Attached files
| file | filename |
|---|---|
| EX-99.2 - EX-99.2 - AMICUS THERAPEUTICS, INC. | a17-13120_1ex99d2.htm |
| 8-K - 8-K - AMICUS THERAPEUTICS, INC. | a17-13120_18k.htm |
Exhibit 99.1
Positive Pompe Phase 1/2 Functional Data in Initial Patients Conference Call & Webcast May 15, 2017

Safe Harbor This presentation contains "forward-looking statements" within the meaning of the Private Securities Litigation Reform Act of 1995, including statements relating to encouraging preliminary data from a global Phase 1/2 study to investigate ATB200/AT2221 for the treatment of Pompe and the potential implications on these data for the future advancement and development of ATB200/AT2221. Words such as, but not limited to, “look forward to,” “believe,” “expect,” “anticipate,” “estimate,” “intend,” "confidence," "encouraged," “potential,” “plan,” “targets,” “likely,” “may,” “will,” “would,” “should” and “could,” and similar expressions or words identify forward-looking statements. The forward looking statements included in this presentation are based on management's current expectations and beliefs which are subject to a number of risks, uncertainties and factors, including that the preliminary data based on a small patient sample and reported before completion of the study will not be predictive of future results, that results of additional preliminary data or data from the completed study or any future study will not yield results that are consistent with the preliminary data presented, that the Company will not be able to demonstrate the safety and efficacy of ATB200/AT2221, that later study results will not support further development, or even if such later results are favorable, that the Company will not be able to successfully complete the development of, obtain regulatory approval for, or successfully commercialize ATB200/AT2221. In addition, all forward looking statements are subject to the other risks and uncertainties detailed in our Annual Report on Form 10-K for the year ended December 31, 2016 and Quarterly Report on 10-Q for the Quarter ended March 31, 2017. As a consequence, actual results may differ materially from those set forth in this press release. You are cautioned not to place undue reliance on these forward looking statements, which speak only of the date hereof. All forward looking statements are qualified in their entirety by this cautionary statement and we undertake no obligation to revise this press release to reflect events or circumstances after the date hereof. Introduction
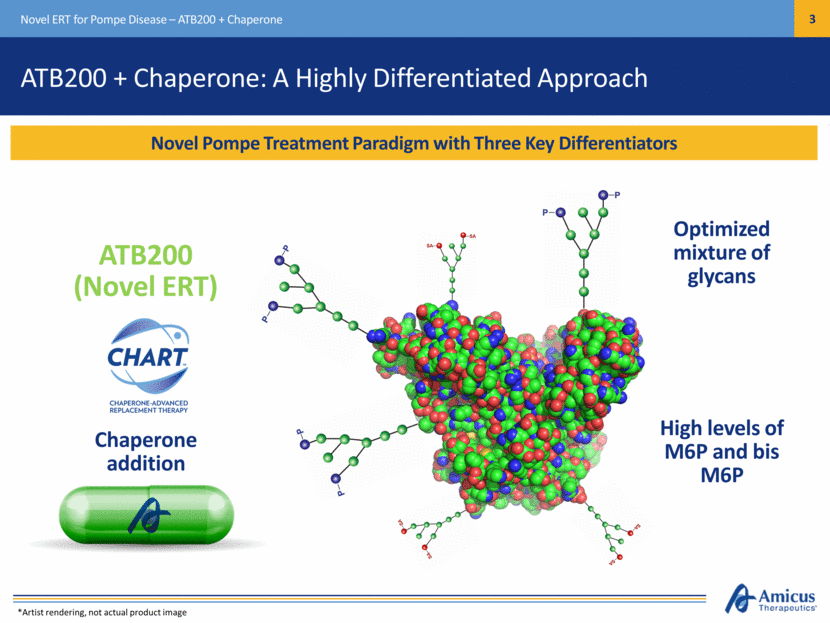
Novel Pompe Treatment Paradigm with Three Key Differentiators Novel ERT for Pompe Disease – ATB200 + Chaperone Chaperone addition Optimized mixture of glycans ATB200 + Chaperone: A Highly Differentiated Approach ATB200 (Novel ERT) High levels of M6P and bis M6P *Artist rendering, not actual product image
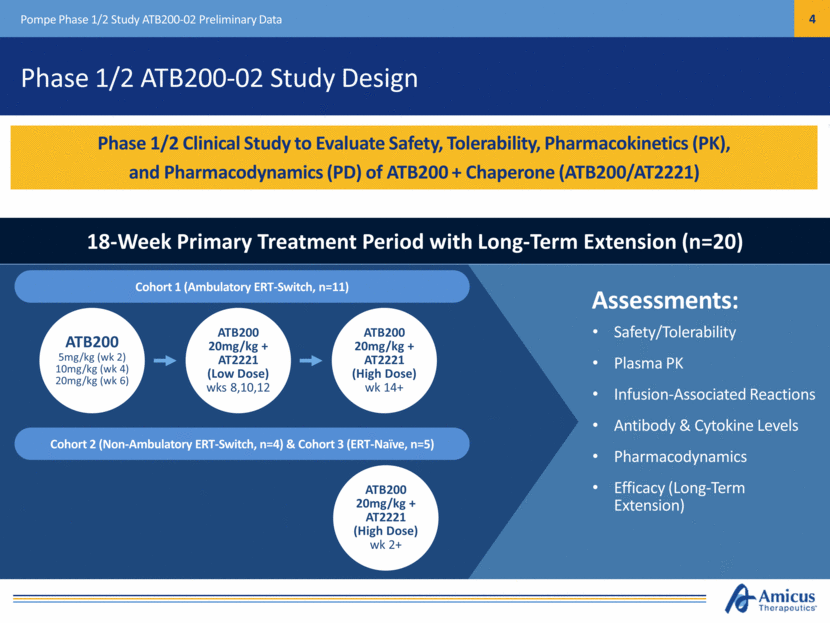
Phase 1/2 ATB200-02 Study Design Pompe Phase 1/2 Study ATB200-02 Preliminary Data Phase 1/2 Clinical Study to Evaluate Safety, Tolerability, Pharmacokinetics (PK), and Pharmacodynamics (PD) of ATB200 + Chaperone (ATB200/AT2221) 18-Week Primary Treatment Period with Long-Term Extension (n=20) ATB200 5mg/kg (wk 2) 10mg/kg (wk 4) 20mg/kg (wk 6) ATB200 20mg/kg + AT2221 (Low Dose) wks 8,10,12 ATB200 20mg/kg + AT2221 (High Dose) wk 14+ Cohort 1 (Ambulatory ERT-Switch, n=11) Cohort 2 (Non-Ambulatory ERT-Switch, n=4) & Cohort 3 (ERT-Naïve, n=5) ATB200 20mg/kg + AT2221 (High Dose) wk 2+ Safety/Tolerability Plasma PK Infusion-Associated Reactions Antibody & Cytokine Levels Pharmacodynamics Efficacy (Long-Term Extension) Assessments:
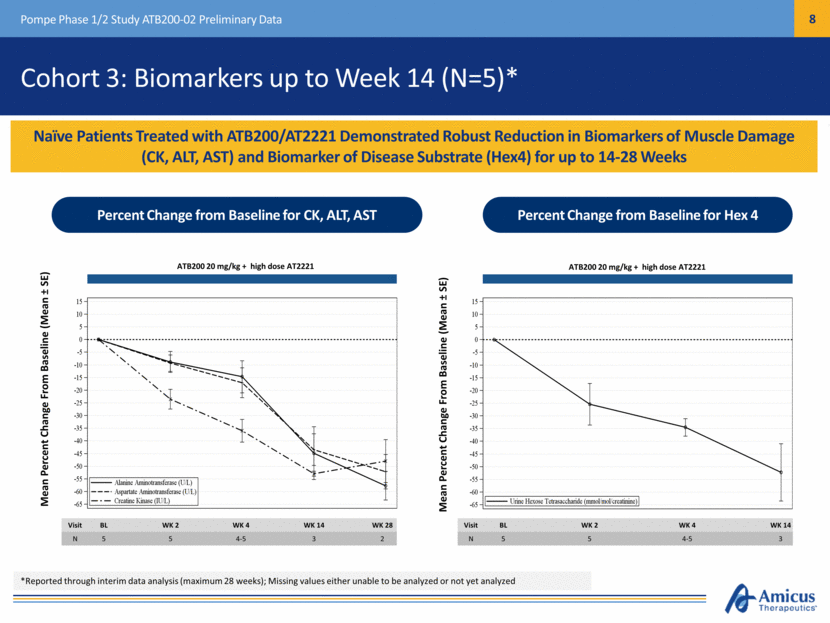
Baseline Characteristics (N=20) Cohort 1: Ambulatory ERT-Switch* (N=11) Cohort 2: Non-Ambulatory ERT-Switch (N=4) Cohort 3: ERT-Naïve (N=5) Time on Lumizyme® – mean years (SD) 4.77 (1.42)* 8.9 (3.8) N/A Age – mean years (range) 49.4 (28, 66) 36.0 (18, 56) 49.4 (24, 65) Sex M:F 9:2 3:1 1:4 6MWT – mean meters (SD) 392.0 (93.4) N/A 399.5 (83.5) FVC Upright – mean % predicted (SD) 52.3 (13.2) N/A 53.4 (20.3) Baseline Characteristics Patients Enrolled Across Three Cohorts Representative of Overall Late-Onset Pompe Population with Impairment at Baseline Pompe Phase 1/2 Study ATB200-02 Preliminary Data Baseline Characteristics of Patients in Phase 1/2 ATB200-02 Study (n=20) *Cohort 1 patients required to have been on Lumizyme for 2-6 years at baseline
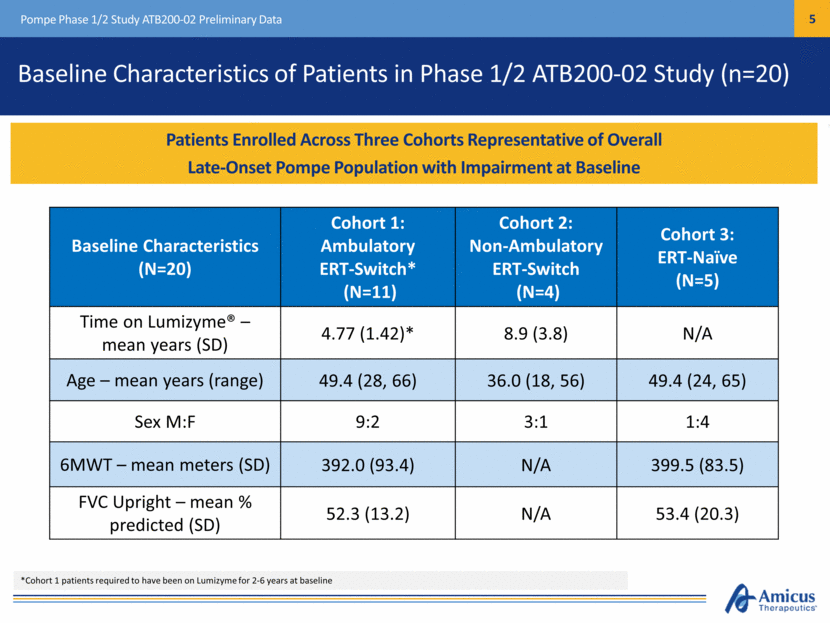
Safety Summary (n=20)* AEs were generally mild and transient No infusion-associated reactions reported after 200+ total infusions across all patients Longest duration of treatment is 48 weeks Pompe Phase 1/2 Study ATB200-02 Preliminary Data Preliminary Safety Data for ATB200/AT2221 Show AEs Have Been Generally Mild and Transient with No Infusion-Associated Reactions After 200+ Total Infusions Across All Cohorts *Reported through interim data analysis (maximum 48 weeks)
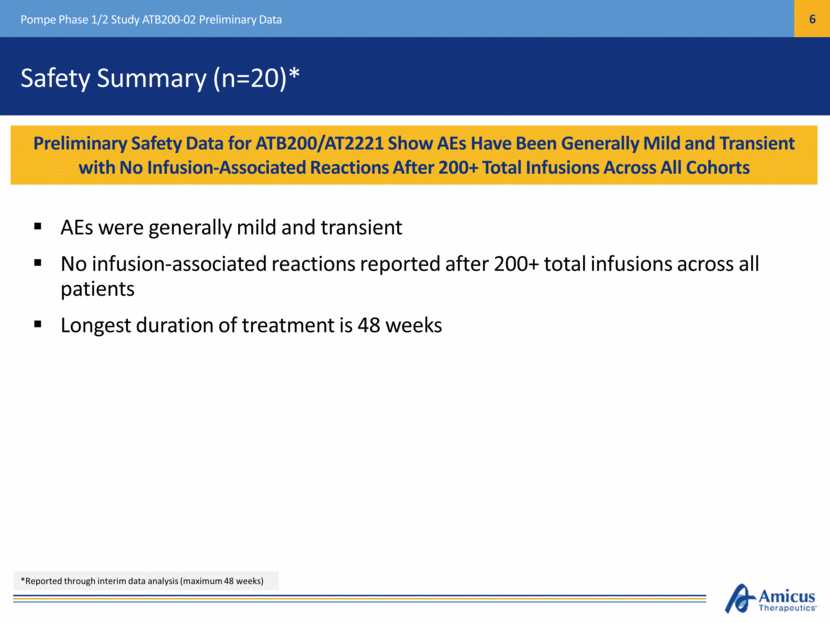
After Switching from SOC to ATB200/A2221 Patients Demonstrated an Improvement in Biomarkers of Muscle Damage (CK, ALT, AST) and Biomarker of Disease Substrate (Hex4) for up to 34 Weeks Pompe Phase 1/2 Study ATB200-02 Preliminary Data Cohort 1: Biomarkers up to Week 34 (N=11)* Percent Change from Baseline for CK, ALT, AST Percent Change from Baseline for Hex 4 Mean Percent Change From Baseline (Mean ± SE) Mean Percent Change From Baseline (Mean ± SE) ATB200 dose escalation (5>10>20) ATB200 20 mg/kg + low dose AT2221 ATB200 20 mg/kg + high dose AT2221 Visit BL WK 2 WK 4 WK 6 WK 8 WK 10 WK 12 WK 14 WK 16 WK 18 WK 34 N 11 11 10 9-10 11 11 8-10 10 10 9 7 Visit BL WK 2 WK 4 WK 6 WK 8 WK 10 WK 12 WK 14 WK 16 WK 18 WK 34 N 11 11 11 11 11 10 10 10 10 10 5 ATB200 dose escalation (5>10>20) ATB200 20 mg/kg + low dose AT2221 ATB200 20 mg/kg + high dose AT2221 *Reported through interim data analysis (maximum 34 weeks); Missing values either unable to be analyzed or not yet analyzed
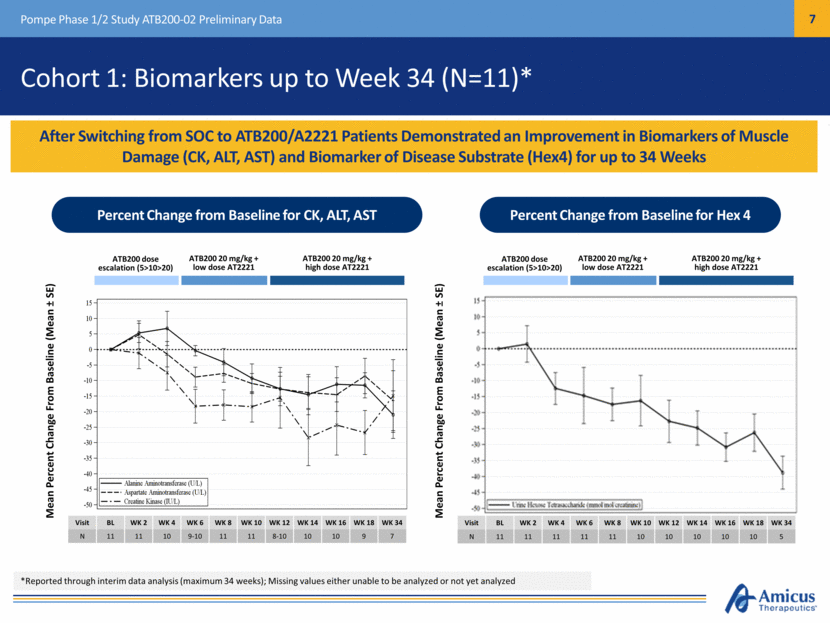
Cohort 3: Biomarkers up to Week 14 (N=5)* Naïve Patients Treated with ATB200/AT2221 Demonstrated Robust Reduction in Biomarkers of Muscle Damage (CK, ALT, AST) and Biomarker of Disease Substrate (Hex4) for up to 14-28 Weeks Pompe Phase 1/2 Study ATB200-02 Preliminary Data Mean Percent Change From Baseline (Mean ± SE) Mean Percent Change From Baseline (Mean ± SE) ATB200 20 mg/kg + high dose AT2221 ATB200 20 mg/kg + high dose AT2221 Visit BL WK 2 WK 4 WK 14 WK 28 N 5 5 4-5 3 2 Visit BL WK 2 WK 4 WK 14 N 5 5 4-5 3 Percent Change from Baseline for CK, ALT, AST Percent Change from Baseline for Hex 4 *Reported through interim data analysis (maximum 28 weeks); Missing values either unable to be analyzed or not yet analyzed
6-Minute Walk Test (6MWT) Summary at Month 6 (n=9) Pompe Phase 1/2 Study ATB200-02 Preliminary Data Cohort Baseline Mean (SD) Change at Month 6 Mean (SD) Cohort 3 ERT Naïve (n=2) 432 (68) +52 (15) Cohort 1 ERT Switch (n=7) 383 (103) +38 (43) 6MWT Distance Improved for Both ERT-Naïve Patients (Mean +52 Meters) and ERT-Switch Patients (Mean +38 Meters) at Month 6 6-Minute Walk Test (m): Month 6 6MWT Increased in 2/2 ERT-Naïve Patients and 6/7 ERT-Switch Patients
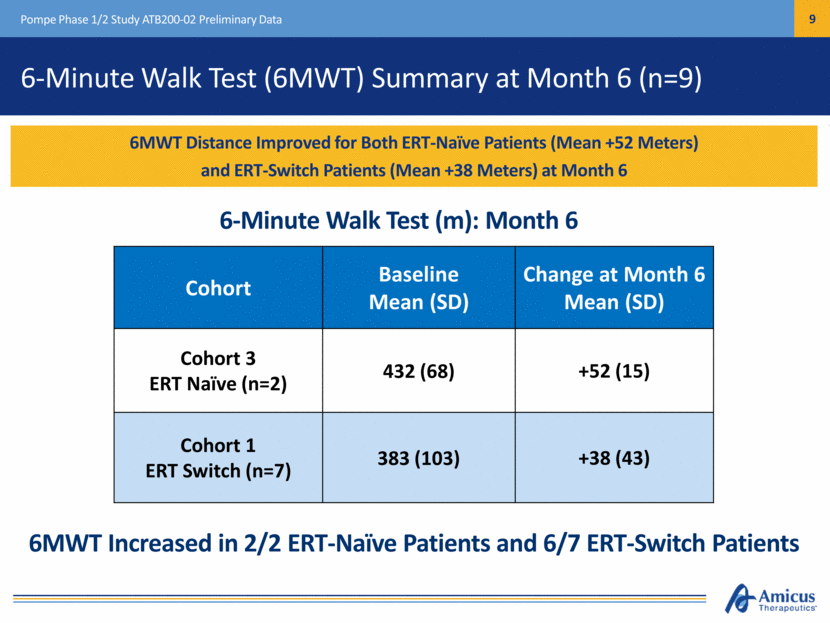
Other Motor Function Tests at Month 6 (n=9) Pompe Phase 1/2 Study ATB200-02 Preliminary Data Patients Timepoint 4 Stair Climb Mean (SD) (sec) Timed Up and Go Mean (SD) (sec) 10M walk Mean (SD) (sec) Cohort 3: ERT Naïve (n=2) Baseline 3.9 (0.6) 8.9 (0.9) 6.9 (0.8) Change at Month 6 -0.3 (0.0) -1.4 (0.4) -0.5 (0.2) Cohort 1: ERT Switch (n=7) Baseline 4.4 (3.1) 11.0 (7.7) 7.5 (3.5) Change at Month 6 -1.1 (1.3) -1.9 (2.8) -0.04 (1.6) Other Motor Function Tests Show Improvements for Both ERT-Naïve and ERT-Switch Patients, Consistent With 6MWT Other Motor Function Tests: Month 6
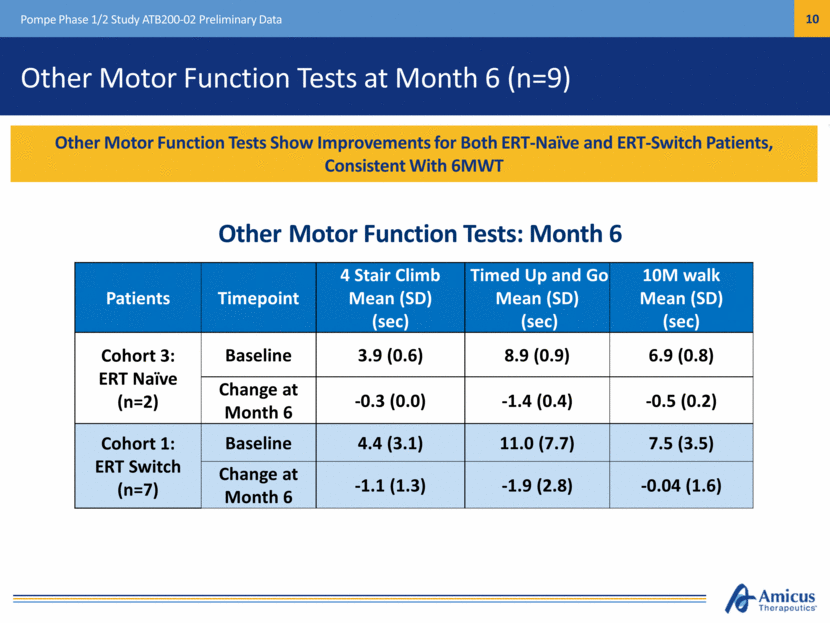
Cohort 2 Muscle Strength Testing at Month 6 (n=1) Pompe Phase 1/2 Study ATB200-02 Initial Patient Data Substantial Improvement Observed in Shoulder and Elbow Strength in First Non-Ambulatory ERT-Switch Patient with Available Data at Month 6 Manual Muscle Testing (MMT)* Assessment Elbow Flex Elbow Extension Shoulder Adduction Right Left Right Left Right Left Baseline 2 2 2 2 2 2 Month 6 4 3 4 3 2 2 CFBL +2 +1 +2 +1 0 0 Scoring Visible muscle movement, but no movement at the joint Movement at the joint, but not against gravity Movement against gravity, but not against added resistance Movement against resistance, but less than normal Normal strength Assessment Elbow Flex Elbow Extension Shoulder Adduction Shoulder Abduction Right Left Right Left Right Left Right Left Baseline 1.0 0.9 1.2 1.1 0.8 0.5 1.3 0.9 Month 6 4.1 3.3 3.5 3.2 2.8 0.0 3.3 3.6 CFBL +3.1 +2.4 +2.3 +2.1 +2.0 -0.5 +2.0 +2.7 Scoring Measurement of force production in pounds as measured by dynamometer Quantitative Muscle Testing (QMT) - Dynamometer *R/L shoulder abduction by MMT not assessed at M6
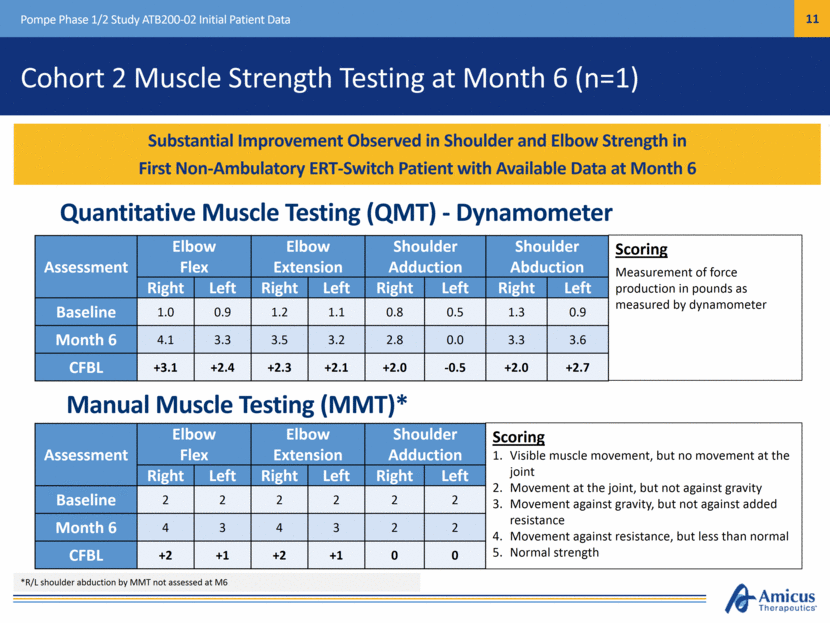
Forced Vital Capacity (FVC) Summary at Month 6 (n=8)* Pompe Phase 1/2 Study ATB200-02 Initial Patient Data Cohort Baseline Mean (SD) Absolute Change at Month 6 Mean (SD) Cohort 3 ERT Naïve (n=2) 51 (27) +3 (0) Cohort 1 ERT Switch (n=6)* 51 (17) +0.3 (3) FVC Results Show Improvement in ERT-Naïve Patients (Mean +3.0%) and Stability in ERT-Switch Patients (Mean +0.3%) at Month 6 FVC (% Predicted): Month 6 *FVC results not available for 1 subject at month 6 FVC increased in 2/2 ERT-Naïve patients and 3/6 ERT-Switch patients
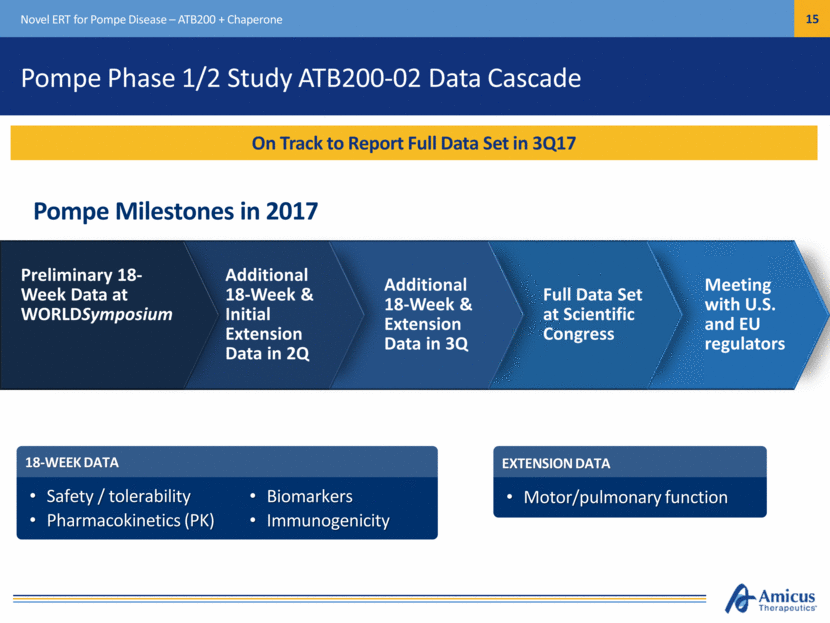
Other Pulmonary Function Tests at Month 6 (n=8-9)* Pompe Phase 1/2 Study ATB200-02 Initial Patient Data Patients Timepoint MIP Mean (SD) MEP Mean (SD) Cohort 3: ERT Naïve (n=2) Baseline 45.5 (27.6) 57.5 (9.2) Change at Month 6 +8.5 (3.5) -4.5 (17.7) Cohort 1: ERT Switch (n=6-7)* Baseline 35.4 (11.3) 69.5 (21.2) Change at Month 6 +1.0 (5.2) +15.5 (25.4) MIP increased and MEP decreased in ERT-naïve patients, MIP and MEP both increased in ERT-switch patients Other Pulmonary Function Tests: Month 6 *MEP results not available for 1 patient at month 6
Preliminary Functional Data Summary Muscle function at Month 6 Muscle function improved in 9/10 patients Mean 6MWT distance improved in both naïve (+52 Meters) and ERT-switch (+38 Meters) patients (8 out of 9) Other motor function tests in ambulatory patients consistent with 6MWT First non-ambulatory patient showed significant improvements in muscle strength tests Pulmonary function at Month 6 FVC increased in ERT-naïve patients (mean +3.0%) and was stable in ERT-switch patients (mean +0.3%) MIP and MEP generally consistent with FVC Pompe Phase 1/2 Study ATB200-02 Preliminary Data
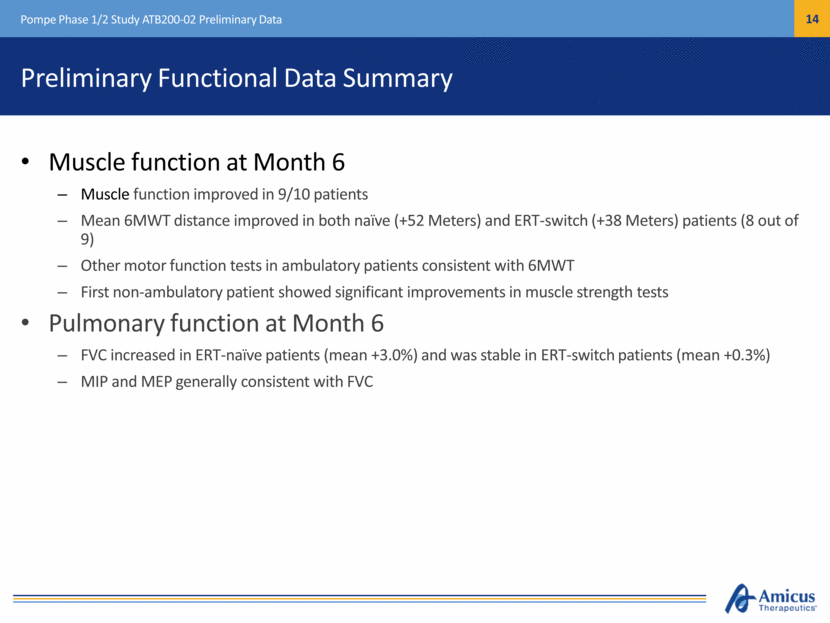
Pompe Phase 1/2 Study ATB200-02 Data Cascade Novel ERT for Pompe Disease – ATB200 + Chaperone On Track to Report Full Data Set in 3Q17 Pompe Milestones in 2017 Meeting with U.S. and EU regulators 18-WEEK DATA Safety / tolerability Pharmacokinetics (PK) EXTENSION DATA Motor/pulmonary function Full Data Set at Scientific Congress Additional 18-Week & Extension Data in 3Q Additional 18-Week & Initial Extension Data in 2Q Preliminary 18-Week Data at WORLDSymposium Biomarkers Immunogenicity
Thank you

Appendix

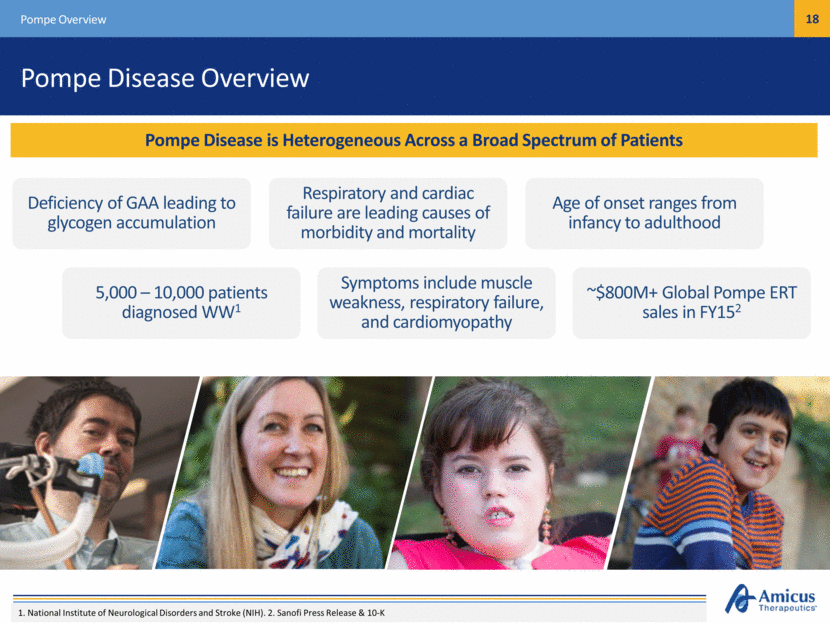
Pompe Disease Overview Pompe Disease is Heterogeneous Across a Broad Spectrum of Patients Pompe Overview Deficiency of GAA leading to glycogen accumulation Age of onset ranges from infancy to adulthood Symptoms include muscle weakness, respiratory failure, and cardiomyopathy Respiratory and cardiac failure are leading causes of morbidity and mortality 5,000 – 10,000 patients diagnosed WW1 ~$800M+ Global Pompe ERT sales in FY152 1. National Institute of Neurological Disorders and Stroke (NIH). 2. Sanofi Press Release & 10-K
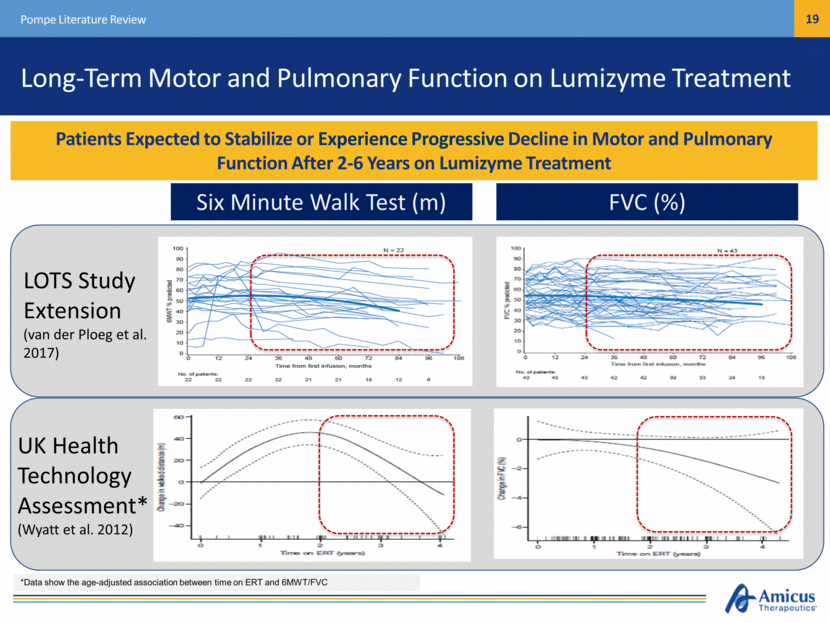
Long-Term Motor and Pulmonary Function on Lumizyme Treatment Patients Expected to Stabilize or Experience Progressive Decline in Motor and Pulmonary Function After 2-6 Years on Lumizyme Treatment Pompe Literature Review Six Minute Walk Test (m) FVC (%) LOTS Study Extension (van der Ploeg et al. 2017) UK Health Technology Assessment* (Wyatt et al. 2012) *Data show the age-adjusted association between time on ERT and 6MWT/FVC
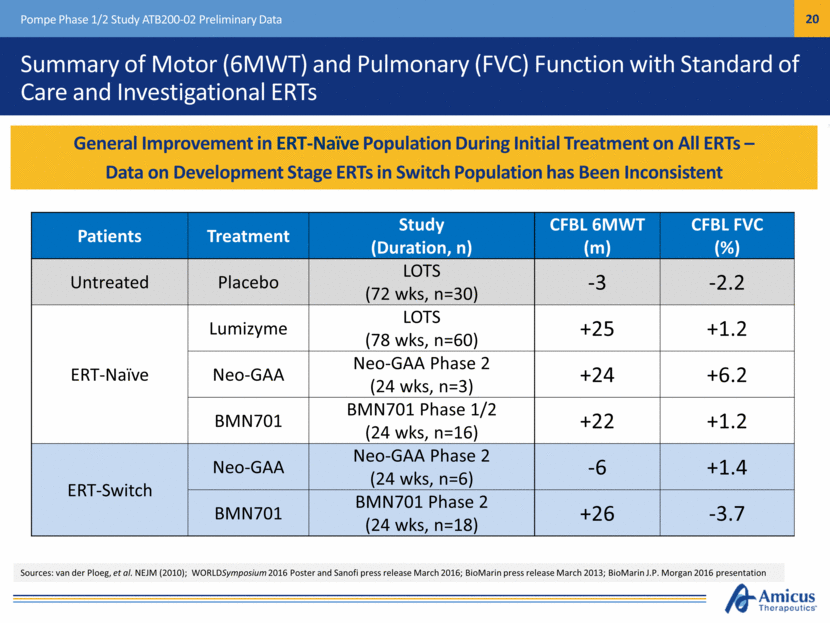
Summary of Motor (6MWT) and Pulmonary (FVC) Function with Standard of Care and Investigational ERTs Pompe Phase 1/2 Study ATB200-02 Preliminary Data Patients Treatment Study (Duration, n) CFBL 6MWT (m) CFBL FVC (%) Untreated Placebo LOTS (72 wks, n=30) -3 -2.2 ERT-Naïve Lumizyme LOTS (78 wks, n=60) +25 +1.2 Neo-GAA Neo-GAA Phase 2 (24 wks, n=3) +24 +6.2 BMN701 BMN701 Phase 1/2 (24 wks, n=16) +22 +1.2 ERT-Switch Neo-GAA Neo-GAA Phase 2 (24 wks, n=6) -6 +1.4 BMN701 BMN701 Phase 2 (24 wks, n=18) +26 -3.7 General Improvement in ERT-Naïve Population During Initial Treatment on All ERTs – Data on Development Stage ERTs in Switch Population has Been Inconsistent Sources: van der Ploeg, et al. NEJM (2010); WORLDSymposium 2016 Poster and Sanofi press release March 2016; BioMarin press release March 2013; BioMarin J.P. Morgan 2016 presentation
