Attached files

(OTCQX: HPHW)
Earnings Presentation
Speakers: Henry Dubois, Chief Executive Officer
Steven Balthazor, Chief Financial Officer

Safe Harbor
2
Special Note Regarding Forward-Looking Statements
This presentation contains forward-looking statements, as such term is defined in the Private Securities Litigation Reform Act of 1995,
concerning the Company’s plans, objectives, goals, strategies, future events or performances, which are not statements of historical
fact and can be identified by words such as: “expect,” “continue,” “should,” “may,” “will,” “project,” “anticipate,” “believe,” “plan,”
“goal,” and similar references to future periods. The forward-looking statements contained in this presentation reflect our current
beliefs and expectations. Actual results or performance may differ materially from what is expressed in the forward looking statements.
Among the important factors that could cause actual results to differ materially from those expressed in, or implied by, the forward-
looking statements contained in this presentation are our ability to realize the expected synergies and other benefits from our merger
with Provant Health Solutions; our ability to realize the expected benefits from the acquisition of Accountable Health Solutions and our
strategic alliance with Clinical Reference Laboratory; our ability to successfully implement our business strategy and integrate
Accountable Health Solutions’ and Provant Health Solutions’ business with ours; our ability to retain and grow our customer base; our
ability to recognize operational efficiencies and reduce costs; uncertainty as to our working capital requirements over the next 12 to 24
months; our ability to maintain compliance with the financial covenants contained in our credit facilities; the rate of growth in the
Health and Wellness market and such other factors as discussed in Part I, Item 1A, Risk Factors, and Part II, Item 7, Management’s
Discussion and Analysis of Financial Conditions and Results of Operations of our Annual Report on Form 10-K for the year ended
December 31, 2016. The Company undertakes no obligation to update or release any revisions to these forward-looking statements to
reflect events or circumstances, or to reflect the occurrence of unanticipated events, after the date of this presentation, except as
required by law. This presentation contains information from third-party sources, including data from studies conducted by others and
market data and industry forecasts obtained from industry publications. Although the Company believes that such information is
reliable, the Company has not independently verified any of this information and the Company does not guarantee the accuracy or
completeness of this information. Any references to documents not included in the presentation itself are qualified by the full text and
content of those documents. During our prepared comments or responses to your questions, we may offer incremental metrics to
provide greater insight into the dynamics of our business or our quarterly results, such as references to EBITDA, adjusted EBITDA and
other measures of financial performance. Please be advised that this additional detail may be one-time in nature and we may or may
not provide an update in the future. These and other financial measures may also have been prepared on a non-GAAP basis.

3
Merger Closed
One of the largest pure-play
Health & Wellness companies
Enhanced Financial Model
› $67 + million in 2016 pro-forma revenue
› $54 + million revenue target for Q2 – Q4 2017
› $ 3 + million adjusted EBITDA target for Q2 – Q4 2017
› $ 5 + million adjusted EBITDA target for 2018
› $ 7 million annualized synergy savings
Stronger Operating Position
› On-site screenings, risk assessments and immunizations
› Technology platform capabilities and coaching
› Engagement and advanced data management

4
Standalone Q1 Revenue Results - Hooper Holmes
Q1 Year-Over-Year Revenue Improvements
› 5% revenue growth to $7.6 million
› 44% growth in channel partner and clinical research organization revenue
› 33% growth in channel partner revenue
› 166% growth in clinical research organization revenue
› 16% gross margin improvement
Gross Margin ($mm)
+16%
+5%
Overall
$7.24
Revenue ($mm)
+33%
Channel

5
Adjusted EBITDA ($000’s)
› 28% Improvement in Adjusted EBITDA
› 26% Improvement in Net Loss
› SG&A Improved 9%
Improved Q1 Operating Performance - Hooper Holmes
+26%
Net Loss ($000’s)
Excluding transaction costs
+28%
Adjusted EBITDA ($000’s)
Q1 2016 Q1 2017
Net Los (3,428) (3,129)
Transaction Costs 108 682
Net Loss Excluding Transaction Cost (3,320) (2,447)
Interest expense $212 $219
Other Debt related costs in Int exp $577 $548
Income taxes $5 $5
Depreciation & amortization $701 $623
Stock Payments $230 $38
Transition Costs $52 ($2)
Leases/Ornelas settlements $150 $19
Adjusted EBITDA ($1,393) ($997)

6
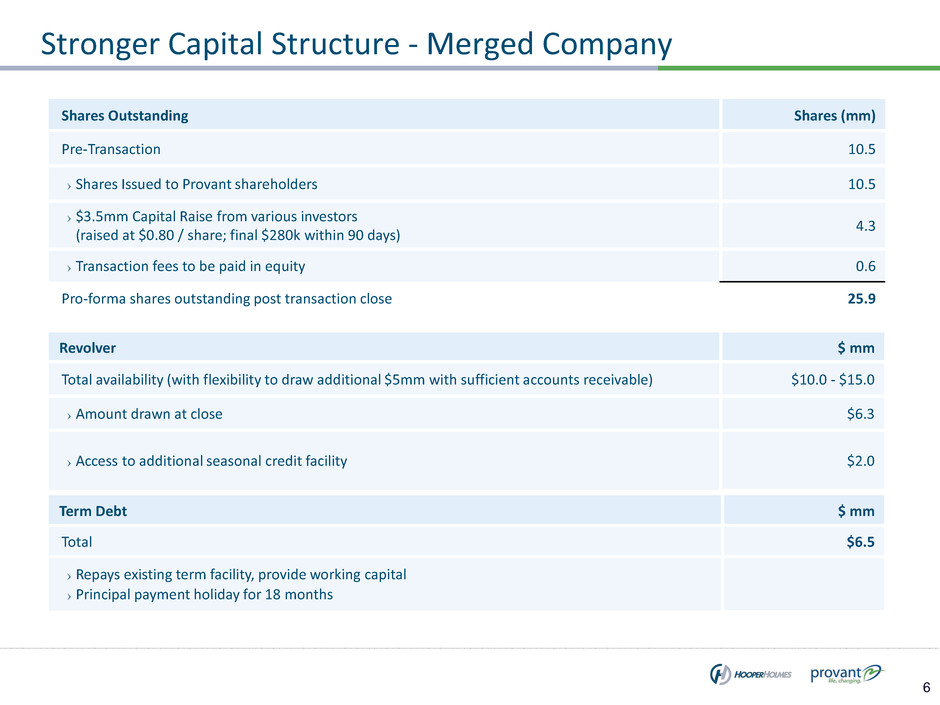
Stronger Capital Structure - Merged Company
Shares Outstanding Shares (mm)
Pre-Transaction 10.5
› Shares Issued to Provant shareholders 10.5
› $3.5mm Capital Raise from various investors
(raised at $0.80 / share; final $280k within 90 days)
4.3
› Transaction fees to be paid in equity 0.6
Pro-forma shares outstanding post transaction close 25.9
Revolver $ mm
Total availability (with flexibility to draw additional $5mm with sufficient accounts receivable) $10.0 - $15.0
› Amount drawn at close $6.3
› Access to additional seasonal credit facility
$2.0
Term Debt $ mm
Total $6.5
› Repays existing term facility, provide working capital
› Principal payment holiday for 18 months

7
Synergies Driven by Integration - Merged Company
Health Professional Network Expansion
Q2 2017 Q3 2017 Q4 2017 Q1 2018
Enhanced Coaching Capabilities
Technology & Infrastructure
Operations Efficiencies
Duplicative SG&A
Screening, clinical, and coaching efficiencies
Realization of technology platform capacity
$7 million Annualized Cost Efficiencies
New sales with an annualized value of $5.5 million in Q1
Growth in Sales
Integration Drives Customer Benefits and Operations Improvements
20% already achieved
$0.7 million in new contracts from existing
channel partners.
$1.6 million from new direct customers.
$3.2 million from new channel partners.

8
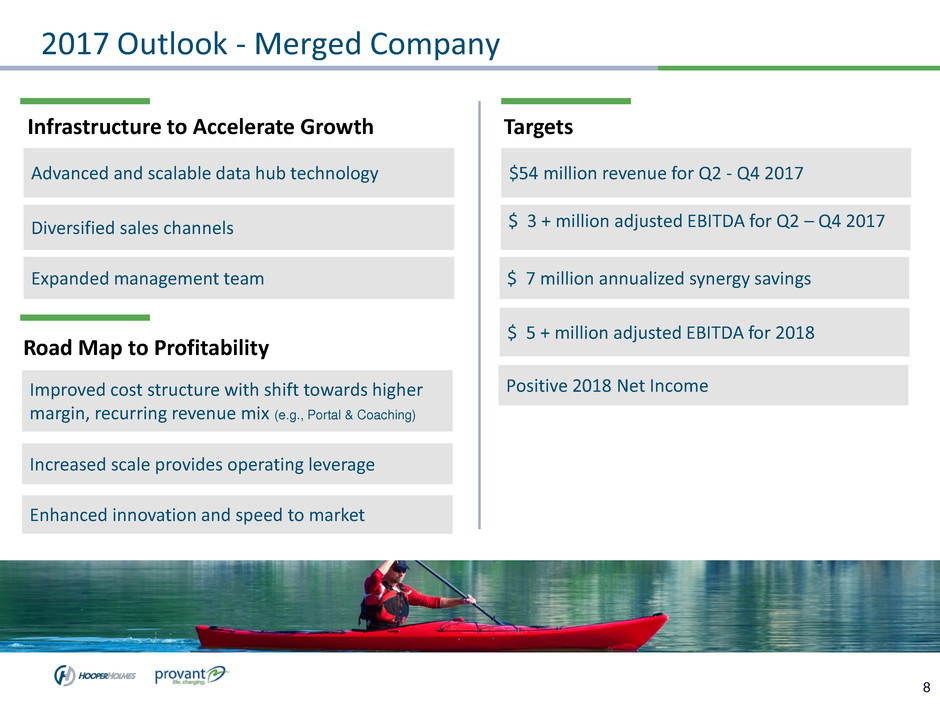
2017 Outlook - Merged Company
Advanced and scalable data hub technology
Diversified sales channels
Expanded management team
Infrastructure to Accelerate Growth
Improved cost structure with shift towards higher
margin, recurring revenue mix (e.g., Portal & Coaching)
Increased scale provides operating leverage
Enhanced innovation and speed to market
Road Map to Profitability
Targets
$ 3 + million adjusted EBITDA for Q2 – Q4 2017
$ 7 million annualized synergy savings
$ 5 + million adjusted EBITDA for 2018
Positive 2018 Net Income
$54 million revenue for Q2 - Q4 2017
