Attached files
| file | filename |
|---|---|
| 8-K - 8-K - AMERICA FIRST MULTIFAMILY INVESTORS, L.P. | atax-8k_20170511.htm |
Exhibit 99.1


|
Supplemental Financial Report for Quarter Ended March 31, 2017 |
|
|
|
|


AMERICA FIRST MULTIFAMILY INVESTORS, L.P.
All statements in this document other than statements of historical facts, including statements regarding our future results of operations and financial position, business strategy and plans and objectives of management for future operations, are forward-looking statements. When used, statements which are not historical in nature, including those containing words such as “anticipate,” “estimate,” “should,” “expect,” “believe,” “intend,” and similar expressions, are intended to identify forward-looking statements. We have based forward-looking statements largely on our current expectations and projections about future events and financial trends that we believe may affect our business, financial condition and results of operations. This document may also contain estimates and other statistical data made by independent parties and by us relating to market size and growth and other industry data. This data involves a number of assumptions and limitations, and you are cautioned not to give undue weight to such estimates. We have not independently verified the statistical and other industry data generated by independent parties contained in this supplement and, accordingly, we cannot guarantee their accuracy or completeness. In addition, projections, assumptions and estimates of our future performance and the future performance of the industries in which we operate are necessarily subject to a high degree of uncertainty and risk due to a variety of factors, including those described under the headings “Item 1A Risk Factors” in our 2016 Annual Report on Form 10-K. These forward-looking statements are subject to various risks and uncertainties and America First Multifamily Investors, L.P. expressly disclaims any obligation to publicly update or revise any forward-looking statements, whether as a result of new information, future events or otherwise.
Most, but not all, of the selected financial information furnished herein is derived from the America First Multifamily Investors, L.P.’s (“ATAX” or “Partnership”) consolidated financial statements and related notes prepared in accordance with GAAP and management’s discussion and analysis of financial condition and results of operations included in the Partnership’s reports on Forms 10-K and 10-Q. The Partnership’s annual consolidated financial statements were subject to independent audit, dated March 3, 2017. The first quarter 2017 Form 10-Q materials are dated May 5, 2017 and the Partnership does not undertake to update the materials after that date.
Disclosure Regarding Non-GAAP Measures
This document refers to certain financial measures that are identified as non-GAAP. We believe these non-GAAP measures are helpful to investors because they are the key information used by management to analyze our operations. This supplemental information should not be considered in isolation or as a substitute for the related GAAP measures.
Please see the consolidated financial statements we filed with the Securities and Exchange Commission on Forms 10-K and 10-Q. Our GAAP consolidated financial statements can be located upon searching for the Partnership’s filings at www.sec.gov.
|
|
|

|
|
|
|
PARTNERSHIP FINANCIAL INFORMATION
TABLE OF CONTENTS
|
|
Pages |
|
|
|
Supplemental Letter from the CEO |
4-5 |
|
|
Quarterly Fact Sheet |
6 |
|
|
Financial Performance Trend Graphs |
7-12 |
|
|
Other Partnership Information |
13 |
|
|
Partnership Financial Statements |
14-16 |
|
|
Partnership Financial Measures and Schedules |
17-21 |
|
|
Occupancy Data |
22-24 |


|
|
|
|
|
|
|
AMERICA FIRST MULTIFAMILY INVESTORS L.P.
SUPPLEMENTAL LETTER FROM THE CEO
The trend in rising interest rates, post-election, was somewhat abated during the first quarter of 2017. Although the Federal Reserve increased short-term interest rates, economic growth was muted during the first three months of 2017, which resulted in a decrease in longer-term rates. During the first quarter of 2017, the affordable housing market sector continued to assess the impact of the potential changes in the political and regulatory environments.
We are pleased by the results of our operations, the net income we have reported, and our Cash Available for Distribution (“CAD”) for the first quarter of 2017. Significant highlights during the first quarter of 2017 are as follows:
|
|
• |
Acquisition of six mortgage revenue bonds of approximately $59.6 million, |
|
|
• |
Sale of an MF Property for approximately $13.8 million, |
|
|
• |
Contributions of approximately $9.5 million to Investment in Unconsolidated Entities, |
|
|
• |
Refinancing of short-term Lines of Credit of approximately $60 million to longer term, fixed-rate financings, and |
|
|
• |
Securitized 19 fixed-term, fixed-rate Term AB Trust financings of approximately $106.8 million. |
In addition, the following results of operation, net income and CAD were realized in the first quarter of 2017, as compared to the first quarter of 2016:
|
|
• |
Total revenue increased approximately 7.4% to $16.0 million, as compared to $14.9 million, |
|
|
• |
Net income per unit, basic and diluted, increased approximately 150.0% to $0.10 per unit, as compared to $0.04 per unit, and |
|
|
• |
CAD increased approximately 31.7% to $8.3 million ($0.14 per unit), as compared to $6.3 million ($0.10 per unit). |
We continue to execute on our strategy of “fine tuning” our assets owned and continue to enhance our relationships with our business partners and Unitholders. This has allowed us to report positive results in net income, basic and diluted, and CAD for the first quarter of 2017.
We are very proud of our history of paying distributions to our Unitholders. We have not missed a regularly scheduled distribution since being listed as a publicly traded company on the NASDAQ market in 1986.
|
|
4 |
|
|
|
|
It has been a privilege to work with the many skilled and dedicated members of our ATAX team and experienced individuals that comprise our Board of Managers. We are encouraged by ATAX’s direction and would like to thank all of our Unitholders for their continued support.

Chad Daffer
Chief Executive Officer
|
|
5 |
|
|
|
|
|
PARTNERSHIP DETAILS |
|
We were formed for the primary purpose of acquiring a portfolio of mortgage revenue bonds that are issued to provide construction and/or permanent financing of multifamily residential properties. We continue to expect most of the interest paid on these bonds is excludable from gross income for federal income tax purposes. Our business objectives are to (i) preserve and protect our capital (ii) provide regular cash distributions, and (iii) generate additional returns from appreciation of real estate or the opportunistic sale of the asset investments to our Unitholders. We also invest in other securities which 1) if not secured by a direct or indirect interest in a property must be rated in one of the four highest rating categories by at least one nationally recognized securities rating agency and 2) cannot be more than 25% of our total assets at acquisition. We have also acquired interests in multifamily apartments (“MF Properties”) in order to position ourselves for future investments in mortgage revenue bonds issued to finance these properties. |
|||
|
(As of March 31, 2017) |
|
||||
|
Symbol (NASDAQ) |
|
|
ATAX |
|
|
|
Annual Distribution |
|
$ |
0.50 |
|
|
|
Price |
|
$ |
5.60 |
|
|
|
Yield |
|
|
8.9% |
|
|
|
|
|
|
|
|
|
|
Units Outstanding (including Restricted Units) |
|
|
60,252,928 |
|
|
|
Market Capitalization |
|
$ |
337,416,397 |
|
|
|
52-week Unit price range |
|
|
$5.13 to $6.09 |
|
|
|
|
|
|
|
|
|
|
Partnership Financial Information for the Q1 2017 (amounts in thousands, except per Unit) |
|
||||
|
|
|
|
|
|
|
|
|
|
|
|
|
|
|
Total Revenue |
|
$ |
16,040 |
|
|
|
Net Income – ATAX Partnership |
|
$ |
7,289 |
|
|
|
Cash Available for Distribution (“CAD”)1 |
|
$ |
8,298 |
|
|
|
Total Assets |
|
$ |
1,023,532 |
|
|
|
Ratio of Debt to Total Assets at Par and Cost |
|
|
66% |
|
|
|
|
|
|
|
|
|
|
CAD, per unit |
|
$ |
0.14 |
|
|
|
Distribution Declared per unit2 |
|
$ |
0.125 |
|
|
|
1 |
Management utilizes a calculation of Cash Available for Distribution (“CAD”) as a means to determine our ability to make distributions to Unitholders. This is a non-GAAP financial measure and reconciliation of our GAAP net income to its CAD is provided on page 14 of the Supplement herein. |
|
2 |
The most recent distribution was paid on April 28, 2017 for Unit holders of record as of March 31, 2017. The distribution is payable to Unit holders of record as of the last business day of the quarter end and ATAX trades ex-dividend two days prior to the record date, with a payable date of the last business day of the subsequent month. |
|
|
6 |
|
|
|
|

|
|
• |
Total mortgage revenue bonds, core assets of ATAX, have increased to 74% of Total Assets at March 31, 2017, from 35% of Total Assets at December 31, 2012. |
|
|
|
7 |
|
|
|
|
REVENUE AND OTHER INCOME TRENDS
Revenue and other income increased year-over-year due to our acquisition of mortgage revenue bonds and the sale of MF Properties.
Highlighted transactions recorded during the past eight quarters include the following:
|
|
• |
During the first quarter of 2017, we recognized a gain on the sale of Northern View (an MF Property) of approximately $3.2 million, net of income taxes and Tier 2 income paid to the general partner, and before direct and indirect expense, and contingent interest of approximately $133,000, |
|
|
• |
During the fourth quarter of 2016, we recognized contingent interest of approximately $1.7 million, |
|
|
• |
During the third quarter of 2016, we recognized a gain of approximately $1.1 million, net of tax, on the sale of Woodland Park, an MF Property, and contingent interest of $90,000, |
|
|
• |
During the second quarter of 2016, we recognized a gain of approximately $8.3 million, net of tax, on the sale of the Arboretum, an MF Property, and contingent interest income of approximately $45,000, |
|
|
• |
During the first quarter of 2016, we recognized contingent interest income of approximately $174,000, |
|
|
• |
During the fourth quarter of 2015, we recognized contingent interest and note interest income of approximately $6.2 million from the sale of the Consolidated VIEs, |
|
|
• |
During the third quarter of 2015, we recognized a gain of approximately $1.2 million on the sale of Glynn Place, an MF Property, and |
|
|
• |
During the second quarter of 2015, we recognized a gain of approximately $3.4 million on the sale of The Colonial, an MF Property. |

|
|
8 |
|
|
|
|

|
|
• |
Since June 30, 2015, the ratio of “Salaries and benefits” and “General and administrative” expenses has remained constant at approximately 0.48% of Total Assets. |
|
|
9 |
|
|
|
|

|
|
• |
In 2017, we realized approximately $133,000 of contingent interest, of which $33,000 was due to the General Partner. In addition, we reported the sale of Northern View, which resulted in a gain of approximately $4.3 million, net of tax, of which approximately $1.1 million was due to the General Partner. There was approximately $3.3 million that was allocated to the Unitholders. |
|
|
• |
In 2016, we realized approximately $2.0 million of contingent interest, of which $505,000 was due the General Partner. In addition, we reported the sale of the Arboretum and Woodland Park which resulted in gains of approximately $8.3 million and $1.1 million, respectively, net of tax, of which approximately $2.4 million was due the General Partner. There was approximately $8.6 million that was allocated to the Unitholders. |
|
|
• |
In 2015, we realized approximately $4.8 million of contingent interest, of which approximately $1.2 million was due the General Partner. In addition, we reported the sale of Glynn Place and The Colonial which resulted in gains of approximately $1.2 million and $3.4 million, respectively, of which approximately $297,000 and $854,000, respectively, was due the General Partner. There was approximately $7.0 million that was allocated to the Unitholders. |
|
|
10 |
|
|
|
|
|
Our operating policy on leverage is: • To maintain leverage of between 75% and 85% on the mortgage revenue bond portfolio. • To maintain leverage of approximately 75% on the PHC certificates portfolio. • For mortgages on MF Properties, we look at supportable loans given standard parameters of LTV and Debt Service Coverage. • The overall target leverage ratio of the Partnership is 70%.
|
|
1
 |
|||||
|
|
|
|
|
|
|
|
|
|
|
Weighted Average Cost of Debt |
|
Period End Rate |
|
|
Period End Rate |
|
|
|
|
|
Mar 31, 2017 |
|
|
Dec 31, 2016 |
|
|
|
|
|
|
|
|
|
|
|
|
TEBS Financing |
|
2.34% |
|
|
2.35% |
|
|
|
|
|
|
|
|
|
|
|
|
TOB and Term A/B Secured Financing |
|
3.91% |
|
|
3.76% |
|
|
|
|
|
|
|
|
|
|
|
|
Mortgages payable and other secured financing |
|
3.98% |
|
|
3.83% |
|
|
|
|
|
|
|
|
|
|
|
1 |
Calculated as total outstanding debt divided by total Partnership assets using the carrying value of the mortgage revenue bonds, PHC Certificates, MBS Securities, initial finance costs, and the MF Properties at cost. |
|
|
11 |
|
|
|
|
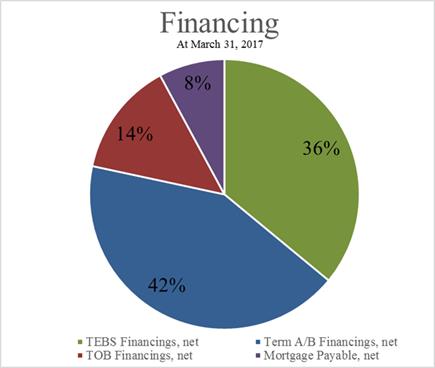
ATAX FINANCING PROFILE
INTEREST RATE CAPS
|
Variable Debt Financing Facility Hedged |
Initial Notional Amount |
Effective Capped Rate |
Maturity Date |
Counterparty |
|
(As of March 31, 2017) |
||||
|
M24 TEBS |
$ 31,936,667 |
3.0% |
Sept 2017 |
Bank of New York Mellon |
|
M24 TEBS |
31,936,667 |
3.0% |
Sept 2017 |
Barclays Bank PLC |
|
M24 TEBS |
31,936,667 |
3.0% |
Sept 2017 |
Royal Bank of Canada |
|
M24 TEBS |
93,305,000 |
1.5% |
Sept 2017 |
Deutsche Bank |
|
M31 TEBS |
31,565,000 |
3.0% |
Aug 2019 |
Barclays Bank PLC |
|
M31 TEBS |
31,565,000 |
3.0% |
Aug 2019 |
Royal Bank of Canada |
|
M31 TEBS |
31,565,000 |
3.0% |
Aug 2019 |
SMBC Capital Markets, Inc |
|
M33 TEBS |
28,095,000 |
3.0% |
Aug 2020 |
Wells Fargo Bank |
|
M33 TEBS |
28,095,000 |
3.0% |
Aug 2020 |
Royal Bank of Canada |
|
M33 TEBS |
28,095,000 |
3.0% |
Aug 2020 |
SMBC Capital Markets, Inc |
|
|
12 |
|
|
|
|
|
OTHER PARTNERSHIP INFORMATION |
||||
|
|
|
|
|
|
|
Corporate Office: |
|
|
Transfer Agent:
|
|
|
1004 Farnam Street |
|
|
American Stock Transfer & Trust Company |
|
|
Suite 400 |
|
|
59 Maiden Lane |
|
|
Omaha, NE 68102 |
|
|
Plaza Level |
|
|
Phone: |
402-444-1630 |
|
New York, NY 10038 |
|
|
Investor Services: |
402-930-3098 |
|
Phone: |
718-921-8124 |
|
K-1 Services: |
855-4AT-AXK1 |
|
|
888-991-9902 |
|
Fax: |
402-930-3047 |
|
Fax: |
718-236-2641 |
|
Web Site: |
www.ataxfund.com |
|
|
|
|
K-1 Services Email: |
k1s@ataxfund.com |
|
|
|
|
Ticker Symbol: |
ATAX |
|
|
|
|
Corporate Counsel: |
|
Independent Accountants: |
|
Barnes & Thornburg LLP |
|
PwC |
|
11 S. Meridian Street |
|
1 North Wacker Drive |
|
Indianapolis, IN 46204 |
|
Chicago, Illinois 60606 |
|
|
|
|
|
Burlington Capital LLC, General Partner of the General Partner for ATAX - Board of Managers |
||
|
|
|
|
|
Michael B. Yanney |
|
Chairman Emeritus of the Board |
|
Lisa Y. Roskens |
|
Chairman of the Board |
|
Mariann Byerwalter |
|
Manager |
|
Dr. William S. Carter |
|
Manager |
|
Patrick J. Jung |
|
Manager |
|
George Krauss |
|
Manager |
|
Dr. Gail Yanney |
|
Manager |
|
Walter K. Griffith |
|
Manager |
|
Senator Michael Johanns |
|
Manager |
|
|
|
|
|
Corporate Officers |
||
|
Chief Executive Officer – Chad Daffer |
||
|
Chief Financial Officer – Craig S. Allen |
||
|
|
13 |


|
Partnership Financial Statements and Information Schedules |
|
|
|
|
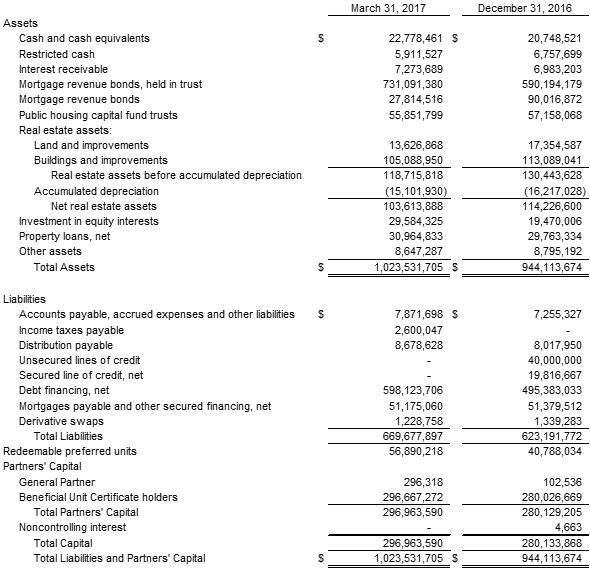
AMERICA FIRST MULTIFAMILY INVESTORS, L.P. BALANCE SHEETS
|
|
15 |
|
|
|
|
AMERICA FIRST MULTIFAMILY INVESTORS, L.P.
PARTNERSHIP INCOME STATEMENTS

|
|
16 |
|
|
|
|
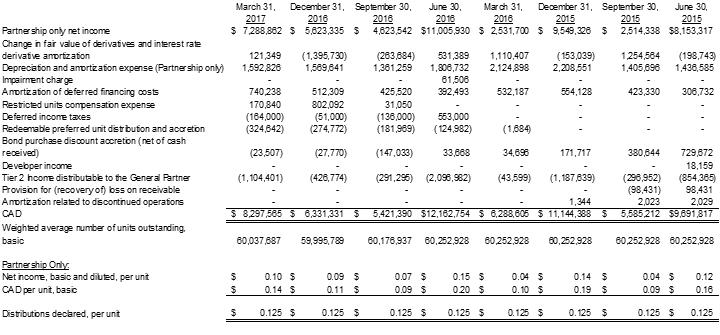
AMERICA FIRST MULTIFAMILY INVESTORS, L.P.
PARTNERSHIP CASH AVAILABLE FOR DISTRIBUTION AND OTHER PERFORMANCE MEASURES
FOR THE THREE MONTHS ENDED
The following table contains reconciliations of the Partnership’s GAAP net income to its CAD:
|
|
17 |
|
|
|
|
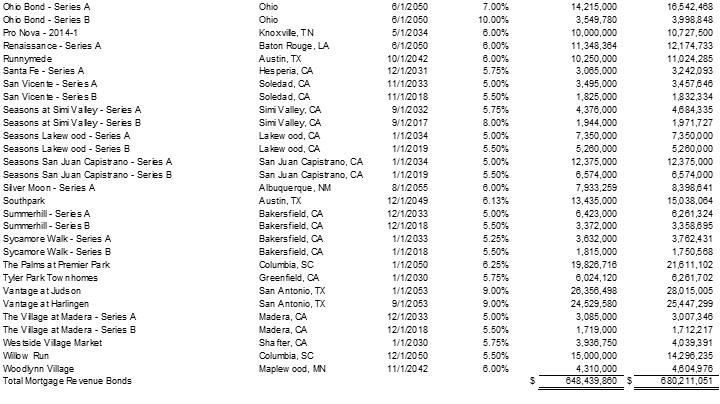
AMERICA FIRST MULTIFAMILY INVESTORS, L.P.
MORTGAGE REVENUE BOND INVESTMENT SCHEDULE MARCH 31, 2017

|
|
18 |
|
|
|
|

OTHER INVESTMENTS MARCH 31, 2017

|
|
19 |
|
|
|
|
AMERICA FIRST MULTIFAMILY INVESTORS, L.P.
MORTGAGE REVENUE BOND INVESTMENT SCHEDULE DECEMBER 31, 2016

|
|
20 |
|
|
|
|
OTHER INVESTMENTS DECEMBER 31, 2016

|
|
21 |
|
|
|
|
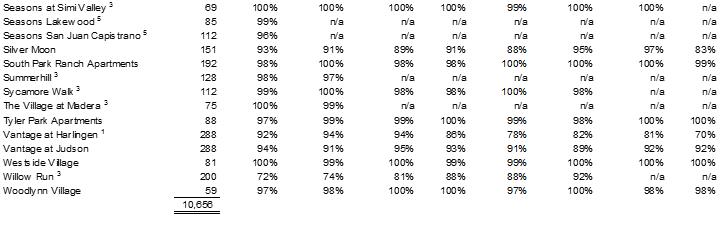
AMERICA FIRST MULTIFAMILY INVESTORS, L.P.
MORTGAGE BOND PROPERTIES PHYSICAL OCCUPANCY

|
|
22 |
|
|
|
|
|
1 |
The Property’s construction is complete and is in the stabilization stage and lease-up. |
|
2 |
Student housing facility - number of units equals number of beds. Occupancy is lower in the summer months. |
|
3 |
Mortgage bonds were acquired in the quarter the occupancy began to be reported. |
|
4 |
Mortgage bond financials not available in the current period. |
|
5 |
Mortgage bond was acquired in December 2016 and occupancy data is unavailable for that period. |
|
|
23 |
|
|
|
|
AMERICA FIRST MULTIFAMILY INVESTORS, L.P.
MF PROPERTIES PHYSICAL OCCUPANCY

|
1 |
Student housing facility - number of units equals number of beds. Occupancy is lower in the summer months. |
|
2 |
In September 2015, the owner of the Suites on Paseo property and the Partnership mutually agreed to exchange the deed for the Suites on Paseo property, a California property, in exchange for the par value Series A and B mortgage revenue bonds plus accrued interest. |
|
3 |
Jade Park was acquired on September 30, 2016. |
|
|
24 |