Attached files
| file | filename |
|---|---|
| EX-32.2 - VYCOR MEDICAL INC | ex32-2.htm |
| EX-32.1 - VYCOR MEDICAL INC | ex32-1.htm |
| EX-31.2 - VYCOR MEDICAL INC | ex31-2.htm |
| EX-31.1 - VYCOR MEDICAL INC | ex31-1.htm |
UNITED STATES
SECURITIES AND EXCHANGE COMMISSION
Washington, D. C. 20549
FORM 10-Q
(Mark
One)
| [X] | QUARTERLY REPORT UNDER SECTION 13 OR 15(d) OF THE SECURITIES EXCHANGE ACT OF 1934 |
| For the fiscal quarter ended March 31, 2017 | |
| [ ] | TRANSITION REPORT UNDER SECTION 13 OR 15(d) OF THE EXCHANGE ACT |
| For the transition period from to |
VYCOR MEDICAL, INC.
(Exact name of small business issuer as specified in its charter)
| Delaware | 333-149782 | 20-3369218 | ||
| (State of | (Commission | (IRS Employer | ||
| Incorporation) | File Number) | Identification No.) |
6401
Congress Ave., Suite 140, Boca Raton, FL 33487
(Address of principal executive offices) (Zip code)
Issuer’s telephone number: (561) 558-2020
Securities registered under Section 12(g) of the Exchange Act:
Common Stock par value $0.0001
Indicate by check mark whether the registrant (1) has filed all reports required to be filed by Section 13 or 15(d) of the Securities Exchange Act of 1934 during the preceding 12 months (or for such shorter period that the registrant was required to file such reports), and (2) has been subject to such filing requirements for the past 90 days. Yes [X] No [ ]
Indicate by check mark whether the registrant has submitted electronically and posted on its corporate Web site, if any, every Interactive Data File required to be submitted and posted pursuant to Rule 405 of Regulation S-T during the preceding 12 months (or for such shorter period that the registrant was required to submit and post such files). Yes [ ] No [ ]
Indicate by check mark whether the registrant is a large accelerated filer, an accelerated filer, a non-accelerated filer, or a smaller reporting company. See the definitions of “large accelerated filer,” “accelerated filer” and “smaller reporting company” in Rule 12b-2 of the Exchange Act.
| Large Accelerated Filer [ ] | Accelerated Filer [ ] | |
| Non-accelerated Filer [ ] (Do not check if a smaller reporting company) | Smaller Reporting Company [X] |
Indicate by check mark whether the registrant is a shell company (as defined in Rule 12b-2 of the Exchange Act). [ ] Yes [ ] No
There were 19,170,265 shares outstanding of registrant’s common stock, par value $0.0001 per share, as of May 9, 2017.
Transitional Small Business Disclosure Format (check one): Yes [ ] No [X]
TABLE OF CONTENTS
| 2 |
| ITEM 1. | FINANCIAL STATEMENTS |
VYCOR
MEDICAL, INC.
Consolidated Balance Sheets
(Unaudited)
| March 31, 2017 | December 31, 2016 | |||||||
| ASSETS | ||||||||
| Current Assets | ||||||||
| Cash | $ | 561,549 | $ | 56,859 | ||||
| Trade accounts receivable, net | 247,728 | 148,784 | ||||||
| Inventory | 186,546 | 204,071 | ||||||
| Prepaid expenses and other current assets | 105,357 | 127,375 | ||||||
| Total Current Assets | 1,101,180 | 537,089 | ||||||
| Fixed assets, net | 475,150 | 401,051 | ||||||
| Intangible and Other assets: | ||||||||
| Trademarks | 251,157 | 251,157 | ||||||
| Patents, net of accumulated amortization | 196,654 | 238,571 | ||||||
| Website, net of accumulated amortization | 13,815 | 14,958 | ||||||
| Security deposits | 42,424 | 42,424 | ||||||
| Total Intangible and Other assets | 504,050 | 547,110 | ||||||
| TOTAL ASSETS | $ | 2,080,380 | $ | 1,485,250 | ||||
| LIABILITIES AND STOCKHOLDERS’ EQUITY | ||||||||
| Current Liabilities | ||||||||
| Accounts payable | $ | 113,545 | $ | 249,949 | ||||
| Accrued interest: Other | 148,601 | 136,765 | ||||||
| Accrued interest: Related party | 12,840 | 12,161 | ||||||
| Accrued liabilities: Other | 231,127 | 116,957 | ||||||
| Accrued liabilities: Related Party | 492,185 | 330,000 | ||||||
| Monies in Escrow Related Party - Offering | - | 101,000 | ||||||
| Notes payable: Related Party | - | 248,000 | ||||||
| Notes payable: Other | 331,243 | 316,856 | ||||||
| Total Current Liabilities | 1,329,541 | 1,511,688 | ||||||
| STOCKHOLDERS’ EQUITY (DEFICIT) | ||||||||
| Preferred stock, $0.0001 par value, 10,000,000 shares authorized, 270,306 issued and outstanding as at March 31, 2017 and December 31, 2016 respectively | 27 | 27 | ||||||
| Common Stock, $0.0001 par value, 25,000,000 shares authorized at March 31, 2017 and December 31, 2016, 17,688,777 and 11,439,357 shares issued and 17,585,443 and 11,336,023 outstanding at March 31, 2017 and December 31, 2016 respectively | 1,769 | 1,144 | ||||||
| Additional Paid-in Capital | 26,259,479 | 25,007,850 | ||||||
| Treasury Stock (103,334 shares of Common Stock as at March 31, 2017 and December 31, 2016 respectively, at cost) | (1,033 | ) | (1,033 | ) | ||||
| Accumulated Deficit | (25,639,522 | ) | (25,164,545 | ) | ||||
| Accumulated Other Comprehensive Income | 130,119 | 130,119 | ||||||
| Total Stockholders’ Equity (Deficit) | 750,839 | (26,438 | ) | |||||
| TOTAL LIABILITIES AND STOCKHOLDERS’ EQUITY (DEFICIT) | $ | 2,080,380 | $ | 1,485,250 | ||||
See accompanying notes to financial statements
| 3 |
VYCOR
MEDICAL, INC.
Consolidated Statements of Comprehensive Loss
(unaudited)
| For the three months ended March 31, | ||||||||
| 2017 | 2016 | |||||||
| Revenue | $ | 428,399 | $ | 400,085 | ||||
| Cost of Goods Sold | 47,976 | 67,238 | ||||||
| Gross Profit | 380,423 | 332,847 | ||||||
| Operating expenses: | ||||||||
| Depreciation and Amortization | 69,372 | 63,283 | ||||||
| General and administrative | 610,773 | 784,342 | ||||||
| Total Operating expenses | 680,145 | 847,625 | ||||||
| Operating loss | (299,722 | ) | (514,778 | ) | ||||
| Other income (expense) | ||||||||
| Interest expense: Related Party | (678 | ) | - | |||||
| Interest expense: Other | (12,043 | ) | (11,980 | ) | ||||
| Loss on foreign currency exchange | (348 | ) | (806 | ) | ||||
| Total Other Income (expense) | (13,069 | ) | (12,786 | ) | ||||
| Loss Before Credit for Income Taxes | (312,791 | ) | (527,564 | ) | ||||
| Credit for income taxes | - | - | ||||||
| Net Loss | (312,791 | ) | (527,564 | ) | ||||
| Preferred stock dividends | (162,186 | ) | (88,318 | ) | ||||
| Net Loss available to common shareholders | (474,977 | ) | (615,882 | ) | ||||
| Comprehensive Loss | ||||||||
| Foreign Currency Translation Adjustment | - | - | ||||||
| Comprehensive Loss | (474,977 | ) | (615,882 | ) | ||||
| Net Loss Per Share | ||||||||
| Basic and diluted | $ | (0.03 | ) | $ | (0.06 | ) | ||
| Weighted Average Number of Shares Outstanding – Basic and Diluted | 15,247,264 | 10,934,887 | ||||||
See accompanying notes to financial statements
| 4 |
VYCOR
MEDICAL, INC.
Consolidated Statement of Cash Flows
(unaudited)
| For the three months ended | ||||||||
| March 31, | ||||||||
| 2017 | 2016 | |||||||
| Cash flows from operating activities: | ||||||||
| Net loss | (312,791 | ) | (527,564 | ) | ||||
| Adjustments to reconcile net loss to cash used in operating activities: | ||||||||
| Amortization of intangible assets | 43,059 | 29,148 | ||||||
| Depreciation of fixed assets | 29,992 | 36,431 | ||||||
| Inventory provision | 2,544 | 2,544 | ||||||
| Stock based compensation | 61,047 | 254,762 | ||||||
| Loss on foreign exchange | - | 806 | ||||||
| Changes in assets and liabilities: | ||||||||
| Accounts receivable | (98,944 | ) | (56,032 | ) | ||||
| Inventory | 14,982 | 12,588 | ||||||
| Prepaid expenses | 27,030 | 37,102 | ||||||
| Accrued interest other | 679 | - | ||||||
| Accrued interest other | 11,836 | 11,967 | ||||||
| Accounts payable | (136,403 | ) | (59,815 | ) | ||||
| Accrued liabilities | 114,168 | 57,984 | ||||||
| Cash used in operating activities | (242,801 | ) | (200,079 | ) | ||||
| Cash flows from investing activities: | ||||||||
| Purchase of fixed assets | (71,331 | ) | (17,172 | ) | ||||
| Cash used in investing activities | (71,331 | ) | (17,172 | ) | ||||
| Cash flows from financing activities: | ||||||||
| Proceeds from issuance of common stock, net | 842,207 | - | ||||||
| Repayment of Notes Payable - Other | (23,385 | ) | (25,815 | ) | ||||
| Cash provided by (used in) financing activities | 818,822 | (25,815 | ) | |||||
| Effect of exchange rate changes on cash | - | (806 | ) | |||||
| Net increase (decrease) in cash | 504,690 | (243,872 | ) | |||||
| Cash at beginning of period | 56,859 | 347,477 | ||||||
| Cash at end of period | 561,549 | 103,605 | ||||||
| Supplemental Disclosures of Cash Flow information: | ||||||||
| Non-Cash Transactions: | ||||||||
| Preferred stock dividends satisfied in new preferred stock | $ | - | $ | 88,318 | ||||
| Common stock issued upon conversion of debt | $ | 248,000 | $ | - | ||||
| Common stock issued in respect of funds held in escrow | $ | 101,000 | $ | - | ||||
See Accompanying Notes to Financial Statements
| 5 |
VYCOR
MEDICAL, INC.
NOTES TO CONSOLIDATED FINANCIAL STATEMENTS
MARCH 31, 2017
(unaudited)
| 1. | BASIS OF PRESENTATION |
The consolidated financial statements of the Company present the financial position, results of operations, and cash flows of Vycor Medical, Inc. and its wholly owned subsidiaries. All significant intercompany accounts and transactions have been eliminated. The accompanying unaudited consolidated financial statements have been prepared in accordance with accounting principles generally accepted in the United States (“GAAP”) for interim financial information and with the instructions to Form 10-Q and Article 10 of Regulation S-X of the Securities Exchange Commission. In accordance with those rules and regulations certain information and footnote disclosures normally included in comprehensive financial statements have been omitted pursuant to such rules and regulations. The consolidated balance sheet as of December 31, 2016 derives from the audited financial statements at that date, but does not include all the information and footnotes required by GAAP. These financial statements should be read in conjunction with the audited financial statements and notes thereto included in the Company’s Annual Report on Form 10-K for the year ended December 31, 2016.
The consolidated financial statements as of and for the three months ended March 31, 2017 and 2016, in the opinion of management, include all adjustments, consisting only of normal recurring adjustments, necessary for a fair presentation of the Company’s financial condition and results of operations. The results of operations for the three months ended March 31, 2017 and 2016 are not necessarily indicative of the results to be expected for any other interim period or for the entire year.
Ability to continue as a Going Concern
The Company has incurred losses since its inception, including a net loss of $312,791 and $527,564 for the three month period ended March 31, 2017 and 2016 respectively. As at December 31, 2016 the Company had stockholder’s deficiency of $26,483 and cash of $56,859. As a result, these conditions had raised substantial doubt regarding our ability to continue as a going concern.
However, on January 11, and February 23, 2017 the Company completed the sale of $1,274,717 in shares of Common Stock and Warrants to accredited investors. Included in these gross proceeds is the conversion of $248,000 of debt on the balance sheet at December 31, 2016, so that proceeds net of debt conversion were $1,026,717. The Private Placement raised net cash proceeds, after debt conversion and expenses, of $943,207, of which 842,207 was received during the period. As at March 31, 2017 the Company had stockholder’s equity of $750,839 and cash of $561,549. Management has evaluated the effects of the Private Placement on the Company’s financial condition, as well as the continued revenue growth coupled with improved margins and control of expenses. Management is of the opinion that any potential going concern uncertainty that previously existed has been remediated, and that its cash and cash equivalents of $561,549 at March 31, 2017, together with the continued reduction in losses as a result of initiatives outlined in “Liquidity and Plan of Operations” in Item 2. will be sufficient to meet its anticipated cash requirements through at least June 30, 2018.
| 2. | SIGNIFICANT ACCOUNTING POLICIES |
Principles of Consolidation and Basis of Presentation
The consolidated financial statements include the accounts of Vycor Medical, Inc., and its wholly-owned subsidiaries, NovaVision, Inc. (a Delaware corporation), NovaVision GmbH (a German corporation) and Sight Science Limited (a UK corporation), both wholly owned subsidiaries of NovaVision, Inc. The Company is headquartered in Boca Raton, FL. All material inter-company accounts, transactions, and profits have been eliminated in consolidation.
Recent Accounting Pronouncements
In August 2014, the FASB issued ASU No. 2014-15 —Presentation of Financial Statements—Going Concern (Subtopic 205-40): Disclosure of Uncertainties about an Entity’s Ability to Continue as a Going Concern. The ASU requires management to evaluate whether there are conditions and events that raise substantial doubt about the entity’s ability to continue as a going concern within one year after the financial statements are issued and if management’s plans will alleviate that doubt. Management is required to make this evaluation for both annual and interim reporting periods. The Company adopted this guidance for the fiscal year ended December 31, 2016. This adoption did not have a material impact on the Company’s consolidated financial statements.
From time to time new accounting pronouncements are issued by the Financial Accounting Standards Board or other standard setting bodies that may have an impact on the Company’s accounting and reporting. The Company believes that such recently issued accounting pronouncements and other authoritative guidance for which the effective date is in the future will not have an impact on its accounting or reporting or that such impact will not be material to its financial position, results of operations and cash flows when implemented.
| 6 |
Net Loss Per Share
Basic net loss per share is computed by dividing net loss by the weighted-average number of common shares outstanding during the period. Diluted net loss per share is computed giving effect to all dilutive potential common shares that were outstanding during the period. Dilutive potential common shares consist of incremental shares issuable upon exercise of stock options and warrants and conversion of preferred stock and convertible debt. Such potentially dilutive shares are excluded when the effect would be to reduce a net loss per share. No dilution adjustment has been made to the weighted average outstanding common shares in the periods presented because the assumed exercise of outstanding options and warrants and the conversion of preferred stock and debt would be anti-dilutive.
The following table sets forth the potential shares of common stock that are not included in the calculation of diluted net loss per share:
| March 31, 2017 | December 31, 2016 | |||||||
| Stock options outstanding | 725,557 | 705,557 | ||||||
| Warrants to purchase common stock | 8,469,239 | 6,007,048 | ||||||
| Debentures convertible into common stock | 248,112 | 242,647 | ||||||
| Preferred shares convertible into common stock | 1,272,052 | 1,272,052 | ||||||
| Directors Deferred Compensation Plan | 297,690 | 176,479 | ||||||
| Total | 11,012,650 | 8,403,783 | ||||||
| 3. | NOTES PAYABLE |
Related Party Notes Payable
As of March 31, 2017 and December 31, 2016 Related Party Notes Payable consists of:
| March 31, 2017 | December 31, 2016 | |||||||
| In the period the Company issued promissory notes to Fountainhead Capital Management Limited for $248,000. The notes bear interest at 10% per annum and are payable on the earlier of one year or five days following the delivery of written demand for payment by the Payee. The notes were converted into 1,180,953,shares of common stock and 1,180,953 warrants in connection with the Private Placement in January 2017. | - | 248,000 | ||||||
| Total Related Party Notes Payable | - | 248,000 | ||||||
| 7 |
Other Notes Payable
As of March 31, 2017 and December 31, 2016, Other Notes Payable consists of:
| March 31, 2017 | December 31, 2016 | |||||||
| On March 25, 2011 the Company issued a term note for $300,000 to EuroAmerican Investment Corp. (“EuroAmerican”). The term note bears interest at 16% per annum and was due June 25, 2011. In connection with the loan the Company also issued EuroAmerican warrants to purchase 400,000 shares of the Company’s common stock at an exercise price of $4.50 per share for a period of three (3) years. On June 25, 2011 the due date for this note was extended to September 25, 2011 and the Holder was granted the right to convert all or any amount of the principal face amount of the note then outstanding and accrued interest into shares of common stock of the Company an adjusted conversion price of $1.80 per share, subject to adjustment and does not require bifurcation. The due date for this note has been extended to May 31, 2017 | 300,000 | 300,000 | ||||||
| Insurance policy finance agreements. During the period ended March 31, 2017 the Company made payments of $23,385. The notes are due over the next twelve months. | 31,243 | 16,856 | ||||||
| Total Notes Payable: | 331,243 | 316,856 | ||||||
The company assesses the value of the beneficial conversion feature of its convertible debt by determining the intrinsic value of such conversion, under ASC 470, at the time of issuance. At the time of issuance of the convertible debt instruments set out above, the fair value of the stock was either the same or less than the conversion price, and so there was no value attributable to any beneficial conversion feature.
| 4. | SEGMENT REPORTING, GEOGRAPHICAL INFORMATION |
(a) Business segments
The Company operates in two business segments: Vycor Medical, which focuses on devices for neurosurgery; and NovaVision, which focuses on neuro stimulation therapies and diagnostic devices for the treatment and screening of vision field loss and which includes Sight Science. Set out below are the revenues, gross profits and total assets for each segment.
| Three
Months Ended March 31, | ||||||||
| 2017 | 2016 | |||||||
| Revenue: | ||||||||
| Vycor Medical | $ | 369,887 | $ | 348,920 | ||||
| NovaVision | $ | 58,512 | $ | 51,165 | ||||
| $ | 428,399 | $ | 400,085 | |||||
| Gross Profit | ||||||||
| Vycor Medical | $ | 328,596 | $ | 286,607 | ||||
| NovaVision | $ | 51,827 | $ | 46,240 | ||||
| $ | 380,423 | $ | 332,847 | |||||
| March 31, 2017 | December 31, 2016 | |||||||
| Total Assets: | ||||||||
| Vycor Medical | $ | 1,450,057 | $ | 805,716 | ||||
| NovaVision | 630,323 | 679,534 | ||||||
| Total Assets | $ | 2,080,380 | $ | 1,485,250 | ||||
| 8 |
(b) Geographic information
The Company operates in two geographic segments, the United States and Europe. Set out below are the revenues, gross profits and total assets for each segment.
| Three Months Ended March 31, | ||||||||
| 2017 | 2016 | |||||||
| Revenue: | ||||||||
| United States | $ | 401,072 | $ | 372,305 | ||||
| Europe | $ | 27,327 | $ | 27,780 | ||||
| $ | 428,399 | $ | 400,085 | |||||
| Gross Profit | ||||||||
| United States | $ | 355,701 | $ | 307,237 | ||||
| Europe | $ | 24,722 | $ | 25,610 | ||||
| $ | 380,423 | $ | 332,847 | |||||
| March 31, 2017 | December 31, 2016 | |||||||
| Total Assets: | ||||||||
| United States | $ | 1,861,679 | $ | 1,258,624 | ||||
| Europe | 218,701 | 226,626 | ||||||
| Total Assets | $ | 2,080,380 | $ | 1,485,250 | ||||
| 5. | EQUITY |
Common Stock and Stock Grants
During January to March 2017, the Company granted 87,878 shares of Common Stock (valued at $21,000) to non-employee Directors. Under the terms of the Directors Deferred Compensation Plan, the receipt of these shares is deferred until the January 15th following the termination of their services as a director. As of March 31, 2017 these shares have yet to be issued.
During January to March 2017, the Company issued 36,484 shares of Common Stock (valued at $8,438) to members of the NovaVision, Inc. Scientific Advisory Board in respect of their services.
During January to March 2017, the Company issued 142,857 shares of Common Stock (valued at $30,000) to Fountainhead in accordance with the terms of a Consulting Agreement.
Private Placement.
On January 11 and February 23, 2017, the Company completed the sale of $1,274,717 in shares of Vycor Common Stock (each a “Share”) and Warrants (together with the Shares, the “Securities”) to accredited investors (the “Investors”). The Shares were issued in a private placement (the “Private Placement”) pursuant to the terms of Stock Purchase Agreements between the Company and each of the Investors, and was limited to current shareholders of the Company as of November 9, 2016 (the “Record Date”).
| 9 |
Included in these gross proceeds is the conversion of $248,000 of debt on the balance sheet at December 31, 2016 and $101,000 funds held in escrow on the balance sheet at December 31, 2016. The Private Placement raised net cash proceeds, after debt conversion and expenses, of $943,207, of which $842,207 was received during the period.
The Private Placement was undertaken as a private placement offering under Section 4(a)(2) of the Securities Act of 1933, as amended (the “Act”) and Rule 506(b) of Regulation D promulgated under the Act since, among other things, the transaction did not involve a public offering and the securities were acquired for investment purposes only and not with a view to or for sale in connection with any distribution thereof.
The Securities comprised one Share at a purchase price $0.21 per share and a Warrant to purchase one Share at an exercise price of $0.27, exercisable over a period of three (3) years. A total of 6,070,079 Shares and Warrants to purchase 6,070,079 Shares were issued in the Private Placement.
Warrants and Options
The details of the outstanding warrants and options are as follows:
| STOCK WARRANTS: | ||||||||
| Weighted average | ||||||||
| Number of shares | exercise
price per share | |||||||
| Outstanding at December 31, 2015 | 6,007,048 | $ | 2.57 | |||||
| Granted | - | - | ||||||
| Exercised | - | - | ||||||
| Cancelled or expired | - | - | ||||||
| Outstanding at December 31, 2016 | 6,007,048 | $ | 2.57 | |||||
| Granted | 6,272,770 | $ | 0.27 | |||||
| Exercised | - | - | ||||||
| Cancelled or expired | (3,810,579 | ) | - | |||||
| Outstanding at March 31, 2017 | 8,469,239 | $ | 2.18 | |||||
| STOCK OPTIONS: | ||||||||
| Weighted average | ||||||||
| Number of shares | exercise
price per share | |||||||
| Outstanding at December 31, 2015 | 25,557 | $ | 20.25 | |||||
| Granted | 680,000 | $ | 0.79 | |||||
| Exercised | - | - | ||||||
| Cancelled or expired | - | - | ||||||
| Outstanding at December 31, 2016 | 705,557 | $ | 20.25 | |||||
| Granted | 20,000 | $ | 0.27 | |||||
| Exercised | - | - | ||||||
| Cancelled or expired | - | - | ||||||
| Outstanding at March 31, 2017 | 725,557 | $ | 1.89 | |||||
On March 31, 2017 options to purchase 660,000 shares of Common Stock were granted to Fountainhead under the terms of a Consulting Agreement. These options will vest on April 1, 2018 subject to the achievement of certain milestones by March 31, 2018. These options are not included in the above table until such a time as they vest.
As of March 31, 2017, the weighted-average remaining contractual life of outstanding warrants and options is 2.18 and 1.89 years, respectively.
| 10 |
| 6. | SHARE-BASED COMPENSATION |
Stock Option Plan
Under ASC Topic 718, the Company estimates the fair value of option awards on the date of grant using an option pricing model. The grant date fair value is recognized over the option-vesting period, the period during which an employee is required to provide service in exchange for the award. No compensation cost is recognized for equity instruments for which employees do not render the requisite service. Under these standards, compensation cost for employee cost for employee stock-based awards is based on the estimated grant-date fair value and recognized over the vesting period of the applicable award on a straight-line basis.
For the three months ended March 31, 2017 and 2016, the Company recognized share-based compensation of $1,609 and $198,200, respectively, for employee stock options.
Stock appreciation rights may be granted either on a stand-alone basis or in conjunction with all or part of any other stock options granted under the plan. As of March 31, 2017 there were no awards of any stock appreciation rights.
Non-Employee Stock Compensation
The Company from time to time issues common stock, stock options or common stock warrants to acquire services or goods from non-employees. Common stock, stock options and common stock warrants issued to other than employees or directors are recorded on the basis of their fair value, which is measured as of the “measurement date” using an option pricing model. The “measurement date” for options and warrants related to contracts that have substantial disincentives to non-performance is the date of the contract, and for all other contracts is the vesting date. Expense related to the options and warrants is recognized on a straight-line basis over the shorter of the period over which services are to be received or the life of the option or warrant.
Aggregate stock-based compensation expense charged to operations for stock and warrants granted to non-employees for the three months ended March 31, 2017 and 2016 was $141,938 and $56,562, of which $59,438 and $56,562 related to stock issued during the periods; $82,500 was accrued and issued following the period ended March 31, 2017. During the three months ended March 31, 2017 warrants with a value of $86,754 were granted with performance vesting conditions; the value of these options will not be recognized as share-based compensation unless or until the Company concludes that it is probably the performance conditions will be achieved.
Stock-based Compensation Valuation Methodology
Stock-based compensation resulting from the issuance of Common Stock is calculated by reference to the valuation of the Stock on the date of issuance, the expense being recognized as the compensation is earned. Stock-based compensation expenses related to employee options and warrants granted to non-employees are recognized as the stock options and warrants are earned. The fair value of the stock options or warrants granted is estimated at the grant date, using the Black-Scholes option pricing model, and the expense is recognized on a straight-line basis over the shorter of the period over which services are to be received or the life of the option or warrant. The grant date fair value of employee share options and similar instruments is estimated using the Black-Scholes option pricing model on the basis of the fair value of the underlying common stock on the measurement date, adjusted for the unique characteristics of those equity instruments, using the assumptions noted in the table below. Expected volatility is based on the historical volatility of a peer group of publicly traded companies. The expected term of options and warrants was based upon the expected life of the option or warrant, and the risk-free rate is based on the U.S. Treasury Constant Maturity rate.
The following assumptions were used in calculations of the Black-Scholes option pricing model for the three months ended March 31, 2017 and 2016:
| Three Months Ended March 31, | ||||||||
| 2017 | 2016 | |||||||
| Risk-free interest rates | 1.50 | % | 0.91 | % | ||||
| Expected life | 1.5 years | 1.5 years | ||||||
| Expected dividends | 0 | % | 0 | % | ||||
| Expected volatility | 104 | % | 95 | % | ||||
| Vycor Common Stock fair value | $ | 0.20 | $ | 0.71 | ||||
| 11 |
| 7. | COMMITMENTS AND CONTINGENCIES |
Lease
The Company leases approximately 10,000 sq. ft. located at 6401 Congress Ave., Suite 140, Boca Raton, FL 33487 from Catexor Limited Partnership for a gross rent of $15,439 plus sales tax per month. The term of the lease is 5 years and 6 months terminating July, 2017. The Company’s subsidiary in Germany occupies premises on a short term lease agreement. Rent expense for the three months ended March 31, 2017 and 2016 was $51,513 and $53,654 respectively.
Potential German tax liability
In June 2012 the Company’s German subsidiary received a preliminary assessment for Magdeburg City trade tax of approximately €75,000 (approximately $85,000). This assessment is for the 2010 fiscal year and relates to the Company’s acquisition of the assets of the former NovaVision, Inc. An initial assessment for corporate tax for the same period has been preliminarily reduced to zero. The Company has not accepted this trade tax assessment and is in discussion with the relevant tax authorities with a view to its reduction. The tax authorities have agreed to suspend the assessment pending the outcome of certain court hearings, and the Company has agreed to make limited monthly payments on account. To the extent that this assessment (either a higher or a reduced amount) is ultimately confirmed by the tax authorities, the Company believes it has a very strong claim against certain professional advisors which would offset the liability in full. Accordingly, the Company has made no provision for this liability in the three months ended March 31, 2017 and the year ended December 31, 2016 respectively, other than recording the monthly payments as an expense.
Potential Patent Infringement
The Company was made aware in 2012 that a competitor had been granted a patent for related technology, and appeared to be entering the market with products that infringe the Company’s own issued patent. Following investigation, the Company initiated an invalidation of the competitor’s patent; in March 2014 the Patent Re-examination Board issued an Examination Decision invalidating all the claims of the competitor’s patent. The competitor appealed the decision, but the Company has contested the appeal. A final decision on the appeal is pending. The Company has, in the interim, also prepared to enforce its own patent against this competitor, however this competitor appears to have abandoned its product offering, making an enforcement action moot for the time being. The Company has also been made aware that a second competitor has filed a patent application for related technology and also may be producing a product that potentially infringes the Company’s patent, and has filed documents with the State Intellectual Property Office opposing grant of the patent application. As a general rule the Company intends to take all necessary action to protect its patent portfolio. As with all patent infringement actions, there is some risk that the accused infringer will not be found to infringe the claims, and an additional risk that the accused infringer will successfully challenge the validity of the asserted claims.
| 8. | CONSULTING AND OTHER AGREEMENTS |
The following agreements were entered into or remained in force during the three months ended March 31, 2017:
During the three months ended March 31, 2017, under the terms of an amended Consulting Agreement between the Company and Fountainhead, Fountainhead was paid a monthly retainer of $10,000 per month in Company Common Stock issued at the end the quarter.
In March 2017 and effective April 1, 2017, as part of a streamlining of compensation arrangements with executive management, the Company established the March 2017 Compensation Plan. Under this Plan, the Company amended the Fountainhead Consulting Agreement (“the Amendment”) to increase the annual fees by $330,000 to a total of $37,500 per month; at the same time, annual compensation payable to executive management under the March 2016 Compensation Plan was reduced by $330,000 to $0. These changes therefore have no financial impact on the Company. The other terms of the Consulting Agreement remain the same, including the ability of Fountainhead at its option to receive $5,000 per month in cash and the remainder payable in Company Common Stock issued at the recent Private Placement price and deliverable at the end of each fiscal quarter. The Consulting Agreement also contains provisions for Fountainhead to receive a higher proportion of fees in cash subject to certain future liquidity events, and subject to Board approval. Under the Amendment, Fountainhead was granted options pursuant to the Vycor Medical, Inc. 2008 Stock Option Plan, to purchase 660,000 shares of Company Common Stock at the same $0.27 exercise price as that of the warrants issued in the Private Placement. Vesting of these options is subject to the achievement of certain milestones by March 31, 2018. These options are equivalent to a grant of options to executive management under the March 2016 Compensation Plan, the change being made as part of the same streamlining.
| 12 |
| 9. | RELATED PARTY TRANSACTIONS |
Peter Zachariou, director and David Cantor, director are investment managers of Fountainhead Capital Management which is a related party due to the size of its shareholding. Adrian Liddell, Chairman is a consultant for Fountainhead Capital Management.
During the period ended March 31, 2017, in accordance with the terms of the Consulting Agreement, the Company issued 142,857 shares of Common Stock (valued at $30,000) to Fountainhead.
On January 11, and February 23, 2017 the Company completed the sale of $1,274,717 in shares of Common Stock and Warrants to accredited investors (the “Private Placement”). Fountainhead subscribed a total of $477,939 of shares in the Private Placement of which approximately $248,000 represented amounts that Fountainhead had already advanced to the Company and was held in the form of notes. As a result, Fountainhead was issued 2,275,901 shares of Common Stock and Warrants to purchase 2,275,901 shares of Common Stock an exercise price of $0.27.
During the period ended March 31, 2017, following the achievement of certain milestones established in the March 2016 Compensation Plan, the Company accrued deferred compensation of $82,500. This together with the balance of the deferred compensation accrued during the year ended December 31, 2016, was paid to Fountainhead in common stock subsequent to the quarter end (See Note 10).
| 10. | SUBSEQUENT EVENTS |
The Company evaluated subsequent events through the date the financial statements were issued and filed with this Form 10Q:
On April 30, 2017, following the achievement of certain milestones established in the March 2016 Compensation Plan, 1,571,429 shares of Common Stock, valued at $330,000, were issued to Fountainhead.
| 13 |
ITEM 2. MANAGEMENT’S DISCUSSION AND ANALYSIS OF FINANCIAL CONDITION AND RESULTS OF OPERATIONS.
Forward Looking Statements
This Interim Report on Form 10-Q contains, in addition to historical information, certain forward-looking statements within the meaning of the Private Securities Litigation Reform Act of 1995 (“PLSRA”), Section 27A of the Securities Act of 1933, as amended (the “Securities Act”), and section 21E of the Securities Exchange Act of 1934, as amended (the “Exchange Act”) regarding Vycor Medical, Inc. (the “Company” or “Vycor,” also referred to as “us”, “we” or “our”). Forward-looking statements give our current expectations or forecasts of future events. You can identify these statements by the fact that they do not relate strictly to historical or current facts. Forward-looking statements involve risks and uncertainties. Forward-looking statements include statements regarding, among other things, (a) our projected sales, profitability, and cash flows, (b) our growth strategies, (c) anticipated trends in our industries, (d) our future financing plans and (e) our anticipated needs for working capital. They are generally identifiable by use of the words “may,” “will,” “should,” “anticipate,” “estimate,” “plans,” “potential,” “projects,” “continuing,” “ongoing,” “expects,” “management believes,” “we believe,” “we intend” or the negative of these words or other variations on these words or comparable terminology. These statements may be found under “Management’s Discussion and Analysis of Financial Condition and Results of Operations” and “Description of Business,” as well as in this Form 10-Q generally. In particular, these include statements relating to future actions, prospective products or product approvals, future performance or results of current and anticipated products, sales efforts, expenses, the outcome of contingencies such as legal proceedings, and financial results.
Any or all of our forward-looking statements in this report may turn out to be inaccurate. They can be affected by inaccurate assumptions we might make or by known or unknown risks or uncertainties. Consequently, no forward-looking statement can be guaranteed. Actual future results may vary materially as a result of various factors, including, without limitation, the risks outlined under “Risk Factors” and matters described in this Form 10-Q generally. In light of these risks and uncertainties, there can be no assurance that the forward-looking statements contained in this filing will in fact occur. You should not place undue reliance on these forward-looking statements. The forward-looking statements speak only as of the date on which they are made, and, except to the extent required by federal securities laws, we undertake no obligation to publicly update any forward-looking statements, whether as the result of new information, future events, or otherwise. We intend that all forward-looking statements be subject to the safe harbor provisions of the PSLRA.
1. Organizational History
The Company was formed as a limited liability company under the laws of the State of New York on June 17, 2005 as “Vycor Medical LLC”. On August 14, 2007, we converted into a Delaware corporation and changed our name to “Vycor Medical, Inc.”. The Company’s listing went effective on February 2009 and on November 29, 2010 Vycor completed the acquisition of substantially all of the assets of NovaVision, Inc. (“NovaVision”) and on January 4, 2012 Vycor, through its wholly-owned NovaVision subsidiary, completed the acquisition of all the shares of Sight Science Limited (“Sight Science”), a previous competitor to NovaVision.
2. Overview of Business
Vycor is dedicated to providing the medical community with innovative and superior surgical and therapeutic solutions and operates two distinct business units within the medical device industry. Vycor Medical designs, develops and markets medical devices for use in neurosurgery. NovaVision provides non-invasive rehabilitation therapies for those who have vision disorders resulting from neurological brain damage such as that caused by a stroke. Both businesses adopt a minimally or non-invasive approach. Both technologies have strong sales growth potential, address large potential markets and have the requisite regulatory approvals. The Company has 59 issued or allowed patents and a further 15 pending. The Company leverages joint resources across the divisions to operate in a cost-efficient manner.
The Company periodically engages in discussions with potential strategic partners for or purchasers of each or both of our operating divisions.
Vycor Medical
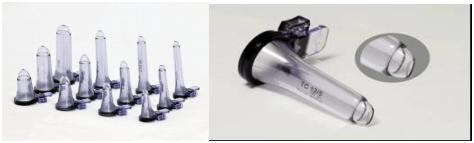
Vycor Medical designs, develops and markets medical devices for use in neurosurgery. Vycor Medical’s ViewSite Brain Access System (“VBAS”) is a next generation retraction and access system that was fully commercialized in early 2010 and is the first significant technological change to brain tissue retraction in over 50 years in contrast to significant development in most other neuro-surgical technologies. Vycor Medical is ISO 13485:2003 compliant, and VBAS has U.S. FDA 510(k) clearance and CE Marking for Europe (Class III) for brain and spine surgeries, and regulatory approvals in Australia, Brazil, Canada, China, Korea, Japan, Russia and Taiwan.
| 14 |
We believe VBAS offers several advantages over other brain retractor systems, commonly known as ribbon or blade retractors that are metallic, including having the potential to significantly reduce brain tissue trauma that arises from excessive pressure at the edges of the blade. The design of VBAS can minimize the size of the brain entry access necessary for surgical procedures, and is believed to significantly reduce the pressure and hence trauma on the surrounding brain tissue.
NovaVision
NovaVision provides non-invasive, computer-based rehabilitation targeted at a substantial and largely un-addressed market of people who have lost their sight as a result of stroke or other brain injury. NovaVision addresses a significant target market, estimated at approximately $2 billion in each of the U.S. and the EU and over $13 billion globally.
NovaVision has a family of therapies that both restore and compensate for lost vision:
| ● | Restoration of vision: NovaVision’s VRT and Sight Science’s Neuro-Eye Therapy (NeET), aim to improve visual sensitivity in a person’s blind area. VRT delivers a series of light stimuli along the border of the patient’s visual field loss. These programmed light sequences stimulate the border zone between the “seeing” and “blind” visual fields, repetitively challenging the visual cortex in the border zone with a large number of stimuli over the course of time. NeET targets deep within the blind area by repeated stimulation, allowing patients to detect objects within the blind field. | |
| ● | Compensation and re-training: Normal eye movements are also affected after brain injury adding to the problems of blindness. NeuroEyeCoach provides a complementary therapy to VRT and NeET, which re-trains a patient to move their eyes, re-integrate left and right vision and to make the most of their remaining visual field. |
VRT and NeuroEyeCoach are therefore highly complementary and are provided in an Internet-delivered suite to ensure broad benefits to NovaVision’s patients.

NovaVision also has models of VRT and NeuroEyeCoach for physicians and rehabilitation clinics, as well as VIDIT, a diagnostic program that enables therapists to perform high-resolution visual field tests in less than ten minutes.
NovaVision’s VRT is the only medical device aimed at the restoration of vision lost as a result of neurological damage which has FDA 510(k) clearance to be marketed in the U.S; and NeuroEyeCoach is registered in the US as a Class I 510(k) exempt device. VRT, NEC and NeET have CE Marking for the EU. NovaVision has 41 granted and 2 pending patents worldwide.
| 15 |
Competition
The VBAS device is both a brain access system and a retractor and is therefore unique with no direct competitors. Competitive manufacturers of brain retractors include Cardinal Health (V. Mueller line), Aesculap, Integra Life Science and Codman (Division of Johnson & Johnson). Nico Corporation has a brain access device specifically designed to work with its Myriad resection and suction product.
NovaVision provides restoration therapies (VRT and NeET) and compensation or saccadic therapies (NeuroEyeCoach) for those suffering vision loss as a result of neurological trauma. The other therapy type for this condition is substitution (optical aids such as prisms) and is not considered by NovaVision as competition.
In restoration, competition has been reduced through NovaVision’s acquisition of Sight Science and there are a few very small companies or entities offering some form of vision rehabilitation product in Germany. Within compensation there are no real direct competitors. Other companies in the general rehabilitation space include RevitalVision, PositScience and Dynavision. In the professional market, NovaVision competes with aggregator products or those that provide a range of non-specific therapies, such a Rehacom, Sanet Vision Integrator and Bioness BITS. NovaVision’s products are dedicated to vision.
The Market For the Company’s Products And Therapies
VBAS is used for craniotomy procedures. Based on statistics from the American Association of Neurological Surgeons (AANS), management estimates 700,000 such procedures are performed in the US annually. Of this, management believe approximately 225,000 (32 percent) are addressable by the VBAS range currently, with another 100,000 (total of 325,000 or 46 percent) addressable by an expanded future range. Management estimates, for the global market, there exists a current addressable market of approximately 1,100,000 procedures with another 500,000 addressable by an expanded VBAS range.
The market for NovaVision’s therapies comprises those suffering from vision loss resulting from neurological trauma such as stroke or other brain injury. The U.S. Centers for Disease Control (CDC) estimates there are approximately 8 million Americans who have previously had a stroke incident, with 795,000 additional strokes occurring annually; adjusting for repeat strokes and deaths, there are 481,000 new stroke survivors each year. Additionally, approximately 5.3 million Americans live with the long-term effects of a TBI, with 275,000 hospitalizations each year. The most recent scientific research estimates that approximately 28.5% experience some visual impediment and 20.5% of these patients experience a permanent visual field deficit, reducing mobility and other activities of daily living. The target market for VRT and NeET is this 20.5% subset of patients who have suffered a permanent visual field deficit; NeuroEyeCoach addresses all 28.5% of patients who experience visual impediments. Management estimates that the addressable target market for its therapies is approximately 2.9 million people in the US, approximately 2.8 million people in Europe and approximately 12.9 million people throughout the rest of the world.
Our Growth Strategy
Vycor Medical
Vycor Medical’s growth strategy includes:
1. Increasing U.S. market penetration through broader hospital coverage and targeted direct physician marketing. Vycor Medical’s sales and marketing strategy is to penetrate a well-defined US target market of 4,500 neurosurgeons. Vycor markets direct to surgeons as well as marketing and distributing through independent distributors, with a focus both on adding new hospitals and expanding to additional surgeons in hospitals where VBAS is already approved, and to expand usage to a broader range of procedures. Vycor is pursuing a policy of continually evaluating and upgrading its distributors as well as adding additional distributors in regions where it has little to no presence.
2. Provision of more Clinical and Scientific Data supporting the products superiority over the current standard-of-care blade retractors and to demonstrate VBAS’ potential for cost savings. Clinical and scientific data (in the form of peer reviewed articles, clinical studies and other reports and case studies) are critical in driving adoption, and in turn revenues, further and faster by demonstrating VBAS’ superiority as a minimally invasive access system that helps VBAS move further up the hospital cost/benefit curve. To date the Company has already had 10 Peer Reviewed studies and 4 other clinical papers and anticipates further studies to be published.
| 16 |
3. International Market Growth
Vycor Medical utilizes select medical device distributors with experience in neurosurgical devices in their countries or regions. VBAS has full regulatory approvals in Australia, Brazil, Canada, China, Europe (EU – Class III), Korea, Japan and Taiwan and is seeking or has partial regulatory approvals in India, Russia and Vietnam. Vycor Medical is actively pursuing new distribution agreements in the countries where it does not have any market presence.
4. New Product Development
New Product Development is targeted at both driving the use of its existing VBAS product range through ancillary products and modalities that will facilitate the product’s use and through new product extensions to broaden VBAS applicability to procedures currently not addressed by the existing product line.
Vycor is modifying its existing VBAS product suite to make it easier to integrate with Image Guidance Systems (IGS) by re-engineering its VBAS product range so that the entire range of 12 devices, excluding the VBASmini, will be able to more easily accommodate pointers from the leading IGS system providers. Increasingly, all major neuro centers have image guidance systems, and where this is in place management believes over 90% of surgeries are carried out using IGS and management strongly believes that the existing VBAS rigid structure lends itself well to being incorporated into this increasing trend.
NovaVision
While speech, physical, and occupational therapies are the long-standing treatment standards for stroke and TBI survivors, VRT is the first and only FDA-cleared clinical component of vision restoration to physically enhance the visual field after a stroke or brain injury. Increasingly the healthcare community, partly driven by strong lobbying by stroke associations worldwide, are recognizing that vision is not only a significant issue post stroke or brain injury, but that visual field loss can have a significant impact on the success of other rehabilitation modalities and the quality of life.
NovaVision is now able to provide a clinically supported, cost-effective and scalable visual therapy solution offering broad benefits to those suffering visual impairment following neurological brain damage, to both patients and medical professionals alike.
NovaVision has four routes-to-market aimed at patients and professionals, comprising: direct-to-patient; rehabilitation centers and clinics; stroke associations and support groups; and physicians. Given the company’s resources NovaVision has initially focused on direct-to-patient, with a website lead-driven inbound and outbound marketing strategy targeted at prospective patients and relatives. Website metrics are positive, although below management’s expectations, showing good growth in traffic and rankings, and have been effective in generating leads. Our analysis of the campaign metrics in the US (including paid search) during 2016 highlighted some key improvements that are being implemented and which we believe could have a material impact on our lead generation.
Following the pilot launch of our NovaVision Center Model, comprising the Vision Diagnostics program and the NeuroEyeCoach training program, we have substantially broadened the delivery and licensing model in response to feedback from clinics. The new Center Model has a complete suite for the professional market, including options for software download, CD Rom, Cloud based and Hardware delivery with flexible and cost-effective pricing options, and is now being offered in both the US and Europe.
Manufacturing
Vycor Medical uses a sub-contract manufacturer to manufacture, package, label and sterilize its VBAS products. The Company has migrated all its VBAS manufacturing to Life Science Outsourcing, Inc. in Brea, California that is FDA-registered and meets ISO standards and certifications.
| 17 |
Intellectual Property
Patents
Vycor Medical maintains a portfolio of patent protection on its methods and apparatus for its Brain and Spine products and technology in the form of issued patents and applications, both domestically and internationally, with a total of 18 granted/allowed and 13 pending patents.
NovaVision maintains a portfolio of patent protection on its methods and apparatus in the form of issued patents and applications, both domestically and internationally, with a total of 41 granted and 2 pending patents (including Sight Science).
Trademarks
VYCOR MEDICAL is a registered trademark and VIEWSITE is a common law trademark.
NovaVision maintains a portfolio of registered trademarks for NOVAVISION, NOVAVISION VRT, VRT VISION RESTORATION THERAPY and NEUROEYECOACH, amongst others, along with relevant logos, both in the US and internationally.
Employees
We currently have 12 employees.
Comparison of the Three Months Ended March 31, 2017 to the Three Months Ended March 31, 2016
Revenue and Gross Margin:
| Three months ended | ||||||||||||
| March 31, | ||||||||||||
| 2017 | 2016 | % Change | ||||||||||
| Revenue: | ||||||||||||
| Vycor Medical | $ | 369,887 | $ | 348,920 | 6 | % | ||||||
| NovaVision | $ | 58,513 | $ | 51,165 | 14 | % | ||||||
| $ | 428,400 | $ | 400,085 | 7 | % | |||||||
| Gross Profit | ||||||||||||
| Vycor Medical | $ | 328,596 | $ | 286,607 | 15 | % | ||||||
| NovaVision | $ | 51,827 | $ | 46,240 | 12 | % | ||||||
| $ | 380,423 | $ | 332,847 | 14 | % | |||||||
Vycor Medical recorded revenue of $369,887 from the sale of its products for the three months ended March 31, 2017, an increase of $20,967, or 6%, over the same period in 2016. Sales grew by 22% in the US in 2017 compared to 2016, offset by reduced sales internationally. International sales tend to be irregular as international distributors follow a pattern of place large stocking orders. Gross margin of 89% was recorded for the three months ended March 31, 2017 compared to 82% for the same period in 2016.
NovaVision recorded revenues of $58,513 for the three months ended March 31, 2017, an increase of 14% over the same period in 2016, and gross margin of 89%, compared to 90% for the same period in 2016. New patient starts were up 54% compared to the same period in 2016.
Research and Development Expense:
Research and development (“R&D”) expenses were $0 for the three months ended March 31, 2017 and 2016.
General and Administrative Expenses:
General and administrative expenses decreased by $173,569 to $610,773 for the three months ended March 31, 2017 from $784,342 for the same period in 2016. Included within General and Administrative Expenses are non-cash charges for share based compensation as the result of amortizing employee and non-employee shares, warrants and options which have been issued by the Company over various periods. The charge for the three months ended March 31, 2017 was $143,547, a decrease of $111,216 over $254,763 in 2016. Also included within General and Administrative Expenses are Sales Commissions, which increased by $18,496 to $70,930. The remaining General and Administrative expenses decreased by $80,849 from $477,145 to $396,296.
| 18 |
An analysis of the change in cash and non-cash G&A is shown in the table below:
| Cash G&A | Non-Cash G&A | |||||||
| Payroll | (40,953 | ) | (3,287 | ) | ||||
| Investor relations and road show costs | (36,015 | ) | - | |||||
| Board, financial and scientific advisory | (3,695 | ) | (107,929 | ) | ||||
| Sales, marketing and travel | (6,642 | ) | - | |||||
| Other (travel/regulatory/premises) | 3,642 | - | ||||||
| Legal, professional and other consulting | 2,814 | - | ||||||
| Commissions | 18,496 | - | ||||||
| Total change | (62,353 | ) | (111,216 | ) | ||||
Interest Expense:
Interest comprises expense on the Company’s debt and insurance policy financing. Related Party Interest expense for the three months ended March 31, 2017 was $678 compared to $0 for 2016. Other Interest expense for 2016 increased by $63 to $12,043 from $11,980 for 2016.
Liquidity and Capital Resources
Liquidity
The following table shows cash flow and liquidity data for the periods ended March 31, 2017 and December 31, 2016:
| March 31, 2017 | December 31, 2016 | $ Change | ||||||||||
| Cash | $ | 561,549 | $ | 56,859 | $ | 504,690 | ||||||
| Accounts receivable, inventory and other current assets | $ | 539,631 | $ | 480,230 | $ | 59,401 | ||||||
| Total current liabilities | $ | 1,329,541 | $ | 1,511,688 | $ | (182,147 | ) | |||||
| Working capital | $ | (789,910 | ) | $ | (1,031,458 | ) | $ | 241,548 | ||||
| Cash provided by (used in) financing activities | $ | 818,822 | $ | (25,815 | ) | $ | 844,637 | |||||
Operating Activities. Cash used in operating activities comprises net loss adjusted for non-cash items and the effect of changes in working capital and other activities. The net repayment of normal insurance financing should also be taken into account when considering cash used in operating activities.
The following table shows the principle components of cash used in operating activities during the three months ended March 31, 2017 and 2016, with a commentary of changes during the periods and known or anticipated future changes:
| 19 |
| March 31, 2017 | March 31, 2016 | $ Change | ||||||||||
| Net loss | $ | (312,791 | ) | $ | (527,564 | ) | $ | 214,773 | ||||
| Adjustments to reconcile net loss to cash used in operating activities: | ||||||||||||
| Amortization and depreciation of assets | $ | 73,051 | $ | 65,579 | $ | 7,472 | ||||||
| Share based compensation | $ | 61,047 | $ | 254,762 | $ | (193,715 | ) | |||||
| Accrued share based compensation | $ | 82,500 | - | $ | 82,500 | |||||||
| Loss on foreign exchange | - | $ | 806 | $ | (806 | ) | ||||||
| Other | $ | 2,543 | $ | 2,544 | $ | (1 | ) | |||||
| $ | 219,141 | $ | 323,691 | $ | (104,550 | ) | ||||||
| Net loss adjusted for non-cash items | $ | (93,650 | ) | $ | (203,873 | ) | $ | 110,223 | ||||
| Changes in working capital | ||||||||||||
| Accounts receivable, accounts payable and accrued liabilities | $ | (203,677 | ) | $ | (57,863 | ) | $ | (145,814 | ) | |||
| Inventory | $ | 14,982 | $ | 12,588 | $ | 2,394 | ||||||
| Prepaid expenses and net insurance financing repayments | $ | 3,645 | $ | 11,287 | $ | (7,642 | ) | |||||
| Accrued interest (not paid in cash) | $ | 12,515 | $ | 11,967 | $ | 548 | ||||||
| $ | (172,536 | ) | $ | (22,021 | ) | $ | (150,515 | ) | ||||
| Cash used in operating activities, adjusted for net insurance repayments | $ | (266,186 | ) | $ | (225,894 | ) | $ | (40,292 | ) | |||
The adjustments to reconcile net loss to cash of $219,141 in the period have no impact on Liquidity. The reduction in net loss (as adjusted for non-cash items) to $93,650 was primarily a result of higher levels of gross profit and lower levels of operating expenses. The net change in accounts receivable, accounts payable and accrued liabilities are primarily are result of: the payment during the first quarter of $69,314 of accounts payable deferred at the end of December 2016; and an increase in accounts receivable of $98,944 due in particular to a large customer order placed prior to the quarter end. In addition, the Company typically renews a large number of annual expense contracts such as insurances and licenses during the first quarter, which has an impact on cash usage. During the period the Company purchased VBAS inventory for $10,306. Vycor is in the process of modifying the VBAS product suite to make it easier to integrate with IGS and as a result will be purchasing new inventory throughout 2017.
Investing Activities. Cash used in investing activities for the three months ended March 31, 2017 was $71,331, which reflected expenditure on modifying the VBAS product suite to make it easier to integrate with IGS, as well as the expenditure to make NovaVision Sight Science’s Neuro-Eye Therapy Internet-deliverable. The VBAS expenditure will continue over the next two quarters, although at a lower level.
Financing Activities. On January 11, and February 23, 2017 the Company completed the sale of $1,274,717 in shares of Common Stock and Warrants to accredited investors (the “Private Placement”). Included in these gross proceeds is the conversion of $248,000 of debt on the balance sheet at December 31, 2016, so that proceeds net of debt conversion were $1,026,717. The Private Placement raised net cash proceeds, after debt conversion and expenses, of $943,207. $101,000 of these proceeds and $7,050 of these expenses were reflected in the in the balance sheet at December 31, 2016 and so the net increase in liquidity during the period from the Private Placement was $849,259.
| 20 |
During the year ended December 31, 2016 Vycor’s largest shareholder, Fountainhead, had provided $248,000 of funding in the form of notes payable, which was converted into Common Stock as part of the Private Placement Initial Closing. Fountainhead also advanced $101,000 during the year ended December 31, 2016 in respect of the Private Placement. This amount was held in escrow at December 31, 2016 and represented part of the Private Placement Initial Closing.
Liquidity and Plan of Operations
The balance of cash at March 31, 2017 is $561,549. Management has evaluated the effects of the Private Placement described above on the Company’s financial condition, as well as the continued revenue growth coupled with improved margins and control of expenses. Management is of the opinion that any potential going concern uncertainty that previously existed has been remediated, and that its existing cash and cash equivalents following the Private Placement, together with the continued reduction in losses as a result of initiatives outlined below, will be sufficient to meet its anticipated cash requirements through at least June 30, 2018.
As described earlier in this ITEM 2 “Our Growth Strategy”, the Company is executing on a plan to achieve a growth in revenues for both the Vycor Medical and NovaVision divisions, and thereby further reduce its cash operating usage. For Vycor Medical this includes in particular: increasing penetration in the US market through targeted marketing; increased international market growth; and new product development centered around the modification of its VBAS product range to make it easier to integrate with IGS systems. For NovaVision, after a prolonged and now complete period of re-development, the Company is focusing its resources on direct-to-patient marketing through a website lead-driven inbound and outbound marketing strategy. In addition, the Company is now starting to market its NovaVision Center Model to medical professionals, with a broad and flexible range of delivery and licensing options.
Critical Accounting Policies and Estimates
Uses of estimates in the preparation of financial statements
The preparation of consolidated financial statements in conformity with generally accepted accounting principles requires management to make estimates and assumptions that affect the amounts reported in the consolidated financial statements and accompanying notes. Actual results could differ from those estimated. To the extent management’s estimates prove to be incorrect, financial results for future periods may be adversely affected. Significant estimates and assumptions contained in the accompanying consolidated financial statements include management’s estimate of the allowance for uncollectible accounts receivable, amortization of intangible assets, and the fair values of options and warrant included in the determination of debt discounts and share based compensation..
Research and Development
The Company expenses all research and development costs as incurred.
Cash and cash equivalents
The Company maintains cash balances at various financial institutions. Accounts at each institution are insured by the Federal Deposit Insurance Corporation up to $250,000. Cash balances may at times exceed the FDIC insured limits. Cash also includes a US investment account in a money market backed by government securities up to 105% of the account balance. The Company considers all highly liquid investments with a maturity of three months or less when purchased to be cash equivalents. Included within cash are deposits paid by patients, held by the Company until the patient returns the VRT device or chinrest at the end of therapy. At March 31, 2017 and December 31, 2016 patient deposits amounted to $35,902 and $33,351, respectively, and are included in Accrued Liabilities
Fixed assets
The Company records fixed assets at cost and calculates depreciation using the straight-line method over the estimated useful life of the assets, which is estimated to be between three and seven years. Maintenance, repairs and minor renewals are charged to expense when incurred. Replacements and major renewals are capitalized.
Income taxes
We use the asset and liability method of accounting for income taxes in accordance with ASC Topic 740, “Income Taxes.” Under this method, income tax expense is recognized for the amount of: (i) taxes payable or refundable for the current year and (ii) deferred tax consequences of temporary differences resulting from matters that have been recognized in an entity’s financial statements or tax returns. Deferred tax assets and liabilities are measured using enacted tax rates expected to apply to taxable income in the years in which those temporary differences are expected to be recovered or settled. The effect on deferred tax assets and liabilities of a change in tax rates is recognized in the results of operations in the period that includes the enactment date. A valuation allowance is provided to reduce the deferred tax assets reported if based on the weight of the available positive and negative evidence, it is more likely than not some portion or all of the deferred tax assets will not be realized.
| 21 |
ASC Topic 740.10.30 clarifies the accounting for uncertainty in income taxes recognized in an enterprise’s financial statements and prescribes a recognition threshold and measurement attribute for the financial statement recognition and measurement of a tax position taken or expected to be taken in a tax return. ASC Topic 740.10.40 provides guidance on derecognition, classification, interest and penalties, accounting in interim periods, disclosure, and transition. We have no material uncertain tax positions for any of the reporting periods presented.
Patents and Other Intangible Assets
The Company capitalizes legal and related costs associated with the establishment and enhancement of patents for its products once patents have been applied for. Costs associated with the development of the patented item or processes are charged to research and development costs as incurred. The capitalized costs are amortized over the life of the patent. The Company reviews intangible assets on an annual in accordance with the authoritative guidance. Trademarks have an indefinite life and are reviewed annually by management for impairment in accordance with the authoritative guidance.
Software Development Costs
The authoritative accounting guidance requires software development costs to be capitalized upon completion of the preliminary project stage. Accordingly, direct internal and external costs associated with the development of the features and functionality of the Company’s software, incurred during the application development stage, are capitalized and amortized using the straight-line method over the estimated life of five years.
Revenue Recognition
Vycor Medical generates revenue from the sale of its surgical access system to hospitals and other medical professionals. Vycor Medical records revenue when a completed contract for the sale exists, the product is invoiced and shipped to the customer. Vycor Medical does not provide for product returns or warranty costs.
NovaVision generates revenues from various programs, therapy services and other sources such as license sales. Therapy services revenues represent fees from NovaVision’s vision restoration therapy software, eye movement training software, diagnostic software, clinic set up and training fees, and the professional and support services associated with the therapy. NovaVision provides vision restoration therapy directly to patients. The typical vision restoration therapy consists of six modules, performed on average over 6 months. A patient contract comprises set-up fees and monthly therapy fees. Set-up fees are recognized at the outset of the contract and therapy revenue is recognized ratably over the therapy period. Patient therapy is restricted to being completed by a patient within a specified time frame. NovaVision’s saccadic training software is generally completed within 2-4 weeks and revenue is therefore recognized fully at commencement.
Deferred revenue results from patients paying for the therapy in advance of receiving the therapy.
Accounts Receivable and Allowance for Doubtful Accounts Receivable
The Company’s accounts receivable are due from the hospitals and distributors in the case of Vycor Medical, and from patients directly for therapy or physicians for diagnostic products in the case of NovaVision. Accounts receivable are due once products have been delivered or at the time the therapy is initiated; however, some NovaVision therapy patients make monthly payments during the therapy program. The outstanding balances are stated net of an allowance for doubtful accounts. The Company determines its allowance by considering a number of factors, including the length of time accounts receivable are past due, and the customer’s ability to pay its obligations. The Company writes off accounts receivable when they become uncollectible.
Inventory
Inventories are stated at the weighted average cost method. Net realizable value is the estimated selling price, in the ordinary course of business, less estimated costs to complete and dispose of the product. If the Company identifies excess, obsolete or unsalable items, its inventories are written down to their realizable value in the period in which the impairment is first identified. The provision for inventory for the years ended March 31, 2017 and 2016 was $2,544, respectively. Shipping and handling costs incurred for inventory purchases and product shipments are recorded in cost of sales.
| 22 |
Foreign Currency
The Euro is the local currency of the country in which NovaVision GmbH conducts its operations and is considered the functional currency of this entity; the GB Pound is the local currency of the country in which Sight Science Limited conducts its operations and is considered the functional currency of this entity. All balance sheet amounts are translated to U.S. dollars using the U.S. exchange rate at the balance sheet date except for the equity section which is translated at historical rates. Operating statement amounts are translated using an average exchange rate for the period of operations. Foreign currency translation effects are accumulated as part of the accumulated other comprehensive income (loss) and included in shareholders’ (deficit) in the accompanying Consolidated Balance Sheet.
Educational marketing and advertising expenses
The Company may incur costs for the education of customers on the uses and benefits of its products. The Company will include education, marketing and advertising expense as a component of selling, general and administrative costs as such costs are incurred.
ITEM 3. QUANTITATIVE AND QUALITATIVE DISCLOSURES ABOUT MARKET RISK
Not applicable
ITEM 4. CONTROLS AND PROCEDURES
(a) Disclosure Controls and Procedures
We are required to maintain disclosure controls and procedures that are designed to ensure that information required to be disclosed in our reports filed under the Securities Exchange Act of 1934, as amended, is recorded, processed, summarized and reported within the time periods specified in the Securities and Exchange Commission’s rules and forms, and that such information is accumulated and communicated to our management, including our chief executive officer (also our principal executive officer) and our chief financial officer (also our principal financial and accounting officer) to allow for timely decisions regarding required disclosure.
The Company’s management, including our Chief Executive Officer (“CEO”) and our Chief Financial Officer (“CFO”), have evaluated the effectiveness of our “disclosure controls and procedures” (as defined in Rules 13a-15(e) and 15d-15(e) under the Securities Exchange Act of 1934, or the Exchange Act), as of the end of the period covered by this report. Based on such evaluation, our CEO and our CFO have concluded that, as of the end of such period, the Company’s disclosure controls and procedures were effective as of that date to provide reasonable assurance that the information required to be disclosed by the Company in the reports it files or submits under the Exchange Act is recorded, processed, summarized and reported within the time periods specified in the rules and forms of the SEC and that information required to be disclosed by the Company in the reports its files or submits under the Exchange Act is accumulated and communicated to the Company’s management, including its CEO and its CFO, as appropriate, to allow timely decisions regarding required disclosure. There have not been any changes in the Company’s internal control over financial reporting (as such term is defined in Rules 13a-15(f) and 15d-15(f) under the Exchange Act) during the fiscal quarter to which this report relates that have materially affected, or are reasonably likely to materially affect, the Company’s internal control over financial reporting.
(b) Changes in Internal Controls
There have not been any changes in the Company’s internal control over financial reporting (as such term is defined in Rules 13a-15(f) under the Exchange Act) during the fiscal period to which this report relates that have materially affected, or are reasonably likely to materially affect, the Company’s internal control over financial reporting.
The Company’s management, including the Company’s CEO and CFO, does not expect that the Company’s internal control over financial reporting will prevent all errors and all fraud. Because of its inherent limitations, internal control over financial reporting may not prevent or detect misstatements. Also, projections of any evaluation of effectiveness to future periods are subject to the risk that controls may become inadequate because of changes in conditions, or that the degree or compliance with the policies or procedures may deteriorate.
| 23 |
We are subject from time to time to litigation, claims and suits arising in the ordinary course of business. As of May 12, 2017, we were not a party to any material litigation, claim or suit whose outcome could have a material effect on our financial statements.
As a “smaller reporting company” as defined by Item 10 of Regulation S-K, the Company is not required to provide information required by this Item.
ITEM 2. UNREGISTERED SALES OF EQUITY SECURITIES AND USE OF PROCEEDS
| Issuance Type | Security | Shares | ||||||
| FHC Management Fees | Common | 1,714,286 | ||||||
| Advisory Board Fees | Common | 49,877 | ||||||
| Private Placement Offering FHC | Common | 2,275,901 | ||||||
| Private Placement Offering Others | Common | 3,794,178 | ||||||
ITEM 3. DEFAULTS UPON SENIOR SECURITIES
None.
ITEM 4. MINE SAFETY DISCLOSURES
Not applicable.
None
| 31.1 | Certification of the Principal Executive Officer pursuant to Section 302 of the Sarbanes-Oxley Act of 2002. |
| 31.2 | Certification of the Chief Financial Officer pursuant to Section 302 of the Sarbanes-Oxley Act of 2002. |
| 32.1 | Certification of Principal Executive Officer pursuant to 18 U.S.C. Section 1350, as adopted pursuant to Section 906 of the Sarbanes-Oxley Act of 2002. |
| 32.2 | Certification of Chief Financial Officer pursuant to 18 U.S.C. Section 1350, as adopted pursuant to Section 906 of the Sarbanes-Oxley Act of 2002. |
| 24 |
In accordance with Section 13 or 15(d) of the Exchange Act, the registrant caused this report to be signed on its behalf by the undersigned, thereunto duly authorized, on May 11, 2017.
| Vycor Medical, Inc. | ||
| (Registrant) | ||
| By: | /s/ Peter C. Zachariou | |
| Peter C. Zachariou | ||
| Chief Executive Officer and Director (Principal Executive Officer) | ||
| Date | May 11, 2017 | |
| By: | /s/ Adrian Liddell | |
| Adrian Liddell | ||
| Chairman of the Board and Director | ||
| (Principal Financial and Accounting Officer) | ||
| Date | May 11, 2017 | |
| 25 |