Attached files
| file | filename |
|---|---|
| EX-99.1 - EXHIBIT 99.1 - Prestige Consumer Healthcare Inc. | exhibit991fy17-q4earningsr.htm |
| 8-K - 8-K - Prestige Consumer Healthcare Inc. | a8-kpressreleaseq42017.htm |

Exhibit 99.2

This presentation contains certain “forward-looking” statements within the meaning of the Private Securities Litigation Reform Act of 1995, such
as statements regarding the Company’s expected financial performance, including revenue growth, organic growth, adjusted EPS, adjusted free
cash flow, and adjusted EBITDA; the Company’s expected leverage; the Company’s ability to repeat its M&A strategy; the expected growth and
market position of the Company’s core brands; the Company’s brand-building and product development initiatives; and the Company’s ability to
create long-term value. Words such as “trend,” “continue,” “will,” “expect,” “project,” “anticipate,” “likely,” “estimate,” “may,” “should,” “could,”
“would,” and similar expressions identify forward-looking statements. Such forward-looking statements represent the Company’s expectations
and beliefs and involve a number of known and unknown risks, uncertainties and other factors that may cause actual results to differ materially
from those expressed or implied by such forward-looking statements. These factors include, among others, general economic and business
conditions, competitive pressures, the impact of the Company’s product development and brand-building initiatives, difficulties successfully
integrating the Fleet brands, manufacturing facility and R&D resources, supplier issues, and other risks set forth in Part I, Item 1A. Risk Factors in
the Company’s Annual Report on Form 10-K for the year ended March 31, 2016 and in Part II, Item 1A. Risk Factors in the Company’s Quarterly
Report on Form 10-Q for the quarter ended December 31, 2016. You are cautioned not to place undue reliance on these forward-looking
statements, which speak only as of the date this presentation. Except to the extent required by applicable law, the Company undertakes no
obligation to update any forward-looking statement contained in this presentation, whether as a result of new information, future events, or
otherwise.
All adjusted GAAP numbers presented are footnoted and reconciled to their closest GAAP measurement in the attached reconciliation schedule
or in our earnings release in the “About Non-GAAP Financial Measures” section.


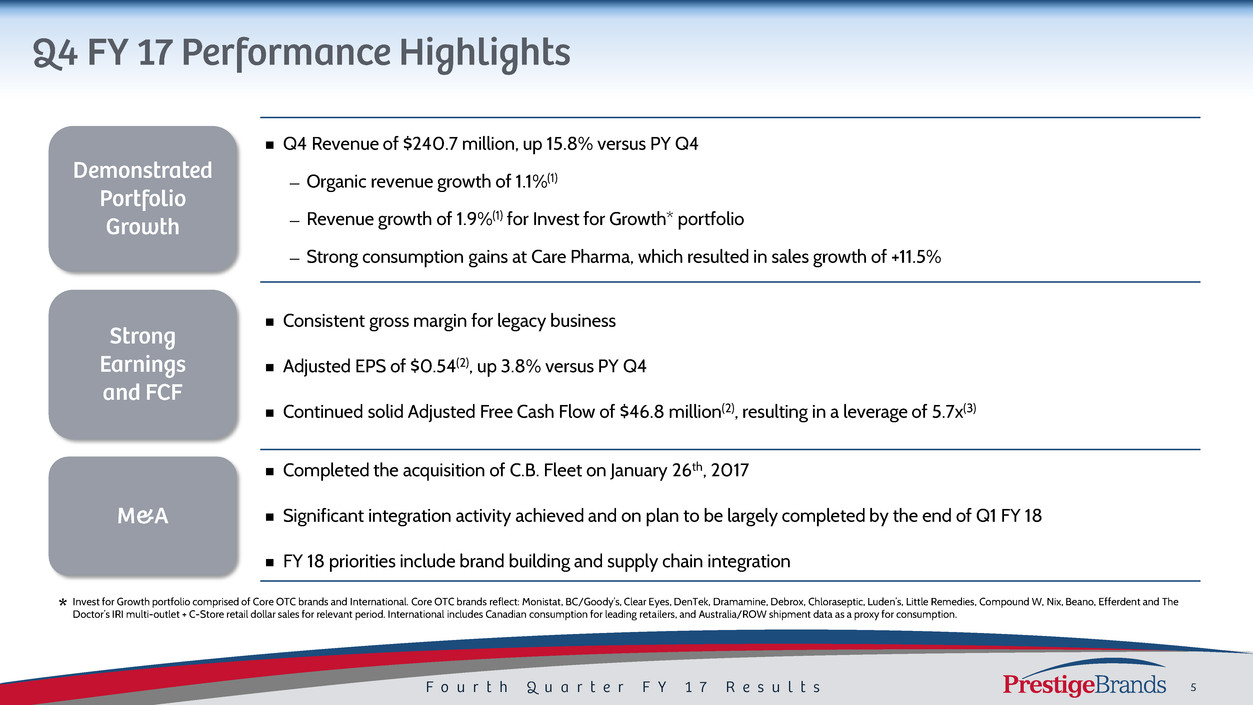
Q4 Revenue of $240.7 million, up 15.8% versus PY Q4
— Organic revenue growth of 1.1%(1)
— Revenue growth of 1.9%(1) for Invest for Growth* portfolio
— Strong consumption gains at Care Pharma, which resulted in sales growth of +11.5%
Consistent gross margin for legacy business
Adjusted EPS of $0.54(2), up 3.8% versus PY Q4
Continued solid Adjusted Free Cash Flow of $46.8 million(2), resulting in a leverage of 5.7x(3)
Completed the acquisition of C.B. Fleet on January 26th, 2017
Significant integration activity achieved and on plan to be largely completed by the end of Q1 FY 18
FY 18 priorities include brand building and supply chain integration
Invest for Growth portfolio comprised of Core OTC brands and International. Core OTC brands reflect: Monistat, BC/Goody’s, Clear Eyes, DenTek, Dramamine, Debrox, Chloraseptic, Luden’s, Little Remedies, Compound W, Nix, Beano, Efferdent and The
Doctor’s IRI multi-outlet + C-Store retail dollar sales for relevant period. International includes Canadian consumption for leading retailers, and Australia/ROW shipment data as a proxy for consumption.*


Manage for CashInvest for Growth

July 2016 December 2016 December 2016 December 2016
February 2016 January 2017
$225MM $825MM

2.5%
1.8%
LTM Growth
2.3%
1.2%
LTM Growth
2.4%
1.7%
LTM Growth
Prestige Brands Prestige Categories
Source: IRI multi-outlet + C-Store retail dollar sales for the period ending 03/29/2017

Consumer research and shopper insights identify unmet needs
Match new product opportunities to each brand’s unique positioning
Goal to launch 3 to 5 meaningful new product innovations annually
Recent new products introduced across our portfolio
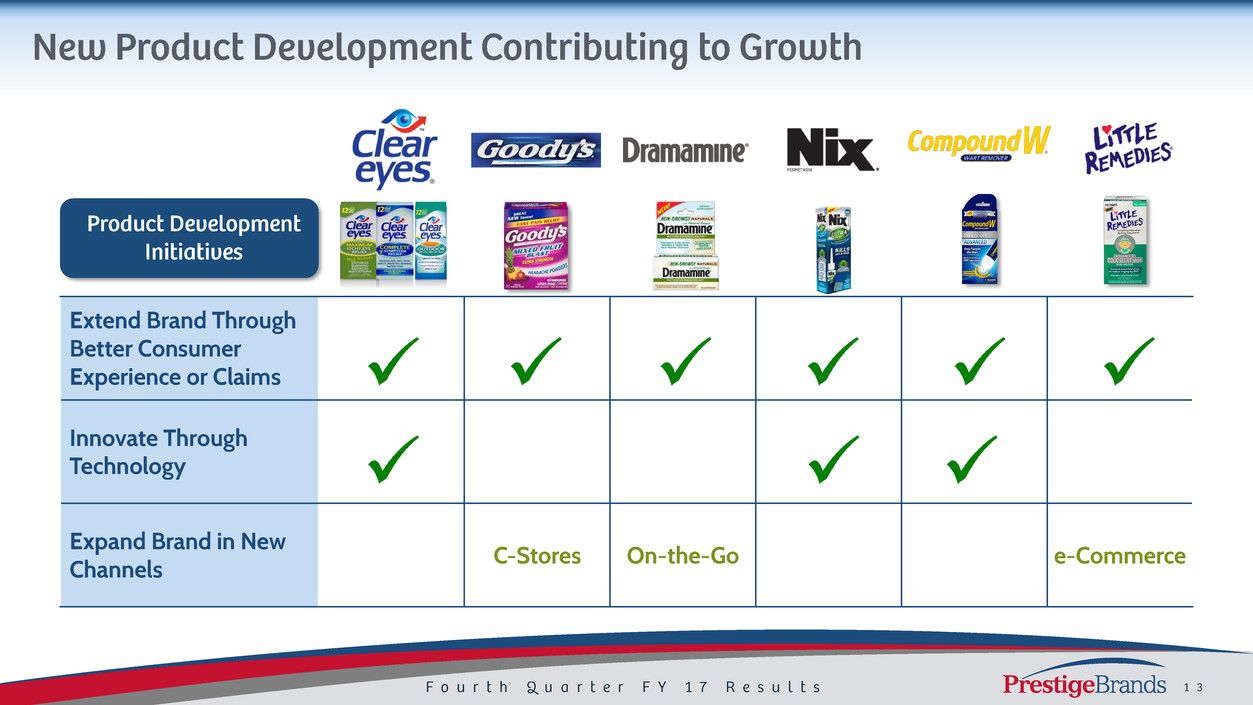
Extend Brand Through
Better Consumer
Experience or Claims
Innovate Through
Technology
Expand Brand in New
Channels C-Stores On-the-Go e-Commerce
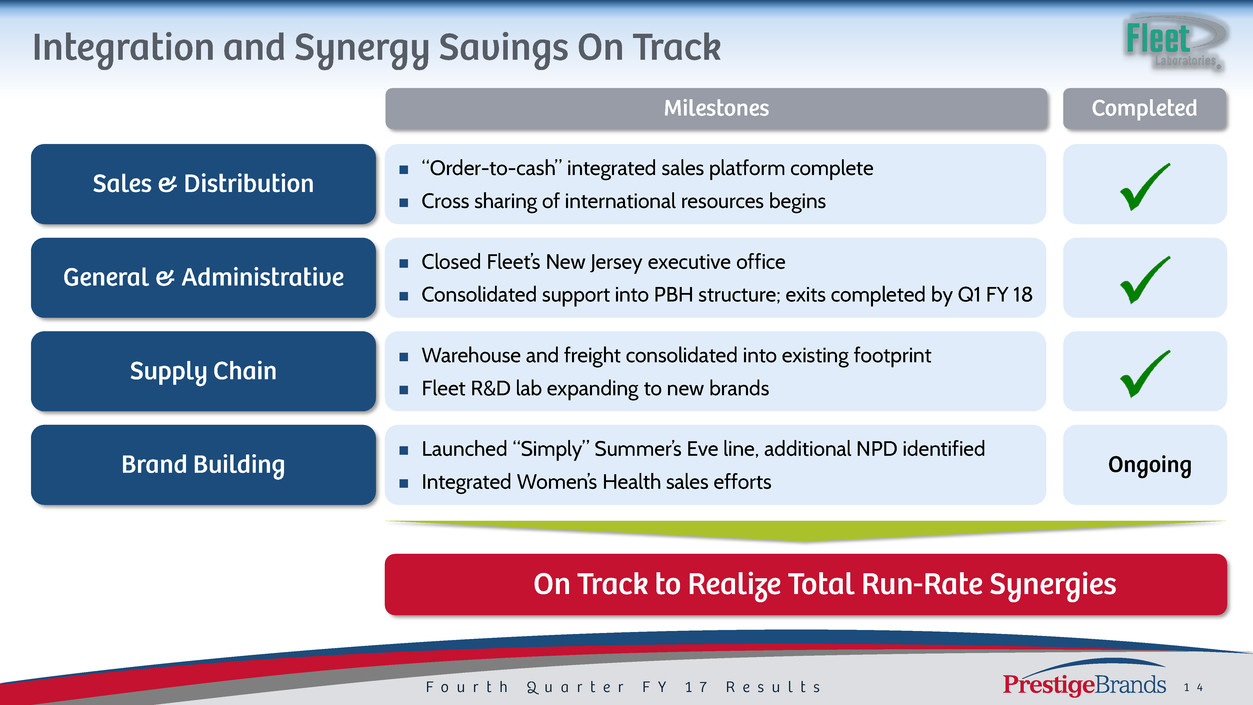
“Order-to-cash” integrated sales platform complete
Cross sharing of international resources begins
Launched “Simply” Summer’s Eve line, additional NPD identified
Integrated Women’s Health sales efforts
Warehouse and freight consolidated into existing footprint
Fleet R&D lab expanding to new brands
Closed Fleet’s New Jersey executive office
Consolidated support into PBH structure; exits completed by Q1 FY 18

$86 $127
$164 $196
FY 11 FY 13 FY 15 FY 17
$101
$218 $252
$305
FY 11 FY 13 FY 15 FY 17
$334
$620 $715
$882
FY 11 FY 13 FY 15 FY 17
17.6% CAGR 20.2% CAGR
14.7% CAGR
$0.79
$1.50 $1.86
$2.37
FY 11 FY 13 FY 15 FY 17
20.1% CAGR
Dollar values in millions, except Adjusted EPS.

~3.2x ~3.5x
~5.0x ~4.3x ~4.3x ~5.2x ~5.0x
~5.7x ~5.0x
FY 10 FY 11 FY 12 FY 13 FY 14 FY 15 FY 16 FY 17 FY 18
$59
$86 $67
$127 $130
$164 $183
$196 $205
FY 10 FY 11 FY 12 FY 13 FY 14 FY 15 FY 16 FY 17 FY 18
Dollar values in millions.
* Peak leverage of 5.75x at close of the Insight Acquisition in September 2014
*
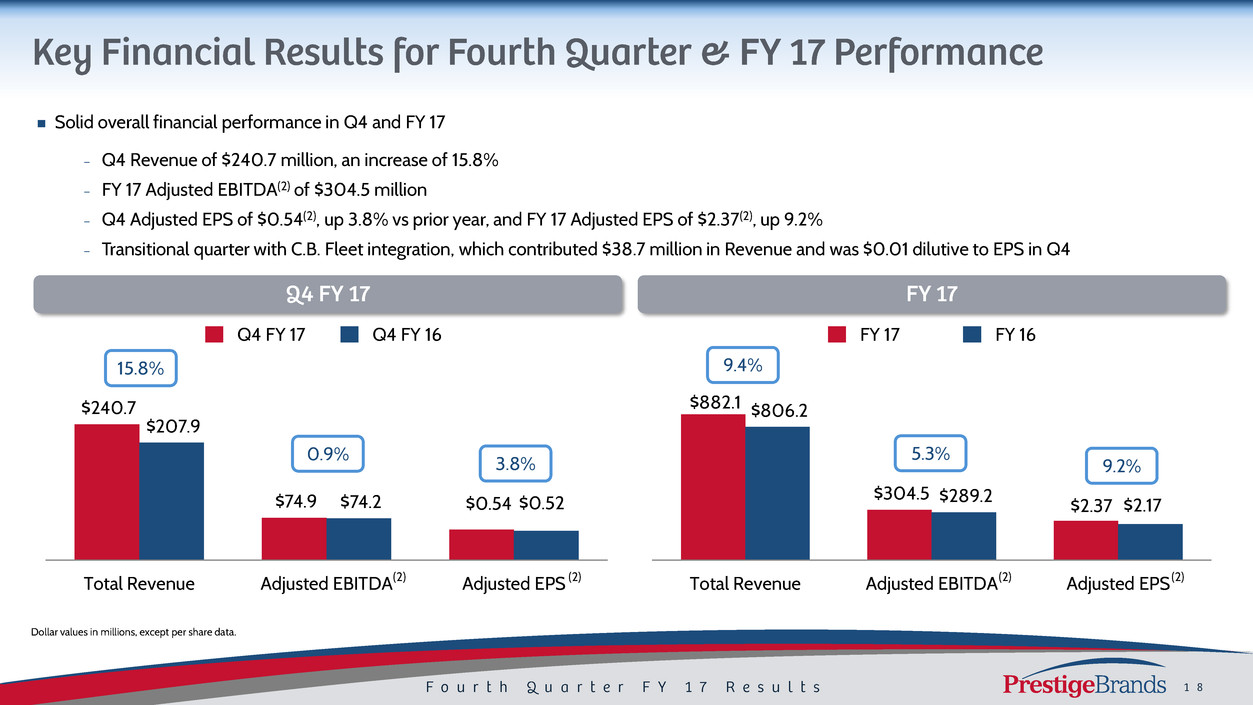
Solid overall financial performance in Q4 and FY 17
− Q4 Revenue of $240.7 million, an increase of 15.8%
− FY 17 Adjusted EBITDA(2) of $304.5 million
− Q4 Adjusted EPS of $0.54(2), up 3.8% vs prior year, and FY 17 Adjusted EPS of $2.37(2), up 9.2%
− Transitional quarter with C.B. Fleet integration, which contributed $38.7 million in Revenue and was $0.01 dilutive to EPS in Q4
$240.7
$74.9
$207.9
$74.2
Total Revenue Adjusted EBITDA Adjusted EPS
Q4 FY 17 Q4 FY 16
15.8%
0.9% 3.8%
$0.54 $0.52
(2) (2)
Dollar values in millions, except per share data.
$882.1
$304.5
$806.2
$289.2
Total Revenue Adjusted EBITDA Adjusted EPS
FY 17 FY 16
9.4%
5.3%
9.2%
$2.37 $2.17
(2) (2)
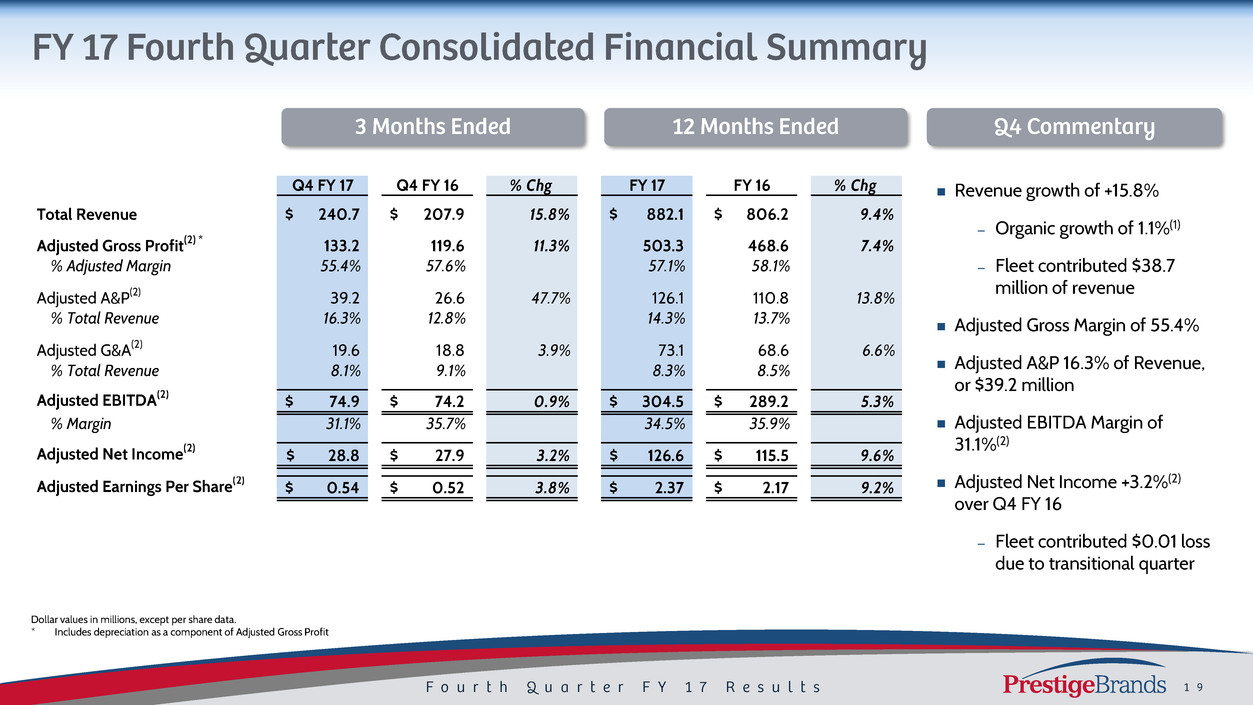
Revenue growth of +15.8%
– Organic growth of 1.1%(1)
– Fleet contributed $38.7
million of revenue
Adjusted Gross Margin of 55.4%
Adjusted A&P 16.3% of Revenue,
or $39.2 million
Adjusted EBITDA Margin of
31.1%(2)
Adjusted Net Income +3.2%(2)
over Q4 FY 16
– Fleet contributed $0.01 loss
due to transitional quarter
Dollar values in millions, except per share data.
* Includes depreciation as a component of Adjusted Gross Profit
Q4 FY 17 Q4 FY 16 % Chg FY 17 FY 16 % Chg
Total Revenue 240.7$ 207.9$ 15.8% 882.1$ 806.2$ 9.4%
Adjusted Gross Profit(2) * 133.2 119.6 11.3% 503.3 468.6 7.4%
% Adjusted Margin 55.4% 57.6% 57.1% 58.1%
Adjusted A&P(2) 39.2 26.6 47.7% 126.1 110.8 13.8%
% Total Revenue 16.3% 12.8% 14.3% 13.7%
Adjusted G&A(2) 19.6 18.8 3.9% 73.1 68.6 6.6%
% Total Revenue 8.1% 9.1% 8.3% 8.5%
Adjusted EBITDA(2) 74.9$ 74.2$ 0.9% 304.5$ 289.2$ 5.3%
% Margin 31.1% 35.7% 34.5% 35.9%
Adjusted Net Income(2) 28.8$ 27.9$ 3.2% 126.6$ 115.5$ 9.6%
Adjusted Earnings Per Share(2) 0.54$ 0.52$ 3.8% 2.37$ 2.17$ 9.2%
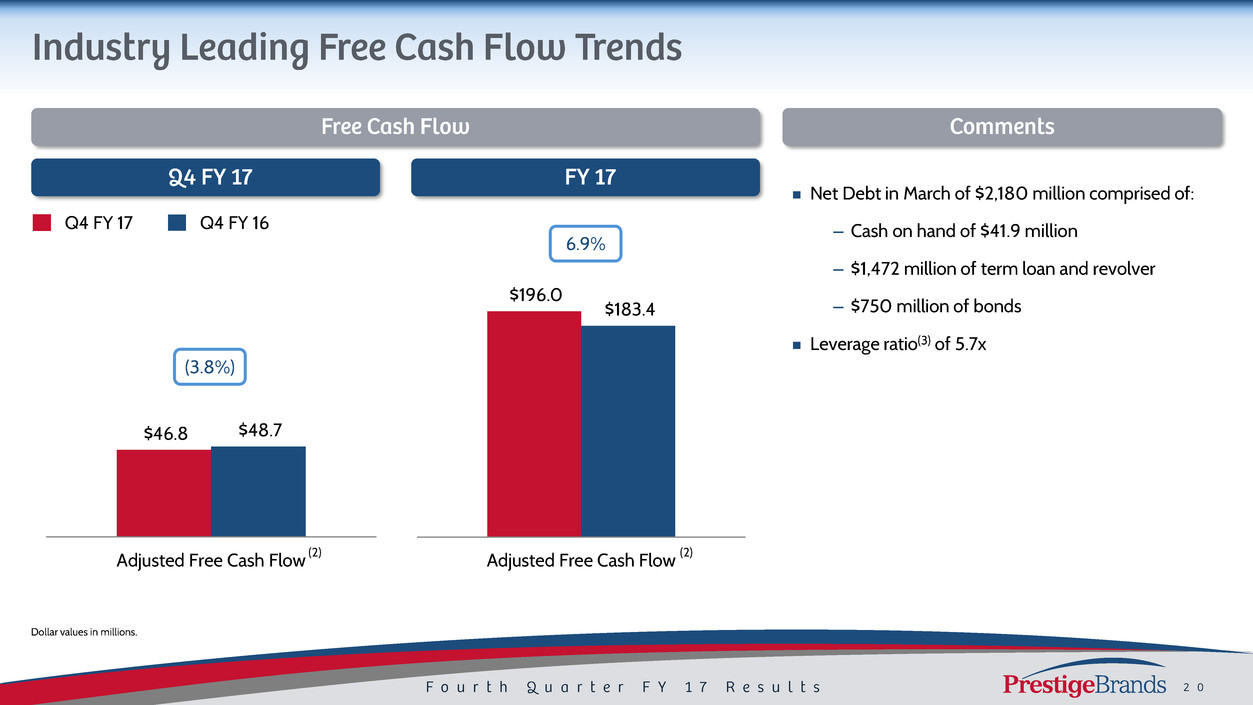
Net Debt in March of $2,180 million comprised of:
– Cash on hand of $41.9 million
– $1,472 million of term loan and revolver
– $750 million of bonds
Leverage ratio(3) of 5.7x
$46.8 $48.7
Adjusted Free Cash Flow
$196.0
$183.4
Adjusted Free Cash Flow
6.9%
(3.8%)
Q4 FY 17 Q4 FY 16
Dollar values in millions.
(2) (2)

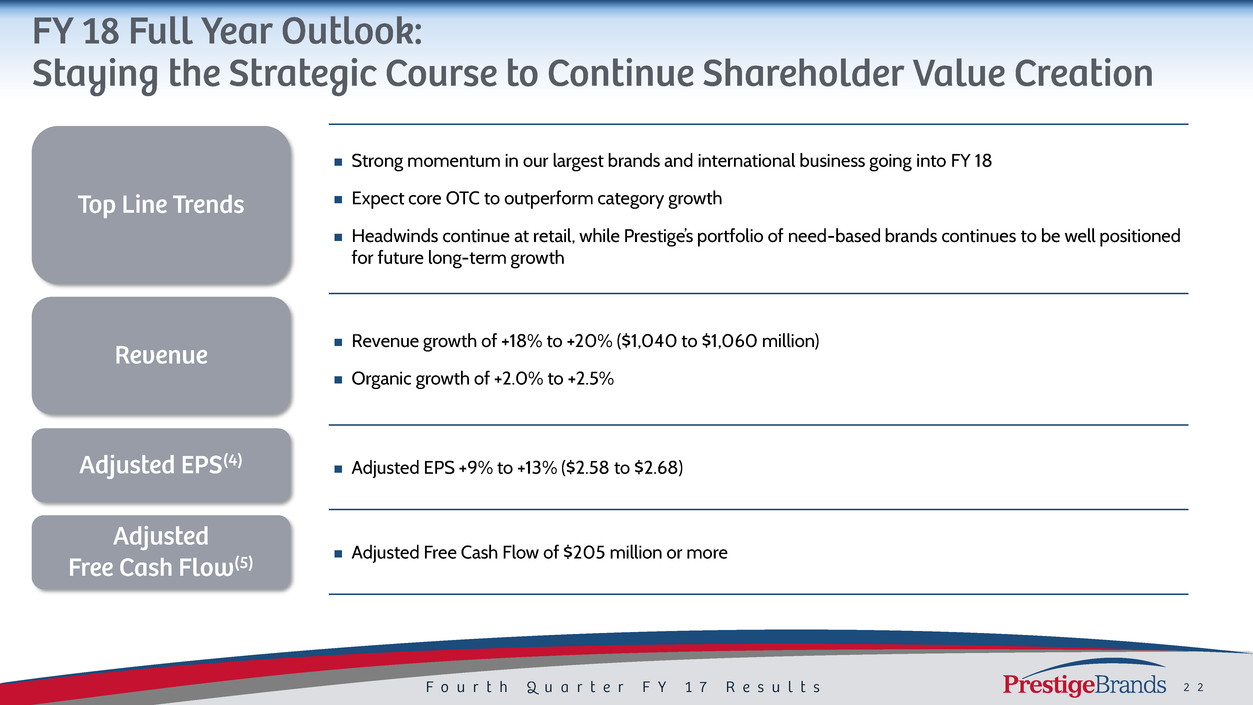
Strong momentum in our largest brands and international business going into FY 18
Expect core OTC to outperform category growth
Headwinds continue at retail, while Prestige’s portfolio of need-based brands continues to be well positioned
for future long-term growth
Revenue growth of +18% to +20% ($1,040 to $1,060 million)
Organic growth of +2.0% to +2.5%
Adjusted EPS +9% to +13% ($2.58 to $2.68)
Adjusted Free Cash Flow of $205 million or more

(1) Organic Revenue Growth is a Non-GAAP financial measure and is reconciled to its most closely related GAAP financial measure
in our earnings release in the “About Non-GAAP Financial Measures” section.
(2) Adjusted Gross Margin, Adjusted A&P, Adjusted G&A, Adjusted EBITDA, Adjusted EBITDA Margin, Adjusted Net Income, Adjusted
EPS, Adjusted Free Cash Flow are Non-GAAP financial measures and are reconciled to their most closely related GAAP financial
measures in the attached Reconciliation Schedules and / or in our earnings release in the “About Non-GAAP Financial Measures”
section.
(3) Leverage ratio reflects net debt / covenant defined EBITDA.
(4) Adjusted EPS for FY 18 is a projected Non-GAAP financial measure, is reconciled to projected GAAP EPS in our earnings release
in the “About Non-GAAP Financial Measures” section and is calculated based on projected GAAP EPS of $2.50 to $2.60 plus
$0.08 of costs associated with Fleet integration, resulting in $2.58 to $2.68.
(5) Adjusted Free Cash Flow for FY 18 is a projected Non-GAAP financial measure, is reconciled to projected GAAP Net Cash
Provided by Operating Activities in our earnings release in the “About Non-GAAP Financial Measures” section and is calculated
based on projected Net Cash Provided by Operating Activities of $210 million less projected capital expenditures of $10 million
plus payments associated with acquisitions of $8 million less tax effect of payments associated with acquisitions of $3 million
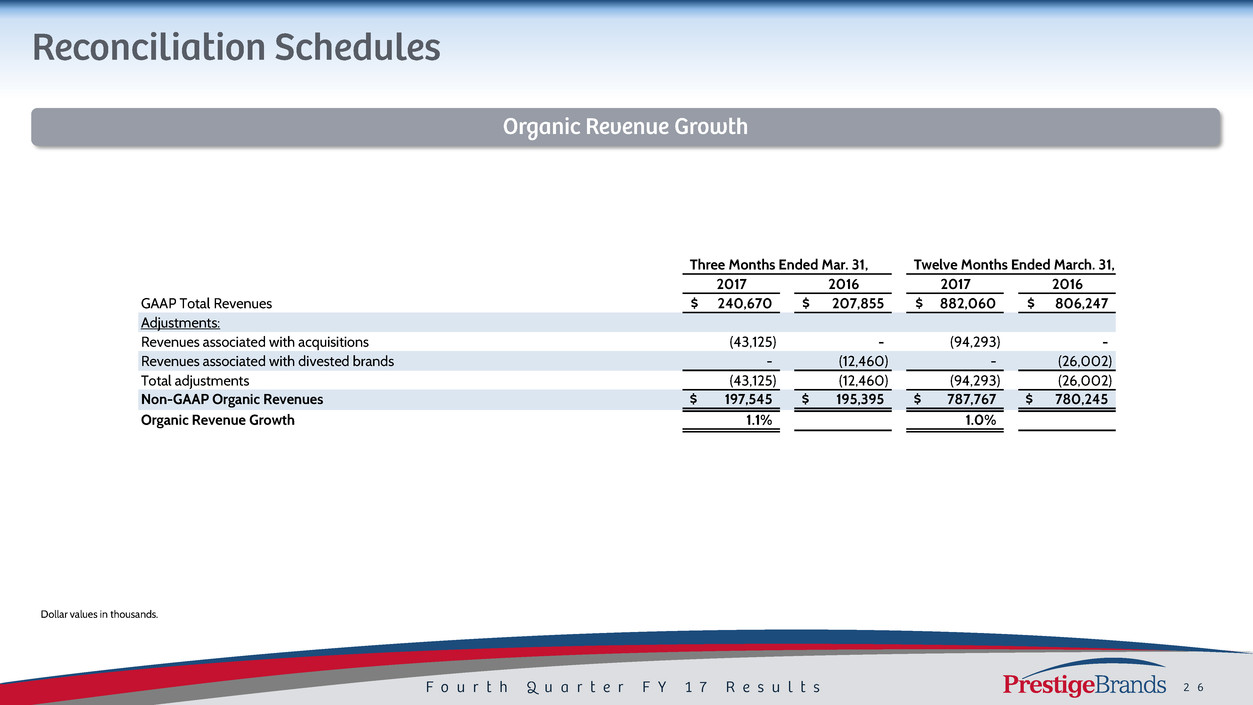
Dollar values in thousands.
Three Months Ended Mar. 31, Twelve Months Ended March. 31,
2017 2016 2017 2016
GAAP Total Revenues 240,670$ 207,855$ 882,060$ 806,247$
Adjustments:
Revenues associated with acquisitions (43,125) - (94,293) -
Revenues associated with divested brands - (12,460) - (26,002)
Total adjustments (43,125) (12,460) (94,293) (26,002)
Non-GAAP Organic Revenues 197,545$ 195,395$ 787,767$ 780,245$
Organic Revenue Growth 1.1% 1.0%
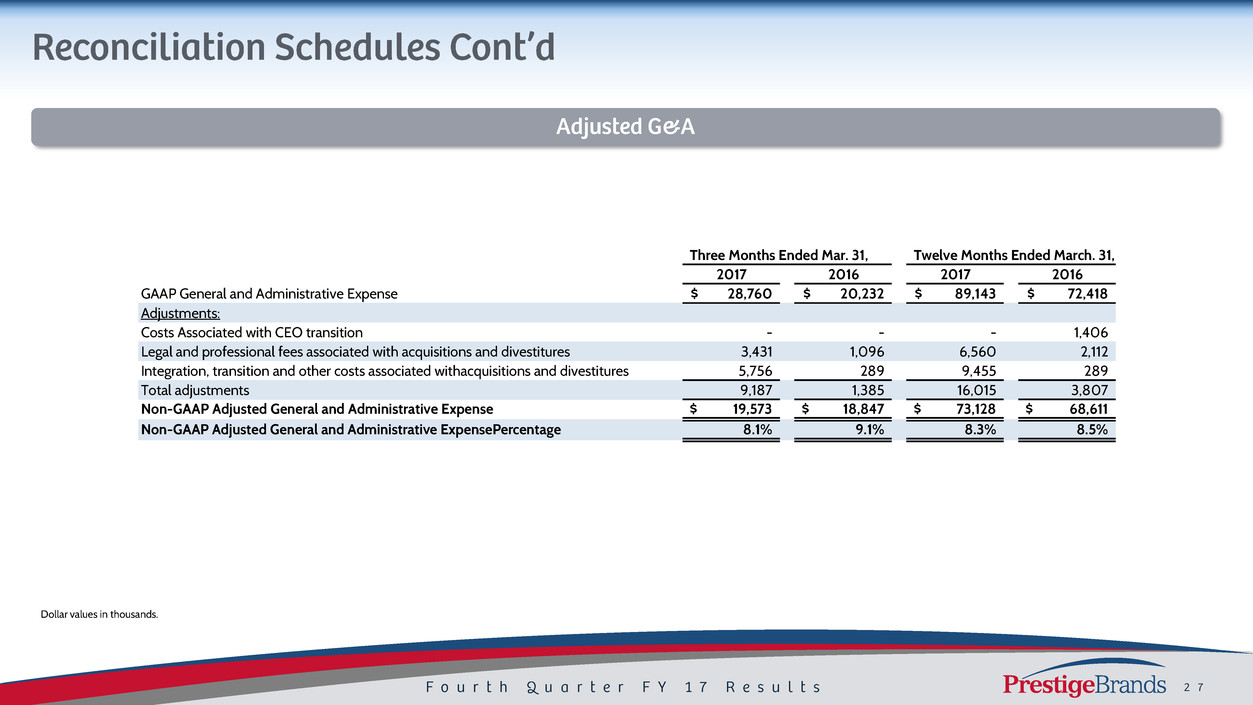
Dollar values in thousands.
Three Months Ended Mar. 31, Twelve Months Ended March. 31,
2017 2016 2017 2016
GAAP General and Administrative Expense 28,760$ 20,232$ 89,143$ 72,418$
Adjustments:
Costs Associated with CEO transition - - - 1,406
Legal and professional fees associated with acquisitions and divestitures 3,431 1,096 6,560 2,112
Integration, transition and other costs associated with acquisitions and divestitures 5,756 289 9,455 289
Total adjustments 9,187 1,385 16,015 3,807
Non-GAAP Adjusted General and Administrative Expense 19,573$ 18,847$ 73,128$ 68,611$
Non-GAAP Adjusted General and Administrative Expense Percentage 8.1% 9.1% 8.3% 8.5%
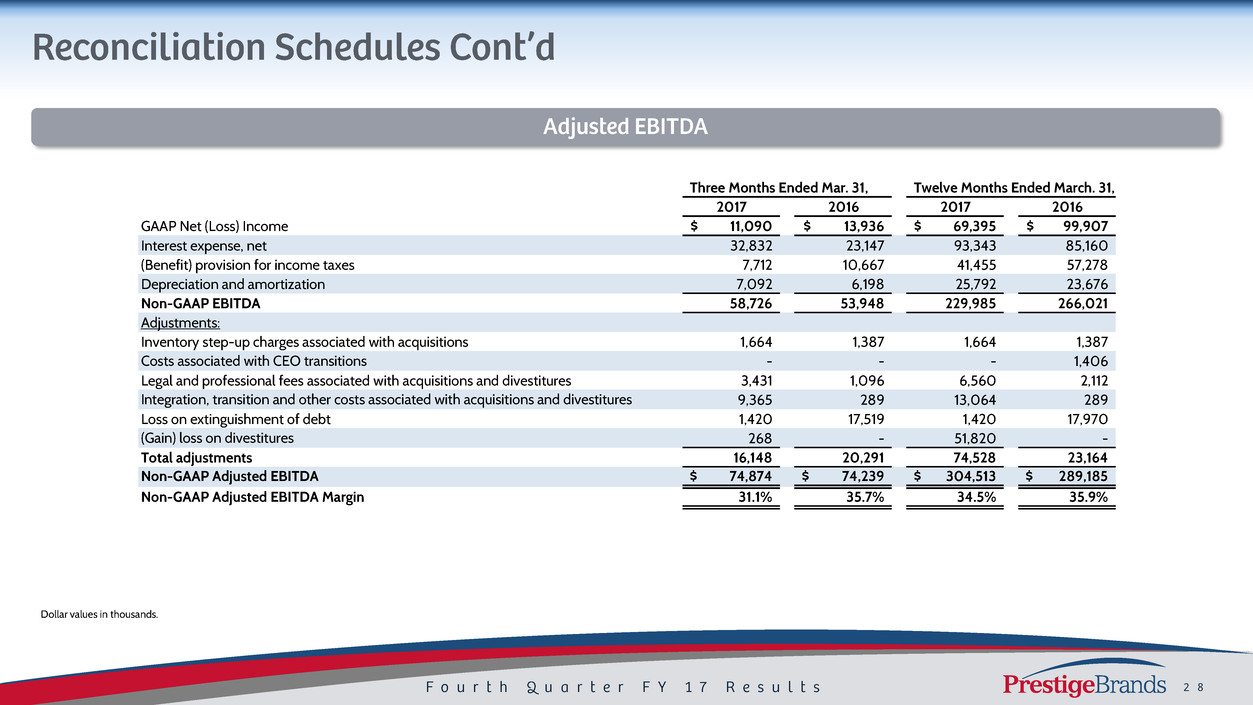
Dollar values in thousands.
Three Months Ended Mar. 31, Twelve Months Ended March. 31,
2017 2016 2017 2016
GAAP Net (Loss) Income 11,090$ 13,936$ 69,395$ 99,907$
Interest expense, net 32,832 23,147 93,343 85,160
(Benefit) provision for income taxes 7,712 10,667 41,455 57,278
Depreciation and amortization 7,092 6,198 25,792 23,676
Non-GAAP EBITDA 58,726 53,948 229,985 266,021
Adjustments:
Inventory step-up charges associated with acquisitions 1,664 1,387 1,664 1,387
Costs associated with CEO transitions - - - 1,406
Legal and professional fees associated with acquisitions and divestitures 3,431 1,096 6,560 2,112
Integration, transition and other costs associated with acquisitions and divestitures 9,365 289 13,064 289
Loss on extinguishment of debt 1,420 17,519 1,420 17,970
(Gain) loss on divestitures 268 - 51,820 -
Total adjustments 16,148 20,291 74,528 23,164
Non-GAAP Adjusted EBITDA 74,874$ 74,239$ 304,513$ 289,185$
Non-GAAP Adjusted EBITDA Margin 31.1% 35.7% 34.5% 35.9%

Dollar values in thousands.
2011 2012 2013 2014 2015 2016 2017
GAAP Net Income 29,220$ 37,212$ 65,505$ 72,615$ 78,260$ 99,907$ 69,395$
Income from Disc Ops (591) - - - - - -
Loss on sale of disc ops 550 - - - - - -
Interest Expense, net 27,317 41,320 84,407 68,582 81,234 85,160 93,343
Provision for income taxes 19,349 23,945 40,529 29,133 49,198 57,278 41,455
Depreciation and amortization 9,876 10,734 13,235 13,486 17,740 23,676 25,792
Non-GAAP EBITDA 85,721 113,211 203,676 183,816 226,432 266,021 229,985
Sales costs related to acquisitions - - 411 - - - -
Inventory step up 7,273 1,795 23 577 2,225 1,387 1,664
Inventory related acquisition costs - - 220 407 - - -
Add'l supplier costs - - 5,426 - - - -
Costs associated with CEO transition - - - - - 1,406
Legal and other professional fees associated with acquisitions 7,729 13,807 98 1,111 10,974 2,112 6,560
Integration, transition, and other Acq costs - 3,588 5,811 - 10,533 289 13,064
Stamp Duty - - - - 2,940 - -
Unsolicited porposal costs - 1,737 534 - - - -
Loss on extinguishment of debt 300 5,409 1,443 18,286 - 17,970 1,420
Gain on settlement - (5,063) - - - - -
Gain on sale of asset - - - - (1,133) - 51,820
Adjustments to EBITDA 15,302 21,273 13,966 20,381 25,539 23,164 74,528
Non-GAAP Adjusted EBITDA 101,023$ 134,484$ 217,642$ 204,197$ 251,971$ 289,185$ 304,513$

Dollar values in thousands.
Three Months Ended Mar. 31, Twelve Months Ended March. 31,
2017 2016 2017 2016
Net
Income EPS
Net
Income EPS
Net
Income EPS
Net
Income EPS
GAAP Net Income 11,090$ 0.21$ 13,936$ 0.26$ 69,395$ 1.30$ 99,907$ 1.88$
Adjustments:
Inventory step-up charges and other costs associate with acquisitions 1,664 0.03 1,387 0.03 1,664 0.03 1,387 0.03
Costs associated with CEO transition - - - - - - 1,406 0.02
Legal and professional fees associated with acquisitions and divestitures 3,431 0.06 1,096 0.02 6,560 0.12 2,112 0.04
Integration, transition and other costs associated with acquisitions and divestitures 9,365 0.18 289 0.01 13,064 0.24 289 0.01
Accelerated amortization of debt orgination costs 575 0.01 - - 1,706 0.03 - -
Additional interest expense from Term Loan B-4 debt refinancing 9,184 0.17 - - 9,184 0.17 - -
Loss on extinguishment of debt 1,420 0.03 17,519 0.33 1,420 0.03 17,970 0.34
(Gain) loss on divestitures 268 0.01 - - 51,820 0.97 - -
Tax impact of adjustments (9,438) (0.18) (6,294) (0.13) (28,024) (0.52) (7,608) (0.15)
Tax impacts related to tax reserve adjustments 1,278 0.02 - - (199) - - -
Total Adjustments 17,747 0.33 13,997 0.26 57,195 1.07 15,556 0.29
Non-GAAP Adjusted Net Income and Adjusted EPS 28,837$ 0.54$ 27,933$ 0.52$ 126,590$ 2.37$ 115,463$ 2.17$

Dollar values in thousands.
2011 2012 2013 2014 2015 2016 2017
Net
Income EPS
Net
Income EPS
Net
Income EPS
Net
Income EPS
Net
Income EPS
Net
Income EPS
Net
Income EPS
GAAP Net Income 29,220$ 0.58$ 37,212$ 0.73$ 65,505$ 1.27$ 72,615$ 1.39$ 78,260$ 1.49$ 99,907$ 1.88$ 69,395$ 1.30$
Adjustments
Income from discontinued ops. (591) (0.01) - - - - - - - - - - - -
Loss on sale of discontinued ops. 550 0.01 - - - - - - - - - - - -
Incremental interest expense to finance Acquisition 800 0.02 - - - - - - - - - - 9,184 0.17
Sales costs related to acquisitions - - - - 411 0.01 - - - - - - - -
Inventory step up 7,273 0.14 1,795 0.04 23 - 577 0.01 2,225 0.04 1,387 0.03 1,664 0.03
Inventory related acquisition costs - - - - 220 - 407 0.01 - - - - - -
Add'l supplier costs - - - - 5,426 0.11 - - - - - - - -
Costs associated with CEO transition - - - - - - - - - - 1,406 0.02 - -
Legal and other professional fees associated with acquisitions 7,729 0.15 13,807 0.27 98 - 1,111 0.02 10,974 0.21 2,112 0.04 6,560 0.12
Integration, Transition, and other Acq costs - - 3,588 0.07 5,811 0.11 - - 10,533 0.20 289 0.01 13,064 0.24
Stamp Duty - - - - - - - - 2,940 0.05 - - - -
Unsolicited porposal costs - - 1,737 0.03 534 0.01 - - - - - - - -
Loss on extinguishment of debt 300 0.01 5,409 0.11 1,443 0.03 18,286 0.35 - - 17,970 0.34 1,420 0.03
Gain on settlement - - (5,063) (0.10) - - - - - - - - - -
(Gain) loss on divestitures - - - - - - - - - - - - 51,820 0.97
(Gain) loss on sale of asset - - - - - - - - (1,133) (0.02) - - - -
Accelerated amortization of debt discounts and debt issue costs - - - - 7,746 0.15 5,477 0.10 218 - - - 1,706 0.03
Tax impact on adjustments (5,513) (0.11) (8,091) (0.16) (8,329) (0.16) (9,100) (0.17) (5,968) (0.11) (7,608) (0.15) (28,024) (0.52)
Impact of state tax adjustments - - (237) - (1,741) (0.03) (9,465) (0.18) - - - - (199) -
Total adjustments 10,548 0.21 18,008 0.36 11,642 0.23 7,293 0.14 19,789 0.37 15,556 0.29 57,195 1.07
Non-GAAP Adjusted Net Income and Non-GAAP Adjusted EPS 39,768$ 0.79$ 55,220$ 1.09$ 77,147$ 1.50$ 79,908$ 1.53$ 98,049$ 1.86$ $115,463 2.17$ $126,590 2.37$

Dollar values in thousands.
Three Months Ended Mar. 31, Twelve Months Ended March. 31,
2017 2016 2017 2016
GAAP Net (Loss) Income 11,090$ 13,936$ 69,395$ 99,907$
Adjustments:
Adjustments to reconcile net (loss) income to net cash provided by operating activities
as shown in the Statement of Cash Flows 21,347 34,206 91,713 96,221
Changes in operating assets and liabilities, net of effects from acquisitions as shown in
the Statement of Cash Flows
(25,013) (10,243) (13,336) (21,778)
Total Adjustments (3,666) 23,963 78,377 74,443
GAAP Net cash provided by operating activities 7,424 37,899 147,772 174,350
Purchase of property and equipment (1,042) (1,028) (2,977) (3,568)
Non-GAAP Free Cash Flow 6,382 36,871 144,795 170,782
Premium payment on extinguishment of 2012 Senior Notes - 10,158 - 10,158
Integration, transition and other payments associated with acquisitions and divestitures 8,304 1,665 10,448 2,461
Additioanl interest on Term Loan B-4 debt refinancing 9,184 - 9,184 -
Pension contribution 6,000 - 6,000 -
Additional income tax payments associated with divestitures 16,956 - 25,545 -
Non-GAAP Adjusted Free Cash Flow 46,826$ 48,694$ 195,972$ 183,401$

Dollar values in thousands, except per share data.
2010 2011 2012 2013 2014 2015 2016 2017
GAAP Net Income 32,115$ 29,220$ 37,212$ 65,505$ 72,615$ 78,260$ 99,907$ 69,395$
Adjustments
Adjustments to reconcile net income to net cash provided by operating
activities as shown in the statement of cash flows 31,137 26,095 35,674 59,497 50,912 64,668 96,221 91,713
Changes in operating assets and liabilities, net of effects from
acquisitions as shown in the statement of cash flows (3,825) 31,355 (5,434) 12,603 (11,945) 13,327 (21,778) (13,336)
Total adjustments 27,312 57,450 30,240 72,100 38,967 77,995 74,443 78,377
GAAP Net cash provided by operating activities 59,427 86,670 67,452 137,605 111,582 156,255 174,350 147,772
Purchases of property and equipment (673) (655) (606) (10,268) (2,764) (6,101) (3,568) (2,977)
Non-GAAP Free Cash Flow 58,754 86,015 66,846 127,337 108,818 150,154 170,782 144,795
Premiuim payment on 2010 Senior Notes - - - - 15,527 - - -
Premiuim payment on extinguishment of 2012 Senior Notes - - - - - - 10,158 -
Accelerated interest payments due to debt refinancing - - - - 4,675 - - 9,184
Integration, transition and other payments associated with acquisitions - - - - 512 13,563 2,461 10,448
Pension contribution - - - - - - 6,000
Additional income tax payments associated with divestitures - - - - - - 25,545
Total adjustments - - - - 20,714 13,563 12,619 51,177
Non-GAAP Adjusted Free Cash Flow 58,754$ 86,015$ 66,846$ 127,337$ 129,532$ 163,717$ 183,401$ 195,972$

2018 Projected EPS
Low High
Projected FY'18 GAAP EPS $ 2.50 $ 2.60
Adjustments:
Costs associated with Fleet integration(1) 0.08 0.08
Total Adjustments 0.08 0.08
Projected Non-GAAP Adjusted EPS $ 2.58 $ 2.68
Dollar values in millions, except per share data.
(1) Acquisition related items represent costs related to integrating recently acquired businesses including (but not limited to), warehouse consolidation, costs to exit or convert contractual obligations, severance, information system conversion and consulting costs;
and certain costs related to the consummation of the acquisition process such as legal and other acquisition related professional fees.
2018 Projected
Free Cash Flow
Projected FY'18 GAAP Net Cash provided by operating activities $ 210
Additions to property and equipment for cash (10)
Projected Non-GAAP Free Cash Flow 200
Payments associated with acquisitions 8
Tax effect of payments associated with acquisitions (3)
Adjusted Non-GAAP Projected Free Cash Flow $ 205
