Attached files
| file | filename |
|---|---|
| EX-99.1 - EX-99.1 - Corium International, Inc. | ex-99d1.htm |
| 8-K - 8-K - Corium International, Inc. | f8-k.htm |
Exhibit 99.2
|
|
Corplex Donepezil® Pilot Bioequivalence Study Preliminary Results May 11, 2017 |
|
|
Forward-looking Statements This presentation and the accompanying oral presentation contain “forward-looking” statements that are based on our management’s beliefs and assumptions and on information currently available to management. Forward-looking statements include all statements other than statements of historical fact contained in this presentation, including information concerning our business strategy, future financial and operating performance, business plans and objectives, potential growth and market opportunities, financing plans, competitive position, industry environment, product pipeline, clinical trial timing and plans, cash and resource requirements, clinical and regulatory pathways for our development programs, the achievement of clinical and commercial milestones, the advancement of our technologies and our proprietary, co-developed and partnered products and product candidates. Forward-looking statements are subject to known and unknown risks, uncertainties, assumptions and other factors including, but not limited to, those related to our future financial performance, market acceptance of our proprietary technology platforms for transdermal drug delivery, our ability to develop and maintain partnerships, our ability to identify, develop and market new products in a timely manner, our ability to maintain, protect and enhance our brand and intellectual property, and our ability to continue to stay in compliance with applicable laws and regulations. Moreover, we operate in a very competitive and rapidly changing environment, and new risks may emerge from time to time. It is not possible for our management to predict all risks, nor can we assess the impact of all factors on our business or the extent to which any factor, or combination of factors, may cause actual results to differ materially from those contained in any forward-looking statements we may make. These factors, together with those that may be described in greater detail in our filings with the Securities and Exchange Commission (“SEC”), may cause our actual results, performance or achievements to differ materially and adversely from those anticipated or implied by our forward-looking statements. You should not rely upon forward-looking statements as predictions of future events. Although our management believes that the expectations reflected in our forward-looking statements are reasonable, we cannot guarantee that the future results, levels of activity, performance or events and circumstances described in the forward-looking statements will be achieved or occur. Moreover, neither we, nor any other person, assume responsibility for the accuracy and completeness of the forward-looking statements. These forward-looking statements speak only as of the date of this presentation, and we undertake no obligation to publicly update any forward-looking statements for any reason after the date of this presentation to conform these statements to actual results or to changes in our expectations, except as required by law. |
|
|
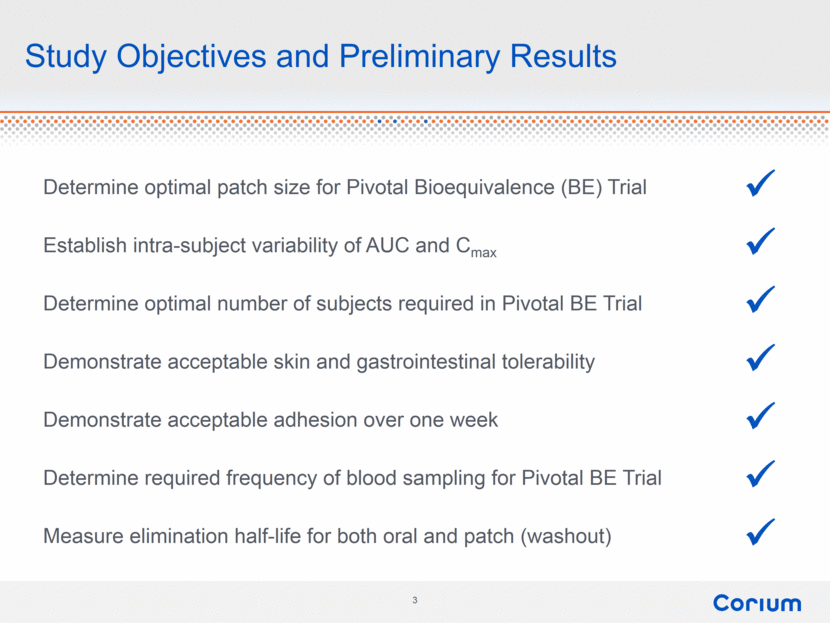
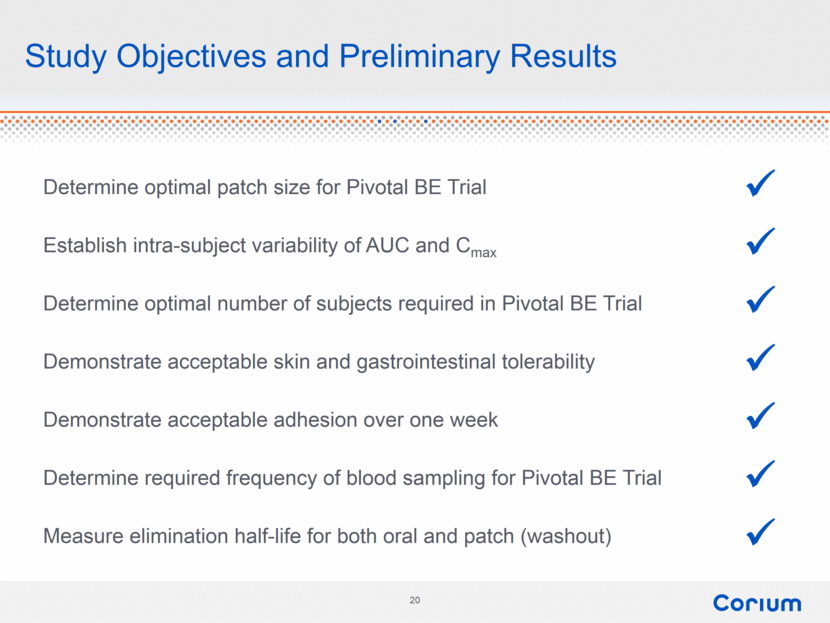
Study Objectives and Preliminary Results Determine optimal patch size for Pivotal Bioequivalence (BE) Trial Establish intra-subject variability of AUC and Cmax Determine optimal number of subjects required in Pivotal BE Trial Demonstrate acceptable skin and gastrointestinal tolerability Demonstrate acceptable adhesion over one week Determine required frequency of blood sampling for Pivotal BE Trial Measure elimination half-life for both oral and patch (washout) |
|
|
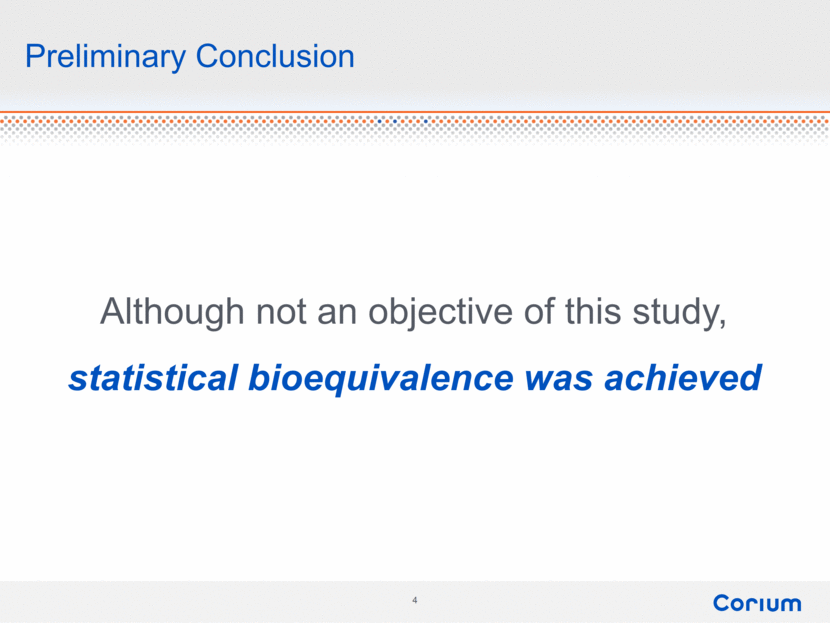
Preliminary Conclusion Although not an objective of this study, statistical bioequivalence was achieved |
|
|
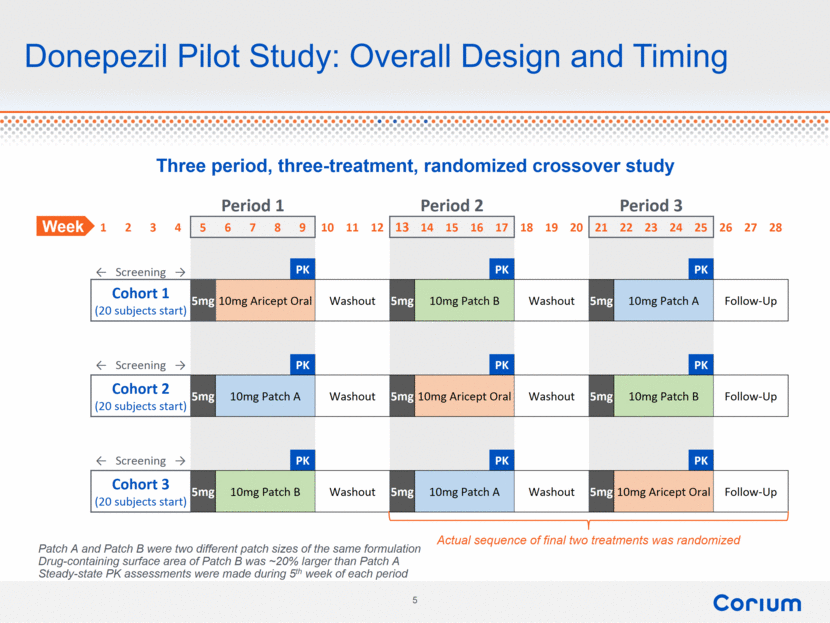
Donepezil Pilot Study: Overall Design and Timing Three period, three-treatment, randomized crossover study Period 1 Period 2 Period 3 1 2 3 4 5 6 7 8 9 10 11 12 13 14 15 16 17 18 19 20 21 22 23 24 25 26 27 28 ← Screening → PK PK PK Cohort 1 (20 subjects start) 5mg 10mg Aricept Oral Washout 5mg 10mg Patch B Washout 5mg 10mg Patch A Follow-Up ← Screening → PK PK PK Cohort 2 (20 subjects start) 5mg 10mg Patch A Washout 5mg 10mg Aricept Oral Washout 5mg 10mg Patch B Follow-Up ← Screening → PK PK PK Cohort 3 (20 subjects start) 5mg 10mg Patch B Washout 5mg 10mg Patch A Washout 5mg 10mg Aricept Oral Follow-Up Actual sequence of final two treatments was randomized Week Patch A and Patch B were two different patch sizes of the same formulation Drug-containing surface area of Patch B was ~20% larger than Patch A Steady-state PK assessments were made during 5th week of each period |
|
|
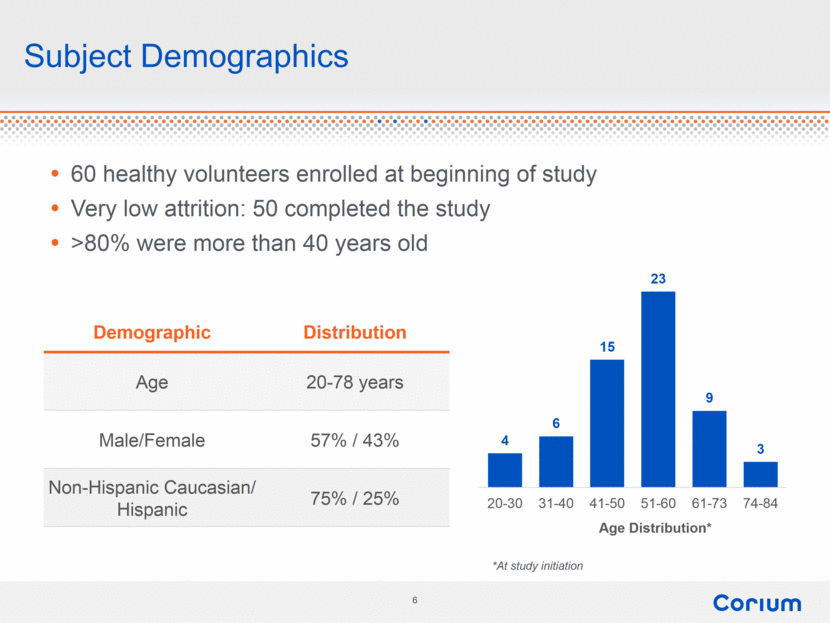
Subject Demographics Demographic Distribution Age 20-78 years Male/Female 57% / 43% Non-Hispanic Caucasian/ Hispanic 75% / 25% 60 healthy volunteers enrolled at beginning of study Very low attrition: 50 completed the study >80% were more than 40 years old *At study initiation 4 6 15 23 9 3 20-30 31-40 41-50 51-60 61-73 74-84 Age Distribution* |
|
|
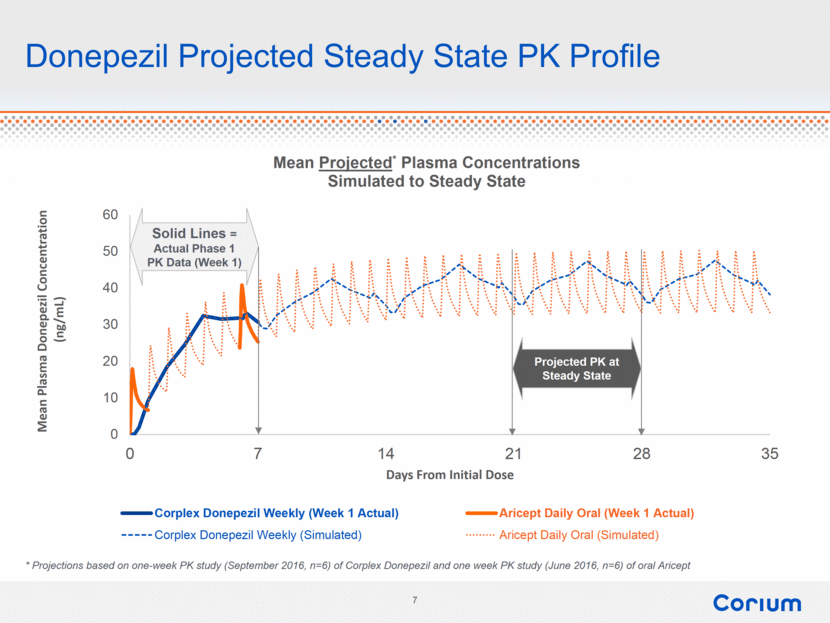
Donepezil Projected Steady State PK Profile Solid Lines = Actual Phase 1 PK Data (Week 1) * Projections based on one-week PK study (September 2016, n=6) of Corplex Donepezil and one week PK study (June 2016, n=6) of oral Aricept Projected PK at Steady State |
|
|
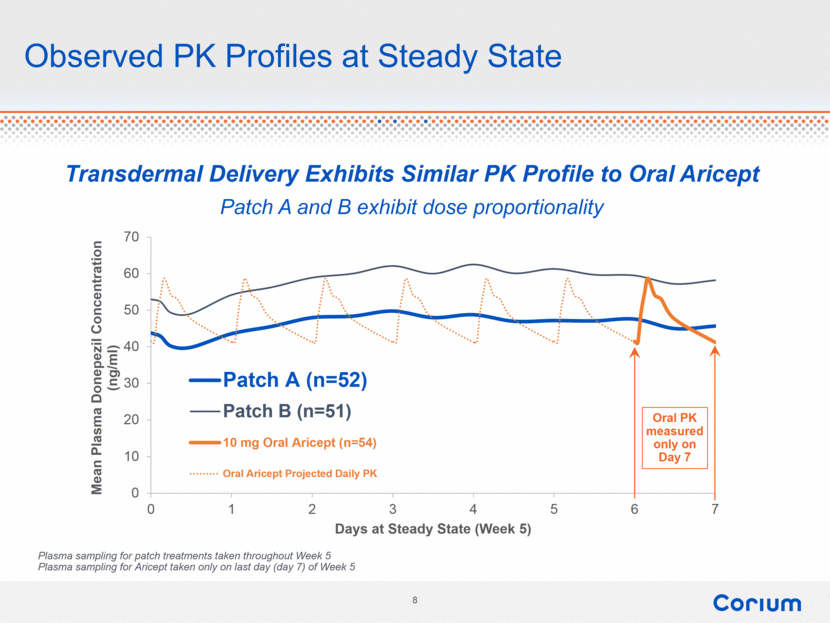
Observed PK Profiles at Steady State Oral PK measured only on Day 7 Plasma sampling for patch treatments taken throughout Week 5 Plasma sampling for Aricept taken only on last day (day 7) of Week 5 Transdermal Delivery Exhibits Similar PK Profile to Oral Aricept Patch A and B exhibit dose proportionality 0 10 20 30 40 50 60 70 0 1 2 3 4 5 6 7 Mean Plasma Donepezil Concentration (ng/ml) Days at Steady State (Week 5) Patch A (n=52) Patch B (n=51) 10 mg Oral Aricept (n=54) Oral Aricept Projected Daily PK |
|
|
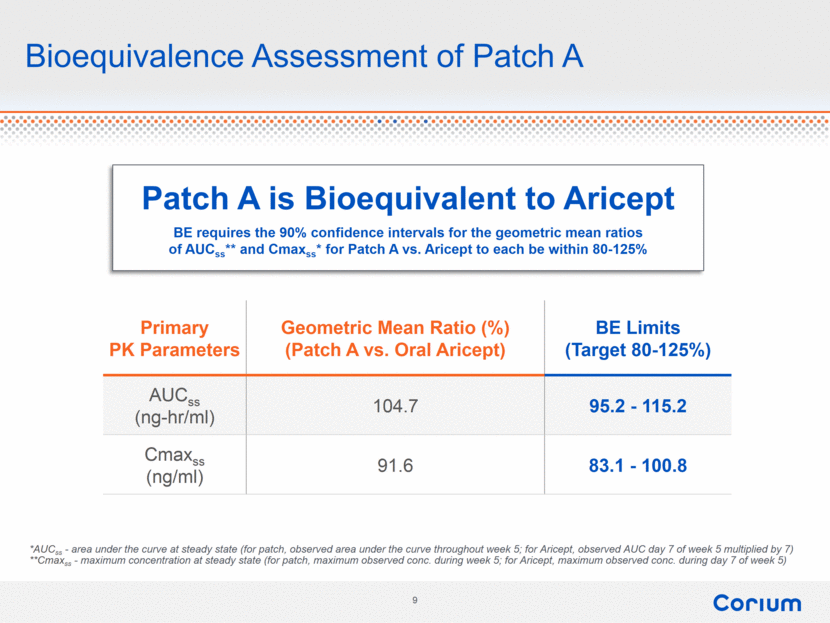
Bioequivalence Assessment of Patch A Primary PK Parameters Geometric Mean Ratio (%) (Patch A vs. Oral Aricept) BE Limits (Target 80-125%) AUCss (ng-hr/ml) 104.7 95.2 - 115.2 Cmaxss (ng/ml) 91.6 83.1 - 100.8 *AUCss - area under the curve at steady state (for patch, observed area under the curve throughout week 5; for Aricept, observed AUC day 7 of week 5 multiplied by 7) **Cmaxss - maximum concentration at steady state (for patch, maximum observed conc. during week 5; for Aricept, maximum observed conc. during day 7 of week 5) Patch A is Bioequivalent to Aricept BE requires the 90% confidence intervals for the geometric mean ratios of AUCss** and Cmaxss* for Patch A vs. Aricept to each be within 80-125% |
|
|
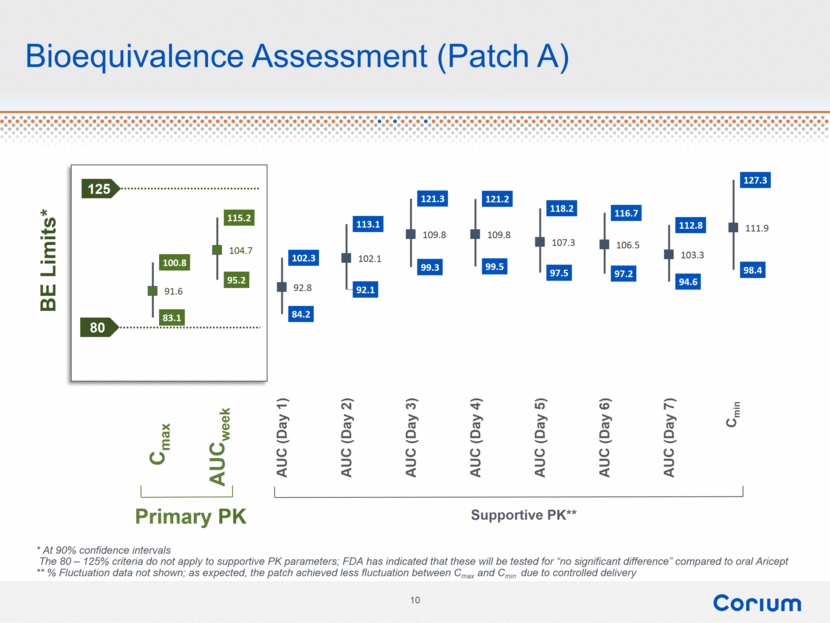
Bioequivalence Assessment (Patch A) Primary PK Supportive PK** 125 80 Cmax AUCweek * At 90% confidence intervals The 80 – 125% criteria do not apply to supportive PK parameters; FDA has indicated that these will be tested for “no significant difference” compared to oral Aricept ** % Fluctuation data not shown; as expected, the patch achieved less fluctuation between Cmax and Cmin due to controlled delivery Cmin 100.8 115.2 102.3 113.1 121.3 121.2 118.2 116.7 112.8 127.3 83.1 95.2 84.2 92.1 99.3 99.5 97.5 97.2 94.6 98.4 91.6 104.7 92.8 102.1 109.8 109.8 107.3 106.5 103.3 111.9 Cmax AUC (week) AUC (Day 1) AUC (Day 2) AUC (Day 3) AUC (Day 4) AUC (Day 5) AUC (Day 6) AUC (Day 7) Cmin BE Limits* |
|
|
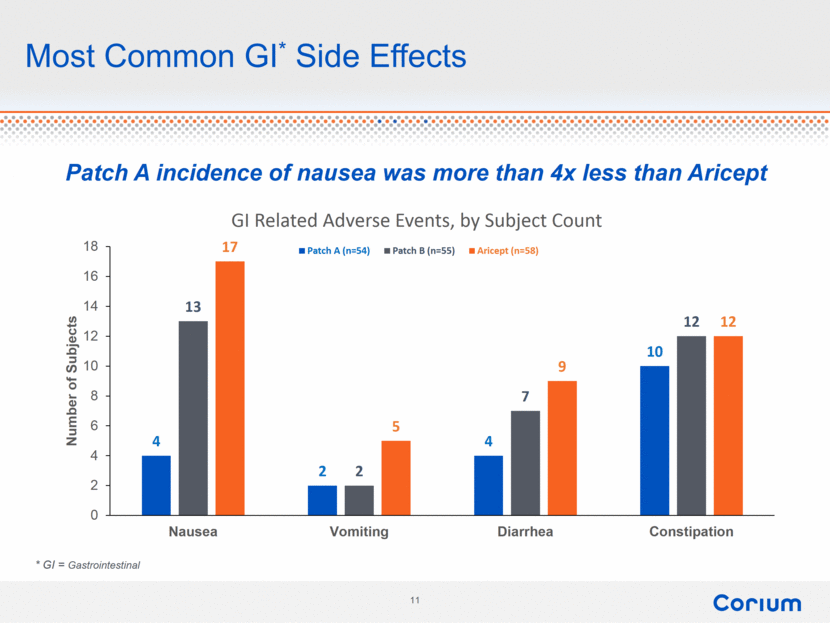
Most Common GI* Side Effects * GI = Gastrointestinal Patch A incidence of nausea was more than 4x less than Aricept 4 2 4 10 13 2 7 12 17 5 9 12 0 2 4 6 8 10 12 14 16 18 Nausea Vomiting Diarrhea Constipation Number of Subjects GI Related Adverse Events, by Subject Count Patch A (n=54) Patch B (n=55) Aricept (n=58) |
|
|
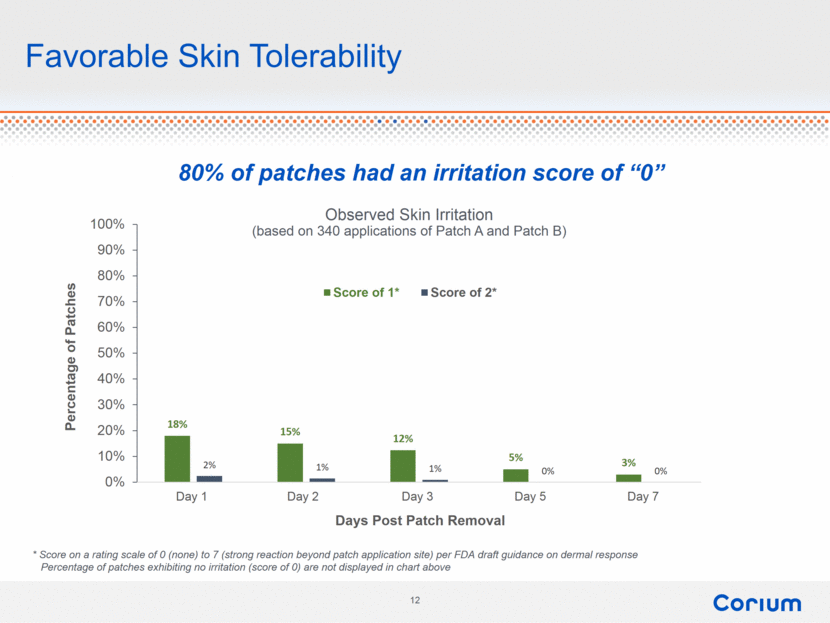
Favorable Skin Tolerability * Score on a rating scale of 0 (none) to 7 (strong reaction beyond patch application site) per FDA draft guidance on dermal response Percentage of patches exhibiting no irritation (score of 0) are not displayed in chart above Observed Skin Irritation (based on 340 applications of Patch A and Patch B) 80% of patches had an irritation score of “0” 18% 15% 12% 5% 3% 2% 1% 1% 0% 0% 0% 10% 20% 30% 40% 50% 60% 70% 80% 90% 100% Day 1 Day 2 Day 3 Day 5 Day 7 Percentage of Patches Days Post Patch Removal Score of 1* Score of 2* |
|
|
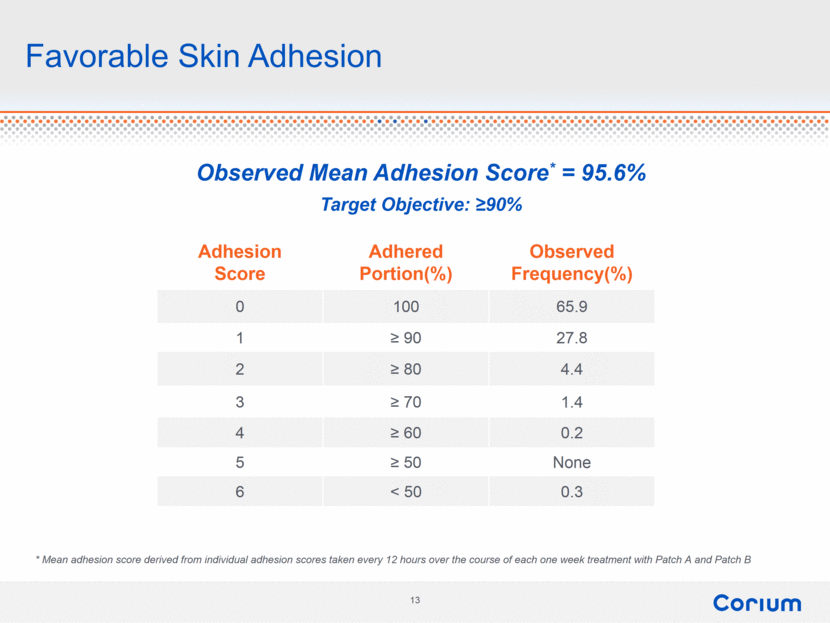
Favorable Skin Adhesion Adhesion Score Adhered Portion(%) Observed Frequency(%) 0 100 65.9 1 ≥ 90 27.8 2 ≥ 80 4.4 3 ≥ 70 1.4 4 ≥ 60 0.2 5 ≥ 50 None 6 < 50 0.3 * Mean adhesion score derived from individual adhesion scores taken every 12 hours over the course of each one week treatment with Patch A and Patch B Observed Mean Adhesion Score* = 95.6% Target Objective: ≥90% |
|
|
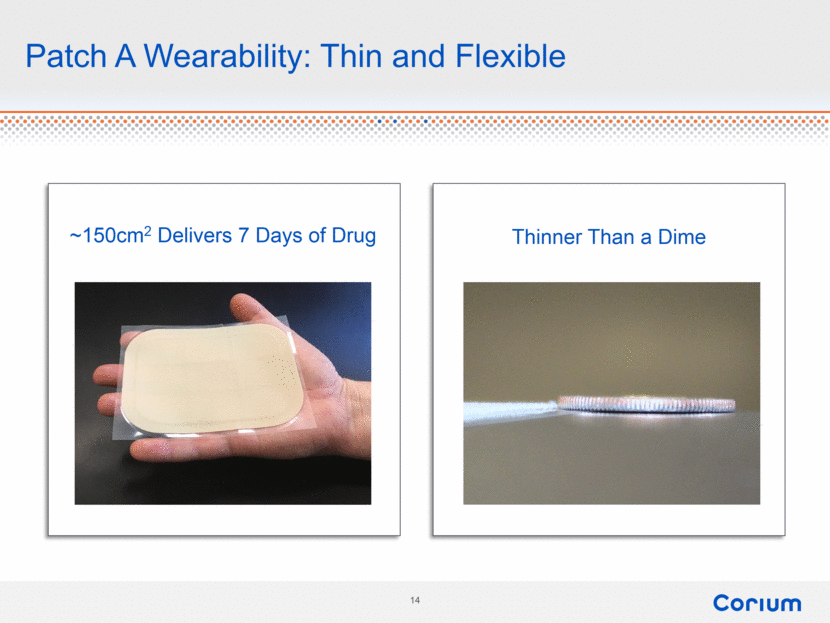
Patch A Wearability: Thin and Flexible ~150cm2 Delivers 7 Days of Drug Thinner Than a Dime |
|
|
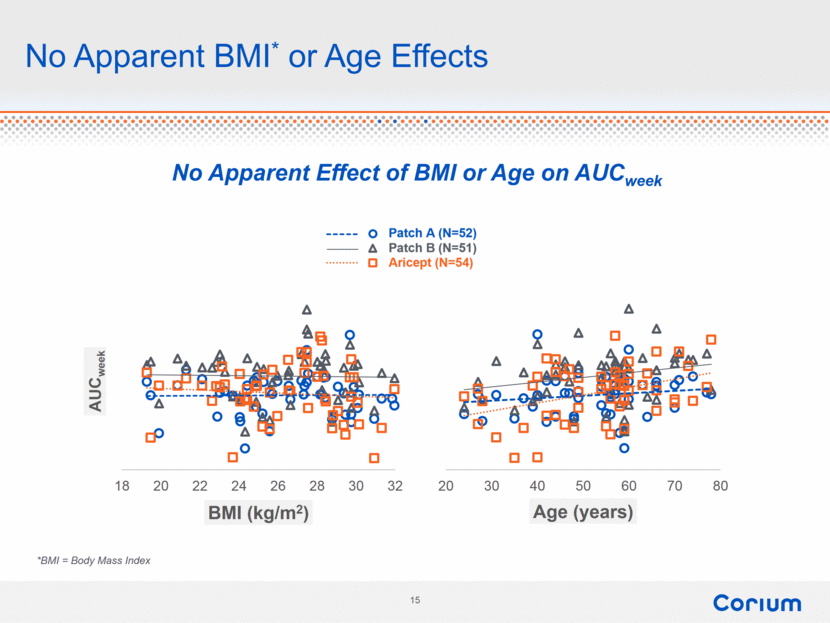
No Apparent BMI* or Age Effects No Apparent Effect of BMI or Age on AUCweek *BMI = Body Mass Index 20 30 40 50 60 70 80 Age (years) 18 20 22 24 26 28 30 32 AUC week BMI (kg/m 2 ) |
|
|
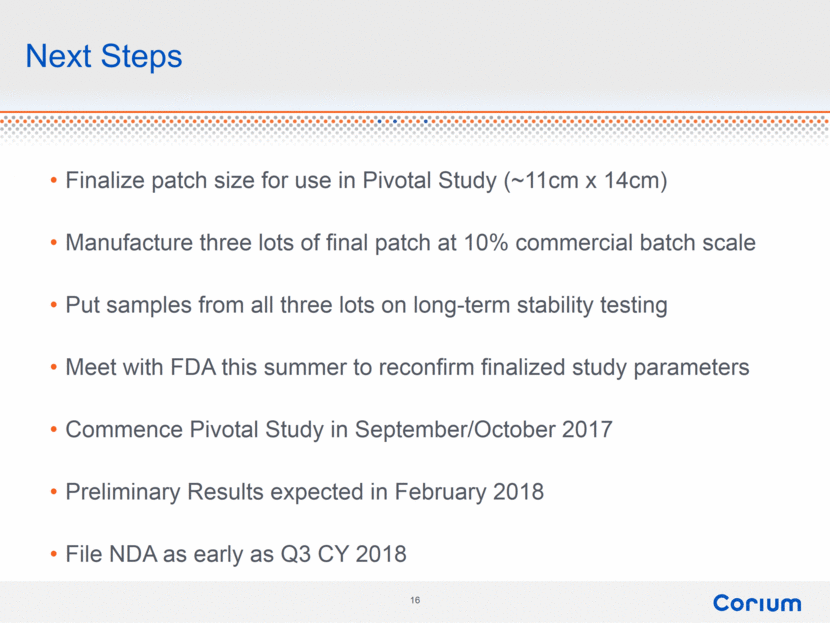
Finalize patch size for use in Pivotal Study (~11cm x 14cm) Manufacture three lots of final patch at 10% commercial batch scale Put samples from all three lots on long-term stability testing Meet with FDA this summer to reconfirm finalized study parameters Commence Pivotal Study in September/October 2017 Preliminary Results expected in February 2018 File NDA as early as Q3 CY 2018 Next Steps |
|
|
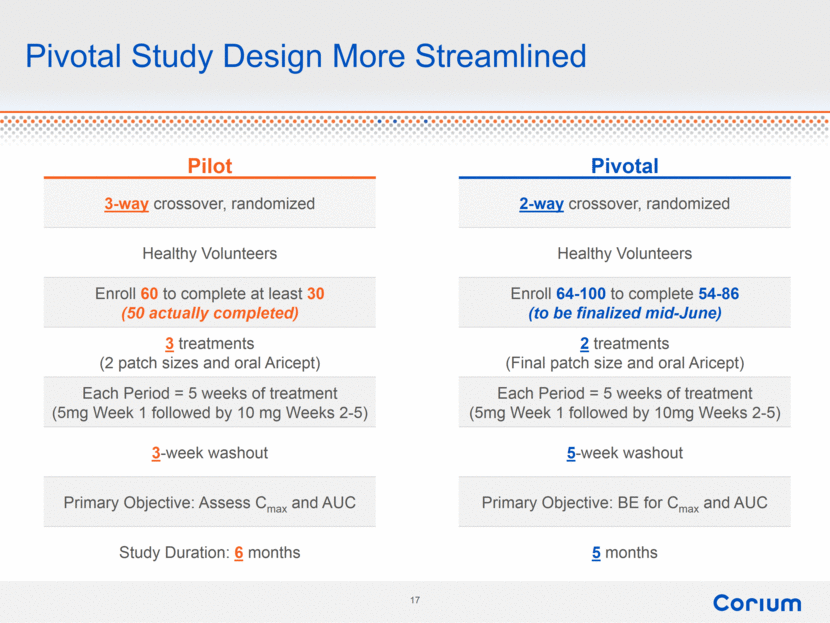
Pilot Pivotal 3-way crossover, randomized 2-way crossover, randomized Healthy Volunteers Healthy Volunteers Enroll 60 to complete at least 30 (50 actually completed) Enroll 64-100 to complete 54-86 (to be finalized mid-June) 3 treatments (2 patch sizes and oral Aricept) 2 treatments (Final patch size and oral Aricept) Each Period = 5 weeks of treatment (5mg Week 1 followed by 10 mg Weeks 2-5) Each Period = 5 weeks of treatment (5mg Week 1 followed by 10mg Weeks 2-5) 3-week washout 5-week washout Primary Objective: Assess Cmax and AUC Primary Objective: BE for Cmax and AUC Study Duration: 6 months 5 months Pivotal Study Design More Streamlined |
|
|
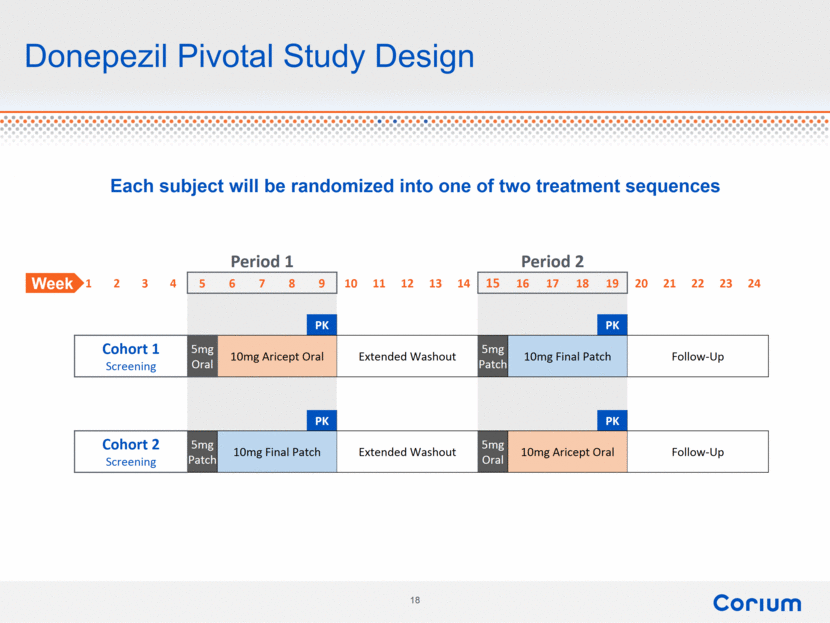
Donepezil Pivotal Study Design Each subject will be randomized into one of two treatment sequences Period 1 Period 2 1 2 3 4 5 6 7 8 9 10 11 12 13 14 15 16 17 18 19 20 21 22 23 24 PK PK Cohort 1 Screening 5mg Oral 10mg Aricept Oral Extended Washout 5mg Patch 10mg Final Patch Follow-Up PK PK Cohort 2 Screening 5mg Patch 10mg Final Patch Extended Washout 5mg Oral 10mg Aricept Oral Follow-Up Week |
|
|
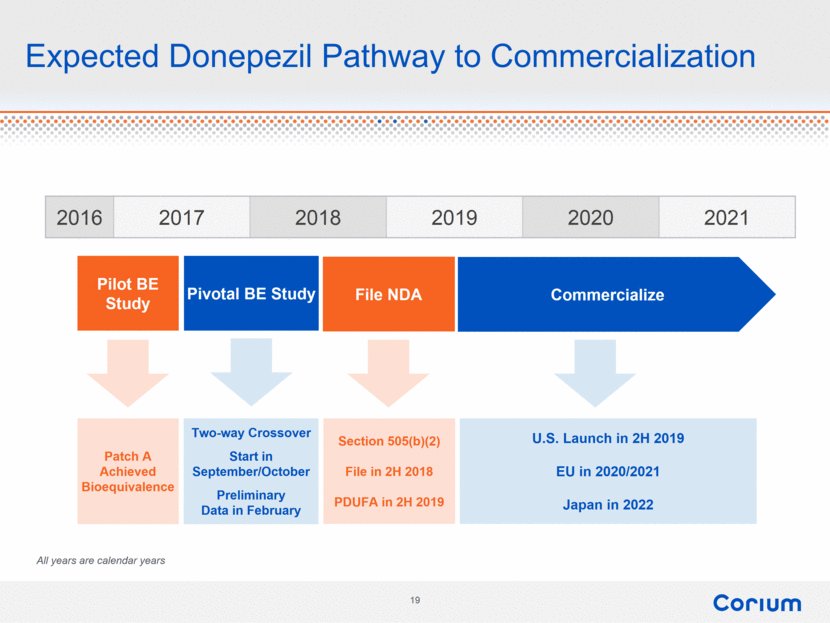
Expected Donepezil Pathway to Commercialization 2016 2017 2018 2019 2020 2021 Pilot BE Study Pivotal BE Study File NDA Commercialize Patch A Achieved Bioequivalence Section 505(b)(2) File in 2H 2018 PDUFA in 2H 2019 U.S. Launch in 2H 2019 EU in 2020/2021 Japan in 2022 Two-way Crossover Start in September/October Preliminary Data in February All years are calendar years |
|
|
Study Objectives and Preliminary Results Determine optimal patch size for Pivotal BE Trial Establish intra-subject variability of AUC and Cmax Determine optimal number of subjects required in Pivotal BE Trial Demonstrate acceptable skin and gastrointestinal tolerability Demonstrate acceptable adhesion over one week Determine required frequency of blood sampling for Pivotal BE Trial Measure elimination half-life for both oral and patch (washout) |
|
|
Nasdaq: CORI |