Attached files
| file | filename |
|---|---|
| 8-K - 8-K - PINNACLE WEST CAPITAL CORP | form8-kmay122107investorme.htm |

Powering Growth, Delivering Value1
Investor Meetings l May 12, 2017
POWERING GROWTH
DELIVERING VALUE

Powering Growth, Delivering Value2
FORWARD LOOKING STATEMENTS
This presentation contains forward-looking statements based on current expectations, including statements regarding our earnings
guidance and financial outlook and goals. These forward-looking statements are often identified by words such as “estimate,”
“predict,” “may,” “believe,” “plan,” “expect,” “require,” “intend,” “assume,” “project” and similar words. Because actual results may
differ materially from expectations, we caution you not to place undue reliance on these statements. A number of factors could cause
future results to differ materially from historical results, or from outcomes currently expected or sought by Pinnacle West or APS.
These factors include, but are not limited to: our ability to manage capital expenditures and operations and maintenance costs while
maintaining high reliability and customer service levels; variations in demand for electricity, including those due to weather
seasonality, the general economy, customer and sales growth (or decline), and the effects of energy conservation measures and
distributed generation; power plant and transmission system performance and outages; competition in retail and wholesale power
markets; regulatory and judicial decisions, developments and proceedings; new legislation, ballet initiatives and regulation, including
those relating to environmental requirements, regulatory policy, nuclear plant operations and potential deregulation of retail electric
markets; fuel and water supply availability; our ability to achieve timely and adequate rate recovery of our costs, including returns on
and of debt and equity capital investments; our ability to meet renewable energy and energy efficiency mandates and recover related
costs; risks inherent in the operation of nuclear facilities, including spent fuel disposal uncertainty; current and future economic
conditions in Arizona, including in real estate markets; the development of new technologies which may affect electric sales or
delivery; the cost of debt and equity capital and the ability to access capital markets when required; environmental, economic and
other concerns surrounding coal-fired generation, including regulation of greenhouse gas emissions; volatile fuel and purchased
power costs; the investment performance of the assets of our nuclear decommissioning trust, pension, and other postretirement
benefit plans and the resulting impact on future funding requirements; the liquidity of wholesale power markets and the use of
derivative contracts in our business; potential shortfalls in insurance coverage; new accounting requirements or new interpretations
of existing requirements; generation, transmission and distribution facility and system conditions and operating costs; the ability to
meet the anticipated future need for additional generation and associated transmission facilities in our region; the willingness or
ability of our counterparties, power plant participants and power plant land owners to meet contractual or other obligations or extend
the rights for continued power plant operations; and restrictions on dividends or other provisions in our credit agreements and ACC
orders. These and other factors are discussed in Risk Factors described in Part I, Item 1A of the Pinnacle West/APS Annual Report on
Form 10-K for the fiscal year ended December 31, 2016, which you should review carefully before placing any reliance on our
financial statements, disclosures or earnings outlook. Neither Pinnacle West nor APS assumes any obligation to update these
statements, even if our internal estimates change, except as required by law.

Powering Growth, Delivering Value3
PINNACLE WEST:
WHO WE ARE
We are a vertically integrated,
regulated electric utility in the
growing southwest United States
Pinnacle West (NYSE: PNW)
- Market Capitalization*: $9.5 billion
- Enterprise Value*: $13.9 billion
- Consolidated Assets: $16.2 billion
- Indicated Annual Dividend*: $2.62
- Dividend Yield*: 3.1%
Principal subsidiary:
- Arizona Public Service Company, Arizona’s largest
and longest-serving electric utility
Customers: 1.2 million (89% residential)
2016 Peak Demand: 7,051 MW
- All time high of 7,236 in July 2006
Generation Capacity: About 6,200 MW of owned or
leased capacity (~8,600 MW with long-term contracts)
- Including 29.1% interest in Palo Verde Nuclear
Generating Station, the largest in the U.S.
- Regulated utility provides stable, regulated
earnings and cash flow base for Pinnacle West
* As of April 28, 2017

Powering Growth, Delivering Value4
• Annual dividend growth target of 5%, subject to declaration at Board of Director’s discretion
• Strong credit ratings and balance sheet
• Rate base growth of 6-7% (2015-2019); investing in a portfolio that is cost-effective and sustainable
in a variety of future state scenarios
Financial Strength
• Arizona’s long-term growth fundamentals remain largely intact, including population growth, job
growth and economic development
Leverage to Economic Growth
• Best safety performance among peers and top quartile ratings in Power Quality and Reliability
• APS operates the Palo Verde Nuclear Generating Station, the largest nuclear plant in the United States
• Disciplined cost management
Operational Excellence
VALUE PROPOSITION
• At the forefront of utilities studying and deploying advanced infrastructure to enable reliable and
cost-efficient integration of emerging technologies into the grid and with customers
Developing Technology to Modernize the Grid
• Working with Arizona Corporation Commission and key stakeholders to modernize rates
Proactively Addressing Rate Design
We are executing on our financial and operational objectives …
… while also advocating to ensure Pinnacle West and Arizona have a sustainable energy future

Powering Growth, Delivering Value5
2016 HIGHLIGHTS & ACCOMPLISHMENTS
PNW Total Shareholder Return of 25.3%, outperforming the electric utilities index and broad market
Increased indicated annual dividend for fifth straight year, by 5%
Maintained strong credit ratings (mid to low A) from all three rating agencies
Completed 40MW Red Rock Solar Power Plant – APS’s largest utility-scale solar plant
Completed installation of 1,600 utility-owned residential rooftop solar systems
Began construction on $500M Ocotillo Modernization Project, including air permit approval
Completed major outages on Four Corners Units 4 and 5 and on-track with $400M SCR installation
Developed 37MW of Microgrids, including 25MW for the Department of the Navy at Yuma Marine
Corp Air Station
Completed 3 new transmission lines worth $146.5M investment
Joined the CAISO Energy Imbalance Market, with go live operations effective October 1st
Launched our Advanced Distribution Management System, including 200+ grid technology devices
Ranked in the top 10 nationally among large IOUs in the 2016 JD Power residential customer
satisfaction survey for Power Quality and Reliability
Successfully completed both Spring and Fall outages at Palo Verde Nuclear Generating Station
Palo Verde site average capacity factor maintained above 95%
Filed our first rate review in 5 years; proposing industry leading rate design
Concluded the Value and Cost of Distributed Generation docket – retiring net metering and replacing
with a more formula-driven approach

Powering Growth, Delivering Value6
DIVIDEND GROWTH
Pinnacle West’s indicated annual
dividend is $2.62 per share;
targeting ~5% annual dividend
growth
$2.10
$2.18
$2.27
$2.38
$2.50
$2.62
2011 2012 2013 2014 2015 2016 2017 2018
Dividend Growth Goal
Indicated Annual Dividend Rate at Year-End
Projected
Future dividends subject to declaration at Board of Directors’ discretion.
Powering Growth, Delivering Value7
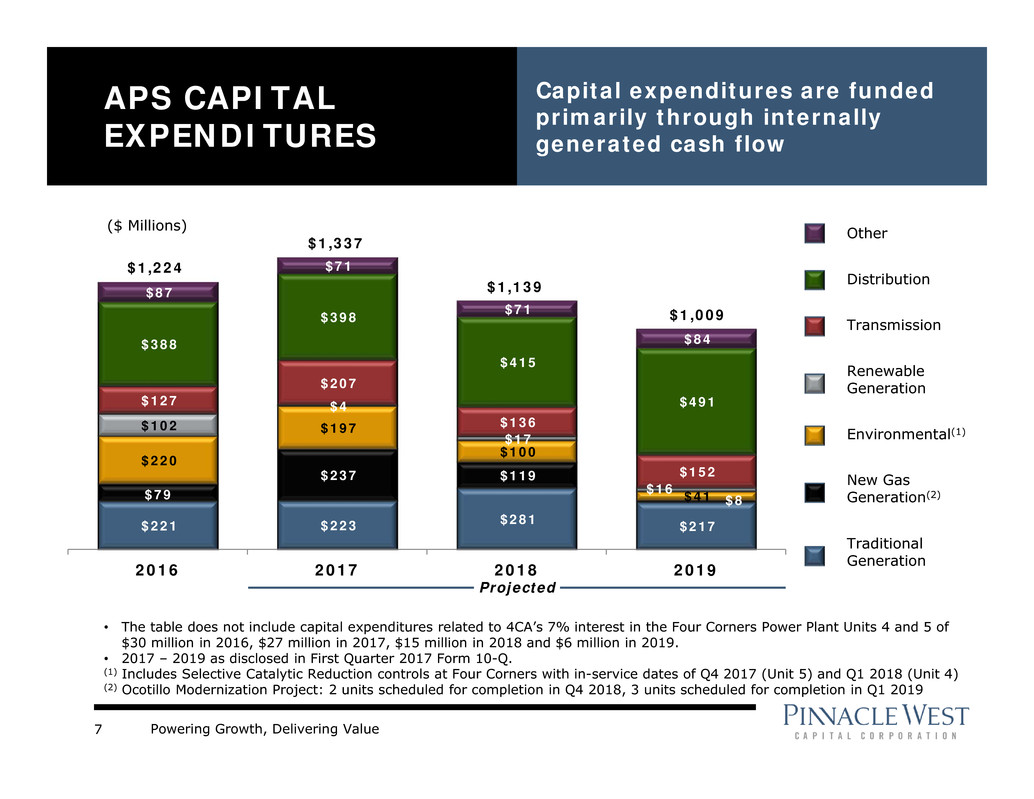
$221 $223 $281 $217
$79
$237 $119
$8
$220
$197
$100
$41
$102
$4
$17
$16
$127
$207
$136
$152
$388
$398
$415
$491
$87
$71
$71
$84
2016 2017 2018 2019
APS CAPITAL
EXPENDITURES
Capital expenditures are funded
primarily through internally
generated cash flow
($ Millions)
$1,224
$1,337
Other
Distribution
Transmission
Renewable
Generation
Environmental(1)
Traditional
Generation
Projected
$1,139
New Gas
Generation(2)
• The table does not include capital expenditures related to 4CA’s 7% interest in the Four Corners Power Plant Units 4 and 5 of
$30 million in 2016, $27 million in 2017, $15 million in 2018 and $6 million in 2019.
• 2017 – 2019 as disclosed in First Quarter 2017 Form 10-Q.
(1) Includes Selective Catalytic Reduction controls at Four Corners with in-service dates of Q4 2017 (Unit 5) and Q1 2018 (Unit 4)
(2) Ocotillo Modernization Project: 2 units scheduled for completion in Q4 2018, 3 units scheduled for completion in Q1 2019
$1,009

Powering Growth, Delivering Value8
RATE BASE
APS’s revenues come from a
regulated retail rate base and
meaningful transmission business
$6.5
$8.3
$1.4
$1.8
2015 2016* 2017 2018 2019
APS Rate Base Growth
Year-End
ACC FERC
Total Rate Base
Projected
Most Recent Rate Decisions
ACC
As Filed 6/1/2016
FERC
Rate Effective Date 7/1/2017 6/1/2016
Test Year Ended 12/31/20151 12/31/2015
Rate Base $6.8B $1.4B
Equity Layer 56% 56%
Allowed ROE 10.5% 10.75%
1 Adjusted to include post test-year plant in service through 6/30/2017
83%
17%
Generation & Distribution Transmission
*2016 rate base pending update following FERC Form 1 filing
Rate base $ in billions, rounded

Powering Growth, Delivering Value9
RESOURCE PLANNING
Over 1.3 gigawatts of new quick
start, combustion turbine capacity
needed by 2025
Gas
Coal
Nuclear
RE + DE
EE
Composition of Energy Mix by Resource*
41%
11%
17%
18%
13%2032
Note: RE = Renewable Energy ; DE = Distributed Energy EE= Energy Efficiency
*Data shown is based on the 2017 Integrated Resource Plan
filed April 10, 2017.
-
2,000
4,000
6,000
8,000
10,000
12,000
14,000
2017 2019 2021 2023 2025 2027 2029 2031
Future Grid-Scale
Generation
Total Load Requirements
MW
Existing Owned Resources
and Contracts
2017-2032 Supply / Demand Gap
29%
21%
25%
12%
13%2017

Powering Growth, Delivering Value10
THE GRID IS EVOLVING – DRIVING NEW
INVESTMENTS IN TECHNOLOGY
Drivers for
Change
– Traditional grid built for
one-way flow
– Technology advancements
(storage, home energy
management)
– Changing customer needs and
demands
– Proliferation of distributed
solar energy, which does not
align with peak
The Modern
Grid
– New technologies to enable
two-way flow
– Proactive vs. reactive
operations and maintenance
– Modern rate structure
– New ways to interact with
customer
– Mobility for our field personnel
– Smarter, more flexible real-
time system operations
– Support consumer products
and services
– Addresses cybersecurity
APS Laying
Foundation for
the Future
– Solar R&D initiatives
• Solar Partner Program
• Solar Innovation Study
– Smart meters fully deployed
– Investing in peaking capacity upgrades
(Ocotillo)
– Evaluating storage/customer-cited
technology
• Battery pilot investments
• Microgrids
– Software upgrades for distribution
operations and customer service
– Ensuring our people have the relevant
skill sets
• Grid stability, power quality and reliability remain the core of a sustainable electrical system
• APS is at the forefront of utilities designing and planning for the next generation electric grid
• New technology advances and changing customer needs are transforming the way we use the grid

Powering Growth, Delivering Value11
DISTRIBUTION GRID
INVESTMENTS
Modernizing the distribution grid
with advanced technology
investments – resulting in
improved reliability for customers
and more efficient operations
Grid Operations
& Investment
$1.3 Billion over
next 3 years
Customer Facing TechnologyUtility-Scale Technology
Rooftop Solar
Home Energy
Management Electric Vehicles
Integrated Volt/VAR
Control (IVVC)
Smart Meters
Advanced
Distribution
Management System
Strategic
Fiber
Supervisory Controlled
Switches
Substation Health
Monitoring
Microgrids
Battery Storage

Powering Growth, Delivering Value12
We assessed our sustainability actions to identify our highest priority elements. These elements are:
Carbon Management, Energy Innovation, Safety and Security, Water Resources and People. Examples
of 2016 accomplishments in these areas include:
Carbon Management: By the end of 2016, 50 percent of our diverse energy mix was carbon-free,
and we saw a 26 percent reduction in our year-over-year carbon emissions. The CDP recognized
Pinnacle West’s action on climate change management to be above industry averages.
Energy Innovation: APS launched one of the nation’s first utility-owned research and development
projects to study the offset of peak energy usage with solar energy production. The project makes
solar available to a limited number of APS customers who are not typical customers for rooftop solar
or have limited income. The 1,600 rooftop solar systems and 4 megawatts of battery storage won
Renewable Integration Project of the Year at the annual Distributech Conference.
Safety and Security: APS had its lowest number of OSHA recordables and expects to remain within
the top decile for electric utilities; additionally, APS continued to implement physical enhancements
and cyber security defenses to protect our people and assets.
Water Resources: 74 percent of our total water usage for energy generation was from reclaimed
water, which produced over 37 million megawatt hours of energy.
People: APS's efforts to improve the workplace experience of our employees yielded positive results.
We improved our 2016 employee engagement survey scores in all categories, including our overall
engagement score, which placed us above other benchmarked utility organizations.
SUSTAINABILITY
APS’s vision is to create a
sustainable energy future for
Arizona

Powering Growth, Delivering Value13
RENEWABLE
RESOURCES
APS is a leader in solar
Aragonne Mesa
Wind
90 MW
Snowflake
Biomass
14 MW
Glendale Landfill
Biogas
2.8 MW
Salton Sea
Geothermal
10 MW
• Solar* 1,156 MW
• Wind 289 MW
• Biomass 14 MW
• Geothermal 10 MW
• Biogas 6 MW
APS currently has 1,475 MW
of renewable resources:
Owned solar includes 170 MW AZ Sun Program, 4 MW of other APS
owned utility scale solar and 40 MW Red Rock Solar Plant;
Distributed Generation (DG) includes 25 MW of APS owned.
PPA is primarily 250 MW Solana Concentrated Solar Facility.
PPA
310 MW
DG
632 MW
Owned
214 MW
* As of First Quarter 2017 Form 10-Q – with additional 45 MW under development
APS Solar Portfolio*
Yuma Foothills
Solar
35 MW

Powering Growth, Delivering Value14
SOLAR PARTNER
PROGRAM
Learning how to efficiently enable
the integration of rooftop solar
and battery storage with our grid
• Overview
– Installed 10 MW of APS-owned residential PV systems; approximately 1,600 systems with average
system size of 6kW
– Advanced controllable inverters that can vary power output depending on grid conditions
– 4 MW of grid-tied battery storage on 2 of the participating feeders
– Collect and analyze real time data on energy production, energy usage, power regulation
capabilities and curtailment options
– Participating customers receive monthly bill credits through 20-year life
• Benefits
− Study system benefits (i.e. strategic deployment orientation,
advanced inverters, etc.)
− Provides support for advanced rate structure
− Provides an alternative for customers who cannot afford solar
or do not want a lease
• Timeline
– Installations through mid-2016
– Technology evaluation in 2016/2017

Powering Growth, Delivering Value15
SOLAR INNOVATION
STUDY
Examining the integration of
behind the meter advanced
technologies with demand-based
rates
• Overview
– Installing APS-owned residential PV systems on 75 homes
with various configurations of battery storage, energy
efficiency, demand controls and smart thermostats
connected to a cloud based energy management system
• Benefits
– Identify effective technology packages that can shift load
and minimize grid challenges
– Gain insight into customer behavior and preferences in use of ‘next generation’ demand control and
load shifting technologies
– Identify strategies to support sustainable growth of renewable resources
– Inform rate design in development of modernized demand based residential rates
• Timeline
– Design and installation in 2016/2017
– 5-year study

Powering Growth, Delivering Value16
ENVIRONMENTAL
PLAN
Regional Haze compliance is the
biggest driver of environmental
spend over the next few years
Regional Haze / BART
(SCR)
Mercury and Other Hazardous
Air Pollutants
(ACI + Baghouse)
Coal Combustion Residuals
EPA Ruling Announced in 1999, with site-specific requirements announced more recently
MATS compliance by April 2015,
with potential for
one-year extension
Announced on December 19,
2014 (Subtitle D)
Four
Corners
Units 4 & 5
Approximately $400M for SCRs in 2016-2018
(does not include CAPEX related to 4CA 7%
interest)
$0
APS estimates its share of
incremental costs to comply
with the CCR rule for Four
Corners is approximately $15
million, and its share of
incremental costs for Cholla is
in the range of $5 million to
$40 million. APS expects to
incur certain of these costs
during 2016-2018 timeframe.
Cholla
Units 1-3
On April 26, 2017, APS’s BART Reassessment for
Cholla took effect, which avoids the need for
additional pollution controls. This BART
compliance approach required the closure of Unit
2 by April 2016 and the cessation of coal-burning
for Units 1 and 3 by April 2025.1
$8M
Navajo
Units 1-32
Up to ~$200M for SCRs and baghouses; on
March 20, 2017, the Ninth Circuit Court of
Appeals denied petitions for review challenging
this better-than-BART compliance alternative
Approximately $1 million Approximately $1 million
Note: Dollars shown at ownership. Estimates as of March 31, 2017.
• Cholla: Unit 1 is not BART-eligible; Unit 2 retired on October 1, 2015; Unit 4 is owned by PacifiCorp.
• SO2 NAAQS and greenhouse gas-related costs will be determined based upon EPA rule makings, with no spend occurring before 2016.
• ACI = Activated Carbon Injection; NAAQS = National Ambient Air Quality Standard; SCR = Selective Catalytic Reduction control
technology
1 Parties opposed to this BART compliance approach have until May 27, 2017 to file petitions for review in the Ninth Circuit as to EPA’s final
rule approving this approach.
2 On February 13, 2017, the co-owners of the Navajo Plant voted not to pursue continued operation beyond December 2019, the
expiration of the current lease term.

Powering Growth, Delivering Value17
Emissions
• 820 MW of coal has been retired including 560 MW at Four Corners Units 1-3 in 2013 and 260 MW at Cholla Unit 2
as of October 1, 2015.
• Four Corners: The 2013 transaction to purchase Southern California Edison’s ownership in Units 4 and 5 led to the
closure of units 1, 2 & 3. We are currently installing $400 million in pollution control equipment on Units 4 and 5
that is designed to reduce NOx emissions from those units up to 90%. When the new pollution control equipment
comes on line in 2018, the total NOx emissions from all APS power plants will be 83% lower than our total NOx
emissions were in 2012.
• Cholla Power Plant: Closure of Unit 2 as of October 1, 2015 will reduce mercury emissions by 51%, particulates
by 34%, NOx by 32%, and CO2 and SO2 by 23% each. We also announced plans to work with the U.S. EPA to stop
burning coal at our remaining Cholla units by the mid-2025.
• Navajo Generating Station: On February 13, 2017, the co-owners voted not to pursue continued operation of the
plant beyond December 2019, the expiration of the current lease term (2032 includes NGS generation).
COAL FLEET STRATEGY
APS’s proactive approach to
reducing emissions leads to coal’s
expected share of the energy mix
being reduced to 11%
13% 13%
12% 18%
25% 17%
21%
11%
29%
41%
2017 2032
P
e
r
c
e
n
t
o
f
P
o
r
t
f
o
l
i
o
M
W
h
Note: RE = Renewable Energy; DE = Distributed Energy; EE = Energy Efficiency
Data shown is based on the 2017 Integrated Resource Plan filed April 10, 2017.
Gas
Coal
Nuclear
RE + DE
EE
Powering Growth, Delivering Value18
WATER STRATEGY
APS, and Palo Verde in particular,
has provided national and
international leadership on the
use of reclaimed water for power
generation
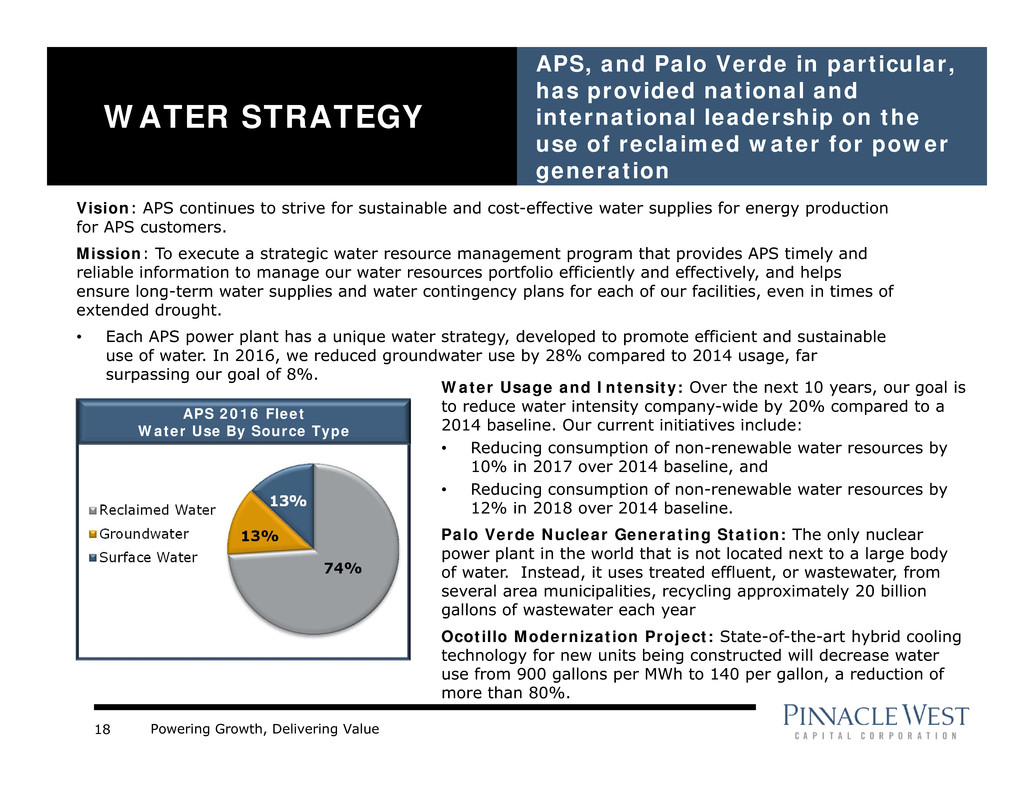
74%
13%
13%
Reclaimed Water
Groundwater
Surface Water
APS 2016 Fleet
Water Use By Source Type
Vision: APS continues to strive for sustainable and cost-effective water supplies for energy production
for APS customers.
Mission: To execute a strategic water resource management program that provides APS timely and
reliable information to manage our water resources portfolio efficiently and effectively, and helps
ensure long-term water supplies and water contingency plans for each of our facilities, even in times of
extended drought.
• Each APS power plant has a unique water strategy, developed to promote efficient and sustainable
use of water. In 2016, we reduced groundwater use by 28% compared to 2014 usage, far
surpassing our goal of 8%.
Water Usage and Intensity: Over the next 10 years, our goal is
to reduce water intensity company-wide by 20% compared to a
2014 baseline. Our current initiatives include:
• Reducing consumption of non-renewable water resources by
10% in 2017 over 2014 baseline, and
• Reducing consumption of non-renewable water resources by
12% in 2018 over 2014 baseline.
Palo Verde Nuclear Generating Station: The only nuclear
power plant in the world that is not located next to a large body
of water. Instead, it uses treated effluent, or wastewater, from
several area municipalities, recycling approximately 20 billion
gallons of wastewater each year
Ocotillo Modernization Project: State-of-the-art hybrid cooling
technology for new units being constructed will decrease water
use from 900 gallons per MWh to 140 per gallon, a reduction of
more than 80%.
Powering Growth, Delivering Value19
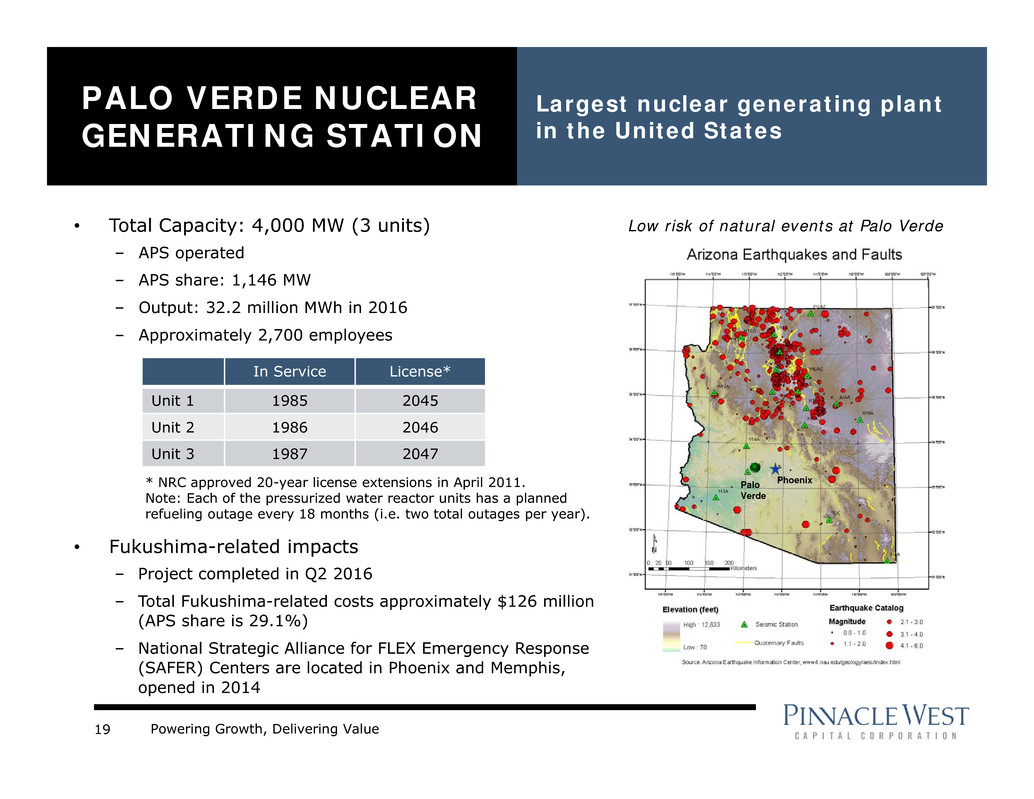
• Total Capacity: 4,000 MW (3 units)
– APS operated
– APS share: 1,146 MW
– Output: 32.2 million MWh in 2016
– Approximately 2,700 employees
• Fukushima-related impacts
– Project completed in Q2 2016
– Total Fukushima-related costs approximately $126 million
(APS share is 29.1%)
– National Strategic Alliance for FLEX Emergency Response
(SAFER) Centers are located in Phoenix and Memphis,
opened in 2014
PALO VERDE NUCLEAR
GENERATING STATION
Largest nuclear generating plant
in the United States
Palo
Verde
Phoenix
Low risk of natural events at Palo Verde
In Service License*
Unit 1 1985 2045
Unit 2 1986 2046
Unit 3 1987 2047
* NRC approved 20-year license extensions in April 2011.
Note: Each of the pressurized water reactor units has a planned
refueling outage every 18 months (i.e. two total outages per year).

Powering Growth, Delivering Value20
APS RATE CASE
Procedural Schedule
File Settlement Agreement
Direct Testimony in Support of/in Opposition to the
Settlement Agreement (All Parties)
Rebuttal Testimony in Support of/in Opposition to the
Settlement Agreement (All Parties)
Hearing Commencement Date
March 27, 2017
April 3, 2017
April 17, 2017
April 24, 2017
• Filed June 1, 2016
• Docket Number: E-01345A-16-0036
• Additional details, including filing, can be found at
http://www.azenergyfuture.com/rate-review/
Powering Growth, Delivering Value21
2017 PROPOSED RATE CASE SETTLEMENT
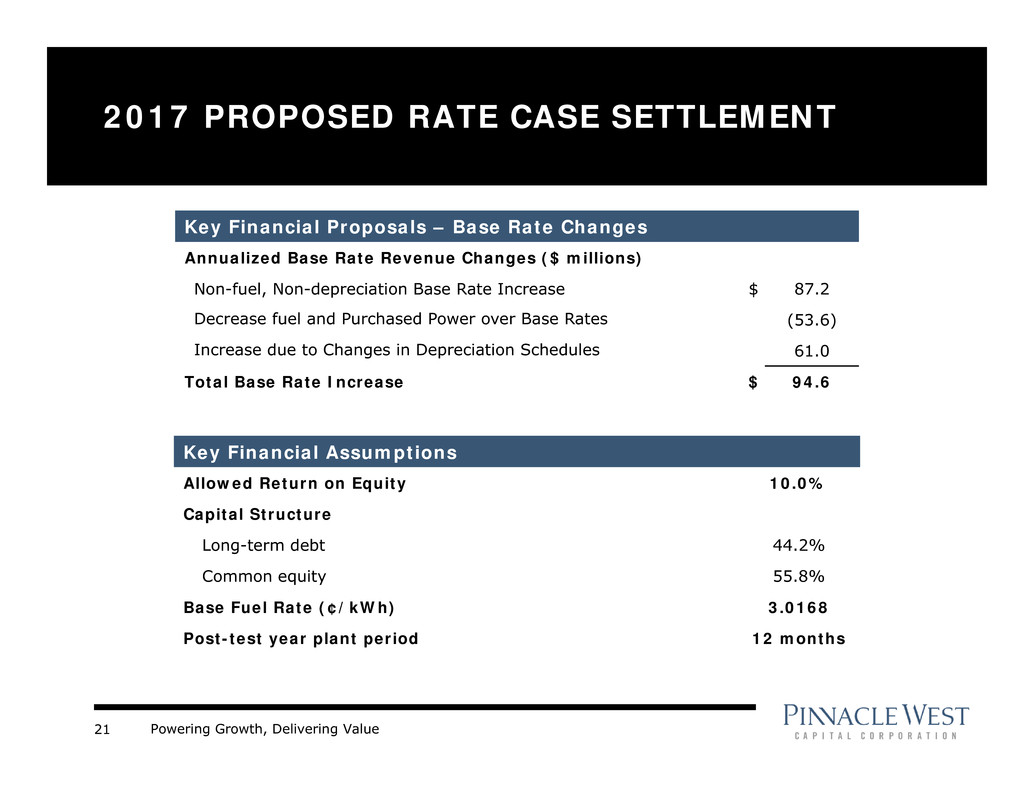
Key Financial Proposals – Base Rate Changes
Annualized Base Rate Revenue Changes ($ millions)
Non-fuel, Non-depreciation Base Rate Increase $ 87.2
Decrease fuel and Purchased Power over Base Rates (53.6)
Increase due to Changes in Depreciation Schedules 61.0
Total Base Rate Increase $ 94.6
Key Financial Assumptions
Allowed Return on Equity 10.0%
Capital Structure
Long-term debt 44.2%
Common equity 55.8%
Base Fuel Rate (¢/kWh) 3.0168
Post-test year plant period 12 months

Powering Growth, Delivering Value22
2017 PROPOSED RATE CASE SETTLEMENT
Key Proposals – Revenue Requirement
Four Corners • Cost deferral order from in-service dates to incorporation of SCRs in rates using a step-increase no later than January 1, 2019
Ocotillo Modernization
Project • Cost deferral order from in-service dates to effective date in next rate case
Power Supply Adjustor (PSA) • Modified to include certain environmental chemical costs and third-party battery storage
Property Tax Deferral • Defer for future recovery the Arizona property tax expense above or below the test year rate
Key Proposals – Rate Design
Lost Fixed Cost Recovery
(LFCR)
• Modified to be applied as a capacity (demand) charge per kW for customer with a demand rate and
as a kWh charge for customers with a two-part rate without demand
Environmental Improvement
Surcharge (EIS)
• Increase cumulative per kWh cap rate from $0.00016 to a new rate of $0.00050 and include a
balancing account
Time-of-Use Rates (TOU)
• Modified on-peak period for residential, and extra small through large general service of 3:00 pm –
8:00 pm weekdays
• After May 1, 2018, a new TOU rate will be the standard rate for all new customers (except small
use)
Distributed Generation
• New DG customers eligible for TOU rate with Grid Access Charge or Demand rates
• Resource Comparison Proxy (RCP) for exported energy of $0.129/kWh in year one
AZ Sun II
• Proposed new program for utility-owned solar distributed generation, recoverable through the
Renewable Energy Adjustment Clause (RES), to be no less than $10 million per year, and not more
than $15 million per year
Other Considerations
Rate Case Moratorium • No new general rate case application before June 1, 2019 (3-year stay-out)
Self-Build Moratorium
• APS will not pursue any new self-build generation (with exceptions) having an in-service date prior
to January 1, 2022 (extended to December 31, 2027 for combined-cycle generating units) unless
expressly authorized by the ACC

Powering Growth, Delivering Value23
APPENDIX
Powering Growth, Delivering Value24
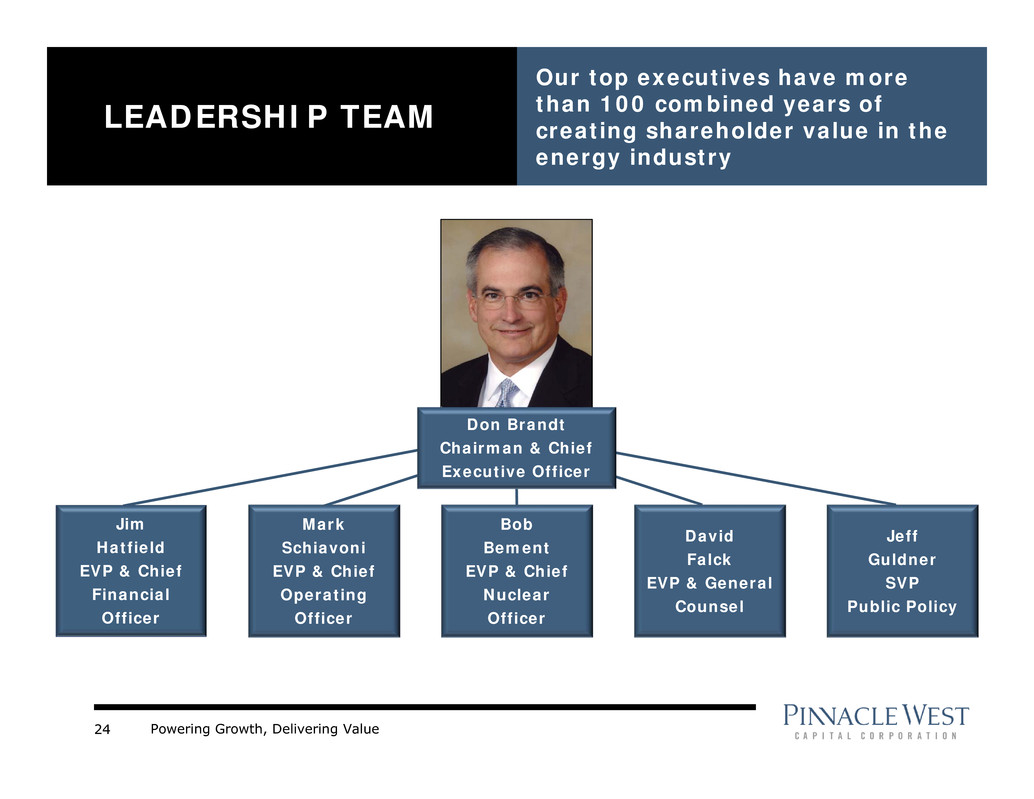
LEADERSHIP TEAM
Our top executives have more
than 100 combined years of
creating shareholder value in the
energy industry
Don Brandt
Chairman & Chief
Executive Officer
Mark
Schiavoni
EVP & Chief
Operating
Officer
David
Falck
EVP & General
Counsel
Bob
Bement
EVP & Chief
Nuclear
Officer
Jim
Hatfield
EVP & Chief
Financial
Officer
Jeff
Guldner
SVP
Public Policy
Powering Growth, Delivering Value25
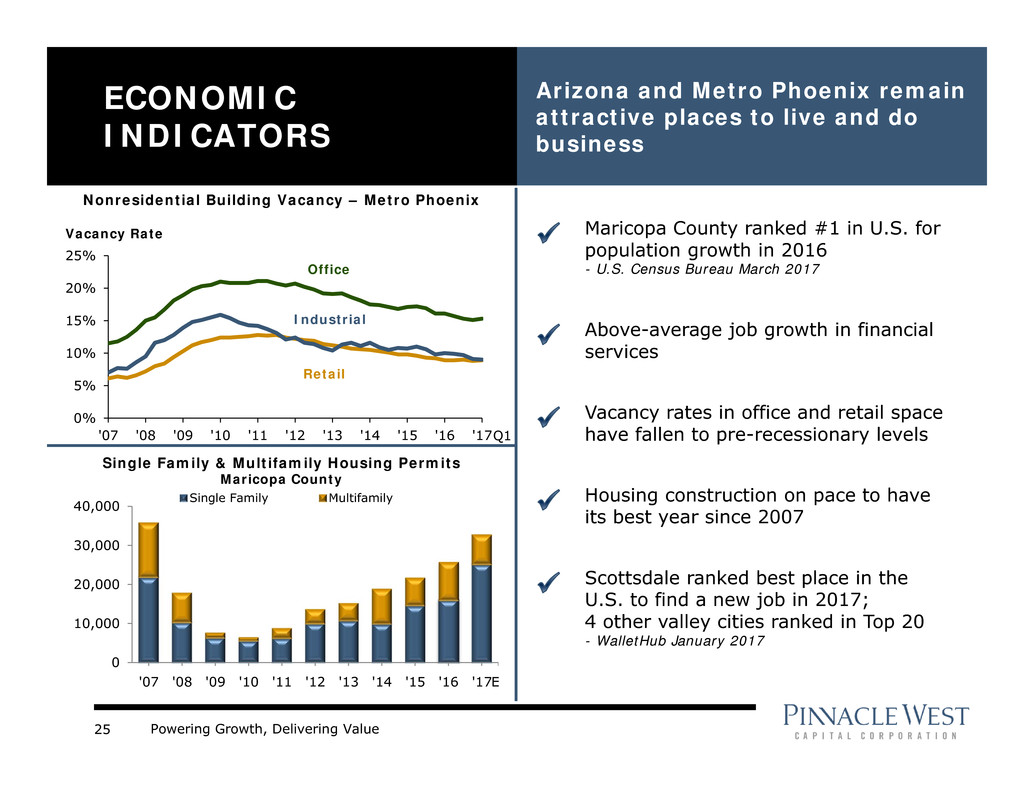
0
10,000
20,000
30,000
40,000
'07 '08 '09 '10 '11 '12 '13 '14 '15 '16 '17
Single Family Multifamily
ECONOMIC
INDICATORS
Arizona and Metro Phoenix remain
attractive places to live and do
business
Single Family & Multifamily Housing Permits
Maricopa County
Above-average job growth in financial
services
Maricopa County ranked #1 in U.S. for
population growth in 2016
- U.S. Census Bureau March 2017
E
Scottsdale ranked best place in the
U.S. to find a new job in 2017;
4 other valley cities ranked in Top 20
- WalletHub January 2017
Housing construction on pace to have
its best year since 2007
Vacancy rates in office and retail space
have fallen to pre-recessionary levels
0%
5%
10%
15%
20%
25%
'07 '08 '09 '10 '11 '12 '13 '14 '15 '16 '17
Nonresidential Building Vacancy – Metro Phoenix
Vacancy Rate
Office
Retail
Industrial
Q1
Powering Growth, Delivering Value26
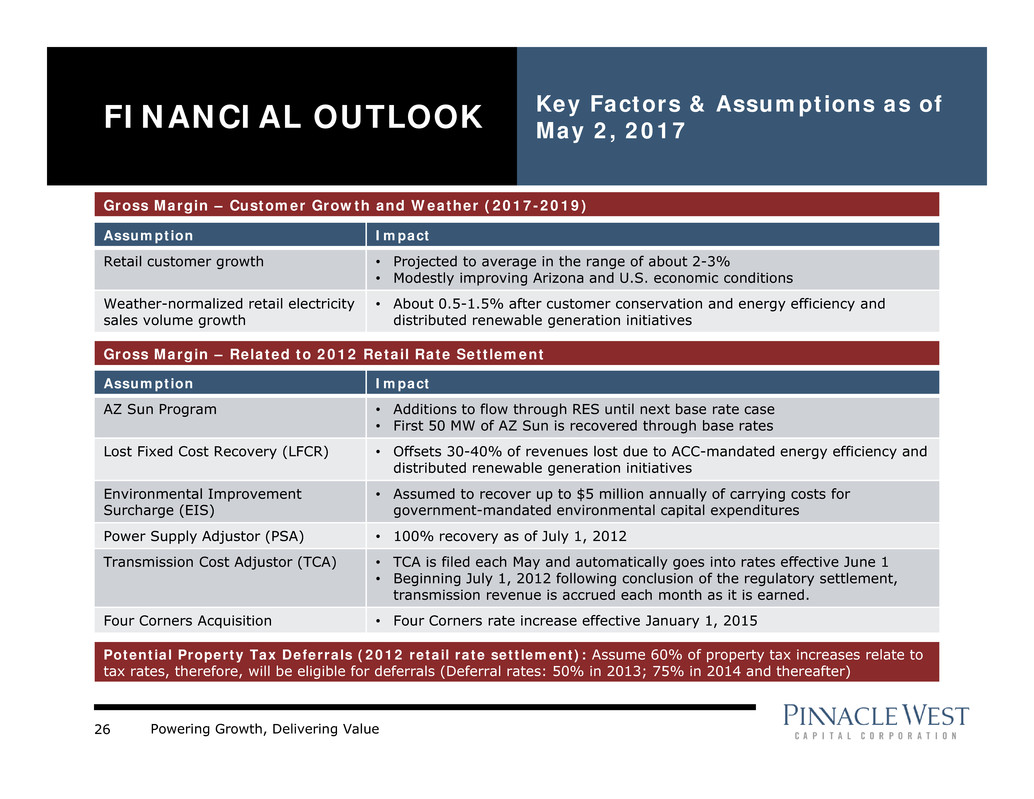
FINANCIAL OUTLOOK Key Factors & Assumptions as of May 2, 2017
Assumption Impact
Retail customer growth • Projected to average in the range of about 2-3%
• Modestly improving Arizona and U.S. economic conditions
Weather-normalized retail electricity
sales volume growth
• About 0.5-1.5% after customer conservation and energy efficiency and
distributed renewable generation initiatives
Assumption Impact
AZ Sun Program • Additions to flow through RES until next base rate case
• First 50 MW of AZ Sun is recovered through base rates
Lost Fixed Cost Recovery (LFCR) • Offsets 30-40% of revenues lost due to ACC-mandated energy efficiency and
distributed renewable generation initiatives
Environmental Improvement
Surcharge (EIS)
• Assumed to recover up to $5 million annually of carrying costs for
government-mandated environmental capital expenditures
Power Supply Adjustor (PSA) • 100% recovery as of July 1, 2012
Transmission Cost Adjustor (TCA) • TCA is filed each May and automatically goes into rates effective June 1
• Beginning July 1, 2012 following conclusion of the regulatory settlement,
transmission revenue is accrued each month as it is earned.
Four Corners Acquisition • Four Corners rate increase effective January 1, 2015
Potential Property Tax Deferrals (2012 retail rate settlement): Assume 60% of property tax increases relate to
tax rates, therefore, will be eligible for deferrals (Deferral rates: 50% in 2013; 75% in 2014 and thereafter)
Gross Margin – Customer Growth and Weather (2017-2019)
Gross Margin – Related to 2012 Retail Rate Settlement

Powering Growth, Delivering Value27
OPERATIONS &
MAINTENANCE
Goal is to keep O&M per kWh flat,
adjusted for planned outages
$754 $761 $788
$805 $772
$828
$150 $124
$137 $103
$96
$83
2011 2012 2013 2014 2015 2016
PNW Consolidated RES/DSM*
*Renewable energy and demand side management expenses are offset by adjustment mechanisms.
($ Millions)

Powering Growth, Delivering Value28
Credit Ratings
• A- or equivalent ratings or better at S&P, Moody’s
and Fitch
2017 Major Financing Activities
• $250 million re-opening in March of APS’s
outstanding 4.35% senior unsecured notes due
November 2045
• Currently expect up to $600 million of long-term
debt issuance from two transactions, one at PNW
(including refinancing of its $125 million term loan)
and one at APS
We are disclosing credit ratings to enhance understanding of
our sources of liquidity and the effects of our ratings on our
costs of funds.
BALANCE SHEET STRENGTH
$50
$600
$250
$125
$-
$100
$200
$300
$400
$500
$600
2017 2018 2019 2020
APS PNW
($Millions)
Debt Maturity Schedule

Powering Growth, Delivering Value29
2011 2012 2013 2014 2015 2016
APS
FFO / Debt 23.6% 27.7% 31.5% 27.5% 29.7% 26.5%
FFO / Interest 4.2x 4.8x 5.6X 5.5x 5.8x 5.0x
Debt /
Capitalization 52.9% 50.7% 47.7% 45.3% 45.8% 47.8%
Pinnacle West
FFO / Debt 23.0% 26.7% 29.8% 26.5% 28.9% 25.1%
FFO / Interest 3.8x 4.4x 4.9X 5.2x 5.6x 4.9x
Debt /
Capitalization 54.4% 52.1% 49.1% 46.7% 47.0% 49.1%
CREDIT RATINGS AND
METRICS
Key credit metrics remain strong
Source: Standard & Poor’s
APS Parent
Corporate Credit Ratings
Moody’s A2 A3
S&P A- A-
Fitch A- A-
Senior Unsecured
Moody’s A2 -
S&P A- -
Fitch A -
Note: Moody’s, S&P, and Fitch all rate
Outlook for APS and Parent as “Stable”
We are disclosing credit ratings to enhance
understanding of our sources of liquidity and the
effects of our ratings on our costs of funds.

Powering Growth, Delivering Value30
• 10-Year Transmission Plan filed January 2017
(115 kV and above)
– 52 miles of new lines
– 5 bulk transformer additions
• Also includes:
– Sun Valley-Morgan 500kV (2018)
– North Gila-Orchard 230kV (2021)
• 2 of 3 Projects to deliver renewable energy
approved by ACC have been completed
• Transmission investment diversifies regulatory
risk
– Constructive regulatory treatment
– FERC formula rates and retail adjustor
APS TRANSMISSION
Strategic transmission investment
is essential to maintain reliability
and deliver diversified resources
to customers
Legend
Planned lines
Existing lines
Solar potential area
Wind potential area
Phoenix
Flagstaff
Tucson

Powering Growth, Delivering Value31
BRIGHT CANYON ENERGY
TRANSCANYON
A 50/50 Joint Venture formed with BHE U.S.
Transmission, a subsidiary of Berkshire Hathaway
Energy, to develop, build and own transmission
infrastructure for the western United States. In
2016, formed a strategic alliance with Pacific Gas
and Electric Company to jointly pursue competitive
transmission opportunities solicited by the California
Independent System Operator (CAISO)
BRIGHT CANYON ENERGY
Pinnacle West subsidiary formed to pursue long-term
growth opportunities in the electric energy industry

Powering Growth, Delivering Value32
Terms to January 2019
Other State Officials
ARIZONA CORPORATION COMMISSION
* Term limited - elected to four-year terms (limited to two consecutive)
Tom
Forese (R)
Chairman
Doug
Little (R)
ACC Executive Director – Ted Vogt
RUCO Director – David Tenney
Terms to January 2020
Bob
Burns (R)*
Andy
Tobin (R)
Boyd
Dunn (R)

Powering Growth, Delivering Value33
2017 KEY DATES
ACC Key Dates / Docket # Q1 Q2 Q3 Q4
Key Recurring Regulatory Filings
Lost Fixed Cost Recovery
E-01345A-11-0224 Jan 15
Transmission Cost Adjustor
E-01345A-11-0224 May 15
2018 DSM/EE Implementation Plan Jun 1
2018 RES Implementation Plan for Reset
of Renewable Energy Adjustor Jul 1
APS Rate Case
E-01345A-16-0036 --------------- See Slide 20 ---------------
Resource Planning and Procurement
E-00000V-15-0094
April 10: Final 2017
IRP Oct 1: Staff Report Due
Reducing System Peak Demand Costs
E-00000J-16-0257 --------------- TBD ---------------
Review, Modernization and Expansion of
Arizona Renewable Energy Standards
E-00000Q-16-0289
Jun 7: Workshop
Investigation Concerning the Future of
the Navajo Generating Station
E-00000C-17-0039
--------------- TBD ---------------
ACC Open Meetings ACC Open Meetings Held Monthly
Other Key Dates Q1 Q2 Q3 Q4
Arizona State Legislature In session Jan 9 – End of Q2

Powering Growth, Delivering Value34
ROOFTOP SOLAR CUSTOMERS USE THE GRID
24 HOURS PER DAY
TYPICAL GRID INTERACTION FOR ROOFTOP SOLAR
• Customers with rooftop solar systems do not pay for all of the electric services they use
• These unpaid costs are then paid by other customers (through higher rates) that can’t have or don’t
want solar
• This issue will only get bigger over time

Powering Growth, Delivering Value35
RESIDENTIAL VS.
UTILITY-SCALE SOLAR
Performance at system peak
On June 19th, APS customers hit “peak demand” for 2016 using more than 7,400 MW of electricity
• Noon: Customer demand still increasing; rooftop
solar peaks and begins to decline
• 5:30PM: Customer demand peaks; rooftop solar
producing at 28% of total capacity
• 7:30PM: Rooftop output at zero, but demand still
above 6,900 MW of power
• Solar panels at 8 of the AZ Sun plants rotate to
track the sun, achieving highest production earlier
in the day and maintaining it later
• At peak demand, utility-scale solar producing at
72% of total capacity
Residential Rooftop Solar AZ Sun Utility-Scale Solar
235
80
0
6,093
7,445
6,908
0
2,000
4,000
6,000
8,000
0
100
200
300
400
500
1 2 3 4 5 6 7 8 9 10 11 12 13 14 15 16 17 18 19 20 21 22 23 24
M
W
Hour Ending
123
7445
0
2,000
4,000
6,000
8,000
0
100
200
300
400
500
1 2 3 4 5 6 7 8 9 10 11 12 13 14 15 16 17 18 19 20 21 22 23 24
M
W
Hour Ending
AZ Sun
System Load
Residential Rooftop
System Load

Powering Growth, Delivering Value36
249
357 339
442
610
710 641
783
871 939
523
836
484
680
832
715
1,157 1,158
1,349
1,141
1,002
1,189
1,077
1,168
1,154
760
1,268
1,003
1,293
1,415 1,374
2,051
1,644
1,489
1,348
1,5471,616
1,809
2,182
0
250
500
750
1,000
1,250
1,500
1,750
2,000
2,250
2,500
Jan Feb Mar Apr May Jun Jul Aug Sep Oct Nov Dec
2014 Applications 2015 Applications 2016 Applications 2017 Applications
* Monthly data equals applications received minus cancelled applications. As of March 31, 2017 approximately 58,000
residential grid-tied solar photovoltaic (PV) systems have been installed in APS’s service territory, totaling more than 445
MWdc of installed capacity. Excludes APS Solar Partner Program residential PV systems.
Note: www.arizonagoessolar.org logs total residential application volume, including cancellations. Solar water heaters can also be found
on the site, but are not included in the chart above.
RESIDENTIAL PV
APPLICATIONS* 10 18 22 44 51
57
74
133
34
2009 2011 2013 2015 2017
Residential DG (MWdc) Annual Additions
Q1

Powering Growth, Delivering Value37
• Cumulative savings from energy
efficiency programs must be equivalent
to 22% of annual retail sales by 2020
• Annual milestones in place to measure
progress toward cumulative 2020 goal
– 14.5% by 2017
– 22% by 2020
ARIZONA’S RENEWABLE RESOURCE AND
ENERGY EFFICIENCY STANDARDS
• Portion of retail sales to be supplied by
renewable resources*
– 7% by 2017
– 15% by 2025
• Distributed energy component
– 30% of total requirement
Energy Efficiency RequirementsRenewable Energy (RES) Requirements
APS currently on track to meet target APS currently on track to meet target
* Represents portion of retails sales to be supplied by renewable resources in compliance with the Arizona Renewable Energy Standard and
Tariff (RES). Total portion of retail sales to be supplied by renewable resources in 2017 expected to be 11%.

Powering Growth, Delivering Value38
500
550
600
650
700
750
OPERATIONAL EXCELLENCE
30.230.430.4
30.8 30.6
31.231.3
31.9
31.4
32.332.532.2
20
22
24
26
28
30
32
34
1998 2001 2004 2007 2010 2013 2016
108
97
65
58
47
35
44 43
32
0
30
60
90
120
2008 2009 2010 2011 2012 2013 2014 2015 2016
Palo Verde
Palo Verde is the only plant in the U.S. to exceed 30M MW
of annual production.
Safety
APS achieved another safe year in 2016. APS ranks in the
Top Decile of electric utility companies.
0
20
40
60
80
100
120
140
160
2008 2009 2010 2011 2012 2013 2014 2015 2016
APS
Industry Average
Power Quality and Reliability
Ranked 9th highest nationally among 53 large investor-owned electric
utilities in 2016 J.D. Power residential customer survey.
Lowering Outage Time Per Customer
Well below industry average over past several years.
A
v
e
r
a
g
e
O
u
t
a
g
e
M
i
n
u
t
e
s
/
Y
e
a
r
M
i
l
l
i
o
n
M
e
g
a
w
a
t
t
H
o
u
r
s
R
a
t
i
n
g
Industry Average
APS

Powering Growth, Delivering Value39
GENERATION PORTFOLIO*
Plant Location No. of Units Dispatch COD Ownership Interest1 Net Capacity (MW)
NUCLEAR
1,146 MW Palo Verde Wintersburg, AZ 3 Base 1986-1989 29.1% 1,146
COAL
1,672 MW
Cholla Joseph City, AZ 2 Base 1962-1980 100 387
Four Corners Farmington, NM 2 Base 1969-1970 63 970
Navajo Page, AZ 3 Base 1974-1976 14 315
GAS - COMBINED CYCLE
1,871 MW
Redhawk Arlington, AZ 2 Intermediate 2002 100 984
West Phoenix Phoenix, AZ 5 Intermediate 1976-2003 100 887
GAS - STEAM TURBINE
220 MW Ocotillo Tempe, AZ 2 Peaking 1960 100 220
GAS / OIL
COMBUSTION TURBINE
1,088 MW
Sundance Casa Grande, AZ 10 Peaking 2002 100 420
Yucca Yuma, AZ 6 Peaking 1971-2008 100 243
Saguaro Red Rock, AZ 3 Peaking 1972-2002 100 189
West Phoenix Phoenix, AZ 2 Peaking 1972-1973 100 110
Ocotillo Tempe, AZ 2 Peaking 1972-1973 100 110
Douglas Douglas, AZ 1 Peaking 1972 100 16
SOLAR
239 MW
Hyder & Hyder II Hyder, AZ - As Available 2011-2013 100 30
Paloma Gila Bend, AZ - As Available 2011 100 17
Cotton Center Gila Bend, AZ - As Available 2011 100 17
Chino Valley Chino Valley, AZ - As Available 2012 100 19
Foothills Yuma, AZ - As Available 2013 100 35
Distributed Energy Multiple AZ Facilities - As Available Various 100 25
Gila Bend Gila Bend, AZ - As Available 2015 100 32
Luke Air Force Base Glendale, AZ - As Available 2015 100 10
Desert Star Buckeye, AZ - As Available 2015 100 10
Red Rock Red Rock, AZ - As Available 2016 100 40
Various Multiple AZ Facilities - As Available 1996-2006 100 4
Total Generation Capacity 6,236 MW
1 Includes leased generation plants* As disclosed in 2016 Form 10-K.

Powering Growth, Delivering Value40
PURCHASED POWER CONTRACTS*
Contract Location Owner/Developer Status1 PPA Signed COD Term (Years) Net Capacity (MW)
SOLAR
310 MW
Solana Gila Bend, AZ Abengoa IO Feb-2008 2013 30 250
RE Ajo Ajo, AZ Duke Energy Gen Svcs IO Jan-2010 2011 25 5
Sun E AZ 1 Prescott, AZ SunEdison IO Feb-2010 2011 30 10
Saddle Mountain Tonopah, AZ SunEdison IO Jan - 2011 2012 30 15
Badger Tonopah, AZ PSEG IO Jan-2012 2013 30 15
Gillespie Maricopa County, AZ Recurrent Energy IO Jan-2012 2013 30 15
WIND
289 MW
Aragonne Mesa Santa Rosa, NM Ingifen Asset Mgmt IO Dec-2005 2006 20 90
High Lonesome Mountainair, NM Foresight / EME IO Feb-2008 2009 30 100
Perrin Ranch Wind Williams, AZ NextEra Energy IO Jul-2010 2012 25 99
GEOTHERMAL
10 MW Salton Sea Imperial County, CA Cal Energy IO Jan-2006 2006 23 10
BIOMASS
14 MW Snowflake Snowflake, AZ Novo Power IO Sep-2005 2008 15 14
BIOGAS
6 MW
Glendale Landfill Glendale, AZ Glendale Energy LLC IO Jul-2008 2010 20 3
NW Regional Landfill Surprise, AZ Waste Management IO Dec-2010 2012 20 3
INTER-UTILITY
540 MW
PacifiCorp Seasonal
Power Exchange - PacifiCorp IO Sep-1990 1991 30 480
Not Disclosed Not Disclosed Not Disclosed IO May-2009 2010 10 60
CONVENTIONAL
TOLLING
1,639 MW
CC Tolling Not Disclosed Not Disclosed IO Mar-2006 2007 10 514
CC Tolling Not Disclosed Not Disclosed IO Aug-2007 2010 10 560
CC Tolling Arlington, AZ Arlington Valley IO Dec-2016 2020 6 565
DEMAND RESPONSE
25 MW Demand Response Not Disclosed Not Disclosed IO Sep-2008 2010 15 25
Total Contracted Capacity 2,833 MW
1 UD = Under Development; UC = Under Construction; IO = In Operation* As disclosed in 2016 Form 10-K.

Powering Growth, Delivering Value41
INVESTOR RELATIONS CONTACTS
Paul J. Mountain, CFA
General Manager, Investor Relations & Audit Services
(602) 250-4952
paul.mountain@pinnaclewest.com
Ted Geisler
Director, Investor Relations
(602) 250-3200
ted.geisler@pinnaclewest.com
Chalese Haraldsen
(602) 250-5643
chalese.haraldsen@pinnaclewest.com
Pinnacle West Capital Corporation
P.O. Box 53999, Mail Station 9998
Phoenix, Arizona 85072-3999
Visit us online at: www.pinnaclewest.com
