Attached files
| file | filename |
|---|---|
| 8-K - FORM 8-K - MIDDLEFIELD BANC CORP | d376944d8k.htm |
 Exhibit
99.1 Annual Shareholder
Meeting May 10, 2017
Middlefield Banc Corp. |
 Forward Looking Statements This presentation contains forward-looking statements within the meaning of the Securities Exchange Act of 1934 and the Private Securities Litigation Reform Act of 1995 concerning Middlefield Banc Corp.’s plans, strategies, objectives, expectations, intentions, financial condition and results of operations. These forward-looking statements reflect management’s current views and intentions and are subject to known and unknown risks, uncertainties, assumptions and other factors that could cause the actual results to differ materially from those contemplated by the statements. The significant risks and uncertainties related to Middlefield Banc Corp. of which management is aware are discussed in detail in the periodic reports that Middlefield Banc Corp. files with the Securities and Exchange Commission (the “SEC”), including in the “Risk Factors” section of its Annual Report on Form 10-K and its Quarterly Report on Form 10-Q. Investors are urged to review Middlefield Banc Corp.’s periodic reports, which are available at no charge through the SEC’s website at www.sec.gov and through Middlefield Banc Corp.’s website at www.middlefieldbank.bank on the “Investor Relations” page. Middlefield Banc Corp. assumes no obligation to update any of these forward-looking statements to reflect a change in its views or events or circumstances that occur after the date of this presentation. 2 |
 Board of Directors Thomas W. Beavan Thomas G. Caldwell James R. Heslop, II Eric W. Hummel Kenneth E. Jones Darryl E. Mast Clayton W. Rose, III James J. McCaskey William J. Skidmore Robert W. Toth Carolyn J. Turk William Valerian 3 |
 Experienced Management Team Management Position Age With MBCN Since Years In Industry Thomas G. Caldwell President & CEO 59 1986 40 Donald L. Stacy EVP & CFO 63 1999 36 James R. Heslop, II EVP & COO 63 1996 38 Teresa M. Hetrick EVP – Operations/Administration 53 1996 29 Alfred F. Thompson, Jr. VP – Loan Administration 57 1996 31 Courtney M. Erminio SVP - Risk Officer 35 2010 14 Shalini Singhal Chief Information Officer 41 2016 14 Eric P. Hollinger EVP/Senior Lender 55 2013 24 Charles O. Moore President – Central Ohio Region 55 2016 30 4 |
 Meeting Overview Welcome to the Middlefield Banc Corp. 2017 Annual Shareholder Meeting
Company Snapshot
(1)(2)
NASDAQ:
MBCN
Stock Price:
$45.75
Market Cap:
$128.1
million
Dividend (yield):
$1.08 (2.4%)
Headquarters:
Middlefield, Ohio
Established:
Bank 1901/HC 1988
Branches:
14
Total
Assets:
$1,071.6
million
Net Loans
$830.4
million
Total Deposits:
$849.9
million
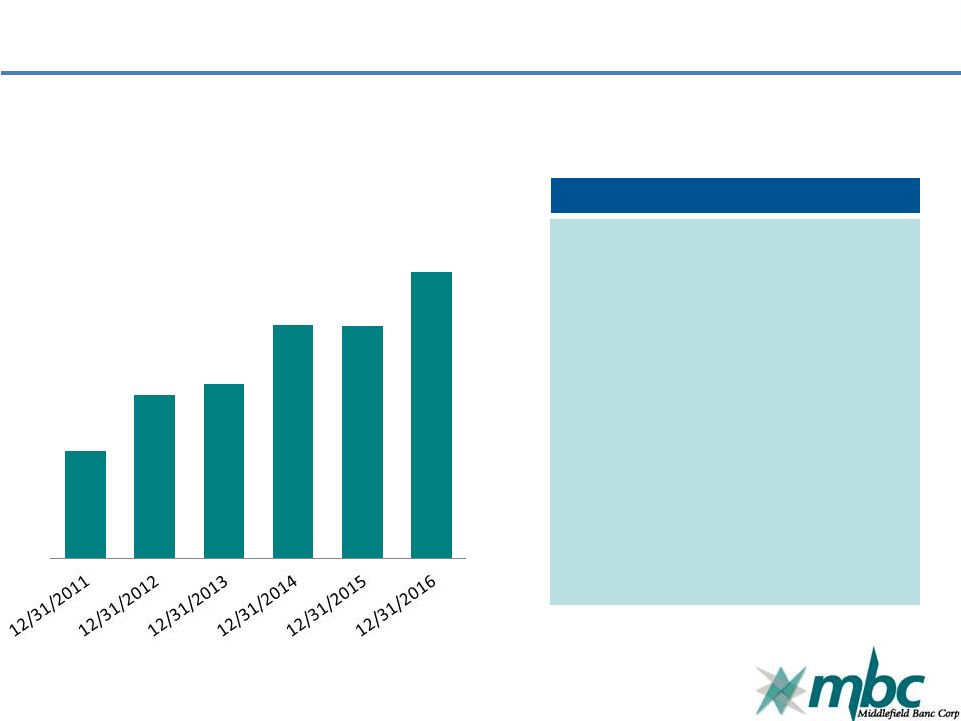
(1) Stock price, market cap and dividend yield as of April 28, 2017 (2) Financial figures for the period ended March 31, 2016 5 $14.38 $21.85 $23.36 $31.28 $31.16 $38.44 Stock Price |
 6 CEO Report |
 Business Overview Ended 2016 with record assets and loans outstanding. Over $1 billion in assets at end of Q1 Announced Liberty Bank acquisition July 2016 and closed acquisition January 2017 Profitable throughout the economic cycle and never reported a quarterly loss History of quarterly cash dividend payments, and increased dividend amount in 2016 Excellent asset quality, strong liquidity profile, and robust core deposit base Strong returns and efficiency ratios Two strong Ohio banking markets For over 115 years, Middlefield Banc Corp. has supported its communities by offering customers superior financial products, exceptional service, and modern banking amenities 7 |
 Recent Events and Growth Strategies Executing Growth Oriented Strategic Plan Expand Ohio De Novo Growth • Focus on high growth markets, with favorable demographics Grow Market Share • Increased advertising budget • Exploit changing market dynamics Generate Fee Income • Secondary mortgages • Financial services Enhance Team • New Central Ohio President • Invest in new lending officers Invest in Technology • Enhance online banking • Grow mobile Seek Attractive Acquisitions • Accelerate growth in similar markets • Generate strong payback 8 |
 Liberty Bank N.A. Overview ROAA (%) Average Total Assets (in millions) Net Income (in millions) 0.36% 0.67% 1.46% 0.86% 1.01% 0.0% 0.5% 1.0% 1.5% 2.0% 2012 2013 2014 2015 2016 $0.8 $1.4 $3.0 $1.8 $2.3 $- $1.0 $2.0 $3.0 $4.0 2012 2013 2014 2015 2016 $208.2 $205.0 $207.7 $209.6 $230.1 $187.5 $195.0 $202.5 $210.0 $217.5 $225.0 $232.5 2012 2013 2014 2015 2016 Founded in 1990 by a group of local business owners to more effectively serve the needs of business and personal clients Three Ohio branches located in Beachwood, Twinsburg, and Solon 5-star "Superior" rating from Bauer Financial, Inc. Preferred Lender for the Small Business Administration 9 |
 Branch Locations 10 Northeast Ohio Central Ohio Middlefield Bank Locations Acquired Liberty Bank Locations Future Powell Location |
 2017 Ranking Source: (1) American Banker April 28, 2017 http://www.americanbanker.com/ American Banker (1) Middlefield Banc Corp. was ranked 85 th out of the top 200 community banks and thrifts by 3-year Avg. ROE according to an April 28, 2017 American Banker article.
Of the top 200, 16 Ohio financial institutions made the list and Middlefield
ranked 6
th in Ohio-based institutions. 11 |
 Financial Summary Dollars in thousands 2011 2012 2013 2014 2015 2016 Net interest income 21,075 22,299 22,928 23,804 24,775 25,804 Provision for loan losses 3,085 2,168 196 370 315 570 Noninterest income 2,237 3,451 3,145 3,588 4,044 3,959 Noninterest expense 15,501 15,639 16,870 17,850 20,077 20,872 Income before income taxes 4,726 7,943 9,007 9,172 8,427 8,321 Income taxes 596 1,662 1,979 1,992 1,562 1,905 Net income 4,130 6,281 7,028 7,180 6,865 6,416 Net interest margin 3.65% 3.74% 3.85% 3.93% 3.94% 3.79% Total assets 654,551 670,288 647,090 677,531 735,139 787,821 Loans outstanding, net 395,061 400,654 428,679 463,738 527,325 602,542 Deposits 580,962 593,335 568,836 586,112 624,447 629,934 Equity capital 47,253 55,437 53,473 63,867 62,304 76,960 Earnings per share 2.45 3.29 3.48 3.52 3.41 3.04 Cash dividend (per share) 1.04 1.04 1.04 1.04 1.07 1.08 Dividend pay-out ratio 42.71% 31.87% 29.84% 29.54% 30.90% 36.13% Return on average assets 0.65% 0.95% 1.06% 1.07% 0.97% 0.85% Return on average equity 10.24% 11.98% 13.17% 12.17% 10.62% 9.33% 12 |
 Annual Profitability $4.1 $6.3 $7.0 $7.2 $6.9 $6.4 2011 2012 2013 2014 2015 2016 $2.45 $3.29 $3.48 $3.52 $3.41 $3.04 2011 2012 2013 2014 2015 2016 Net Income (In millions) Earnings Per Share MBCN has been consistently profitable through the economic cycle
and has never reported a quarterly loss.
13 |
 Annual Returns Return on Average Equity Return on Average Assets 10.24% 11.98% 13.17% 12.17% 10.62% 9.33% 2011 2012 2013 2014 2015 2016 0.65% 0.95% 1.06% 1.07% 0.97% 0.85% 2011 2012 2013 2014 2015 2016 14 |
 Strong Market Demographics Market Rank Company Total Median Median Value Unemployment Based on Deposits in Population Household Owner-Occupied Rate Share of Market July 2016 Income Housing Units March County Deposits ($000) (1) (est.) (2) 2015 ($) (2) 2014 ($) (2) 2017 (%) (3) Geauga 1 393,049 94,060 75,895 219,500 5.7 Geauga County has the 3rd highest median household income in the State. Portage 6 101,791 161,921 52,835 149,300 5.6 Franklin 25 57,071 1,264,518 53,882 150,000 3.9 Trumbull 10 49,744 201,825 42,368 97,700 9.2 Ashtabula 7 30,534 98,231 44,511 107,300 6.5 Aggregate: Entire State of Ohio 11,614,373 51,075 129,600 5.3 Aggregate: National 323,148,587 55,775 175,700 4.5 (1) Obtained from the FDIC's Summary of Deposits data, as of June 30, 2016 (www.fdic.gov).
(2)
Information from the U. S. Census Bureau
(https://www.census.gov/data/datasets/2016/demo/popest/counties-total.html). (3) Sourced from Bureau of Labor Statistics (data.bls.gov - March 2017). Majority of offices and deposits are located in counties that have
stronger demographics than the State averages (median
household income, median value of
owner-occupied housing, and
employment rates). 15 |
 Deposit Market Share Ashtabula, Geauga, Portage & Trumbull Counties
June 30, 2016
Rank in
Market
Institution
Number of
Branches
Total Deposits
in
Market ($M)
Total Market
Share (%)
1
The Huntington National Bank
44
1,880,282
23.68
2
JP Morgan Chase Bank, N.A.
17
1,015,937
12.80
3
The Middlefield Banking Company
8
575,118
7.24
4
PNC Bank, National Association
12
553,340
6.97
5
Key Bank, National Association
15
547,328
6.89
6
Chemical Financial Corp.
10
538,876
6.79
7
Cortland Savings & Banking Co.
10
420,008
5.29
8
Citizens Financial Group Inc.
5
291,383
3.67
Total for institutions
in Market
182
7,939,259
16 |
 Annual Loan Growth (1) $602.5 $527.3 $463.8 $428.7 $400.7 $395.1 2016 2015 2014 2013 2012 2011 (1) Dollars in millions 17 |
 Loan Portfolio 8% 4% 44% 43% 1% 18 December 31, 2015 December 31, 2016 Commercial & Industrial Real Estate – Construction Residential Mortgage Commercial Mortgage Consumer Installment 4% 44% 41% 1% 10% |
 Asset Quality 2012 2013 2014 2015 2016 Nonperforming Loans $14,224 $12,290 $9,048 $10,263 $7,075 Real Estate Owned 1,846 2,698 2,590 1,412 934 Nonperforming Assets $16,070 $14,988 $11,638 $11,675 $8,009 Nonperforming Assets/ Total Assets (%) 2.40% 2.32% 1.72% 1.59% 1.02% Allowance for Loan Losses $7,779 $7,046 $6,846 $6,385 $6,598 Allowance/Total Loans (%) 1.90% 1.62% 1.45% 1.20% 1.08% Net Charge-off Ratio (%) 0.30% 0.22% 0.13% 0.16% 0.06% Strong reserve coverage provides flexibility in managing potential losses with reduced impact on net
income. 19 |
 Managed Deposit Growth (1) $581.0 $593.3 $568.8 $586.1 $624.4 $629.9 2011 2012 2013 2014 2015 2016 (1) Dollars in millions 20 |
 Strong Core Deposit Base 19% 13% 30% 9% 29% 21 December 31, 2015 December 31, 2016 Non-interest bearing Demand Money Market Time Interest Bearing Demand Savings 12% 30% 9% 27% 21% |
 Capital Ratios at December 31, 2016 To Be Well Capitalized Middlefield Banc Corp. The Middlefield Banking Company Tier 1 Risk-Based Capital 8.00% 13.07% 13.03% Total Risk-Based Capital 10.00% 15.75% 14.25% Tier 1 Leverage Capital 5.00% 9.27% 9.46% All capital ratios exceed regulatory requirements to qualify as well capitalized.
22 |
 Operating Initiatives Personnel/Talent Strong management to drive performance growth Sales-orientation and cultural fit Operations/Risk Management Expanded technology Scaled to support growth initiatives Diligent risk management incorporating regulatory
environment
Expand Share of Market/Share of Customer
Identify target markets and customer
segments Commercial relationship
opportunities De novo expansion and
strategic acquisitions 23 |
 Today’s Banking Landscape High level of competition for share of wallet Increasing regulatory concerns with added costs
for smaller banks
Industry continues to consolidate
Economic challenges and slow growth
Rising rate environment
24 |
 2017 and Forward Integrate Liberty Bank Acquisition Execute against Strategic Plan: Market position Product and service offerings Growth initiatives Continue to Expand Share of Market/Share of Customer
Identify target markets and customer
segments Commercial relationship
opportunities De novo expansion and
strategic acquisitions 25 |
 Questions, Comments, and Discussion 26 |
 Voting Results Election of four Directors to serve until the 2020 annual meeting Election of one Director to serve until the 2018 annual meeting Approve 2017 omnibus equity plan Non-binding proposal on compensation Ratification of appointment of S.R. Snodgrass, P.C. 27 |
 Thank you for your support! May 10, 2017 28 |