Attached files
| file | filename |
|---|---|
| EX-99.1 - EXHIBIT 99.1 - HMS HOLDINGS CORP | exh_991.htm |
| 8-K - FORM 8-K - HMS HOLDINGS CORP | f8k_051017.htm |
EXHIBIT 99.2
May 10, 2017 Q1 2017 Investor Presentation
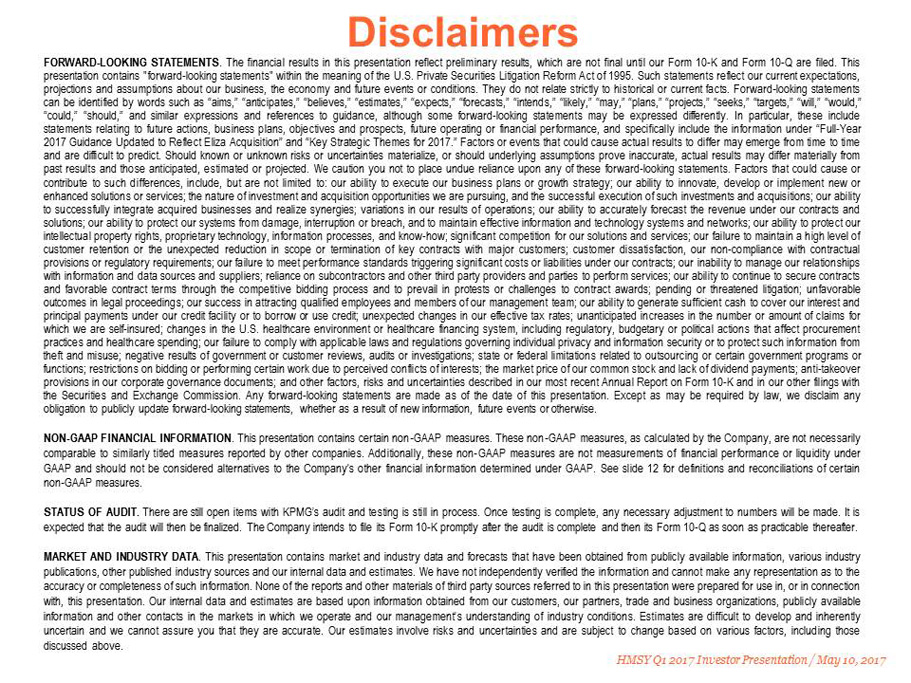
Disclaimers FORWARD - LOOKING STATEMENTS . The financial results in this presentation reflect preliminary results, which are not final until our Form 10 - K and Form 10 - Q are filed . This presentation contains "forward - looking statements" within the meaning of the U . S . Private Securities Litigation Reform Act of 1995 . Such statements reflect our current expectations, projections and assumptions about our business, the economy and future events or conditions . They do not relate strictly to historical or current facts . Forward - looking statements can be identified by words such as “aims,” “anticipates,” “believes,” “estimates,” “expects,” “forecasts,” “intends,” “likely,” “may,” “plans,” “projects,” “seeks,” “targets,” “will,” “would,” “could,” “should,” and similar expressions and references to guidance, although some forward - looking statements may be expressed differently . In particular, these include statements relating to future actions, business plans, objectives and prospects, future operating or financial performance, and specifically include the information under “Full - Year 2017 Guidance Updated to Reflect Eliza Acquisition” and “Key Strategic Themes for 2017 . ” Factors or events that could cause actual results to differ may emerge from time to time and are difficult to predict . Should known or unknown risks or uncertainties materialize, or should underlying assumptions prove inaccurate, actual results may differ materially from past results and those anticipated, estimated or projected . We caution you not to place undue reliance upon any of these forward - looking statements . Factors that could cause or contribute to such differences, include, but are not limited to : our ability to execute our business plans or growth strategy ; our ability to innovate, develop or implement new or enhanced solutions or services ; the nature of investment and acquisition opportunities we are pursuing, and the successful execution of such investments and acquisitions ; our ability to successfully integrate acquired businesses and realize synergies ; variations in our results of operations ; our ability to accurately forecast the revenue under our contracts and solutions ; our ability to protect our systems from damage, interruption or breach, and to maintain effective information and technology systems and networks ; our ability to protect our intellectual property rights, proprietary technology, information processes, and know - how ; significant competition for our solutions and services ; our failure to maintain a high level of customer retention or the unexpected reduction in scope or termination of key contracts with major customers ; customer dissatisfaction, our non - compliance with contractual provisions or regulatory requirements ; our failure to meet performance standards triggering significant costs or liabilities under our contracts ; our inability to manage our relationships with information and data sources and suppliers ; reliance on subcontractors and other third party providers and parties to perform services ; our ability to continue to secure contracts and favorable contract terms through the competitive bidding process and to prevail in protests or challenges to contract awards ; pending or threatened litigation ; unfavorable outcomes in legal proceedings ; our success in attracting qualified employees and members of our management team ; our ability to generate sufficient cash to cover our interest and principal payments under our credit facility or to borrow or use credit ; unexpected changes in our effective tax rates ; unanticipated increases in the number or amount of claims for which we are self - insured ; changes in the U . S . healthcare environment or healthcare financing system, including regulatory, budgetary or political actions that affect procurement practices and healthcare spending ; our failure to comply with applicable laws and regulations governing individual privacy and information security or to protect such information from theft and misuse ; negative results of government or customer reviews, audits or investigations ; state or federal limitations related to outsourcing or certain government programs or functions ; restrictions on bidding or performing certain work due to perceived conflicts of interests ; the market price of our common stock and lack of dividend payments ; anti - takeover provisions in our corporate governance documents ; and other factors, risks and uncertainties described in our most recent Annual Report on Form 10 - K and in our other filings with the Securities and Exchange Commission . Any forward - looking statements are made as of the date of this presentation . Except as may be required by law, we disclaim any obligation to publicly update forward - looking statements, whether as a result of new information, future events or otherwise . NON - GAAP FINANCIAL INFORMATION . This presentation contains certain non - GAAP measures . These non - GAAP measures, as calculated by the Company, are not necessarily comparable to similarly titled measures reported by other companies . Additionally, these non - GAAP measures are not measurements of financial performance or liquidity under GAAP and should not be considered alternatives to the Company's other financial information determined under GAAP . See slide 12 for definitions and reconciliations of certain non - GAAP measures . STATUS OF AUDIT . There are still open items with KPMG’s audit and testing is still in process . Once testing is complete, any necessary adjustment to numbers will be made . It is expected that the audit will then be finalized . The Company intends to file its Form 10 - K promptly after the audit is complete and then its Form 10 - Q as soon as practicable thereafter . MARKET AND INDUSTRY DATA . This presentation contains market and industry data and forecasts that have been obtained from publicly available information, various industry publications, other published industry sources and our internal data and estimates . We have not independently verified the information and cannot make any representation as to the accuracy or completeness of such information . None of the reports and other materials of third party sources referred to in this presentation were prepared for use in, or in connection with, this presentation . Our internal data and estimates are based upon information obtained from our customers, our partners, trade and business organizations, publicly available information and other contacts in the markets in which we operate and our management’s understanding of industry conditions . Estimates are difficult to develop and inherently uncertain and we cannot assure you that they are accurate . Our estimates involve risks and uncertainties and are subject to change based on various factors, including those discussed above . HMSY Q1 2017 Investor Presentation / May 10, 2017
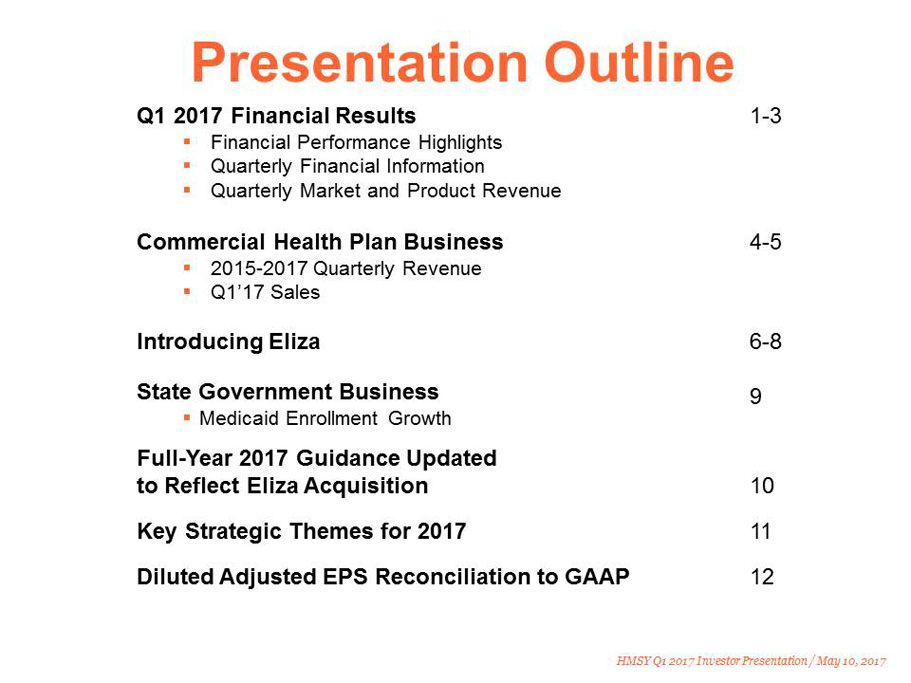
Presentation Outline HMSY Q1 2017 Investor Presentation / May 10, 2017 Q1 2017 Financial Results ▪ Financial Performance Highlights ▪ Quarterly Financial Information ▪ Quarterly Market and Product Revenue 1 - 3 Commercial Health Plan Business ▪ 2015 - 2017 Quarterly Revenue ▪ Q1’17 Sales 4 - 5 Introducing Eliza 6 - 8 9 State Government Business ▪ Medicaid Enrollment Growth Full - Year 2017 Guidance Updated to Reflect Eliza Acquisition 10 Key Strategic Themes for 2017 11 Diluted Adjusted EPS Reconciliation to GAAP 12
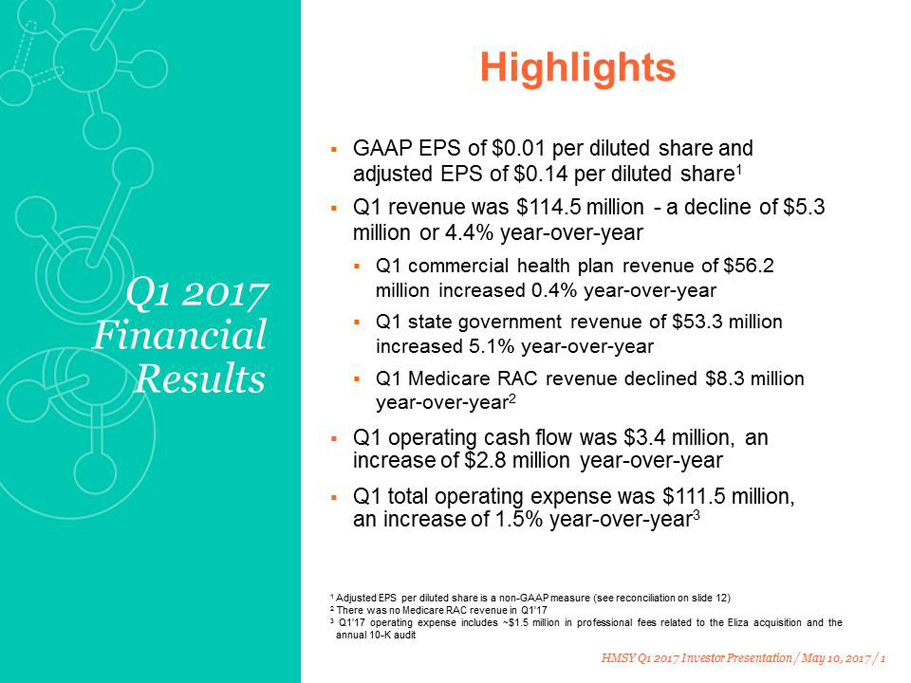
HMSY Q1 2017 Investor Presentation / May 10, 2017 / 1 Highlights ▪ GAAP EPS of $0.01 per diluted share and adjusted EPS of $0.14 per diluted share 1 ▪ Q1 revenue was $114.5 million - a decline of $5.3 million or 4.4% year - over - year ▪ Q1 commercial health plan revenue of $56.2 million increased 0.4% year - over - year ▪ Q1 state government revenue of $53.3 million increased 5.1% year - over - year ▪ Q1 Medicare RAC revenue declined $8.3 million year - over - year 2 ▪ Q1 operating cash flow was $3.4 million, an increase of $2.8 million year - over - year ▪ Q1 total operating expense was $111.5 million, an increase of 1.5% year - over - year 3 Q1 2017 Financial Results 1 Adjusted EPS per diluted share is a non - GAAP measure (see reconciliation on slide 12 ) 2 There was no Medicare RAC revenue in Q 1 ’ 17 3 Q 1 ’ 17 operating expense includes ~ $ 1 . 5 million in professional fees related to the Eliza acquisition and the annual 10 - K audit
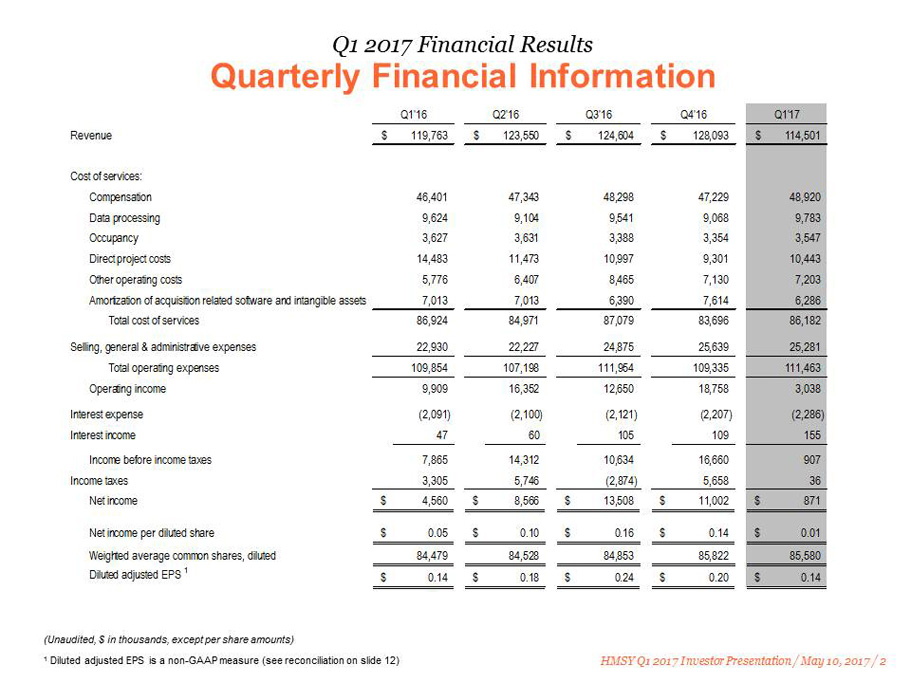
HMSY Q1 2017 Investor Presentation / May 10, 2017 / 2 Q1 2017 Financial Results Quarterly Financial Information (Unaudited, $ in thousands, except per share amounts) 1 Diluted adjusted EPS is a non - GAAP measure (see reconciliation on slide 12) Revenue $ 119,763 $ 123,550 $ 124,604 $ 128,093 $ 114,501 Cost of services: Compensation 46,401 47,343 48,298 47,229 48,920 Data processing 9,624 9,104 9,541 9,068 9,783 Occupancy 3,627 3,631 3,388 3,354 3,547 Direct project costs 14,483 11,473 10,997 9,301 10,443 Other operating costs 5,776 6,407 8,465 7,130 7,203 Amortization of acquisition related software and intangible assets 7,013 7,013 6,390 7,614 6,286 Total cost of services 86,924 84,971 87,079 83,696 86,182 Selling, general & administrative expenses 22,930 22,227 24,875 25,639 25,281 Total operating expenses 109,854 107,198 111,954 109,335 111,463 Operating income 9,909 16,352 12,650 18,758 3,038 Interest expense (2,091) (2,100) (2,121) (2,207) (2,286) Interest income 47 60 105 109 155 Income before income taxes 7,865 14,312 10,634 16,660 907 Income taxes 3,305 5,746 (2,874) 5,658 36 Net income $ 4,560 $ 8,566 $ 13,508 $ 11,002 $ 871 Net income per diluted share $ 0.05 $ 0.10 $ 0.16 $ 0.14 $ 0.01 Weighted average common shares, diluted 84,479 84,528 84,853 85,822 85,580 Diluted adjusted EPS 1 $ 0.14 $ 0.18 $ 0.24 $ 0.20 $ 0.14 Q1'16 Q2'16 Q3'16 Q1'17Q4'16
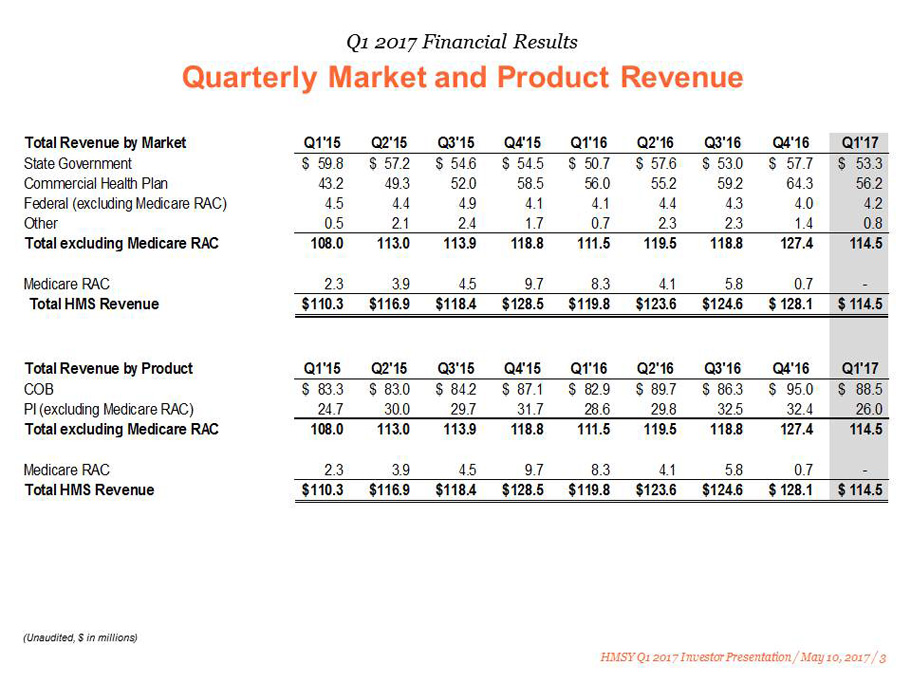
HMSY Q1 2017 Investor Presentation / May 10, 2017 / 3 Q1 2017 Financial Results Quarterly Market and Product Revenue (Unaudited, $ in millions) Total Revenue by Market Q1'15 Q2'15 Q3'15 Q4'15 Q1'16 Q2'16 Q3'16 Q4'16 Q1'17 State Government 59.8$ 57.2$ 54.6$ 54.5$ 50.7$ 57.6$ 53.0$ 57.7$ 53.3$ Commercial Health Plan 43.2 49.3 52.0 58.5 56.0 55.2 59.2 64.3 56.2 Federal (excluding Medicare RAC) 4.5 4.4 4.9 4.1 4.1 4.4 4.3 4.0 4.2 Other 0.5 2.1 2.4 1.7 0.7 2.3 2.3 1.4 0.8 Total excluding Medicare RAC 108.0 113.0 113.9 118.8 111.5 119.5 118.8 127.4 114.5 Medicare RAC 2.3 3.9 4.5 9.7 8.3 4.1 5.8 0.7 - Total HMS Revenue 110.3$ 116.9$ 118.4$ 128.5$ 119.8$ 123.6$ 124.6$ 128.1$ 114.5$ Total Revenue by Product Q1'15 Q2'15 Q3'15 Q4'15 Q1'16 Q2'16 Q3'16 Q4'16 Q1'17 COB 83.3$ 83.0$ 84.2$ 87.1$ 82.9$ 89.7$ 86.3$ 95.0$ 88.5$ PI (excluding Medicare RAC) 24.7 30.0 29.7 31.7 28.6 29.8 32.5 32.4 26.0 Total excluding Medicare RAC 108.0 113.0 113.9 118.8 111.5 119.5 118.8 127.4 114.5 Medicare RAC 2.3 3.9 4.5 9.7 8.3 4.1 5.8 0.7 - Total HMS Revenue 110.3$ 116.9$ 118.4$ 128.5$ 119.8$ 123.6$ 124.6$ 128.1$ 114.5$
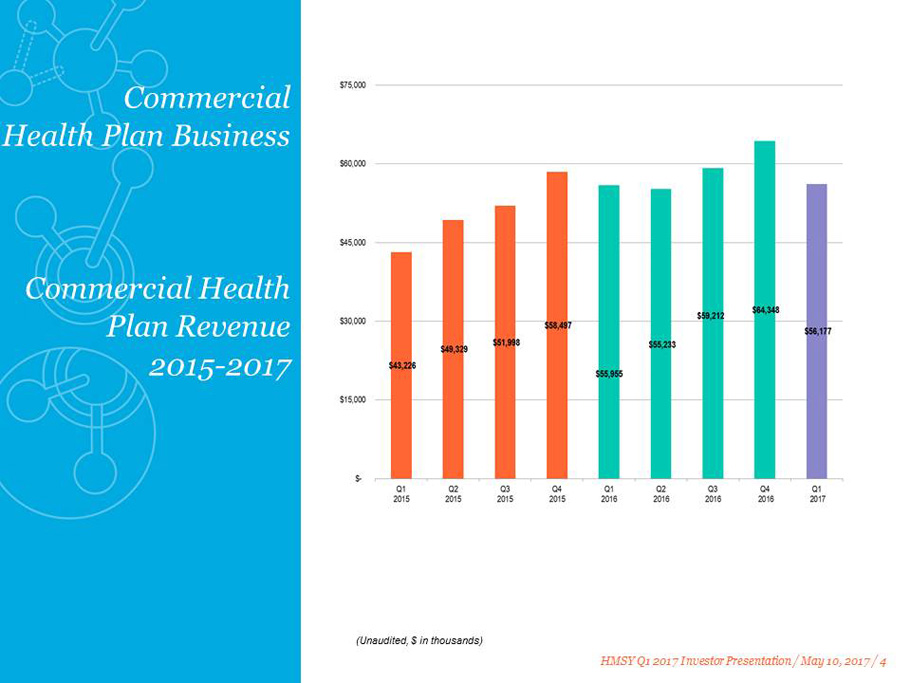
HMSY Q1 2017 Investor Presentation / May 10, 2017 / 4 Commercial Health Plan Business Commercial Health Plan Revenue 2015 - 2017 (Unaudited, $ in thousands)
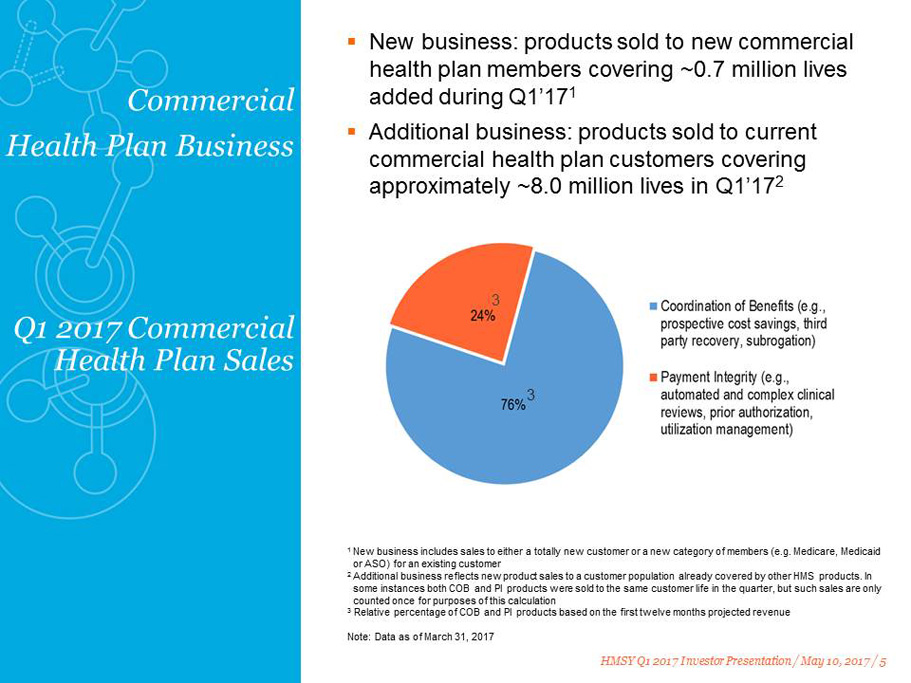
HMSY Q1 2017 Investor Presentation / May 10, 2017 / 5 ▪ New business: products sold to new commercial health plan members covering ~0.7 million lives added during Q1’17 1 ▪ Additional business: products sold to current commercial health plan customers covering approximately ~8.0 million lives in Q1’17 2 Commercial Health Plan Business Q1 2017 Commercial Health Plan Sales 1 New business includes sales to either a totally new customer or a new category of members (e.g. Medicare, Medicaid or ASO) for an existing customer 2 Additional business reflects new product sales to a customer population already covered by other HMS products. In some instances both COB and PI products were sold to the same customer life in the quarter, but such sales are only counted once for purposes of this calculation 3 Relative percentage of COB and PI products based on the first twelve months projected revenue Note: Data as of March 31, 2017 3 3
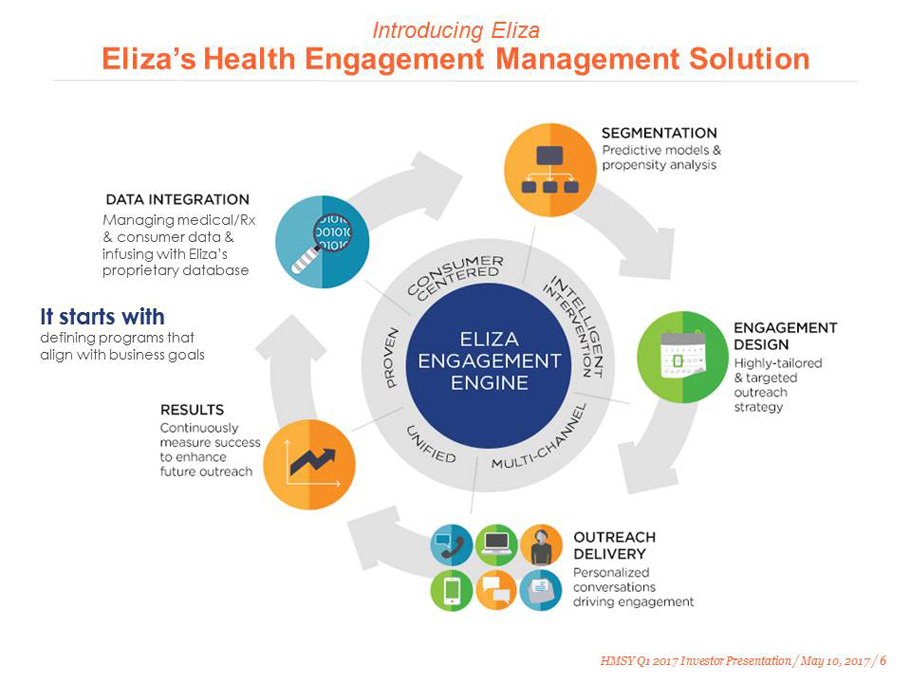
Introducing Eliza Eliza’s Health Engagement Management Solution It starts with defining programs that align with business goals Managing medical/Rx & consumer data & infusing with Eliza’s proprietary database HMSY Q1 2017 Investor Presentation / May 10, 2017 / 6
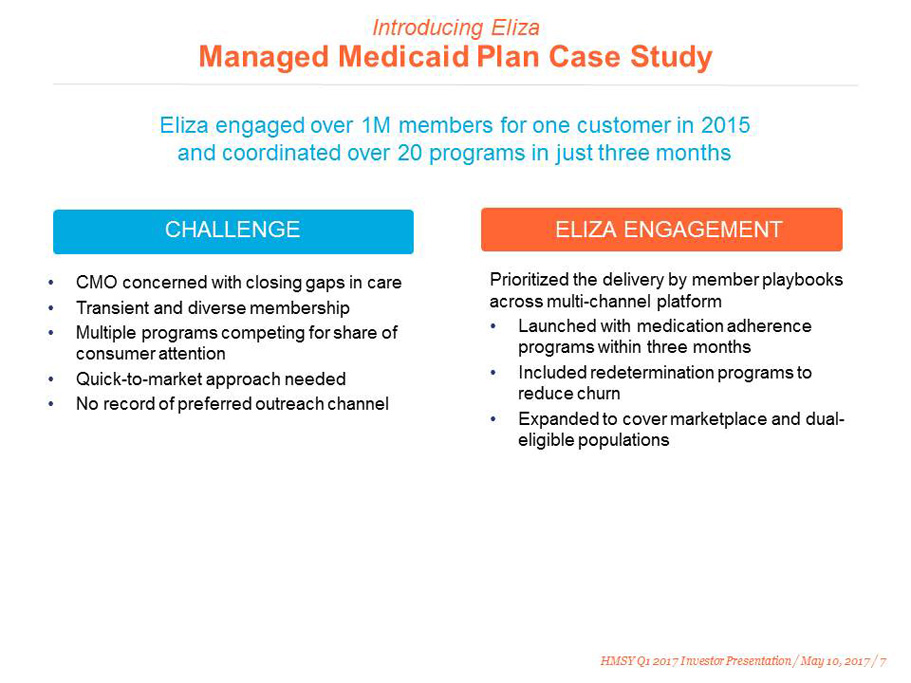
• CMO concerned with closing gaps in care • Transient and diverse membership • Multiple programs competing for share of consumer attention • Quick - to - market approach needed • No record of preferred outreach channel Introducing Eliza Managed Medicaid Plan Case Study ELIZA ENGAGEMENT Prioritized the delivery by member playbooks across multi - channel platform • Launched with medication a dherence programs within three months • Included redetermination programs to reduce churn • Expanded to cover marketplace and dual - eligible populations Eliza engaged over 1M members for one customer in 2015 a nd coordinated over 20 programs in just three months CHALLENGE HMSY Q1 2017 Investor Presentation / May 10, 2017 / 7
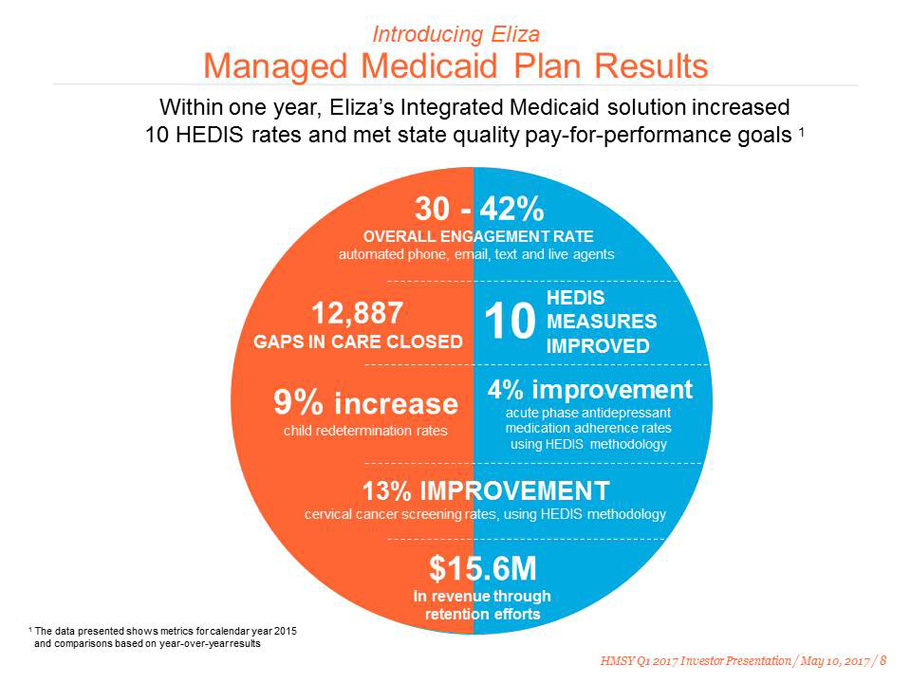
Introducing Eliza Managed Medicaid Plan Results Within one year, Eliza’s Integrated Medicaid solution increased 10 HEDIS rates and met state quality pay - for - performance goals 1 30 - 42% OVERALL ENGAGEMENT RATE automated phone, email, text and live agents 12,887 GAPS IN CARE CLOSED $15.6M In revenue through r etention efforts 9% increase child redetermination rates 13% IMPROVEMENT cervical cancer screening rates, using HEDIS methodology 4% improvement acute phase antidepressant m edication adherence rates using HEDIS methodology HEDIS MEASURES IMPROVED 10 HMSY Q1 2017 Investor Presentation / May 10, 2017 / 8 1 The data presented shows metrics for calendar year 2015 and comparisons based on year - over - year results
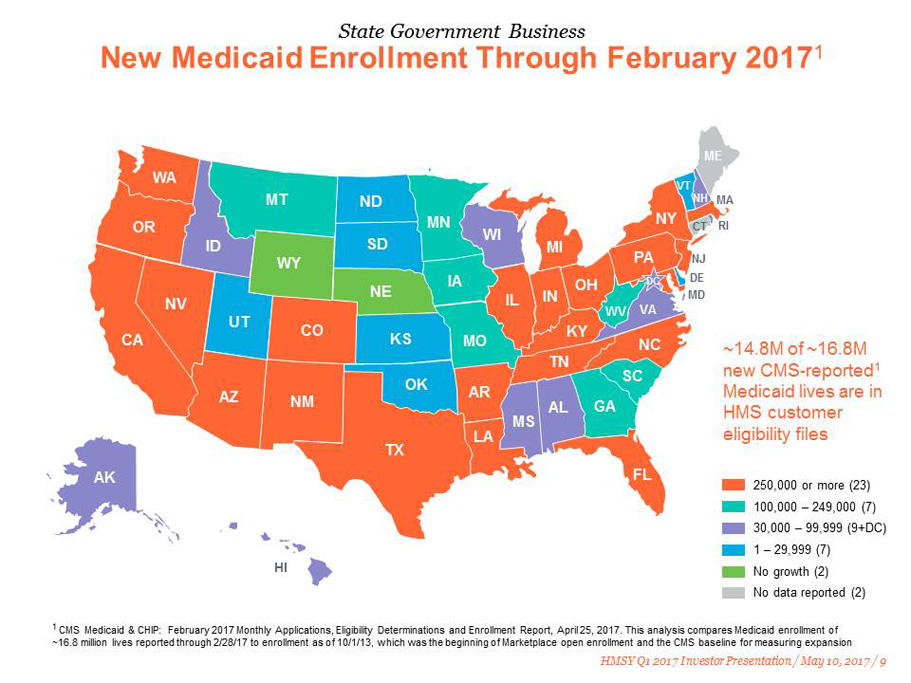
State Government Business New Medicaid Enrollment Through February 2017 1 1 CMS Medicaid & CHIP: February 2017 Monthly Applications, Eligibility Determinations and Enrollment Report, April 25, 2017. This analysis compares Medicaid enrollment of ~16.8 million lives reported through 2/28/17 to enrollment as of 10/1/13, which was the beginning of Marketplace open enrollment and the CMS baseline for measuring expansion ~14.8M of ~16.8M new CMS - reported 1 Medicaid lives are in HMS customer eligibility files 250,000 or more (23) 100,000 – 249,000 (7) 30,000 – 99,999 (9+DC) 1 – 29,999 (7) No growth (2) No data reported (2) CA NV OR WA ID MT ND SD NE KS OK TX HI AK AZ UT WY CO NM MO IA MN WI MI AR LA MS AL GA FL SC TN NC KY IL IN OH PA NY WV VA ME MD DE NJ CT RI MA VT NH DC HMSY Q1 2017 Investor Presentation / May 10, 2017 / 9
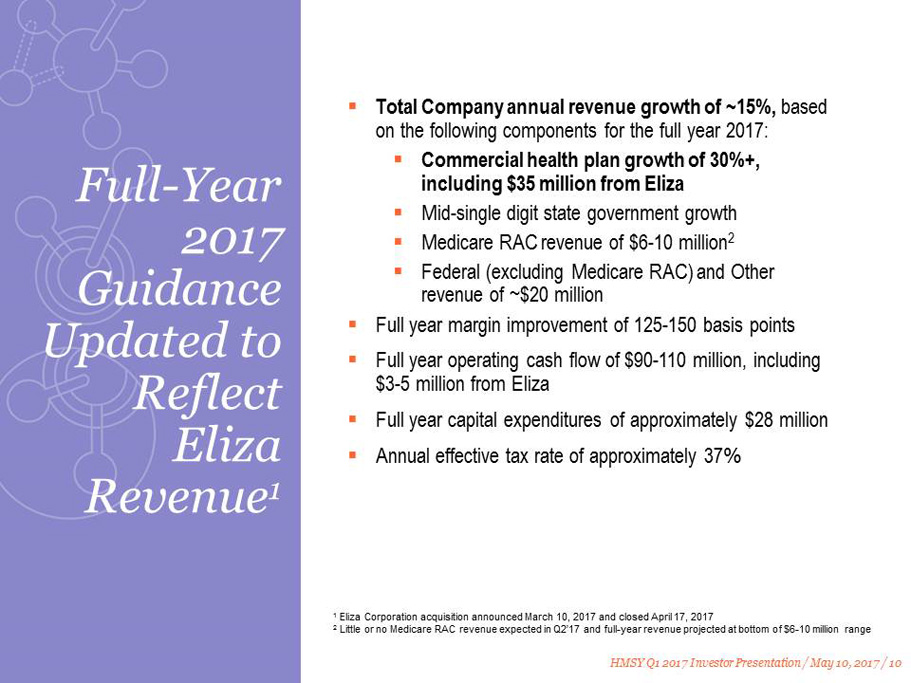
HMSY Q1 2017 Investor Presentation / May 10, 2017 / 10 ▪ Total Company annual revenue growth of ~15%, based on the following components for the full year 2017: ▪ Commercial health plan growth of 30%+, including $35 million from Eliza ▪ Mid - single digit state government growth ▪ Medicare RAC revenue of $ 6 - 10 million 2 ▪ Federal (excluding Medicare RAC) and Other revenue of ~$ 20 million ▪ Full year margin improvement of 125 - 150 basis points ▪ Full year operating cash flow of $90 - 110 million, including $3 - 5 million from Eliza ▪ Full year capital expenditures of approximately $28 million ▪ Annual effective tax rate of approximately 37% Full - Year 2017 Guidance Updated to Reflect Eliza Revenue 1 1 Eliza Corporation acquisition announced March 10, 2017 and closed April 17, 2017 2 Little or no Medicare RAC revenue expected in Q2’17 and full - year revenue projected at bottom of $6 - 10 million range
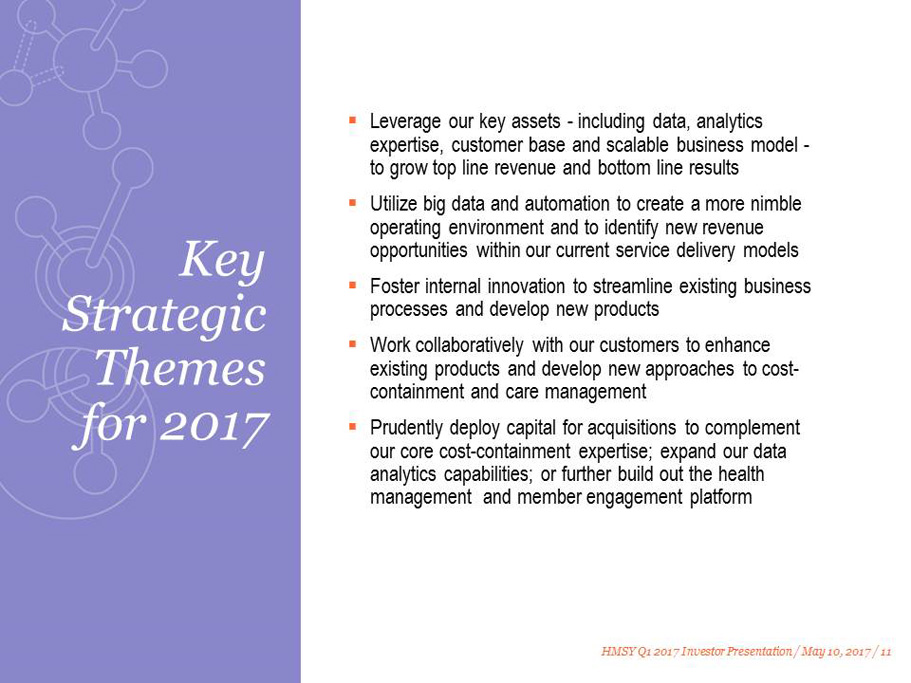
▪ Leverage our key assets - including data, analytics expertise, customer base and scalable business model - to grow top line revenue and bottom line results ▪ Utilize big data and automation to create a more nimble operating environment and to identify new revenue opportunities within our current service delivery models ▪ Foster internal innovation to streamline existing business processes and develop new products ▪ Work collaboratively with our customers to enhance existing products and develop new approaches to cost - containment and care management ▪ Prudently deploy capital for acquisitions to complement our core cost - containment expertise; expand our data analytics capabilities; or further build out the health management and member engagement platform Key Strategic Themes for 2017 HMSY Q1 2017 Investor Presentation / May 10, 2017 / 11
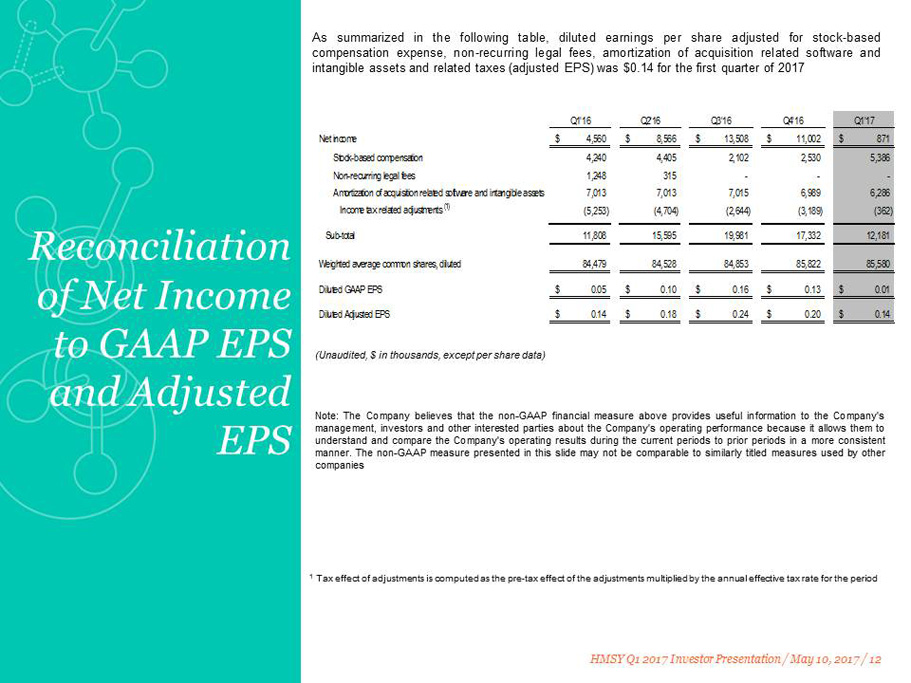
HMSY Q1 2017 Investor Presentation / May 10, 2017 / 12 Reconciliation of Net Income to GAAP EPS and Adjusted EPS Note : The Company believes that the non - GAAP financial measure above provides useful information to the Company's management, investors and other interested parties about the Company's operating performance because it allows them to understand and compare the Company's operating results during the current periods to prior periods in a more consistent manner . The non - GAAP measure presented in this slide may not be comparable to similarly titled measures used by other companies (Unaudited, $ in thousands, except per share data) As summarized in the following table, diluted earnings per share adjusted for stock - based compensation expense, non - recurring legal fees, amortization of acquisition related software and intangible assets and related taxes (adjusted EPS) was $ 0 . 14 for the first quarter of 2017 1 Tax effect of adjustments is computed as the pre - tax effect of the adjustments multiplied by the annual effective tax rate for the period Net income $ 4,560 $ 8,566 $ 13,508 $ 11,002 $ 871 Stock-based compensation 4,240 4,405 2,102 2,530 5,386 Non-recurring legal fees 1,248 315 - - - Amortization of acquisition related software and intangible assets 7,013 7,013 7,015 6,989 6,286 (5,253) (4,704) (2,644) (3,189) (362) Sub-total 11,808 15,595 19,981 17,332 12,181 Weighted average common shares, diluted 84,479 84,528 84,853 85,822 85,580 Diluted GAAP EPS $ 0.05 $ 0.10 $ 0.16 $ 0.13 $ 0.01 Diluted Adjusted EPS $ 0.14 $ 0.18 $ 0.24 $ 0.20 $ 0.14 Q1'16 Q2'16 Income tax related adjustments (1) Q3'16 Q1'17Q4'16
Enterprising healthcare