Attached files
| file | filename |
|---|---|
| 8-K - FORM 8-K - Consolidated Communications Holdings, Inc. | f8k_050917.htm |
Exhibit 99.1

• Click to edit Master title style Click to edit Master title style Consolidated Communications Investor Presentation May 2017 NASDAQ: CNSL
• Click to edit Master title style Click to edit Master title style Safe Harbor The Securities and Exchange Commission (“SEC”) encourages companies to disclose forward - looking information so that investors can be tter understand a company’s future prospects and make informed investment decisions. Certain statements in this communication are forward - looking statements and are made pursuant to the safe harbor provisions of the Securities Litigation Reform Act of 1995. These forward - looking statements reflec t, among other things, current expectations, plans, strategies, and anticipated financial results of Consolidated Communications Holdings, Inc. (the “Compan y”) and FairPoint Communications, Inc. (“FairPoint”), both separately and as a combined entity. There are a number of risks, uncertainties, and conditions tha t m ay cause the actual results of the Company and FairPoint, both separately and as a combined entity, to differ materially from those expressed or implied by thes e f orward - looking statements. These risks and uncertainties include the timing and ability to complete the proposed acquisition of FairPoint by the Company , t he expected benefits of the integration of the two companies and successful integration of FairPoint’s operations with those of the Company and realizati on of the synergies from the integration, as well as a number of factors related to the respective businesses of the Company and FairPoint, including econ omi c and financial market conditions generally and economic conditions in the Company’s and FairPoint’s service areas; various risks to stockholders of not receiv ing dividends and risks to the Company’s ability to pursue growth opportunities if the Company continues to pay dividends according to the current dividend pol icy; various risks to the price and volatility of the Company’s common stock; changes in the valuation of pension plan assets; the substantial amount of debt and th e Company’s ability to repay or refinance it or incur additional debt in the future; the Company’s need for a significant amount of cash to service and repay th e debt and to pay dividends on its common stock; restrictions contained in the Company’s debt agreements that limit the discretion of management in operating th e b usiness; legal or regulatory proceedings or other matters that impact the timing or ability to complete the acquisition as contemplated, regulatory change s, including changes to subsidies, rapid development and introduction of new technologies and intense competition in the telecommunications industry; risks asso cia ted with the Company’s possible pursuit of acquisitions; system failures; cyber - attacks, information or security breaches, or technology failure of the Company or of a third party; losses of large customers or government contracts; risks associated with the rights - of - way for the network; disruptions in the relationship with third party vendors; losses of key management personnel and the inability to attract and retain highly qualified management and personnel in the future; changes in the extensive governmental legislation and regulations governing telecommunications providers and the provision of telecommunications services; new or c han ging tax laws or regulations; telecommunications carriers disputing and/or avoiding their obligations to pay network access charges for use of the Company’ s a nd FairPoint’s network; high costs of regulatory compliance; the competitive impact of legislation and regulatory changes in the telecommunications indust ry; liability and compliance costs regarding environmental regulations; the possibility of disruption from the integration of the two companies making it more d iff icult to maintain business and operational relationships; the possibility that the acquisition is not consummated, including, but not limited to, due to the fa ilure to satisfy the closing conditions; the possibility that the merger or the acquisition may be more expensive to complete than anticipated, including as a result of u nex pected factors or events; and diversion of management’s attention from ongoing business operations and opportunities. A detailed discussion of risks and u nce rtainties that could cause actual results and events to differ materially from such forward - looking statements are discussed in more detail in the Company’s and F airPoint’s respective filings with the SEC, including the Annual Report on Form 10 - K of the Company for the year ended December 31, 2016, which was filed with the SEC on March 1, 2017, under the heading “Item 1A — Risk Factors,” and the Annual Report on Form 10 - K of FairPoint for the year ended December 31, 2016, which was filed with the SEC on March 6, 2017, under the heading “Item 1A — Risk Factors,” and in subsequent reports on Forms 10 - Q and 8 - K and other filing s made with the SEC by each of the Company and FairPoint. Many of these circumstances are beyond the ability of the Company and FairPoint to control or predict. Moreover, forward - looking statements necessarily involve assumptions on the part of the Company and FairPoint. These forward - looking statements g enerally are identified by the words “believe,” “expect,” “anticipate,” “estimate,” “project,” “intend,” “plan,” “should,” “may,” “will,” “would,” “will be, ” “ will continue” or similar expressions. Such forward - looking statements involve known and unknown risks, uncertainties and other factors that may cause actual results, perfo rmance or achievements of the Company and FairPoint, and their respective subsidiaries, both separately and as a combined entity to be different from those ex pressed or implied in the forward - looking statements. All forward - looking statements attributable to us or persons acting on the respective behalf of the Company or FairPoint are expressly qualified in their entirety by the cautionary statements that appear throughout this communication. Furthermore, forward - looking statemen ts speak only as of the date they are made. Except as required under the federal securities laws or the rules and regulations of the SEC, each of the Company and FairPoint disclaim any intention or obligation to update or revise publicly any forward - looking statements. You should not place undue reliance on forward - looki ng statements . 2
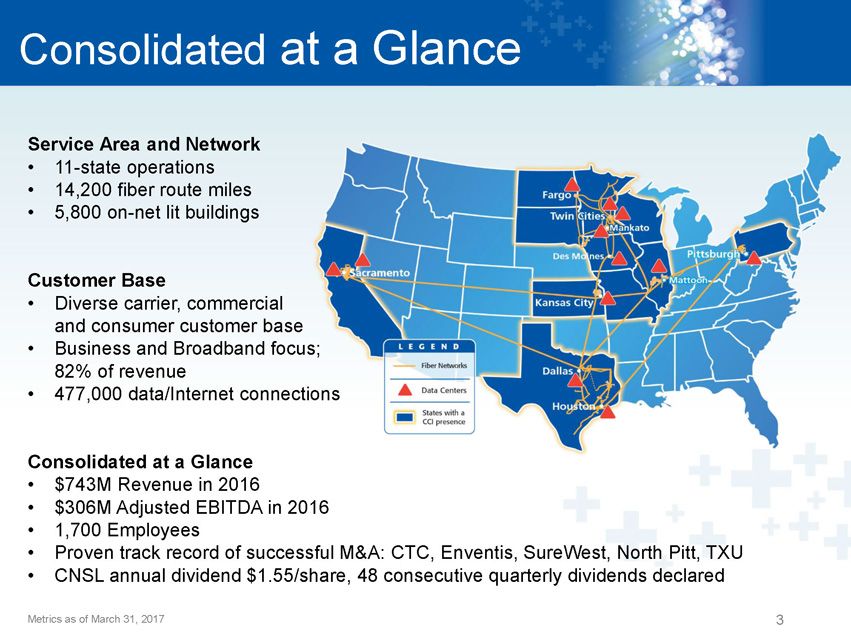
• Click to edit Master title style Click to edit Master title style Consolidated at a Glance Service Area and Network • 11 - state operations • 14,200 fiber route miles • 5,800 on - net lit buildings Customer Base • Diverse carrier, commercial and consumer customer base • Business and Broadband focus; 82% of revenue • 477,000 data/Internet connections Consolidated at a Glance • $743M Revenue in 2016 • $306M Adjusted EBITDA in 2016 • 1,700 Employees • Proven track record of successful M&A: CTC , Enventis, SureWest, North Pitt, TXU • CNSL annual dividend $ 1.55/share, 48 consecutive quarterly dividends declared 3 Metrics as of March 31, 2017
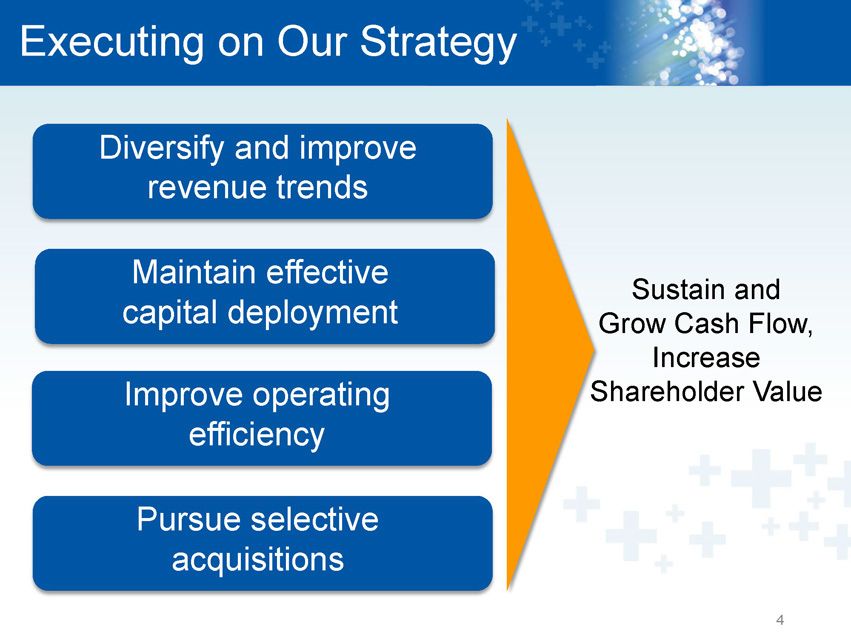
• Click to edit Master title style Click to edit Master title style Executing on Our Strategy Diversify and improve revenue trends Maintain effective capital deployment Improve operating efficiency Pursue selective acquisitions Sustain and Grow Cash Flow, Increase Shareholder Value 4
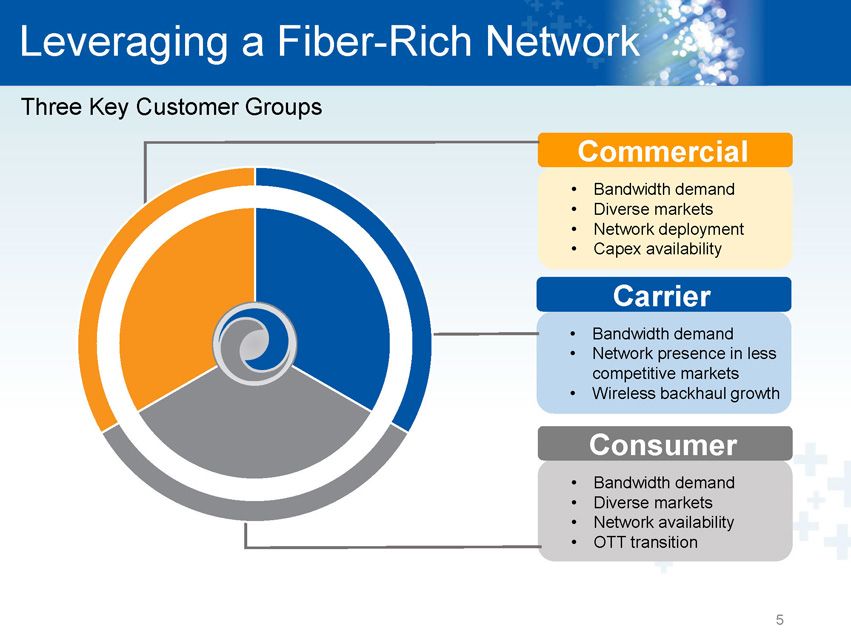
• Click to edit Master title style Click to edit Master title style Leveraging a Fiber - Rich Network Consumer • Bandwidth demand • Diverse markets • Network availability • OTT transition Carrier • Bandwidth demand • Network presence in less competitive markets • Wireless backhaul growth Commercial • Bandwidth demand • Diverse markets • Network deployment • Capex availability Three Key Customer Groups 5
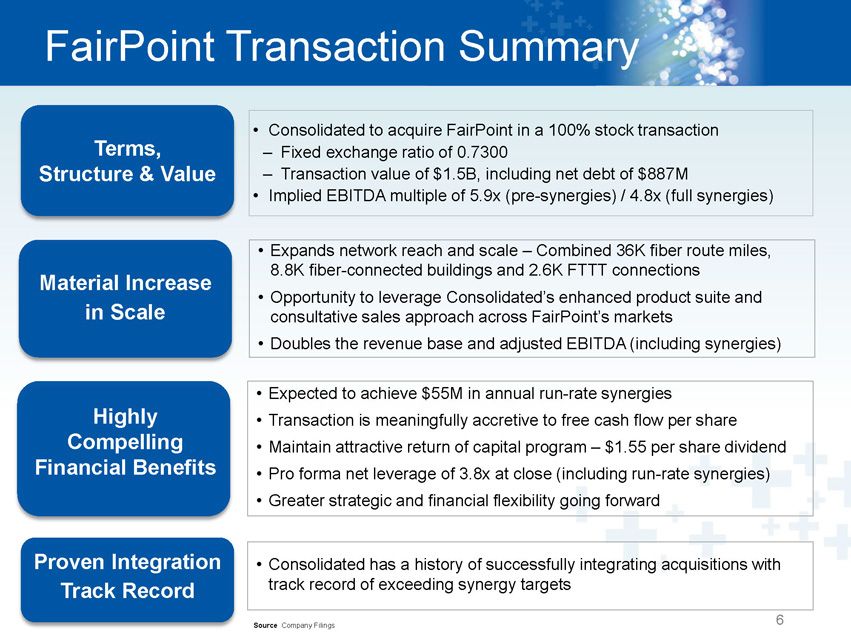
• Click to edit Master title style Click to edit Master title style FairPoint Transaction Summary • Expands network reach and scale – Combined 36K fiber route miles, 8.8K fiber - connected buildings and 2.6K FTTT connections • Opportunity to leverage Consolidated’s enhanced product suite and consultative sales approach across FairPoint’s markets • Doubles the revenue base and adjusted EBITDA (including synergies) Material Increase in Scale • Consolidated has a history of successfully integrating acquisitions with track record of exceeding synergy targets Proven Integration Track Record • Expected to achieve $ 55M in annual run - rate synergies • Transaction is meaningfully accretive to free cash flow per share • Maintain attractive return of capital program – $1.55 per share dividend • Pro forma net leverage of 3.8x at close (including run - rate synergies) • Greater strategic and financial flexibility going forward Source Company Filings Highly Compelling Financial Benefits 6 • Consolidated to acquire FairPoint in a 100% stock transaction – Fixed exchange ratio of 0.7300 – Transaction value of $1.5B, including net debt of $887M • Implied EBITDA multiple of 5.9x (pre - synergies) / 4.8x (full synergies ) Terms, Structure & Value
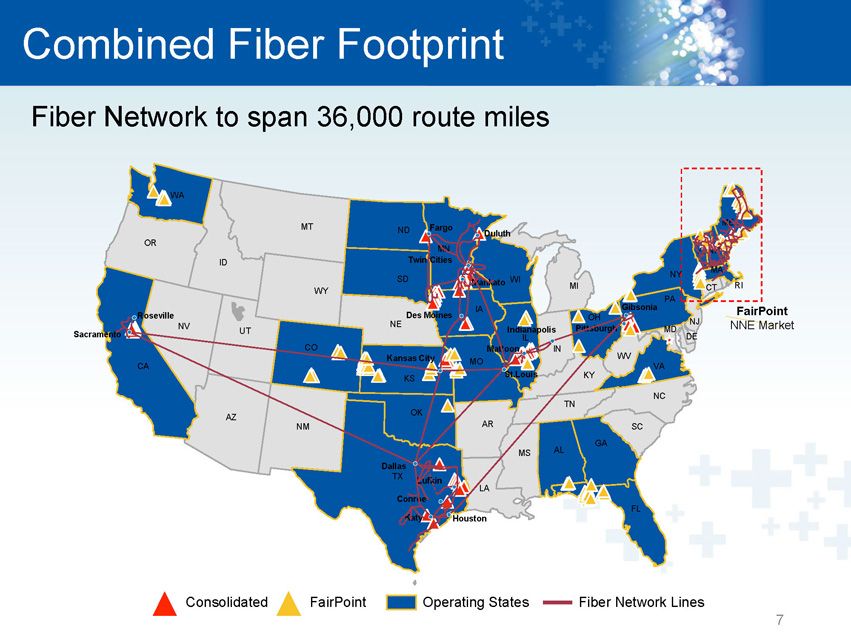
• Click to edit Master title style Click to edit Master title style Combined Fiber Footprint Fiber Network to span 36,000 route miles Consolidated FairPoint Operating States Fiber Network Lines FL NM MD TX OK KS NE SD ND MT WY CO UT ID AZ NV WA CA OR KY NY PA MI NH MA CT VA WV OH IN IL NC TN SC AL AR LA MO IA MN WI GA MS VT NJ DE ME RI FairPoint NNE Market Roseville Sacramento Fargo Twin Cities Duluth Mankato Des Moines Kansas City Dallas Lufkin Conroe Katy Houston St.Louis Mattoon Indianapolis Pittsburgh Gibsonia 7
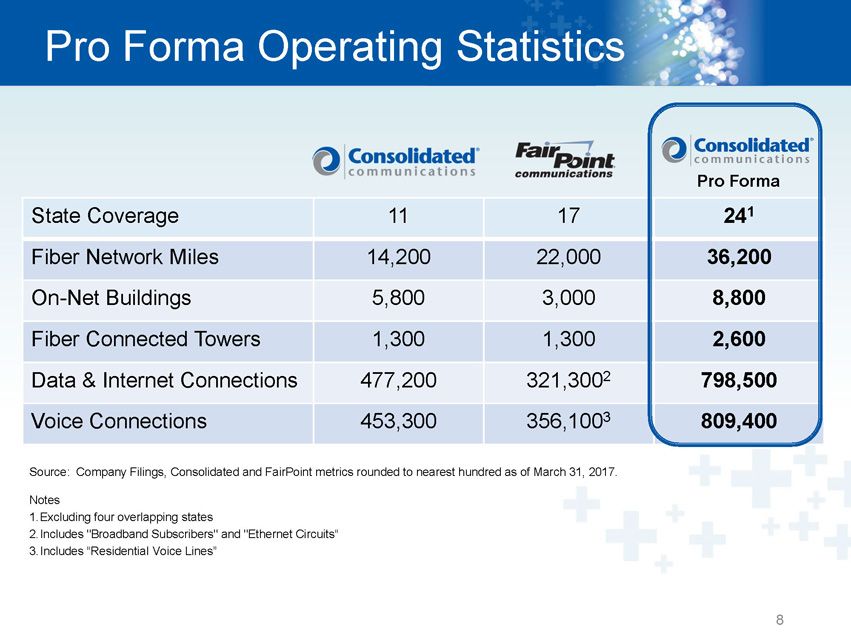
• Click to edit Master title style Click to edit Master title style Pro Forma Operating Statistics Source: Company Filings, Consolidated and FairPoint metrics rounded to nearest hundred as of March 31, 2017. Notes 1. Excluding four overlapping states 2. Includes "Broadband Subscribers" and "Ethernet Circuits “ 3. Includes “Residential Voice Lines” 8 State Coverage 11 17 24 1 Fiber Network Miles 14,200 22,000 36,200 On - Net Buildings 5,800 3,000 8,800 Fiber Connected Towers 1,300 1,300 2,600 Data & Internet Connections 477,200 321,300 2 798,500 Voice Connections 453,300 356,100 3 809,400 Pro Forma
• Click to edit Master title style Click to edit Master title style 9 FairPoint Transaction Updates • Financing commitments secured for the transaction in December with favorable terms • Hart - Scott Rodino clearance received in January • Consolidated and FairPoint shareholders approved merger in March • Making good progress in obtaining necessary approvals/clearances in states • Integration planning in process; remain confident with synergy targets • Continue to expect to close by mid - 2017
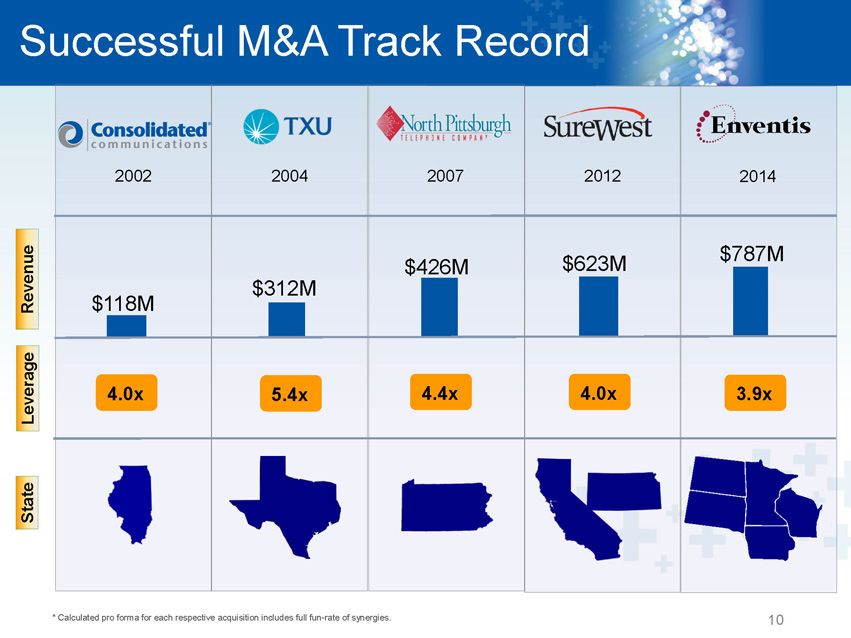
• Click to edit Master title style Click to edit Master title style 2002 Successful M&A Track Record Revenue Leverage 2004 2007 2012 2014 $ 118M $ 312M $ 426M $ 623M $ 787M 5.4x * Calculated pro forma for each respective acquisition includes full fun - rate of synergies. 4.4x 4.0x 3.9x 4.0x State 10
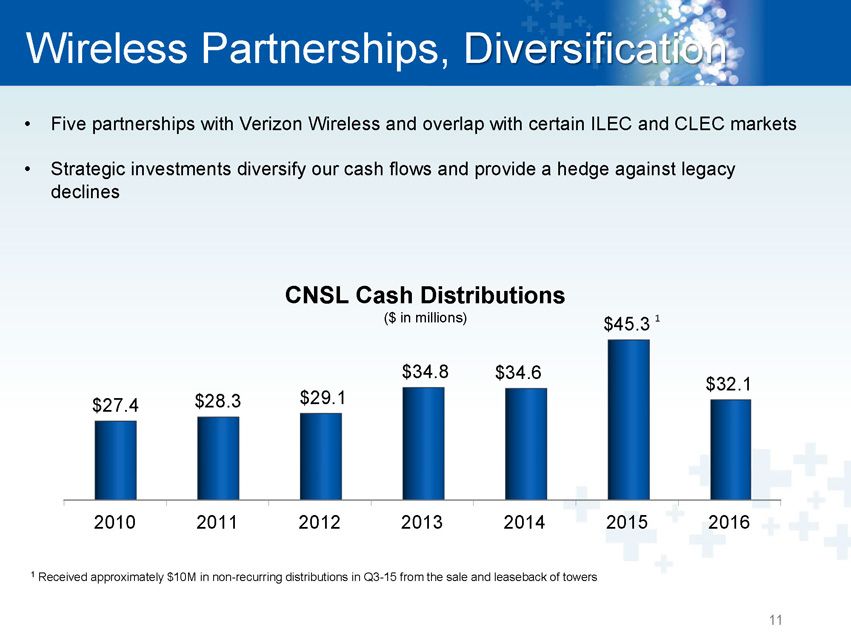
• Click to edit Master title style Click to edit Master title style Wireless Partnerships, Diversification • Five partnerships with Verizon Wireless and overlap with certain ILEC and CLEC markets • Strategic investments diversify our cash flows and provide a hedge against legacy declines 1 Received approximately $10M in non - recurring distributions in Q3 - 15 from the sale and leaseback of towers CNSL Cash Distributions ($ in millions) 1 11 2010 2011 2012 2013 2014 2015 2016 $27.4 $28.3 $29.1 $34.8 $34.6 $45.3 $32.1
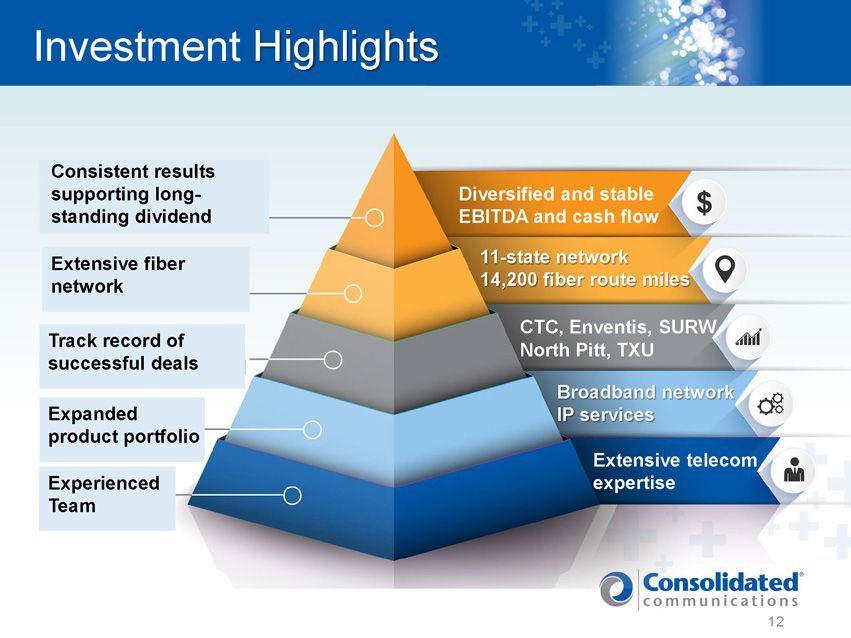
• Click to edit Master title style Click to edit Master title style Investment Highlights Diversified and stable EBITDA and cash flow 11 - state network 14,200 fiber route miles CTC, Enventis, SURW, North Pitt, TXU Broadband network IP services Extensive telecom expertise Consistent results supporting long - standing dividend Extensive fiber n etwork Track record of successful deals Expanded product p ortfolio Experienced Team 12
• Click to edit Master title style Click to edit Master title style Appendix - Use of Non - GAAP Measures - 2017 Guidance - Adjusted EBITDA Reconciliation - Net Leverage - Revenue Categories - Cash Available to Pay Dividends 13
• Click to edit Master title style Click to edit Master title style Use of Non - GAAP Measures 14 This presentation includes disclosures regarding “EBITDA,” “adjusted EBITDA,” “cash available to pay dividends” and the related “dividend payout ratio,” “t otal net debt to last twelve month adjusted EBITDA coverage ratio,” “adjusted diluted net income per share” and “adjusted net inco me attributable to common stockholders,” all of which are non - GAAP financial measures and described in this section as not being in compliance with Regula tion S - X. Accordingly, they should not be construed as alternatives to net cash from operating or investing activities, cash and cash equivalents, cash f low s from operations, net income or net income per share as defined by GAAP and are not, on their own, necessarily indicative of cash available to fund cash need s a s determined in accordance with GAAP. In addition, not all companies use identical calculations, and the non - GAAP financial measures may not be comparable to other similarly titled measures of other companies. A reconciliation of the differences between these non - GAAP financial measures and the most directl y comparable financial measures presented in accordance with GAAP is included in the tables that follow. Adjusted EBITDA is comprised of EBITDA, adjusted for certain items as permitted or required by the lenders under our credit agreement in place at the end of each quarter in the periods presented. The tables that follow include an explanation of how adjusted EBITDA is calculated fo r e ach of the periods presented with the reconciliation to net income. EBITDA is defined as net earnings before interest expense, income taxes, depreciation an d amortization on a historical basis. Cash available to pay dividends represents adjusted EBITDA plus cash interest income less (1) cash interest expense, (2) capital e xpe nditures and (3) cash income taxes; this calculation differs in certain respects from the similar calculation used in our credit agreement. We present adjusted EBITDA, cash available to pay dividends and the related dividend payout ratio for several reasons. Manageme nt believes adjusted EBITDA, cash available to pay dividends and the dividend payout ratio are useful as a means to evaluate our ability to fund o ur estimated uses of cash (including interest on our debt) and pay dividends. In addition, we have presented adjusted EBITDA, cash available to pay div ide nds and the dividend payout ratio to investors in the past because they are frequently used by investors, securities analysts and other interested partie s i n the evaluation of companies in our industry, and management believes presenting them here provides a measure of consistency in our financial reporting. Adjusted EB ITDA and cash available to pay dividends, referred to as Available Cash in our credit agreement, are also components of the restrictive covenants and fi nan cial ratios contained in our credit agreement that requires us to maintain compliance with these covenants and limit certain activities, such as our ability to i ncu r debt and to pay dividends. The definitions in these covenants and ratios are based on adjusted EBITDA and cash available to pay dividends after giving effec t t o specified charges. In addition, adjusted EBITDA, cash available to pay dividends and the dividend payout ratio provide our board of directors with meaningful in formation to determine, with other data, assumptions and considerations, our dividend policy and our ability to pay dividends under the restrictive covena nts in our credit agreement and to measure our ability to service and repay debt. We present the related “total net debt to last twelve month adjusted EBITDA c ove rage ratio” principally to put other non - GAAP measures in context and facilitate comparisons by investors, security analysts and others; this ratio differs in certain respects from the similar ratio used in our credit agreement. These measures differ in certain respects from the ratios used in our senior notes inden tur e. These non - GAAP financial measures have certain shortcomings. In particular, adjusted EBITDA does not represent the residual cash flow s available for discretionary expenditures, since items such as debt repayment and interest payments are not deducted from such measure. Sim ila rly, while we may generate cash available to pay dividends, we are not required to use any such cash to pay dividends, and the payment of any dividends is subject to declaration by our board of directors, compliance with applicable law and the terms of our credit agreement. Because adjusted EBITDA is a compo nen t of the dividend payout ratio and the ratio of total net debt to last twelve month adjusted EBITDA, these measures are also subject to the material l imi tations discussed above. In addition, the ratio of total net debt to last twelve month adjusted EBITDA is subject to the risk that we may not be able to use the cash on the balance sheet to reduce our debt on a dollar - for - dollar basis. Management believes these ratios are useful as a means to evaluate our ability to incur additional indebtedness in the future. We present the non - GAAP measures adjusted diluted net income per share and adjusted diluted net income attributable to common stock holders because our net income and net income per share are regularly affected by items that occur at irregular intervals or are non - cash items. We believe that disclosing these measures assists investors, securities analysts and other interested parties in evaluating both our company over time and the re lative performance of the companies in our industry.
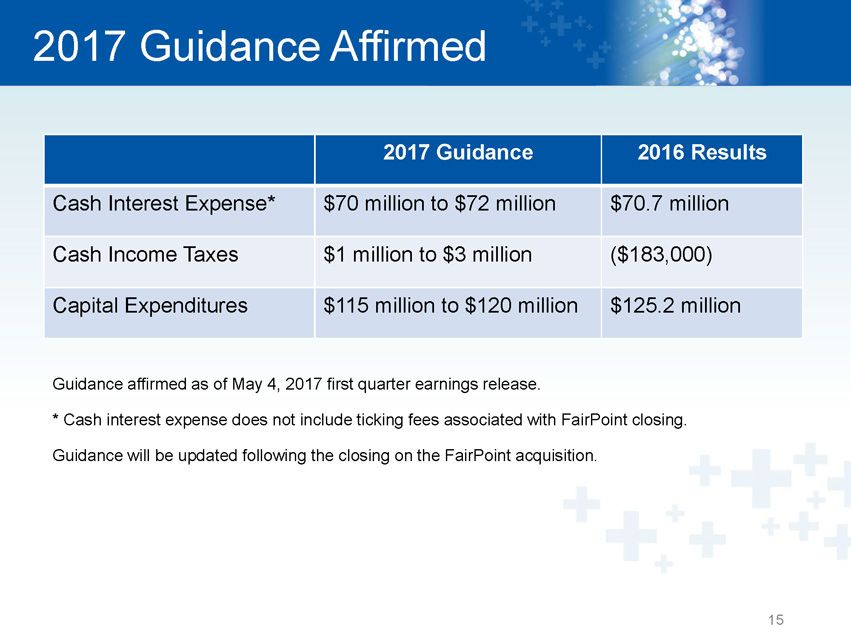
• Click to edit Master title style Click to edit Master title style 15 Guidance affirmed as of May 4, 2017 first quarter earnings release. * Cash interest expense does not include ticking fees associated with FairPoint closing. Guidance will be updated following the closing on the FairPoint acquisition. 2017 Guidance Affirmed 2017 Guidance 2016 Results Cash Interest Expense* $70 million to $72 million $70.7 million Cash Income Taxes $1 million to $3 million ($183,000) Capital Expenditures $115 million to $120 million $125.2 million
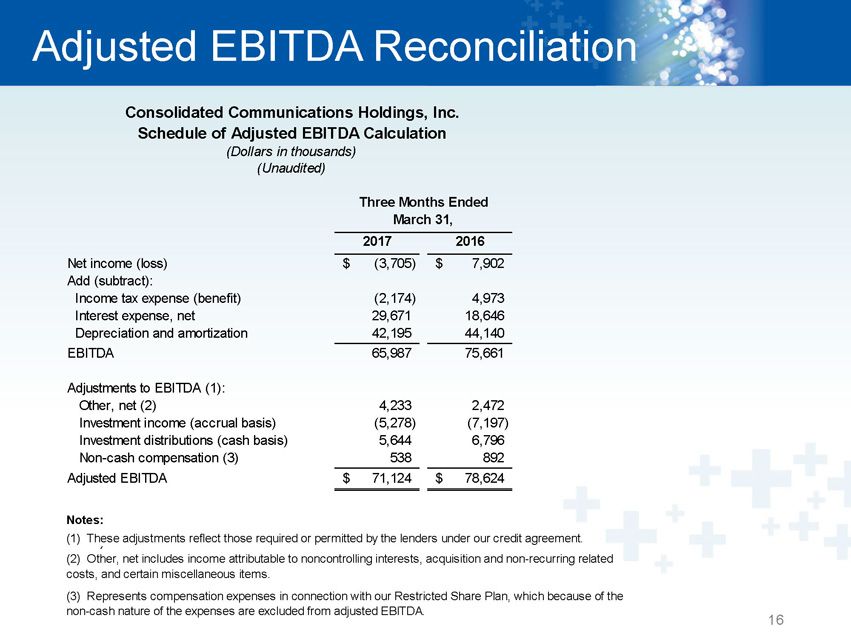
• Click to edit Master title style Click to edit Master title style 16 Adjusted EBITDA Reconciliation 2017 2016 Net income (loss) (3,705)$ 7,902$ Add (subtract): Income tax expense (benefit) (2,174) 4,973 Interest expense, net 29,671 18,646 Depreciation and amortization 42,195 44,140 EBITDA 65,987 75,661 Adjustments to EBITDA (1): Other, net (2) 4,233 2,472 Investment income (accrual basis) (5,278) (7,197) Investment distributions (cash basis) 5,644 6,796 Non-cash compensation (3) 538 892 Adjusted EBITDA 71,124$ 78,624$ Notes: Pennsylvania businesses. (2) Other, net includes income attributable to noncontrolling interests, acquisition and non-recurring related costs, and certain miscellaneous items. (3) Represents compensation expenses in connection with our Restricted Share Plan, which because of the non-cash nature of the expenses are excluded from adjusted EBITDA. Consolidated Communications Holdings, Inc. Schedule of Adjusted EBITDA Calculation (Dollars in thousands) (Unaudited) Three Months Ended March 31, (1) These adjustments reflect those required or permitted by the lenders under our credit agreement.
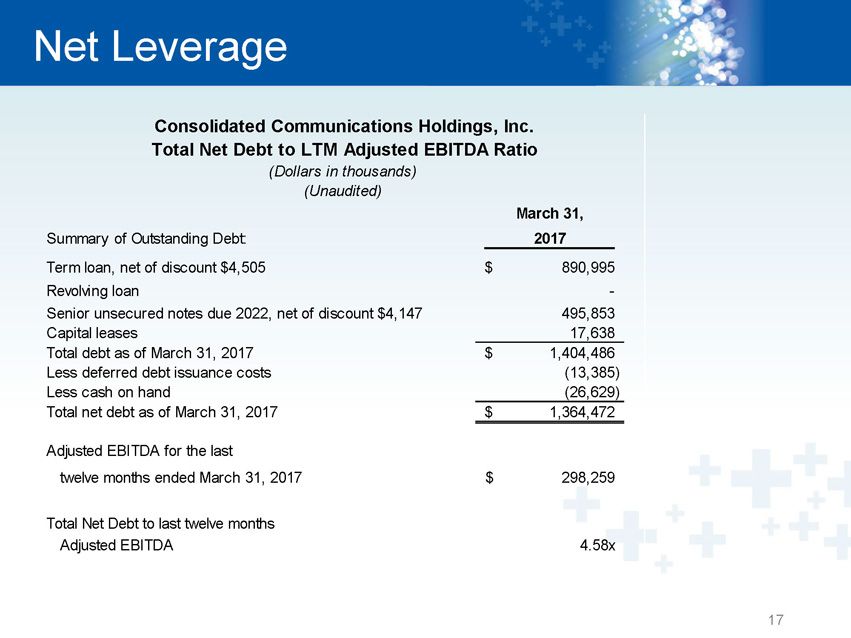
• Click to edit Master title style Click to edit Master title style 17 Net Leverage March 31, Summary of Outstanding Debt: 2017 Term loan, net of discount $4,505 890,995$ Revolving loan - Senior unsecured notes due 2022, net of discount $4,147 495,853 Capital leases 17,638 Total debt as of March 31, 2017 1,404,486$ Less deferred debt issuance costs (13,385) Less cash on hand (26,629) Total net debt as of March 31, 2017 1,364,472$ Adjusted EBITDA for the last twelve months ended March 31, 2017 298,259$ Total Net Debt to last twelve months Adjusted EBITDA 4.58x Consolidated Communications Holdings, Inc. Total Net Debt to LTM Adjusted EBITDA Ratio (Dollars in thousands) (Unaudited)
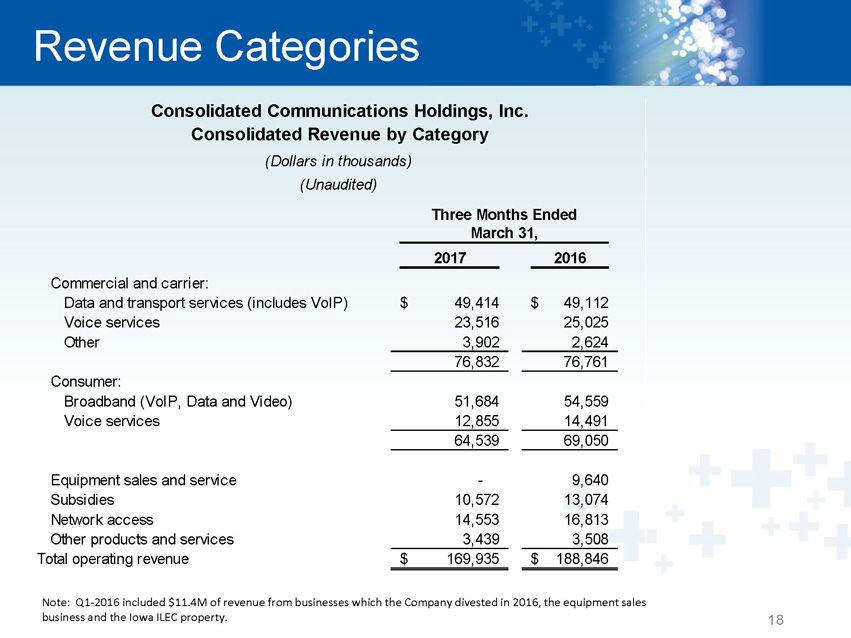
• Click to edit Master title style Click to edit Master title style 18 Revenue Categories 2017 2016 Commercial and carrier: Data and transport services (includes VoIP) 49,414$ 49,112$ Voice services 23,516 25,025 Other 3,902 2,624 76,832 76,761 Consumer: Broadband (VoIP, Data and Video) 51,684 54,559 Voice services 12,855 14,491 64,539 69,050 Equipment sales and service - 9,640 Subsidies 10,572 13,074 Network access 14,553 16,813 Other products and services 3,439 3,508 Total operating revenue 169,935$ 188,846$ Three Months Ended March 31, Consolidated Communications Holdings, Inc. Consolidated Revenue by Category (Dollars in thousands) (Unaudited) Note: Q1 - 2016 included $11.4M of revenue from businesses which the Company divested in 2016, the equipment sales business and the Iowa ILEC property.
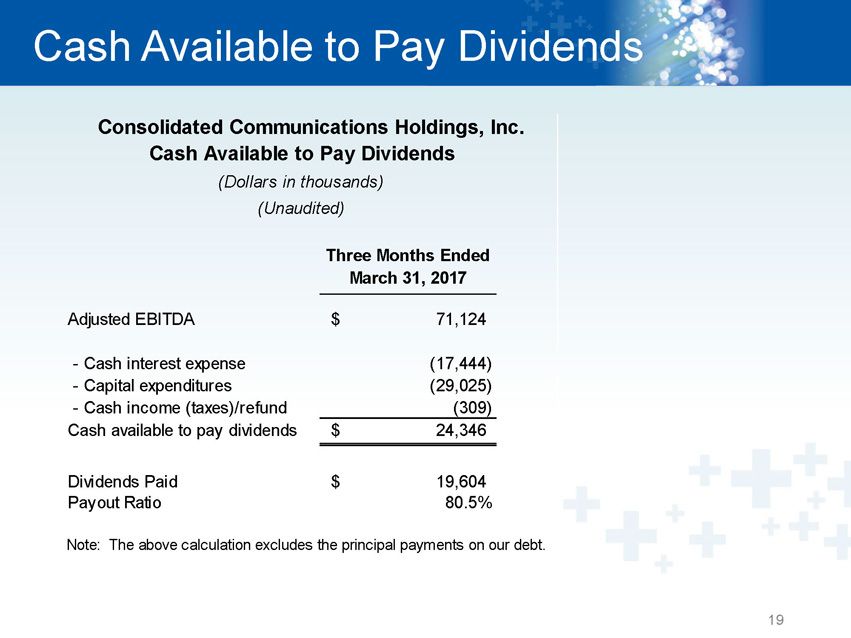
• Click to edit Master title style Click to edit Master title style Cash Available to Pay Dividends 19 Three Months Ended March 31, 2017 Adjusted EBITDA 71,124$ - Cash interest expense (17,444) - Capital expenditures (29,025) - Cash income (taxes)/refund (309) Cash available to pay dividends 24,346$ Dividends Paid 19,604$ Payout Ratio 80.5% Note: The above calculation excludes the principal payments on our debt. (Unaudited) Consolidated Communications Holdings, Inc. Cash Available to Pay Dividends (Dollars in thousands)