Attached files
| file | filename |
|---|---|
| 8-K - 8-K - Commercial Vehicle Group, Inc. | a8koppenheimer051017.htm |

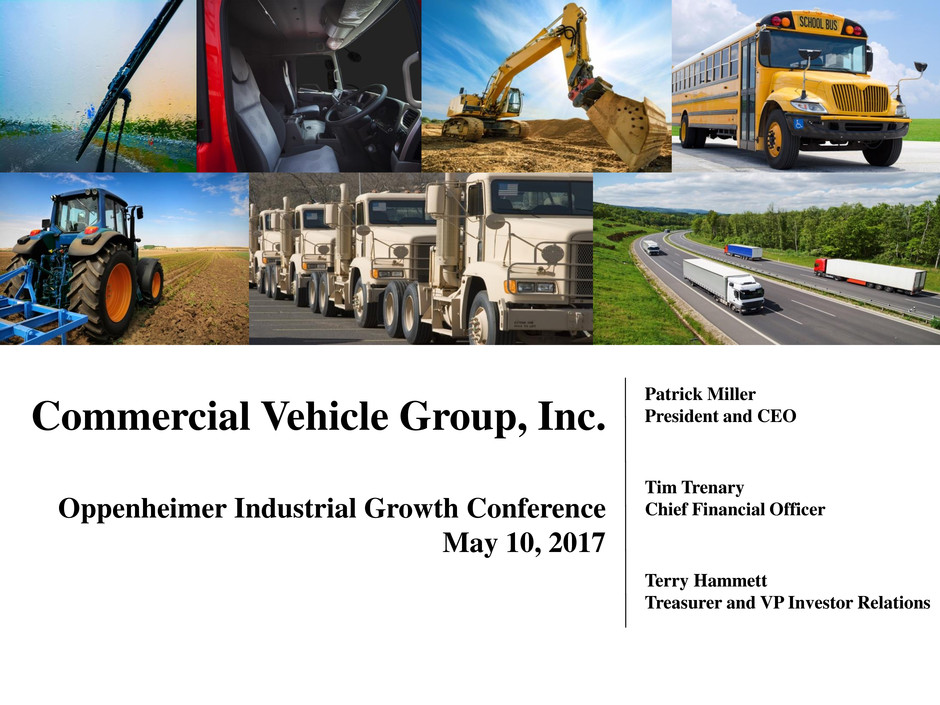
Commercial Vehicle Group, Inc.
Oppenheimer Industrial Growth Conference
May 10, 2017
Patrick Miller
President and CEO
Tim Trenary
Chief Financial Officer
Terry Hammett
Treasurer and VP Investor Relations

Forward Looking Statement
This press release contains forward-looking statements that are subject to risks and uncertainties. These statements often include words such as
"believe," "expect," "anticipate," "intend," "plan," "estimate," or similar expressions. In particular, this press release may contain forward-looking
statements about Company expectations for future periods with respect to its plans to improve financial results and enhance the Company, the future of
the Company’s end markets, Class 8 North America build rates, performance of the global construction equipment business, expected cost savings,
enhanced shareholder value and other economic benefits of the consulting services, the Company’s initiatives to address customer needs, organic
growth, the Company’s economic growth plans to focus on certain segments and markets and the Company’s financial position or other financial
information. These statements are based on certain assumptions that the Company has made in light of its experience in the industry as well as its
perspective on historical trends, current conditions, expected future developments and other factors it believes are appropriate under the circumstances.
Actual results may differ materially from the anticipated results because of certain risks and uncertainties, including but not limited to: (i) general
economic or business conditions affecting the markets in which the Company serves; (ii) the Company's ability to develop or successfully introduce new
products; (iii) risks associated with conducting business in foreign countries and currencies; (iv) increased competition in the heavy-duty truck,
construction, aftermarket, military, bus, agriculture and other markets; (v) the Company’s failure to complete or successfully integrate strategic
acquisitions; (vi) the impact of changes in governmental regulations on the Company's customers or on its business; (vii) the loss of business from a
major customer or the discontinuation of particular commercial vehicle platforms; (viii) the Company’s ability to obtain future financing due to changes in
the lending markets or its financial position; (ix) the Company’s ability to comply with the financial covenants in its revolving credit facility and term loan
facility; (x) fluctuation in interest rates relating to its term loan facility and revolving credit facility; (xi) the Company’s ability to realize the benefits of its
cost reduction and strategic initiatives; (xii) a material weakness in our internal control over financial reporting which could, if not remediated, result in
material misstatements in our financial statements; (xiii) volatility and cyclicality in the commercial vehicle market adversely affecting us; (xiv) the
geographic profile of our taxable income and changes in valuation of our deferred tax assets and liabilities impacting our effective tax rate; (xv) changes
to domestic manufacturing initiatives impacting our effective tax rate related to products manufactured either in the United States or in international
jurisdictions; (xvi) implementation of tax changes, by the United States or another international jurisdiction, related to products manufactured in one or
more jurisdictions where we do business; and (xvii) various other risks as outlined under the heading "Risk Factors" in the Company's Annual Report on
Form 10-K for fiscal year ending December 31, 2016. There can be no assurance that statements made in this press release relating to future events
will be achieved. The Company undertakes no obligation to update or revise forward-looking statements to reflect changed assumptions, the occurrence
of unanticipated events or changes to future operating results over time. All subsequent written and oral forward-looking statements attributable to the
Company or persons acting on behalf of the Company are expressly qualified in their entirety by such cautionary statements.
pg | 1
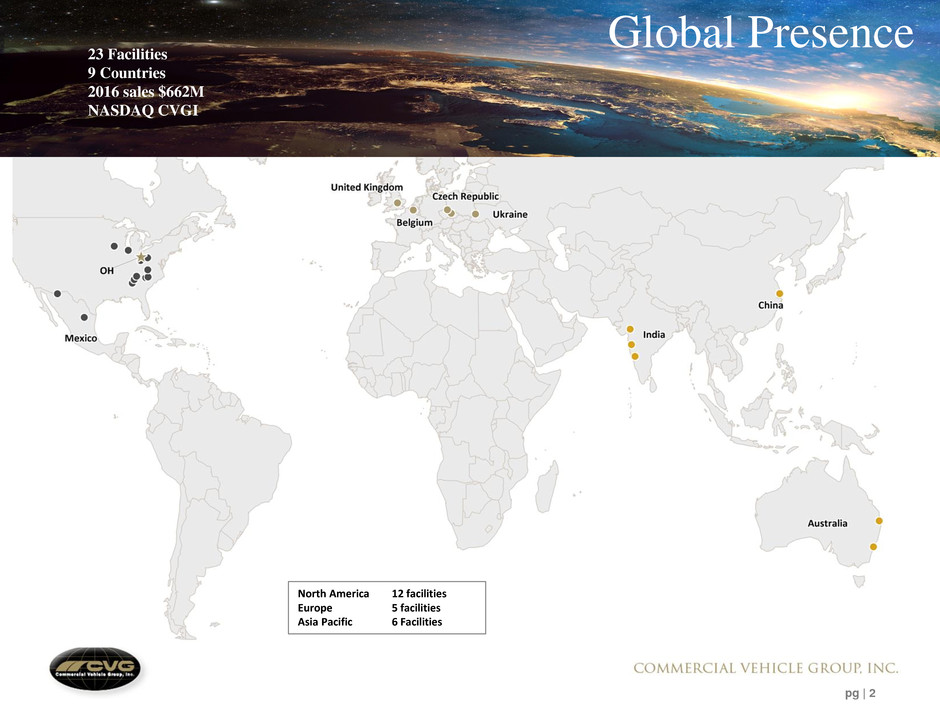
23 Facilities
9 Countries
2016 sales $662M
NASDAQ CVGI
Global Presence
pg | 2
North America 12 facilities
Europe 5 facilities
Asia Pacific 6 Facilities

Products
Seats & Seating
Systems
Cabs and Sleeper BoxesWiper Systems,
Mirrors & Controls
Wire Harnesses &
Controls
Interior Trim
pg | 3
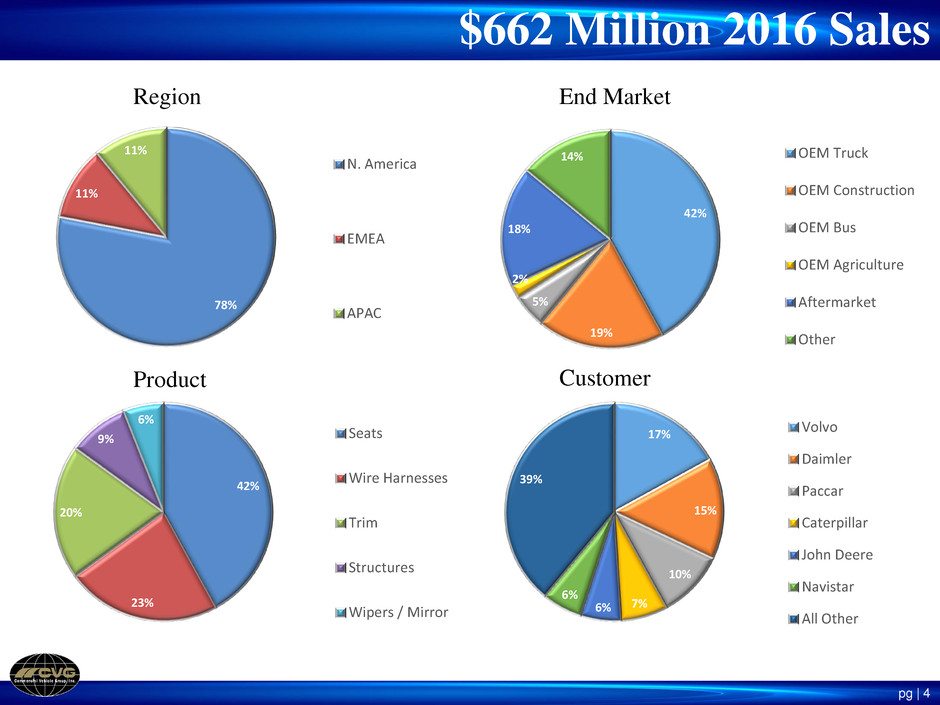
$662 Million 2016 Sales
pg | 4
78%
11%
11%
N. America
EMEA
APAC
42%
19%
5%
2%
18%
14% OEM Truck
OEM Construction
OEM Bus
OEM Agriculture
Aftermarket
Other
42%
23%
20%
9%
6%
Seats
Wire Harnesses
Trim
Structures
Wipers / Mirrors
17%
15%
10%
7%6%
6%
39%
Volvo
Daimler
Paccar
Caterpillar
John Deere
Navistar
All Other
Region End Market
Product Customer

2016 Business Segment Sales¹
pg | 5
1. Before intercompany sales eliminations
62%
19%
8%
2%
9% MD/HD Truck
OEMs
Aftermarket and
OE Service
Bus OEMs
Construction
OEMs
Other
Global Truck and Bus
$416 Million (62%)
47%
16%
14%
8%
5%
3%
7% Construction
Aftermarket and
OE Service
Automotive
Truck
Military
Agriculture
Global Construction and Agriculture
$254 Million (38%)

Industry Outlook – North America Truck
pg | 6
North American Truck Build Rates 2016 CVG Sales by End Market
(‘000s of units)
297 323 228 217 258
294 295 231
2014A 2015A 2016A 2017E 2018E 2019E 2020E 2021E
Heavy-Duty Truck (Class 8)
227 237 233
245 248 255
270 265
2014A 2015A 2016A 2017E 2018E 2019E 2020E 2021E
42%
19%
5%
2%
18%
14%
OEM Truck
OEM Bus
OEM
Agriculture
Aftermarket
*
Other
OEM Construction
Market Observations
Indicators point to a bottoming/recovery in the North American MD/HD
Truck market
HD Build rates projected to increase at 10.8% CAGR 2017 - 2020
Excess inventories are being reduced
Average age of class 8 fleet remains above historical averages
Indicators point to steady growth in medium-duty truck market
Medium-Duty Trucks (Class 5-7)
Source: Company website and filings, LMC Automotive, ACT Research, and Wall Street Research.
* Each segment has aftermarket exposure.
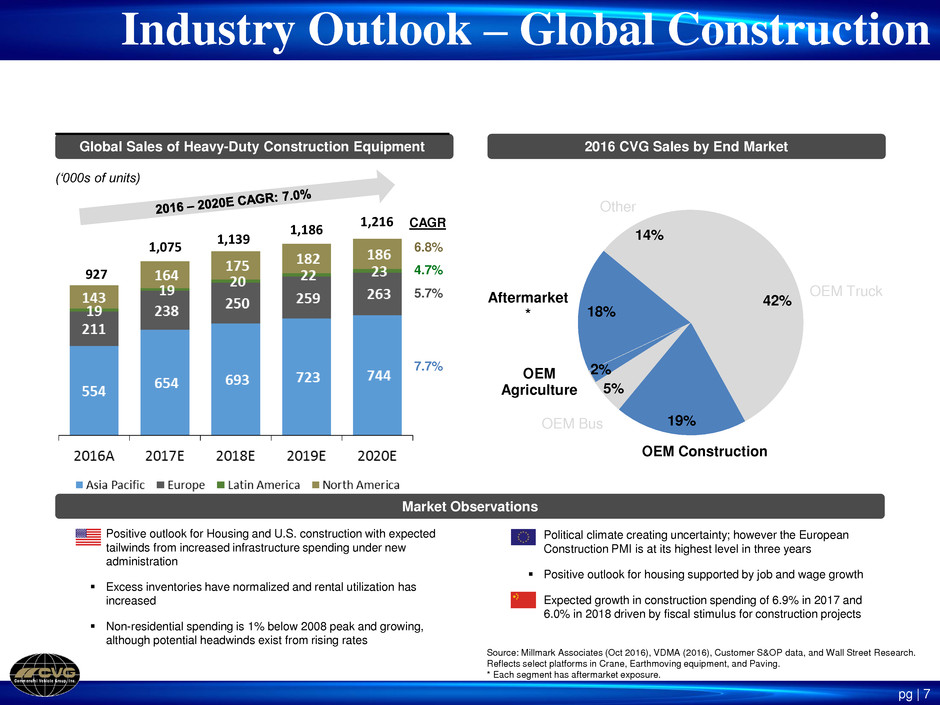
Industry Outlook – Global Construction
pg | 7
Global Sales of Heavy-Duty Construction Equipment
(‘000s of units)
2016 CVG Sales by End Market
42%
19%
5%
2%
18%
14%
OEM Truck
OEM Bus
OEM
Agriculture
Aftermarket
*
Other
Market Observations
CAGR
6.8%
4.7%
5.7%
7.7%
OEM Construction
Source: Millmark Associates (Oct 2016), VDMA (2016), Customer S&OP data, and Wall Street Research.
Reflects select platforms in Crane, Earthmoving equipment, and Paving.
* Each segment has aftermarket exposure.
927
1,075
1,139
1,186
1,216
Positive outlook for Housing and U.S. construction with expected
tailwinds from increased infrastructure spending under new
administration
Excess inventories have normalized and rental utilization has
increased
Non-residential spending is 1% below 2008 peak and growing,
although potential headwinds exist from rising rates
Political climate creating uncertainty; however the European
Construction PMI is at its highest level in three years
Positive outlook for housing supported by job and wage growth
Expected growth in construction spending of 6.9% in 2017 and
6.0% in 2018 driven by fiscal stimulus for construction projects

Strategies to Improve the Core
18% Fewer Sales
pg | 8
Restructuring and cost reductions
Executive leadership realigned
Major changes announced
Supply Chain - Leveraging globally, increasing standardization, and localizing supply
Lean/Six Sigma driving cost out
Over 600 belts granted in the past two years, including 47 black belts
Another 600 belts planned for 2017
Process investments
Interior trim in North America
More efficient seat assembly lines in US and UK
18% Fewer Sales
18% Fewer
Sales
pg | 9
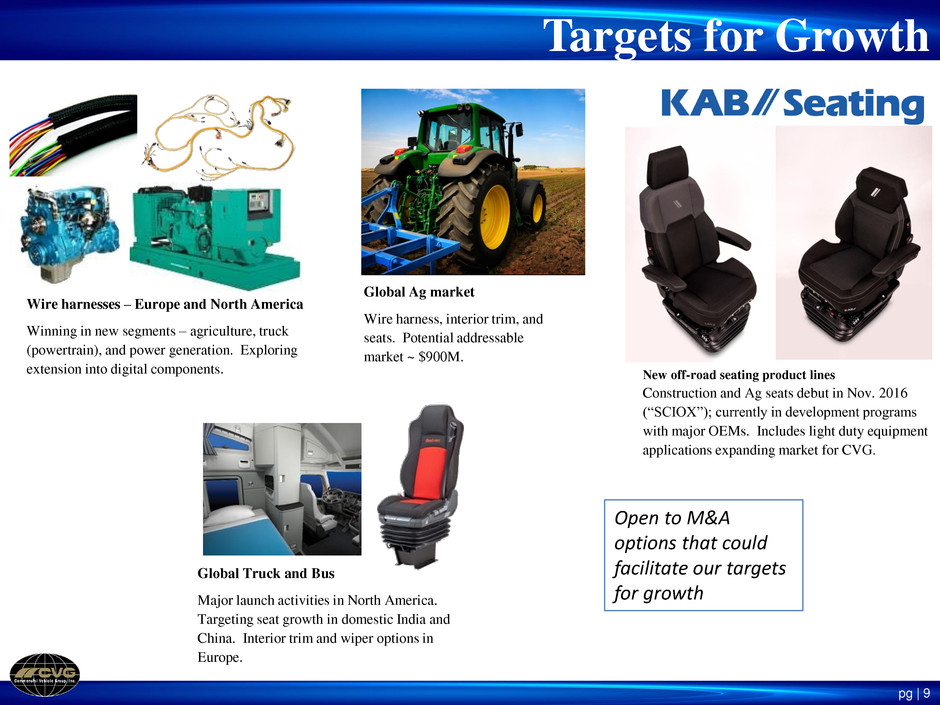
Targets for Growth
New off-road seating product lines
Construction and Ag seats debut in Nov. 2016
(“SCIOX”); currently in development programs
with major OEMs. Includes light duty equipment
applications expanding market for CVG.
Global Ag market
Wire harness, interior trim, and
seats. Potential addressable
market ~ $900M.
Wire harnesses – Europe and North America
Winning in new segments – agriculture, truck
(powertrain), and power generation. Exploring
extension into digital components.
Global Truck and Bus
Major launch activities in North America.
Targeting seat growth in domestic India and
China. Interior trim and wiper options in
Europe.
Open to M&A
options that could
facilitate our targets
for growth

FINANCIAL UPDATE

Financial Results
pg | 11
ACT outlook for
medium and heavy
duty truck production
(000’s)*
Class 8 Class 5-7
* Source: ACT Research
See appendix for reconciliation of GAAP to non-GAAP financial measures
Q1 Q4 Q1
(Dollars in millions) 2016 2016 2017
Sales 180.3 150.0 173.4 Reflects Q1 market improvement
Gross Profit 25.7 18.3 21.5
Margin 14.3 % 12.2 % 12.4 %
SG&A 16.8 14.0 16.6 Litigation settlement
Operating Income 8.6 3.9 4.6
Margin 4.8 % 2.6 % 2.6 %
Adjusted Operating Income 9.5 5.1 8.0
Margin 5.3 % 3.4 % 4.6 % 120 bps improvement from Q4
N.A. Class 8 Production (000's) 64 47 51 Up 9% from Q4
N.A. Class 5 - 7 Production (000's) 64 54 64 Up 19% from Q4

Business Segments¹
pg | 12
1. Before intercompany sales eliminations
See appendix for reconciliation of GAAP to non-GAAP financial measures
(Dollars in millions)
Global
Truck & Bus
Global
Construction
& Agriculture
Sales 102.1 73.5
Gross Profit 14.0 7.8
Margin 13.7 % 10.6 %
SG&A 5.5 4.5
Operating Income 8.3 3.3
Margin 8.1 % 4.5 %
Adjusted Operating Income 9.3 3.4
Margin 9.1 % 4.6 %
Three Months Ended March 31, 2017

See appendix for reconciliation of GAAP to non-GAAP financial measures
Capital Structure
pg | 13
Capital Allocation: 1.) liquidity 2.) growth 3.) de-leverage 4.) return capital to shareholders
Proforma
LTM Q1 Q1 2017
(Dollars in millions) 2015 2016 2017 (Refinancing)
Satisfaction & Discharge Filed - 4/12/17
Debt 235 235 235 175
Less: Cash 92 130 119 41
Net Debt 143 105 116 134 Principal Balance $ 175
Interest LIBOR + 600
Adjusted EBITDA 58 46 44 44 Due April 2023
Adjusted Gross Leverage 4.1 X 5.1 X 5.3 X 4.0 X
Adjusted Net Leverage 2.5 X 2.3 X 2.6 X 3.0 X Commitment $ 65
Availability $ 64
Letters of Credit $ 2
Liquidity: Accordion $ 40
Cash 41
ABL Borrowing Base 64
Less: LOC (2) Moody's B2 / Stable
Liquidity 103 S&P B / Stable
* Effective April 12, 2017
Term Loan*
Asset Based Credit Facility*
Agency Ratings
7.875% Senior Secured Notes
Commercial Vehicle Group, Inc.
Oppenheimer Industrial Growth Conference
May 10, 2017
Patrick Miller
President and CEO
Tim Trenary
Chief Financial Officer
Terry Hammett
Treasurer and VP Investor Relations
GAAP to Non-GAAP Reconciliation
APPENDIX

GAAP to Non-GAAP Reconciliation
Adjusted Operating Income Reconciliation
pg | 16
Q1 Q4 Q1
(Dollars in millions) 2016 2016 2017
Operating Income 8.6 3.9 4.6
Margin 4.8 % 2.6 % 2.6 %
Special Items:
Restructuring & Related 0.3 1.2 1.1
Litigation Settlement 2.3
Impaired Asset 0.6
Adjusted Operating Income 9.5 5.1 8.0
Margin 5.3 % 3.4 % 4.6 %

EBITDA & Adjusted EBITDA Reconciliation
GAAP to Non-GAAP Reconciliation
pg | 17
FY FY Q2 Q3 Q4 Q1 LTM
(Dollars in millions) 2015 2016 2016 2016 2016 2017 Q1 2017
Net Income 7.1 6.8 2.7 1.2 0.4 0.6 4.9
Interest Expense 21.4 19.3 4.9 5.0 4.5 4.9 19.3
Tax Provision (Benefit) 9.8 0.8 (1.5) (0.4) (0.6) (1.7)
Depreciation 16.4 15.2 3.7 3.8 3.6 3.6 14.7
Amortization 1.3 1.3 0.3 0.3 0.3 0.3 1.2
EBITDA 56.0 42.6 12.4 8.8 8.4 8.8 38.4
Restructuring & Related 2.3 3.5 0.5 1.5 1.2 1.1 4.3
Insurance Recovery (0.7) (0.7) (0.7)
Litigation Settlement 2.3 2.3
Impaired Asset 0.6
Adjusted EBITDA 58.3 46.0 12.9 10.3 8.9 12.2 44.3

GAAP to Non-GAAP Reconciliation
Business Segment Adjusted Operating Income Reconciliation
pg | 18
Three Months Ended March 31, 2017
(Dollars in millions)
Global Truck
& Bus
Global
Construction &
Agriculture
Operating Income 8.3 3.3
Special Items:
Restructuring & Related 1.0 0.1
Adjusted Operating Income 9.3 3.4
Margin 9.1 % 4.6%
