Attached files
| file | filename |
|---|---|
| 8-K - 8-K - CLOUD PEAK ENERGY INC. | a17-11900_38k.htm |
Exhibit 99.1
2017 Annual Stockholders’ Meeting Colin Marshall President and CEO
Cautionary Note Regarding Forward-Looking Statements This presentation contains “forward-looking statements” within the meaning of the safe harbor provisions of Section 27A of the Securities Act of 1933 and Section 21E of the Securities Exchange Act of 1934. Forward-looking statements are not statements of historical facts, and often contain words such as “may,” “will,” “expect,” “believe,” “anticipate,” “plan,” “estimate,” “seek,” “could,” “should,” “intend,” “potential,” or words of similar meaning. Forward-looking statements are based on management’s current expectations, beliefs, assumptions and estimates regarding our company, industry, economic conditions, government regulations, energy policies and other factors. These statements are subject to significant risks, uncertainties and assumptions that are difficult to predict and could cause actual results to differ materially and adversely from those expressed or implied in the forward-looking statements. For a description of some of the risks and uncertainties that may adversely affect our future results, refer to the risk factors described from time to time in the reports and registration statements we file with the Securities and Exchange Commission, including those in Item 1A "Risk Factors" of our most recent Form 10-K and any updates thereto in our Forms 10-Q and Forms 8-K. There may be other risks and uncertainties that are not currently known to us or that we currently believe are not material. We make forward-looking statements based on currently available information, and we assume no obligation to, and expressly disclaim any obligation to, update or revise publicly any forward-looking statements made in our presentation, whether as a result of new information, future events or otherwise, except as required by law. 2
Cloud Peak Energy 3
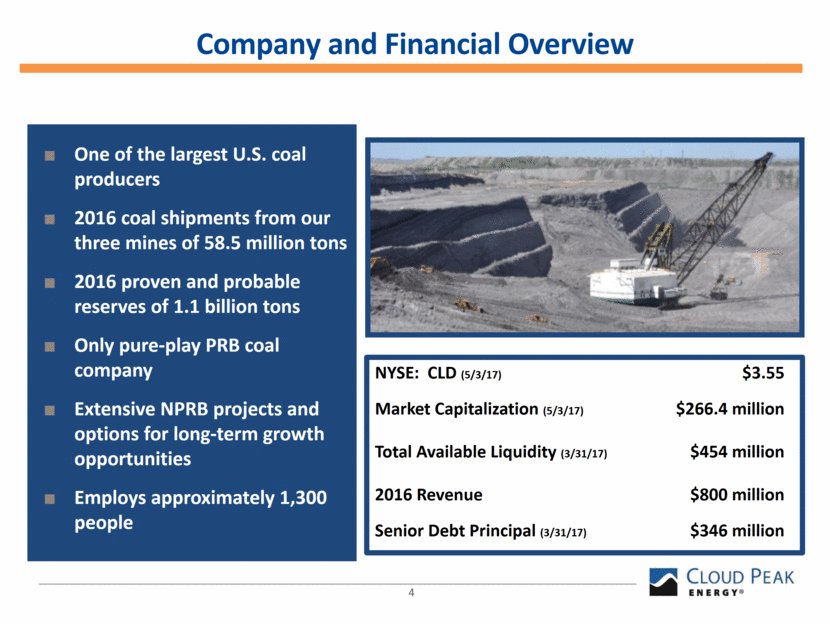
One of the largest U.S. coal producers 2016 coal shipments from our three mines of 58.5 million tons 2016 proven and probable reserves of 1.1 billion tons Only pure-play PRB coal company Extensive NPRB projects and options for long-term growth opportunities Employs approximately 1,300 people Company and Financial Overview NYSE: CLD (5/3/17) $3.55 Market Capitalization (5/3/17) $266.4 million Total Available Liquidity (3/31/17) $454 million 2016 Revenue $800 million Senior Debt Principal (3/31/17) $346 million 4
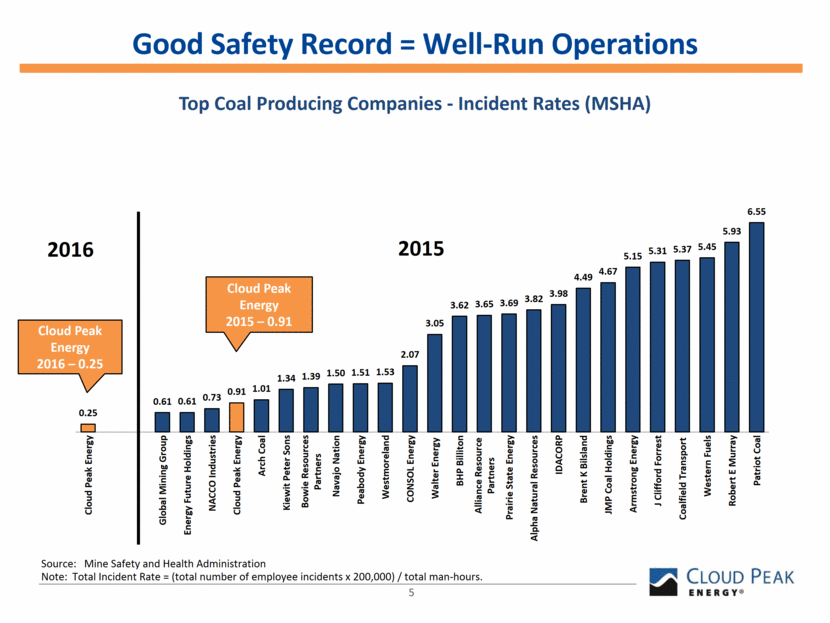
Good Safety Record = Well-Run Operations Source: Mine Safety and Health Administration Note: Total Incident Rate = (total number of employee incidents x 200,000) / total man-hours. 5 Top Coal Producing Companies - Incident Rates (MSHA) Cloud Peak Energy 2016 – 0.25 Cloud Peak Energy 2015 – 0.91 2016 0.25 0.61 0.61 0.73 0.91 1.01 1.34 1.39 1.50 1.51 1.53 2.07 3.05 3.62 3.65 3.69 3.82 3.98 4.49 4.67 5.15 5.31 5.37 5.45 5.93 6.55 Cloud Peak Energy Global Mining Group Energy Future Holdings NACCO Industries Cloud Peak Energy Arch Coal Kiewit Peter Sons Bowie Resources Partners Navajo Nation Peabody Energy Westmoreland CONSOL Energy Walter Energy BHP Billiton Alliance Resource Partners Prairie State Energy Alpha Natural Resources IDACORP Brent K Bilsland JMP Coal Holdings Armstrong Energy J Clifford Forrest Coalfield Transport Western Fuels Robert E Murray Patriot Coal 2015
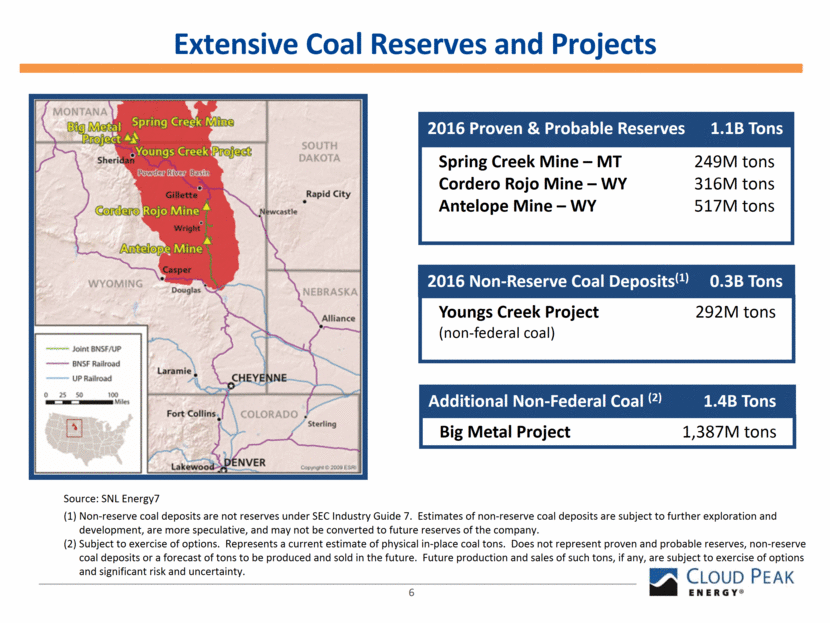
Extensive Coal Reserves and Projects Spring Creek Mine – MT 249M tons Cordero Rojo Mine – WY 316M tons Antelope Mine – WY 517M tons Youngs Creek Project 292M tons (non-federal coal) 2016 Non-Reserve Coal Deposits(1) 0.3B Tons Big Metal Project 1,387M tons Additional Non-Federal Coal (2) 1.4B Tons 2016 Proven & Probable Reserves 1.1B Tons Source: SNL Energy7 (1) Non-reserve coal deposits are not reserves under SEC Industry Guide 7. Estimates of non-reserve coal deposits are subject to further exploration and development, are more speculative, and may not be converted to future reserves of the company. (2) Subject to exercise of options. Represents a current estimate of physical in-place coal tons. Does not represent proven and probable reserves, non-reserve coal deposits or a forecast of tons to be produced and sold in the future. Future production and sales of such tons, if any, are subject to exercise of options and significant risk and uncertainty. 6
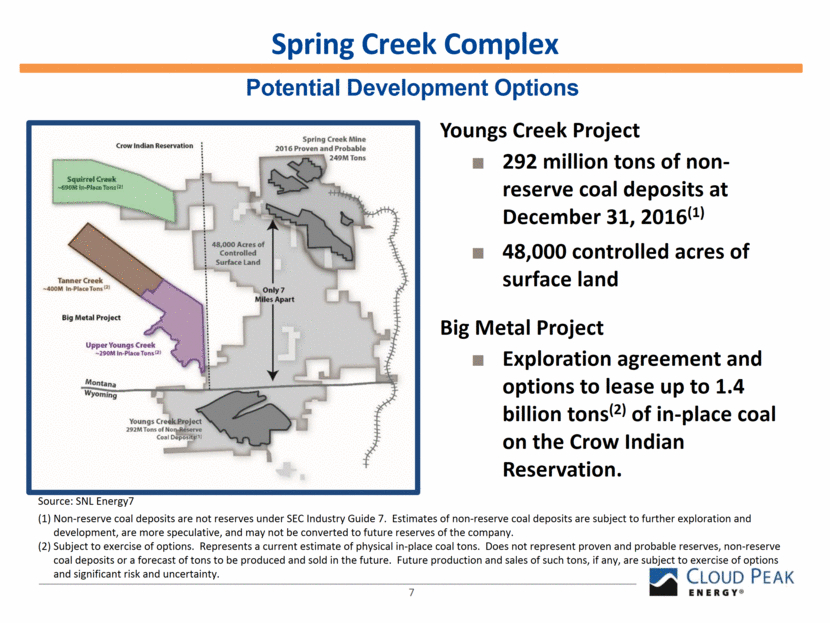
7 Spring Creek Complex Potential Development Options Youngs Creek Project 292 million tons of non-reserve coal deposits at December 31, 2016(1) 48,000 controlled acres of surface land Big Metal Project Exploration agreement and options to lease up to 1.4 billion tons(2) of in-place coal on the Crow Indian Reservation. Source: SNL Energy7 (1) Non-reserve coal deposits are not reserves under SEC Industry Guide 7. Estimates of non-reserve coal deposits are subject to further exploration and development, are more speculative, and may not be converted to future reserves of the company. (2) Subject to exercise of options. Represents a current estimate of physical in-place coal tons. Does not represent proven and probable reserves, non-reserve coal deposits or a forecast of tons to be produced and sold in the future. Future production and sales of such tons, if any, are subject to exercise of options and significant risk and uncertainty.
Domestic Coal Environment Conditions and Regulations 8
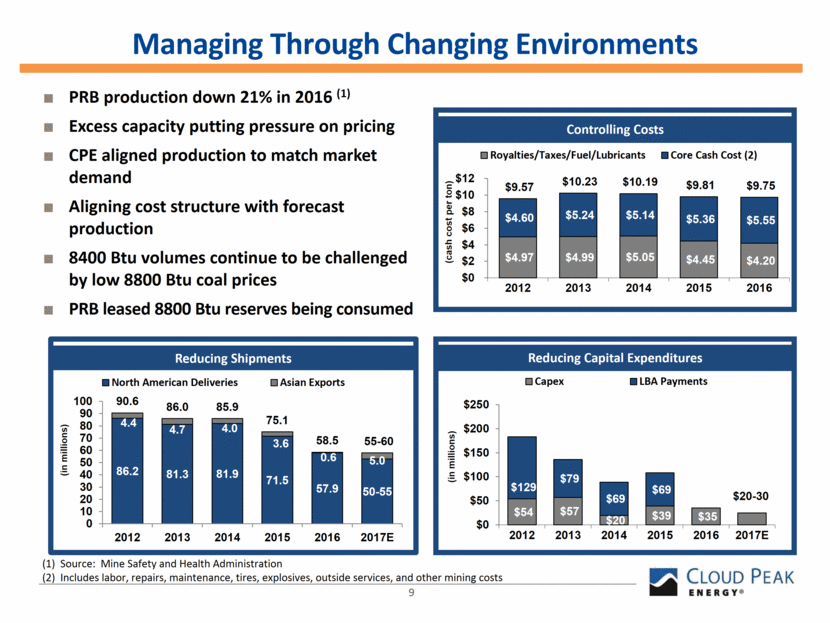
9 Managing Through Changing Environments PRB production down 21% in 2016 (1) Excess capacity putting pressure on pricing CPE aligned production to match market demand Aligning cost structure with forecast production 8400 Btu volumes continue to be challenged by low 8800 Btu coal prices PRB leased 8800 Btu reserves being consumed Controlling Costs Reducing Capital Expenditures (1) Source: Mine Safety and Health Administration (2) Includes labor, repairs, maintenance, tires, explosives, outside services, and other mining costs $4.97 $4.99 $5.05 $4.45 $4.20 $4.60 $5.24 $5.14 $5.36 $5.55 $9.57 $10.23 $10.19 $9.81 $9.75 $0 $2 $4 $6 $8 $10 $12 2012 2013 2014 2015 2016 (cash cost per ton) Royalties/Taxes/Fuel/Lubricants Core Cash Cost (2) 86.2 81.3 81.9 71.5 57.9 50 - 55 4.4 4.7 4.0 3.6 0.6 5.0 90.6 86.0 85.9 75.1 58.5 55 - 60 0 10 20 30 40 50 60 70 80 90 100 2012 2013 2014 2015 2016 2017E (in millions) North American Deliveries Asian Exports Reducing Shipments $54 $57 $20 $39 $35 $20 - 30 $129 $79 $69 $69 $0 $50 $100 $150 $200 $250 2012 2013 2014 2015 2016 2017E (in millions) Capex LBA Payments
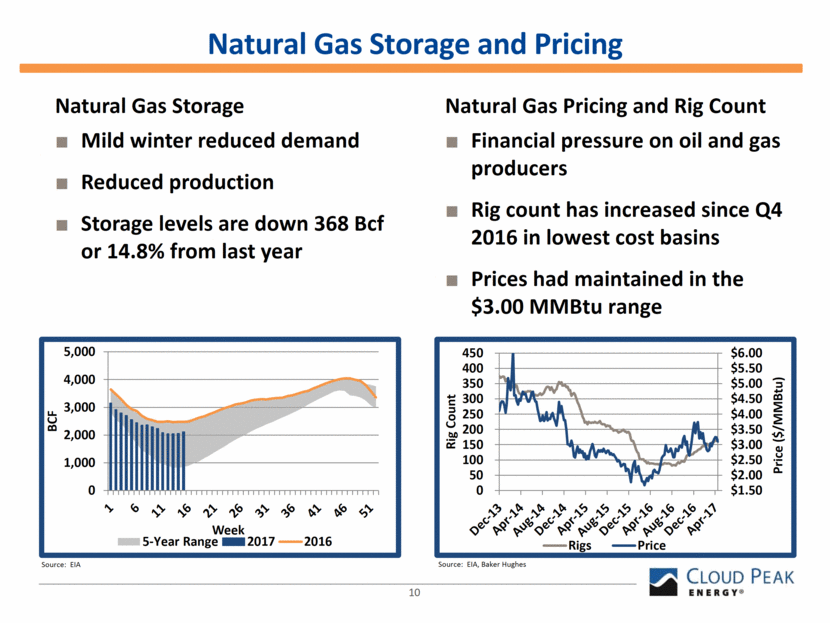
Natural Gas Storage and Pricing Natural Gas Storage Mild winter reduced demand Reduced production Storage levels are down 368 Bcf or 14.8% from last year Natural Gas Pricing and Rig Count Financial pressure on oil and gas producers Rig count has increased since Q4 2016 in lowest cost basins Prices had maintained in the $3.00 MMBtu range 10 Source: EIA Source: EIA, Baker Hughes $1.50 $2.00 $2.50 $3.00 $3.50 $4.00 $4.50 $5.00 $5.50 $6.00 0 50 100 150 200 250 300 350 400 450 Price ($/MMBtu) Rig Count Rigs Price 0 1,000 2,000 3,000 4,000 5,000 BCF Week 5-Year Range 2017 2016
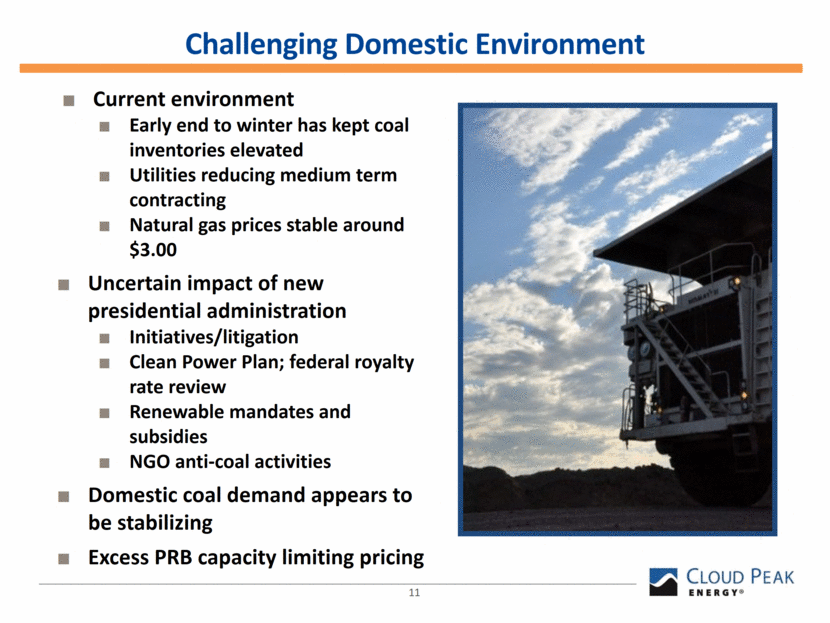
Challenging Domestic Environment Current environment Early end to winter has kept coal inventories elevated Utilities reducing medium term contracting Natural gas prices stable around $3.00 Uncertain impact of new presidential administration Initiatives/litigation Clean Power Plan; federal royalty rate review Renewable mandates and subsidies NGO anti-coal activities Domestic coal demand appears to be stabilizing Excess PRB capacity limiting pricing 11
Export Environment 12
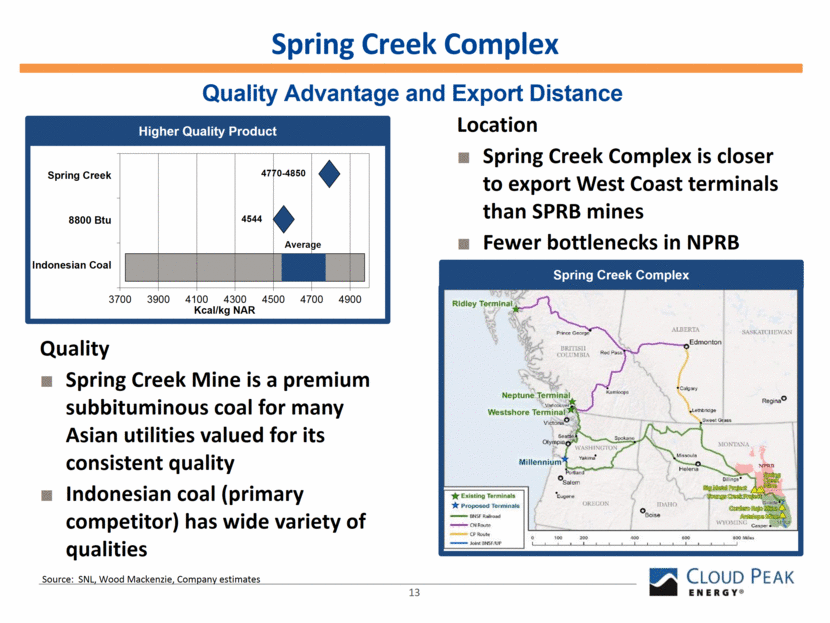
13 Spring Creek Complex Quality Advantage and Export Distance 4770-4850 4544 Average Source: SNL, Wood Mackenzie, Company estimates Higher Quality Product Location Spring Creek Complex is closer to export West Coast terminals than SPRB mines Fewer bottlenecks in NPRB Quality Spring Creek Mine is a premium subbituminous coal for many Asian utilities valued for its consistent quality Indonesian coal (primary competitor) has wide variety of qualities Spring Creek Complex 3700 3900 4100 4300 4500 4700 4900 Indonesian Coal 8800 Btu Spring Creek Kcal/kg NAR
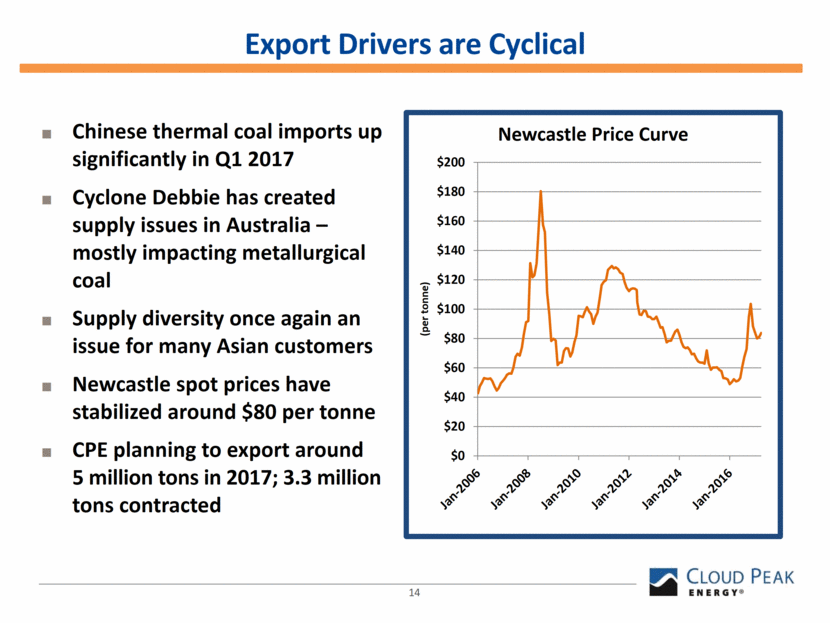
14 Chinese thermal coal imports up significantly in Q1 2017 Cyclone Debbie has created supply issues in Australia – mostly impacting metallurgical coal Supply diversity once again an issue for many Asian customers Newcastle spot prices have stabilized around $80 per tonne CPE planning to export around 5 million tons in 2017; 3.3 million tons contracted Export Drivers are Cyclical $0 $20 $40 $60 $80 $100 $120 $140 $160 $180 $200 (per tonne) Newcastle Price Curve
Finance 15
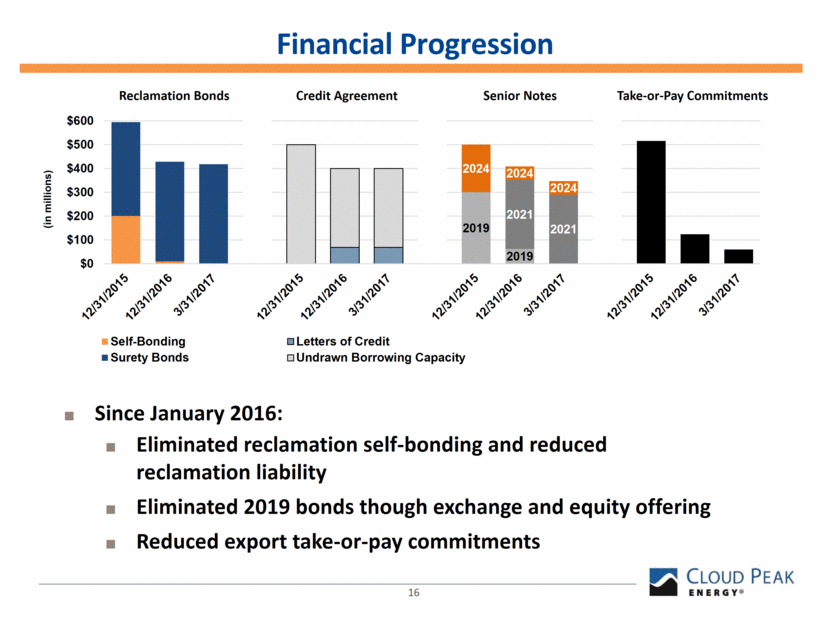
Financial Progression Reclamation Bonds Credit Agreement Senior Notes Take-or-Pay Commitments 16 Since January 2016: Eliminated reclamation self-bonding and reduced reclamation liability Eliminated 2019 bonds though exchange and equity offering Reduced export take-or-pay commitments 2019 2019 2021 2021 2024 2024 2024 $0 $100 $200 $300 $400 $500 $600 (in millions) Self-Bonding Letters of Credit Surety Bonds Undrawn Borrowing Capacity
Summary Domestic coal demand appears to be stabilizing Future demand dependent on natural gas prices Excess PRB capacity currently limiting pricing Operations managing costs as volumes reduce Positioned to make export sales when economic Strong reserve position with Spring Creek Complex development potential Strong available liquidity with no debt maturities until 2021 17
Questions? 18