Attached files
| file | filename |
|---|---|
| EX-32 - EXHIBIT 32 - AXON ENTERPRISE, INC. | ex32-33117.htm |
| EX-31.2 - EXHIBIT 31.2 - AXON ENTERPRISE, INC. | ex312-33117.htm |
| EX-31.1 - EXHIBIT 31.1 - AXON ENTERPRISE, INC. | ex311-33117.htm |
UNITED STATES
SECURITIES AND EXCHANGE COMMISSION
Washington, D.C. 20549
Form 10-Q |
(Mark One)
x | QUARTERLY REPORT PURSUANT TO SECTION 13 OR 15(d) OF THE SECURITIES EXCHANGE ACT OF 1934 |
For the quarterly period ended March 31, 2017
or
¨ | TRANSITION REPORT PURSUANT TO SECTION 13 OR 15(d) OF THE SECURITIES EXCHANGE ACT OF 1934 |
For the transition period from to
Commission File Number: 001-16391
Axon Enterprise, Inc. (Exact name of registrant as specified in its charter) |
Delaware | 86-0741227 | |
(State or other jurisdiction of incorporation or organization) | (I.R.S. Employer Identification No.) | |
17800 North 85th Street Scottsdale, Arizona | 85255 | |
(Address of principal executive offices) | (Zip Code) | |
(480) 991-0797
(Registrant’s telephone number, including area code)
Not Applicable
(Former name, former address and former fiscal year, if changed since last report)
Indicate by check mark whether the registrant: (1) has filed all reports required to be filed by Section 13 or 15(d) of the Securities Exchange Act of 1934 during the preceding 12 months (or for such shorter period that the registrant was required to file such reports), and (2) has been subject to such filing requirements for the past 90 days. Yes ý No ¨
Indicate by check mark whether the registrant has submitted electronically and posted on its corporate Website, if any, every Interactive Data File required to be submitted and posted pursuant to Rule 405 of Regulation S-T (§232.405 of this chapter) during the preceding 12 months (or for such shorter period that the registrant was required to submit and post such files). Yes ý No ¨
Indicate by check mark whether the registrant is a large accelerated filer, an accelerated filer, a non-accelerated filer, smaller reporting company, or an emerging growth company. See the definitions of “large accelerated filer,” “accelerated filer”, “smaller reporting company” and “emerging growth company” in Rule 12b-2 of the Exchange Act.
Large accelerated filer | ý | Accelerated filer | ¨ | ||
Non-accelerated filer | ¨ (Do not check if a smaller reporting company) | Smaller reporting company | ¨ | ||
If an emerging growth company, indicate by check mark if the registrant has elected not to use the extended transition period for complying with any new or revised financial accounting standards provided pursuant to Section 13(a) of the Exchange Act. ¨
Indicate by check mark whether the registrant is a shell company (as defined in Rule 12b-2 of the Exchange Act). Yes ¨ No ý
The number of shares of the registrant’s common stock outstanding as of April 28, 2017 was 52,725,058.
AXON ENTERPRISE, INC.
INDEX TO QUARTERLY REPORT ON FORM 10-Q
FOR THE QUARTERLY PERIOD ENDED MARCH 31, 2017
Page | |||
2
PART I - FINANCIAL INFORMATION
Item 1. Financial Statements
AXON ENTERPRISE, INC.
CONDENSED CONSOLIDATED BALANCE SHEETS
(in thousands, except share data)
March 31, 2017 | December 31, 2016 | ||||||
(Unaudited) | |||||||
ASSETS | |||||||
Current assets: | |||||||
Cash and cash equivalents | $ | 41,974 | $ | 40,651 | |||
Short-term investments | 29,630 | 48,415 | |||||
Accounts and notes receivable, net of allowance of $765 and $443 as of March 31, 2017 and December 31, 2016, respectively | 44,328 | 39,466 | |||||
Inventory | 48,699 | 34,841 | |||||
Prepaid expenses and other current assets | 15,707 | 13,858 | |||||
Total current assets | 180,338 | 177,231 | |||||
Property and equipment, net of accumulated depreciation of $33,794 and $37,799 as of March 31, 2017 and December 31, 2016, respectively | 26,399 | 24,004 | |||||
Deferred income tax assets, net | 20,055 | 19,515 | |||||
Intangible assets, net | 20,256 | 15,218 | |||||
Goodwill | 13,001 | 10,442 | |||||
Long-term investments | — | 234 | |||||
Long-term accounts and notes receivable, net of current portion | 24,688 | 17,602 | |||||
Other assets | 14,781 | 13,917 | |||||
Total assets | $ | 299,518 | $ | 278,163 | |||
LIABILITIES AND STOCKHOLDERS’ EQUITY | |||||||
Current liabilities: | |||||||
Accounts payable | $ | 15,632 | $ | 10,736 | |||
Accrued liabilities | 20,330 | 18,248 | |||||
Current portion of deferred revenue | 49,909 | 45,137 | |||||
Customer deposits | 2,445 | 2,148 | |||||
Current portion of business acquisition contingent consideration | 1,705 | 1,690 | |||||
Other current liabilities | 467 | 80 | |||||
Total current liabilities | 90,488 | 78,039 | |||||
Deferred revenue, net of current portion | 41,644 | 40,054 | |||||
Liability for unrecognized tax benefits | 2,030 | 1,896 | |||||
Long-term deferred compensation | 3,407 | 3,362 | |||||
Business acquisition contingent consideration, net of current portion | 2,664 | 1,635 | |||||
Other long-term liabilities | 1,895 | 2,289 | |||||
Total liabilities | 142,128 | 127,275 | |||||
Commitments and contingencies (Note 11) | |||||||
Stockholders’ equity: | |||||||
Preferred stock, $0.00001 par value; 25,000,000 shares authorized; no shares issued and outstanding as of March 31, 2017 and December 31, 2016 | — | — | |||||
Common stock, $0.00001 par value; 200,000,000 shares authorized; 52,593,417 and 52,325,251 shares issued and outstanding as of March 31, 2017 and December 31, 2016, respectively | 1 | 1 | |||||
Additional paid-in capital | 189,710 | 187,656 | |||||
Treasury stock at cost, 20,220,227 shares as of March 31, 2017 and December 31, 2016 | (155,947 | ) | (155,947 | ) | |||
Retained earnings | 122,558 | 118,275 | |||||
Accumulated other comprehensive income | 1,068 | 903 | |||||
Total stockholders’ equity | 157,390 | 150,888 | |||||
Total liabilities and stockholders’ equity | $ | 299,518 | $ | 278,163 | |||
The accompanying notes are an integral part of these condensed consolidated financial statements.
3
AXON ENTERPRISE, INC.
UNAUDITED CONDENSED CONSOLIDATED STATEMENTS OF OPERATIONS
AND COMPREHENSIVE INCOME
(in thousands, except per share data)
Three Months Ended March 31, | |||||||
2017 | 2016 | ||||||
Net sales | $ | 79,242 | $ | 55,530 | |||
Cost of products sold and services delivered | 30,572 | 18,628 | |||||
Gross margin | 48,670 | 36,902 | |||||
Operating expenses: | |||||||
Sales, general and administrative | 30,857 | 24,833 | |||||
Research and development | 12,463 | 6,927 | |||||
Total operating expenses | 43,320 | 31,760 | |||||
Income from operations | 5,350 | 5,142 | |||||
Interest and other income, net | 206 | 118 | |||||
Income before provision for income taxes | 5,556 | 5,260 | |||||
Provision for income taxes | 976 | 1,797 | |||||
Net income | $ | 4,580 | $ | 3,463 | |||
Net income per common and common equivalent shares: | |||||||
Basic | $ | 0.09 | $ | 0.06 | |||
Diluted | $ | 0.09 | $ | 0.06 | |||
Weighted average number of common and common equivalent shares outstanding: | |||||||
Basic | 52,418 | 53,693 | |||||
Diluted | 53,677 | 54,789 | |||||
UNAUDITED CONDENSED CONSOLIDATED STATEMENTS OF COMPREHENSIVE INCOME | |||||||
Net income | $ | 4,580 | $ | 3,463 | |||
Foreign currency translation adjustments | 165 | 234 | |||||
Comprehensive income | $ | 4,745 | $ | 3,697 | |||
The accompanying notes are an integral part of these condensed consolidated financial statements.
4
AXON ENTERPRISE, INC.
UNAUDITED CONDENSED CONSOLIDATED STATEMENTS OF CASH FLOWS
(in thousands)
Three Months Ended March 31, | |||||||
2017 | 2016 | ||||||
Cash flows from operating activities: | |||||||
Net income | $ | 4,580 | $ | 3,463 | |||
Adjustments to reconcile net income to net cash provided by (used in) operating activities: | |||||||
Depreciation and amortization | 1,604 | 901 | |||||
Purchase accounting adjustments to goodwill | — | 372 | |||||
Gain on disposal of property and equipment, net | — | (23 | ) | ||||
Bond premium amortization | 218 | 375 | |||||
Stock-based compensation | 3,447 | 2,220 | |||||
Deferred income taxes | (1,216 | ) | (721 | ) | |||
Unrecognized tax benefits | 134 | 96 | |||||
Tax shortfall from stock-based compensation | — | 21 | |||||
Change in assets and liabilities: | |||||||
Accounts and notes receivable | (3,538 | ) | (2,195 | ) | |||
Inventory | (13,686 | ) | (4,327 | ) | |||
Prepaid expenses and other assets | (11,027 | ) | (4,070 | ) | |||
Accounts payable, accrued and other liabilities | 6,264 | 5,560 | |||||
Deferred revenue | 6,313 | 4,380 | |||||
Customer deposits | 298 | 1,041 | |||||
Net cash provided by (used in) operating activities | (6,609 | ) | 7,093 | ||||
Cash flows from investing activities: | |||||||
Purchases of investments | — | (20,328 | ) | ||||
Proceeds from call / maturity of investments | 18,801 | 18,033 | |||||
Purchases of property and equipment | (2,343 | ) | (1,280 | ) | |||
Proceeds from disposal of property and equipment | — | 36 | |||||
Purchases of intangible assets | (95 | ) | (98 | ) | |||
Business acquisitions, net of cash acquired | (6,479 | ) | — | ||||
Net cash provided by (used in) investing activities | 9,884 | (3,637 | ) | ||||
Cash flows from financing activities: | |||||||
Repurchase of common stock | — | (8,962 | ) | ||||
Proceeds from options exercised | 296 | 30 | |||||
Payroll tax payments for net-settled stock awards | (2,165 | ) | (744 | ) | |||
Payments on capital lease obligation | (8 | ) | (10 | ) | |||
Payments on notes payable | — | (15 | ) | ||||
Tax shortfall from stock-based compensation | — | (21 | ) | ||||
Net cash used in financing activities | (1,877 | ) | (9,722 | ) | |||
Effect of exchange rate changes on cash and cash equivalents | (75 | ) | 105 | ||||
Net decrease in cash and cash equivalents | 1,323 | (6,161 | ) | ||||
Cash and cash equivalents, beginning of period | 40,651 | 59,526 | |||||
Cash and cash equivalents, end of period | $ | 41,974 | $ | 53,365 | |||
Supplemental disclosure: | |||||||
Cash paid for income taxes, net of refunds | $ | 145 | $ | 3,533 | |||
Non-cash transactions | |||||||
Property and equipment purchases in accounts payable and accrued liabilities | $ | 794 | $ | 54 | |||
Contingent consideration related to business combinations | $ | 1,007 | $ | — | |||
The accompanying notes are an integral part of these condensed consolidated financial statements.
5
AXON ENTERPRISE, INC.
NOTES TO UNAUDITED CONDENSED CONSOLIDATED FINANCIAL STATEMENTS
1. Organization and Summary of Significant Accounting Policies
Axon Enterprise, Inc. (“Axon” or the “Company”), formerly known as TASER International, Inc., is a developer and manufacturer of advanced conducted electrical weapons (“CEWs”) designed for use by law enforcement, military, corrections, and private security personnel, and by private individuals for personal defense. In addition, the Company has developed full technology solutions for the capture, storage and management of video/audio evidence as well as other tactical capabilities for use in law enforcement. The Company sells its products worldwide through its direct sales force, distribution partners, online store and third-party resellers. The Company was incorporated in Arizona in September 1993, and reincorporated in Delaware in January 2001. The Company’s corporate headquarters and manufacturing facilities are located in Scottsdale, Arizona. The Company’s software development unit facility is located in Seattle, Washington. Axon Public Safety BV, formerly known as TASER International BV, a wholly owned subsidiary of the Company, serves as the Company's international headquarters, and is located in Amsterdam, Netherlands. Axon Public Safety BV wholly owns two subsidiaries, Axon Public Safety U.K. LTD and Axon Public Safety AU, that serve as direct sales operations in the United Kingdom and Australia, respectively. The Company also sells to certain international markets through a wholly owned subsidiary, Axon Public Safety Germany SE, formerly known as TASER International SE. In 2015, the Company formed Axon Public Safety Canada, Inc., a wholly owned subsidiary, to facilitate transactions for its products and services with new and existing customers located in Canada.
The accompanying unaudited condensed consolidated financial statements include the accounts of the Company and its subsidiaries. All material intercompany accounts, transactions, and profits have been eliminated.
a. Basis of Presentation and Use of Estimates
These unaudited condensed consolidated financial statements have been prepared pursuant to the rules and regulations of the Securities and Exchange Commission. Certain information related to the Company’s organization, significant accounting policies and footnote disclosures normally included in financial statements prepared in accordance with accounting principles generally accepted in the United States (“US GAAP”) has been condensed or omitted. The accounting policies followed in the preparation of these unaudited condensed consolidated financial statements are consistent with those followed in the Company’s annual consolidated financial statements for the year ended December 31, 2016, as filed on Form 10-K. In the opinion of management, these unaudited condensed consolidated financial statements contain all material adjustments, consisting only of normal recurring adjustments, necessary to fairly state the Company’s financial position, results of operations and cash flows for the periods presented and the presentations and disclosures herein are adequate when read in conjunction with the Company’s Form 10-K for the year ended December 31, 2016. The results of operations for the three months ended March 31, 2017 and 2016 are not necessarily indicative of the results to be expected for the full year (or any other period). Significant estimates and assumptions in these unaudited condensed consolidated financial statements include:
• | product warranty reserves, |
• | inventory valuation, |
• | revenue recognition allocated in multiple-deliverable contracts or arrangements, |
• | valuation of goodwill, intangibles and long-lived assets, |
• | recognition, measurement and valuation of current and deferred income taxes, |
• | fair value of stock awards issued and the estimated vesting period for performance-based stock awards, and |
• | recognition and measurement of contingencies and accrued litigation expense. |
Actual results could differ materially from those estimates.
b. Segment Information
The Company is comprised of two reportable segments: the manufacture and sale of CEWs, accessories and other products and services (the “TASER Weapons” segment); and the software and sensors business, which includes the TASER Cam, Axon cameras and related accessories, Evidence.com, and the Axon Artificial Intelligence team ("Axon AI") (collectively the “Software and Sensors” segment), formerly known as the Axon segment. The composition of the Software and Sensors segment remained unchanged, and represents only a change in name. Reportable segments are determined based on discrete financial information reviewed by the Company’s Chief Executive Officer who is the Chief Operating Decision Maker (the “CODM”) for the Company. The Company organizes and reviews operations based on products and services, and currently there are no operating segments that are aggregated. The Company performs an annual analysis of its reportable segments. Additional information related to the Company’s business segments is summarized in Note 14.
6
AXON ENTERPRISE, INC.
NOTES TO UNAUDITED CONDENSED CONSOLIDATED FINANCIAL STATEMENTS – (Continued)
c. Geographic Information and Major Customers
For the three months ended March 31, 2017 and 2016, net sales by geographic area were as follows (in thousands):
Three Months Ended March 31, | |||||||||||||
2017 | 2016 | ||||||||||||
United States | $ | 64,752 | 81.7 | % | $ | 42,468 | 76.5 | % | |||||
Other Countries | 14,490 | 18.3 | 13,062 | 23.5 | |||||||||
Total | $ | 79,242 | 100.0 | % | $ | 55,530 | 100.0 | % | |||||
Sales to customers outside of the U.S. are typically denominated in U.S. dollars, and are attributed to each country based on the shipping address of the distributor or customer. For the three months ended March 31, 2017 no individual country outside the U.S. represented more than 10% of net sales. For the three months ended March 31, 2016, one individual country outside the U.S. represented 10.9% of net sales. Individual sales transactions in the international market are generally larger and occur more intermittently than in the domestic market due to the profile of the Company's customers.
For the three months ended March 31, 2017, no customer represented more than 10% of total net sales. For the three months ended March 31, 2016 one customer represented 10.9% of total net sales. At March 31, 2017, there were no outstanding customer balances from unaffiliated customers that comprised over 10% of the aggregate accounts receivable balance. At December 31, 2016, the Company had a trade receivable from one unaffiliated customer comprising 14.5% of the aggregate accounts receivable balance.
d. Income per Common Share
Basic income per common share is computed by dividing net income by the weighted average number of common shares outstanding during the periods presented. Potentially dilutive securities include outstanding stock options and unvested restricted stock units. The dilutive effect of potentially dilutive securities is reflected in diluted earnings per share by application of the treasury stock method. Under the treasury stock method, an increase in the fair market value of the Company’s common stock can result in a greater dilutive effect from potentially dilutive securities.
The calculation of the weighted average number of shares outstanding and earnings per share are as follows (in thousands except per share data):
Three Months Ended March 31, | |||||||
2017 | 2016 | ||||||
Numerator for basic and diluted earnings per share: | |||||||
Net income | $ | 4,580 | $ | 3,463 | |||
Denominator: | |||||||
Weighted average shares outstanding - basic | 52,418 | 53,693 | |||||
Dilutive effect of stock-based awards (a) | 1,259 | 1,096 | |||||
Diluted weighted average shares outstanding | 53,677 | 54,789 | |||||
Anti-dilutive stock-based awards excluded | 676 | 525 | |||||
Net income per common share: | |||||||
Basic | $ | 0.09 | $ | 0.06 | |||
Diluted | $ | 0.09 | $ | 0.06 | |||
(a) Prior-period information has been restated for the adoption of ASU 2016-09, which the Company adopted on January 1, 2017, resulting in an increased dilutive effect of restricted stock units.
7
AXON ENTERPRISE, INC.
NOTES TO UNAUDITED CONDENSED CONSOLIDATED FINANCIAL STATEMENTS – (Continued)
e. Revenue Recognition, Deferred Revenue and Accounts and Notes Receivable
The Company derives revenue from two primary sources: (1) the sale of physical products, including CEWs, Axon cameras, corresponding hardware extended warranties, and related accessories such as Axon docks, cartridges and batteries, among others, and (2) subscription to the Company's Evidence.com digital evidence management software as a service ("SaaS") (including data storage fees and other ancillary services), which includes varying levels of support. To a lesser extent, the Company also recognizes training and other professional services revenue. Revenue is recognized when persuasive evidence of an arrangement exists, delivery has occurred or services have been rendered, title has transferred, the price is fixed and collectability is reasonably assured. Contractual arrangements may contain explicit customer acceptance provisions, and under such arrangements, the Company defers recognition of revenue until formal customer acceptance is received. Extended warranty revenue, SaaS revenue and related data storage revenue are recognized ratably over the term of the contract beginning on the commencement date of each contract.
Revenue arrangements with multiple deliverables are divided into separate units and revenue is allocated using the relative selling price method based upon vendor-specific objective evidence of selling price or third-party evidence of the selling prices if vendor-specific objective evidence of selling prices does not exist. If neither vendor-specific objective evidence nor third-party evidence exists, management uses its best estimate of selling price. The majority of the Company’s allocations of arrangement consideration under multiple element arrangements are performed utilizing prices charged to customers for deliverables when sold separately. The Company’s multiple element arrangements may include future CEWs and/or Axon devices to be delivered at defined points within a multi-year contract, and in those arrangements, the Company allocates total arrangement consideration over the life of the multi-year contract to future deliverables using management’s best estimate of selling price. The Company has not utilized third party evidence of selling price.
The Company offers the right to purchase extended warranties that include additional services and coverage beyond the standard limited warranty for certain products. Revenue for extended warranty purchases is deferred at the time of sale and recognized over the warranty period commencing on the date of sale. Extended warranties range from one to five years.
Evidence.com and Axon cameras and related accessories have stand-alone value to the customer and are sometimes sold separately, but in most instances are sold together. In these instances, customers typically purchase and pay for the equipment and one year of Evidence.com in advance. Additional years of service are generally billed annually over a specified service term, which has typically ranged from one to five years. Generally, the Company recognizes revenue for the Axon equipment at the time of the sale consistent with the discussion of multiple deliverable arrangements above. Revenue for Evidence.com is deferred at the time of the sale and recognized over the service period. At times the Company subsidizes the cost of Axon devices provided to customers to secure long-term Evidence.com service contracts. In such circumstances, revenue related to the Axon devices recognized at the time of delivery is limited to the amount collected from the customer that is not contingent upon the delivery of future Evidence.com services. The Company recognizes the remaining allocated revenue related to subsidized Axon devices over the remaining period it provides the contracted Evidence.com services.
In 2012, the Company introduced a program, the TASER Assurance Program (“TAP”) whereby a customer purchasing a product and joining the program will have the right to trade-in the original product for a new product of the same or like model in the future. Upon joining TAP, customers also receive an extended warranty for the initial products purchased and spare inventory. Under this program the customer generally pays additional annual installments over the contract period, generally three to five years. The Company records consideration received related to the future product purchase as deferred revenue until all revenue recognition criteria are met, which is generally when the new product is delivered. Consideration related to future product purchases is determined at the inception of the arrangement using management’s best estimate of selling price. Management’s estimate is principally based on the current selling price for such products, with due evaluation of the impact of any expected product and pricing changes, which have historically had an immaterial influence on management’s best estimate of selling price.
In 2015, The Company introduced the Officer Safety Plan (“OSP”) whereby a customer enters into a five-year Evidence.com subscription that includes all of its standard advanced features along with unlimited storage. The OSP also includes a service plan that includes upgrades of (i) the Axon devices every 2.5 years and (ii) a TASER CEW at any point within the contract period. Upon entering into the OSP, customers also receive extended warranties on the Axon and CEW devices upon delivery to cover the contract periods as well as spare inventory units. Under this program the customer generally makes an initial purchase of Axon cameras and related accessories, and CEWs at inception along with annual installments for services and future hardware deliverables over the contract period. The Company records consideration received related to the future purchase as deferred revenue until all revenue recognition criteria are met, which is generally when the products or services are delivered.
8
AXON ENTERPRISE, INC.
NOTES TO UNAUDITED CONDENSED CONSOLIDATED FINANCIAL STATEMENTS – (Continued)
In 2016, the Company introduced the TASER 60 Plan ("TASER 60") whereby a customer typically enters into a five year CEW installment purchase arrangement. The TASER 60 plan also includes extended warranties on the CEW devices upon delivery covering the contract periods as well as on-site spares, holsters and cartridges. Generally, the Company recognizes revenue for the amount allocated to the CEW at the time of sale for the amount of the customer receivable, net of imputed interest, and the amount allocated to the extended warranty is recognized over five years.
In 2017, the Company introduced new subscription programs that allow for agencies to purchase the Company's training and duty cartridges over a five-year term whereby the customer would make five equal annual installments. The Company offers two tiers under this program; the basic and unlimited plan. The Axon Basic Cartridge Plan entitles customers to a fixed number of training and duty cartridges as well as a fixed number battery replacements over the contractual term, while the Axon Unlimited Cartridge Plan entitles customers to a fixed number of training cartridges and unlimited duty cartridges and replacement batteries.
Sales tax collected on sales is netted against government remittances and thus, recorded on a net basis. Training and professional service revenues are recorded as the services are provided.
Deferred revenue consists of payments received in advance related to products and services for which the criteria for revenue recognition have not yet been met. Deferred revenue that will be recognized during the succeeding twelve month period is recorded as current deferred revenue and the remaining portion is recorded as long-term. Deferred revenue does not include future revenue from multi-year contracts for which no invoice has yet been created. Generally, customers are billed in annual installments. See Note 6 for further disclosures about the Company’s deferred revenue.
Sales are typically made on credit, and the Company generally does not require collateral. Management performs ongoing credit evaluations of its customers’ financial condition, and maintains an allowance for estimated potential losses. Uncollectible accounts are charged to expense when deemed uncollectible, and accounts and notes receivable are presented net of an allowance for doubtful accounts. This allowance represents management’s best use of estimates, and is based on judgment after considering a number of factors, including third-party credit reports, actual payment history, cash discounts, customer-specific financial information and broader market and economic trends and conditions.
f. Standard Warranties
The Company warranties its CEWs, Axon cameras and certain related accessories from manufacturing defects on a limited basis for a period of one year after purchase and, thereafter, will replace any defective unit for a fee. Estimated costs for the standard warranty are charged to cost of products sold and services delivered when revenue is recorded for the related product. Future warranty costs are estimated based on historical data related to returns and warranty costs on a quarterly basis and this rate is applied to current product sales. Historically, reserve amounts have been increased if management becomes aware of a component failure or other issue that could result in larger than anticipated returns from customers. The accrued warranty liability expense is reviewed quarterly to verify that it sufficiently reflects the remaining warranty obligations based on the anticipated expenditures over the balance of the warranty obligation period, and adjustments are made when actual warranty claim experience differs from estimates. Costs related to extended warranties are charged to cost of products sold and services delivered when incurred. The reserve for warranty returns is included in accrued liabilities on the accompanying condensed consolidated balance sheets.
Changes in the Company’s estimated product warranty liabilities are as follows (in thousands):
Three Months Ended March 31, | |||||||
2017 | 2016 | ||||||
Balance, beginning of period | $ | 780 | $ | 314 | |||
Utilization of accrual | (66 | ) | (26 | ) | |||
Warranty expense (recoveries) | (367 | ) | 161 | ||||
Balance, end of period | $ | 347 | $ | 449 | |||
9
AXON ENTERPRISE, INC.
NOTES TO UNAUDITED CONDENSED CONSOLIDATED FINANCIAL STATEMENTS – (Continued)
g. Fair Value of Financial Instruments
The Company uses the fair value framework that prioritizes the inputs to valuation techniques for measuring financial assets and liabilities measured on a recurring basis and for non-financial assets and liabilities when these items are re-measured. Fair value is considered to be the exchange price in an orderly transaction between market participants, to sell an asset or transfer a liability at the measurement date. The hierarchy below lists three levels of fair value based on the extent to which inputs used in measuring fair value are observable in the market. The Company categorizes each of its fair value measurements in one of these three levels based on the lowest level input that is significant to the fair value measurement in its entirety. These levels are:
• | Level 1 – Valuation techniques in which all significant inputs are unadjusted quoted prices from active markets for assets or liabilities that are identical to the assets or liabilities being measured. |
• | Level 2 – Valuation techniques in which significant inputs include quoted prices from active markets for assets or liabilities that are similar to the assets or liabilities being measured and/or quoted prices for assets or liabilities that are identical or similar to the assets or liabilities being measured from markets that are not active. Also, model-derived valuations in which all significant inputs and significant value drivers are observable in active markets are Level 2 valuation techniques. |
• | Level 3 – Valuation techniques in which one or more significant inputs or significant value drivers are unobservable. Unobservable inputs are valuation technique inputs that reflect the Company's own assumptions about inputs that market participants would use in pricing an asset or liability. |
The Company has cash equivalents and investments, which at March 31, 2017 and December 31, 2016 were comprised of money market funds, state and municipal obligations, corporate bonds, and certificates of deposits. See additional disclosure regarding the fair value of the Company’s cash equivalents and investments in Note 2. Included in the balance of Other assets as of March 31, 2017 and December 31, 2016 was $3.5 million and $3.2 million, respectively, related to corporate-owned life insurance policies which are used to fund the Company’s deferred compensation plan. The Company determines the fair value of its insurance contracts by obtaining the cash surrender value of the contracts from the issuer, a Level 2 valuation technique.
The Company’s financial instruments also include accounts and notes receivable, accounts payable, notes payable and accrued liabilities. Due to the short-term nature of these instruments, their fair values approximate their carrying values on the accompanying condensed consolidated balance sheets.
h. Valuation of Goodwill, Intangibles and Long-lived Assets
Management evaluates whether events and circumstances have occurred that indicate the remaining estimated useful life of long-lived assets and identifiable intangible assets may warrant revision or that the remaining balance of these assets may not be recoverable. Such circumstances could include, but are not limited to, a change in the product mix, a change in the way products are created, produced or delivered, or a significant change in the way products are branded and marketed. In performing the review for recoverability, management estimates the future undiscounted cash flows expected to result from the use of the assets and their eventual disposition. The amount of the impairment loss, if impairment exists, is calculated based on the excess of the carrying amounts of the assets over their estimated fair value computed using discounted cash flows.
i. Recently Issued Accounting Guidance
In May 2014, the Financial Accounting Standards Board (“FASB”) issued Accounting Standards Update (“ASU”) 2014-09, Revenue from Contracts with Customers (Topic 606). ASU 2014-09 requires entities to recognize revenue through the application of a five-step model, which includes identification of the contract, identification of the performance obligations, determination of the transaction price, allocation of the transaction price to the performance obligations and recognition of revenue as the entity satisfies the performance obligations. Subsequently, the FASB issued the following accounting standard updates related to Topic 606, Revenue Contracts with Customers:
• | ASU No. 2016-08, Revenue from Contracts with Customers (Topic 606): Principal versus Agent Considerations (Reporting Revenue Gross versus Net) in March 2016. ASU 2016-08 does not change the core principle of revenue recognition in Topic 606 but clarifies the implementation guidance on principal versus agent considerations. |
• | ASU No. 2016-10, Revenue from Contracts with Customers (Topic 606): Identifying Performance Obligations and Licensing in April 2016. ASU 2016-10 does not change the core principle of revenue recognition in Topic 606 but clarifies the implementation guidance on identifying performance obligations and the licensing |
10
AXON ENTERPRISE, INC.
NOTES TO UNAUDITED CONDENSED CONSOLIDATED FINANCIAL STATEMENTS – (Continued)
• | ASUs No. 2016-12 and 2016-20, Revenue from Contracts with Customers (Topic 606): Narrow-Scope Improvements and Practical Expedients. These ASUs do not change the core principle of revenue recognition in Topic 606 but clarifiy the implementation guidance on a few narrow areas and adds some practical expedients to the guidance. |
The amendments are effective for annual reporting periods beginning after December 15, 2017, including interim periods within that reporting period. During fiscal 2016, the Company established an internal implementation team and engaged a third-party advisory firm to assist in the implementation of the new standard. The Company is currently finalizing its assessment relative to the adoption and implementation of this guidance, and currently does not expect it will have a significant impact on its consolidated financial statements. The Company is also evaluating whether to adopt the guidance using the full or modified retrospective basis, and will likely make that determination during the first half of fiscal 2017.
In July 2015, the FASB issued ASU 2015-11, Inventory (Topic 330). The amendments require that an entity should measure inventory at the lower of cost and net realizable value. Net realizable value is the estimated price in the ordinary course of business, less reasonably predictable costs of completion, disposal, and transportation. The Company adopted this guidance effective January 1, 2017 and it did not have a material impact on its consolidated financial statements.
In February 2016, the FASB issued ASU 2016-02, Leases (Topic 842) in order to increase transparency and comparability among organizations by recognizing lease assets and lease liabilities on the balance sheet for those leases classified as operating leases under previous GAAP. ASU 2016-02 requires that a lessee should recognize a liability to make lease payments (the lease liability) and a right-of-use asset representing its right to use the underlying asset for the lease term on the balance sheet. ASU 2016-02 is effective for the fiscal year beginning after December 15, 2018 (including interim periods within that year) using a modified retrospective approach and early adoption is permitted. The Company is currently in the process of evaluating the impact of adoption of this ASU on its consolidated financial statements.
In March 2016, the FASB issued ASU 2016-09, Improvements to Employee Share-Based Payment Accounting, which amends Accounting Standards Codification (Topic 718), Compensation – Stock Compensation. ASU 2016-09 impacts several aspects of the accounting for share-based payment transactions. This amended guidance was effective for the Company on January 1, 2017, and required the following changes to the presentation of the Company's financial statements:
• | Excess tax benefits or deficiencies for share-based payments are now recorded as a discrete item in the period shares vest or stock options are exercised as an adjustment to income tax expense or benefit rather than additional paid-in capital. This change was applied prospectively as of January 1, 2017. The Company did not have any excess tax benefits that were not previously recognized as of January 1, 2017. |
• | As of January 1, 2017, the calculation of diluted weighted average shares outstanding was changed prospectively to no longer include excess tax benefits as assumed proceeds. This change resulted in recording an increased number of dilutive shares, but did not have a material impact on the Company's current year diluted earnings per share; |
• | Cash flows related to excess tax benefits or deficiencies are included in net cash provided by operating activities rather than as a financing activity. The Company adopted this change prospectively. |
• | Cash paid to taxing authorities when withholding shares from an employee's vesting or exercise of equity-based compensation awards for tax-withholding purposes is now considered a repurchase of the Company's equity instruments and is classified as cash used in financing activities. The Company already classifies these transactions as a financing activity, and as such, there is no impact upon adoption. |
• | The Company has made the election to account for forfeitures when they occur rather than estimating forfeitures. The Company adopted this change on a modified retrospective basis, which resulted in an increase to additional paid-in capital and decrease to retained earnings as of December 31, 2016 of $0.5 million. |
In June 2016, the FASB issued ASU 2016-13, Financial Instruments - Credit Losses, which amends ASC 326. The new guidance differs from existing GAAP wherein previous standards generally delayed recognition of credit losses until the loss was probable. ASU 2016-13 eliminates the probable initial recognition threshold and, instead, reflect an entity’s current estimate of all expected credit losses. The use of forecasted information is intended to incorporate more timely information in the estimate of expected credit loss. ASU 2016-13 is effective for the fiscal year beginning after December 15, 2019, and interim periods within that fiscal year, and early adoption is permitted. The Company is currently in the process of evaluating the impact of adoption of ASU 2016-13 on its consolidated financial statements.
11
AXON ENTERPRISE, INC.
NOTES TO UNAUDITED CONDENSED CONSOLIDATED FINANCIAL STATEMENTS – (Continued)
In August 2016, the FASB issued ASU 2016-15, Statement of Cash Flows (Topic 230): Classification of Certain Cash Receipts and Cash Payments. ASU 2016-15 eliminates the diversity in practice related to the classification of certain cash receipts and payments. ASU 2016-15 designates the appropriate cash flow classification, including requirements to allocate certain components of these cash receipts and payments among operating, investing and financing activities. ASU 2016-15 is effective for the fiscal year beginning after December 15, 2017, and interim periods within that fiscal year, and early adoption is permitted. The retrospective transition method, requiring adjustment to all comparative periods presented, is required unless it is impracticable for some of the amendments, in which case those amendments would be prospectively as of the earliest date practicable. The Company does not expect the adoption of this ASU to have a material impact on its consolidated financial statements.
In October 2016, the FASB issued ASU 2016-16, Income Taxes (Topic 740) - Intra-Entity Transfers of Assets Other Than Inventory. ASU 2016-16 requires an entity to recognize income tax consequences of an intra-entity transfer of an asset other than inventory when the transfer occurs. This removes the exception to postpone recognition until the asset has been sold to an outside party. ASU 2016-16 is effective for fiscal year beginning after December 15, 2017 using a modified retrospective approach, and early adoption is permitted. The Company is currently in the process of evaluating the impact of adoption of this ASU on its consolidated financial statements.
In November 2016, the FASB issued ASU 2016-18, Statement of Cash Flows - Restricted Cash (Topic 230), which amends the existing guidance relating to the disclosure of restricted cash and restricted cash equivalents on the statement of cash flows. ASU 2016-18 is effective for the fiscal year beginning after December 15, 2017, and interim periods within that fiscal year, and early adoption is permitted. The Company does not expect the adoption of this ASU to have a material impact on its consolidated financial statements.
In January 2017, the FASB issued ASU 2017-01, Business Combinations (Topic 805) to provide a more robust framework to use in determining when a set of acquired assets and activities is a business. ASU 2017-01 is effective for the fiscal year beginning after December 15, 2017, and interim periods within that year and early adoption is permitted. The Company does not expect the adoption of this ASU to have a material impact on its consolidated financial statements.
In January 2017, issued ASU 2017-04, Intangibles - Goodwill and Other (Topic 350) which simplifies the goodwill impairment test by eliminating Step 2 of the quantitative assessment and should reduce the cost and complexity of evaluating goodwill for impairment. Under the amended guidance, when a quantitative assessment is required, an entity will perform a goodwill impairment test by comparing the fair value of a reporting unit with its carrying amount. An impairment charge will be measured as the amount by which the carrying amount exceeds the reporting unit’s fair value, not to exceed the total amount of recorded goodwill. ASU 2017-04 is effective for the fiscal year beginning after December 15, 2019, and interim periods within that fiscal year, and early adoption is permitted. The Company's early adoption on January 1, 2017 did not have an impact on its consolidated financial statements.
j. Reclassification of Prior Year Presentation
Certain prior year amounts have been reclassified for consistency with the current year presentation. These reclassifications had no effect on the reported results of operations.
12
AXON ENTERPRISE, INC.
NOTES TO UNAUDITED CONDENSED CONSOLIDATED FINANCIAL STATEMENTS – (Continued)
2. Cash, Cash Equivalents and Investments
The following tables summarize the Company's cash, cash equivalents, and held-to-maturity investments at March 31, 2017 and December 31, 2016 (in thousands):
As of March 31, 2017 | |||||||||||||||||||||||||||
Amortized Cost | Gross Unrealized Gains | Gross Unrealized Losses | Fair Value | Cash and Cash Equivalents | Short-Term Investments | Long-Term Investments | |||||||||||||||||||||
Cash | $ | 22,879 | $ | — | $ | — | $ | 22,879 | $ | 22,879 | $ | — | $ | — | |||||||||||||
Level 1: | |||||||||||||||||||||||||||
Money market funds | 19,095 | — | — | 19,095 | 19,095 | — | — | ||||||||||||||||||||
Corporate bonds | 22,893 | — | (26 | ) | 22,867 | — | 22,893 | — | |||||||||||||||||||
Subtotal | 41,988 | — | (26 | ) | 41,962 | 19,095 | 22,893 | — | |||||||||||||||||||
Level 2: | |||||||||||||||||||||||||||
State and municipal obligations | 6,392 | — | (1 | ) | 6,391 | — | 6,392 | — | |||||||||||||||||||
Certificates of deposit | 345 | — | — | 345 | — | 345 | — | ||||||||||||||||||||
Subtotal | 6,737 | — | (1 | ) | 6,736 | — | 6,737 | — | |||||||||||||||||||
Total | $ | 71,604 | $ | — | $ | (27 | ) | $ | 71,577 | $ | 41,974 | $ | 29,630 | $ | — | ||||||||||||
As of December 31, 2016 | |||||||||||||||||||||||||||
Amortized Cost | Gross Unrealized Gains | Gross Unrealized Losses | Fair Value | Cash and Cash Equivalents | Short-Term Investments | Long-Term Investments | |||||||||||||||||||||
Cash | $ | 32,802 | $ | — | $ | — | $ | 32,802 | $ | 32,802 | $ | — | $ | — | |||||||||||||
Level 1: | |||||||||||||||||||||||||||
Money market funds | 7,849 | — | — | 7,849 | 7,849 | — | — | ||||||||||||||||||||
Corporate bonds | 33,379 | — | (57 | ) | 33,322 | — | 33,379 | — | |||||||||||||||||||
Subtotal | 41,228 | — | (57 | ) | 41,171 | 7,849 | 33,379 | — | |||||||||||||||||||
Level 2: | |||||||||||||||||||||||||||
State and municipal obligations | 14,477 | — | (10 | ) | 14,467 | — | 14,243 | 234 | |||||||||||||||||||
Certificates of deposit | 793 | — | — | 793 | — | 793 | — | ||||||||||||||||||||
Subtotal | 15,270 | — | (10 | ) | 15,260 | — | 15,036 | 234 | |||||||||||||||||||
Total | $ | 89,300 | $ | — | $ | (67 | ) | $ | 89,233 | $ | 40,651 | $ | 48,415 | $ | 234 | ||||||||||||
The Company believes the unrealized losses on the Company’s investments are due to interest rate fluctuations. As these investments are either short-term in nature, are expected to be redeemed at par value, and/or because the Company has the ability and intent to hold these investments to maturity, the Company does not consider these investments to be other than temporarily impaired at March 31, 2017.
13
AXON ENTERPRISE, INC.
NOTES TO UNAUDITED CONDENSED CONSOLIDATED FINANCIAL STATEMENTS – (Continued)
The following table summarizes the amortized cost and fair value of the short-term and long-term investments held by the Company at March 31, 2017 by contractual maturity (in thousands):
Amortized Cost | Fair Value | ||||||
Due in less than one year | $ | 29,630 | $ | 29,603 | |||
Due after one year, through two years | — | — | |||||
Due after two years | — | — | |||||
Total short-term and long-term investments | $ | 29,630 | $ | 29,603 | |||
3. Inventory
Inventories are stated at the lower of cost and net realizable value. Cost is determined using the weighted average cost of raw materials which approximates the first-in, first-out (“FIFO”) method and includes allocations of manufacturing labor and overhead. Provisions are made to reduce excess, obsolete or slow-moving inventories to their net realizable value. Inventories consisted of the following at March 31, 2017 and December 31, 2016 (in thousands):
2017 | 2016 | ||||||
Raw materials | $ | 28,047 | $ | 18,002 | |||
Finished goods | 20,652 | 16,839 | |||||
Total inventory | $ | 48,699 | $ | 34,841 | |||
4. Goodwill and Intangible Assets
The changes in the carrying amount of goodwill for the three months ended March 31, 2017 were as follows (in thousands):
Balance, beginning of period | $ | 10,442 | |
Goodwill acquired | 2,546 | ||
Foreign currency translation adjustment | 13 | ||
Balance, end of period | $ | 13,001 | |
Intangible assets (other than goodwill) consisted of the following (in thousands):
March 31, 2017 | December 31, 2016 | ||||||||||||||||||||||||
Useful Life | Gross Carrying Amount | Accumulated Amortization | Net Carrying Amount | Gross Carrying Amount | Accumulated Amortization | Net Carrying Amount | |||||||||||||||||||
Amortized: | |||||||||||||||||||||||||
Domain names | 5 years | $ | 3,161 | $ | (201 | ) | $ | 2,960 | $ | 3,161 | $ | (125 | ) | $ | 3,036 | ||||||||||
Issued patents | 4-15 years | 1,952 | (811 | ) | 1,141 | 1,942 | (780 | ) | 1,162 | ||||||||||||||||
Issued trademarks | 3-11 years | 662 | (338 | ) | 324 | 655 | (320 | ) | 335 | ||||||||||||||||
Customer relationships | 4-8 years | 922 | (279 | ) | 643 | 914 | (240 | ) | 674 | ||||||||||||||||
Non-compete agreements | 3-4 years | 446 | (260 | ) | 186 | 465 | (236 | ) | 229 | ||||||||||||||||
Developed technology | 3-7 years | 14,480 | (1,502 | ) | 12,978 | 8,661 | (824 | ) | 7,837 | ||||||||||||||||
Total amortized | 21,623 | (3,391 | ) | 18,232 | 15,798 | (2,525 | ) | 13,273 | |||||||||||||||||
Not amortized: | |||||||||||||||||||||||||
TASER trademark | 900 | 900 | 900 | 900 | |||||||||||||||||||||
Patents and trademarks pending | 1,124 | 1,124 | 1,045 | 1,045 | |||||||||||||||||||||
Total not amortized | 2,024 | 2,024 | 1,945 | 1,945 | |||||||||||||||||||||
Total intangible assets | $ | 23,647 | $ | (3,391 | ) | $ | 20,256 | $ | 17,743 | $ | (2,525 | ) | $ | 15,218 | |||||||||||
14
AXON ENTERPRISE, INC.
NOTES TO UNAUDITED CONDENSED CONSOLIDATED FINANCIAL STATEMENTS – (Continued)
Amortization expense relative to intangible assets for the three months ended March 31, 2017 and 2016 was approximately $0.9 million and $0.2 million, respectively. Estimated amortization for intangible assets with definitive lives for the remaining nine months of 2017, the next five years ended December 31, and thereafter, is as follows (in thousands):
2017 (remaining nine months) | $ | 3,044 | |
2018 | 4,043 | ||
2019 | 3,970 | ||
2020 | 2,403 | ||
2021 | 2,318 | ||
2022 | 717 | ||
Thereafter | 1,737 | ||
Total | $ | 18,232 | |
5. Other Long-Term Assets
Other long-term assets consisted of the following at March 31, 2017 and December 31, 2016 (in thousands):
2017 | 2016 | ||||||
Cash surrender value of corporate-owned life insurance policies (Note 1) | $ | 3,518 | $ | 3,240 | |||
Prepaid commissions (i) | 5,777 | 5,302 | |||||
Restricted cash (ii) | 3,317 | 3,317 | |||||
Prepaid expenses, deposits and other (iii) | 2,169 | 2,058 | |||||
Total other long-term assets | $ | 14,781 | $ | 13,917 | |||
(i) Prepaid commissions represent customer acquisition costs to secure long-term contracts. The Company capitalizes incremental and direct costs related to a specific contract and recognizes as expense over the term of the contract.
(ii) As of March 31, 2017 and December 31, 2016, restricted cash primarily consisted of $2.7 million of sales proceeds related to a long-term contract with a specific customer. These proceeds are held in escrow until certain billing milestones are achieved, and then specified amounts are transferred to the Company's operating accounts. Restricted also contained $0.6 million related to a performance guarantee related to an international customer sales contract.
(iii) Included in long-term assets as of March 31, 2017 and December 31, 2016 was $1.8 million of funds deposited in escrow related to contingent consideration in connection with a business combination (see Note 15). The funds will be held in escrow and released to selling shareholders if certain conditions are subsequently met. If the conditions are not met, the funds will be released back to the Company.
15
AXON ENTERPRISE, INC.
NOTES TO UNAUDITED CONDENSED CONSOLIDATED FINANCIAL STATEMENTS – (Continued)
6. Deferred Revenue
Deferred revenue consisted of the following (in thousands):
March 31, 2017 | December 31, 2016 | ||||||||||||||||||||||
Current | Long-Term | Total | Current | Long-Term | Total | ||||||||||||||||||
Warranty: | |||||||||||||||||||||||
TASER Weapons | $ | 11,368 | $ | 17,288 | $ | 28,656 | $ | 9,980 | $ | 17,319 | $ | 27,299 | |||||||||||
Software and Sensors | 4,401 | 3,148 | 7,549 | 3,979 | 2,926 | 6,905 | |||||||||||||||||
15,769 | 20,436 | 36,205 | 13,959 | 20,245 | 34,204 | ||||||||||||||||||
Hardware: | |||||||||||||||||||||||
TASER Weapons | 2,591 | 8,177 | 10,768 | 1,702 | 4,390 | 6,092 | |||||||||||||||||
Software and Sensors | 10,379 | 8,749 | 19,128 | 9,850 | 11,205 | 21,055 | |||||||||||||||||
12,970 | 16,926 | 29,896 | 11,552 | 15,595 | 27,147 | ||||||||||||||||||
Software and Sensors Services | 21,170 | 4,282 | 25,452 | 19,626 | 4,214 | 23,840 | |||||||||||||||||
Total | $ | 49,909 | $ | 41,644 | $ | 91,553 | $ | 45,137 | $ | 40,054 | $ | 85,191 | |||||||||||
March 31, 2017 | December 31, 2016 | ||||||||||||||||||||||
Current | Long-Term | Total | Current | Long-Term | Total | ||||||||||||||||||
TASER Weapons | $ | 13,959 | $ | 25,465 | $ | 39,424 | $ | 11,682 | $ | 21,709 | $ | 33,391 | |||||||||||
Software and Sensors | 35,950 | 16,179 | 52,129 | 33,455 | 18,345 | 51,800 | |||||||||||||||||
Total | $ | 49,909 | $ | 41,644 | $ | 91,553 | $ | 45,137 | $ | 40,054 | $ | 85,191 | |||||||||||
7. Accrued Liabilities
Accrued liabilities consisted of the following at March 31, 2017 and December 31, 2016 (in thousands):
2017 | 2016 | ||||||
Accrued salaries, benefits and bonus | $ | 5,465 | $ | 6,474 | |||
Accrued professional, consulting and lobbying | 1,079 | 3,673 | |||||
Accrued warranty expense | 347 | 780 | |||||
Accrued income and other taxes | 7,415 | 4,581 | |||||
Other accrued liabilities | 6,024 | 2,740 | |||||
Accrued liabilities | $ | 20,330 | $ | 18,248 | |||
8. Income Taxes
Deferred Tax Assets
Net deferred income tax assets at March 31, 2017, include capitalized research and development costs, research and development tax credits, non-qualified stock-based compensation expense, deferred warranty revenue, warranty and inventory reserves, accrued vacation, and other items, partially offset by accelerated depreciation expense and intangible amortization that is not tax deductible. The Company’s total net deferred tax assets at March 31, 2017 were $20.1 million.
In preparing the Company’s condensed consolidated financial statements, management assesses the likelihood that its deferred tax assets will be realized from future taxable income. In evaluating the Company’s ability to recover its deferred income tax assets, management considers all available positive and negative evidence, including its operating results, ongoing tax planning and forecasts of future taxable income on a jurisdiction by jurisdiction basis. A valuation allowance is established if it is determined that it is more likely than not that some portion or all of the net deferred tax assets will not be realized. Management exercises significant judgment in determining its provisions for income taxes, its deferred tax assets and liabilities, and its future taxable
16
AXON ENTERPRISE, INC.
NOTES TO UNAUDITED CONDENSED CONSOLIDATED FINANCIAL STATEMENTS – (Continued)
income for purposes of assessing its ability to utilize any future tax benefit from its deferred tax assets.
Although management believes that its tax estimates are reasonable, the ultimate tax determination involves significant judgments that could become subject to audit by tax authorities in the ordinary course of business. As of each reporting date, management considers new evidence, both positive and negative, that could impact management’s view with regard to future realization of deferred tax assets. As of March 31, 2017, the Company continues to demonstrate three-year cumulative pre-tax income in the U.S. federal and Arizona tax jurisdictions; however, the Company's Arizona R&D Tax Credits start to expire in 2018 with a significant tranche with a gross value of $1.2 million expiring if not used by the end of 2019. It appears that that Company’s long term investments, which impact short term profits, will likely result in some of the R&D credits expiring before they are utilized. Therefore, management has concluded that it is more likely than not that a portion of the Company’s deferred tax assets will not be realized and has established a valuation allowance.
The Company has completed research and development (“R&D”) tax credit studies which identified approximately $15.6 million in tax credits for federal, Arizona and California income tax purposes related to the 2003 through 2017 tax years. Management has made the determination that it is more likely than not that the full benefit of the R&D tax credit will not be sustained on examination and recorded a liability for unrecognized tax benefits of $4.3 million as of March 31, 2017. In addition, management accrued approximately $0.1 million for estimated uncertain tax positions related to certain state income tax liabilities as of March 31, 2017. The Company does not expect a significant increase or decrease in the total amount of unrecognized tax benefits within 12 months. Should the total unrecognized tax benefit of $4.4 million be recognized, the Company’s effective tax rate would be favorably impacted. Approximately $1.6 million of the unrecognized tax benefit associated with research and development credits has been netted against the research and development credit deferred tax asset.
Effective Tax Rate
The Company’s overall effective tax rate for the three months ended March 31, 2017, after discrete period adjustments, was 17.6%. Before discrete adjustments the tax rate was 42.9%, which is more than the statutory rate primarily due to the impact of non-deductible losses in certain foreign jurisdictions, state taxes and non-deductible expenses for items such as incentive stock option expense, meals and entertainment and lobbying fees, partially offset by the domestic production activities and research and development tax credit deductions. The effective tax rate was unfavorably impacted by foreign losses for which the Company is not expected to receive a tax benefit. This was offset by the favorable impact of a $1.0 million discrete tax benefit associated with windfalls related to stock-based compensation for restricted stock units that vested or stock options that were exercised during the quarter.
9. Stockholders’ Equity
In May 2016, the Company’s stockholders approved a new stock incentive plan authorizing an additional 2.0 million shares, plus remaining available shares under a prior plan for issuance under the new plan. Combined with the legacy stock incentive plans, there are approximately 1.8 million shares available for grant as of March 31, 2017.
Performance-based stock awards
The Company has issued performance-based stock options and performance-based restricted stock units ("RSUs"), the vesting of which is contingent upon the achievement of certain performance criteria related to the operating performance of the Company, as well as successful and timely development and market acceptance of future product introductions. In addition, certain of the performance RSUs have additional service-based vesting requirements subsequent to the achievement of the performance criteria. Compensation expense is recognized over the implicit service period (the longer of the period the performance condition is expected to be achieved or the required service period) based on management’s estimate of the probability of the performance criteria being satisfied, adjusted at each balance sheet date.
17
AXON ENTERPRISE, INC.
NOTES TO UNAUDITED CONDENSED CONSOLIDATED FINANCIAL STATEMENTS – (Continued)
Restricted Stock Units
The following table summarizes RSU activity for the three months ended March 31, 2017 (number of units and aggregate intrinsic value in thousands):
Number of Units | Weighted Average Grant-Date Fair Value | Aggregate Intrinsic Value | ||||||||
Units outstanding, beginning of year | 1,330 | $ | 20.40 | |||||||
Granted | 786 | 25.57 | ||||||||
Released | (241 | ) | 18.87 | |||||||
Forfeited | (16 | ) | 23.87 | |||||||
Units outstanding, end of period | 1,859 | 22.74 | $ | 42,367 | ||||||
Aggregate intrinsic value represents the Company’s closing stock price on the last trading day of the period, which was $22.79 per share, multiplied by the number of RSUs outstanding. As of March 31, 2017, there was $35.8 million in unrecognized compensation costs related to RSUs under the Company's stock plans. The Company expects to recognize the cost related to the RSUs over a weighted average period of 2.99 years. RSUs are released when vesting requirements are met.
During the three months ended March 31, 2017, the Company granted approximately 0.1 million performance-based RSUs, which are included in the table above. As of March 31, 2017, the performance criteria had not been met for any the 0.2 million performance-based RSUs outstanding. Certain of the performance-based RSUs granted in 2017 , 2016 and 2015 contain provisions whereby the amount of RSUs that ultimately vest is dependent upon the level of achievement of performance metrics. The amount of RSUs included in the table above related to such grants is the target level, which is the Company's best estimate of the amount of RSUs that will vest. The maximum additional number of performance-based RSUs that could be earned is 0.2 million, which are not included in the table above.
Certain RSUs that vested in the three months ended March 31, 2017 were net-share settled such that the Company withheld shares with value equivalent to the employees’ minimum statutory obligation for the applicable income and other employment taxes, and remitted the cash to the appropriate taxing authorities. Total shares withheld were approximately 83,300 and had a value of approximately $2.2 million on their respective vesting dates as determined by the Company’s closing stock price. Payments for the employees’ tax obligations are reflected as a financing activity within the statement of cash flows. These net-share settlements had the effect of share repurchases by the Company as they reduced the amount of shares that would have otherwise been issued as a result of the vesting.
Stock Option Activity
The following table summarizes stock option activity for the three months ended March 31, 2017 (number of units and aggregate intrinsic value in thousands):
Number of Options | Weighted Average Exercise Price | Weighted Average Remaining Contractual Life (years) | Aggregate Intrinsic Value | |||||||||
Options outstanding, beginning of year | 1,008 | $ | 5.40 | |||||||||
Granted | — | — | ||||||||||
Exercised | (45 | ) | 6.60 | |||||||||
Expired / terminated | — | — | ||||||||||
Options outstanding, end of period | 963 | 5.35 | 2.03 | $ | — | |||||||
Options exercisable, end of period | 932 | 5.38 | 2.03 | — | ||||||||
Options expected to vest, end of period | 25 | 4.75 | 1.73 | 451 | ||||||||
Aggregate intrinsic value represents the difference between the exercise price of the underlying stock option awards and the closing market price of the Company's common stock of $22.79 on March 31, 2017. The intrinsic value of options exercised for the three months ended March 31, 2017 and 2016 was $0.7 million and $0.1 million, respectively. As of March 31, 2017, total
18
AXON ENTERPRISE, INC.
NOTES TO UNAUDITED CONDENSED CONSOLIDATED FINANCIAL STATEMENTS – (Continued)
options outstanding includes approximately 0.2 million performance-based stock options, of which approximately 30,600 were unvested and 25,000 expected to vest.
Stock-based Compensation Expense
Stock-based compensation cost for RSUs is measured based on the closing fair market value of the Company’s common stock on the date of grant. The Company recognizes stock-based compensation cost over the requisite service period of an award on a straight-line basis for time-based RSUs and on a graded basis for RSUs that are contingent on the achievement of performance conditions. The following table summarizes the composition of stock stock-based compensation for the three months ended March 31, 2017 and 2016 (in thousands):
Three Months Ended March 31, | |||||||
2017 | 2016 | ||||||
Cost of products sold and services delivered | $ | 79 | $ | 100 | |||
Sales, general and administrative expenses | 2,028 | 1,390 | |||||
Research and development expenses | 1,340 | 730 | |||||
Total stock-based compensation | $ | 3,447 | $ | 2,220 | |||
Stock Repurchase Plan
In February 2016, the Company's Board of Directors authorized a stock repurchase program to acquire up to $50.0 million of the Company’s outstanding common stock subject to stock market conditions and corporate considerations. During the three months ended March 31, 2017, no common shares were purchased under the program. During the three months ended March 31, 2016, the Company purchased, under a Rule 10b5-1 plan, approximately 0.5 million common shares for a total cost of approximately $9.0 million, or a weighted average cost of $18.86 per share. The weighted average cost includes the average price paid per share of $18.83, plus applicable administrative costs for the transaction. As of March 31, 2017, $16.2 million remains available under the plan for future purchases. The Company suspended its 10b5-1 plan, and any future purchases will be discretionary.
10. Line of Credit
The Company has a $10.0 million revolving line of credit with a domestic bank. At both March 31, 2017 and December 31, 2016, there were no borrowings under the line. As of March 31, 2017, the Company had letters of credit outstanding of approximately $2.7 million under the facility and available borrowing of approximately $7.3 million. The line is secured by substantially all of the assets of the Company, and bears interest at varying rates (currently LIBOR plus 1.5% or Prime less 0.75%). The line of credit matures on July 31, 2017, and requires monthly payments of interest only. The Company’s agreement with the bank requires it to comply with certain financial and other covenants including maintenance of a maximum leverage ratio and minimum fixed charge coverage ratio. The leverage ratio (ratio of total liabilities to tangible net worth) can be no greater than 1:1, and the fixed charge coverage ratio can be no less than 1.25:1, based upon a trailing twelve-month period. At March 31, 2017, the Company’s leverage ratio was 1.14:1 and its fixed charge coverage ratio was 2.45:1. The Company's violation of the leverage ratio requirement was waived as of March 31, 2017.
11. Commitments and Contingencies
Product Litigation
The Company is currently named as a defendant in eight lawsuits in which the plaintiffs allege either wrongful death or personal injury in situations in which a TASER CEW was used (or present) by law enforcement officers in connection with arrests or during training exercises. While the facts vary from case to case, the product liability claims are typically based on an alleged product defect resulting in injury or death, usually involving a failure to warn, and the plaintiffs are seeking monetary damages. The information throughout this note is current through the date of these financial statements.
As a general rule, it is the Company’s policy not to settle suspect injury or death cases. Exceptions are sometimes made where the settlement is strategically beneficial to the Company. Also, on occasion, the Company’s insurance company has settled such lawsuits over the Company’s objection where the risk is over the Company’s liability insurance deductibles. Due to the confidentiality of the Company's litigation strategy and the confidentiality agreements that are executed in the event of a settlement, the Company does not identify or comment on which specific lawsuits have been settled or the amount of any settlement.
19
AXON ENTERPRISE, INC.
NOTES TO UNAUDITED CONDENSED CONSOLIDATED FINANCIAL STATEMENTS – (Continued)
In 2009, the Company implemented new risk management strategies, including revisions to product warnings and training to better protect both the Company and its customers from litigation based on ‘failure to warn’ theories - which comprise the vast majority of the cases against the Company. These risk management strategies have been highly effective in reducing the rate and exposure from litigation post-2009. From the third quarter of 2011 to the first quarter of 2017, product liability cases have been reduced from 55 active to eight active cases.
Management believes that pre-2009 cases have a different risk profile than cases which have occurred since the risk management procedures were introduced in 2009. Therefore, the Company necessarily treats certain pre-2009 cases as exceptions to the Company’s general no settlement policy in order to reduce caseload, legal costs and liability exposure. The Company intends to continue its successful practice of aggressively defending and generally not settling litigation except in very limited and unusual circumstances as described above.
With respect to each of the pending lawsuits, the following table lists the name of plaintiff, the date the Company was served with process, the jurisdiction in which the case is pending, the type of claim and the status of the matter.
Plaintiff | Month Served | Jurisdiction | Claim Type | Status | ||||
Derbyshire | Nov-09 | Ontario, Canada Superior Court of Justice | Officer Injury | Discovery Phase | ||||
Shymko | Dec-10 | The Queen's Bench, Winnipeg Centre, Manitoba | Wrongful Death | Pleading Phase | ||||
Ramsey | Jan-12 | 12th Judicial Circuit Court, Broward County, FL | Wrongful Death | Discovery Phase | ||||
Schrock | Sep-14 | San Bernardino County Superior Court, CA | Wrongful Death | Motion for Summary Judgment granted on all claims except negligent design and manufacture, subject to repleading by Plaintiff. Plaintiff filed an amended complaint for negligent design claims as well as a Petition for Writ of Mandate or Prohibition Petition in the Superior Court of California for the County of San Bernardino; which writ was summarily denied. Axon filed Motion for Summary Judgment on design defect claims in April 2017. Trial scheduled for August 14, 2017. | ||||
Bennett | Sep-15 | 11th Judicial Circuit Court, Miami-Dade County, FL | Wrongful Death | Discovery Phase. Trial scheduled for June 18, 2018. | ||||
Suarez | Sep-16 | US District Court, Southern District of Florida | Wrongful Death | Pleading Phase. Trial scheduled for September 3, 2018. | ||||
Masters | Nov-16 | US District Court, Western District of Missouri | Wrongful Death | Pleading Phase | ||||
Taylor | Mar-17 | US District Court, Southern District of Texas | Officer Injury | Pleading Phase | ||||
There are no product litigation matters in which the Company is involved that are currently on appeal, but the judgment entered resulting from the court granting the Company’s motion for dismissal of the Digital Ally, Inc. ("Digital Ally") litigation for antitrust claims is on appeal as noted in the following table.
Plaintiff | Month Served | Jurisdiction | Claim Type | Status | ||||
Digital Ally | Feb-17 | US District Court, District of Kansas | Antitrust Claims | Axon's Motion for Dismissal of the antitrust claims was granted on January 12, 2017 with judgment entered in Axon's favor on April 14, 2017 and Plaintiff filed an appeal to the 10th Circuit Court of Appeals on April 20, 2017. | ||||
The following cases were dismissed or judgment entered during the first quarter of 2017 and through the date of these financial statements.
Plaintiff | Month Served | Jurisdiction | Claim Type | Status | ||||
Ramos | Dec-16 | US District Court, Northern District of Illinois | Conspiracy and negligent spoliation. | Dismissed | ||||
Firman | Apr-12 | Ontario, Canada Superior Court of Justice | Wrongful Death | Dismissed | ||||
20
AXON ENTERPRISE, INC.
NOTES TO UNAUDITED CONDENSED CONSOLIDATED FINANCIAL STATEMENTS – (Continued)
The claims, and in some instances the defense, of each of these lawsuits have been submitted to the Company’s insurance carriers that maintained insurance coverage during the applicable periods. The Company continues to maintain product liability insurance coverage with varying limits and deductibles. The following table provides information regarding the Company’s product liability insurance. Remaining insurance coverage is based on information received from the Company’s insurance provider (in millions).
Policy Year | Policy Start Date | Policy End Date | Insurance Coverage | Deductible Amount | Defense Costs Covered | Remaining Insurance Coverage | Active Cases and Cases on Appeal | ||||||||||
2009 | 12/15/2008 | 12/15/2009 | 10.0 | 1.0 | N | 10.0 | Derbyshire | ||||||||||
2010 | 12/15/2009 | 12/15/2010 | 10.0 | 1.0 | N | 10.0 | Shymko | ||||||||||
2011 | 12/15/2010 | 12/15/2011 | 10.0 | 1.0 | N | 10.0 | n/a | ||||||||||
Jan-Jun 2012 | 12/15/2011 | 6/25/2012 | 7.0 | 1.0 | N | 7.0 | Ramsey | ||||||||||
Jul-Dec 2012 | 6/25/2012 | 12/15/2012 | 12.0 | 1.0 | N | 12.0 | n/a | ||||||||||
2013 | 12/15/2012 | 12/15/2013 | 12.0 | 1.0 | N | 12.0 | n/a | ||||||||||
2014 | 12/15/2013 | 12/15/2014 | 11.0 | 4.0 | N | 11.0 | Schrock | ||||||||||
2015 | 12/15/2014 | 12/15/2015 | 10.0 | 5.0 | N | 10.0 | Bennett | ||||||||||
2016 | 12/15/2015 | 12/15/2016 | 10.0 | 5.0 | N | 10.0 | Suarez, Masters | ||||||||||
2017 | 12/15/2016 | 12/15/2017 | 10.0 | 5.0 | N | 10.0 | Taylor | ||||||||||
Other Litigation
In November 2015, the Company filed a complaint against Phazzer Electronics Inc. and Sang Min International Co. Ltd. for patent infringement, trademark infringement and false advertising. Defendant Phazzer has filed a motion to dismiss. Phazzer has filed an ex parte review with the USPTO to invalidate the Company’s data log patent, which patent was reissued with claims 6-18 confirmed and claims 1-5 amended; as well as a cancellation of the Company’s trademark on its cartridge, which cancellation proceeding has been stayed. This litigation is in the motion/discovery phase with a trial date on September 5, 2017.
In February 2016, the Company was served with a first amended complaint filed by Digital Ally in the Federal District Court for the District of Kansas alleging patent infringement, commercial bribery, contracts, combinations and conspiracies in restraint of trade and unfair or anti-competitive acts and practices. In March 2016, the Company was served with a second amended complaint with similar allegations. The second amended complaint seeks a judgment of infringement, monetary damages, a permanent injunction, punitive damages and attorneys’ fees and costs. The Company believes the second amended complaint is frivolous and the Company will vigorously defend this litigation. The Company’s motion to dismiss the claims involving commercial bribery, contracts, combinations and conspiracies in restraint of trade and unfair or anti-competitive acts and practices, was granted on January 12, 2017 and judgment of dismissal was entered in the Company’s favor on April 14, 2017. Plaintiff filed an appeal on April 20, 2017 to the 10th Circuit Court of Appeals. The Company has filed four inter parte reviews with the USPTO to invalidate Digital Ally’s patents and also has filed a motion to stay the litigation pending resolution of the inter parte reviews, which motion was granted. This litigation is in the discovery phase.
In April 2016, the Company was served with a notice of arbitration claim filed by Antoine di Zazzo, the Company’s former distributor in France, for commissions allegedly owed Mr. di Zazzo. The arbitration claim was filed with the International Court of Arbitration of the International Chamber of Commerce in Paris, France, and the amount that is claimed in controversy is approximately $0.6 million. The Company’s records reflect that all commissions that were due Mr. di Zazzo under his contract were paid or offered to him and the Company will vigorously defend this arbitration claim.
In February 2017, the Company was served with a complaint filed by VieVu LLC ("VieVu") alleging tortious interference with a business expectancy. In March 2017, the Company filed a motion to dismiss which motion is pending. In February 2017, the Company filed complaints against VieVu for unfair competition and false advertising in both the Superior Court of Arizona for Maricopa County as well as the California Superior Court for Santa Cruz County. The California complaint was served on VieVu and this litigation is in the pleading phase.
21
AXON ENTERPRISE, INC.
NOTES TO UNAUDITED CONDENSED CONSOLIDATED FINANCIAL STATEMENTS – (Continued)
General
From time to time, the Company is notified that it may be a party to a lawsuit or that a claim is being made against it. It is the Company’s policy to not disclose the specifics of any claim or threatened lawsuit until the summons and complaint are actually served on the Company. After carefully assessing the claim, and assuming the Company determines that it is not at fault or it disagrees with the damages or relief demanded, the Company vigorously defends any lawsuit filed against the Company. In certain legal matters, the Company records a liability when losses are deemed probable and reasonably estimable. In evaluating matters for accrual and disclosure purposes, the Company takes into consideration factors such as our historical experience with matters of a similar nature, the specific facts and circumstances asserted, the likelihood of our prevailing, the availability of insurance, and the severity of any potential loss. The Company reevaluates and updates accruals as matters progress over time.
Based on the Company's assessment of outstanding litigation and claims as of March 31, 2017, the Company has determined that it is not reasonably possible that these lawsuits will individually, or in the aggregate, materially affect its results of operations, financial condition or cash flows. However, the outcome of any litigation is inherently uncertain and there can be no assurance that any expense, liability or damages that may ultimately result from the resolution of these matters will be covered by its insurance or will not be in excess of amounts recognized or provided by insurance coverage and will not have a material adverse effect on our operating results, financial condition or cash flows.
Off-Balance Sheet Arrangements
Under certain circumstances, the Company uses letters of credit and surety bonds to guarantee its performance under various contracts, principally in connection with the installation and integration of its Axon cameras and related technologies. Certain of the Company's letters of credit contracts and surety bonds have stated expiration dates with others being released as the contractual performance terms are completed. At March 31, 2017, the Company had outstanding letters of credit of approximately $2.7 million which are expected to expire in May 2017. Additionally, the Company had approximately $5.7 million of outstanding surety bonds at March 31, 2017, with $1.0 million expiring in 2018, $2.4 million expiring in 2020, and the remaining $2.3 million expiring in 2021.
12. Related Party Transactions
The Company engages Dr. Mark Kroll, a member of the Board of Directors, to provide consulting services. The expenses related to these services were approximately $53,000 and $20,000 for the three months ended March 31, 2017 and 2016. At March 31, 2017 and December 31, 2016, the Company had liabilities of approximately $8,000 and $12,000, respectively, related to these services.
The Company subscribes to a mobile collaboration software suite co-founded and managed by Bret Taylor, a member of the Company's Board of Directors. The cost to license this software is approximately $0.1 million per year, and as of March 31, 2017 and December 31, 2016 the Company had $20,200 and $50,500, respectively, of prepaid costs related to the license subscription.
13. Employee Benefit Plans
The Company has a defined contribution profit sharing 401(k) plan for eligible employees, which is qualified under Sections 401(a) and 401(k) of the Internal Revenue Code of 1986, as amended. Employees are entitled to make tax-deferred contributions of up to the maximum allowed by law of their eligible compensation.
The Company also has a non-qualified deferred compensation plan for certain executives, key employees and non-employee directors through which participants may elect to postpone the receipt and taxation of a portion of their compensation, including stock-based compensation, received from the Company. The non-qualified deferred compensation plan allows eligible participants to defer up to 80% of their base salary and up to 100% of other types of compensation. The plan also allows for matching and discretionary employer contributions. Employee deferrals are deemed 100% vested upon contribution. Distributions from the plan are made upon retirement, death, separation of service, specified date or upon the occurrence of an unforeseeable emergency. Distributions can be paid in a variety of forms from lump sum to installments over a period of years. Participants in the plan are entitled to select from a wide variety of investments available under the plan and are allocated gains or losses based upon the performance of the investments selected by the participant. All gains or losses are allocated fully to plan participants and the Company does not guarantee a rate of return on deferred balances. Assets related to this plan consist of corporate-owned life insurance contracts and are included in other assets in the condensed consolidated balance sheets. Participants have no rights or claims with respect to any plan assets and any such assets are subject to the claims of the Company’s general creditors.
22
Contributions to the plans are made by both the employee and the Company. Company contributions to the 401(k) plan are based on the level of employee contributions and are immediately vested. The Company’s matching contributions to the 401(k) plan for the three months ended March 31, 2017 and 2016, were approximately $0.7 million and $0.5 million, respectively. The Company expects to make contributions to the non-qualified deferred compensation plan related to the three months ended March 31, 2017, of approximately $12,000. Future matching or profit sharing contributions to the plans are at the Company’s sole discretion.
14. Segment Data
The Company’s operations are comprised of two reportable segments: the manufacture and sale of CEWs, accessories and other products and services (the “TASER Weapons” segment); and the software and sensors business, which includes the TASER Cam, Axon cameras and related accessories, Evidence.com, and the Axon Artificial Intelligence team ("Axon AI") (the “Software and Sensors” segment). The Company includes only revenues and costs attributable to the Software and Sensors products in that segment. Included in Software and Sensors segment costs are: costs of sales for both products and services, overhead allocation based on direct labor, selling expense for the Software and Sensors sales team, product management expenses, trade shows and related expenses, and research and development for products included in the Software and Sensors segment. All other costs are included in the TASER Weapons segment. The CODM does not review assets by segment as part of the financial information provided; therefore, only limited asset information is provided in the following tables.
Information relative to the Company’s reportable segments is as follows (in thousands):
Three Months Ended March 31, 2017 | Three Months Ended March 31, 2016 | ||||||||||||||||||||||
TASER Weapons | Software and Sensors | Total | TASER Weapons | Software and Sensors | Total | ||||||||||||||||||
Product sales | $ | 57,671 | $ | 9,820 | $ | 67,491 | $ | 45,834 | $ | 4,841 | $ | 50,675 | |||||||||||
Service revenue | — | 11,751 | 11,751 | — | 4,855 | 4,855 | |||||||||||||||||
Net sales | 57,671 | 21,571 | 79,242 | 45,834 | 9,696 | 55,530 | |||||||||||||||||
Cost of products sold | 18,026 | 9,046 | 27,072 | 14,077 | 3,378 | 17,455 | |||||||||||||||||
Cost of services delivered | — | 3,500 | 3,500 | — | 1,173 | 1,173 | |||||||||||||||||
Gross margin | 39,645 | 9,025 | 48,670 | 31,757 | 5,145 | 36,902 | |||||||||||||||||
Sales, general and administrative | 17,216 | 13,641 | 30,857 | 15,272 | 9,561 | 24,833 | |||||||||||||||||
Research and development | 2,212 | 10,251 | 12,463 | 1,120 | 5,807 | 6,927 | |||||||||||||||||
Income (loss) from operations | $ | 20,217 | $ | (14,867 | ) | $ | 5,350 | $ | 15,365 | $ | (10,223 | ) | $ | 5,142 | |||||||||
Purchase of property and equipment | $ | 933 | $ | 1,410 | $ | 2,343 | $ | 1,071 | $ | 209 | $ | 1,280 | |||||||||||
Purchase of intangible assets | 64 | 31 | 95 | 62 | 36 | 98 | |||||||||||||||||
Purchase of property and equipment and intangible assets in connection with business acquisition | — | 6,479 | 6,479 | — | — | — | |||||||||||||||||
Depreciation and amortization | 841 | 763 | 1,604 | 572 | 329 | 901 | |||||||||||||||||
15. Business Acquisitions
Axon Artificial Intelligence
On December 30, 2016, the Company acquired certain intellectual property from Fossil Group, Inc. and Fossil Vietnam, Limited Liability Company. This transaction, which was accounted for as a business combination under ASC 805, was part of the Company's efforts to expand on the Axon platform by transforming workflows using computer vision and natural language with machine learning techniques in order to analyze data and multimedia captured throughout the course of policing. Additionally, as part of the acquisition, a team of seven researchers and software engineers joined the Company as part of the newly established Axon AI team. The purchase price, totaling approximately $6.8 million, consisted of $3.5 million cash at close, and up to an additional $3.3 million of consideration contingent upon the satisfaction of certain conditions. As of March 31, 2017, no amounts were earned relative to the earn-out provisions.
The Company's purchase price allocation is preliminary and subject to revision as more detailed analyses are completed and additional information about fair value of assets become available.
23
AXON ENTERPRISE, INC.
NOTES TO UNAUDITED CONDENSED CONSOLIDATED FINANCIAL STATEMENTS – (Continued)
The major classes of assets and liabilities to which the Company has allocated the purchase price, on a preliminary basis, were as follows (in thousands):
Developed technology | $ | 5,210 | |
Goodwill | 1,615 | ||
Total purchase price | $ | 6,825 | |
The Company assigned the goodwill to the Software and Sensors segment. The acquired developed technology was assigned an amortization period of 5 years. Costs related to the acquisition were expensed as incurred and were considered insignificant.
Dextro, Inc.
On February 8, 2017, the Company acquired all of the outstanding common stock of Dextro, Inc. ("Dextro"), a Delaware corporation, for a total purchase price of $7.5 million. Dextro's technology provides one of the first computer-vision and deep learning systems to make the visual contents in video searchable in real time. This technology will allow law enforcement agencies and departments to have the ability to quickly isolate and analyze critical seconds of footage from massive amounts of video data. The technology acquired, along with the Dextro employees that joined the Company, will be key additions to the Axon AI team.
The purchase price of $7.5 million consisted primarily of cash, net of cash acquired, and contingent consideration of $1.0 million representing potential earn-outs to former stockholders based on predetermined future financial metrics. The Company also agreed to additional earn-out provisions totaling approximately $1.4 million based, in part, on predefined future financial metrics. The additional earn-outs were not included as part of the purchase price and will be expensed as compensation in the period earned. As of March 31, 2017, no amounts were earned relative to the earn-out provisions.
The major classes of assets and liabilities to which the Company allocated the purchase price was as follows (in thousands):
Accounts receivable | $ | 12 | |
Property and equipment | 46 | ||
Developed technology | 5,800 | ||
Goodwill | 2,546 | ||
Deferred income tax liabilities, net | (917 | ) | |
Total purchase price | $ | 7,487 | |
The Company has assigned the goodwill to the Software and Sensors segment. Identifiable definite lived intangible assets were assigned a total weighted average amortization period of 3.4 years. Dextro has been included in the Company's consolidated results of operations subsequent to the acquisition date. Pro forma results of operations for Dextro have not been presented because they are not material to the consolidated results of operations. In connection with the acquisition, the Company incurred and expensed costs of approximately $0.2 million, which included legal, accounting and other third-party expenses related to the transaction.
24
Item 7. Management’s Discussion and Analysis of Financial Condition and Results of Operations
The following is a discussion of the Company’s financial condition as of March 31, 2017, and results of operations for the three months ended March 31, 2017 and 2016. The following discussion may be understood more fully by reference to the consolidated financial statements, notes to the consolidated financial statements, and Management’s Discussion and Analysis of Financial Condition and Results of Operations section contained in the Company’s Annual Report on Form 10-K for the year ended December 31, 2016.
Certain statements contained in this report may be deemed to be forward-looking statements as defined by the Private Securities Litigation Reform Act of 1995, and the Company intends that such forward-looking statements be subject to the safe-harbor created thereby. Such forward-looking statements may relate to, among other things: our strategies relating to our Axon business; future income trends and our ability to realized deferred tax assets; our belief that customers will honor multi-year contracts despite the existence of appropriations (or similar) clauses; the sufficiency and availability of our liquid assets and capital resources; our litigation strategy, including the outcome of legal proceedings in which we are currently involved; that we may make further repurchases of our common stock; the expected expiration of outstanding letters of credit; our intention to reinvest earnings from foreign operations outside the United States; that foreign sales and expenses may increase; the remediation of identified material weaknesses in internal controls over financial reporting; our estimated effective tax rate for full year 2017; that we may engage in currency hedging activities; and the impact of recently adopted and future accounting standards. We caution that these statements are qualified by important factors that could cause actual results to differ materially from those reflected by the forward looking statements herein. Such factors include, but are not limited to: market acceptance of our products; our dependence on sales of our TASER X26P and X2 CEWs; acceptance of our Evidence.com software as a service delivery model by our law enforcement customers; our ability to design, introduce and sell new products; delays in development schedules; rapid technological change and competition; product defects; breach of our security measures resulting in unauthorized access to customer data; outages and disruptions relating to our Evidence.com service; budgetary and political constraints of prospects and customers; the length of our sales cycle and our ability to realize benefits from our marketing and selling efforts; our exposure to cancellations of government contracts due to appropriation clauses; changes in civil forfeiture laws; the long-term revenue recognition cycle for our SaaS Evidence.com product; our reliance on third party cloud-based storage providers; litigation risks resulting from alleged product-related injuries and media publicity concerning allegations of deaths occurring after use of the TASER device and the negative impact this publicity could have on sales; the outcome of pending or future litigation; our ability to protect our intellectual property as well as intellectual property infringement claims and relating litigation costs; challenges obtaining and enforcing our patent rights in foreign countries; risks of governmental regulations, including regulations of our products by the United States Consumer Product Safety Commission, regulation of our products as a "crime control" product by the Federal government, state and local government regulation and foreign regulation and the adverse effects that could result from our products being classified as firearms by the United States Bureau of Alcohol, Tobacco, Firearms and Explosives; regulatory and political challenges presented by international markets; the possibility that the United States may withdraw from or materially modify the North American Free Trade Agreement; the adverse effect of the United Kingdom’s exit from the European Union; our compliance with regulations governing the environment, including but not limited to, regulations within the European Union; regulations relating to voice, data and communications services; regulations relating to conflict minerals; our dependence on third party suppliers for key components of our products; component shortages; rising costs of raw materials and transportation relating to petroleum prices; that we may experience declines in gross margins due to a shift in product sales from CEWs to Axon devices; our ability to manage our growth and increase manufacturing production to meet demand; establishment and expansion of our direct and indirect distribution channels; our ability to pursue sales directly with customers; risks relating to acquisitions and joint ventures; goodwill impairment; catastrophic events; the adverse effects on our operations and financial results from foreign currency fluctuations; fluctuations in our effective tax rate; counter-party risks relating to cash balances held in excess of FDIC insurance limits; employee retention risks; volatility in our stock price; quarterly fluctuations in our operating results; and other factors identified in documents filed by us with the Securities and Exchange Commission, including those set forth in our Form 10-K for the year ended December 31, 2016.
Overview
Axon Enterprise, Inc.’s (the “Company” or “Axon” or “we” or “our”) core mission is to protect life and to protect truth through technologies that make communities safer. We are the market leader in the development, manufacture and sale of conducted electrical weapons (“CEWs”) and other electronic weapons designed for use in law enforcement, military, corrections, private security and personal defense. To address challenges faced by law enforcement officers subsequent to post-incident, we have developed a fully integrated hardware and software solution to provide our law enforcement customers the capabilities to capture, store, manage, share and analyze video and other digital evidence.
25
Results of Operations
Three Months Ended March 31, 2017 Compared to the Three Months Ended March 31, 2016
The following table presents data from our statements of operations as well as the percentage relationship to total net sales of items included in our statements of operations (dollars in thousands):
Three Months Ended March 31, | |||||||||||||
2017 | 2016 | ||||||||||||
Net sales | $ | 79,242 | 100.0 | % | $ | 55,530 | 100.0 | % | |||||
Cost of products sold and services delivered | 30,572 | 38.6 | 18,628 | 33.5 | |||||||||
Gross margin | 48,670 | 61.4 | 36,902 | 66.5 | |||||||||
Operating expenses: | |||||||||||||
Sales, general and administrative | 30,857 | 38.9 | 24,833 | 44.7 | |||||||||
Research and development | 12,463 | 15.7 | 6,927 | 12.5 | |||||||||
Total operating expenses | 43,320 | 54.7 | 31,760 | 57.2 | |||||||||
Income from operations | 5,350 | 6.8 | 5,142 | 9.3 | |||||||||
Interest and other income, net | 206 | 0.3 | 118 | 0.2 | |||||||||
Income before provision for income taxes | 5,556 | 7.0 | 5,260 | 9.5 | |||||||||
Provision for income taxes | 976 | 1.2 | 1,797 | 3.2 | |||||||||
Net income | $ | 4,580 | 5.8 | % | $ | 3,463 | 6.2 | % | |||||
Net sales to the U.S. and other countries are summarized as follows (dollars in thousands):
Three Months Ended March 31, | |||||||||||||
2017 | 2016 | ||||||||||||
United States | $ | 64,752 | 81.7 | % | $ | 42,468 | 76.5 | % | |||||
Other Countries | 14,490 | 18.3 | 13,062 | 23.5 | |||||||||
Total | $ | 79,242 | 100.0 | % | $ | 55,530 | 100.0 | % | |||||
26
Net Sales
Net sales by product line were as follows (dollars in thousands):
Three Months Ended March 31, | Dollar Change | Percent Change | ||||||||||||||||||
2017 | 2016 | |||||||||||||||||||
TASER Weapons segment: | ||||||||||||||||||||
TASER X26P | $ | 15,668 | 19.8 | % | $ | 18,776 | 33.8 | % | $ | (3,108 | ) | (16.6 | )% | |||||||
TASER X2 | 18,986 | 24.0 | 9,614 | 17.3 | 9,372 | 97.5 | ||||||||||||||
TASER X26 | 1,345 | 1.7 | 1,398 | 2.5 | (53 | ) | (3.8 | ) | ||||||||||||
TASER Pulse and Bolt | 1,022 | 1.3 | 542 | 1.0 | 480 | 88.6 | ||||||||||||||
Single cartridges | 16,664 | 21.0 | 12,187 | 21.9 | 4,477 | 36.7 | ||||||||||||||
Extended warranties including TAP | 2,843 | 3.6 | 2,151 | 3.9 | 692 | 32.2 | ||||||||||||||
Other | 1,143 | 1.4 | 1,166 | 2.1 | (23 | ) | (2.0 | ) | ||||||||||||
TASER Weapons segment | 57,671 | 72.8 | 45,834 | 82.5 | 11,837 | 25.8 | ||||||||||||||
Software and Sensors segment: | ||||||||||||||||||||
Axon Body | 3,446 | 4.3 | 1,483 | 2.7 | 1,963 | 132.4 | ||||||||||||||
Axon Flex | 1,475 | 1.9 | 922 | 1.7 | 553 | 60.0 | ||||||||||||||
Axon Dock | 1,987 | 2.5 | 488 | 0.9 | 1,499 | 307.2 | ||||||||||||||
Evidence.com | 11,742 | 14.8 | 4,590 | 8.3 | 7,152 | 155.8 | ||||||||||||||
TASER Cam | 719 | 0.9 | 991 | 1.8 | (272 | ) | (27.4 | ) | ||||||||||||
Extended warranties including TAP | 1,418 | 1.8 | 643 | 1.2 | 775 | 120.5 | ||||||||||||||
Other | 784 | 1.0 | 579 | 1.0 | 205 | 35.4 | ||||||||||||||
Software and Sensors segment | 21,571 | 27.2 | 9,696 | 17.5 | 11,875 | 122.5 | ||||||||||||||
Total net sales | $ | 79,242 | 100.0 | % | $ | 55,530 | 100.0 | % | $ | 23,712 | 42.7 | |||||||||
Net unit sales for TASER Weapons handles and other products and Software and Sensors segment products were as follows:
Three Months Ended March 31, | Unit Change | Percent Change | |||||||||
2017 | 2016 | ||||||||||
TASER X26P | 15,361 | 18,567 | (3,206 | ) | (17.3 | )% | |||||
TASER X2 | 17,137 | 8,737 | 8,400 | 96.1 | |||||||
TASER X26 | 618 | 821 | (203 | ) | (24.7 | ) | |||||
TASER Pulse and Bolt | 3,572 | 1,566 | 2,006 | 128.1 | |||||||
Cartridges | 595,986 | 465,157 | 130,829 | 28.1 | |||||||
Axon Flex | 3,101 | 2,397 | 704 | 29.4 | |||||||
Axon Body | 20,313 | 6,198 | 14,115 | 227.7 | |||||||
Axon Dock | 4,875 | 1,402 | 3,473 | 247.7 | |||||||
TASER Cam | 1,339 | 2,005 | (666 | ) | (33.2 | ) | |||||
Net sales were $79.2 million and $55.5 million for the three months ended March 31, 2017 and 2016, respectively, an increase of $23.7 million or 42.7%. International revenues were $14.5 million and $13.1 million for the three months ended March 31, 2017 and 2016, respectively, an increase of $1.4 million or 10.9%.
Net sales for the TASER Weapons segment were $57.7 million and $45.8 million for the three months ended March 31, 2017 and 2016, respectively, an increase of $11.8 million or 25.8%. During the first quarter of 2017, the Home Office of the UK government approved the Company's Smart Weapons for sale which resulted in increased revenues within the UK of $2.9 million for the three months ended March 31, 2017 as compared to the same period in 2016. The Company also experienced increased purchases under its Officer Safety Plan and TASER 60 installment payment programs. Additionally, the Company increased cartridge sales by $4.5 million to $16.7 million during the quarter ended March 31, 2017 as compared to $12.2 million during 2016.
27
Net sales for the Software and Sensors segment were $21.6 million and $9.7 million for the three months ended March 31, 2017 and 2016, respectively, an increase of $11.9 million, or 122.5%. The overall increase in the Software and Sensors segment was driven by continued adoption of on-officer cameras and related technologies, including the Company's Evidence.com digital evidence management software suite. Revenue related to the Company's on-officer cameras and related accessories increased approximately $4.0 million. The Company is continuing to enter into new contracts with domestic and international agencies seeking to deploy its technologies. Evidence.com revenues for the three months ended March 31, 2017 increased $7.2 million to $11.7 million as compared to the same period in 2016. This increase was primarily driven by an increase in active users on the Company's Evidence.com platform.
To gain more immediate feedback regarding activity for Axon camera products and Evidence.com services, we also review bookings for these products. We consider bookings to be a statistical measure defined as the sales price of orders (not invoiced sales), net of cancellations, placed in the relevant fiscal period, regardless of when the products or services ultimately will be provided. Some bookings will be invoiced in subsequent periods. Due to municipal government funding rules, certain of the future period amounts included in bookings are subject to budget appropriation or other contract cancellation clauses. Although the Company has entered into contracts for the delivery of products and services in the future and anticipates the contracts will be completed, if agencies do not appropriate funds in future year budgets, or enact a cancellation clause, revenue associated with these bookings may not ultimately be recognized, resulting in a future reduction to bookings. Bookings related to Evidence.com and Axon products and services, net of cancellations, were $60.1 million and $52.1 million during the three months ended March 31, 2017 and 2016, respectively, an increase of $8.0 million, or 15.4%.
The chart below illustrates the Company's Software and Sensors segment quarterly bookings for each of the previous six fiscal quarters (in thousands):
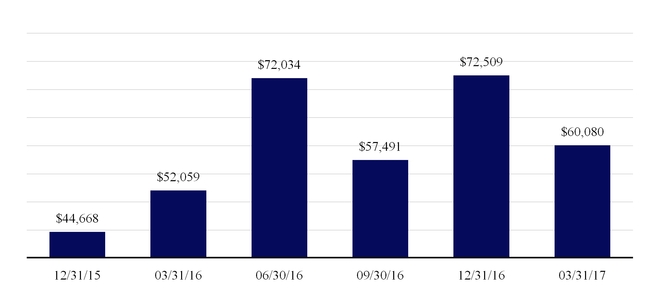
Cost of Products Sold and Services Delivered
Cost of products sold and services delivered was $30.6 million and $18.6 million for the three months ended March 31, 2017 and 2016, respectively, an increase of $11.9 million, or 64.1%. As a percentage of net sales, cost of products sold and services delivered increased to 38.6% for the three months ended March 31, 2017 compared to 33.5% during the same period in 2016.
Within the TASER Weapons segment, cost of products sold increased to $18.0 million for the three months ended March 31, 2017 from $14.1 million in 2016, and increased as a percentage of sales to 31.3% from 30.7%, respectively.
Within the Software and Sensors segment, cost of products sold and services delivered increased to $12.5 million for the three months ended March 31, 2017 from $4.6 million for the same period in 2016. Cost of products sold and services delivered as a percentage of sales increased to 58.2% for the three months ended March 31, 2017 from 46.9% for the same period in 2016. The overall increase in costs was driven by higher sales volumes, with no significant changes in product costs experienced during the three months ended March 31, 2017 as compared to the same period in 2016.
28
Gross Margin
Gross margin increased $11.8 million to $48.7 million for the three months ended March 31, 2017 compared to $36.9 million for 2016. As a percentage of net sales, gross margin was 61.4% for the three months ended March 31, 2017 compared to 66.5% for 2016.
As a percentage of net sales, gross margin for the TASER Weapons segment was 68.7% compared to 69.3% for the three months ended March 31, 2017 and 2016, respectively. As a percentage of net sales, gross margin for the Software and Sensors segment was 41.8% and 53.1% for the three months ended March 31, 2017 and 2016, respectively. Within the Software and Sensors segment hardware gross margins were 7.9% and 30.2% for the three months ended March 31, 2017 and 2016, respectively, while the service margins were 70.2% and 75.8% during those same periods, respectively. The change in hardware margins was attributable to higher discounting while the decrease in service margins was primarily attributable to non-recurring expenses related to the Company's data migration to a new cloud-storage provider.
Sales, General and Administrative Expenses
Sales, general and administrative (“SG&A”) expenses were comprised as follows (dollars in thousands):
Three Months Ended March 31, | Dollar Change | Percent Change | ||||||||||||
2017 | 2016 | |||||||||||||
Salaries, benefits and bonus | $ | 14,076 | $ | 9,674 | $ | 4,402 | 45.5 | % | ||||||
Stock-based compensation | 2,028 | 1,390 | 638 | 45.9 | ||||||||||
Professional, consulting and lobbying | 4,564 | 3,992 | 572 | 14.3 | ||||||||||
Sales and marketing | 3,413 | 4,807 | (1,394 | ) | (29.0 | ) | ||||||||
Travel and meals | 2,672 | 2,019 | 653 | 32.3 | ||||||||||
Other | 4,104 | 2,951 | 1,153 | 39.1 | ||||||||||
Total sales, general and administrative expenses | $ | 30,857 | $ | 24,833 | $ | 6,024 | 24.3 | |||||||
Sales, general, and administrative as a percentage of net sales | 38.9 | % | 44.7 | % | ||||||||||
SG&A expenses were $30.9 million and $24.8 million for the three months ended March 31, 2017 and 2016, respectively, an increase of $6.0 million or 24.3%. As a percentage of total net sales, SG&A expenses decreased to 38.9% for the three months ended March 31, 2017 compared to 44.7% for the same period in 2016.
29
SG&A by type and by segment was as follows (dollars in thousands):
Three Months Ended March 31, | Dollar Change | Percent Change | ||||||||||||||||||
2017 | 2016 | |||||||||||||||||||
TASER Weapons segment: | ||||||||||||||||||||
Salaries, benefits and bonus | $ | 8,074 | 26.2 | % | $ | 5,719 | 23.0 | % | $ | 2,355 | 41.2 | % | ||||||||
Stock-based compensation | 1,480 | 4.8 | 758 | 3.1 | 722 | 95.3 | ||||||||||||||
Professional, consulting and lobbying | 1,852 | 6.0 | 2,958 | 11.9 | (1,106 | ) | (37.4 | ) | ||||||||||||
Sales and marketing | 1,255 | 4.1 | 2,668 | 10.7 | (1,413 | ) | (53.0 | ) | ||||||||||||
Travel and meals | 1,318 | 4.3 | 945 | 3.8 | 373 | 39.5 | ||||||||||||||
Other | 3,237 | 10.5 | 2,224 | 9.0 | 1,013 | 45.5 | ||||||||||||||
TASER Weapons segment | 17,216 | 55.8 | 15,272 | 61.5 | 1,944 | 12.7 | ||||||||||||||
Software and Sensors segment: | ||||||||||||||||||||
Salaries, benefits and bonus | 6,002 | 19.5 | 3,955 | 15.9 | 2,047 | 51.8 | ||||||||||||||
Stock-based compensation | 548 | 1.8 | 632 | 2.5 | (84 | ) | (13.3 | ) | ||||||||||||
Professional, consulting and lobbying | 2,712 | 8.8 | 1,034 | 4.2 | 1,678 | 162.3 | ||||||||||||||
Sales and marketing | 2,158 | 7.0 | 2,139 | 8.6 | 19 | 0.9 | ||||||||||||||
Travel and meals | 1,354 | 4.4 | 1,074 | 4.3 | 280 | 26.1 | ||||||||||||||
Other | 867 | 2.8 | 727 | 2.9 | 140 | 19.3 | ||||||||||||||
Software and Sensors segment | 13,641 | 44.2 | 9,561 | 38.5 | 4,080 | 42.7 | ||||||||||||||
Total sales, general and administrative expenses | $ | 30,857 | 100.0 | % | $ | 24,833 | 100.0 | % | $ | 6,024 | 24.3 | |||||||||
Within the TASER Weapons segment, SG&A increased $1.9 million, or 12.7%, to $17.2 million during the three months ended March 31, 2017 as compared to $15.3 million for the three months ended March 31, 2016. Salaries, benefits and bonus along with stock-based compensation increased approximately $3.1 million during the three months ended March 31, 2017 as compared to 2016 as the Company continued its efforts to build out direct sales teams internally along with the related support staff during the current quarter. Sales and marketing expenses for the TASER Weapons segment decreased $1.4 million during the three months ended March 31, 2017 as compared to 2016 attributed to lower total commissions of $1.2 million attributable to a large international TASER weapons order in the first quarter of 2016 at a higher contractual commission rate. Professional, consulting and lobbying expense decreased $1.1 million primarily due to lower patent and trademark related legal fees and lower spend on lobbying services during the three months ended March 31, 2016. Increases in other operating expenses was partially attributable to $0.2 million of increased bad debt provisions and $0.3 million of increased expenses related to computer hardware and licenses, with the remaining being related to overall growth of the Company's operations.
Within the Software and Sensors segment, SG&A increased $4.1 million, or 42.7%, to $13.6 million during the three months ended March 31, 2017 as compared to $9.6 million for the same period in 2016. Salaries, benefits and bonus along with stock-based compensation increased approximately $2.0 million during the three months ended March 31, 2017 as compared to 2016 as the Company continues to build its direct sales and support teams and corporate infrastructure to continue to scale the Software and Sensors segment. The increase in travel and meals of $0.3 million during this time period correlated with the increase in employees during the period. The Company continued its increased consulting efforts related to increasing awareness of its Software and Sensors products during the three months ended March 31, 2017 as compared to 2016 which made up $1.1 million of the $1.7 million increase in professional, consulting and lobbying expense. Also included in the increase in professional expenses were legal fees related to an on-going patent litigation suit filed by a competitor of the Company as well as higher audit and tax fees related to the Company's Software and Sensors segment accounting matters.
30
Research and Development Expenses
Research and development expenses (“R&D”) expenses were comprised as follows (dollars in thousands):
Three Months Ended March 31, | Dollar Change | Percent Change | ||||||||||||
2017 | 2016 | |||||||||||||
Salaries, benefits and bonus | $ | 7,156 | $ | 3,924 | $ | 3,232 | 82.4 | % | ||||||
Stock-based compensation | 1,340 | 730 | 610 | 83.6 | ||||||||||
Professional and consulting | 1,572 | 786 | 786 | 100.0 | ||||||||||
Travel and meals | 302 | 191 | 111 | 58.1 | ||||||||||
Other | 2,093 | 1,296 | 797 | 61.5 | ||||||||||
Total research and development expenses | $ | 12,463 | $ | 6,927 | $ | 5,536 | 79.9 | |||||||
Research and development as a percentage of net sales | 15.7 | % | 12.5 | % | ||||||||||
R&D expenses were $12.5 million and $6.9 million for the three months ended March 31, 2017 and 2016, respectively, an increase of $5.5 million, or 79.9%. As a percentage of net sales, R&D decreased to 15.7% for the three months ended March 31, 2017 compared to 12.5% for the same period in 2016.
R&D by type and by segment was as follows (dollars in thousands):
Three Months Ended March 31, | Dollar Change | Percent Change | ||||||||||||||||||
2017 | 2016 | |||||||||||||||||||
TASER Weapons segment: | ||||||||||||||||||||
Salaries, benefits and bonus | $ | 1,107 | 8.9 | % | $ | 293 | 4.2 | % | $ | 814 | 277.8 | % | ||||||||
Stock-based compensation | 128 | 1.0 | 143 | 2.1 | (15 | ) | (10.5 | ) | ||||||||||||
Professional and consulting | 325 | 2.6 | 354 | 5.1 | (29 | ) | (8.2 | ) | ||||||||||||
Travel and meals | 103 | 0.8 | 37 | 0.5 | 66 | 178.4 | ||||||||||||||
Other | 549 | 4.4 | 293 | 4.2 | 256 | 87.4 | ||||||||||||||
TASER Weapons segment | 2,212 | 17.7 | 1,120 | 16.2 | 1,092 | 97.5 | ||||||||||||||
Software and Sensors segment: | ||||||||||||||||||||
Salaries, benefits and bonus | 6,049 | 48.5 | $ | 3,631 | 52.4 | 2,418 | 66.6 | |||||||||||||
Stock-based compensation | 1,212 | 9.7 | 587 | 8.5 | 625 | 106.5 | ||||||||||||||
Professional and consulting | 1,247 | 10.0 | 432 | 6.2 | 815 | 188.7 | ||||||||||||||
Travel and meals | 199 | 1.6 | 154 | 2.2 | 45 | 29.2 | ||||||||||||||
Other | 1,544 | 12.4 | 1,003 | 14.5 | 541 | 53.9 | ||||||||||||||
Software and Sensors segment: | 10,251 | 82.3 | 5,807 | 83.8 | 4,444 | 76.5 | ||||||||||||||
Total research and development expenses | $ | 12,463 | 100.0 | % | $ | 6,927 | 100.0 | % | $ | 5,536 | 79.9 | |||||||||
The Company's Software and Sensors segment was responsible for approximately 80% of the overall increase in R&D. The main increase in the Weapons segment was approximately $0.8 million of salaries, benefits and bonus along with stock-based compensation as the Company continues to invest in the development of new CEW related technologies. Of the $4.4 million increase in R&D for the Software and Sensors segment, $3.0 million related to salaries and benefits, inclusive of stock-based compensation. The Company remains focused on growing the Software and Sensors segment as it adds headcount and external resources to develop new products and services to further advance its scalable cloud-connected device platform. The Company also incurred higher consulting and professional fees related to the development of new products in both of its segments.
31
Interest and Other Income
Interest and other income, net of expense, was $0.2 million and $0.1 million for the three months ended March 31, 2017 and 2016, respectively. Interest and other income amounts consisted primarily of investment interest income and interest income related to the Company's installment purchase programs offered to customers as well as foreign currency transaction adjustments.
Provision for Income Taxes
The provision for income was $1.0 million for the three months ended March 31, 2017, which was an effective tax rate of 17.6%. Our estimated full year effective income tax rate for 2017, before discrete period adjustments, is approximately 42.9%, which is more than the statutory rate primarily due to the impact of non-deductible losses in certain foreign jurisdictions, state taxes and non-deductible expenses for items such as Subpart F income, meals and entertainment, and lobbying fees. The effective tax rate was unfavorably impacted by foreign losses for which the Company is not expected to receive a tax benefit. This was offset by the favorable impact of a $1.0 million discrete tax benefit associated with windfalls related to stock-based compensation for restricted stock units that vested or stock options that were exercised during the quarter.
Net Income
Our net income increased by $1.1 million to $4.6 million for the three months ended March 31, 2017 compared to $3.5 million for the same period in 2016. Net income per basic and diluted share was $0.09 for the three months ended March 31, 2017 compared to $0.06 per basic and diluted share for the same period in 2016.
32
Three Months Ended March 31, 2017 Compared to the Three Months December 31, 2016
Net Sales
Net sales by product line were as follows (dollars in thousands):
Three Months Ended March 31, 2017 | Three Months Ended December 31, 2016 | Dollar Change | Percent Change | |||||||||||||||||
TASER Weapons segment: | ||||||||||||||||||||
TASER X26P | $ | 15,668 | 19.8 | % | $ | 20,233 | 24.7 | % | $ | (4,565 | ) | (22.6 | )% | |||||||
TASER X2 | 18,986 | 24.0 | 15,529 | 18.9 | 3,457 | 22.3 | ||||||||||||||
TASER X26 | 1,345 | 1.7 | 2,042 | 2.5 | (697 | ) | (34.1 | ) | ||||||||||||
TASER Pulse and Bolt | 1,022 | 1.3 | 944 | 1.2 | 78 | 8.3 | ||||||||||||||
Single cartridges | 16,664 | 21.0 | 15,292 | 18.6 | 1,372 | 9.0 | ||||||||||||||
Extended warranties including TAP | 2,843 | 3.6 | 2,778 | 3.4 | 65 | 2.3 | ||||||||||||||
Other | 1,143 | 1.4 | 1,519 | 1.9 | (376 | ) | (24.8 | ) | ||||||||||||
TASER Weapons segment | 57,671 | 72.8 | 58,337 | 71.1 | (666 | ) | (1.1 | ) | ||||||||||||
Software and Sensors segment: | ||||||||||||||||||||
Axon Body | 3,446 | 4.3 | 5,694 | 6.9 | (2,248 | ) | (39.5 | ) | ||||||||||||
Axon Flex | 1,475 | 1.9 | 564 | 0.7 | 911 | 161.5 | ||||||||||||||
Axon Dock | 1,987 | 2.5 | 2,499 | 3.0 | (512 | ) | (20.5 | ) | ||||||||||||
Evidence.com | 11,742 | 14.8 | 11,239 | 13.7 | 503 | 4.5 | ||||||||||||||
TASER Cam | 719 | 0.9 | 1,577 | 1.9 | (858 | ) | (54.4 | ) | ||||||||||||
Extended warranties including TAP | 1,418 | 1.8 | 1,276 | 1.6 | 142 | 11.1 | ||||||||||||||
Other | 784 | 1.0 | 891 | 1.1 | (107 | ) | (12.0 | ) | ||||||||||||
Software and Sensors segment | 21,571 | 27.2 | 23,740 | 28.9 | (2,169 | ) | (9.1 | ) | ||||||||||||
Total net sales | $ | 79,242 | 100.0 | % | $ | 82,077 | 100.0 | % | $ | (2,835 | ) | (3.5 | ) | |||||||
Net unit sales for TASER Weapons handles and other products and Axon segment products were as follows:
Three Months Ended March 31, 2017 | Three Months Ended December 31, 2016 | Unit Change | Percent Change | ||||||||
TASER X26P | 15,361 | 20,833 | (5,472 | ) | (26.3 | )% | |||||
TASER X2 | 17,137 | 13,003 | 4,134 | 31.8 | |||||||
TASER X26 | 618 | 769 | (151 | ) | (19.6 | ) | |||||
TASER Pulse and Bolt | 3,572 | 3,027 | 545 | 18.0 | |||||||
Cartridges | 595,986 | 554,395 | 41,591 | 7.5 | |||||||
Axon Flex | 3,101 | 3,147 | (46 | ) | (1.5 | ) | |||||
Axon Body | 20,313 | 25,177 | (4,864 | ) | (19.3 | ) | |||||
Axon Dock | 4,875 | 5,747 | (872 | ) | (15.2 | ) | |||||
TASER Cam | 1,339 | 3,106 | (1,767 | ) | (56.9 | ) | |||||
Net sales were $79.2 million and $82.1 million for the three months ended March 31, 2017 and December 31, 2016, respectively, an increase of $2.8 million or 3.5%. Net sales for the TASER Weapons segment were $57.7 million and $58.3 million for the three months ended March 31, 2017 and December 31, 2016, respectively, a decrease of $0.7 million or 1.1%. The decrease in sales was primarily attributable to year-end budget appropriations expiring at December 31, 2016 which resulted in higher fourth quarter 2016 revenues as compared to first quarter of 2017. This decrease was partially offset by the Home Office of the UK government approval of the Company's Smart Weapons for sale which resulted in increased revenues in the first quarter of 2017. International revenues were $14.5 million for the three months ended March 31, 2017 as compared to $18.6 million for the three months ended December 31, 2016. The fourth quarter was the highest quarter of international revenue in the Company's
33
history. Additionally, individual sales transactions in the international market are generally larger and occur more intermittently than in the domestic market due to the profile of the Company's customers often causing unforeseen quarterly volatility.
Net sales for the Software and Sensors segment were $21.6 million and $23.7 million for the three months ended March 31, 2017 and December 31, 2016 respectively, a decrease of $2.2 million or 9.1%. The decrease is partially attributable to the expiration of year-end budget appropriations as well as higher backlog of the Axon Flex 2 camera caused by quality control measures resulting in lower shipments during the first quarter than anticipated.
Liquidity and Capital Resources
Summary
As of March 31, 2017, we had $71.6 million of cash, cash equivalents and investments, a decrease of $17.7 million from the end of 2016.
Cash Flows
The following table summarizes our cash flows from operating, investing and financing activities (in thousands):
Three Months Ended March 31, | |||||||
2017 | 2016 | ||||||
Operating activities | $ | (6,609 | ) | $ | 7,093 | ||
Investing activities | 9,884 | (3,637 | ) | ||||
Financing activities | (1,877 | ) | (9,722 | ) | |||
Effect of exchange rate changes on cash and cash equivalents | (75 | ) | 105 | ||||
Net decrease in cash and cash equivalents | $ | 1,323 | $ | (6,161 | ) | ||
Operating activities
Net cash used in operating activities in the first three months of 2017 of $6.6 million consisted of $4.6 million in net income impacted by the net increase of non-cash income statement items totaling $4.2 million and decrease of $15.4 million for the net change in operating assets and liabilities. Included in the non-cash items were $1.6 million in depreciation and amortization expense, $3.4 million in stock-based compensation expense and $0.2 million of bond premium amortization. These non-cash impacts were partially offset by deferred income tax expense of $1.2 million. Increases to operating cash flows consisted of increased accounts payable, accrued and other liabilities of $6.3 million, which reduced the amount of cash used during the period, along with increased deferred revenue of $6.3 million. The increase in deferred revenue was primarily driven by continued sales growth of products and services within the Company's Software and Sensors segment that are typically invoiced in advance, and recognized over the duration of the contract period as hardware and services are delivered. Of the increase in deferred revenue, $2.7 million resulted from increased hardware deferred revenue along with increased deferred warranty revenue of $2.0 million, and increased services, including Evidence.com subscriptions, of $1.6 million. Cash used in operations were also impacted by various other operating items, with the most significant component related to increased inventory of $13.7 million in anticipation of the Company's national field trial offer for body cameras as well as increased sales throughout the remainder of 2017. The Company also had increased prepaid expenses and other assets of $11.0 million which was primarily driven by increased long-term accounts receivable of $7.1 million related to the Company's Officer Safety Plan and TASER 60 purchase programs, a $1.5 million increase in value added tax ("VAT") receivables attributable to higher TASER weapons sales in the UK and $0.7 million of increased prepaid commissions which are paid for when a contract is booked, and subsequently amortized over the contractual period. Cash from operations also decreased due to increases in accounts and notes receivable of $3.5 million driven by higher sales.
Net cash provided by operating activities in the first three months of 2016 of $7.1 million consisted of $3.5 million in net income impacted by the net increase of non-cash income statement items totaling $3.2 million and $0.4 million for the net change in operating assets and liabilities. Included in the non-cash items were $0.9 million in depreciation and amortization expense, $2.2 million in stock-based compensation expense and $0.4 million of bond premium amortization. These non-cash impacts were partially offset by deferred income tax expense of $0.7 million. The most significant increases to the portion of cash from operating activities related to the changes in operating assets and liabilities were increases of $5.6 million in accounts payable, accrued liabilities and other, and an increase in deferred revenue and customer deposits of $4.4 million and $1.0 million, respectively. The increase in deferred revenue was primarily driven by the continued adoption of products and services within the Software and Sensors segment that are typically invoiced at inception of the contract, and recognized over the duration of the contract period
34
as hardware and services are delivered. Of the increase in deferred revenue, $2.7 million resulted from increased hardware deferred revenue along with increased deferred warranty revenue of $1.3 million, and increased services, including Evidence.com subscriptions, of $0.2 million, with the remaining $0.2 million made up primarily of deferred training revenue. These increases were partially offset by increases in accounts and notes receivable of $2.2 million, increases in inventory of $4.3 million and increased prepaid expenses and other assets of $4.1 million.
Investing activities
We generated $9.9 million from investing activities during the first three months of 2017. Maturities and calls of investments of $18.8 million was partially offset by the Company's investment of $2.4 million in the purchase of property and equipment and intangible assets. The Company also used $6.5 million in connection with the acquisition of Dextro, Inc.
Primarily as a result of investing cash generated from operating activities, we used $3.6 million for investing activities during the first three months of 2016. Purchases of investments, net of calls and maturities, were $2.3 million. In addition, the Company invested $1.4 million in the purchase of property and equipment and intangible assets.
Financing activities
Net cash used in financing activities was $1.9 million during the first three months of 2017. During the first three months of 2017, the Company paid payroll taxes of $2.2 million on behalf of employees who net-settled stock awards during the period which was offset by proceeds from options exercised of $0.3 million.
Net cash used in financing activities was $9.7 million during the first three months of 2016. During the first quarter of 2016, the Company repurchased $9.0 million of the Company's common stock, reflecting a weighted average cost of $18.86 per share, inclusive of applicable administrative costs for the transactions. Additionally, the Company paid payroll taxes of $0.7 million on behalf of employees who net-settled stock awards during the period.
Liquidity and Capital Resources
Our most significant sources of liquidity continue to be funds generated by operating activities and available cash and cash equivalents. In addition, our $10.0 million revolving credit facility is available for additional working capital needs or investment opportunities. Under the terms of the line of credit, available borrowings are reduced by outstanding letters of credit. The line is secured by substantially all of the assets of the Company, and bears interest at varying rates, currently LIBOR plus 1.5% or Prime less 0.75%. At March 31, 2017 and December 31, 2016, there were no borrowings under the line. As of March 31, 2017, we had letters of credit outstanding of $2.7 million, leaving the net amount available for borrowing of approximately $7.3 million. The facility matures on July 31, 2017.
Our agreement with the bank requires us to comply with certain financial and other covenants including maintenance of a maximum leverage ratio and minimum fixed charge coverage ratio. The leverage ratio (ratio of total liabilities to tangible net worth) can be no greater than 1:1, and the fixed charge coverage ratio can be no less than 1.25:1, based upon a trailing twelve-month period. At March 31, 2017, the Company’s leverage ratio was 1.14:1 and its fixed charge coverage ratio was 2.45:1. The Company's violation of the leverage ratio requirement was waived as of March 31, 2017.
Based on our strong balance sheet at March 31, 2017, we believe financing will be available, both through our existing credit line and possible additional financing. However, there is no assurance that such funding will be available on terms acceptable to us, or at all.
We believe funds generated from our expected results of operations, as well as available cash and investments, will be sufficient to finance our operations and strategic initiatives for the remainder of 2017 and the foreseeable future. From time to time, our board of directors considers repurchases of our common stock. Further repurchases of our common stock may take place on the open market, may be financed with available cash and are subject to board authorization as well as market and business conditions.
Off-Balance Sheet Arrangements
The discussion of off-balance sheet arrangements in Note 11 to the unaudited condensed consolidated financial statements included in PART I, ITEM I of this Form 10-Q is incorporated by reference herein.
35
Critical Accounting Estimates
We have identified the following accounting estimates as critical to our business operations and the understanding of our results of operations. The preparation of this Quarterly Report on Form 10-Q requires us to make estimates and assumptions that affect the reported amount of assets and liabilities, the disclosure of contingent assets and liabilities at the date of our unaudited condensed consolidated financial statements, and the reported amounts of revenue and expenses during the reporting period. While we don’t believe that a change in these estimates is reasonably likely, there can be no assurance that our actual results will not differ from these estimates. The effect of these estimates on our business operations is discussed below.
Product Warranties
The Company warranties its CEWs, Axon cameras and Axon Docks from manufacturing defects on a limited basis for a period of one year after purchase and, thereafter, will replace any defective unit for a fee. Estimated costs for our standard warranty are charged to cost of products sold and services delivered when revenue is recorded for the related product. We estimate future warranty costs based on historical data related to returns and warranty costs on a quarterly basis and apply this rate to current product anticipated returns from our customers. We have also historically increased our reserve amount if we become aware of a component failure that could result in larger than anticipated returns from our customers. The accrued warranty liability is reviewed quarterly to evaluate whether it sufficiently reflects the remaining warranty obligations based on the anticipated expenditures over the balance of the warranty obligation period, and adjustments are made when actual warranty claim experience differs from estimates. As of March 31, 2017 and December 31, 2016, our reserve for warranty returns was approximately $0.3 million and $0.8 million, respectively. Warranty expense (recoveries) for the three months ended March 31, 2017 and 2016 was $(0.4) million and $0.2 million, respectively. The decrease in warranty reserve and related expense as of and for the three months ended March 31, 2017 was primarily driven by the release of initial reserves related to the launch of the Axon Body 2 on-officer body camera. The Company experienced lower warranty claims than initially expected, and as such has adjusted the warranty reserve to better reflect actual warranty claims. As the Company continues investing in the development of new technologies it will continue to assess the adequacy of its warranty reserve related to inherent uncertainties with new product offerings.
Revenue related to separately-priced extended warranties is recorded as deferred revenue at its contractual amount and subsequently recognized in net sales on a straight-line basis over the delivery period. Costs related to extended warranties are charged to cost of products sold and services delivered when incurred.
Inventory
Inventories are stated at the lower of cost and net realizable value, with cost determined using the weighted average cost of raw materials, which approximates the first-in, first-out (“FIFO”) method, and an allocation of manufacturing labor and overhead costs. The allocation of manufacturing labor and overhead costs includes management’s judgments of what constitutes normal capacity of our production facilities and a determination of what costs are considered to be abnormal fixed production costs, which are expensed as current period charges. Provisions are made to reduce excess, obsolete or slow-moving inventories to their net realizable value. These provisions are based on our best estimates after considering historical demand, projected future demand, inventory purchase commitments, industry and market trends and conditions and other factors. During the three months ended March 31, 2017, the Company recorded provisions for excess and obsolete inventory of approximately $0.7 million compared to $0.3 million during the same period in 2016. The increase for the three months ended March 31, 2017 was driven by analyses looking at projected sales data for existing products and making corresponding adjustments to state inventories at their lower of cost and net realizable value. When the Company phases out previous generations of its CEWs and body-worn cameras and related accessories, and slows or ceases production of these products, the finished goods and related raw materials may become excess or obsolete. No specific product or product lines made up a meaningful portion of the overall increase.
Revenue Recognition, Deferred Revenue and Accounts and Notes Receivable
We derive our revenue from two primary sources: (1) the sale of physical products, including CEWs, Axon cameras, corresponding hardware extended warranties, and related accessories such as Axon docks, cartridges and batteries, among others and (2) subscription to our Evidence.com digital evidence management SaaS (including data storage fees and other ancillary services), which includes varying levels of support. To a lesser extent, we also recognize training and other revenue. Revenue is recognized when persuasive evidence of an arrangement exists, delivery has occurred or services have been rendered, title has transferred, the price is fixed and collectability is reasonably assured. Contractual arrangements may contain explicit customer acceptance provisions, and under such arrangements, the Company defers recognition of revenue until formal customer acceptance is received. Extended warranty revenue, SaaS revenue and related data storage revenue are recognized ratably over the term of the contract beginning on the commencement date of each contract.
36
Revenue arrangements with multiple deliverables are divided into separate units and revenue is allocated using the relative selling price method based upon vendor-specific objective evidence of selling price or third-party evidence of the selling prices if vendor-specific objective evidence of selling prices does not exist. If neither vendor-specific objective evidence nor third-party evidence exists, management uses its best estimate of selling price. The majority of the Company’s allocations of arrangement consideration under multiple element arrangements are performed utilizing prices charged to customers for deliverables when sold separately. The Company’s multiple element arrangements may include future CEWs and/or Axon devices to be delivered at defined points within a multi-year contract, and in those arrangements, the Company allocates total arrangement consideration over the life of the multi-year contract to future deliverables using management’s best estimate of selling price. The Company has not utilized third party evidence of selling price.
For the three months ended March 31, 2017 and 2016, the composition of revenue recognized from arrangements containing multiple elements and those not containing multiple elements was as follows (dollars in thousands):
Three Months Ended March 31, 2017 | Three Months Ended March 31, 2016 | ||||||||||||||||||||||||||||||||||||||||
TASER Weapons | Software and Sensors | Total | TASER Weapons | Software and Sensors | Total | ||||||||||||||||||||||||||||||||||||
Arrangements with multiple elements | $ | 13,938 | 24.2 | % | $ | 19,514 | 90.5 | % | $ | 33,452 | 42.2 | % | $ | 4,098 | 8.9 | % | $ | 7,477 | 77.1 | % | $ | 11,575 | 20.8 | % | |||||||||||||||||
Arrangements without multiple elements | 43,733 | 75.8 | 2,057 | 9.5 | 45,790 | 57.8 | 41,736 | 91.1 | 2,219 | 22.9 | 43,955 | 79.2 | |||||||||||||||||||||||||||||
Total | $ | 57,671 | 100.0 | % | $ | 21,571 | 100.0 | % | $ | 79,242 | 100.0 | % | $ | 45,834 | 100.0 | % | $ | 9,696 | 100.0 | % | $ | 55,530 | 100.0 | % | |||||||||||||||||
Evidence.com, Axon cameras and related accessories are sometimes sold separately, but in most instances are sold together. In these instances, customers typically purchase and pay for the equipment and one year of Evidence.com in advance. Additional years of service are generally billed annually over a specified service term, which has typically ranged from one to five years. Axon equipment represents a deliverable that is provided to the customer at the time of sale, while Evidence.com services are provided over the specified term of the contract. Generally, the Company recognizes revenue for the Axon equipment at the time of the sale consistent with the discussion of multiple deliverable arrangements above. Revenue for Evidence.com is deferred at the time of the sale and recognized over the service period. At times the Company subsidizes the cost of Axon devices provided to customers to secure long-term Evidence.com service contracts. In such circumstances, revenue related to the Axon devices recognized at the time of delivery is limited to the amount collected from the customer that is not contingent upon the delivery of future Evidence.com services. The Company recognizes the remaining allocated revenue related to subsidized Axon devices over the remaining period it provides the contracted Evidence.com services.
Deferred revenue consists of payments received in advance related to products and services for which the criteria for revenue recognition have not yet been met. Deferred revenue that will be recognized during the succeeding twelve month period is recorded as current deferred revenue and the remaining portion is recorded as long-term. Deferred revenue does not include future revenue from multi-year contracts for which no invoice has yet been created. We generally bill customers in annual installments.
Sales are typically made on credit and we generally do not require collateral. We perform ongoing credit evaluations of our customers’ financial condition and maintain an allowance for estimated potential losses. Uncollectible accounts are written off when deemed uncollectible, and accounts and notes receivable are presented net of an allowance for doubtful accounts. This allowance represents our best estimate and is based on our judgment after considering a number of factors including third-party credit reports, actual payment history, customer-specific financial information and broader market and economic trends and conditions. In the event that actual uncollectible amounts differ from our estimates, additional expense could be necessary.
Valuation of Goodwill, Intangibles and Long-lived Assets
The recoverability of the goodwill is evaluated and tested for impairment at least annually during the fourth quarter or more often, if and when circumstances indicate that goodwill may not be recoverable. Finite-lived intangible assets and other long-lived assets are amortized over their useful lives. We evaluate whether events and circumstances have occurred that indicate the remaining estimated useful life of long-lived assets and intangible assets may warrant revision or that the remaining balance of these assets, including intangible assets with indefinite lives, may not be recoverable.
Circumstances that might indicate long-lived assets might not be recoverable could include, but are not limited to, a change in the product mix, a change in the way products are created, produced or delivered, or a significant change in the way our products are branded and marketed. When performing a review for recoverability, we estimate the future undiscounted cash flows expected to result from the use of the assets and their eventual disposition. The amount of the impairment loss, if impairment exists, is calculated based on the excess of the carrying amounts of the assets over their estimated fair value computed using discounted cash flows.
37
Income Taxes
We recognize federal, state and foreign current tax liabilities or assets based on our estimate of taxes payable or refundable in the current fiscal year by tax jurisdiction. We also recognize federal, state and foreign deferred tax assets or liabilities, as appropriate, for our estimate of future tax effects attributable to temporary differences and carry forwards.
We recognize the tax benefit from an uncertain tax position only if it is more likely than not that the tax position will be sustained based on the technical merits of the position. The tax benefits recognized in the consolidated financial statements from such positions are measured based on the largest benefit that has a greater than fifty percent likelihood of being realized upon ultimate resolution. Management must also assess whether uncertain tax positions as filed could result in the recognition of a liability for possible interest and penalties if any. We have completed research and development tax credit studies which identified approximately $15.6 million in tax credits for federal, Arizona and California income tax purposes related to the 2003 through 2017 tax years. Management determined that it was more likely than not that the full benefit of the research and development tax credit would not be sustained on examination and accordingly, has established a liability for unrecognized tax benefits of $4.3 million as of March 31, 2017. In addition, we established a $0.1 million liability related to uncertain tax positions for certain state income tax liabilities, for a total unrecognized tax benefit at March 31, 2017 of $4.4 million. Approximately $1.6 million of the unrecognized tax benefit associated with research and development credits has been netted against the research and development credit deferred tax asset. Our estimates are based on the information available to us at the time we prepare the income tax provision. Our income tax returns are subject to audit by federal, state, and local governments, generally years after the returns are filed. These returns could be subject to material adjustments or differing interpretations of the tax laws.
Our calculation of current and deferred tax assets and liabilities is based on certain estimates and judgments and involves dealing with uncertainties in the application of complex tax laws. Our estimates of current and deferred tax assets and liabilities may change based, in part, on added certainty or finality to an anticipated outcome, changes in accounting or tax laws in the U.S. and overseas, or changes in other facts or circumstances. In addition, we recognize liabilities for potential U.S. tax contingencies based on our estimate of whether, and the extent to which, additional taxes may be due. If we determine that payment of these amounts is unnecessary, or if the recorded tax liability is less than our current assessment, we may be required to recognize an income tax benefit, or additional income tax expense, respectively, in our consolidated financial statements.
In preparing our consolidated financial statements, management assesses the likelihood that our deferred tax assets will be realized from future taxable income. In evaluating our ability to recover our deferred income tax assets, management considers all available positive and negative evidence, including operating results, ongoing tax planning and forecasts of future taxable income on a jurisdiction by jurisdiction basis. A valuation allowance is established if we determine that it is more likely than not that some portion or all of the net deferred tax assets will not be realized.
Although management believes that its tax estimates are reasonable, the ultimate tax determination involves significant judgments that could become subject to audit by tax authorities in the ordinary course of business. As of March 31, 2017, the Company would need to generate approximately $55.9 million of pre-tax book income in the U.S. in order to realize the net deferred tax assets for which a benefit has been recorded. This estimate considers the reversal of approximately $16.4 million of taxable temporary differences, which produce $6.1 million of deferred tax liabilities. The Company has $1.3 million of state net operating losses (“NOLs”) which expire at various dates between 2029 and 2034. The Company also has federal NOLs of $2.5 million which expire in 2035 through 2038, and are subject to limitation under IRC Section 382. The Company has $7.0 million of Arizona R&D credits carrying forward, which expire at various dates between 2018 and 2032. In Australia, the UK, Canada, and Germany, the Company has $1.5 million, $5.2 million, $0.7 million, and $1.1 million of NOLs, respectively, which expire at various dates or may be carried forward indefinitely.
We anticipate the Company’s future income to continue to trend upward from our 2017 results, with sufficient pre-tax book income to realize a large portion of our deferred tax assets. As such, we have not recorded a valuation allowance on our U.S. deferred tax assets as of March 31, 2017, with the exception of a reserve of approximately $4.4 million that has been recorded due to specific income projections in years in which certain tax assets are set to expire. As of March 31, 2017, the Company has cumulative losses in Australia, the UK, Canada, and Germany, which limits the ability to consider other subjective evidence, such as projections for future growth. On the basis of this evaluation, a full valuation allowance has been recorded for these jurisdictions. The amount of the deferred tax asset considered realizable, however, could be adjusted if objective negative evidence in the form of cumulative losses is no longer present and additional weight is given to subjective evidence such as projections for growth.
We consider the earnings of certain non-U.S. subsidiaries to be indefinitely reinvested outside of the United States on the basis of estimates that future domestic cash generation will be sufficient to meet future domestic cash needs and our specific plans for reinvestment of those subsidiary earnings. It is not practicable to estimate the amount of the deferred tax liability, if any, related to investments in those foreign subsidiaries. If we decide to repatriate the foreign earnings, we would need to adjust our income tax provision in the period we determined that the earnings will no longer be indefinitely invested outside the United States.
38
Stock-Based Compensation
We have historically granted stock-based compensation to key employees and non-employee directors as a means of attracting and retaining quality personnel. We have historically utilized restricted stock units and stock options; however, no stock options have been issued since 2011. The fair value of restricted stock units is estimated as the closing price of our common stock on the date of grant. We estimate the fair value of granted stock options by using the Black-Scholes-Merton option pricing model, which requires the input of highly subjective assumptions. These assumptions include estimating the length of time employees will retain their stock options before exercising them (expected term), the estimated volatility of our common stock price over the expected term and the number of options that will ultimately not vest (forfeitures). The expense for both restricted stock units and stock options is recorded over the life of the grant, and forfeitures are recognized when they occur.
We have granted a total of approximately 1.8 million performance-based awards (options and restricted stock units) of which approximately 0.5 million are outstanding as of March 31, 2017, the vesting of which is contingent upon the achievement of certain performance criteria including the successful development and market acceptance of future product introductions as well as our future sales targets and operating performance. These awards will vest and compensation expense will be recognized based on management’s best estimate of the probability of the performance criteria being satisfied using the most currently available projections of future product adoption and operating performance, adjusted at each balance sheet date. Changes in the subjective and probability-based assumptions can materially affect the estimate of fair value of stock-based compensation and consequently, the related amount recognized in our statements of operations.
Contingencies and Accrued Litigation Expense
We are subject to the possibility of various loss contingencies arising in the ordinary course of business, including product-related litigation. We consider the likelihood of loss or impairment of an asset or the incurrence of a liability, as well as our ability to reasonably estimate the amount of loss in determining loss contingencies. An estimated loss contingency is accrued when it is probable that an asset has been impaired or a liability has been incurred and the amount of loss can be reasonably estimated. We regularly evaluate current information available to us to determine whether such accruals should be adjusted and whether new accruals are required. Refer to Note 11 of our condensed consolidated financial statements for further discussion.
39
Item 3. Quantitative and Qualitative Disclosures About Market Risk
Interest Rate Risk
We typically invest in a limited number of financial instruments, consisting principally of investments in money market accounts, certificates of deposit and corporate and municipal bonds with a typical long-term debt rating of “AA” or better by any nationally recognized statistical rating organization, denominated in U.S. dollars. All of our cash equivalents and investments are treated as “held-to-maturity.” Investments in fixed-rate interest-earning instruments carry a degree of interest rate risk as their market value may be adversely impacted due to a rise in interest rates. As a result, we may suffer losses in principal if we sell securities that have declined in market value due to changes in interest rates. However, because we classify our debt securities as “held-to-maturity” based on our intent and ability to hold these instruments to maturity, no gains or losses are recognized due to changes in interest rates. These securities are reported at amortized cost. Based on investment positions as of March 31, 2017, a hypothetical 100 basis point increase across all maturities would result in a $0.1 million incremental decline in the fair market value of the portfolio. Such losses would only be realized if the Company sold the investments prior to maturity.
Additionally, we have access to a $10.0 million line of credit borrowing facility which bears interest at varying rates, currently at LIBOR plus 1.5% or Prime less 0.75%. Under the terms of the line of credit, available borrowings are reduced by outstanding letters of credit, which totaled $2.7 million at March 31, 2017. At March 31, 2017, there was no amount outstanding under the line of credit and the available borrowing under the line of credit was approximately $7.3 million. We have not borrowed any funds under the line of credit since its inception; however; should we need to do so in the future, such borrowings could be subject to adverse or favorable changes in the underlying interest rate.
Exchange Rate Risk
Our results of operations and cash flows are subject to fluctuations due to changes in foreign currency exchange rates, in each case compared to the U.S. Dollar, related to transactions by Axon Public Safety Germany, SE, formerly known as TASER Europe SE, Axon Public Safety UK LTD, Axon Public Safety AU, Axon Public Safety Canada and Axon Public Safety BV. To date, we have not engaged in any currency hedging activities, although we may do so in the future. Fluctuations in currency exchange rates could harm our business in the future.
The majority of our sales to international customers are transacted in U.S. dollars and therefore, are not subject to exchange rate fluctuations on these transactions. However, the cost of our products to our customers increases when the U.S. dollar strengthens against their local currency, and the Company may have more sales and expenses denominated in foreign currencies during the remainder of 2017 which would increase its foreign exchange rate risk.
Item 4. Controls and Procedures
Evaluation of Disclosure Controls and Procedures
Our Chief Executive Officer and Chief Financial Officer are responsible for the evaluation of the effectiveness of our disclosure controls and procedures (as defined in Rules 13a-15(e) and 15d-15(e) under the Exchange Act) as of the end of the period covered by this Quarterly Report on Form 10-Q. Our disclosure controls and procedures are designed to ensure that information we are required to disclose in reports that we file or submit under the Exchange Act is (i) recorded, processed, summarized and reported within the time periods specified in the Securities and Exchange Commission’s rules and forms and (ii) accumulated and communicated to our management, including our Chief Executive Officer and our Chief Financial Officer, as appropriate to allow timely decisions regarding required disclosure.
During the quarter ended March 31, 2017 and year ended December 31, 2016, we identified material weaknesses in our internal control over financial reporting. A material weakness is defined as a deficiency, or a combination of deficiencies, in internal control over financial reporting, such that there is a reasonable possibility that a material misstatement of our financial statements will not be prevented or detected on a timely basis.
Specifically, during the quarter ended March 31, 2017, we identified a material weakness over accounting for income taxes. During the year ended December 31, 2016, we identified material weaknesses in our internal controls over revenue recognition, cost of goods sold and services delivered and the reporting of deferred revenue. Further, we identified material weaknesses in our account reconciliations and monitoring processes. These material weaknesses in internal control over financial reporting resulted from a breakdown in the operation of identified preventative and detective controls which led to the Company not initially recording some transactions correctly.
These material weaknesses arose during a period where the timing of the Company’s financial close and reporting process had been adversely impacted by the continued growth in both the volume and complexity of our business transactions. To remediate
40
the material weaknesses described above, we are working to design and implement new controls and procedures to properly ensure transactions are identified and recorded timely and accurately.
Specifically:
• | we have added and will continue to add staff to support the growing operations of the Company. During the year ended December 31, 2016 and the quarter ended March 31, 2017, we have added additional resources to our revenue, tax and general accounting teams to ensure that we have the knowledge and resources to properly account for transactions in accordance with GAAP. |
• | we have implemented and are continuing to implement additional internal reporting procedures, including those designed to add depth to our detailed review processes of revenue transactions and related accounting for deferred revenue and cost of goods sold and services delivered; |
• | we have implemented and are continuing to implement additional system controls that would help prevent data entry errors of transactional information within the Company’s general ledger system, as well as adding and refining existing system reports that would help isolate outliers within the Company’s transactional data for further review; |
• | we have improved and are continuing to improve communication and coordination among our finance and accounting departments and we have expanded cross-functional involvement and input into period-end accruals; and |
• | we are in the process of documenting, assessing and testing our internal control over financial reporting as part of our efforts to comply with Section 404 of the Sarbanes-Oxley Act. |
The material weakness will not be considered remediated until the applicable remedial controls operate for a sufficient period of time and management has concluded, through testing, that these controls are operating effectively. We expect that the remediation of these deficiencies will be completed prior to the end of fiscal year 2017. As remediation has not yet been completed, our Chief Executive Officer and Chief Financial Officer have concluded that our disclosure controls and procedures were not effective as of March 31, 2017 at a level that provides reasonable assurance as of the last day of the period covered by this report.
Change in Internal Control over Financial Reporting
Except as noted above, there was no change in our internal control over financial reporting during the fiscal quarter ended March 31, 2017, that has materially affected, or is reasonably likely to materially affect, our internal control over financial reporting.
41
PART II - OTHER INFORMATION
Item 1. Legal Proceedings
The discussion of legal proceedings in Note 11 to the unaudited condensed consolidated financial statements included in PART I, ITEM 1 of this Form 10-Q is incorporated by reference herein.
Item 1A. Risk Factors
In addition to the other information set forth in this report, you should carefully consider the factors discussed in our Annual Report on Form 10-K for the year ended December 31, 2016, under the heading “Risk Factors,” which could materially affect our business, financial condition or future results. The risks described in our Annual Report on Form 10-K are not the only risks facing our Company. Additional risks and uncertainties not currently known to us or that we currently deem to be immaterial also may materially, adversely affect our business, financial condition and/or operating results. Except as discussed blow, there has been no material change in our risk factors as previously disclosed in our Annual Report on Form 10-K for the year ended December 31, 2016.
Unanticipated changes in our effective tax rate and additional tax liabilities may impact our operating results
Additionally, with the adoption of ASU 2016-09, the new guidance requires excess tax benefits and tax deficiencies to be recorded in the consolidated statements of operations when stock awards vest or are settled and as discrete items on the tax rate in the period in which they occur. As a result, for interim reporting purposes, the new standard requires us to exclude the excess tax benefits and tax deficiencies from the annual estimated tax rate and not to forecast the potential impact to the rate. This could cause us to experience an effective tax rate significantly different from previous periods or our current expectations, which could have an adverse effect on our business, financial condition and results of operations and cash flows.
Item 2. Unregistered Sales of Equity Securities and Use of Proceeds
None.
Item 3. Defaults Upon Senior Securities
None.
Item 4. Mine Safety Disclosures
None.
Item 5. Other Information
None.
42
Item 6. Exhibits
31.1* | Principal Executive Officer Certification pursuant to Rule 13a-14(a) or Rule 15d-14(a) | |
31.2* | Principal Financial Officer Certification pursuant to Rule 13a-14(a) or Rule 15d-14(a) | |
32** | Principal Executive Officer and Principal Financial Officer Certification pursuant to 18 U.S.C. Section 1350 as adopted pursuant to Section 906 of the Sarbanes-Oxley Act of 2002 | |
101.INS* | XBRL Instance Document | |
101.SCH* | XBRL Taxonomy Extension Schema Document | |
101.CAL* | XBRL Taxonomy Extension Calculation Linkbase Document | |
101.DEF* | XBRL Taxonomy Extension Definition Linkbase Document | |
101.LAB* | XBRL Taxonomy Extension Label Linkbase Document | |
101.PRE* | XBRL Taxonomy Extension Presentation Linkbase Document | |
* Filed herewith
** Furnished herewith
43
SIGNATURES
Pursuant to the requirements of the Securities Exchange Act of 1934, the registrant has duly caused this report to be signed on its behalf by the undersigned thereunto duly authorized.
AXON ENTERPRISE, INC. | ||||
Date: | May 10, 2017 | |||
By: | /s/ PATRICK W. SMITH | |||
Chief Executive Officer | ||||
(Principal Executive Officer) | ||||
Date: | May 10, 2017 | By: | /s/ JAWAD A. AHSAN | |
Chief Financial Officer | ||||
(Principal Financial and | ||||
Accounting Officer) | ||||
44