Attached files
| file | filename |
|---|---|
| 8-K - 8-K - PLUG POWER INC | a17-12722_18k.htm |
Exhibit 99.1
Plug Power is changing the way the world moves by developing industry-leading hydrogen fuel cell energy solutions for high growth markets around the globe. Plug Power 2017 First Quarter Update Letter Highlights for First Quarter 2017 and Subsequent Events Signed Amazon agreement for multi-site GenKey deployments and technology collaboration; representing approximately $70.0 million in 2017 revenue Shipped first commercial ProGen engines for integration into electric vehicle range extenders associated with FedEx program Introduced next-generation versions of two Class 2 GenDrive units that will further reduce costs and improve performance and reliability; Total GAAP revenues of $15.2 million; Completed $65.0 million in new contract bookings; GAAP earnings per share loss of $0.13 on a diluted basis; Deployed two PPA sites, in line with expectations; Confirmed full-year 2017 guidance, including GAAP revenue of $130.0 million, GAAP gross margins within the range of 8% - 12% and total cash used of $25 - $35 million; Our performance early in 2017 can be characterized as building strong foundational steps to both deliver on our 2017 goals and on our long term strategic vision. The first quarter results were flat with last year, but were in line with our expectations. As we discussed on the business update call in February, we anticipate a ramp up in activity in Q2, and the second half will be the majority of deployments and will represent approximately 65% of our expected revenues. More importantly, recent advancements such as the signing of significant new deals with customers such as Amazon and Carrefour, and continuing the development of new markets and of our core fuel cell and hydrogen product lines, sets the stage for us to achieve our growth and profitability projections for 2017 and beyond. As innovators, we have recognized the ongoing need to refine and evolve in order to capitalize on the tremendous opportunities that lie ahead. Our recently announced deal with Amazon is not only a strong validation of our business model, especially in an environment without pricing incentives, but is a catalyst in driving inbound interest from new customers and accelerating our sales cycle. This transaction is a major milestone in the execution of our original strategic plan – to penetrate the right first market, scale volume while driving down costs, and leverage this progress as we enter new markets. 1
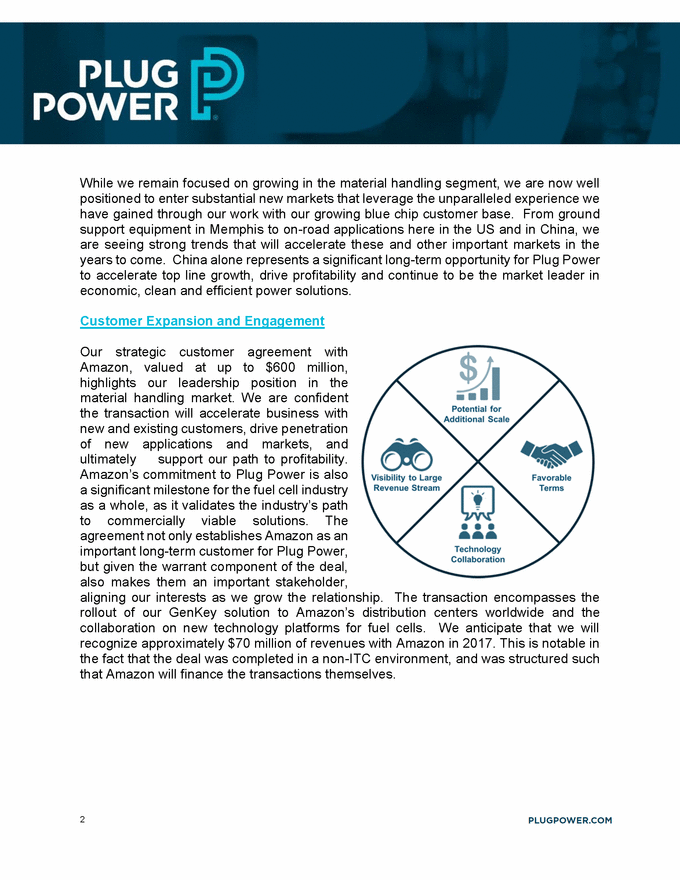
While we remain focused on growing in the material handling segment, we are now well positioned to enter substantial new markets that leverage the unparalleled experience we have gained through our work with our growing blue chip customer base. From ground support equipment in Memphis to on-road applications here in the US and in China, we are seeing strong trends that will accelerate these and other important markets in the years to come. China alone represents a significant long-term opportunity for Plug Power to accelerate top line growth, drive profitability and continue to be the market leader in economic, clean and efficient power solutions. Customer Expansion and Engagement Our strategic customeragreement with Amazon, valued at up to $600 million, highlights our leadership position in the material handling market. We are confident the transaction will accelerate business with new and existing customers, drive penetration of newapplicationsand markets,and ultimately support our path to profitability. Amazon’s commitment to Plug Power is also a significant milestone for the fuel cell industry as a whole, as it validates the industry’s path to commercially viable solutions. The agreement not only establishes Amazon as an important long-term customer for Plug Power, but given the warrant component of the deal, also makes them an important stakeholder, aligning our interests as we grow the relationship. The transaction encompasses the rollout of our GenKey solution to Amazon’s distribution centers worldwide and the collaboration on new technology platforms for fuel cells. We anticipate that we will recognize approximately $70 million of revenues with Amazon in 2017. This is notable in the fact that the deal was completed in a non-ITC environment, and was structured such that Amazon will finance the transactions themselves. 2
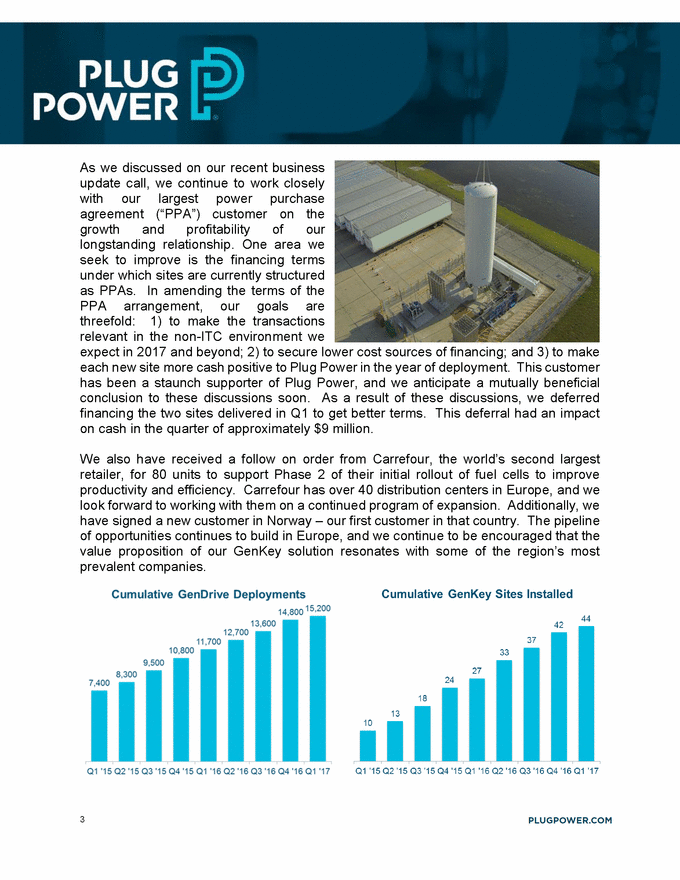
As we discussed on our recent business update call, we continue to work closely with ourlargestpower purchase agreement(“PPA”)customeronthe growth and profitability of our longstanding relationship. One area we seek to improve is the financing terms under which sites are currently structured as PPAs. In amending the terms of the PPA arrangement, ourgoals are threefold: 1) to make the transactions relevant in the non-ITC environment we expect in 2017 and beyond; 2) to secure lower cost sources of financing; and 3) to make each new site more cash positive to Plug Power in the year of deployment. This customer has been a staunch supporter of Plug Power, and we anticipate a mutually beneficial conclusion to these discussions soon. As a result of these discussions, we deferred financing the two sites delivered in Q1 to get better terms. This deferral had an impact on cash in the quarter of approximately $9 million. We also have received a follow on order from Carrefour, the world’s second largest retailer, for 80 units to support Phase 2 of their initial rollout of fuel cells to improve productivity and efficiency. Carrefour has over 40 distribution centers in Europe, and we look forward to working with them on a continued program of expansion. Additionally, we have signed a new customer in Norway – our first customer in that country. The pipeline of opportunities continues to build in Europe, and we continue to be encouraged that the value proposition of our GenKey solution resonates with some of the region’s most prevalent companies. 3
As we highlight in our full-year 2017 guidance section below, we anticipate 25 total sites installed this year, with deployments and revenue recognition more heavily weighed on the second half of the year. We currently anticipate four sites in Q2, 12 sites in Q3 and the balance in Q4, though timing of certain greenfield sites (these are sites where a new building is being constructed) could vary the timing of these numbers slightly. As we saw in Q4 of last year, our capacity for both our in-house assembly and our supply chain, is more than adequate to handle the expected volumes, and continues to be enhanced by product scale and advanced engineering. Virtually 100% of the anticipated GenDrive demand in 2017 will utilize Plug Power stacks, and we continue to refine the designs and vendors for our GenFuel infrastructure to improve our margins. Our operations team has set their focus on hitting margin targets for the year, with a firm grasp on what is necessary to scale production relative to order magnitude. Capitalizing on Important Long-Term Trends Plug Power has been at the forefront of providing solutions to businesses todrive improved efficiencies that reduce costs and meet ever-increasing customer expectations. As we think about our core markets in distribution and manufacturing – and then translate that into the full supply and delivery chain – we can clearly see that there are a set of undeniable and interconnected trends driving innovation in these markets while creating new markets we can exploit around the world: Electrification: Lower total cost of ownership, simplicity and flexibility of design, and reduced emissions drive the move towards electrification. Many applications leverage batteries, specifically lithium ion, as their energy storage technology, but this comes with inherent limitations that either slow or prevent the electrification of certain platforms and use cases. Fuel cells can provide all of the benefits of electrification with all of the benefits of traditional engines – long run times and range, fast refueling, and appropriate power and energy density. Asset Utilization: Higher utilization of critical and expensive assets has an important cost and business model effect for companies and individuals. Some assets like a forklift in a Walmart distribution center run all the time, and can be utilized significantly more during peak times of the year such as around the holidays. Other assets like our personal cars, run as little as 4% of the time. The ability to get more out of a forklift at a DC reduces overall costs, improves return 4
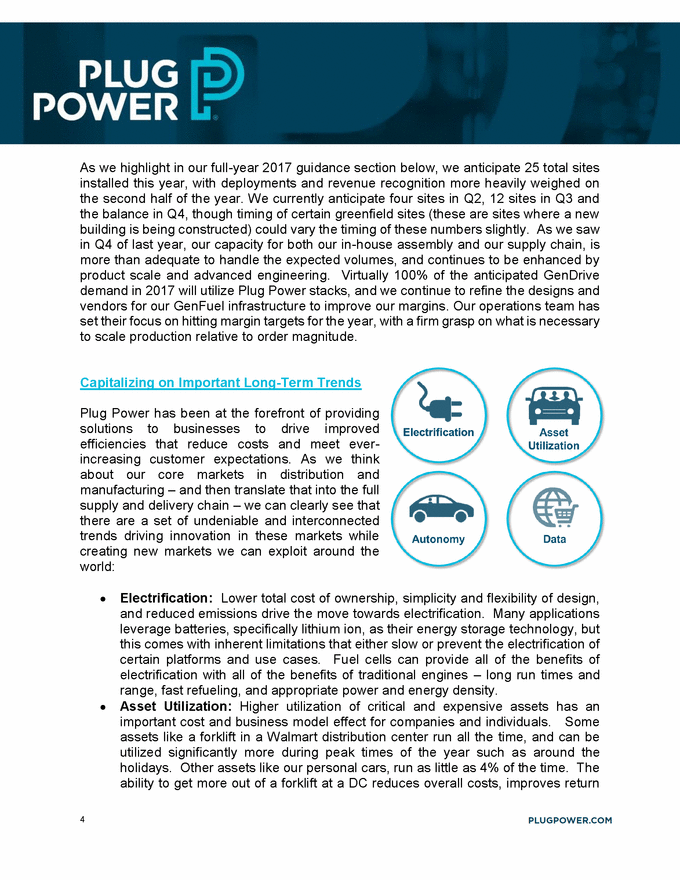
on assets and ultimately provides the customer with a better overall experience (cost, delivery, etc.). The ability to get more out of our car can completely change the business model for companies like GM and Ford, as new models like Uber and Lyft dramatically increase utilization and open the door for new approaches to transportation. Fuel cells play an enabling role by limiting downtime for refueling, providing longer run times, and allowing higher levels of auxiliary devices (safety, communication, sensors, etc.) and automation. Autonomy: Autonomous technology for cars has received a great deal of press recently. But, Plug Power has been powering autonomous vehicles for years at manufacturing facilities. For example, GenDrive powers automated guided vehicles today at customers like BMW, which creates benefits that can be realized throughout the value chain, which ultimately results in lower costs and faster delivery to the consumer. Electrification of fleet vehicles – be it delivery trucks or taxis – enables a faster path towards the vision of fully autonomous vehicles. A fuel cell’s reliability, range and ability to enable powerful sensors that measure performance as well as the surroundings can enable a deeper and more complete level of autonomy. Data: The ability to harness and effectively leverage all of the data that is created by our multiple engineering, manufacturing, and service system platforms creates substantial opportunities to drive value. For example, Plug Power utilizes its SiteView suite of Internet of Things (IoT) and analysis tools to collect and analyze data from deployed units and systems to find problems before they arise, improving ongoing system reliability, lowering maintenance costs, and providing more valuable operational transparency to our customers. But as we continue to employ ever-smarter intelligence to these robust information platforms, the results will be more rapid iteration of new designs along with the creation of new businesses and business models that will increase value to customers over time. Each of these forces is driven by the value individuals and businesses place on time, reliability, convenience, predictability, and cost savings. In some cases, it is expected by the consumer as part of their implicit contract with the service provider. In other cases, it is a valuable change from the current state of the art that customers are willing to pay for. 5
Addressing Sustainability Other trends, specifically those related to reduced emissions, are also driving fuel cell adoption. While we believe there always has to be a strong companies, increasing economic case, we are seeing andcountries,starttoplace value on metrics around environmental responsibility and sustainability. FedEx Express, our partner along with the DOE on fuel cell electric delivery vehicles, recognizes the importance of the trends discussed above not only to reduce costs, but also to find sustainable solutions to ensure their competitive position well into the future. In China, fuel cells have been identified as a critical component in the current five-year central government’s plan to address the short-term goal of reducing emissions in cities and large urban areas, and the long-term goal of finding practical and economically viable solutions that will run on renewable sources of energy. From concept to creation: Plug Power seeks to evaluate today’s market, while keeping an eye on the future. We have always been focused on maximizing the long-term value of Plug Power. Investing in the long term takes vision, capital, and meaningful patience to achieve sustainable success. Five years ago, we had a plan – to find a first market where fuel cells could drive significant value to the customer despite commanding a premium price. We found this market in material handling and we have since been rapidly increasing volumes, driving down costs, and gaining unparalleled commercial knowledge into the real-world operation of our systems. The strong reduction in cost combined with improvements in performance and reliability has led to steadily improving financial performance, expanding the size of the first addressable market, andopeningupadjacentandnewmarket opportunities. We are seeing this play out with 6
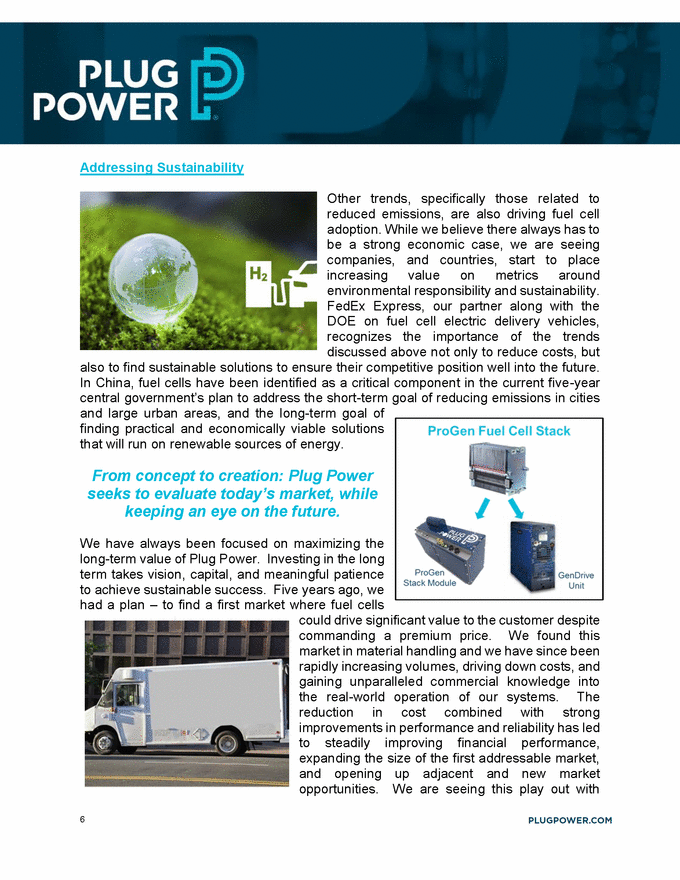
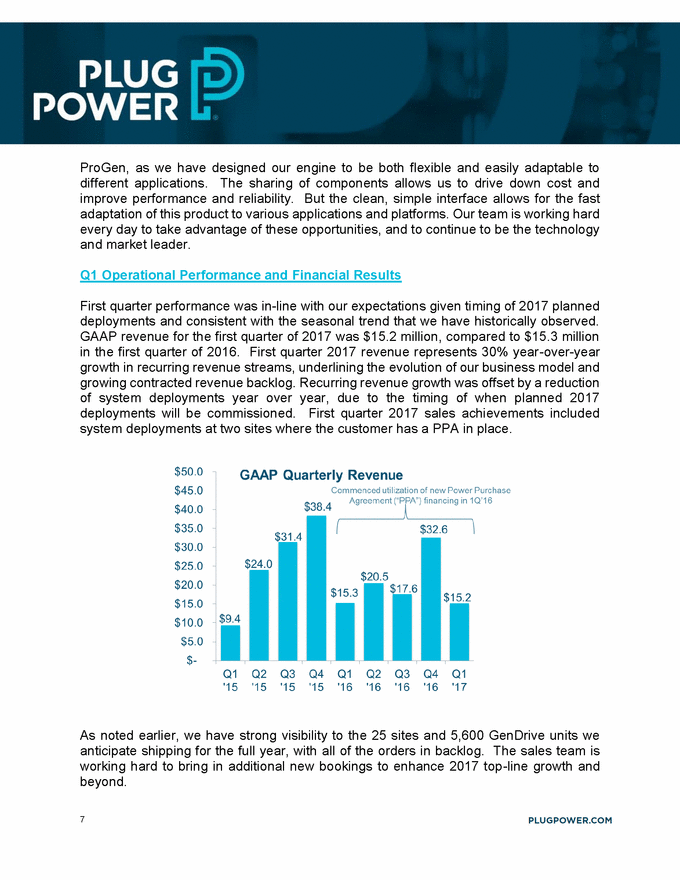
ProGen, as we have designed our engine to be both flexible and easily adaptable to different applications. The sharing of components allows us to drive down cost and improve performance and reliability. But the clean, simple interface allows for the fast adaptation of this product to various applications and platforms. Our team is working hard every day to take advantage of these opportunities, and to continue to be the technology and market leader. Q1 Operational Performance and Financial Results First quarter performance was in-line with our expectations given timing of 2017 planned deployments and consistent with the seasonal trend that we have historically observed. GAAP revenue for the first quarter of 2017 was $15.2 million, compared to $15.3 million in the first quarter of 2016. First quarter 2017 revenue represents 30% year-over-year growth in recurring revenue streams, underlining the evolution of our business model and growing contracted revenue backlog. Recurring revenue growth was offset by a reduction of system deployments year over year, due to the timing of when planned 2017 deployments will be commissioned.First quarter 2017 sales achievements system deployments at two sites where the customer has a PPA in place. included As noted earlier, we have strong visibility to the 25 sites and 5,600 GenDrive units we anticipate shipping for the full year, with all of the orders in backlog. The sales team is working hard to bring in additional new bookings to enhance 2017 top-line growth and beyond. 7
Key operating metrics: 439 total GenDrive units deployed for the three months ended March 31, 2017, versus 834 units for the three months ended March 31, 2016 Two PPA sites installed for the three months ended March 31, 2017, versus three PPA sites installed for the three months ended March 31, 2016 Approximately 12,000 GenDrive units under service or PPA contract at March 31, 2017, versus approximately 9,400 under service or PPA contract at March 31, 2016 42 sites under fuel delivery contract at March 31, 2017, versus 25 sites under contract at March 31, 2016 • • • • GAAP gross margin for the first quarter of 2017 was negative $4.5 million, or (29.4%) of sales, compared to a GAAP gross margin of $0.2 million, or 1.1% of sales, in the first quarter of 2016. The year-over-year decline in GAAP gross margins is primarily a result of a revenue mix less weighted on product sales and more heavily weighted towards recurring streams which currently have lower margin profiles given they are relatively newer offerings, but are scaling. Net loss attributable to common shareholders for the first quarter of 2017 was $24.1 million, or $0.13 loss per share on a diluted basis. This compares to a net loss attributable to common shareholders in the first quarter of 2016 of $11.8 million, or $0.07 loss per share on a diluted basis. Cash and Liquidity: Net cash used in operating activities for the first quarter of 2017 was $23.9 million, compared to a usage of $6.9 million in the first quarter of 2016. As of March 31, 2017, Plug Power had total cash of $65.7 million, including cash and cash equivalents of $11.8 million and restricted cash of $53.9 million. The use of cash in the first quarter is consistent with our full year expectations given timing of 2017 deployments and working capital requirements as well as the timing of financing for the first quarter PPA deployments. Based on our order activity and backlog, we began work in Q1 on many of the projects that will be delivered in Q2 and Q3. As a result, we utilized cash for working capital to begin building out these orders. In addition, we did not finance the two PPA sites, including approximately 400 GenDrive units, that were delivered in the first quarter, as we are working to improve financing terms for the monetization of these assets, which we anticipate will close in the near term. We have a number of initiatives in process to finance our working capital needs for future orders and we are confident our capital options will enable us to deliver on our growth and cost down initiatives. We anticipate significantly 8
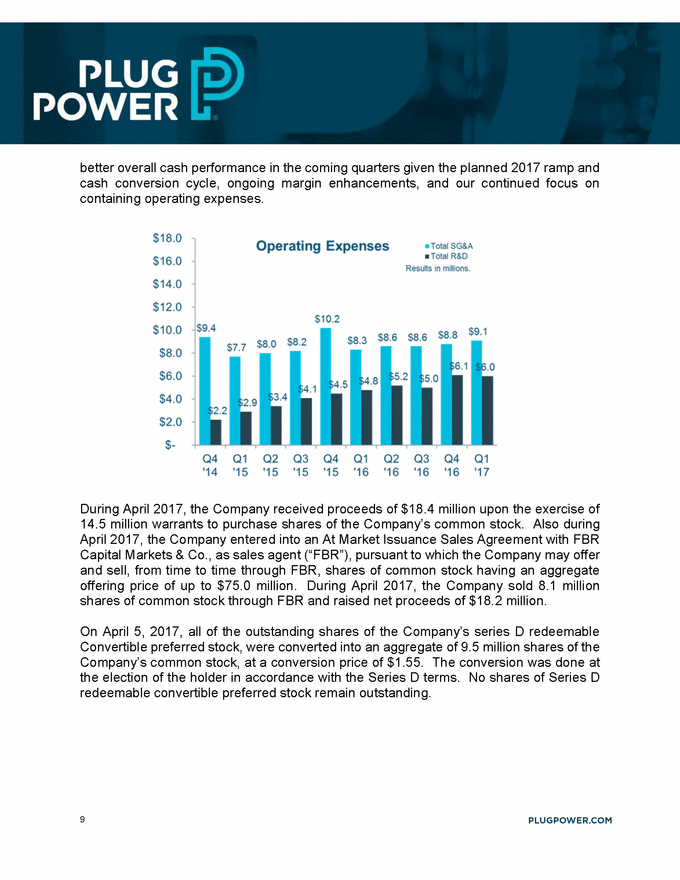
better overall cash performance in the coming quarters given the planned 2017 ramp and cash conversion cycle, ongoing containing operating expenses. margin enhancements, and our continued focus on During April 2017, the Company received proceeds of $18.4 million upon the exercise of 14.5 million warrants to purchase shares of the Company’s common stock. Also during April 2017, the Company entered into an At Market Issuance Sales Agreement with FBR Capital Markets & Co., as sales agent (“FBR”), pursuant to which the Company may offer and sell, from time to time through FBR, shares of common stock having an aggregate offering price of up to $75.0 million. During April 2017, the Company sold 8.1 million shares of common stock through FBR and raised net proceeds of $18.2 million. On April 5, 2017, all of the outstanding shares of the Company’s series D redeemable Convertible preferred stock, were converted into an aggregate of 9.5 million shares of the Company’s common stock, at a conversion price of $1.55. The conversion was done at the election of the holder in accordance with the Series D terms. No shares of Series D redeemable convertible preferred stock remain outstanding. 9
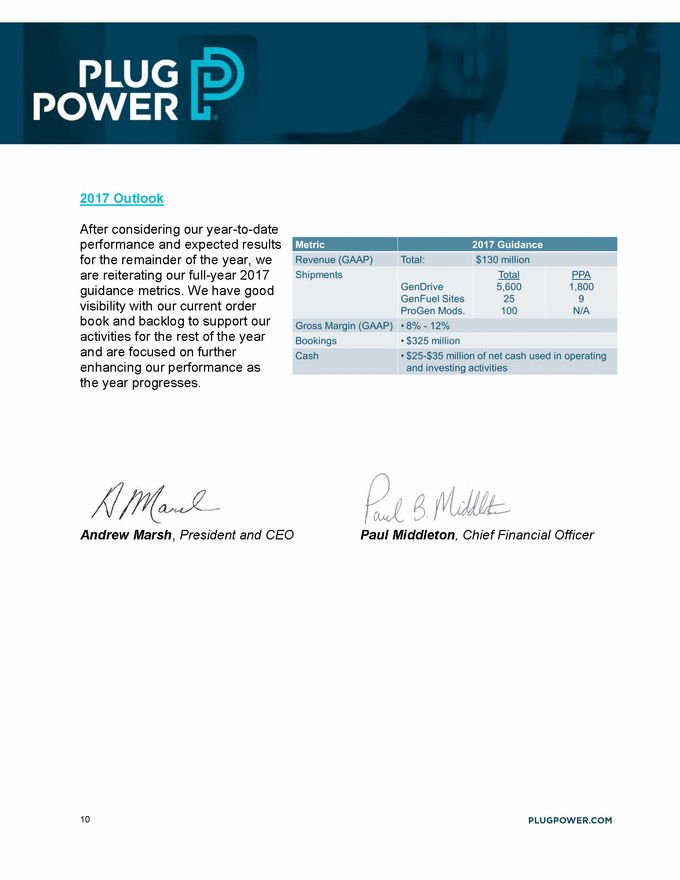
2017 Outlook After considering our year-to-date performance and expected results for the remainder of the year, we are reiterating our full-year 2017 guidance metrics. We have good visibility with our current order book and backlog to support our activities for the rest of the year and are focused on further enhancing our performance as the year progresses. Andrew Marsh, President and CEO Paul Middleton, Chief Financial Officer 10
Conference Call Information The Company will host a live conference call and webcast: Date: May 9, 2017 Time: 10:00 am ET Toll-free: 877-407-5795 Webcast: https://event.webcasts.com/starthere.jsp?ei=1145550 The webcast can be accessed at www.plugpower.com, selecting the conference call link on the home page, or directly at https://event.webcasts.com/starthere.jsp?ei=1145550. A playback of the call will be available online for a period following the event. About Plug Power Inc. The architect of modern hydrogen and fuel cell technology, Plug Power is the innovator that has taken hydrogen and fuel cell technology from concept to commercialization. Plug Power has revolutionized the material handling industry with its full-service GenKey solution, which is designed to increase productivity, lower operating costs and reduce carbon footprints in a reliable, cost-effective way. The Company’s GenKey solution couples together all the necessary elements to power, fuel and serve a customer. With proven hydrogen and fuel cell products, Plug Power replaces lead acid batteries to power electric industrial vehicles, such as the lift trucks customers use in their distribution centers. Extending its reach into the on-road electric vehicle market, Plug Power’s ProGen platform of modular fuel cell engines empowers OEMs and system integrators to rapidly adopt hydrogen fuel cell technology. ProGen engines are proven today, with thousands in service, supporting some of the most rugged operations in the world. Plug Power is the partner that customers trust to take their businesses into the future. www.plugpower.com. Cautionary Note on Forward Looking Statements This communication contains “forward-looking statements” within the meaning of the Private Securities Litigation Reform Act of 1995 that involve significant risks and uncertainties about the Company, including but not limited to statements about the Company’s expectations regarding full year 2017 revenue, shipments, gross margin, bookings and cash usage, improvements in product performance and reliability, reduction in product costs, the impact of the Amazon relationship and the 2017 revenue to be derived from that relationship, the potential joint venture for the Chinese market, the potential changes to the Company’s relationship with its largest PPA customer, , expansion of applications for ProGen and achieving profitability. Investors are cautioned that such statements should not be read as a guarantee of future performance or results, and will not necessarily be accurate indications of the times that, or by which, such performance or results will have been achieved. Such statements are subject to risks and uncertainties that could cause actual performance or results to differ materially from those expressed in these statements. In particular, the risks and uncertainties include, among other things, the risk that the Company will not obtain the Stockholder Approval that may be required with respect to the equity arrangements expressed in the agreements with Amazon; the risk that the anticipated benefits of the agreements with Amazon will not be realized when expected, or at all; the possibility that Amazon may terminate its agreements with the Company; the effect of the announcement or pendency of the transactions contemplated by the agreements with Amazon; the risk that the Company continues to incur losses and might never achieve or maintain profitability; the risk that the Company will need to raise additional capital to fund its operations and such capital may not be available; the risk that the Company’s lack of extensive experience in manufacturing and marketing products may impact its ability to manufacture and market products on a profitable and large-scale commercial basis; the risk that unit orders will not 11
ship, be installed and/or be converted to revenue, in whole or in part; the risk that a loss of one or more of the Company’s major customers could result in a material adverse effect on the Company’s financial condition; the risk that a sale of a significant number of shares of stock could depress the market price of the Company’s common stock; the risk of potential losses related to any product liability claims or contract disputes; the risk of loss related to an inability to maintain an effective system of internal controls; the Company’s ability to attract and maintain key personnel; the risks related to the use of flammable fuels in the Company’s products; the risk that pending orders may not convert to purchase orders, in whole or in part; the cost and timing of developing, marketing and selling the Company’s products and the Company’s ability to raise the necessary capital to fund such costs; the Company’s ability to obtain financing arrangements to support the sale or leasing of its products and services to customers; the Company’s ability to achieve the forecasted gross margin on the sale of its products; the cost and availability of fuel and fueling infrastructures for the Company’s products; the risk of elimination of government subsidies and economic incentives for alternative energy products; market acceptance of the Company’s products and services, including GenDrive units; the Company’s ability to establish and maintain relationships with third parties with respect to product development, manufacturing, distribution and servicing and the supply of key product components; the cost and availability of components and parts for the Company’s products; the Company’s ability to develop commercially viable products; the Company’s ability to reduce product and manufacturing costs; the Company’s ability to successfully market, distribute and service its products and services internationally; the Company’s ability to improve system reliability for its products; competitive factors, such as price competition and competition from other traditional and alternative energy companies; the Company’s ability to protect its intellectual property; the cost of complying with current and future federal, state and international governmental regulations; the risks associated with potential future acquisitions; the volatility of the Company’s stock price; and other risks and uncertainties referenced in the Company’s public filings with the SEC. For additional disclosure regarding these and other risks faced by the Company, see disclosures contained in the Company’s public filings with the SEC, including the “Risk Factors” section of the Company’s Annual Report on Form 10-K for the year ended December 31, 2016. Investors should consider these factors in evaluating the forward-looking statements included in this communication and not place undue reliance on such statements. The forward-looking statements are made as of the date hereof, and the Company undertakes no obligation to update such statements as a result of new information. Plug Power Investor Contact John Cococcia investors@plugpower.com Plug Power Media Contact Teal Vivacqua media@plugpower.com 12
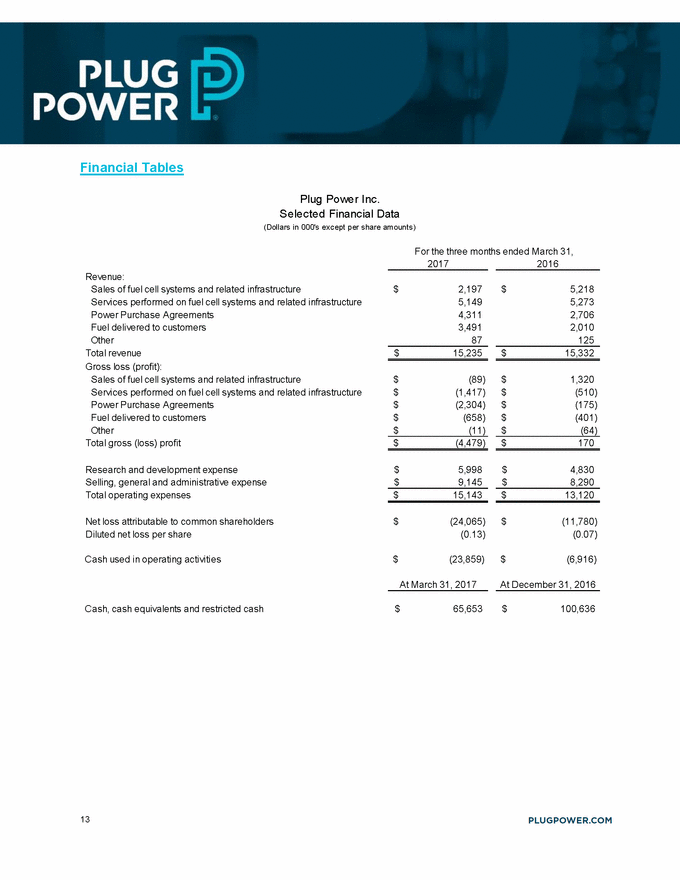
Financial Tables Plug Power Inc. Selected Financial Data (Dollars in 000's except per share amounts) For the three months ended March 31, 2017 2016 Revenue: Sales of fuel cell systems and related infrastructure Services performed on fuel cell systems and related infrastructure Power Purchase Agreements Fuel delivered to customers Other Total revenue Gross loss (profit): Sales of fuel cell systems and related infrastructure Services performed on fuel cell systems and related infrastructure Power Purchase Agreements Fuel delivered to customers Other Total gross (loss) profit $ 2,197 5,149 4,311 3,491 $ 5,218 5,273 2,706 2,010 125 87 $ 15,235 $ 15,332 $ $ $ $ (89) (1,417) (2,304) (658) $ $ $ $ $ 1,320 (510) (175) (401) (64) $ (11) $ (4,479) $ 170 Research and development expense Selling, general and administrative expense Total operating expenses $ 5,998 $ $ 4,830 8,290 $ 9,145 $ 15,143 $ 13,120 Net loss attributable to common shareholders Diluted net loss per share $ (24,065) (0.13) $ (11,780) (0.07) Cash used in operating activities $ (23,859) $ (6,916) At March 31, 2017 At December 31, 2016 Cash, cash equivalents and restricted cash $ 65,653 $ 100,636 13
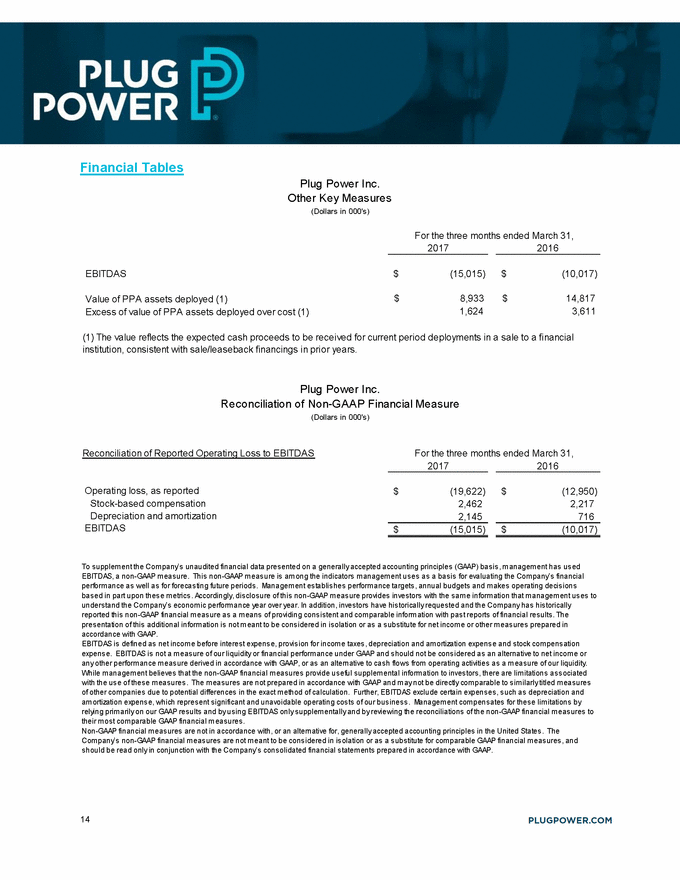
Financial Tables Plug Power Inc. Other Key Measures (Dollars in 000's) For the three months ended March 31, 2017 2016 EBITDAS $ (15,015) $ (10,017) Value of PPA assets deployed (1) Excess of value of PPA assets deployed over cost (1) $ 8,933 1,624 $ 14,817 3,611 (1) The value reflects the expected cash proceeds to be received for current period deployments in a sale to a financial institution, consistent with sale/leaseback financings in prior years. Plug Power Inc. Reconciliation of Non-GAAP Financial Measure (Dollars in 000's) Reconciliation of Reported Operating Loss to EBITDAS For the three months ended March 31, 2017 2016 Operating loss, as reported Stock-based compensation Depreciation and amortization EBITDAS $ (19,622) 2,462 2,145 $ (12,950) 2,217 716 $ (15,015) $ (10,017) To s upplem ent the Com pany’s unaudited financial data pres ented on a generally accepted accounting principles (GAAP) bas is , m anagem ent has us ed EBITDAS, a non-GAAP m eas ure. This non-GAAP m eas ure is am ong the indicators m anagem ent us es as a bas is for evaluating the Com pany’s financial perform ance as well as for forecas ting future periods . Managem ent es tablis hes perform ance targets , annual budgets and m akes operating decis ions bas ed in part upon thes e m etrics . Accordingly, dis clos ure of this non-GAAP m eas ure provides inves tors with the s am e inform ation that m anagem ent us es to unders tand the Com pany’s econom ic perform ance year over year. In addition, inves tors have his torically reques ted and the Com pany has his torically reported this non-GAAP financial m eas ure as a m eans of providing cons is tent and com parable inform ation with pas t reports of financial res ults . The pres entation of this additional inform ation is not m eant to be cons idered in is olation or as a s ubs titute for net incom e or other m eas ures prepared in accordance with GAAP. EBITDAS is defined as net incom e before interes t expens e, provis ion for incom e taxes , depreciation and am ortization expens e and s tock com pens ation expens e. EBITDAS is not a m eas ure of our liquidity or financial perform ance under GAAP and s hould not be cons idered as an alternative to net incom e or any other perform ance m eas ure derived in accordance with GAAP, or as an alternative to cas h flows from operating activities as a m eas ure of our liquidity. While m anagem ent believes that the non-GAAP financial m eas ures provide us eful s upplem ental inform ation to inves tors , there are lim itations as s ociated with the us e of thes e m eas ures . The m eas ures are not prepared in accordance with GAAP and m ay not be directly com parable to s im ilarly titled m eas ures of other com panies due to potential differences in the exact m ethod of calculation. Further, EBITDAS exclude certain expens es , s uch as depreciation and am ortization expens e, which repres ent s ignificant and unavoidable operating cos ts of our bus ines s . Managem ent com pens ates for thes e lim itations by relying prim arily on our GAAP res ults and by us ing EBITDAS only s upplem entally and by reviewing the reconciliations of the non-GAAP financial m eas ures to their m os t com parable GAAP financial m eas ures . Non-GAAP financial m eas ures are not in accordance with, or an alternative for, generally accepted accounting principles in the United States . The Com pany’s non-GAAP financial m eas ures are not m eant to be cons idered in is olation or as a s ubs titute for com parable GAAP financial m eas ures , and s hould be read only in conjunction with the Com pany’s cons olidated financial s tatem ents prepared in accordance with GAAP. 14