Attached files
| file | filename |
|---|---|
| 8-K - 8-K - PARK NATIONAL CORP /OH/ | prk2017-05x098xk.htm |
May 9-11, 2017
D.A. Davidson 19th Annual Financial
Services Conference & Summit
1
Safe Harbor Statement
2
Park cautions that any forward-looking statements contained in this presentation or made by management of Park are provided to assist in the understanding
of anticipated future financial performance. Forward-looking statements provide current expectations or forecasts of future events and are not guarantees of
future performance. The forward-looking statements are based on management’s expectations and are subject to a number of risks and uncertainties. Although
management believes that the expectations reflected in such forward-looking statements are reasonable, actual results may differ materially from those
expressed or implied in such statements. Risks and uncertainties that could cause actual results to differ materially include, without limitation: Park's ability to
execute our business plan successfully and within the expected timeframe; general economic and financial market conditions, specifically in the real estate
markets and the credit markets, either nationally or in the states in which Park and our subsidiaries do business, may experience a slowing or reversal of the
recent economic expansion in addition to continuing residual effects of recessionary conditions and an uneven spread of positive impacts of recovery on the
economy and our counterparties, including adverse impacts on the demand for loan, deposit and other financial services, delinquencies, defaults and
counterparties' ability to meet credit and other obligations; changes in interest rates and prices may adversely impact the value of securities, loans, deposits
and other financial instruments and the interest rate sensitivity of our consolidated balance sheet as well as reduce interest margins and impact loan demand;
changes in consumer spending, borrowing and saving habits, whether due to changing business and economic conditions, legislative and regulatory initiatives,
or other factors; changes in unemployment; changes in customers', suppliers', and other counterparties' performance and creditworthiness; asset/liability
repricing risks and liquidity risks; our liquidity requirements could be adversely affected by changes to regulations governing bank and bank holding company
capital and liquidity standards as well as by changes in our assets and liabilities; competitive factors among financial services organizations could increase
significantly, including product and pricing pressures, changes to third-party relationships and our ability to attract, develop and retain qualified bank
professionals; clients could pursue alternatives to bank deposits, causing us to lose a relatively inexpensive source of funding; uncertainty regarding the nature,
timing and effect of changes in banking regulations or other regulatory or legislative requirements affecting the respective businesses of Park and our
subsidiaries, including major reform of the regulatory oversight structure of the financial services industry and changes in laws and regulations concerning
taxes, pensions, bankruptcy, consumer protection, accounting, bank products and services, fiduciary standards, securities and other aspects of the financial
services industry, specifically the reforms provided for in the Dodd-Frank Wall Street Reform and Consumer Protection Act of 2010 (the “Dodd-Frank Act”) and
the Basel III regulatory capital reforms, as well as regulations already adopted and which may be adopted in the future by the relevant regulatory agencies,
including the Consumer Financial Protection Bureau, the OCC, the FDIC, and the Federal Reserve Board, to implement the Dodd-Frank Act's provisions, the
Budget Control Act of 2011, the American Taxpayer Relief Act of 2012, the JOBS Act, the FAST Act and the Basel III regulatory capital reforms; the effect of
changes in accounting policies and practices, as may be adopted by the Financial Accounting Standards Board, the SEC, the Public Company Accounting
Oversight Board and other regulatory agencies, and the accuracy of our assumptions and estimates used to prepare our financial statements; the effect of
trade, monetary, fiscal and other governmental policies of the U.S. federal government, including money supply and interest rate policies of the Federal
Reserve Board; disruption in the liquidity and other functioning of U.S. financial markets; the impact on financial markets and the economy of any changes in
the credit ratings of the U.S. Treasury obligations and other U.S. government-backed debt, as well as issues surrounding the levels of U.S., European and
Asian government debt and concerns regarding the creditworthiness of certain sovereign governments, supranationals and financial institutions in Europe and
Asia; the uncertainty surrounding the United Kingdom's exit from the European Union and its consequences; our litigation and regulatory compliance exposure,
including any adverse developments in legal proceedings or other claims and unfavorable resolution of regulatory and other governmental examinations or
other inquiries; the adequacy of our risk management program; the ability to secure confidential information and deliver products and services through the use
of computer systems and telecommunications networks; a failure in or breach of our operational or security systems or infrastructure, or those of our third-party
vendors and other service providers, including as a result of cyber attacks; fraud, scams and schemes of third parties; the impact of widespread natural and
other disasters, pandemics, dislocations, terrorist activities or international hostilities on the economy and financial markets generally or on us or our
counterparties specifically; demand for loans in the respective market areas served by Park and our subsidiaries; and other risk factors relating to the banking
industry as detailed from time to time in Park's reports filed with the SEC including those described in "Item 1A. Risk Factors" of Part I of Park's Annual Report
on Form 10-K for the fiscal year ended December 31, 2016. Park does not undertake, and specifically disclaims any obligation, to publicly release the results of
any revisions that may be made to update any forward-looking statement to reflect the events or circumstances after the date on which the forward-looking
statement was made, or reflect the occurrence of unanticipated events, except to the extent required by law.
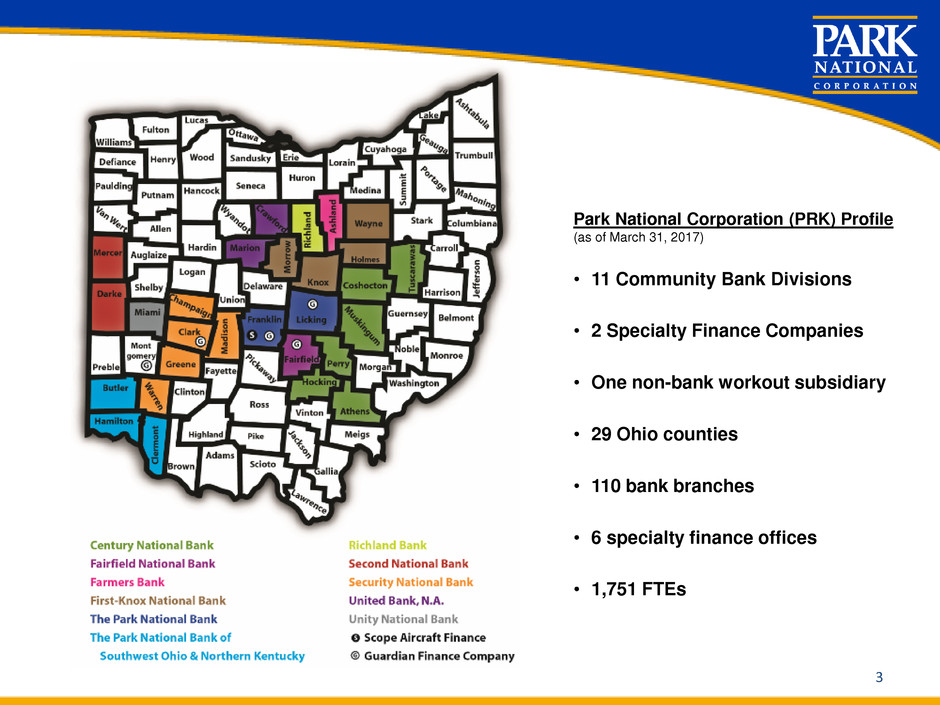
Park National Corporation (PRK) Profile
(as of March 31, 2017)
• 11 Community Bank Divisions
• 2 Specialty Finance Companies
• One non-bank workout subsidiary
• 29 Ohio counties
• 110 bank branches
• 6 specialty finance offices
• 1,751 FTEs
3
Park Executive Management
• David L. Trautman – President and CEO– Age: 56
President , CEO and Board Member of The Park National Bank and Park National Corporation (Park)
headquartered in Newark, Ohio. He served as President of First-Knox National Bank, a division of The Park
National Bank, from May 1997 through January 2002, and as its Chairman from 2001 to 2006. In addition, he
served on the Board of the United Bank of Bucyrus, a division of The Park National bank, from 2000 to 2006.
Mr. Trautman received his BA from Duke University and joined Park immediately following graduation. He holds
an MBA, with honors, from The Ohio State University. He is a graduate of The Stonier Graduate School of
Banking at The University of Delaware and the Ohio Bankers Association Leadership Institute.
Mr. Trautman is past Chairman of the Ohio Bankers League, member of Newark Rotary Club, past campaign
chair for United Way of Licking County, and serves as a Trustee of Dawes Arboretum.
• C. Daniel DeLawder – Chairman – Age: 67
Chairman and Board Member of The Park National Bank and Park National Corporation headquartered in
Newark, Ohio. He served previously as CEO of The Park National Bank and Park for 15 years. He served as
President of the Fairfield National Bank, a division of The Park National Bank, from 1985 through 1991. He also
currently serves on the Boards of MedBen, Truck One, Inc. and Fleet Service, Inc.
Mr. DeLawder received his B.S.Ed., cum laude from Ohio University in Athens and joined Park immediately
following graduation. He is a graduate of numerous bank industry educational programs.
Mr. DeLawder is a past member of the Board of Directors of the Federal Reserve Bank of Cleveland. He is the
past chairman of the Board of Trustees of Ohio University. He served as a member of the American Bankers
Association (ABA) BankPac Committee as well as a member of the Government Relations Council of the ABA.
He is past Chairman of the Ohio Bankers Association and a past Director-at-Large of the Community Bankers
Association of Ohio.
Leadership Team
4
Park Executive Management
(continued)
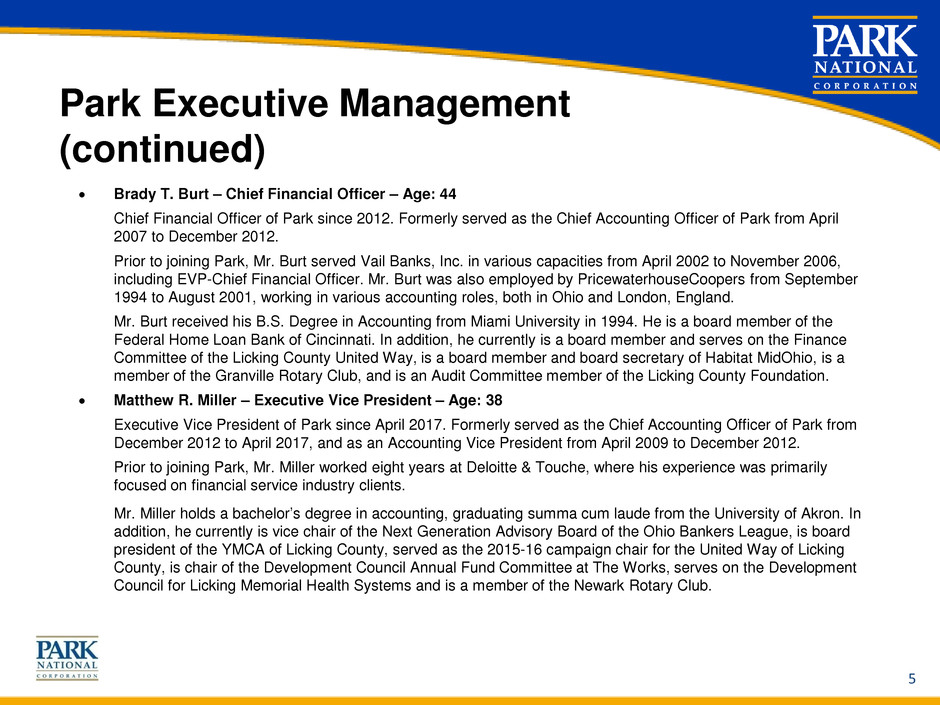
• Brady T. Burt – Chief Financial Officer – Age: 44
Chief Financial Officer of Park since 2012. Formerly served as the Chief Accounting Officer of Park from April
2007 to December 2012.
Prior to joining Park, Mr. Burt served Vail Banks, Inc. in various capacities from April 2002 to November 2006,
including EVP-Chief Financial Officer. Mr. Burt was also employed by PricewaterhouseCoopers from September
1994 to August 2001, working in various accounting roles, both in Ohio and London, England.
Mr. Burt received his B.S. Degree in Accounting from Miami University in 1994. He is a board member of the
Federal Home Loan Bank of Cincinnati. In addition, he currently is a board member and serves on the Finance
Committee of the Licking County United Way, is a board member and board secretary of Habitat MidOhio, is a
member of the Granville Rotary Club, and is an Audit Committee member of the Licking County Foundation.
• Matthew R. Miller – Executive Vice President – Age: 38
Executive Vice President of Park since April 2017. Formerly served as the Chief Accounting Officer of Park from
December 2012 to April 2017, and as an Accounting Vice President from April 2009 to December 2012.
Prior to joining Park, Mr. Miller worked eight years at Deloitte & Touche, where his experience was primarily
focused on financial service industry clients.
Mr. Miller holds a bachelor’s degree in accounting, graduating summa cum laude from the University of Akron. In
addition, he currently is vice chair of the Next Generation Advisory Board of the Ohio Bankers League, is board
president of the YMCA of Licking County, served as the 2015-16 campaign chair for the United Way of Licking
County, is chair of the Development Council Annual Fund Committee at The Works, serves on the Development
Council for Licking Memorial Health Systems and is a member of the Newark Rotary Club.
5
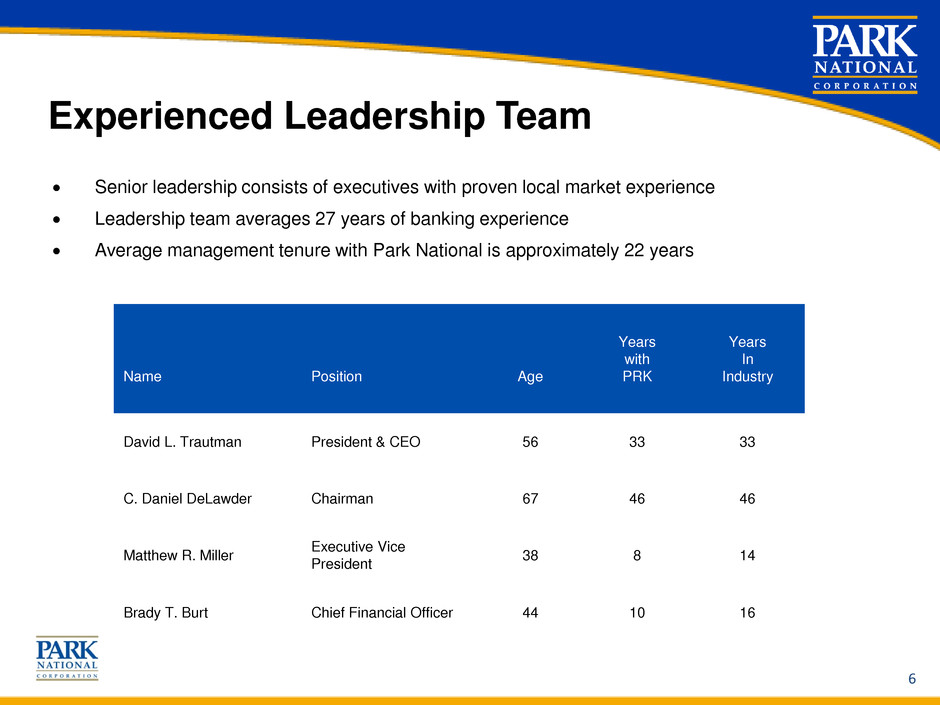
Experienced Leadership Team
Name Position Age
Years
with
PRK
Years
In
Industry
David L. Trautman President & CEO 56 33 33
C. Daniel DeLawder Chairman 67 46 46
Matthew R. Miller Executive Vice President 38 8 14
Brady T. Burt Chief Financial Officer 44 10 16
• Senior leadership consists of executives with proven local market experience
• Leadership team averages 27 years of banking experience
• Average management tenure with Park National is approximately 22 years
6
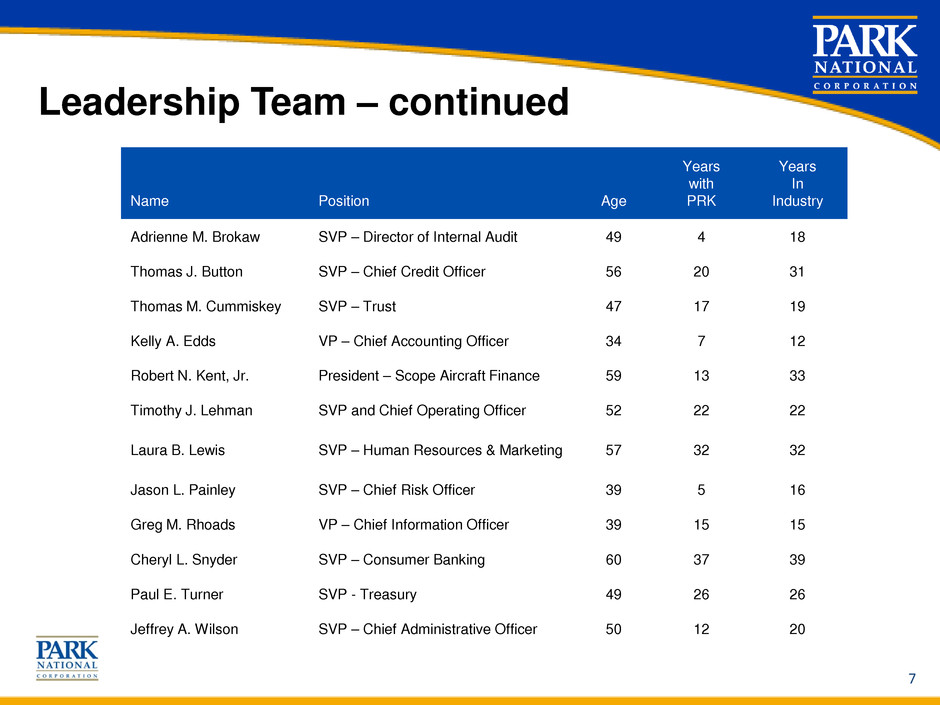
Leadership Team – continued
Name Position Age
Years
with
PRK
Years
In
Industry
Adrienne M. Brokaw SVP – Director of Internal Audit 49 4 18
Thomas J. Button SVP – Chief Credit Officer 56 20 31
Thomas M. Cummiskey SVP – Trust 47 17 19
Kelly A. Edds VP – Chief Accounting Officer 34 7 12
Robert N. Kent, Jr. President – Scope Aircraft Finance 59 13 33
Timothy J. Lehman SVP and Chief Operating Officer 52 22 22
Laura B. Lewis SVP – Human Resources & Marketing 57 32 32
Jason L. Painley SVP – Chief Risk Officer 39 5 16
Greg M. Rhoads VP – Chief Information Officer 39 15 15
Cheryl L. Snyder SVP – Consumer Banking 60 37 39
Paul E. Turner SVP - Treasury 49 26 26
Jeffrey A. Wilson SVP – Chief Administrative Officer 50 12 20
7
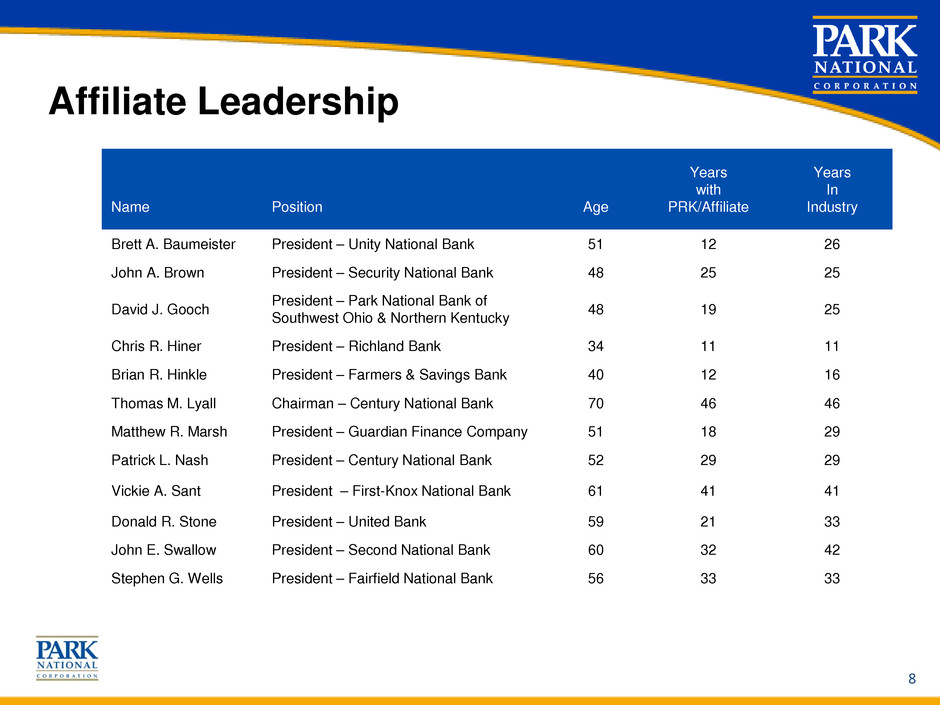
Affiliate Leadership
Name Position Age
Years
with
PRK/Affiliate
Years
In
Industry
Brett A. Baumeister President – Unity National Bank 51 12 26
John A. Brown President – Security National Bank 48 25 25
David J. Gooch President – Park National Bank of Southwest Ohio & Northern Kentucky 48 19 25
Chris R. Hiner President – Richland Bank 34 11 11
Brian R. Hinkle President – Farmers & Savings Bank 40 12 16
Thomas M. Lyall Chairman – Century National Bank 70 46 46
Matthew R. Marsh President – Guardian Finance Company 51 18 29
Patrick L. Nash President – Century National Bank 52 29 29
Vickie A. Sant President – First-Knox National Bank 61 41 41
Donald R. Stone President – United Bank 59 21 33
John E. Swallow President – Second National Bank 60 32 42
Stephen G. Wells President – Fairfield National Bank 56 33 33
8
Highlights of Q1 2017
• Loan growth of $41.8 million in Q1 2017 (3.24% annualized) at Park National
Corporation’s (PRK) Ohio subsidiary, The Park National Bank (PNB).
• Credit quality remains strong: PRK and PNB experienced net charge-offs of 12
basis points (bps) in Q1 2017. Delinquencies (30 days or more past due and
accruing) remain low at 35 bps and 29 bps for PRK and PNB, respectively.
• Deposit growth of $317.1 million (5.56%) from 3/31/16 to 3/31/17 at PNB. Growth
consisted of $126.4 million of interest bearing deposits (2.98%) and $190.8 million
of noninterest bearing deposits (13.03%).
• On April 24, 2017, Park prepaid in full $30 million of outstanding subordinated
notes due April 20, 2022. The notes paid interest at a rate of 7% per annum. April
21, 2017 was the earliest repayment date allowable under the terms of the notes.
9
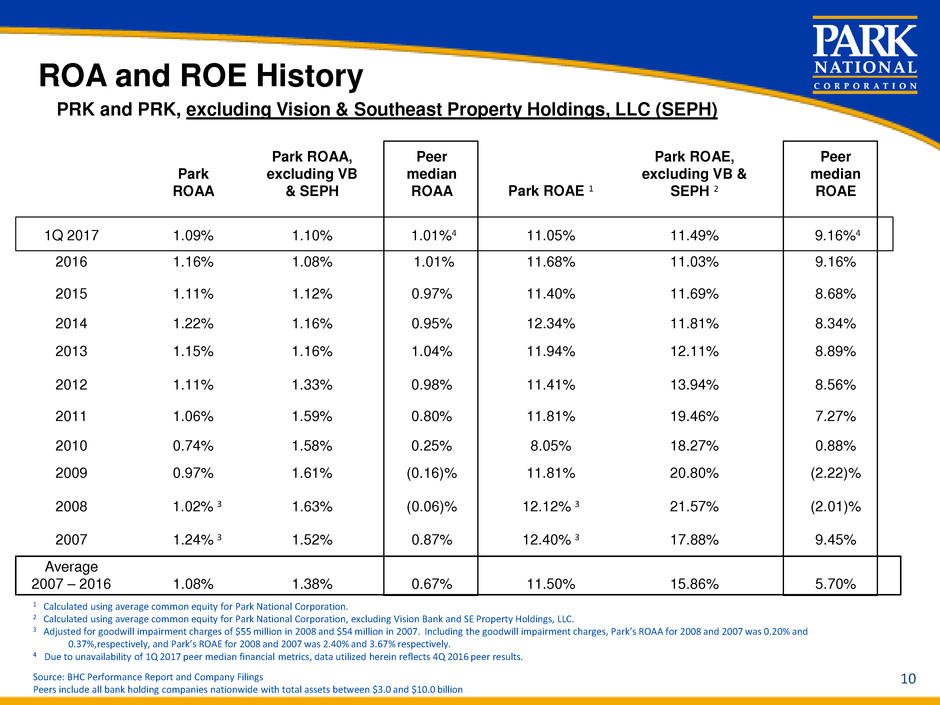
PRK and PRK, excluding Vision & Southeast Property Holdings, LLC (SEPH)
ROA and ROE History
1 Calculated using average common equity for Park National Corporation.
2 Calculated using average common equity for Park National Corporation, excluding Vision Bank and SE Property Holdings, LLC.
3 Adjusted for goodwill impairment charges of $55 million in 2008 and $54 million in 2007. Including the goodwill impairment charges, Park’s ROAA for 2008 and 2007 was 0.20% and
0.37%,respectively, and Park’s ROAE for 2008 and 2007 was 2.40% and 3.67% respectively.
4 Due to unavailability of 1Q 2017 peer median financial metrics, data utilized herein reflects 4Q 2016 peer results.
Source: BHC Performance Report and Company Filings
Peers include all bank holding companies nationwide with total assets between $3.0 and $10.0 billion
Park
ROAA
Park ROAA,
excluding VB
& SEPH
Peer
median
ROAA Park ROAE 1
Park ROAE,
excluding VB &
SEPH 2
Peer
median
ROAE
1Q 2017 1.09% 1.10% 1.01%4 11.05% 11.49% 9.16%4
2016 1.16% 1.08% 1.01% 11.68% 11.03% 9.16%
2015 1.11% 1.12% 0.97% 11.40% 11.69% 8.68%
2014 1.22% 1.16% 0.95% 12.34% 11.81% 8.34%
2013 1.15% 1.16% 1.04% 11.94% 12.11% 8.89%
2012 1.11% 1.33% 0.98% 11.41% 13.94% 8.56%
2011 1.06% 1.59% 0.80% 11.81% 19.46% 7.27%
2010 0.74% 1.58% 0.25% 8.05% 18.27% 0.88%
2009 0.97% 1.61% (0.16)% 11.81% 20.80% (2.22)%
2008 1.02% 3 1.63% (0.06)% 12.12% 3 21.57% (2.01)%
2007 1.24% 3 1.52% 0.87% 12.40% 3 17.88% 9.45%
Average
2007 – 2016 1.08% 1.38% 0.67% 11.50% 15.86% 5.70%
10
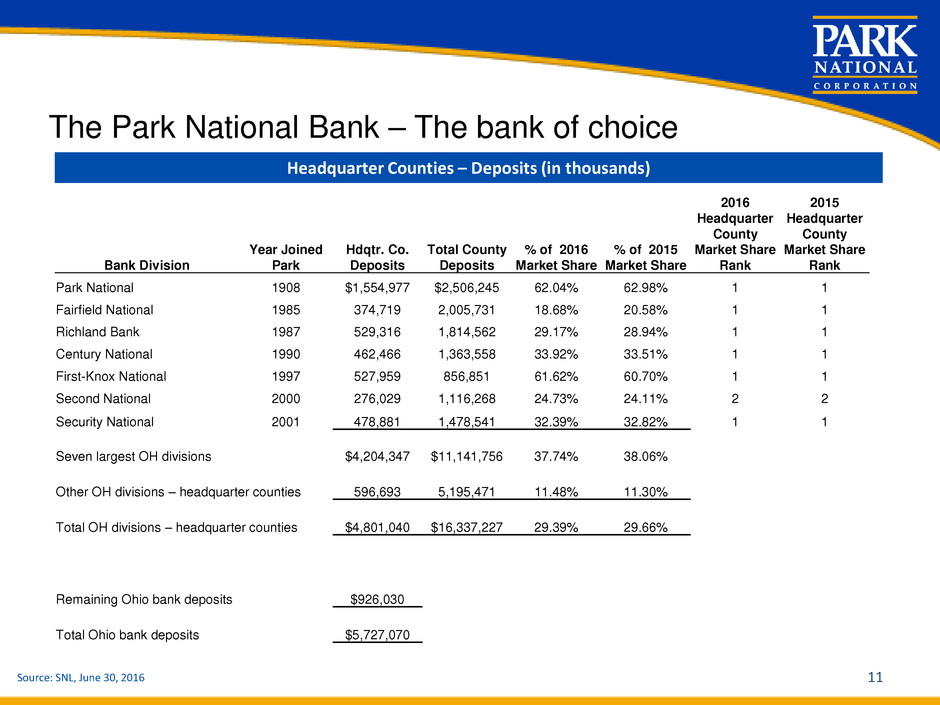
The Park National Bank – The bank of choice
Source: SNL, June 30, 2016
Headquarter Counties – Deposits (in thousands)
11
Bank Division
Year Joined
Park
Hdqtr. Co.
Deposits
Total County
Deposits
% of 2016
Market Share
% of 2015
Market Share
2016
Headquarter
County
Market Share
Rank
2015
Headquarter
County
Market Share
Rank
Park National 1908 $1,554,977 $2,506,245 62.04% 62.98% 1 1
Fairfield National 1985 374,719 2,005,731 18.68% 20.58% 1 1
Richland Bank 1987 529,316 1,814,562 29.17% 28.94% 1 1
Century National 1990 462,466 1,363,558 33.92% 33.51% 1 1
First-Knox National 1997 527,959 856,851 61.62% 60.70% 1 1
Second National 2000 276,029 1,116,268 24.73% 24.11% 2 2
Security National 2001 478,881 1,478,541 32.39% 32.82% 1 1
Seven largest OH divisions $4,204,347 $11,141,756 37.74% 38.06%
Other OH divisions – headquarter counties 596,693 5,195,471 11.48% 11.30%
Total OH divisions – headquarter counties $4,801,040 $16,337,227 29.39% 29.66%
Remaining Ohio bank deposits $926,030
Total Ohio bank deposits $5,727,070
Source: Company Filings 12
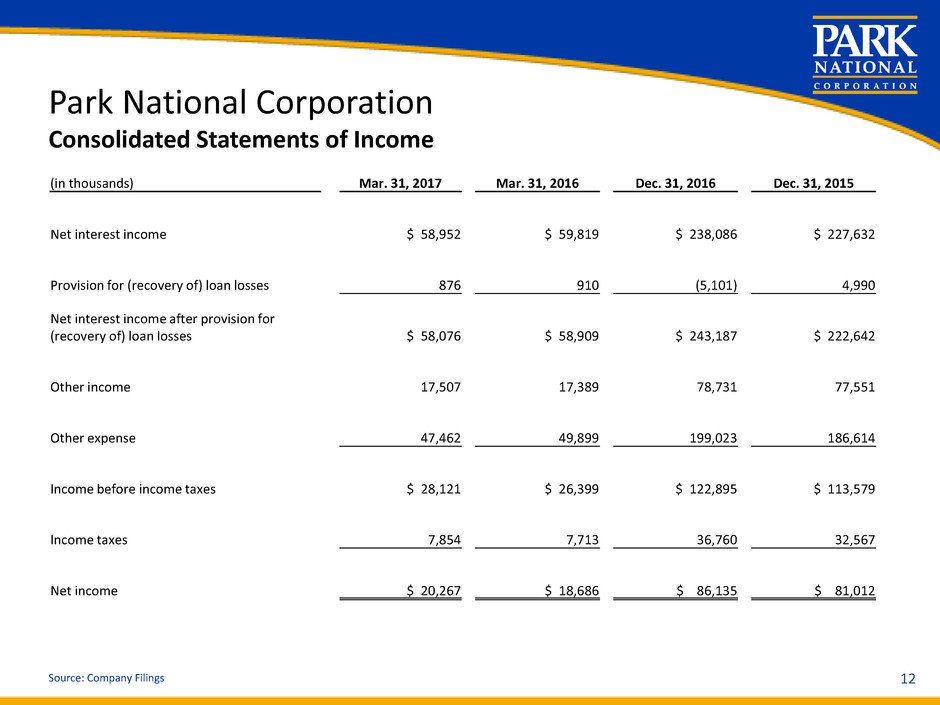
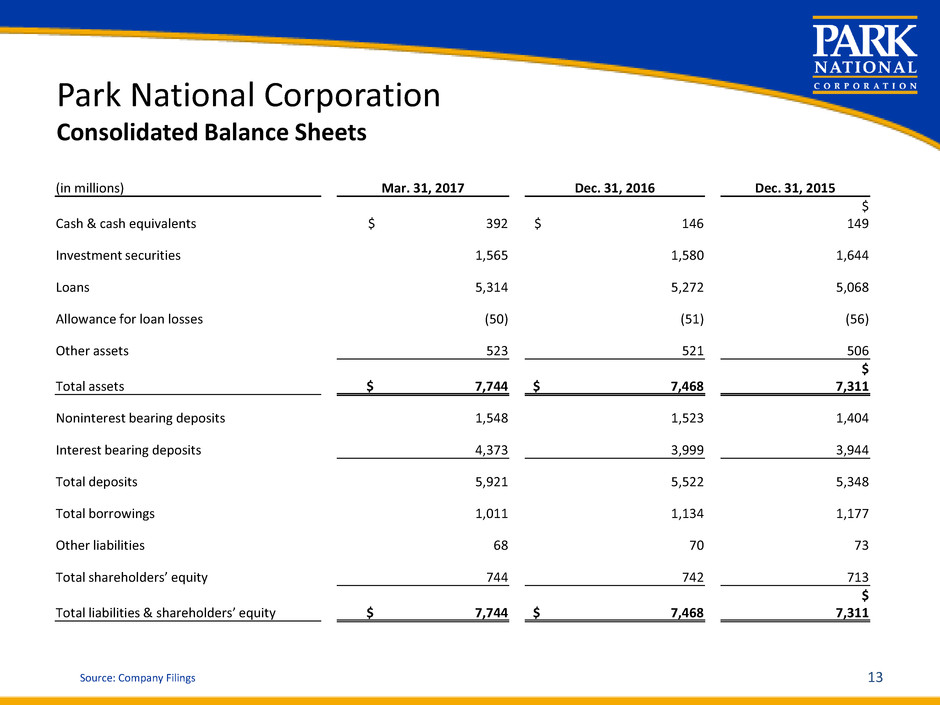
(in thousands) Mar. 31, 2017 Mar. 31, 2016 Dec. 31, 2016 Dec. 31, 2015
Net interest income $ 58,952 $ 59,819 $ 238,086 $ 227,632
Provision for (recovery of) loan losses 876 910 (5,101) 4,990
Net interest income after provision for
(recovery of) loan losses $ 58,076 $ 58,909 $ 243,187 $ 222,642
Other income 17,507 17,389 78,731 77,551
Other expense 47,462 49,899 199,023 186,614
Income before income taxes $ 28,121 $ 26,399 $ 122,895 $ 113,579
Income taxes 7,854 7,713 36,760 32,567
Net income $ 20,267 $ 18,686 $ 86,135 $ 81,012
Park National Corporation
Consolidated Statements of Income
Source: Company Filings 13
Park National Corporation
Consolidated Balance Sheets
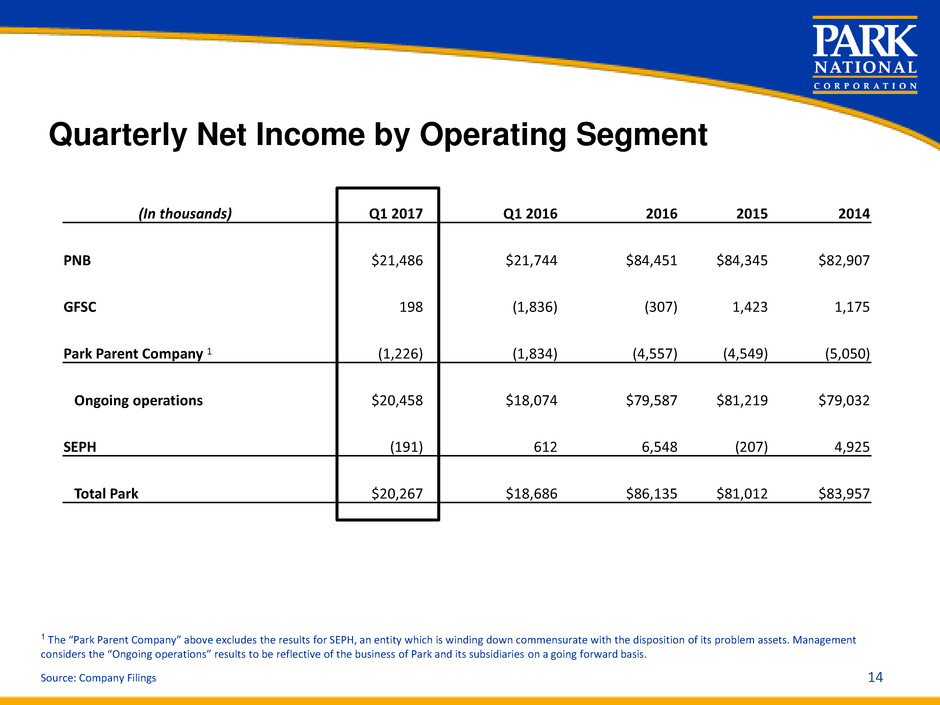
(in millions) Mar. 31, 2017 Dec. 31, 2016 Dec. 31, 2015
Cash & cash equivalents $ 392 $ 146
$
149
Investment securities 1,565 1,580 1,644
Loans 5,314 5,272 5,068
Allowance for loan losses (50) (51) (56)
Other assets 523 521 506
Total assets $ 7,744 $ 7,468
$
7,311
Noninterest bearing deposits 1,548 1,523 1,404
Interest bearing deposits 4,373 3,999 3,944
Total deposits 5,921 5,522 5,348
Total borrowings 1,011 1,134 1,177
Other liabilities 68 70 73
Total shareholders’ equity 744 742 713
Total liabilities & shareholders’ equity $ 7,744 $ 7,468
$
7,311
Quarterly Net Income by Operating Segment
Source: Company Filings
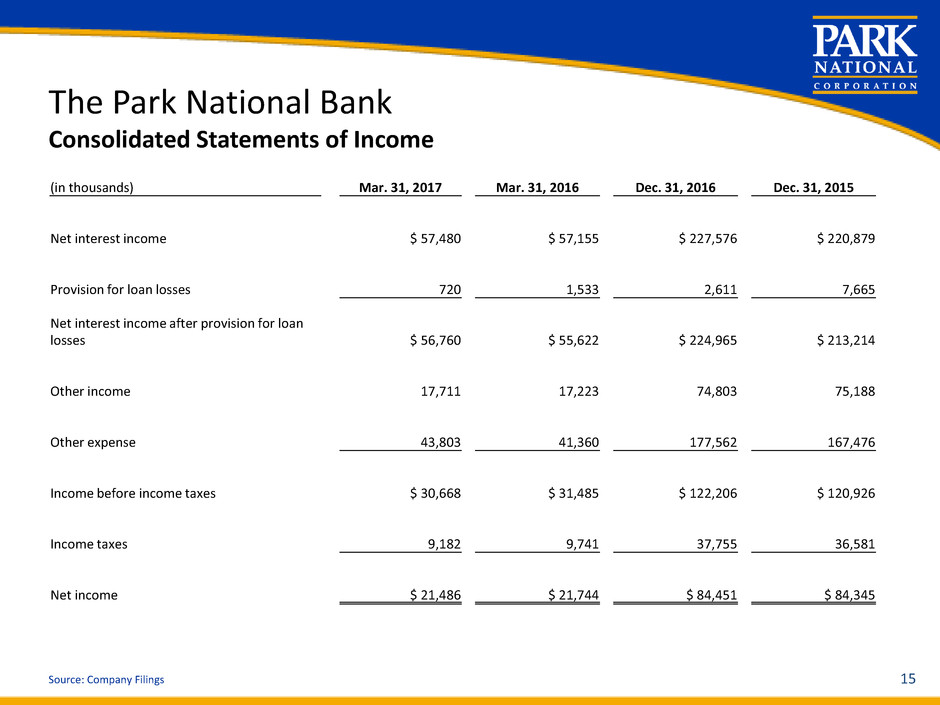
(In thousands) Q1 2017 Q1 2016 2016 2015 2014
PNB $21,486 $21,744 $84,451 $84,345 $82,907
GFSC 198 (1,836) (307) 1,423 1,175
Park Parent Company 1 (1,226) (1,834) (4,557) (4,549) (5,050)
Ongoing operations $20,458 $18,074 $79,587 $81,219 $79,032
SEPH (191) 612 6,548 (207) 4,925
Total Park $20,267 $18,686 $86,135 $81,012 $83,957
1 The “Park Parent Company” above excludes the results for SEPH, an entity which is winding down commensurate with the disposition of its problem assets. Management
considers the “Ongoing operations” results to be reflective of the business of Park and its subsidiaries on a going forward basis.
14
Source: Company Filings 15
The Park National Bank
Consolidated Statements of Income
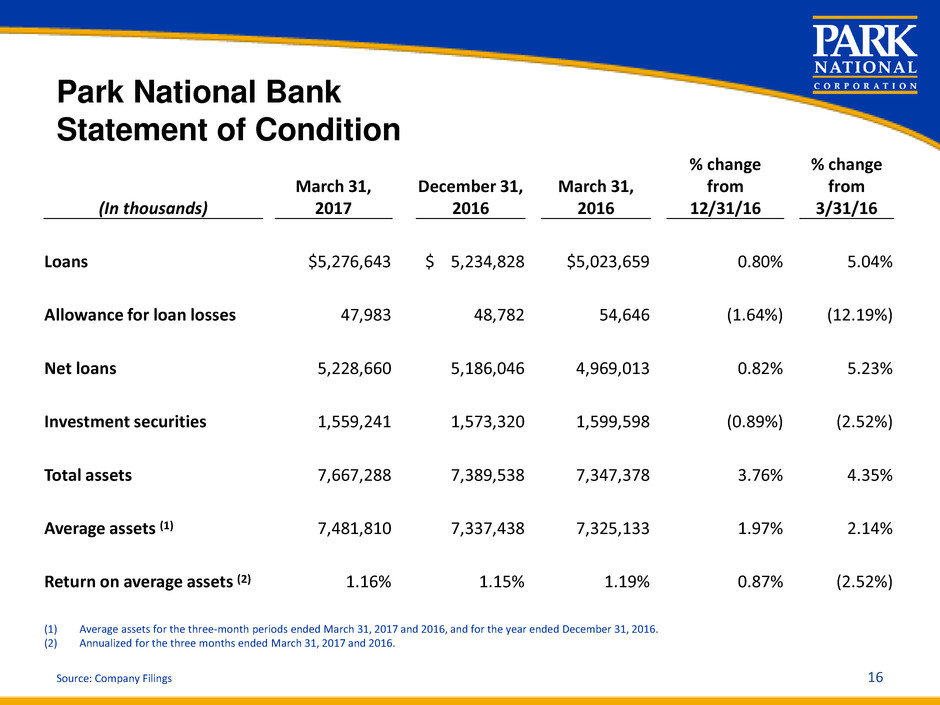
(in thousands) Mar. 31, 2017 Mar. 31, 2016 Dec. 31, 2016 Dec. 31, 2015
Net interest income $ 57,480 $ 57,155 $ 227,576 $ 220,879
Provision for loan losses 720 1,533 2,611 7,665
Net interest income after provision for loan
losses $ 56,760 $ 55,622 $ 224,965 $ 213,214
Other income 17,711 17,223 74,803 75,188
Other expense 43,803 41,360 177,562 167,476
Income before income taxes $ 30,668 $ 31,485 $ 122,206 $ 120,926
Income taxes 9,182 9,741 37,755 36,581
Net income $ 21,486 $ 21,744 $ 84,451 $ 84,345
Park National Bank
Statement of Condition
Source: Company Filings
(In thousands)
March 31,
2017
December 31,
2016
March 31,
2016
% change
from
12/31/16
% change
from
3/31/16
Loans $5,276,643 $ 5,234,828 $5,023,659 0.80% 5.04%
Allowance for loan losses 47,983 48,782 54,646 (1.64%) (12.19%)
Net loans 5,228,660 5,186,046 4,969,013 0.82% 5.23%
Investment securities 1,559,241 1,573,320 1,599,598 (0.89%) (2.52%)
Total assets 7,667,288 7,389,538 7,347,378 3.76% 4.35%
Average assets (1) 7,481,810 7,337,438 7,325,133 1.97% 2.14%
Return on average assets (2) 1.16% 1.15% 1.19% 0.87% (2.52%)
(1) Average assets for the three-month periods ended March 31, 2017 and 2016, and for the year ended December 31, 2016.
(2) Annualized for the three months ended March 31, 2017 and 2016.
16
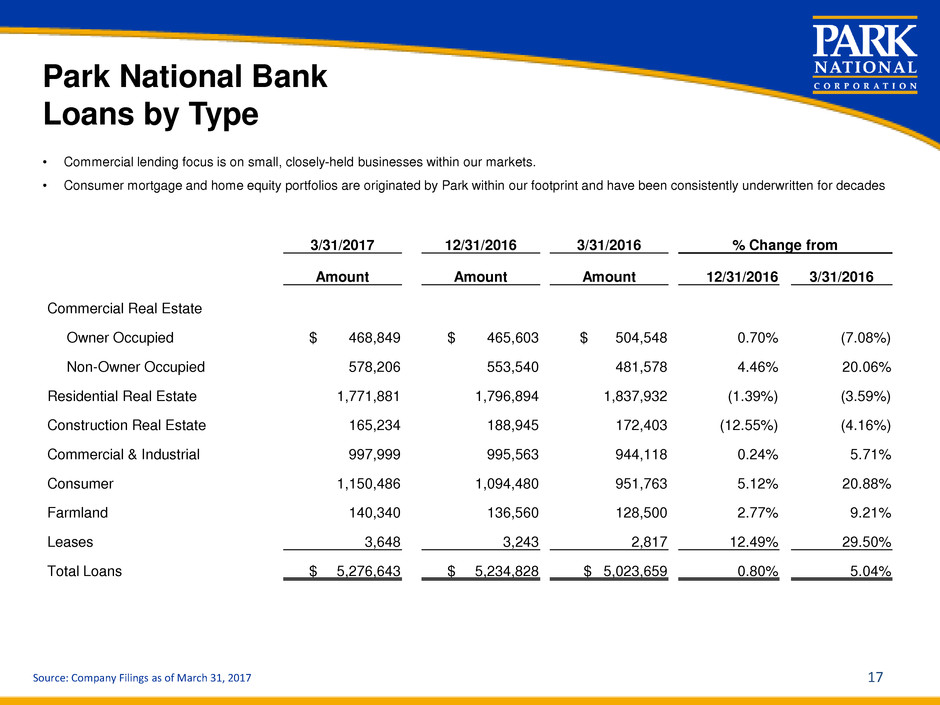
Park National Bank
Loans by Type
Source: Company Filings as of March 31, 2017
• Commercial lending focus is on small, closely-held businesses within our markets.
• Consumer mortgage and home equity portfolios are originated by Park within our footprint and have been consistently underwritten for decades
3/31/2017 12/31/2016 3/31/2016 % Change from
Amount Amount Amount 12/31/2016 3/31/2016
Commercial Real Estate
Owner Occupied $ 468,849 $ 465,603 $ 504,548 0.70% (7.08%)
Non-Owner Occupied 578,206 553,540 481,578 4.46% 20.06%
Residential Real Estate 1,771,881 1,796,894 1,837,932 (1.39%) (3.59%)
Construction Real Estate 165,234 188,945 172,403 (12.55%) (4.16%)
Commercial & Industrial 997,999 995,563 944,118 0.24% 5.71%
Consumer 1,150,486 1,094,480 951,763 5.12% 20.88%
Farmland 140,340 136,560 128,500 2.77% 9.21%
Leases 3,648 3,243 2,817 12.49% 29.50%
Total Loans $ 5,276,643 $ 5,234,828 $ 5,023,659 0.80% 5.04%
17
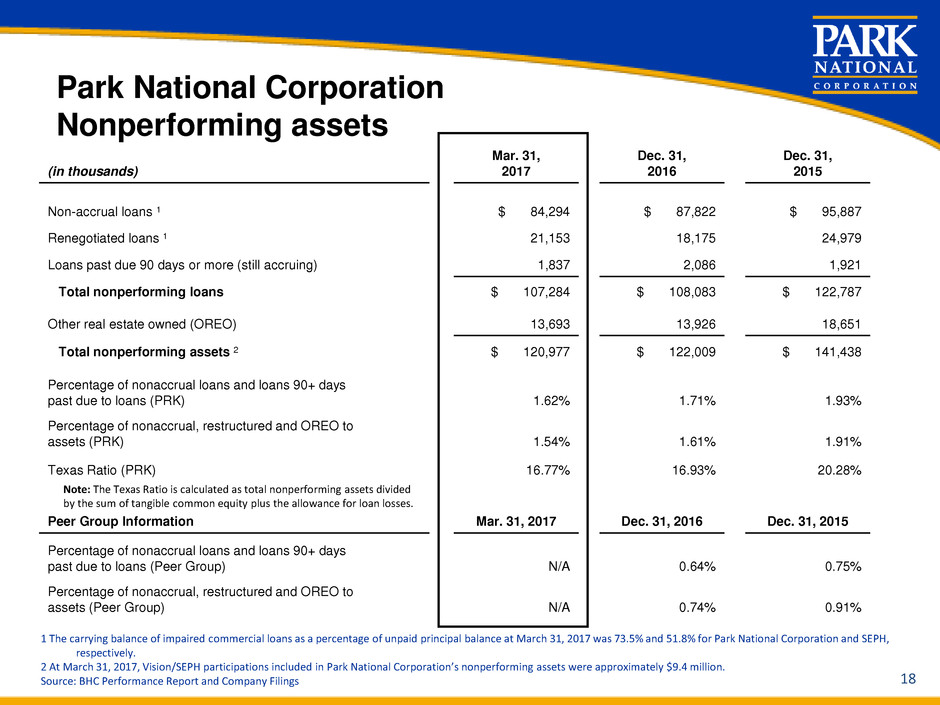
Park National Corporation
Nonperforming assets
1 The carrying balance of impaired commercial loans as a percentage of unpaid principal balance at March 31, 2017 was 73.5% and 51.8% for Park National Corporation and SEPH,
respectively.
2 At March 31, 2017, Vision/SEPH participations included in Park National Corporation’s nonperforming assets were approximately $9.4 million.
Source: BHC Performance Report and Company Filings
(in thousands)
Mar. 31,
2017
Dec. 31,
2016
Dec. 31,
2015
Non-accrual loans 1 $ 84,294 $ 87,822 $ 95,887
Renegotiated loans 1 21,153 18,175 24,979
Loans past due 90 days or more (still accruing) 1,837 2,086 1,921
Total nonperforming loans $ 107,284 $ 108,083 $ 122,787
Other real estate owned (OREO) 13,693 13,926 18,651
Total nonperforming assets 2 $ 120,977 $ 122,009 $ 141,438
Percentage of nonaccrual loans and loans 90+ days
past due to loans (PRK) 1.62% 1.71% 1.93%
Percentage of nonaccrual, restructured and OREO to
assets (PRK) 1.54% 1.61% 1.91%
Texas Ratio (PRK) 16.77% 16.93% 20.28%
Peer Group Information Mar. 31, 2017 Dec. 31, 2016 Dec. 31, 2015
Percentage of nonaccrual loans and loans 90+ days
past due to loans (Peer Group) N/A 0.64% 0.75%
Percentage of nonaccrual, restructured and OREO to
assets (Peer Group) N/A 0.74% 0.91%
Note: The Texas Ratio is calculated as total nonperforming assets divided
by the sum of tangible common equity plus the allowance for loan losses.
18
Source: BHC Performance Report and Company Filings
(in thousands)
Mar. 31,
2017
Dec. 31,
2016
Dec. 31,
2015
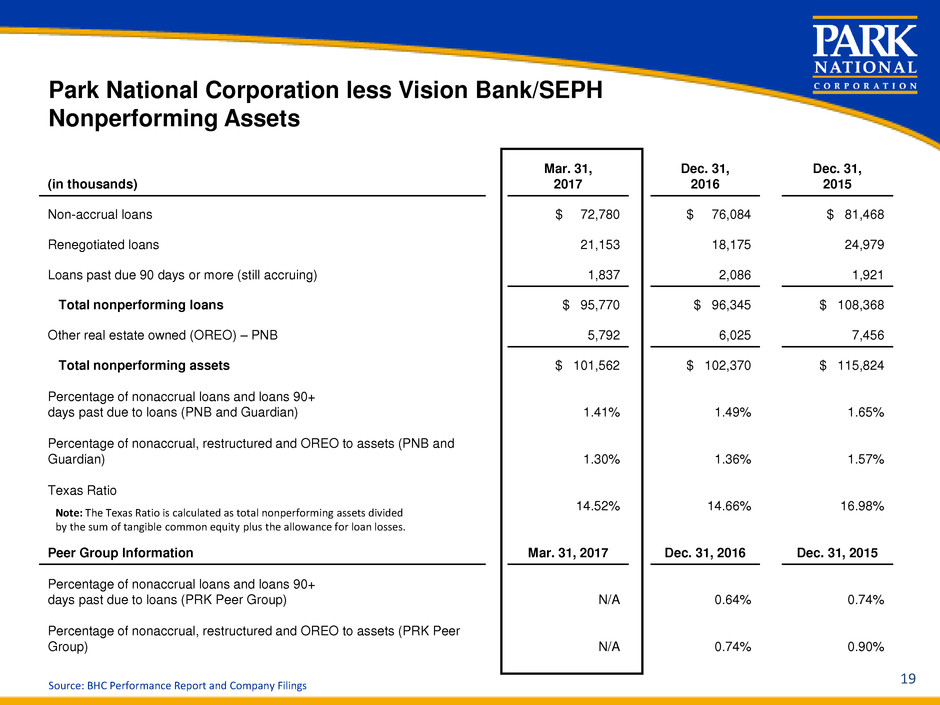
Non-accrual loans $ 72,780 $ 76,084 $ 81,468
Renegotiated loans 21,153 18,175 24,979
Loans past due 90 days or more (still accruing) 1,837 2,086 1,921
Total nonperforming loans $ 95,770 $ 96,345 $ 108,368
Other real estate owned (OREO) – PNB 5,792 6,025 7,456
Total nonperforming assets $ 101,562 $ 102,370 $ 115,824
Percentage of nonaccrual loans and loans 90+
days past due to loans (PNB and Guardian) 1.41% 1.49% 1.65%
Percentage of nonaccrual, restructured and OREO to assets (PNB and
Guardian) 1.30% 1.36% 1.57%
Texas Ratio
14.52% 14.66% 16.98%
Peer Group Information Mar. 31, 2017 Dec. 31, 2016 Dec. 31, 2015
Percentage of nonaccrual loans and loans 90+
days past due to loans (PRK Peer Group) N/A 0.64% 0.74%
Percentage of nonaccrual, restructured and OREO to assets (PRK Peer
Group) N/A 0.74% 0.90%
Park National Corporation less Vision Bank/SEPH
Nonperforming Assets
Note: The Texas Ratio is calculated as total nonperforming assets divided
by the sum of tangible common equity plus the allowance for loan losses.
19
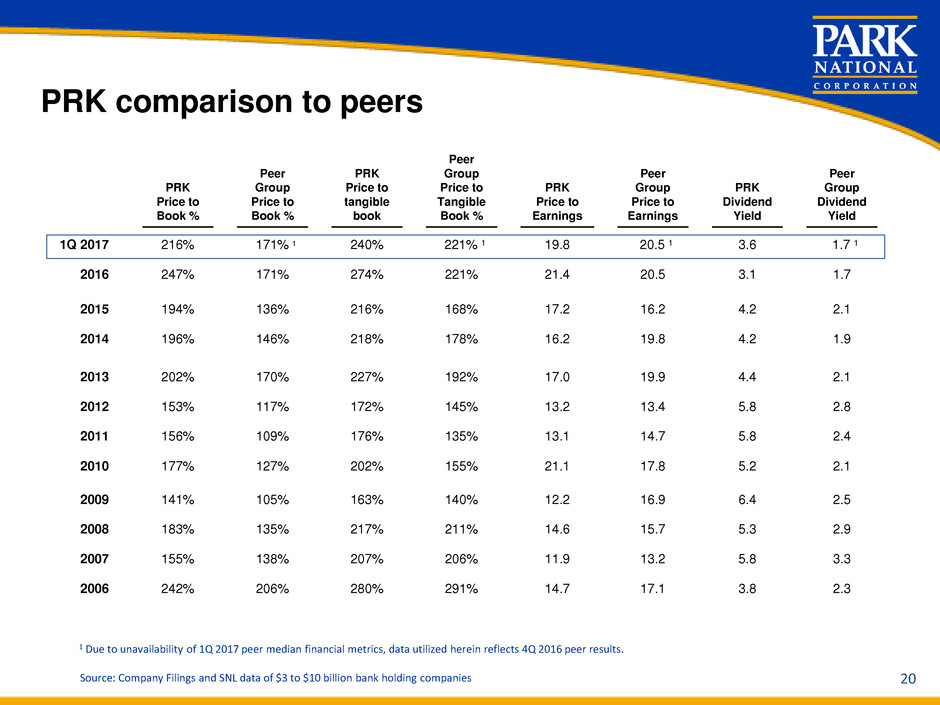
PRK comparison to peers
1 Due to unavailability of 1Q 2017 peer median financial metrics, data utilized herein reflects 4Q 2016 peer results.
Source: Company Filings and SNL data of $3 to $10 billion bank holding companies
PRK
Price to
Book %
Peer
Group
Price to
Book %
PRK
Price to
tangible
book
Peer
Group
Price to
Tangible
Book %
PRK
Price to
Earnings
Peer
Group
Price to
Earnings
PRK
Dividend
Yield
Peer
Group
Dividend
Yield
1Q 2017 216% 171% 1 240% 221% 1 19.8 20.5 1 3.6 1.7 1
2016 247% 171% 274% 221% 21.4 20.5 3.1 1.7
2015 194% 136% 216% 168% 17.2 16.2 4.2 2.1
2014 196% 146% 218% 178% 16.2 19.8 4.2 1.9
2013 202% 170% 227% 192% 17.0 19.9 4.4 2.1
2012 153% 117% 172% 145% 13.2 13.4 5.8 2.8
2011 156% 109% 176% 135% 13.1 14.7 5.8 2.4
2010 177% 127% 202% 155% 21.1 17.8 5.2 2.1
2009 141% 105% 163% 140% 12.2 16.9 6.4 2.5
2008 183% 135% 217% 211% 14.6 15.7 5.3 2.9
2007 155% 138% 207% 206% 11.9 13.2 5.8 3.3
2006 242% 206% 280% 291% 14.7 17.1 3.8 2.3
20
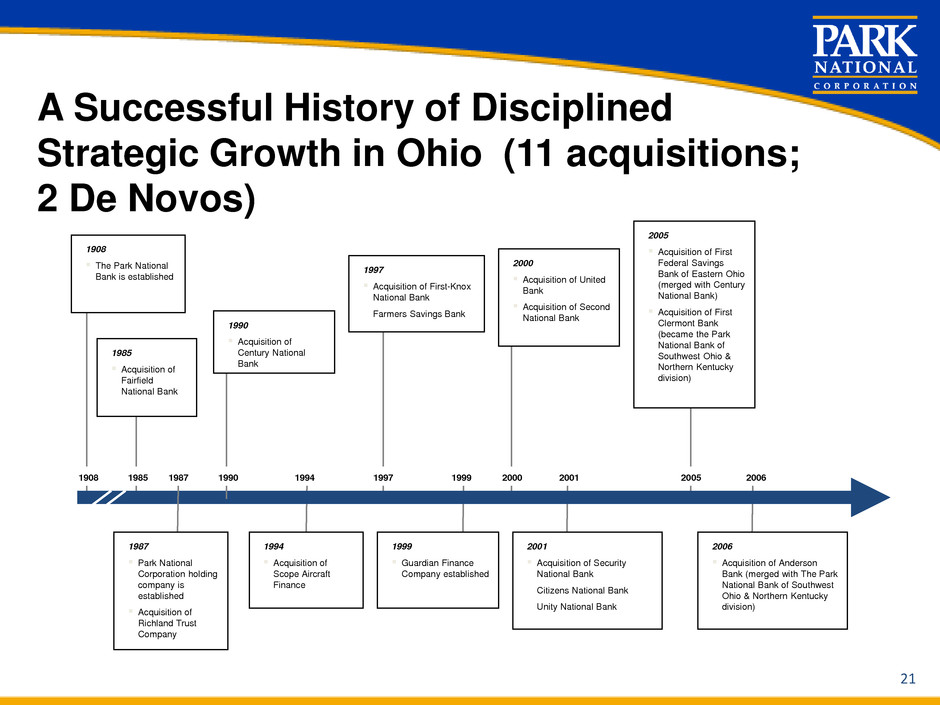
A Successful History of Disciplined
Strategic Growth in Ohio (11 acquisitions;
2 De Novos)
1908
1908
The Park National
Bank is established
1985
1985
Acquisition of
Fairfield
National Bank
1987
1987
Park National
Corporation holding
company is
established
Acquisition of
Richland Trust
Company
1990
1990
Acquisition of
Century National
Bank
1994
1994
Acquisition of
Scope Aircraft
Finance
1997 1999 2000 2001 2005 2006
1997
Acquisition of First-Knox
National Bank
Farmers Savings Bank
1999
Guardian Finance
Company established
2000
Acquisition of United
Bank
Acquisition of Second
National Bank
2001
Acquisition of Security
National Bank
Citizens National Bank
Unity National Bank
2005
Acquisition of First
Federal Savings
Bank of Eastern Ohio
(merged with Century
National Bank)
Acquisition of First
Clermont Bank
(became the Park
National Bank of
Southwest Ohio &
Northern Kentucky
division)
2006
Acquisition of Anderson
Bank (merged with The Park
National Bank of Southwest
Ohio & Northern Kentucky
division)
21
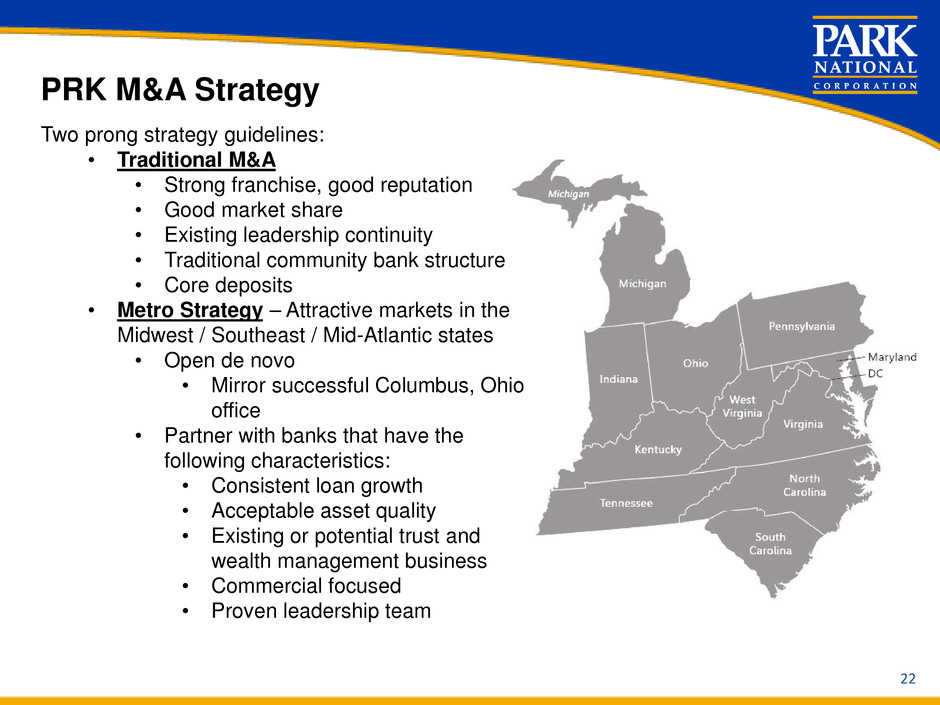
PRK M&A Strategy
Two prong strategy guidelines:
• Traditional M&A
• Strong franchise, good reputation
• Good market share
• Existing leadership continuity
• Traditional community bank structure
• Core deposits
• Metro Strategy – Attractive markets in the
Midwest / Southeast / Mid-Atlantic states
• Open de novo
• Mirror successful Columbus, Ohio
office
• Partner with banks that have the
following characteristics:
• Consistent loan growth
• Acceptable asset quality
• Existing or potential trust and
wealth management business
• Commercial focused
• Proven leadership team
22
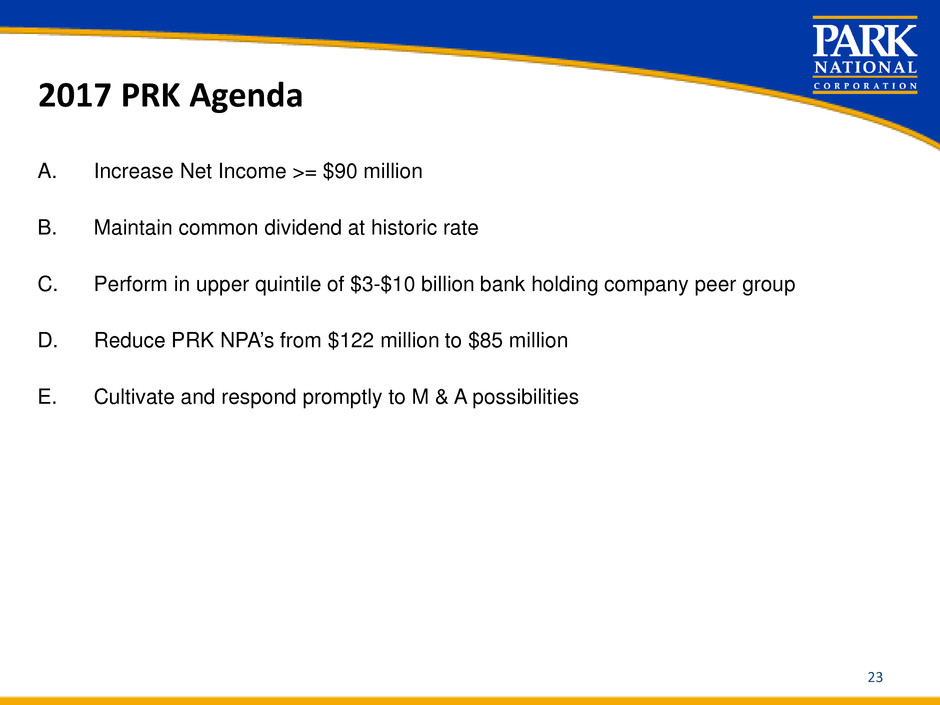
2017 PRK Agenda
23
A. Increase Net Income >= $90 million
B. Maintain common dividend at historic rate
C. Perform in upper quintile of $3-$10 billion bank holding company peer group
D. Reduce PRK NPA’s from $122 million to $85 million
E. Cultivate and respond promptly to M & A possibilities
May 9-11, 2017
24
D.A. Davidson 19th Annual Financial
Services Conference & Summit
