Attached files
| file | filename |
|---|---|
| EX-99.1 - EX-99.1 - Elevate Credit, Inc. | d385882dex991.htm |
| 8-K - FORM 8-K - Elevate Credit, Inc. | d385882d8k.htm |

First Quarter 2017 Earnings Call May 2017 Exhibit 99.2
Forward-Looking Statements This presentation and responses to various questions contain forward-looking statements within the meaning of Section 27A of the Securities Act of 1933, as amended, and Section 21E of the Securities Exchange Act of 1934, as amended. The forward-looking statements present our current expectations and projections relating to our business, financial condition and results of operations, and do not refer to historical or current facts. These statements may include words such as “anticipate,” “estimate,” “expect,” “project,” “plan,” “intend,” “believe,” “may,” “will,” “should,” “likely” and other words and terms of similar meaning. The forward-looking statements include statements regarding: our future financial performance including our outlook for full fiscal year 2017 and our perspectives on the second quarter of 2017 and our expectations regarding revenue, cost of revenue, growth rate of revenue, cost of borrowing, credit losses, marketing costs, net charge-offs, gross profit or gross margin, operating expenses, operating margins, ability to generate cash flow and ability to achieve and maintain future profitability; the availability of debt financing, funding sources and disruptions in credit markets; expectations related to our debt funding, including our expectation that we will extend the maturity of the RISE and ESPV facility to 2021 and that one RISE facility and the related lender will be replaced before the end of the second quarter of 2017, related to our RISE CSO relationships in Texas and Ohio; anticipated trends, growth rates, seasonal fluctuations and challenges in our business and in the markets in which we operate; our growth strategies and our ability to effectively manage that growth; customer demand for the our products; the cost of customer acquisition; the ability of customers to repay loans; interest rates and origination fees on loans; the impact of competition in our industry and innovation by our competitors; the efficacy and cost of our marketing efforts and relationships with marketing affiliates; continued innovation of our analytics platform and our ability to prevent security breaches, disruption in service and comparable events that could compromise the personal and confidential information held in our data systems, reduce the attractiveness of our platform or adversely impact our ability to service loans. Forward‐looking statements involve certain risks and uncertainties, and actual results may differ materially from those discussed in any such statement. These risks and uncertainties include, but are not limited to: the Company’s limited operating history in an evolving industry; new laws and regulations in the consumer lending industry in many jurisdictions that could restrict the consumer lending products and services the Company offers, impose additional compliance costs on the Company, render the Company’s current operations unprofitable or even prohibit the Company’s current operations; scrutiny by regulators and payment processors of certain online lenders’ access to the Automated Clearing House system to disburse and collect loan proceeds and repayments; a lack of sufficient debt financing at acceptable prices or disruptions in the credit markets; and other risks related to litigation, compliance and regulation. Additional factors that could cause actual results to differ are discussed under the heading "Risk Factors" and in other sections of the Prospectus related to the Company’s initial public offering of common stock filed pursuant to Rule 424(b) under the Securities Act of 1933, and in the Company's current and periodic reports filed from time to time with the SEC. All written and oral forward-looking statements attributable to us, or persons acting on our behalf, are expressly qualified in their entirety by the cautionary statements regarding risks and uncertainties that are included in our public communications. You should evaluate all forward-looking statements made in this presentation in the context of these risks and uncertainties. Neither we nor any of our respective agents, employees or advisors intend or have any duty or obligation to supplement, amend, update or revise any of the forward-looking statements contained in this presentation. This presentation also contains estimates and other statistical data made by independent parties and by us relating to market size and growth and other data about our industry. This data involves a number of assumptions and limitations, and you are cautioned not to give undue weight to such estimates. Neither we nor any other person makes any representation as to the accuracy or completeness of such data or undertakes any obligation to update such data after the date of this presentation. In addition, projections, assumptions and estimates of our future performance and the future performance of the markets in which we operate are necessarily subject to a high degree of uncertainty and risk. The information and opinions contained in this presentation are provided as of the date of this presentation and are subject to change without notice. This presentation has not been approved by any regulatory or supervisory agency.

CONFIDENTIAL-DO NOT COPY Elevate is reinventing non-prime credit with online products that provide financial relief today, and help people build a brighter financial future.
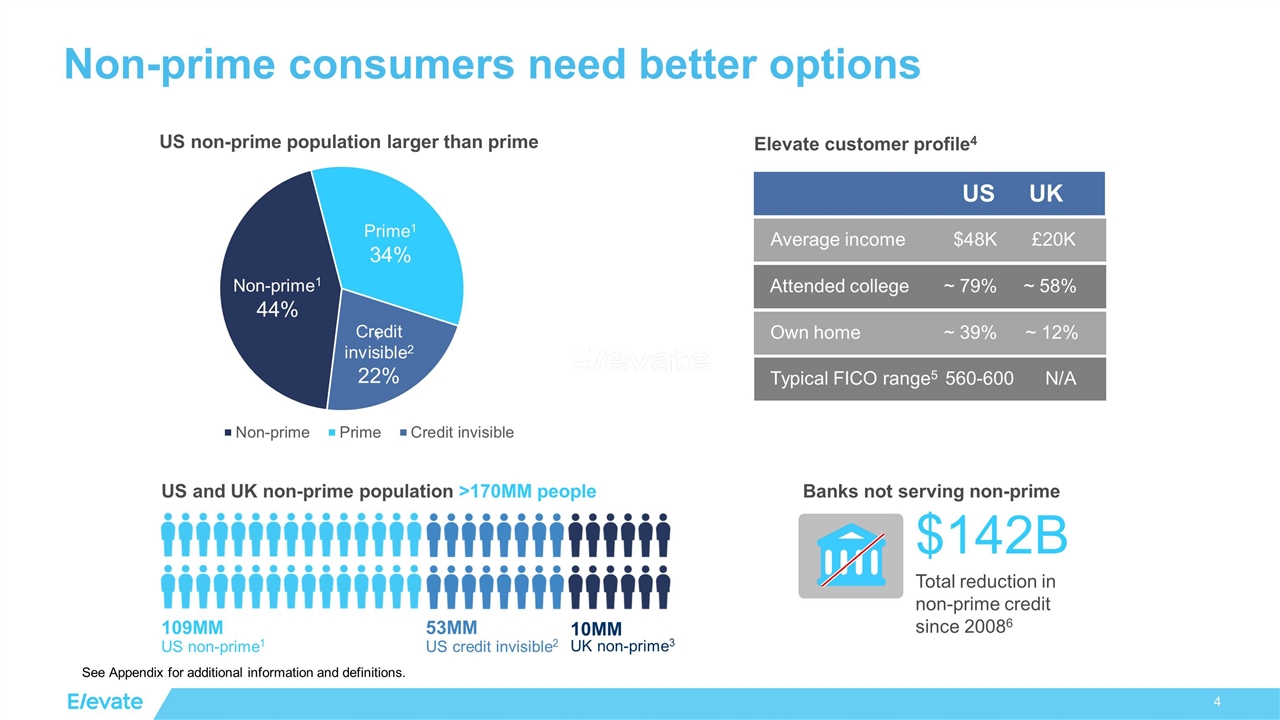
109MM US non-prime1 53MM US credit invisible2 10MM UK non-prime3 US non-prime population larger than prime US and UK non-prime population >170MM people Elevate customer profile4 Prime1 34% Non-prime1 44% Credit invisible2 22% Banks not serving non-prime $142B Total reduction in non-prime credit since 20086 1 1 2 US UK Average income Attended college Own home $48K ~ 79% ~ 39% £20K ~ 58% ~ 12% Typical FICO range5 560-600 N/A Non-prime consumers need better options See Appendix for additional information and definitions.

Approval in seconds Rates that go down over time Financial wellness features Credit building features Flexible payment terms Good Today, Better Tomorrow The next generation of responsible online credit
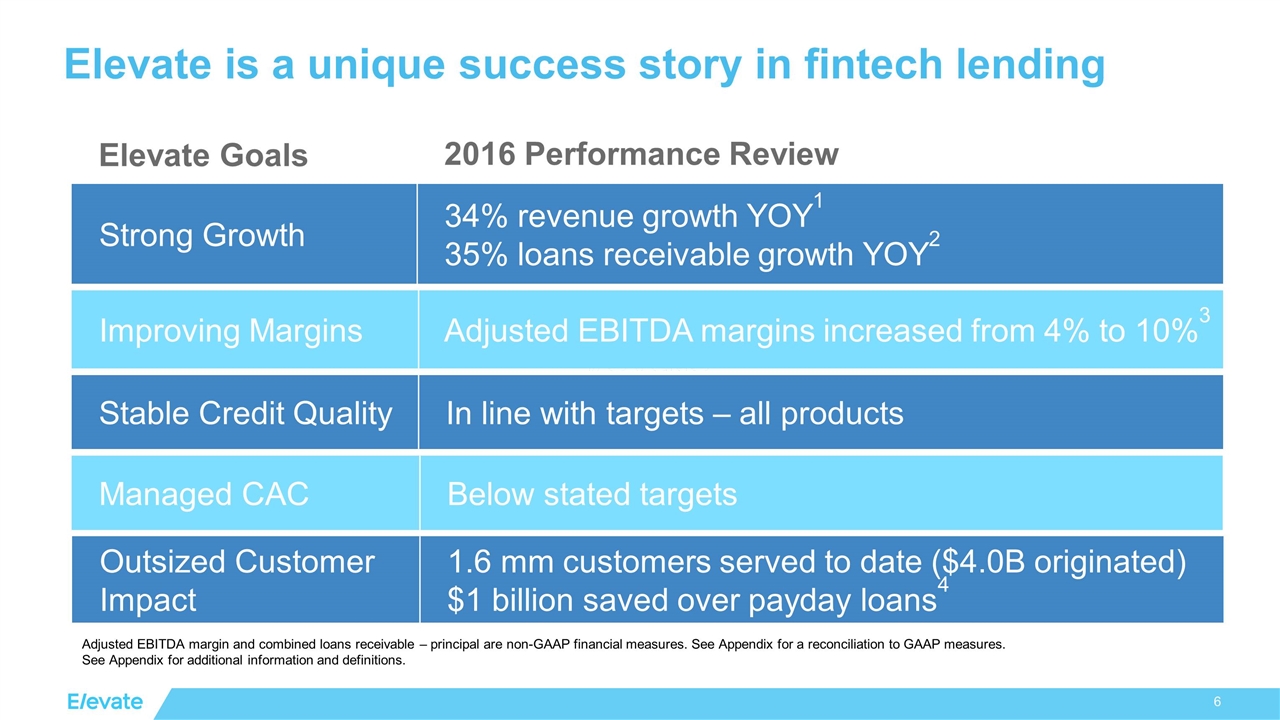
Strong Growth 34% revenue growth YOY1 35% loans receivable growth YOY2 Stable Credit Quality In line with targets – all products Improving Margins Adjusted EBITDA margins increased from 4% to 10%3 Managed CAC Below stated targets Outsized Customer Impact 1.6 mm customers served to date ($4.0B originated) $1 billion saved over payday loans4 Elevate is a unique success story in fintech lending Elevate Goals 2016 Performance Review Adjusted EBITDA margin and combined loans receivable – principal are non-GAAP financial measures. See Appendix for a reconciliation to GAAP measures. See Appendix for additional information and definitions.
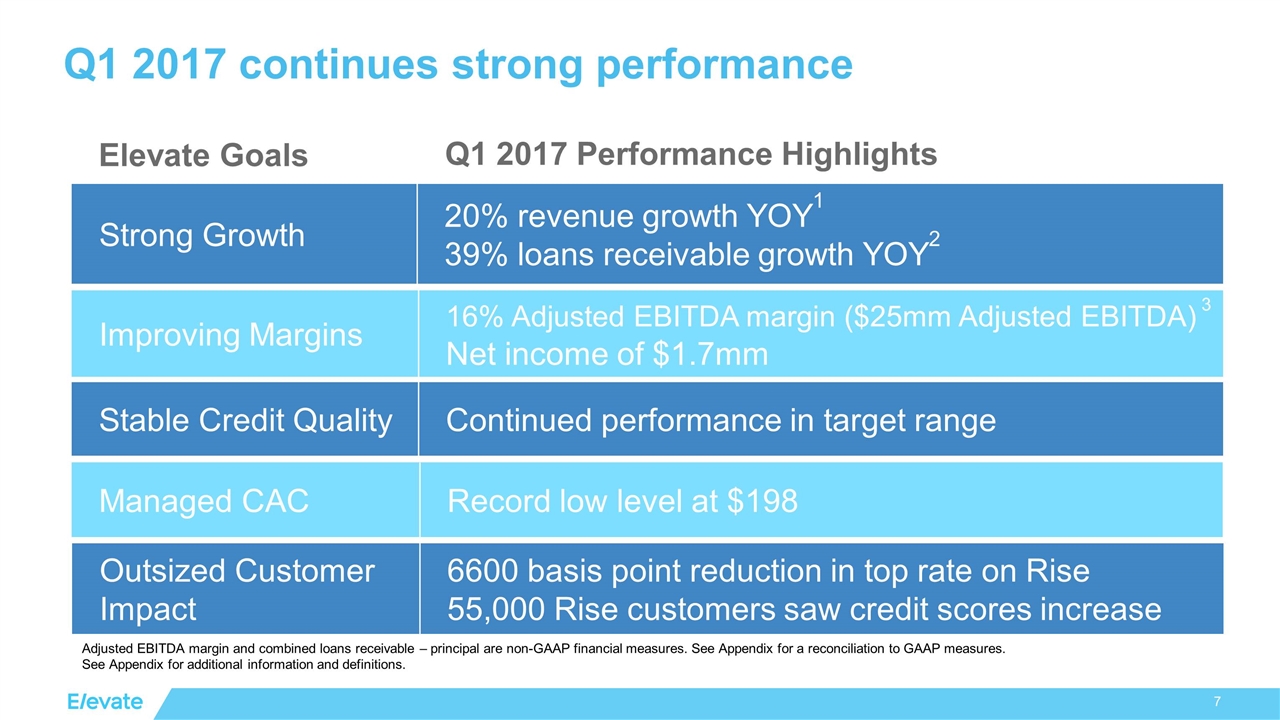
Strong Growth 20% revenue growth YOY1 39% loans receivable growth YOY2 Stable Credit Quality Continued performance in target range Improving Margins 16% Adjusted EBITDA margin ($25mm Adjusted EBITDA) 3 Net income of $1.7mm Managed CAC Record low level at $198 Outsized Customer Impact 6600 basis point reduction in top rate on Rise 55,000 Rise customers saw credit scores increase Q1 2017 continues strong performance Elevate Goals Q1 2017 Performance Highlights Adjusted EBITDA margin and combined loans receivable – principal are non-GAAP financial measures. See Appendix for a reconciliation to GAAP measures. See Appendix for additional information and definitions.
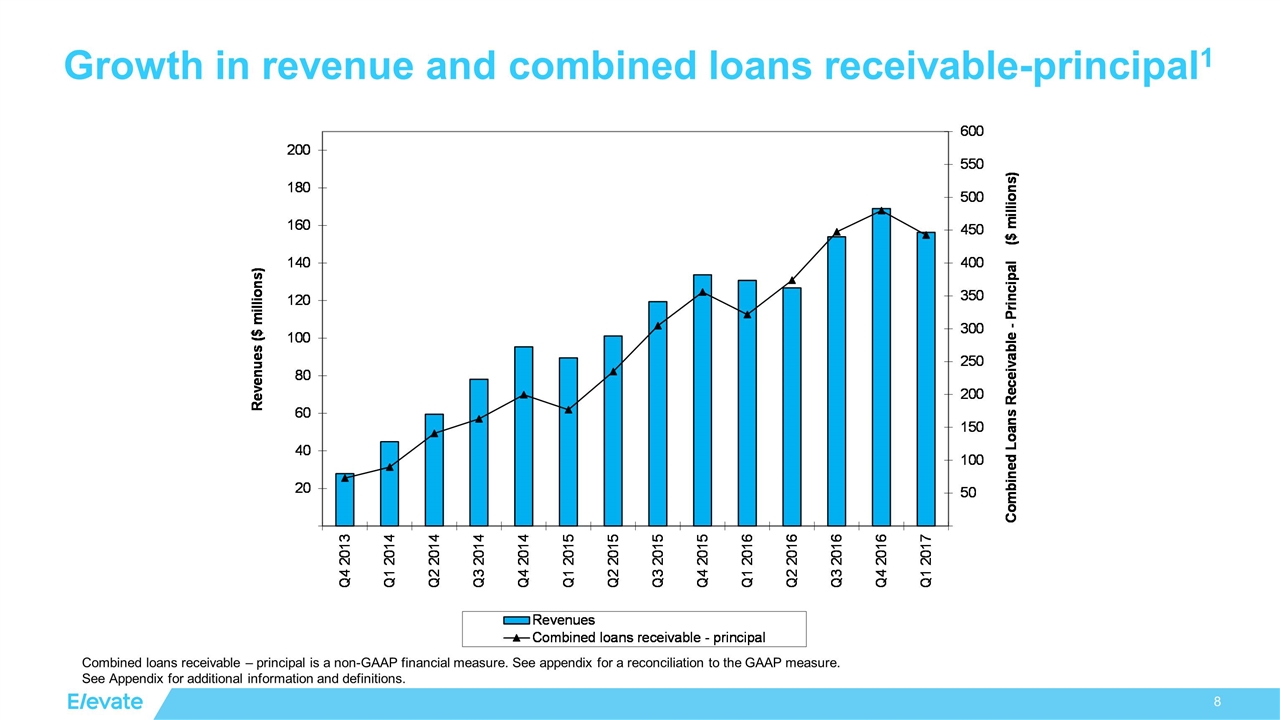
Growth in revenue and combined loans receivable-principal1 Combined loans receivable – principal is a non-GAAP financial measure. See appendix for a reconciliation to the GAAP measure. See Appendix for additional information and definitions.
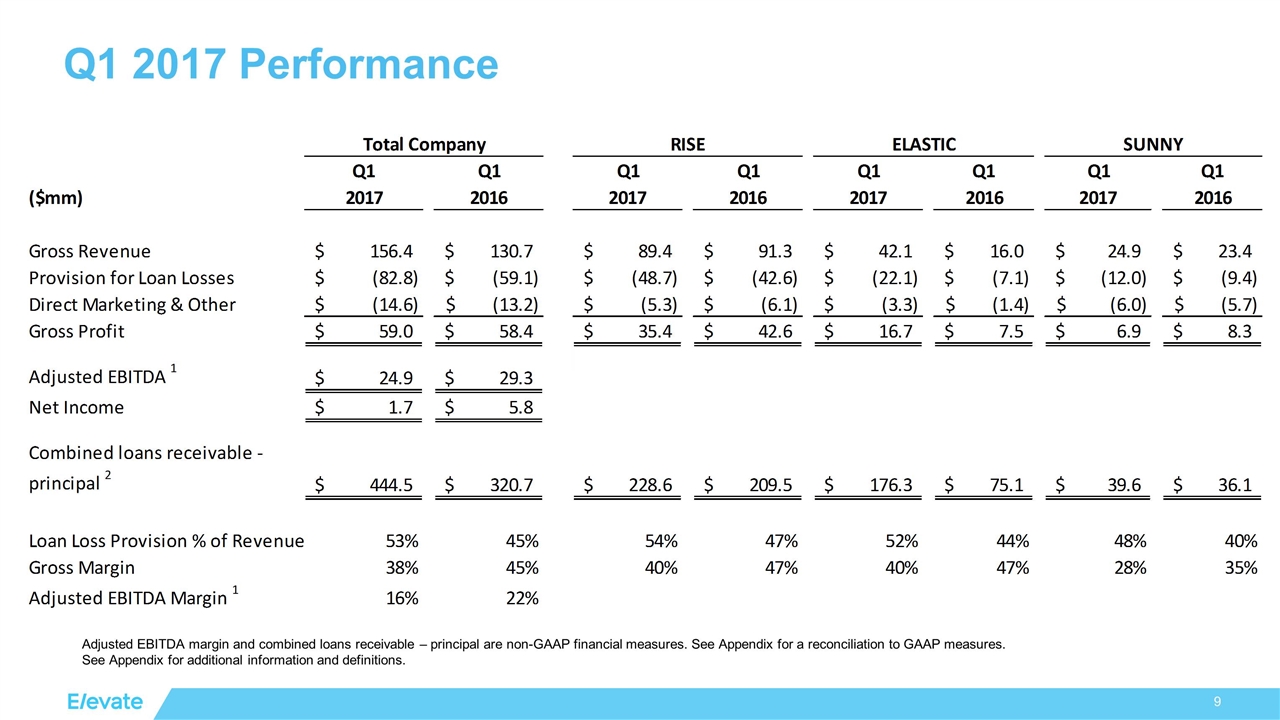
Q1 2017 Performance Adjusted EBITDA margin and combined loans receivable – principal are non-GAAP financial measures. See Appendix for a reconciliation to GAAP measures. See Appendix for additional information and definitions.
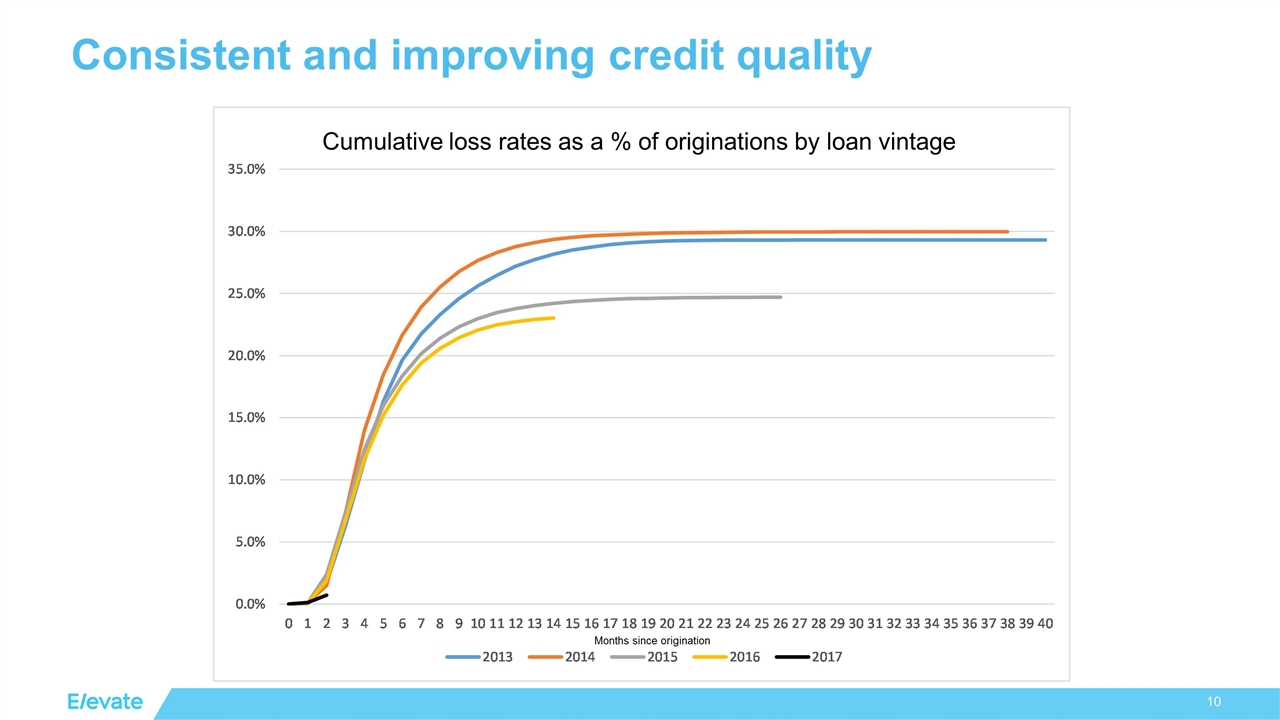
Consistent and improving credit quality Cumulative loss rates as a % of originations by loan vintage Months since origination
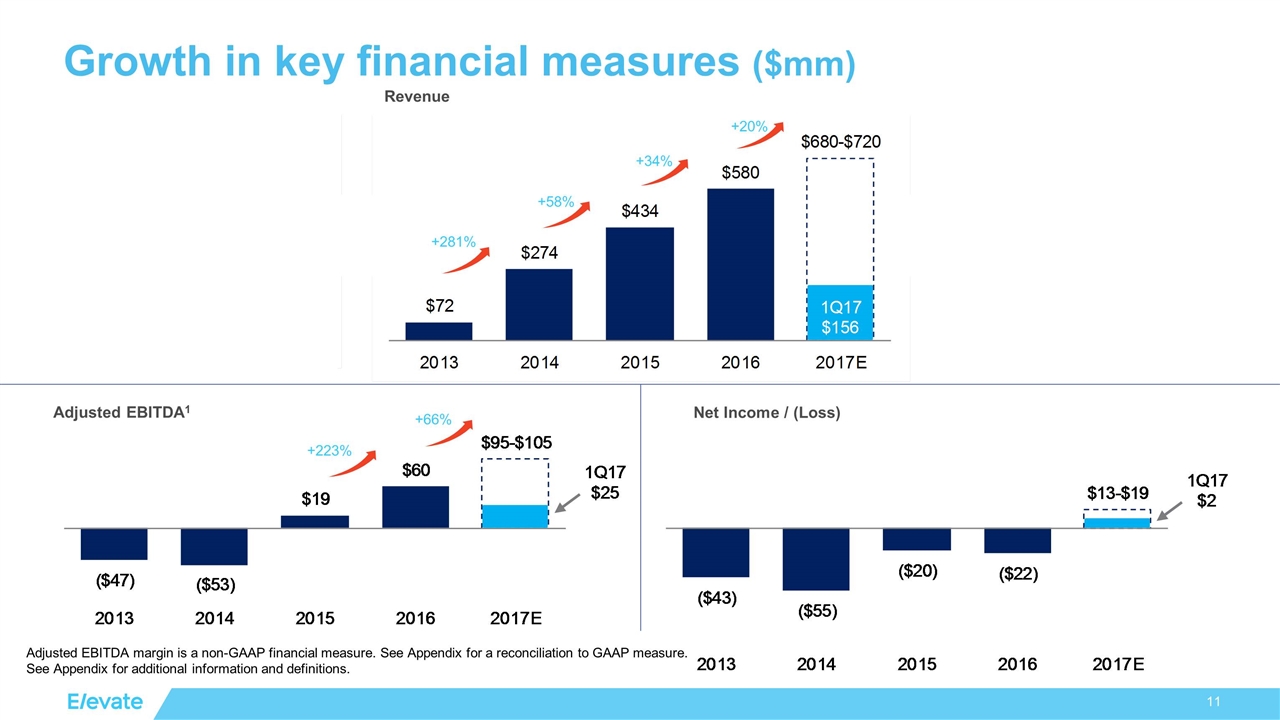
Revenue Adjusted EBITDA1 +281% +58% +34% +20% +223% +66% Net Income / (Loss) Growth in key financial measures ($mm) Adjusted EBITDA margin is a non-GAAP financial measure. See Appendix for a reconciliation to GAAP measure. See Appendix for additional information and definitions.
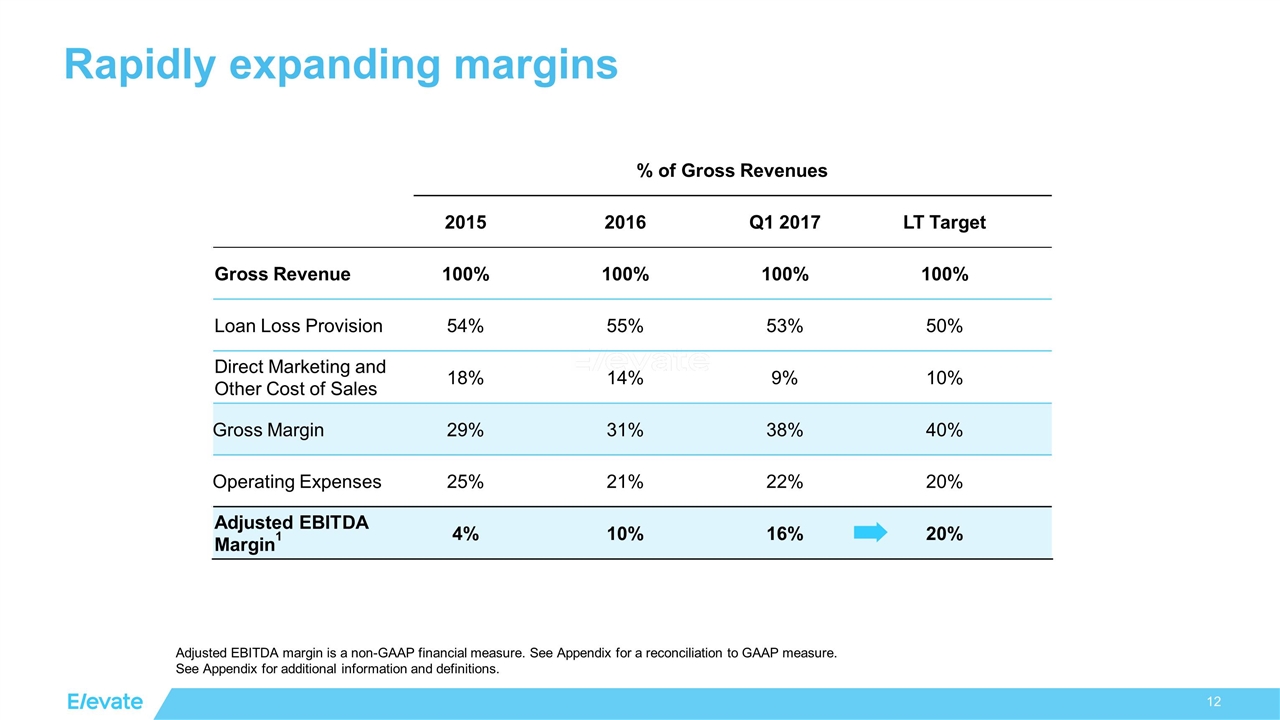
Rapidly expanding margins % of Gross Revenues 2015 2016 Q1 2017 LT Target Gross Revenue 100% 100% 100% 100% Loan Loss Provision 54% 55% 53% 50% Direct Marketing and Other Cost of Sales 18% 14% 9% 10% Gross Margin 29% 31% 38% 40% Operating Expenses 25% 21% 22% 20% Adjusted EBITDA Margin1 4% 10% 16% 20% ➡ Adjusted EBITDA margin is a non-GAAP financial measure. See Appendix for a reconciliation to GAAP measure. See Appendix for additional information and definitions.
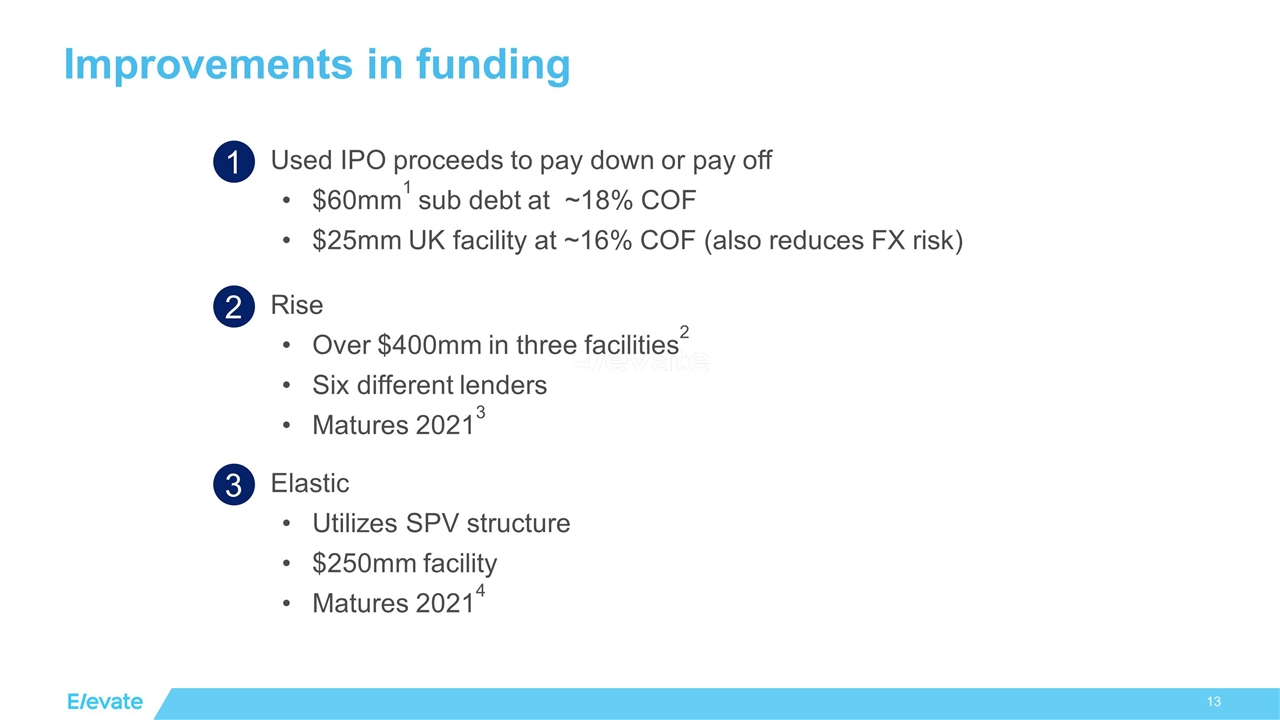
Improvements in funding Used IPO proceeds to pay down or pay off $60mm1 sub debt at ~18% COF $25mm UK facility at ~16% COF (also reduces FX risk) 1 Elastic Utilizes SPV structure $250mm facility Matures 20214 3 Rise Over $400mm in three facilities2 Six different lenders Matures 20213 2
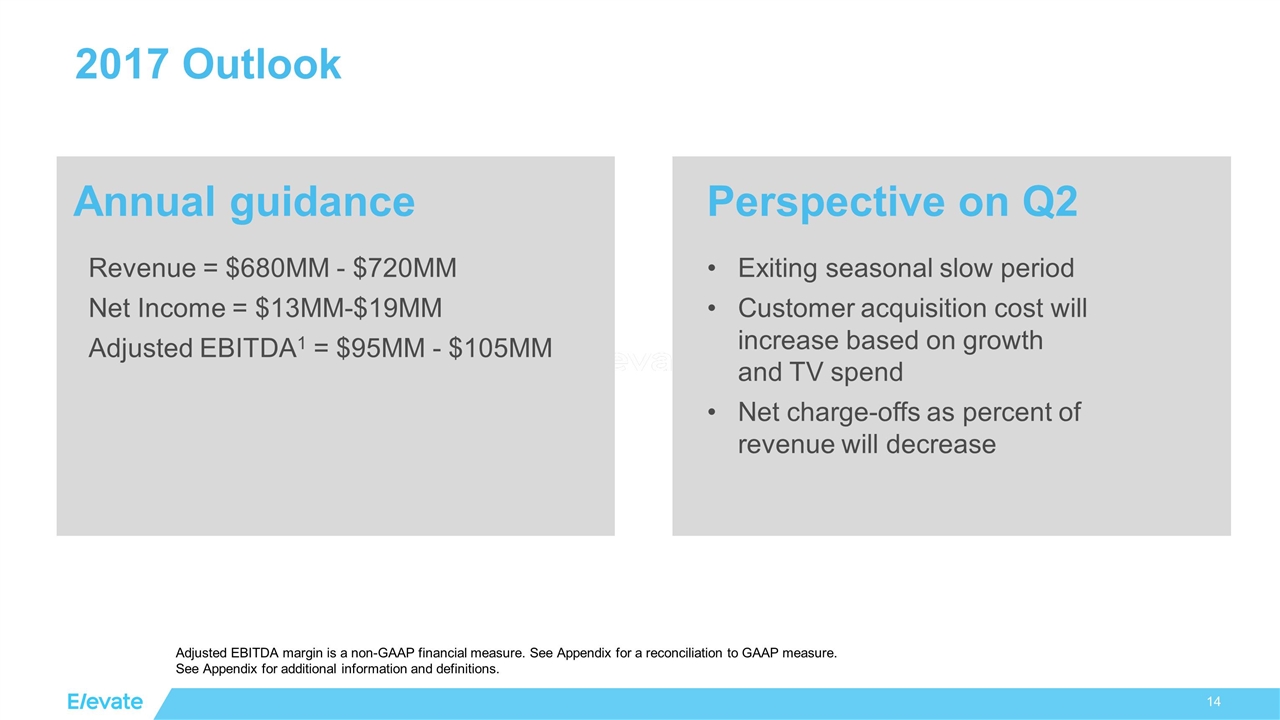
2017 Outlook Revenue = $680MM - $720MM Net Income = $13MM-$19MM Adjusted EBITDA1 = $95MM - $105MM Exiting seasonal slow period Customer acquisition cost will increase based on growth and TV spend Net charge-offs as percent of revenue will decrease Perspective on Q2 Annual guidance Adjusted EBITDA margin is a non-GAAP financial measure. See Appendix for a reconciliation to GAAP measure. See Appendix for additional information and definitions.

CONFIDENTIAL-DO NOT COPY We believe everyone deserves a lift.

Appendix
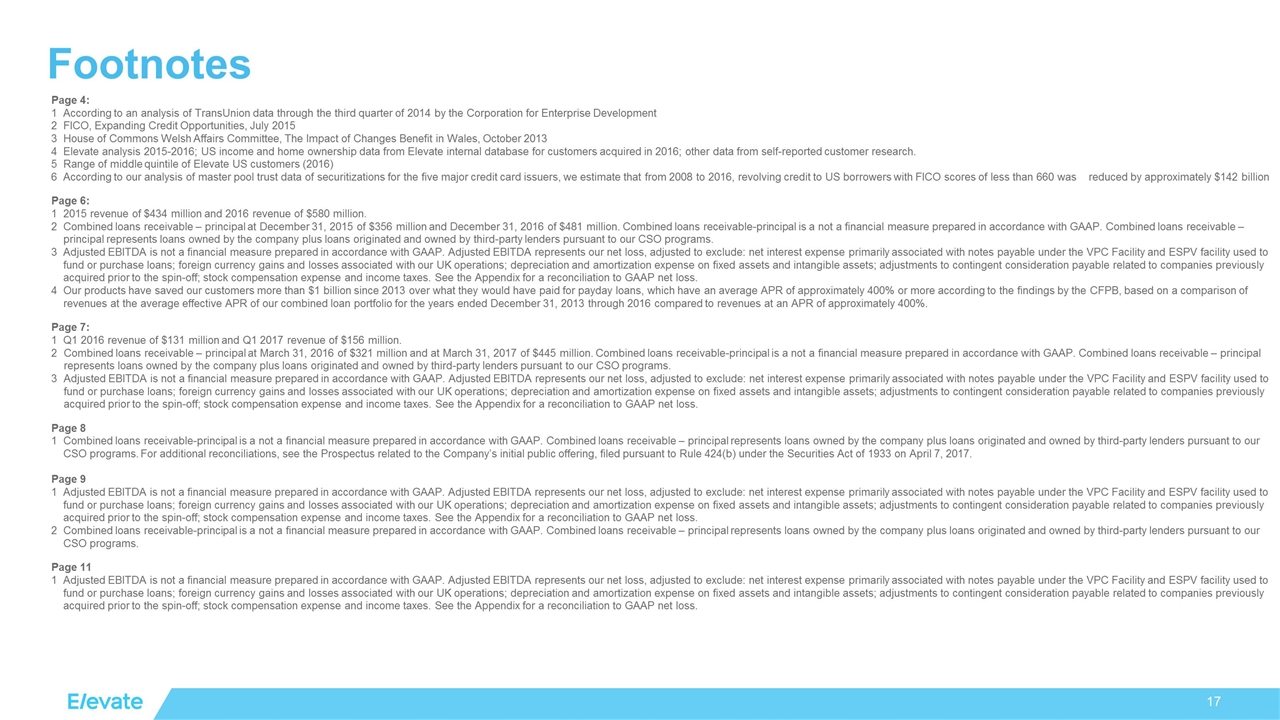
Footnotes Page 4: 1According to an analysis of TransUnion data through the third quarter of 2014 by the Corporation for Enterprise Development 2 FICO, Expanding Credit Opportunities, July 2015 3 House of Commons Welsh Affairs Committee, The Impact of Changes Benefit in Wales, October 2013 4 Elevate analysis 2015-2016; US income and home ownership data from Elevate internal database for customers acquired in 2016; other data from self-reported customer research. Range of middle quintile of Elevate US customers (2016) According to our analysis of master pool trust data of securitizations for the five major credit card issuers, we estimate that from 2008 to 2016, revolving credit to US borrowers with FICO scores of less than 660 was reduced by approximately $142 billion Page 6: 1 2015 revenue of $434 million and 2016 revenue of $580 million. Combined loans receivable – principal at December 31, 2015 of $356 million and December 31, 2016 of $481 million. Combined loans receivable-principal is a not a financial measure prepared in accordance with GAAP. Combined loans receivable – principal represents loans owned by the company plus loans originated and owned by third-party lenders pursuant to our CSO programs. Adjusted EBITDA is not a financial measure prepared in accordance with GAAP. Adjusted EBITDA represents our net loss, adjusted to exclude: net interest expense primarily associated with notes payable under the VPC Facility and ESPV facility used to fund or purchase loans; foreign currency gains and losses associated with our UK operations; depreciation and amortization expense on fixed assets and intangible assets; adjustments to contingent consideration payable related to companies previously acquired prior to the spin-off; stock compensation expense and income taxes. See the Appendix for a reconciliation to GAAP net loss. Our products have saved our customers more than $1 billion since 2013 over what they would have paid for payday loans, which have an average APR of approximately 400% or more according to the findings by the CFPB, based on a comparison of revenues at the average effective APR of our combined loan portfolio for the years ended December 31, 2013 through 2016 compared to revenues at an APR of approximately 400%. Page 7: 1Q1 2016 revenue of $131 million and Q1 2017 revenue of $156 million. Combined loans receivable – principal at March 31, 2016 of $321 million and at March 31, 2017 of $445 million. Combined loans receivable-principal is a not a financial measure prepared in accordance with GAAP. Combined loans receivable – principal represents loans owned by the company plus loans originated and owned by third-party lenders pursuant to our CSO programs. Adjusted EBITDA is not a financial measure prepared in accordance with GAAP. Adjusted EBITDA represents our net loss, adjusted to exclude: net interest expense primarily associated with notes payable under the VPC Facility and ESPV facility used to fund or purchase loans; foreign currency gains and losses associated with our UK operations; depreciation and amortization expense on fixed assets and intangible assets; adjustments to contingent consideration payable related to companies previously acquired prior to the spin-off; stock compensation expense and income taxes. See the Appendix for a reconciliation to GAAP net loss. Page 8 Combined loans receivable-principal is a not a financial measure prepared in accordance with GAAP. Combined loans receivable – principal represents loans owned by the company plus loans originated and owned by third-party lenders pursuant to our CSO programs. For additional reconciliations, see the Prospectus related to the Company’s initial public offering, filed pursuant to Rule 424(b) under the Securities Act of 1933 on April 7, 2017. Page 9 Adjusted EBITDA is not a financial measure prepared in accordance with GAAP. Adjusted EBITDA represents our net loss, adjusted to exclude: net interest expense primarily associated with notes payable under the VPC Facility and ESPV facility used to fund or purchase loans; foreign currency gains and losses associated with our UK operations; depreciation and amortization expense on fixed assets and intangible assets; adjustments to contingent consideration payable related to companies previously acquired prior to the spin-off; stock compensation expense and income taxes. See the Appendix for a reconciliation to GAAP net loss. Combined loans receivable-principal is a not a financial measure prepared in accordance with GAAP. Combined loans receivable – principal represents loans owned by the company plus loans originated and owned by third-party lenders pursuant to our CSO programs. Page 11 Adjusted EBITDA is not a financial measure prepared in accordance with GAAP. Adjusted EBITDA represents our net loss, adjusted to exclude: net interest expense primarily associated with notes payable under the VPC Facility and ESPV facility used to fund or purchase loans; foreign currency gains and losses associated with our UK operations; depreciation and amortization expense on fixed assets and intangible assets; adjustments to contingent consideration payable related to companies previously acquired prior to the spin-off; stock compensation expense and income taxes. See the Appendix for a reconciliation to GAAP net loss.
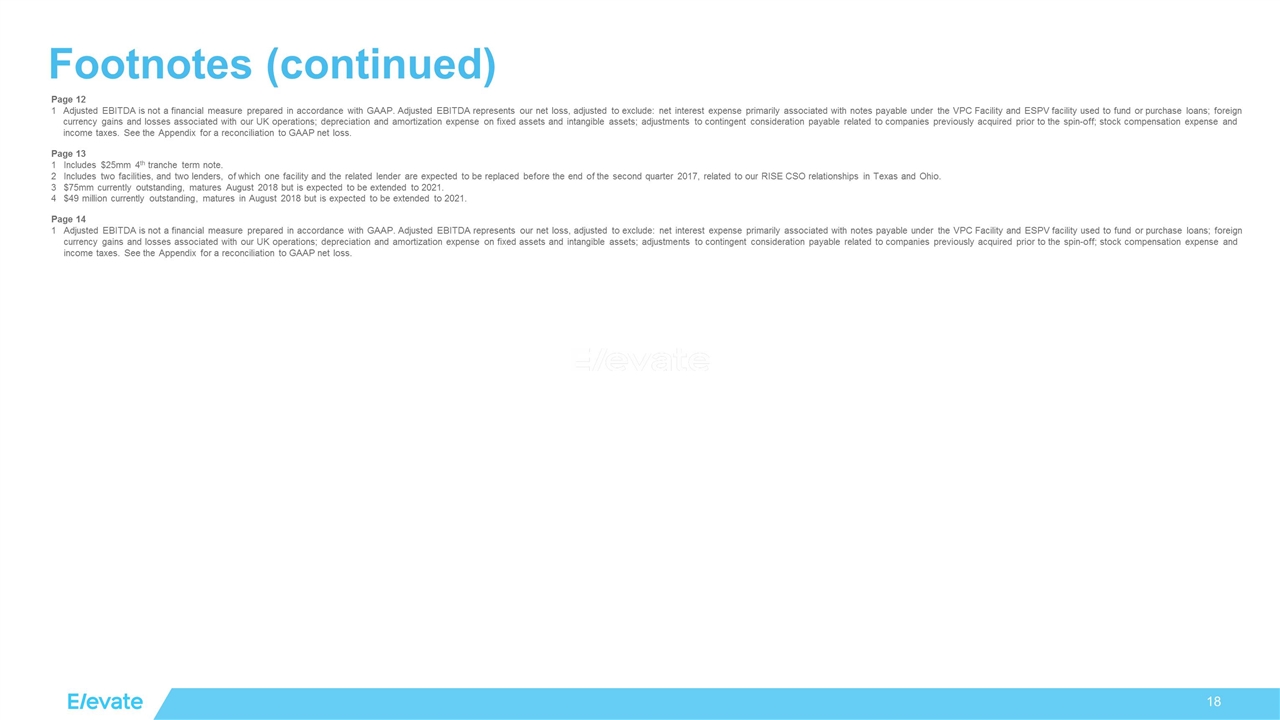
Footnotes (continued) Page 12 Adjusted EBITDA is not a financial measure prepared in accordance with GAAP. Adjusted EBITDA represents our net loss, adjusted to exclude: net interest expense primarily associated with notes payable under the VPC Facility and ESPV facility used to fund or purchase loans; foreign currency gains and losses associated with our UK operations; depreciation and amortization expense on fixed assets and intangible assets; adjustments to contingent consideration payable related to companies previously acquired prior to the spin-off; stock compensation expense and income taxes. See the Appendix for a reconciliation to GAAP net loss. Page 13 1Includes $25mm 4th tranche term note. Includes two facilities, and two lenders, of which one facility and the related lender are expected to be replaced before the end of the second quarter 2017, related to our RISE CSO relationships in Texas and Ohio. $75mm currently outstanding, matures August 2018 but is expected to be extended to 2021. $49 million currently outstanding, matures in August 2018 but is expected to be extended to 2021. Page 14 1Adjusted EBITDA is not a financial measure prepared in accordance with GAAP. Adjusted EBITDA represents our net loss, adjusted to exclude: net interest expense primarily associated with notes payable under the VPC Facility and ESPV facility used to fund or purchase loans; foreign currency gains and losses associated with our UK operations; depreciation and amortization expense on fixed assets and intangible assets; adjustments to contingent consideration payable related to companies previously acquired prior to the spin-off; stock compensation expense and income taxes. See the Appendix for a reconciliation to GAAP net loss.
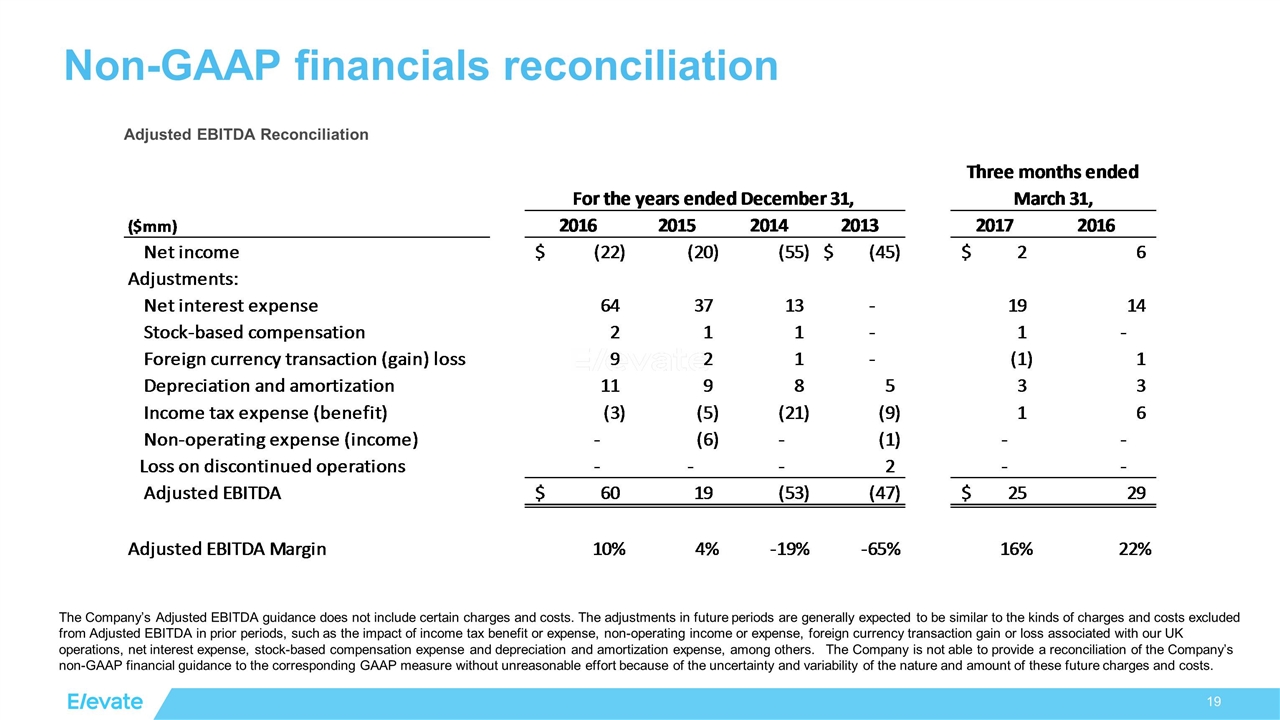
Non-GAAP financials reconciliation Adjusted EBITDA Reconciliation The Company’s Adjusted EBITDA guidance does not include certain charges and costs. The adjustments in future periods are generally expected to be similar to the kinds of charges and costs excluded from Adjusted EBITDA in prior periods, such as the impact of income tax benefit or expense, non-operating income or expense, foreign currency transaction gain or loss associated with our UK operations, net interest expense, stock-based compensation expense and depreciation and amortization expense, among others. The Company is not able to provide a reconciliation of the Company’s non-GAAP financial guidance to the corresponding GAAP measure without unreasonable effort because of the uncertainty and variability of the nature and amount of these future charges and costs.
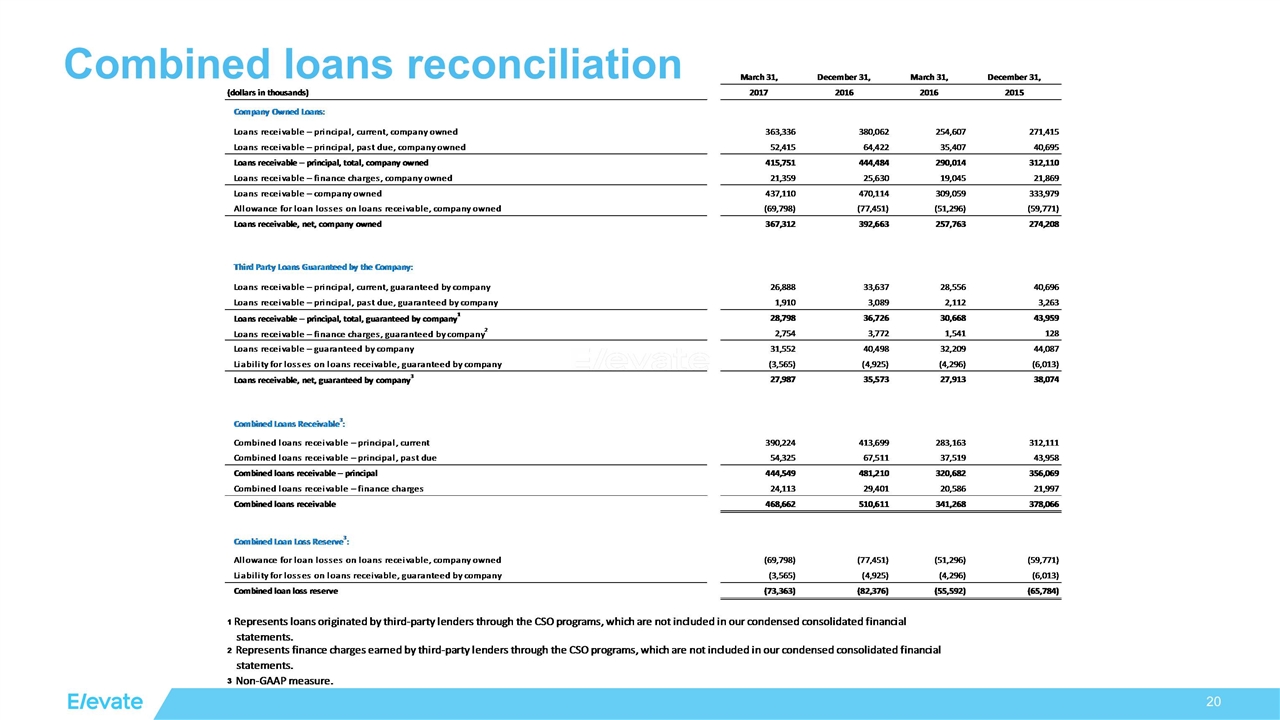
Combined loans reconciliation
