Attached files
| file | filename |
|---|---|
| EX-99.1 - EX-99.1 - Easterly Government Properties, Inc. | dea-ex991_6.htm |
| 8-K - 8-K - Easterly Government Properties, Inc. | dea-8k_20170509.htm |
Exhibit 99.2

|
Disclaimers |
|
|
|
|

We make statements in this Supplemental Information Package that are considered “forward-looking statements” within the meaning of Section 27A of the Securities Act of 1933, as amended, or the Securities Act, and Section 21E of the Securities Exchange Act of 1934, as amended, or the Exchange Act, which are usually identified by the use of words such as “anticipates,” “believes,” “estimates,” “expects,” “intends,” “may,” “plans,” “projects,” “seeks,” “should,” “will,” and variations of such words or similar expressions. We intend these forward-looking statements to be covered by the safe harbor provisions for forward-looking statements contained in the Private Securities Litigation Reform Act of 1995 and are including this statement in this Supplemental Information Package for purposes of complying with those safe harbor provisions. These forward-looking statements reflect our current views about our plans, intentions, expectations, strategies and prospects, which are based on the information currently available to us and on assumptions we have made. Although we believe that our plans, intentions, expectations, strategies and prospects as reflected in or suggested by those forward-looking statements are reasonable, we can give no assurance that the plans, intentions, expectations or strategies will be attained or achieved. Furthermore, actual results may differ materially from those described in the forward-looking statements and will be affected by a variety of risks and factors that are beyond our control including, without limitation: risks associated with our dependence on the U.S. Government and its agencies for substantially all of our revenues; risks associated with ownership and development of real estate; decreased rental rates or increased vacancy rates; loss of key personnel; general volatility of the capital and credit markets and the market price of our common stock; the risk we may lose one or more major tenants; difficulties in completing and successfully integrating acquisitions; failure of acquisitions or development projects to occur at anticipated levels or to yield anticipated results; risks associated with actual or threatened terrorist attacks; intense competition in the real estate market that may limit our ability to attract or retain tenants or re-lease space; insufficient amounts of insurance or exposure to events that are either uninsured or underinsured; uncertainties and risks related to adverse weather conditions, natural disasters and climate change; exposure to liability relating to environmental and health and safety matters; limited ability to dispose of assets because of the relative illiquidity of real estate investments and the nature of our assets; exposure to litigation or other claims; risks associated with breaches of our data security; risks associated with our indebtedness; and other risks and uncertainties detailed in the “Risk Factors” section of our Form 10-K for the year ended December 31, 2016, filed with the Securities and Exchange Commission on March 2, 2017 and the factors included under the heading “Risk Factors” in our other public filings. In addition, our qualification as a real estate investment trust involves the application of highly technical and complex provisions of the Internal Revenue Code of 1986, or the Code, and depends on our ability to meet the various requirements imposed by the Code through actual operating results, distribution levels and diversity of stock ownership. We assume no obligation to update publicly any forward-looking statements, whether as a result of new information, future events or otherwise.
Ratings
Ratings are not recommendations to buy, sell or hold the Company’s securities.
The following discussion related to the consolidated financial statements of the Company should be read in conjunction with the financial statements for the quarter ended March 31, 2017 that will be released on Form 10-Q to be filed on or about May 9, 2017.
2
|
Supplemental Definitions |
|
|
|
|
This section contains definitions of certain non-GAAP financial measures and other terms that the Company uses in this Supplemental Information Package and, where applicable, the reasons why management believes these non-GAAP financial measures provide useful information to investors about the Company’s financial condition and results of operations and the other purposes for which management uses the measures. These measures should not be considered in isolation or as a substitute for measures of performance in accordance with GAAP. Additional detail can be found in the Company’s most recent annual report on Form 10-K, as well as other documents filed with or furnished to the SEC from time to time.
Annualized lease income is defined as the annualized contractual base rent for the last month in a specified period, plus the annualized straight line rent adjustments for the last month in such period and the annualized expense reimbursements earned by us for the last month in such period.
Cash Available for Distribution (CAD) is a non-GAAP financial measure that is not intended to represent cash flow for the period and is not indicative of cash flow provided by operating activities as determined under GAAP. CAD is calculated in accordance with the current NAREIT definition as FFO minus normalized recurring real estate-related expenditures and other non-cash items and nonrecurring expenditures. CAD is presented solely as a supplemental disclosure because the Company believes it provides useful information regarding the Company’s ability to fund its dividends. Because all companies do not calculate CAD the same way, the presentation of CAD may not be comparable to similarly titled measures of other companies.
EBITDA is calculated as the sum of net income (loss) before interest expense, income taxes, depreciation and amortization. EBITDA is not intended to represent cash flow for the period, is not presented as an alternative to operating income as an indicator of operating performance, should not be considered in isolation or as a substitute for measures of performance prepared in accordance with GAAP and is not indicative of operating income or cash provided by operating activities as determined under GAAP. EBITDA is presented solely as a supplemental disclosure with respect to liquidity because the Company believes it provides useful information regarding the Company's ability to service or incur debt. Because all companies do not calculate EBITDA the same way, the presentation of EBITDA may not be comparable to similarly titled measures of other companies.
Fully diluted basis assumes the exchange of all outstanding common units representing limited partnership interests in the Company’s operating partnership, or common units, the full vesting of all shares of restricted stock, and the exchange of all earned and vested LTIP units in the Company’s operating partnership for shares of common stock on a one-for-one basis, which is not the same as the meaning of “fully diluted” under GAAP. Fully diluted basis does not include outstanding LTIP units in the Company’s operating partnership that are subject to performance criteria that have not yet been met.
Funds From Operations (FFO) is defined by NAREIT as net income (loss), calculated in accordance with GAAP, excluding gains or losses from sales of property and impairment losses on depreciable real estate, plus real estate depreciation and amortization, and after adjustments for unconsolidated partnerships and joint ventures. FFO is a widely recognized measure of REIT performance. Although FFO is a non-GAAP financial measure, the Company believes that information regarding FFO is helpful to shareholders and potential investors.
Funds From Operations, as Adjusted (FFO, as Adjusted) adjusts FFO to present an alternative measure of our operating performance, which, when applicable, excludes the impact of acquisition costs, straight-line rent, above-/below-market leases, non-cash interest expense and non-cash compensation. By excluding income and expense items such as straight-line rent, above-/below-market leases, non-cash interest expense and non-cash compensation from FFO, as Adjusted, the Company believes it provides useful information as these items have no cash impact. In addition, by excluding acquisition related costs the Company believes FFO, as Adjusted provides useful information that is comparable across periods and more accurately reflects the operating performance of the Company’s properties.
3
|
Supplemental Definitions |
|
|
|
|
Net Operating Income (NOI) is calculated as total property revenues (rental income, tenant reimbursements and other income) less property operating expenses and real estate taxes from the properties owned by the Company. Cash NOI excludes from NOI straight-line rent and amortization of above-/below-market leases. NOI presented by the Company may not be comparable to NOI reported by other REITs that define NOI differently. The Company believes that NOI provides investors with a useful measure of the operating performance of our properties. NOI should not be considered an alternative to net income as an indication of our performance or to cash flows as a measure of the Company's liquidity or its ability to make distributions.
4
|
Table of Contents |
|
|
|
|
|
Overview |
|
|
|
|
|
|
|
|
6 |
|
|
|
|
|
|
|
7 |
|
|
|
|
|
|
Corporate Financials |
|
|
|
|
|
|
|
|
8 |
|
|
|
|
|
|
|
9 |
|
|
|
|
|
|
|
10 |
|
|
|
|
|
|
|
11 |
|
|
|
|
|
|
Debt |
|
|
|
|
|
|
|
|
12 |
|
|
|
|
|
|
|
13 |
|
|
|
|
|
|
Properties |
|
|
|
|
|
|
|
|
14 |
|
|
|
|
|
|
|
16 |
|
|
|
|
|
|
|
17 |
5
|
Corporate Information and Analyst Coverage |
|
|
|
|
|
Corporate Information |
|||
|
|
|
|
|
|
Corporate Headquarters |
Stock Exchange Listing |
Information Requests |
Investor Relations |
|
2101 L Street NW |
New York Stock Exchange |
Please contact ir@easterlyreit.com |
Lindsay Winterhalter, |
|
Suite 650 |
|
or 202-596-3947 to request an |
VP, Investor Relations |
|
Washington, DC 20037 |
Ticker |
Investor Relations package |
& Operations |
|
202-595-9500 |
DEA |
|
|
|
Executive Team |
|
Board of Directors |
|
|
William Trimble III, CEO |
Darrell Crate, Chairman |
William Binnie |
Michael Ibe |
|
Michael Ibe, Vice-Chairman and EVP |
Meghan Baivier, CFO & COO |
Darrell Crate |
James Mead |
|
Alison Bernard, CAO |
Ronald Kendall, EVP |
Cynthia Fisher |
William Trimble III |
|
|
|
Emil Henry Jr. |
|
|
Equity Research Coverage |
|
|
|
|
|
|
|
Citigroup |
Raymond James & Associates |
RBC Capital Markets |
|
Michael Bilerman / Emmanuel Korchman |
Bill Crow / Paul Puryear |
Michael Carroll |
|
212-816-1383 / 212-816-1382 |
727-567-2594 / 727-567-2253 |
440-715-2649 |
|
|
|
|
|
Jefferies |
SunTrust Robinson Humphrey |
|
|
Jonathan Petersen |
Michael R. Lewis |
|
|
212-284-1705 |
212-319-5659 |
|
Any opinions, estimates, forecasts or predictions regarding Easterly Government Properties, Inc.’s performance made by these analysts are theirs alone and do not represent opinions, estimates, forecasts or predictions of Easterly Government Properties, Inc. or its management. Easterly Government Properties, Inc. does not by its reference above or distribution imply its endorsement of or concurrence with such opinions, estimates, forecasts or predictions.
6
|
Executive Summary (Unaudited, in thousands except share and per share amounts) |
|
|
|
|
|
Price of Common Shares |
|
Three months ended March 31, 2017 |
|
|
Earnings |
|
Three months ended March 31, 2017 |
|
|
Three months ended March 31, 2016 |
|
|||
|
High closing price during period |
|
$ |
20.80 |
|
|
Net income available to Easterly Government Properties, Inc. |
|
$ |
1,084 |
|
|
$ |
675 |
|
|
Low closing price during period |
|
$ |
19.25 |
|
|
Net income available to Easterly Government Properties, Inc. |
|
|
|
|
|
|
|
|
|
End of period closing price |
|
$ |
19.79 |
|
|
per share: |
|
|
|
|
|
|
|
|
|
|
|
|
|
|
|
Basic |
|
$ |
0.03 |
|
|
$ |
0.03 |
|
|
|
|
|
|
|
|
Diluted |
|
$ |
0.03 |
|
|
$ |
0.03 |
|
|
Outstanding Classes of Stock and |
|
|
|
|
|
|
|
|
|
|
|
|
|
|
|
Partnership Units - Fully Diluted Basis |
|
At March 31, 2017 |
|
|
Net income |
|
$ |
1,350 |
|
|
$ |
1,109 |
|
|
|
Common shares |
|
|
36,972,610 |
|
|
Net income, per share - fully diluted basis |
|
$ |
0.03 |
|
|
$ |
0.03 |
|
|
Unvested restricted shares |
|
|
18,820 |
|
|
|
|
|
|
|
|
|
|
|
|
Common partnership units outstanding |
|
|
8,958,253 |
|
|
Funds From Operations ("FFO") |
|
$ |
14,410 |
|
|
$ |
11,972 |
|
|
Total - fully diluted basis |
|
|
45,949,683 |
|
|
FFO, per share - fully diluted basis |
|
$ |
0.31 |
|
|
$ |
0.30 |
|
|
|
|
|
|
|
|
|
|
|
|
|
|
|
|
|
|
|
|
|
|
|
|
Funds From Operations, as Adjusted |
|
$ |
13,644 |
|
|
$ |
11,489 |
|
|
Market Capitalization |
|
At March 31, 2017 |
|
|
FFO, as Adjusted, per share - fully diluted basis |
|
$ |
0.30 |
|
|
$ |
0.29 |
|
|
|
Total equity market capitalization - fully diluted basis |
|
$ |
909,344 |
|
|
|
|
|
|
|
|
|
|
|
|
Consolidated debt(1) |
|
|
337,817 |
|
|
Cash Available for Distribution |
|
$ |
12,182 |
|
|
$ |
10,378 |
|
|
Cash and cash equivalents |
|
|
(5,241 |
) |
|
|
|
|
|
|
|
|
|
|
|
Total enterprise value |
|
$ |
1,241,920 |
|
|
|
|
|
|
|
|
|
|
|
|
|
|
|
|
|
|
Liquidity |
|
|
|
|
|
At March 31, 2017 |
|
|
|
|
|
|
|
|
|
Cash and cash equivalents |
|
|
|
|
|
$ |
5,241 |
|
|
Ratios |
|
At March 31, 2017 |
|
|
|
|
|
|
|
|
|
|
|
|
|
Net debt to total enterprise value |
|
|
26.8 |
% |
|
Unsecured revolving credit facility |
|
|
|
|
|
|
|
|
|
Net debt to total equity market capitalization |
|
|
36.6 |
% |
|
Total current facility size (2) |
|
|
|
|
|
$ |
400,000 |
|
|
Net debt to annualized quarterly EBITDA |
|
|
4.9 |
x |
|
Less: outstanding balance |
|
|
|
|
|
|
(158,167 |
) |
|
Cash interest coverage ratio |
|
|
7.7 |
x |
|
Available under unsecured revolving credit facility |
|
|
|
|
|
$ |
241,833 |
|
|
Cash fixed charge coverage ratio |
|
|
5.8 |
x |
|
|
|
|
|
|
|
|
|
|
|
|
|
|
|
|
|
|
|
|
|
|
|
|
|
|
|
|
|
|
|
|
|
|
|
|
|
|
|
|
|
|
|
|
|
|
|
|
|
|
|
|
|
|
|
|
|
|
|
|
|
|
|
|
|
|
|
|
|
|
|
|
|
|
(1)Excludes unamortized premiums / discounts and deferred financing fees.
(2)Credit facility has an accordion feature that provides additional capacity, subject to the satisfaction of customary terms and conditions, of up to $250 million, for a total facility size of not more than $650 million.
7
|
Balance Sheets (In thousands, except share amounts) |
|
|
|
|
|
|
|
March 31, 2017 |
|
|
|
|
|
|
|
|
|
(unaudited) |
|
|
December 31, 2016 |
|
||
|
Assets |
|
|
|
|
|
|
|
|
|
Real estate properties, net |
|
$ |
928,855 |
|
|
$ |
901,066 |
|
|
Cash and cash equivalents |
|
|
5,241 |
|
|
|
4,845 |
|
|
Restricted cash |
|
|
2,005 |
|
|
|
1,646 |
|
|
Deposits on acquisitions |
|
|
8,750 |
|
|
|
1,750 |
|
|
Rents receivable |
|
|
7,913 |
|
|
|
8,544 |
|
|
Accounts receivable |
|
|
5,740 |
|
|
|
5,823 |
|
|
Deferred financing, net |
|
|
1,652 |
|
|
|
2,787 |
|
|
Intangible assets, net |
|
|
111,195 |
|
|
|
113,795 |
|
|
Interest rate swap |
|
|
3,893 |
|
|
|
3,785 |
|
|
Prepaid expenses and other assets |
|
|
3,327 |
|
|
|
1,422 |
|
|
Total assets |
|
$ |
1,078,571 |
|
|
$ |
1,045,463 |
|
|
|
|
|
|
|
|
|
|
|
|
Liabilities |
|
|
|
|
|
|
|
|
|
Revolving credit facility |
|
|
158,167 |
|
|
|
212,167 |
|
|
Term loan facility, net |
|
|
99,097 |
|
|
|
- |
|
|
Mortgage notes payable, net |
|
|
80,054 |
|
|
|
80,806 |
|
|
Intangible liabilities, net |
|
|
40,629 |
|
|
|
41,840 |
|
|
Accounts payable and accrued liabilities |
|
|
12,622 |
|
|
|
13,784 |
|
|
Total liabilities |
|
|
390,569 |
|
|
|
348,597 |
|
|
|
|
|
|
|
|
|
|
|
|
Equity |
|
|
|
|
|
|
|
|
|
Common stock, par value $0.01, 200,000,000 shares authorized, |
|
|
|
|
|
|
|
|
|
36,991,430 and 36,874,810 shares issued and outstanding at March 31, 2017 and December 31, 2016, respectively. |
|
|
370 |
|
|
|
369 |
|
|
Additional paid-in capital |
|
|
599,233 |
|
|
|
596,971 |
|
|
Retained (deficit) |
|
|
2,805 |
|
|
|
1,721 |
|
|
Cumulative dividends |
|
|
(51,671 |
) |
|
|
(42,794 |
) |
|
Accumulated other comprehensive income |
|
|
3,134 |
|
|
|
3,038 |
|
|
Total stockholders' equity |
|
|
553,871 |
|
|
|
559,305 |
|
|
Non-controlling interest in Operating Partnership |
|
|
134,131 |
|
|
|
137,561 |
|
|
Total equity |
|
|
688,002 |
|
|
|
696,866 |
|
|
Total liabilities and equity |
|
$ |
1,078,571 |
|
|
$ |
1,045,463 |
|
8
|
Income Statements (Unaudited, in thousands, except share and per share amounts) |
|
|
|
|
|
|
|
Three Months Ended |
|
|
|||||
|
|
|
March 31, 2017 |
|
|
March 31, 2016 |
|
|
||
|
Revenues |
|
|
|
|
|
|
|
|
|
|
Rental income |
|
$ |
26,020 |
|
|
$ |
21,736 |
|
|
|
Tenant reimbursements |
|
|
3,628 |
|
|
|
2,155 |
|
|
|
Other income |
|
|
239 |
|
|
|
80 |
|
|
|
Total revenues |
|
|
29,887 |
|
|
|
23,971 |
|
|
|
|
|
|
|
|
|
|
|
|
|
|
Operating expenses |
|
|
|
|
|
|
|
|
|
|
Property operating |
|
|
6,349 |
|
|
|
4,333 |
|
|
|
Real estate taxes |
|
|
2,735 |
|
|
|
2,368 |
|
|
|
Depreciation and amortization |
|
|
13,060 |
|
|
|
10,863 |
|
|
|
Acquisition costs |
|
|
532 |
|
|
|
333 |
|
|
|
Corporate general and administrative |
|
|
3,444 |
|
|
|
3,036 |
|
|
|
Total expenses |
|
|
26,120 |
|
|
|
20,933 |
|
|
|
Operating income |
|
|
3,767 |
|
|
|
3,038 |
|
|
|
|
|
|
|
|
|
|
|
|
|
|
Other expenses |
|
|
|
|
|
|
|
|
|
|
Interest expense, net |
|
|
(2,417 |
) |
|
|
(1,929 |
) |
|
|
Net income |
|
|
1,350 |
|
|
|
1,109 |
|
|
|
|
|
|
|
|
|
|
|
|
|
|
Non-controlling interest in Operating Partnership |
|
|
(266 |
) |
|
|
(434 |
) |
|
|
Net income available to Easterly Government |
|
|
|
|
|
|
|
|
|
|
Properties, Inc. |
|
$ |
1,084 |
|
|
$ |
675 |
|
|
|
|
|
|
|
|
|
|
|
|
|
|
Net income available to Easterly Government |
|
|
|
|
|
|
|
|
|
|
Properties, Inc. per share: |
|
|
|
|
|
|
|
|
|
|
Basic |
|
$ |
0.03 |
|
|
$ |
0.03 |
|
|
|
Diluted |
|
$ |
0.03 |
|
|
$ |
0.03 |
|
|
|
|
|
|
|
|
|
|
|
|
|
|
Weighted-average common shares outstanding: |
|
|
|
|
|
|
|
|
|
|
Basic |
|
|
36,891,595 |
|
|
|
24,141,712 |
|
|
|
Diluted |
|
|
39,143,887 |
|
|
|
25,744,824 |
|
|
|
|
|
|
|
|
|
|
|
|
|
|
Net income, per share - fully diluted basis |
|
$ |
0.03 |
|
|
$ |
0.03 |
|
|
|
|
|
|
|
|
|
|
|
|
|
|
Weighted average common shares outstanding - |
|
|
|
|
|
|
|
|
|
|
fully diluted basis |
|
|
45,947,709 |
|
|
|
39,711,818 |
|
|
9
|
Net Operating Income (Unaudited, in thousands) |
|
|
|
|
|
|
|
Three Months Ended |
|
|
|||||
|
|
|
March 31, 2017 |
|
|
March 31, 2016 |
|
|
||
|
Revenue |
|
|
|
|
|
|
|
|
|
|
Rental income |
|
$ |
26,020 |
|
|
$ |
21,736 |
|
|
|
Tenant reimbursements |
|
|
3,628 |
|
|
|
2,155 |
|
|
|
Other income |
|
|
239 |
|
|
|
80 |
|
|
|
Total revenues |
|
|
29,887 |
|
|
|
23,971 |
|
|
|
|
|
|
|
|
|
|
|
|
|
|
Operating Expenses |
|
|
|
|
|
|
|
|
|
|
Property operating |
|
|
6,349 |
|
|
|
4,333 |
|
|
|
Real estate taxes |
|
|
2,735 |
|
|
|
2,368 |
|
|
|
Total expenses |
|
|
9,084 |
|
|
|
6,701 |
|
|
|
Net Operating Income |
|
$ |
20,803 |
|
|
$ |
17,270 |
|
|
|
Adjustments to Net Operating Income: |
|
|
|
|
|
|
|
|
|
|
Straight-line rent |
|
|
(140 |
) |
|
|
(21 |
) |
|
|
Above-/below-market leases |
|
|
(2,112 |
) |
|
|
(1,698 |
) |
|
|
Cash Net Operating Income |
|
$ |
18,551 |
|
|
$ |
15,551 |
|
|
10
|
EBITDA, FFO and CAD (Unaudited, in thousands, except share and per share amounts) |
|
|
|
|
|
|
|
Three Months Ended |
|
|
|||||
|
|
|
March 31, 2017 |
|
|
March 31, 2016 |
|
|
||
|
Net income |
|
$ |
1,350 |
|
|
$ |
1,109 |
|
|
|
Depreciation and amortization |
|
|
13,060 |
|
|
|
10,863 |
|
|
|
Interest expense |
|
|
2,417 |
|
|
|
1,929 |
|
|
|
EBITDA |
|
$ |
16,827 |
|
|
$ |
13,901 |
|
|
|
|
|
|
|
|
|
|
|
|
|
|
|
|
|
|
|
|
|
|
|
|
|
Net income |
|
$ |
1,350 |
|
|
$ |
1,109 |
|
|
|
Depreciation and amortization |
|
|
13,060 |
|
|
|
10,863 |
|
|
|
Funds From Operations (FFO) |
|
$ |
14,410 |
|
|
$ |
11,972 |
|
|
|
Adjustments to FFO: |
|
|
|
|
|
|
|
|
|
|
Acquisition costs |
|
|
532 |
|
|
|
333 |
|
|
|
Straight-line rent |
|
|
(143 |
) |
|
|
(12 |
) |
|
|
Above-/below-market leases |
|
|
(2,112 |
) |
|
|
(1,698 |
) |
|
|
Non-cash interest expense |
|
|
230 |
|
|
|
195 |
|
|
|
Non-cash compensation |
|
|
727 |
|
|
|
699 |
|
|
|
Funds From Operations, as Adjusted |
|
$ |
13,644 |
|
|
$ |
11,489 |
|
|
|
|
|
|
|
|
|
|
|
|
|
|
|
|
|
|
|
|
|
|
|
|
|
FFO, per share - fully diluted basis |
|
$ |
0.31 |
|
|
$ |
0.30 |
|
|
|
FFO, as Adjusted, per share - fully diluted basis |
|
$ |
0.30 |
|
|
$ |
0.29 |
|
|
|
|
|
|
|
|
|
|
|
|
|
|
Funds From Operations, as Adjusted |
|
$ |
13,644 |
|
|
$ |
11,489 |
|
|
|
Acquisition costs |
|
|
(532 |
) |
|
|
(333 |
) |
|
|
Principal amortization |
|
|
(732 |
) |
|
|
(703 |
) |
|
|
Maintenance capital expenditures |
|
|
(185 |
) |
|
|
(66 |
) |
|
|
Contractual tenant improvements |
|
|
(13 |
) |
|
|
(9 |
) |
|
|
Cash Available for Distribution (CAD) |
|
$ |
12,182 |
|
|
$ |
10,378 |
|
|
|
|
|
|
|
|
|
|
|
|
|
|
Weighted average common shares outstanding - |
|
|
|
|
|
|
|
|
|
|
fully diluted basis |
|
|
45,947,709 |
|
|
|
39,711,818 |
|
|
11
|
Debt Schedules (Unaudited, in thousands) |
|
|
|
|
|
Debt Instrument |
Maturity Date |
Stated Rate(2) |
|
March 31, 2017 Balance(4) |
|
March 31, 2017 Percent of Total Indebtedness |
|
|||
|
Unsecured debt |
|
|
|
|
|
|
|
|
|
|
|
Unsecured revolving credit facility(1) |
11-Feb-19(3) |
LIBOR + 140bps |
|
$ |
158,167 |
|
|
46.8% |
|
|
|
Unsecured term loan facility |
29-Sep-23 |
3.12%(5) |
|
|
100,000 |
|
|
29.6% |
|
|
|
|
3.7 years |
|
2.63% |
|
$ |
258,167 |
|
|
76.4% |
|
|
Total unsecured debt |
(wtd-avg maturity) |
(wtd-avg rate) |
|
|
|
|
|
|
|
|
|
|
|
|
|
|
|
|
|
|
|
|
|
Secured mortgage debt |
|
|
|
|
|
|
|
|
|
|
|
ICE - Charleston |
15-Jan-27 |
|
4.21% |
|
$ |
20,647 |
|
|
6.1% |
|
|
USFS II - Albuquerque |
14-Jul-26 |
|
4.46% |
|
|
17,118 |
|
|
5.1% |
|
|
DEA - Pleasanton |
18-Oct-23 |
LIBOR + 150bps |
|
|
15,700 |
|
|
4.6% |
|
|
|
CBP - Savannah |
10-Jul-33 |
|
3.40% |
|
|
14,736 |
|
|
4.4% |
|
|
MEPCOM - Jacksonville |
14-Oct-25 |
|
4.41% |
|
|
11,449 |
|
|
3.4% |
|
|
|
10.1 years |
|
3.76% |
|
$ |
79,650 |
|
|
23.6% |
|
|
Total secured mortgage debt |
(wtd-avg maturity) |
(wtd-avg rate) |
|
|
|
|
|
|
|
|
|
Debt Statistics |
March 31, 2017 |
|
|
|
Variable rate debt - unhedged |
$ |
173,867 |
|
|
Fixed rate debt |
|
163,950 |
|
|
Total debt(4) |
$ |
337,817 |
|
|
|
|
|
|
|
% Variable rate debt - unhedged |
|
51.5 |
% |
|
% Fixed rate debt |
|
48.5 |
% |
|
|
|
|
|
|
Weighted average maturity |
5.2 years |
|
|
|
Weighted average interest rate |
|
2.9 |
% |
(1)Credit facility has available capacity of $241,833 as of March 31, 2017.
(2)Average stated rates represent the weighted average interest rate at March 31, 2017.
(3)Credit facility has two six-month as-of-right extension options subject to certain conditions and the payment of an extension fee.
(4)Excludes unamortized premiums / discounts and deferred financing fees.
(5)Entered into two interest rate swaps with an effective date of March 29, 2017 with an aggregate notional value of $100 million to effectively fix the interest rate at 3.12% annually based on the company’s current leverage ratio.
12
|
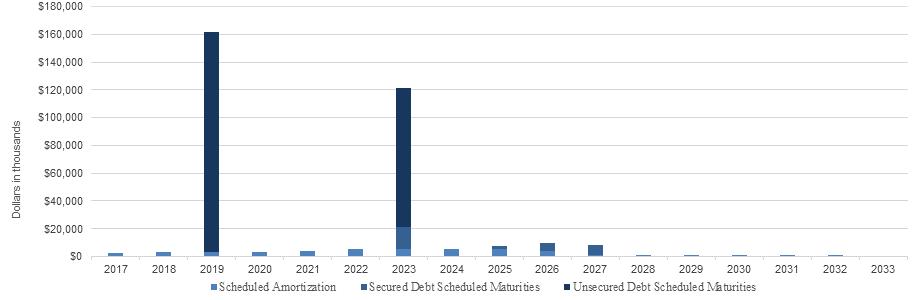
Debt Maturities (As of March 31, 2017, unaudited, in thousands) |
|
|
|
|
|
|
|
Secured Debt |
|
|
Unsecured Debt |
|
|
|
|
|
|
|
|
|
|
Weighted Average |
|
|||||||
|
Year |
|
Scheduled Amortization |
|
|
Scheduled Maturities |
|
|
Scheduled Maturities |
|
|
Total |
|
|
Percentage of Debt Maturing |
|
|
Interest Rate of Scheduled Maturities |
|
||||||
|
2017 |
|
|
2,244 |
|
|
- |
|
|
- |
|
|
|
2,244 |
|
|
|
0.7% |
|
|
- |
|
|||
|
2018 |
|
|
3,100 |
|
|
- |
|
|
- |
|
|
|
3,100 |
|
|
|
0.9% |
|
|
- |
|
|||
|
2019 |
|
|
3,229 |
|
|
- |
|
|
|
158,167 |
|
|
|
161,396 |
|
|
|
47.8% |
|
|
|
2.31% |
|
|
|
2020 |
|
|
3,395 |
|
|
- |
|
|
- |
|
|
|
3,395 |
|
|
|
1.0% |
|
|
- |
|
|||
|
2021 |
|
|
4,054 |
|
|
- |
|
|
- |
|
|
|
4,054 |
|
|
|
1.2% |
|
|
- |
|
|||
|
2022 |
|
|
5,109 |
|
|
- |
|
|
- |
|
|
|
5,109 |
|
|
|
1.5% |
|
|
- |
|
|||
|
2023 |
|
|
5,388 |
|
|
|
15,700 |
|
|
|
100,000 |
|
|
|
121,088 |
|
|
|
35.8% |
|
|
|
3.01% |
|
|
2024 |
|
|
5,679 |
|
|
- |
|
|
- |
|
|
|
5,679 |
|
|
|
1.7% |
|
|
- |
|
|||
|
2025 |
|
|
5,633 |
|
|
|
1,917 |
|
|
- |
|
|
|
7,550 |
|
|
|
2.2% |
|
|
|
4.41% |
|
|
|
2026 |
|
|
3,686 |
|
|
|
6,368 |
|
|
- |
|
|
|
10,054 |
|
|
|
3.0% |
|
|
|
4.46% |
|
|
|
2027 |
|
|
1,093 |
|
|
|
7,140 |
|
|
- |
|
|
|
8,233 |
|
|
|
2.4% |
|
|
|
4.21% |
|
|
|
2028 |
|
|
983 |
|
|
- |
|
|
- |
|
|
|
983 |
|
|
|
0.3% |
|
|
- |
|
|||
|
2029 |
|
|
1,016 |
|
|
- |
|
|
- |
|
|
|
1,016 |
|
|
|
0.3% |
|
|
- |
|
|||
|
2030 |
|
|
1,049 |
|
|
- |
|
|
- |
|
|
|
1,049 |
|
|
|
0.3% |
|
|
- |
|
|||
|
2031 |
|
|
1,083 |
|
|
- |
|
|
- |
|
|
|
1,083 |
|
|
|
0.3% |
|
|
- |
|
|||
|
2032 |
|
|
1,116 |
|
|
- |
|
|
- |
|
|
|
1,116 |
|
|
|
0.3% |
|
|
- |
|
|||
|
2033 |
|
|
668 |
|
|
- |
|
|
- |
|
|
|
668 |
|
|
|
0.2% |
|
|
- |
|
|||
|
Total |
$ |
|
48,525 |
|
$ |
|
31,125 |
|
$ |
|
258,167 |
|
$ |
|
337,817 |
|
|
|
100.0% |
|
|
|
|
|
13
|
Operating Property Overview (As of March 31, 2017, unaudited) |
|
|
|
|
|
Property Name |
|
Location |
|
Property Type |
|
Tenant Lease Expiration Year |
|
Year Built / Renovated |
|
Rentable Square Feet |
|
|
Annualized Lease Income |
|
|
Percentage of Total Annualized Lease Income |
|
|
Annualized Lease Income per Leased Square Foot |
|
||||
|
|
|
|
|
|
|
|
|
|
|
|
|
|
|
|
|
|
|
|
|
|
|
|
|
|
|
U.S. Government Leased Properties |
|
|
|
|
|
|
|
|
|
|
|
|
|
|
|
|
|
|
|
|
|
|
|
|
|
IRS - Fresno |
|
Fresno, CA |
|
Office |
|
2018 |
|
2003 |
|
|
180,481 |
|
|
$ |
7,505,037 |
|
|
|
7.2 |
% |
|
$ |
41.58 |
|
|
PTO - Arlington |
|
Arlington, VA |
|
Office |
|
2019 / 2020 |
|
2009 |
|
|
189,871 |
|
|
|
6,469,073 |
|
|
|
6.2 |
% |
|
|
34.07 |
|
|
FBI - San Antonio |
|
San Antonio, TX |
|
Office |
|
2021 |
|
2007 |
|
|
148,584 |
|
|
|
5,037,895 |
|
|
|
4.8 |
% |
|
|
33.91 |
|
|
FBI - Omaha |
|
Omaha, NE |
|
Office |
|
2024 |
|
2009 |
|
|
112,196 |
|
|
|
4,569,876 |
|
|
|
4.4 |
% |
|
|
40.73 |
|
|
EPA - Kansas City |
|
Kansas City, KS |
|
Laboratory |
|
2023 |
|
2003 |
|
|
71,979 |
|
|
|
3,840,990 |
|
|
|
3.7 |
% |
|
|
53.36 |
|
|
ICE - Charleston |
|
North Charleston, SC |
|
Office |
|
2019 / 2027 |
|
1994 / 2012 |
|
|
86,733 |
|
|
|
3,679,523 |
|
|
|
3.5 |
% |
|
|
42.42 |
|
|
DOT - Lakewood |
|
Lakewood, CO |
|
Office |
|
2024 |
|
2004 |
|
|
122,225 |
|
|
|
3,477,277 |
|
|
|
3.3 |
% |
|
|
28.45 |
|
|
USCIS - Lincoln |
|
Lincoln, NE |
|
Office |
|
2020 |
|
2005 |
|
|
137,671 |
|
|
|
3,246,285 |
|
|
|
3.1 |
% |
|
|
23.58 |
|
|
AOC - El Centro |
|
El Centro, CA |
|
Courthouse/Office |
|
2019 |
|
2004 |
|
|
46,813 |
|
|
|
3,041,909 |
|
|
|
2.9 |
% |
|
|
64.98 |
|
|
FBI - Birmingham |
|
Birmingham, AL |
|
Office |
|
2020 |
|
2005 |
|
|
96,278 |
|
|
|
3,011,442 |
|
|
|
2.9 |
% |
|
|
31.28 |
|
|
OSHA - Sandy |
|
Sandy, UT |
|
Laboratory |
|
2024 |
|
2003 |
|
|
75,000 |
|
|
|
2,988,673 |
|
|
|
2.9 |
% |
|
|
39.85 |
|
|
USFS II - Albuquerque |
|
Albuquerque, NM |
|
Office |
|
2026 |
|
2011 |
|
|
98,720 |
|
|
|
2,795,973 |
|
|
|
2.7 |
% |
|
|
28.32 |
|
|
ICE - Albuquerque |
|
Albuquerque, NM |
|
Office |
|
2027 |
|
2011 |
|
|
71,100 |
|
|
|
2,794,202 |
|
|
|
2.7 |
% |
|
|
39.30 |
|
|
DEA - Vista |
|
Vista, CA |
|
Laboratory |
|
2020 |
|
2002 |
|
|
54,119 |
|
|
|
2,761,077 |
|
|
|
2.6 |
% |
|
|
51.02 |
|
|
DEA - Pleasanton |
|
Pleasanton, CA |
|
Laboratory |
|
2035 |
|
2015 |
|
|
42,480 |
|
|
|
2,730,965 |
|
|
|
2.6 |
% |
|
|
64.29 |
|
|
FBI - Richmond |
|
Richmond, VA |
|
Office |
|
2021 |
|
2001 |
|
|
96,607 |
|
|
|
2,722,216 |
|
|
|
2.6 |
% |
|
|
28.18 |
|
|
USFS I - Albuquerque |
|
Albuquerque, NM |
|
Office |
|
2021 |
|
2006 |
|
|
92,455 |
|
|
|
2,679,124 |
|
|
|
2.6 |
% |
|
|
28.98 |
|
|
AOC - Del Rio |
|
Del Rio, TX |
|
Courthouse/Office |
|
2024 |
|
1992 / 2004 |
|
|
89,880 |
|
|
|
2,641,487 |
|
|
|
2.5 |
% |
|
|
29.39 |
|
|
DEA - Dallas Lab |
|
Dallas, TX |
|
Laboratory |
|
2021 |
|
2001 |
|
|
49,723 |
|
|
|
2,395,557 |
|
|
|
2.3 |
% |
|
|
48.18 |
|
|
MEPCOM - Jacksonville |
|
Jacksonville, FL |
|
Office |
|
2025 |
|
2010 |
|
|
30,000 |
|
|
|
2,180,208 |
|
|
|
2.1 |
% |
|
|
72.67 |
|
|
FBI - Little Rock |
|
Little Rock, AR |
|
Office |
|
2021 |
|
2001 |
|
|
101,977 |
|
|
|
2,145,210 |
|
|
|
2.1 |
% |
|
|
21.04 |
|
|
CBP - Savannah |
|
Savannah, GA |
|
Laboratory |
|
2033 |
|
2013 |
|
|
35,000 |
|
|
|
2,109,303 |
|
|
|
2.0 |
% |
|
|
60.27 |
|
|
FBI - Albany |
|
Albany, NY |
|
Office |
|
2018 |
|
1998 |
|
|
98,184 |
|
|
|
2,097,557 |
|
|
|
2.0 |
% |
|
|
21.36 |
|
|
DEA - Santa Ana |
|
Santa Ana, CA |
|
Office |
|
2024 |
|
2004 |
|
|
39,905 |
|
|
|
2,062,177 |
|
|
|
2.0 |
% |
|
|
51.68 |
|
|
DOE - Lakewood |
|
Lakewood, CO |
|
Office |
|
2029 |
|
1999 |
|
|
115,650 |
|
|
|
2,061,963 |
|
|
|
2.0 |
% |
|
|
17.83 |
|
|
DEA - Dallas |
|
Dallas, TX |
|
Office |
|
2021 |
|
2001 |
|
|
71,827 |
|
|
|
1,784,468 |
|
|
|
1.7 |
% |
|
|
24.84 |
|
|
NPS - Omaha |
|
Omaha, NE |
|
Office |
|
2024 |
|
2004 |
|
|
62,772 |
|
|
|
1,743,642 |
|
|
|
1.7 |
% |
|
|
27.78 |
|
|
DEA - North Highlands |
|
Sacramento, CA |
|
Office |
|
2017 |
|
2002 |
|
|
37,975 |
|
|
|
1,707,569 |
|
|
|
1.6 |
% |
|
|
44.97 |
|
|
CBP - Chula Vista |
|
Chula Vista, CA |
|
Office |
|
2018 |
|
1998 |
|
|
59,397 |
|
|
|
1,699,750 |
|
|
|
1.6 |
% |
|
|
28.62 |
|
|
ICE - Otay |
|
San Diego, CA |
|
Office |
|
2022 / 2026 |
|
2001 |
|
|
52,881 |
|
|
|
1,699,352 |
|
|
|
1.6 |
% |
|
|
34.36 |
|
14
|
Operating Property Overview (Cont.) (As of March 31, 2017, unaudited) |
|
|
|
|
|
Property Name |
|
Location |
|
Property Type |
|
Tenant Lease Expiration Year |
|
Year Built / Renovated |
|
Rentable Square Feet |
|
|
Annualized Lease Income |
|
|
Percentage of Total Annualized Lease Income |
|
|
Annualized Lease Income per Leased Square Foot |
|
||||
|
|
|
|
|
|
|
|
|
|
|
|
|
|
|
|
|
|
|
|
|
|
|
|
|
|
|
U.S. Government Leased Properties (Cont.) |
|
|
|
|
|
|
|
|
|
|
|
|
|
|
|
|
|
|
|
|
|
|
|
|
|
CBP - Sunburst |
|
Sunburst, MT |
|
Office |
|
2028 |
|
2008 |
|
|
33,000 |
|
|
|
1,588,434 |
|
|
|
1.5 |
% |
|
|
48.13 |
|
|
USCG - Martinsburg |
|
Martinsburg, WV |
|
Office |
|
2027 |
|
2007 |
|
|
59,547 |
|
|
|
1,569,244 |
|
|
|
1.5 |
% |
|
|
26.35 |
|
|
AOC - Aberdeen |
|
Aberdeen, MS |
|
Courthouse/Office |
|
2025 |
|
2005 |
|
|
46,979 |
|
|
|
1,459,277 |
|
|
|
1.4 |
% |
|
|
31.06 |
|
|
DEA - Birmingham |
|
Birmingham, AL |
|
Office |
|
2020 |
|
2005 |
|
|
35,616 |
|
|
|
1,392,369 |
|
|
|
1.3 |
% |
|
|
39.09 |
|
|
DEA - Albany |
|
Albany, NY |
|
Office |
|
2025 |
|
2004 |
|
|
31,976 |
|
|
|
1,339,760 |
|
|
|
1.3 |
% |
|
|
41.90 |
|
|
DEA - Otay |
|
San Diego, CA |
|
Office |
|
2017 |
|
1997 |
|
|
32,560 |
|
|
|
1,293,126 |
|
|
|
1.2 |
% |
|
|
39.72 |
|
|
DEA - Riverside |
|
Riverside, CA |
|
Office |
|
2017 |
|
1997 |
|
|
34,354 |
|
|
|
1,290,383 |
|
|
|
1.2 |
% |
|
|
37.56 |
|
|
AOC - South Bend |
|
South Bend, IN |
|
Courthouse/Office |
|
2027 |
|
1996 / 2011 |
|
|
30,119 |
|
|
|
819,555 |
|
|
|
0.8 |
% |
|
|
27.21 |
|
|
SSA - Mission Viejo |
|
Mission Viejo, CA |
|
Office |
|
2020 |
|
2005 |
|
|
11,590 |
|
|
|
535,274 |
|
|
|
0.5 |
% |
|
|
46.18 |
|
|
SSA - San Diego |
|
San Diego, CA |
|
Office |
|
2032 |
|
2003 |
|
|
10,856 |
|
|
|
442,291 |
|
|
|
0.4 |
% |
|
|
43.97 |
|
|
DEA - San Diego |
|
San Diego, CA |
|
Warehouse |
|
2017 |
|
1999 |
|
|
16,100 |
|
|
|
404,096 |
|
|
|
0.4 |
% |
|
|
25.10 |
|
|
Subtotal |
|
|
|
|
|
|
|
|
|
|
2,911,180 |
|
|
$ |
101,813,589 |
|
|
|
97.4 |
% |
|
$ |
35.02 |
|
|
|
|
|
|
|
|
|
|
|
|
|
|
|
|
|
|
|
|
|
|
|
|
|
|
|
|
Privately Leased Properties |
|
|
|
|
|
|
|
|
|
|
|
|
|
|
|
|
|
|
|
|
|
|
|
|
|
2650 SW 145th Avenue - Parbel of Florida |
|
Miramar, FL |
|
Warehouse/Distribution |
|
2018 |
|
2007 |
|
|
81,721 |
|
|
|
1,669,092 |
|
|
|
1.6 |
% |
|
|
20.42 |
|
|
5998 Osceola Court - United Technologies |
|
Midland, GA |
|
Warehouse/Manufacturing |
|
2023 |
|
2014 |
|
|
105,641 |
|
|
|
538,932 |
|
|
|
0.5 |
% |
|
|
5.10 |
|
|
501 East Hunter Street - Lummus Corporation |
|
Lubbock, TX |
|
Warehouse/Distribution |
|
2028 |
|
2013 |
|
|
70,078 |
|
|
|
521,472 |
|
|
|
0.5 |
% |
|
|
7.44 |
|
|
Subtotal |
|
|
|
|
|
|
|
|
|
|
257,440 |
|
|
$ |
2,729,496 |
|
|
|
2.6 |
% |
|
$ |
10.60 |
|
|
|
|
|
|
|
|
|
|
|
|
|
|
|
|
|
|
|
|
|
|
|
|
|
|
|
|
Total / Weighted Average |
|
|
|
|
|
|
|
|
|
|
3,168,620 |
|
|
$ |
104,543,085 |
|
|
|
100.0 |
% |
|
$ |
33.04 |
|
|
|
|
|
|
|
|
|
|
|
|
|
|
|
|
|
|
|
|
|
|
|
|
|
|
|
15
|
Tenants (As of March 31, 2017, unaudited) |
|
|
|
|
|
Tenant |
|
Number of Properties |
|
|
Number of Leases |
|
|
Weighted Average Remaining Lease Term(1) |
|
|
Leased Square Feet |
|
|
Percentage of Leased Square Feet |
|
|
Annualized Lease Income |
|
|
Percentage of Total Annualized Lease Income |
|
|||||||
|
|
|
|
|
|
|
|
|
|
|
|
|
|
|
|
|
|
|
|
|
|
|
|
|
|
|
|
|
|
|
U.S. Government |
|
|
|
|
|
|
|
|
|
|
|
|
|
|
|
|
|
|
|
|
|
|
|
|
|
|
|
|
|
Federal Bureau of Investigation ("FBI") |
|
|
6 |
|
|
|
6 |
|
|
|
4.2 |
|
|
|
653,826 |
|
|
|
20.7 |
% |
|
$ |
19,584,196 |
|
|
|
18.7 |
% |
|
Drug Enforcement Administration ("DEA") |
|
|
11 |
|
|
|
11 |
|
|
|
5.0 |
|
|
|
432,142 |
|
|
|
13.7 |
% |
|
|
18,591,348 |
|
|
|
17.8 |
% |
|
Administrative Office of the U.S. Courts ("AOC") |
|
|
4 |
|
|
|
4 |
|
|
|
6.6 |
|
|
|
213,791 |
|
|
|
6.8 |
% |
|
|
7,962,228 |
|
|
|
7.6 |
% |
|
Immigration and Customs Enforcement ("ICE") |
|
|
3 |
|
|
|
3 |
|
|
|
8.6 |
|
|
|
182,522 |
|
|
|
5.8 |
% |
|
|
7,564,587 |
|
|
|
7.2 |
% |
|
Internal Revenue Service ("IRS") |
|
|
1 |
|
|
|
1 |
|
|
|
1.7 |
|
|
|
180,481 |
|
|
|
5.7 |
% |
|
|
7,505,037 |
|
|
|
7.2 |
% |
|
Patent and Trademark Office ("PTO") |
|
|
1 |
|
|
|
2 |
|
|
|
2.1 |
|
|
|
189,871 |
|
|
|
6.0 |
% |
|
|
6,469,073 |
|
|
|
6.2 |
% |
|
U.S. Forest Service ("USFS") |
|
|
2 |
|
|
|
2 |
|
|
|
6.9 |
|
|
|
191,175 |
|
|
|
6.0 |
% |
|
|
5,475,097 |
|
|
|
5.2 |
% |
|
Customs and Border Protection ("CBP") |
|
|
3 |
|
|
|
3 |
|
|
|
8.0 |
|
|
|
127,397 |
|
|
|
4.0 |
% |
|
|
5,397,487 |
|
|
|
5.2 |
% |
|
Environmental Protection Agency ("EPA") |
|
|
1 |
|
|
|
1 |
|
|
|
6.0 |
|
|
|
71,979 |
|
|
|
2.3 |
% |
|
|
3,840,990 |
|
|
|
3.7 |
% |
|
Department of Transportation ("DOT") |
|
|
1 |
|
|
|
2 |
|
|
|
7.1 |
|
|
|
129,659 |
|
|
|
4.1 |
% |
|
|
3,733,748 |
|
|
|
3.6 |
% |
|
U.S. Citizenship and Immigration Services ("USCIS") |
|
|
1 |
|
|
|
1 |
|
|
|
3.4 |
|
|
|
137,671 |
|
|
|
4.4 |
% |
|
|
3,246,285 |
|
|
|
3.1 |
% |
|
Occupational Safety and Health Administration ("OSHA") |
|
|
1 |
|
|
|
1 |
|
|
|
6.8 |
|
|
|
75,000 |
|
|
|
2.4 |
% |
|
|
2,988,673 |
|
|
|
2.8 |
% |
|
Military Entrance Processing Command ("MEPCOM") |
|
|
1 |
|
|
|
1 |
|
|
|
8.5 |
|
|
|
30,000 |
|
|
|
0.9 |
% |
|
|
2,180,208 |
|
|
|
2.1 |
% |
|
Department of Energy ("DOE") |
|
|
1 |
|
|
|
1 |
|
|
|
12.6 |
|
|
|
115,650 |
|
|
|
3.6 |
% |
|
|
2,061,963 |
|
|
|
2.0 |
% |
|
National Park Service ("NPS") |
|
|
1 |
|
|
|
1 |
|
|
|
7.2 |
|
|
|
62,772 |
|
|
|
2.0 |
% |
|
|
1,743,642 |
|
|
|
1.7 |
% |
|
U.S. Coast Guard ("USCG") |
|
|
1 |
|
|
|
1 |
|
|
|
10.7 |
|
|
|
59,547 |
|
|
|
1.9 |
% |
|
|
1,569,244 |
|
|
|
1.5 |
% |
|
Social Security Administration ("SSA") |
|
|
2 |
|
|
|
2 |
|
|
|
9.3 |
|
|
|
21,649 |
|
|
|
0.7 |
% |
|
|
977,565 |
|
|
|
0.9 |
% |
|
Bureau of Alcohol, Tobacco, Firearms and Explosives (“ATF”)(2) |
|
|
0 |
|
|
|
0 |
|
|
|
3.7 |
|
|
|
8,680 |
|
|
|
0.3 |
% |
|
|
339,335 |
|
|
|
0.3 |
% |
|
U.S. Department of Agriculture ("USDA") |
|
|
0 |
|
|
|
1 |
|
|
|
8.8 |
|
|
|
1,538 |
|
|
|
0.0 |
% |
|
|
53,061 |
|
|
|
0.1 |
% |
|
Subtotal |
|
|
41 |
|
|
|
44 |
|
|
|
5.6 |
|
|
|
2,885,350 |
|
|
|
91.3 |
% |
|
$ |
101,283,767 |
|
|
|
96.9 |
% |
|
|
|
|
|
|
|
|
|
|
|
|
|
|
|
|
|
|
|
|
|
|
|
|
|
|
|
|
|
|
|
Private Tenants |
|
|
|
|
|
|
|
|
|
|
|
|
|
|
|
|
|
|
|
|
|
|
|
|
|
|
|
|
|
Parbel of Florida |
|
|
1 |
|
|
|
1 |
|
|
|
0.9 |
|
|
|
81,721 |
|
|
|
2.6 |
% |
|
$ |
1,669,092 |
|
|
|
1.6 |
% |
|
United Technologies (Pratt & Whitney) |
|
|
1 |
|
|
|
1 |
|
|
|
6.8 |
|
|
|
105,641 |
|
|
|
3.2 |
% |
|
|
538,932 |
|
|
|
0.5 |
% |
|
LifePoint, Inc. |
|
|
0 |
|
|
|
1 |
|
|
|
2.5 |
|
|
|
21,609 |
|
|
|
0.7 |
% |
|
|
529,822 |
|
|
|
0.5 |
% |
|
Lummus Corporation |
|
|
1 |
|
|
|
1 |
|
|
|
11.3 |
|
|
|
70,078 |
|
|
|
2.2 |
% |
|
|
521,472 |
|
|
|
0.5 |
% |
|
Subtotal |
|
|
3 |
|
|
|
4 |
|
|
|
5.9 |
|
|
|
279,049 |
|
|
|
8.7 |
% |
|
$ |
3,259,318 |
|
|
|
3.1 |
% |
|
|
|
|
|
|
|
|
|
|
|
|
|
|
|
|
|
|
|
|
|
|
|
|
|
|
|
|
|
|
|
Total / Weighted Average |
|
|
44 |
|
|
|
48 |
|
|
|
5.7 |
|
|
|
3,164,399 |
|
|
|
100.0 |
% |
|
$ |
104,543,085 |
|
|
|
100.0 |
% |
(1)Weighted based on leased square feet.
(2)ATF occupies the first floor of the DEA – Birmingham building in a joint lease with the DEA.
16
|
Lease Expirations (As of March 31, 2017, unaudited) |
|
|
|
|
|
Year of Lease Expiration |
|
Number of Leases Expiring |
|
|
Square Footage Expiring |
|
|
Percentage of Total Square Footage Expiring |
|
|
Annualized Lease Income Expiring |
|
|
Percentage of Total Annualized Lease Income Expiring |
|
|
Annualized Lease Income per Leased Square Foot Expiring |
|
||||||
|
2017 |
|
|
4 |
|
|
|
120,989 |
|
|
|
3.8 |
% |
|
$ |
4,695,174 |
|
|
|
4.5 |
% |
|
$ |
38.81 |
|
|
2018 |
|
|
4 |
|
|
|
419,783 |
|
|
|
13.3 |
% |
|
|
12,971,436 |
|
|
|
12.4 |
% |
|
|
30.90 |
|
|
2019 |
|
|
3 |
|
|
|
236,890 |
|
|
|
7.5 |
% |
|
|
9,276,771 |
|
|
|
8.9 |
% |
|
|
39.16 |
|
|
2020 |
|
|
7 |
|
|
|
356,677 |
|
|
|
11.3 |
% |
|
|
11,710,480 |
|
|
|
11.2 |
% |
|
|
32.83 |
|
|
2021 |
|
|
6 |
|
|
|
561,173 |
|
|
|
17.7 |
% |
|
|
16,764,470 |
|
|
|
16.0 |
% |
|
|
29.87 |
|
|
2022 |
|
|
2 |
|
|
|
47,919 |
|
|
|
1.5 |
% |
|
|
1,646,291 |
|
|
|
1.6 |
% |
|
|
34.36 |
|
|
2023 |
|
|
2 |
|
|
|
177,620 |
|
|
|
5.6 |
% |
|
|
4,379,922 |
|
|
|
4.2 |
% |
|
|
24.66 |
|
|
2024 |
|
|
6 |
|
|
|
501,978 |
|
|
|
15.9 |
% |
|
|
17,483,132 |
|
|
|
16.7 |
% |
|
|
34.83 |
|
|
2025 |
|
|
3 |
|
|
|
108,955 |
|
|
|
3.4 |
% |
|
|
4,979,245 |
|
|
|
4.8 |
% |
|
|
45.70 |
|
|
2026 |
|
|
2 |
|
|
|
100,258 |
|
|
|
3.2 |
% |
|
|
2,849,034 |
|
|
|
2.7 |
% |
|
|
28.42 |
|
|
Thereafter |
|
|
9 |
|
|
|
532,157 |
|
|
|
16.8 |
% |
|
|
17,787,130 |
|
|
|
17.0 |
% |
|
|
33.42 |
|
|
Total / Weighted Average |
|
|
48 |
|
|
|
3,164,399 |
|
|
|
100.0 |
% |
|
$ |
104,543,085 |
|
|
|
100.0 |
% |
|
$ |
33.04 |
|
17