Attached files
| file | filename |
|---|---|
| 8-K - 8-K - Delek Logistics Partners, LP | dkl-8kxinvestorpresentatio.htm |
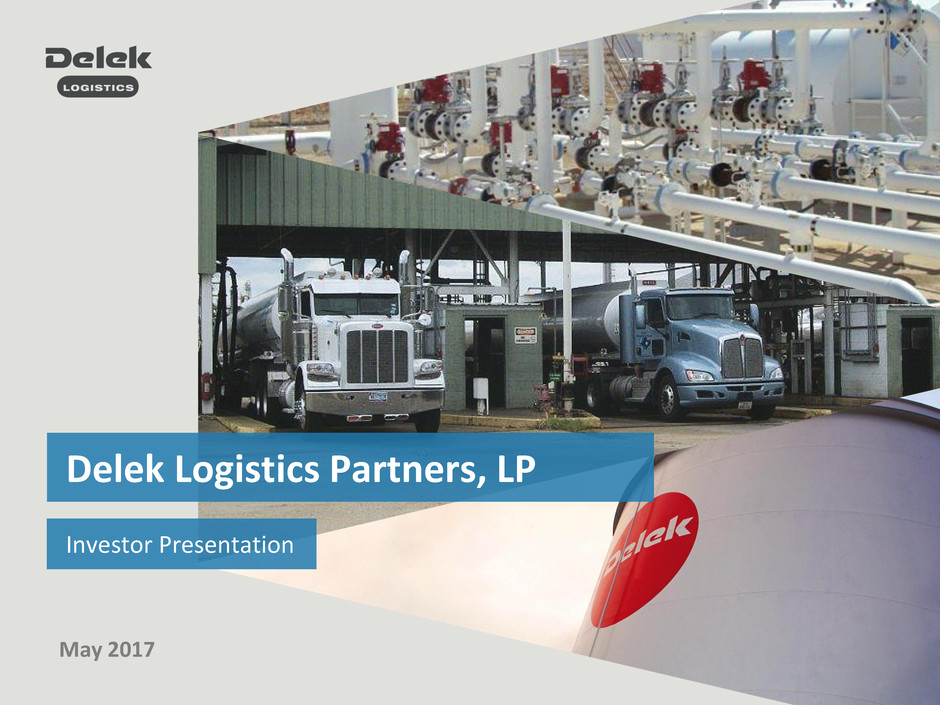
Delek Logistics Partners, LP
Investor Presentation
May 2017
These slides and any accompanying oral and written presentations contain forward-looking statements by Delek Logistics Partners, LP (defined as “we”, “our”, or
”Delek Logistics”) that are based upon our current expectations and involve a number of risks and uncertainties. Statements concerning current estimates,
expectations and projections about our future results, performance, prospects and opportunities and other statements, concerns, or matters that are not
historical facts are "forward-looking statements," as that term is defined under United States securities laws.
Investors are cautioned that the following important factors, among others, may affect these forward-looking statements: our substantial dependence on Delek
US Holdings, Inc. (“Delek US”) (NYSE: DK) or its assignees and their respective ability to pay us under our commercial agreements; risks and costs relating to the
age and operational hazards of our assets including, without limitation, costs, penalties, regulatory or legal actions and other affects related to releases, spills and
other hazards inherent in transporting and storing crude oil and intermediate and finished petroleum products; the timing and extent of changes in commodity
prices and demand for crude oil and refined products; the suspension, reduction or termination of Delek US‘s or its assignees' or any third-party's obligations
under our commercial agreements; as it relates to potential future growth opportunities and other potential benefits for Delek Logistics, the risks and
uncertainties related to the expected timing and likelihood of completion of the proposed merger between Delek US and Alon USA Energy, Inc.
(“Alon”)(NYSE:ALJ), including the timing, receipt and terms and conditions of any required governmental and regulatory approvals of the proposed merger that
could reduce anticipated benefits or cause the parties to abandon the transaction, the ability to successfully integrate the businesses of Delek US and Alon, the
occurrence of any event, change or other circumstances that could give rise to the termination of the merger agreement, the possibility that stockholders of
Delek US may not approve the issuance of new shares of common stock as consideration for the merger or that stockholders of Alon may not approve the merger
agreement, the risk that the parties may not be able to satisfy the conditions to the proposed transaction in a timely manner or at all, risks related to disruption
of management time from ongoing business operations due to the proposed transaction, the risk that problems may arise in successfully integrating the
businesses of the companies, which may result in the combined company not operating as effectively and efficiently as expected, the risk that the combined
company may be unable to achieve cost-cutting synergies or it may take longer than expected to achieve those synergies and other factors discussed in our other
filings with the United States Securities and Exchange Commission.
Forward-looking statements should not be read as a guarantee of future performance or results and will not be accurate indications of the times at, or by which
such performance or results will be achieved. Forward-looking information is based on information available at the time and/or management's good faith belief
with respect to future events, and is subject to risks and uncertainties that could cause actual performance or results to differ materially from those expressed in
the statements. We undertake no obligation to update or revise any such forward-looking statements.
Non-GAAP Disclosures:
Delek Logistics believes that the presentation of EBITDA, distributable cash flow and distribution coverage ratio provide useful information to investors in
assessing its financial condition, its results of operations and cash flow its business is generating. EBITDA, distributable cash flow and distribution coverage ratio
should not be considered in isolation or as alternatives to net income, operating income, cash from operations or any other measure of financial performance or
liquidity presented in accordance with U.S. GAAP. EBITDA, distributable cash flow and distribution coverage ratio have important limitations as analytical tools
because they exclude some, but not all items that affect net income and net cash provided by operating activities. Additionally, because EBITDA and distributable
cash flow may be defined differently by other partnerships in its industry, Delek Logistics' definitions of EBITDA and distributable cash flow may not be
comparable to similarly titled measures of other partnerships. Please see the appendix for a reconciliation of EBITDA, and distributable cash flow to their most
directly comparable financial measures calculated and presented in accordance with U.S. GAAP.
Disclaimers
3
Chairman and Chief Executive Officer
Director, Executive Vice President and Chief Financial Officer (1)
Executive Vice President
Uzi Yemin
Assi Ginzburg
Mark Smith
Executive Vice President and Chief Financial Officer (1) Kevin Kremke
(1) Effective June 1, 2017, Kevin Kremke will replace Assi Ginzburg as Chief Financial Officer.
Management Presenters
Agenda
4
Sponsor Overview
Delek Logistics Overview
Stable Assets and Long-Term Minimum Volume Commitments
Assets Positioned for Permian Basin Growth
Financial Overview
Appendix
Sponsor Overview
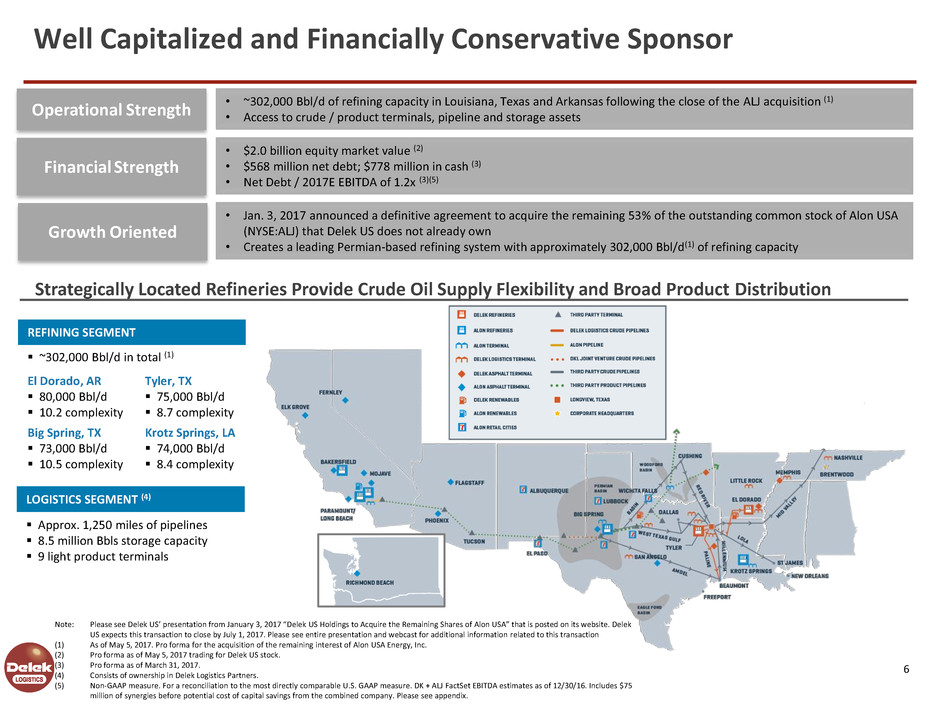
• ~302,000 Bbl/d of refining capacity in Louisiana, Texas and Arkansas following the close of the ALJ acquisition (1)
• Access to crude / product terminals, pipeline and storage assets Operational Strength
Note: Please see Delek US’ presentation from January 3, 2017 “Delek US Holdings to Acquire the Remaining Shares of Alon USA” that is posted on its website. Delek
US expects this transaction to close by July 1, 2017. Please see entire presentation and webcast for additional information related to this transaction
(1) As of May 5, 2017. Pro forma for the acquisition of the remaining interest of Alon USA Energy, Inc.
(2) Pro forma as of May 5, 2017 trading for Delek US stock.
(3) Pro forma as of March 31, 2017.
(4) Consists of ownership in Delek Logistics Partners.
(5) Non-GAAP measure. For a reconciliation to the most directly comparable U.S. GAAP measure. DK + ALJ FactSet EBITDA estimates as of 12/30/16. Includes $75
million of synergies before potential cost of capital savings from the combined company. Please see appendix.
Strategically Located Refineries Provide Crude Oil Supply Flexibility and Broad Product Distribution
• $2.0 billion equity market value (2)
• $568 million net debt; $778 million in cash (3)
• Net Debt / 2017E EBITDA of 1.2x (3)(5)
Financial Strength
REFINING SEGMENT
~302,000 Bbl/d in total (1)
El Dorado, AR
80,000 Bbl/d
10.2 complexity
Tyler, TX
75,000 Bbl/d
8.7 complexity
Approx. 1,250 miles of pipelines
8.5 million Bbls storage capacity
9 light product terminals
LOGISTICS SEGMENT (4)
• Jan. 3, 2017 announced a definitive agreement to acquire the remaining 53% of the outstanding common stock of Alon USA
(NYSE:ALJ) that Delek US does not already own
• Creates a leading Permian-based refining system with approximately 302,000 Bbl/d(1) of refining capacity
Growth Oriented
6
Big Spring, TX
73,000 Bbl/d
10.5 complexity
Krotz Springs, LA
74,000 Bbl/d
8.4 complexity
Well Capitalized and Financially Conservative Sponsor
7
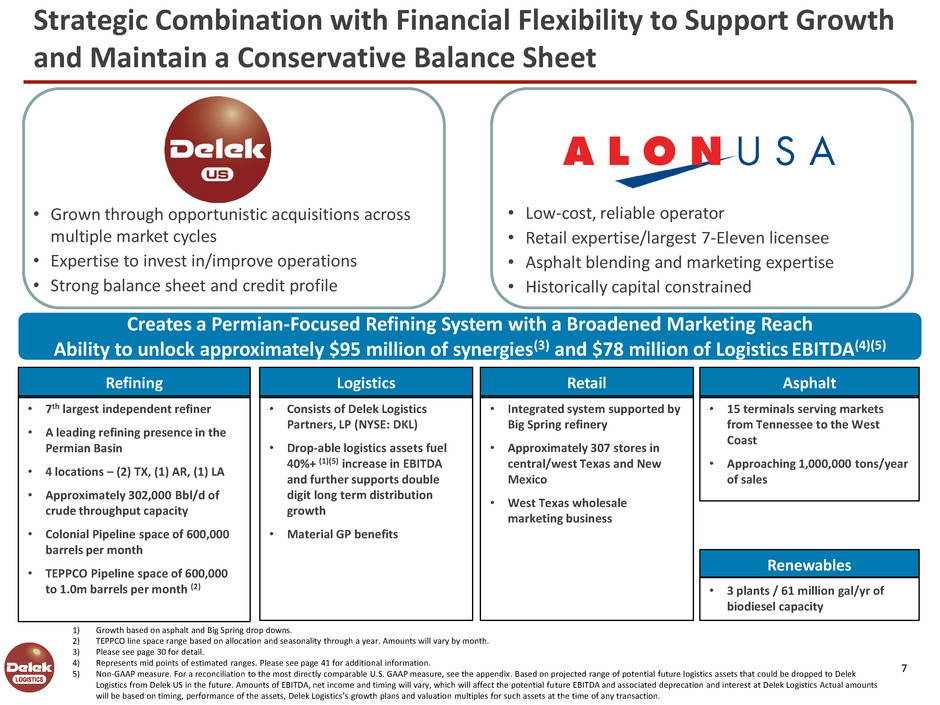
• Grown through opportunistic acquisitions across
multiple market cycles
• Expertise to invest in/improve operations
• Strong balance sheet and credit profile
• Low-cost, reliable operator
• Retail expertise/largest 7-Eleven licensee
• Asphalt blending and marketing expertise
• Historically capital constrained
Creates a Permian-Focused Refining System with a Broadened Marketing Reach
Ability to unlock approximately $95 million of synergies(3) and $78 million of Logistics EBITDA(4)(5)
Refining
• 7th largest independent refiner
• A leading refining presence in the
Permian Basin
• 4 locations – (2) TX, (1) AR, (1) LA
• Approximately 302,000 Bbl/d of
crude throughput capacity
• Colonial Pipeline space of 600,000
barrels per month
• TEPPCO Pipeline space of 600,000
to 1.0m barrels per month (2)
Retail
• Integrated system supported by
Big Spring refinery
• Approximately 307 stores in
central/west Texas and New
Mexico
• West Texas wholesale
marketing business
Asphalt
• 15 terminals serving markets
from Tennessee to the West
Coast
• Approaching 1,000,000 tons/year
of sales
Logistics
• Consists of Delek Logistics
Partners, LP (NYSE: DKL)
• Drop-able logistics assets fuel
40%+ (1)(5) increase in EBITDA
and further supports double
digit long term distribution
growth
• Material GP benefits
Renewables
• 3 plants / 61 million gal/yr of
biodiesel capacity
Strategic Combination with Financial Flexibility to Support Growth
and Maintain a Conservative Balance Sheet
1) Growth based on asphalt and Big Spring drop downs.
2) TEPPCO line space range based on allocation and seasonality through a year. Amounts will vary by month.
3) Please see page 30 for detail.
4) Represents mid points of estimated ranges. Please see page 41 for additional information.
5) Non-GAAP measure. For a reconciliation to the most directly comparable U.S. GAAP measure, see the appendix. Based on projected range of potential future logistics assets that could be dropped to Delek
Logistics from Delek US in the future. Amounts of EBITDA, net income and timing will vary, which will affect the potential future EBITDA and associated deprecation and interest at Delek Logistics Actual amounts
will be based on timing, performance of the assets, Delek Logistics’s growth plans and valuation multiples for such assets at the time of any transaction.
8
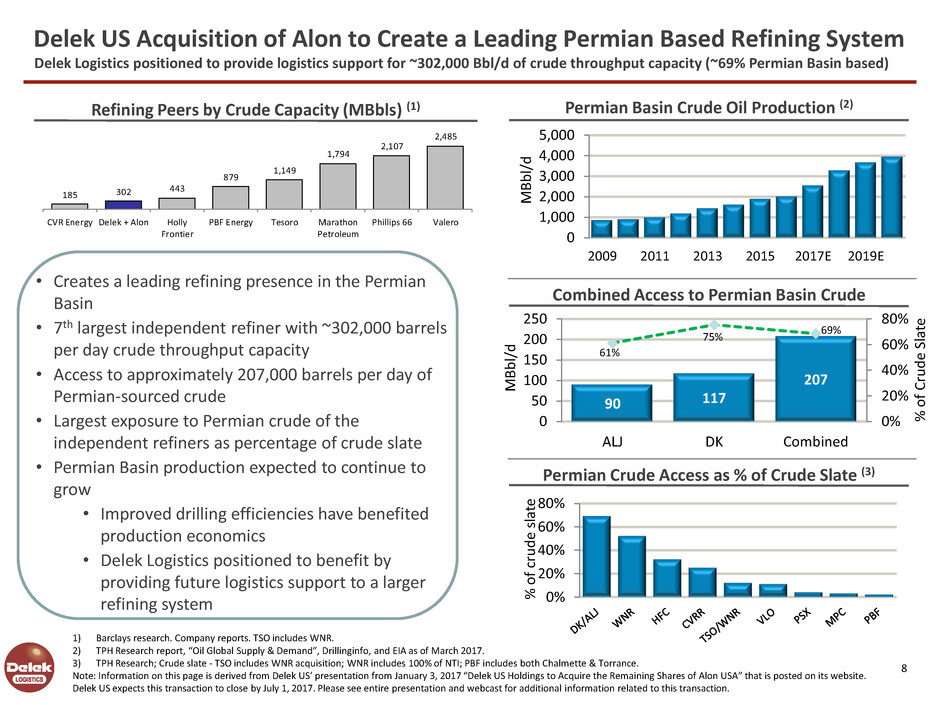
• Creates a leading refining presence in the Permian
Basin
• 7th largest independent refiner with ~302,000 barrels
per day crude throughput capacity
• Access to approximately 207,000 barrels per day of
Permian-sourced crude
• Largest exposure to Permian crude of the
independent refiners as percentage of crude slate
• Permian Basin production expected to continue to
grow
• Improved drilling efficiencies have benefited
production economics
• Delek Logistics positioned to benefit by
providing future logistics support to a larger
refining system
Permian Basin Crude Oil Production (2)
Combined Access to Permian Basin Crude
Permian Crude Access as % of Crude Slate (3)
1) Barclays research. Company reports. TSO includes WNR.
2) TPH Research report, “Oil Global Supply & Demand”, Drillinginfo, and EIA as of March 2017.
3) TPH Research; Crude slate - TSO includes WNR acquisition; WNR includes 100% of NTI; PBF includes both Chalmette & Torrance.
Note: Information on this page is derived from Delek US’ presentation from January 3, 2017 “Delek US Holdings to Acquire the Remaining Shares of Alon USA” that is posted on its website.
Delek US expects this transaction to close by July 1, 2017. Please see entire presentation and webcast for additional information related to this transaction.
90 117
207
61%
75%
69%
0%
20%
40%
60%
80%
0
50
100
150
200
250
ALJ DK Combined
%
o
f
Cr
u
d
e
Sl
at
e
M
B
b
l/
d
Refining Peers by Crude Capacity (MBbls) (1)
185 302
443
879
1,149
1,794
2,107
2,485
CVR Energy Delek + Alon Holly
Frontier
PBF Energy Tesoro Marathon
Petroleum
Phillips 66 Valero
0
1,000
2,000
3,000
4,000
5,000
2009 2011 2013 2015 2017E 2019E
M
B
b
l/
d
0%
20%
40%
60%
80%
%
o
f
cr
u
d
e
sl
at
e
Delek US Acquisition of Alon to Create a Leading Permian Based Refining System
Delek Logistics positioned to provide logistics support for ~302,000 Bbl/d of crude throughput capacity (~69% Permian Basin based)
Delek Logistics Overview
NY008LRP - 912119_1.wor -L r - r- rLL P 912119_1.wo
San Angelo
Fort Worth Dallas
Waco
Tyler
Shreveport
Monroe
El Dorado
Beaumont New Orleans
Little Rock Memphis
Brentwood
Nashville
Knoxville
Abilene
Big Spring
Krotz Springs
NY008LRP - 912119_1.wor - rL 1.P 912119_
SALA GATHERING SYSTEM
AR
LA
Magnolia El Dorado
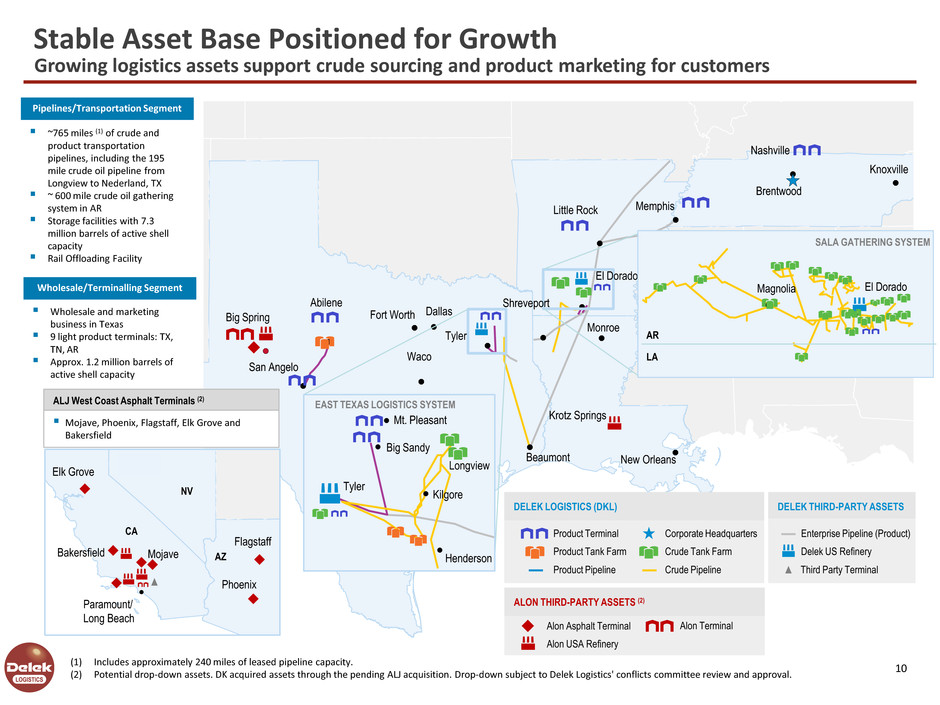
~765 miles (1) of crude and
product transportation
pipelines, including the 195
mile crude oil pipeline from
Longview to Nederland, TX
~ 600 mile crude oil gathering
system in AR
Storage facilities with 7.3
million barrels of active shell
capacity
Rail Offloading Facility
Pipelines/Transportation Segment
Wholesale and marketing
business in Texas
9 light product terminals: TX,
TN, AR
Approx. 1.2 million barrels of
active shell capacity
Wholesale/Terminalling Segment
10
Stable Asset Base Positioned for Growth
Growing logistics assets support crude sourcing and product marketing for customers
(NY008LRP) 912119_1.wor1. r) 912119 rr) 912119 1.1.) 912119(NY008LRP _ o
EAST TEXAS LOGISTICS SYSTEM
Mt. Pleasant
Big Sandy
Longview
Kilgore
Henderson
Tyler
DELEK THIRD-PARTY ASSETS
Enterprise Pipeline (Product)
Delek US Refinery
DELEK LOGISTICS (DKL)
Product Terminal
Product Tank Farm
Product Pipeline
Corporate Headquarters
Crude Tank Farm
Crude Pipeline
ALON THIRD-PARTY ASSETS (2)
Alon Asphalt Terminal
Alon USA Refinery
Alon Terminal
Third Party Terminal
ALJ West Coast Asphalt Terminals (2)
Mojave, Phoenix, Flagstaff, Elk Grove and
Bakersfield
NY008LRP - 912119_1.wor - .P rL - .- .P rP r008L 912119_1LY R - . o - .
Paramount/
Long Beach
Mojave
CA
Bakersfield
Elk Grove
Flagstaff
Phoenix
NV
AZ
(1) Includes approximately 240 miles of leased pipeline capacity.
(2) Potential drop-down assets. DK acquired assets through the pending ALJ acquisition. Drop-down subject to Delek Logistics' conflicts committee review and approval.
11
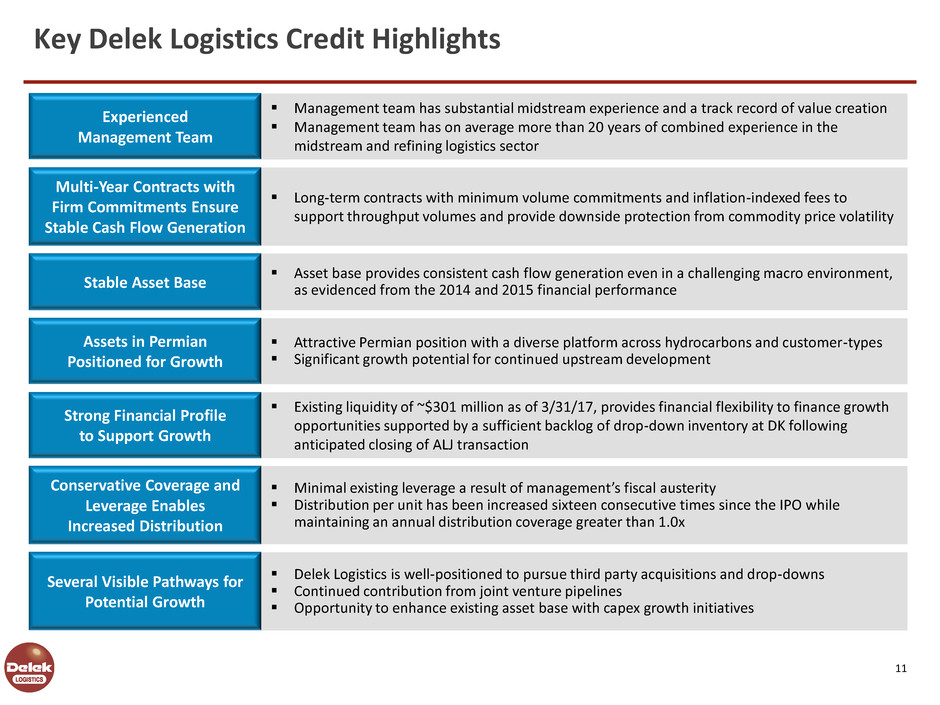
Management team has substantial midstream experience and a track record of value creation
Management team has on average more than 20 years of combined experience in the
midstream and refining logistics sector
Experienced
Management Team
Key Delek Logistics Credit Highlights
Asset base provides consistent cash flow generation even in a challenging macro environment,
as evidenced from the 2014 and 2015 financial performance
Long-term contracts with minimum volume commitments and inflation-indexed fees to
support throughput volumes and provide downside protection from commodity price volatility
Existing liquidity of ~$301 million as of 3/31/17, provides financial flexibility to finance growth
opportunities supported by a sufficient backlog of drop-down inventory at DK following
anticipated closing of ALJ transaction
Minimal existing leverage a result of management’s fiscal austerity
Distribution per unit has been increased sixteen consecutive times since the IPO while
maintaining an annual distribution coverage greater than 1.0x
Delek Logistics is well-positioned to pursue third party acquisitions and drop-downs
Continued contribution from joint venture pipelines
Opportunity to enhance existing asset base with capex growth initiatives
Several Visible Pathways for
Potential Growth
Stable Asset Base
Multi-Year Contracts with
Firm Commitments Ensure
Stable Cash Flow Generation
Strong Financial Profile
to Support Growth
Conservative Coverage and
Leverage Enables
Increased Distribution
Attractive Permian position with a diverse platform across hydrocarbons and customer-types
Significant growth potential for continued upstream development
Assets in Permian
Positioned for Growth
Stable Assets and Long-Term
Minimum Volume Commitments
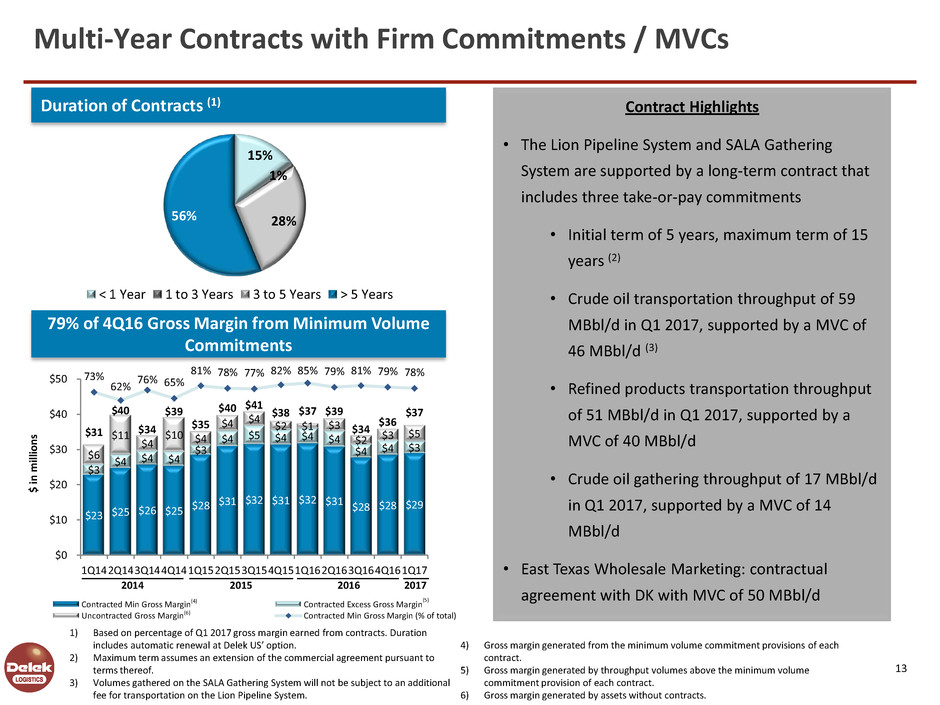
Contract Highlights
• The Lion Pipeline System and SALA Gathering
System are supported by a long-term contract that
includes three take-or-pay commitments
• Initial term of 5 years, maximum term of 15
years (2)
• Crude oil transportation throughput of 59
MBbl/d in Q1 2017, supported by a MVC of
46 MBbl/d (3)
• Refined products transportation throughput
of 51 MBbl/d in Q1 2017, supported by a
MVC of 40 MBbl/d
• Crude oil gathering throughput of 17 MBbl/d
in Q1 2017, supported by a MVC of 14
MBbl/d
• East Texas Wholesale Marketing: contractual
agreement with DK with MVC of 50 MBbl/d
1) Based on percentage of Q1 2017 gross margin earned from contracts. Duration
includes automatic renewal at Delek US’ option.
2) Maximum term assumes an extension of the commercial agreement pursuant to
terms thereof.
3) Volumes gathered on the SALA Gathering System will not be subject to an additional
fee for transportation on the Lion Pipeline System.
4) Gross margin generated from the minimum volume commitment provisions of each
contract.
5) Gross margin generated by throughput volumes above the minimum volume
commitment provision of each contract.
6) Gross margin generated by assets without contracts.
13
$23 $25 $26 $25
$28 $31 $32 $31 $32 $31 $28 $28 $29
$3
$4 $4 $4
$3
$4 $5 $4 $4 $4
$4 $4 $3 $6
$11
$4
$10 $4
$4 $4 $2 $1 $3
$2 $3
$5 $31
$40
$34
$39
$35
$40 $41 $38 $37 $39
$34
$36
$37
73%
62%
76% 65%
81% 78% 77% 82% 85% 79% 81% 79% 78%
$0
$10
$20
$30
$40
$50
1Q14 2Q14 3Q14 4Q14 1Q15 2Q15 3Q15 4Q15 1Q16 2Q16 3Q16 4Q16 1Q17
$
in
m
ill
io
n
s
Contracted Min Gross Margin Contracted Excess Gross Margin
Uncontracted Gross Margin Contracted Min Gross Margin (% of total)
79% of 4Q16 Gross Margin from Minimum Volume
Commitments
2014 2015
15%
1%
28% 56%
< 1 Year 1 to 3 Years 3 to 5 Years > 5 Years
Duration of Contracts (1)
(4) (5)
(6)
Multi-Year Contracts with Firm Commitments / MVCs
2016 2017
46.0 46.5 47.9
55.0
56.6 58.7
45.2
49.7
53.5
57.4
52.1 51.4
-
20.0
40.0
60.0
80.0
2012 2013 2014 2015 2016 Q1 2017
(M
B
b
l/
d
)
Crude Volume (MBbl/d) Refined Product Volume (MBbl/d)
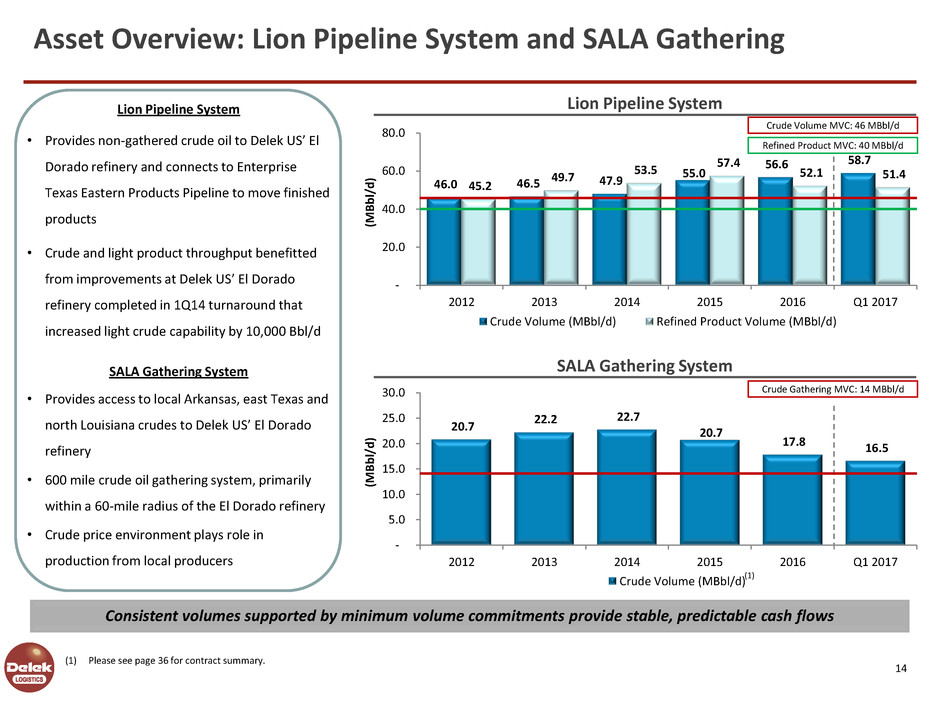
SALA Gathering System
• Provides access to local Arkansas, east Texas and
north Louisiana crudes to Delek US’ El Dorado
refinery
• 600 mile crude oil gathering system, primarily
within a 60-mile radius of the El Dorado refinery
• Crude price environment plays role in
production from local producers
20.7
22.2 22.7
20.7
17.8 16.5
-
5.0
10.0
15.0
20.0
25.0
30.0
2012 2013 2014 2015 2016 Q1 2017
(M
B
b
l/
d
)
Crude Volume (MBbl/d)
Lion Pipeline System
• Provides non-gathered crude oil to Delek US’ El
Dorado refinery and connects to Enterprise
Texas Eastern Products Pipeline to move finished
products
• Crude and light product throughput benefitted
from improvements at Delek US’ El Dorado
refinery completed in 1Q14 turnaround that
increased light crude capability by 10,000 Bbl/d
(1) Please see page 36 for contract summary.
Lion Pipeline System
SALA Gathering System
14
Asset Overview: Lion Pipeline System and SALA Gathering
(1)
Consistent volumes supported by minimum volume commitments provide stable, predictable cash flows
Crude Volume MVC: 46 MBbl/d
Refined Product MVC: 40 MBbl/d
Crude Gathering MVC: 14 MBbl/d
15
Additional Stable Logistics Assets and Agreements Overview
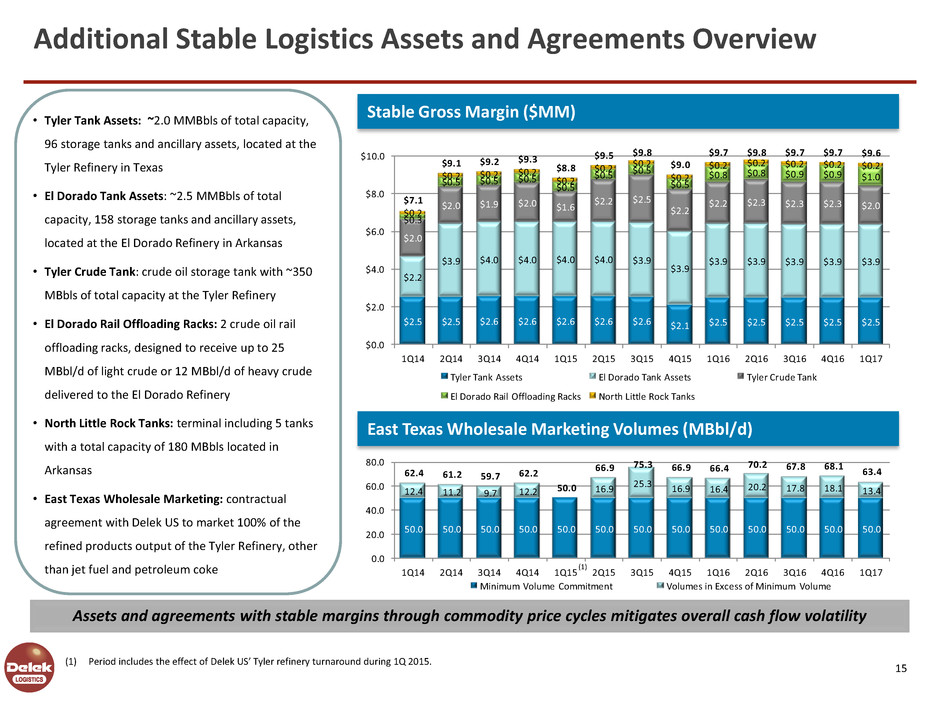
• Tyler Tank Assets: ~2.0 MMBbls of total capacity,
96 storage tanks and ancillary assets, located at the
Tyler Refinery in Texas
• El Dorado Tank Assets: ~2.5 MMBbls of total
capacity, 158 storage tanks and ancillary assets,
located at the El Dorado Refinery in Arkansas
• Tyler Crude Tank: crude oil storage tank with ~350
MBbls of total capacity at the Tyler Refinery
• El Dorado Rail Offloading Racks: 2 crude oil rail
offloading racks, designed to receive up to 25
MBbl/d of light crude or 12 MBbl/d of heavy crude
delivered to the El Dorado Refinery
• North Little Rock Tanks: terminal including 5 tanks
with a total capacity of 180 MBbls located in
Arkansas
• East Texas Wholesale Marketing: contractual
agreement with Delek US to market 100% of the
refined products output of the Tyler Refinery, other
than jet fuel and petroleum coke
Stable Gross Margin ($MM)
$2.5 $2.5 $2.6 $2.6 $2.6 $2.6 $2.6 $2.1 $2.5 $2.5 $2.5 $2.5 $2.5
$2.2
$3.9 $4.0 $4.0 $4.0 $4.0 $3.9
$3.9
$3.9 $3.9 $3.9 $3.9 $3.9
$2.0
$2.0 $1.9 $2.0 $1.6
$2.2 $2.5
$2.2
$2.2 $2.3 $2.3 $2.3 $2.0
$0.3
$0.5 $0.5 $0.5
$0.5
$0.5 $0.5
$0.5
$0.8 $0.8 $0.9 $0.9 $1.0
$0.2
$0.2 $0.2 $0.2 $0.2
$0.2 $0.2
$0.2
$0.2 $0.2 $0.2 $0.2 $0.2
$7.1
$9.1 $9.2 $9.3 $8.8
$9.5 $9.8
$9.0
$9.7 $9.8 $9.7 $9.7 $9.6
$0.0
$2.0
$4.0
$6.0
$8.0
$10.0
1Q14 2Q14 3Q14 4Q14 1Q15 2Q15 3Q15 4Q15 1Q16 2Q16 3Q16 4Q16 1Q17
Tyler Tank Assets El Dorado Tank Assets Tyler Crude Tank
El Dorado Rail Offloading Racks North Little Rock Tanks
East Texas Wholesale Marketing Volumes (MBbl/d)
50.0 50.0 50.0 50.0 50.0 50.0 50.0 50.0 50.0 50.0 50.0 50.0 50.0
12.4 11.2 9.7 12.2 16.9
25.3 16.9 16.4 20.2 17.8 18.1 13.4
62.4 61.2 59.7 62.2
50.0
66.9 75.3 66.9 66.4 70.2 67.8 68.1 63.4
0.0
20.0
40.0
60.0
80.0
1Q14 2Q14 3Q14 4Q14 1Q15 2Q15 3Q15 4Q15 1Q16 2Q16 3Q16 4Q16 1Q17
Minimum Volume Commitment Volumes in Excess of Minimum Volume
Assets and agreements with stable margins through commodity price cycles mitigates overall cash flow volatility
(1) Period includes the effect of Delek US’ Tyler refinery turnaround during 1Q 2015.
(1)
19 13
75
97
107
122 118 115
2011 2012 2013 2014 2015 2016 Q1 2016 Q1 2017
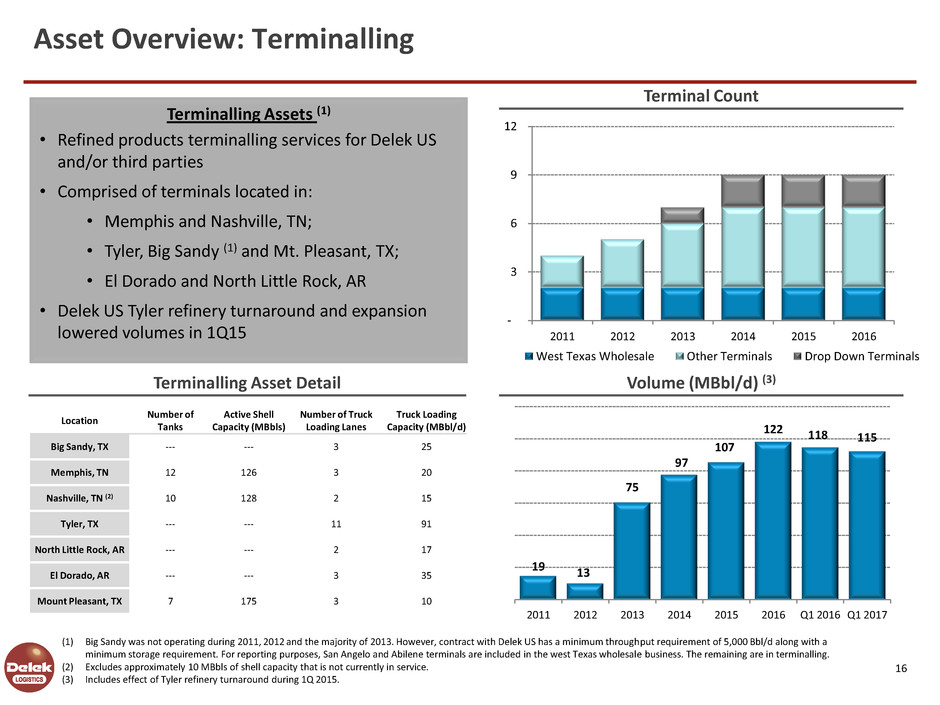
Terminalling Assets (1)
• Refined products terminalling services for Delek US
and/or third parties
• Comprised of terminals located in:
• Memphis and Nashville, TN;
• Tyler, Big Sandy (1) and Mt. Pleasant, TX;
• El Dorado and North Little Rock, AR
• Delek US Tyler refinery turnaround and expansion
lowered volumes in 1Q15
-
3
6
9
12
2011 2012 2013 2014 2015 2016
West Texas Wholesale Other Terminals Drop Down Terminals
(1) Big Sandy was not operating during 2011, 2012 and the majority of 2013. However, contract with Delek US has a minimum throughput requirement of 5,000 Bbl/d along with a
minimum storage requirement. For reporting purposes, San Angelo and Abilene terminals are included in the west Texas wholesale business. The remaining are in terminalling.
(2) Excludes approximately 10 MBbls of shell capacity that is not currently in service.
(3) Includes effect of Tyler refinery turnaround during 1Q 2015.
16
Asset Overview: Terminalling
Terminal Count
Volume (MBbl/d) (3)
Location
Number of
Tanks
Active Shell
Capacity (MBbls)
Number of Truck
Loading Lanes
Truck Loading
Capacity (MBbl/d)
Big Sandy, TX --- --- 3 25
Memphis, TN 12 126 3 20
Nashville, TN (2) 10 128 2 15
Tyler, TX --- --- 11 91
North Little Rock, AR --- --- 2 17
El Dorado, AR --- --- 3 35
Mount Pleasant, TX 7 175 3 10
Terminalling Asset Detail
Assets Positioned for
Permian Basin Growth
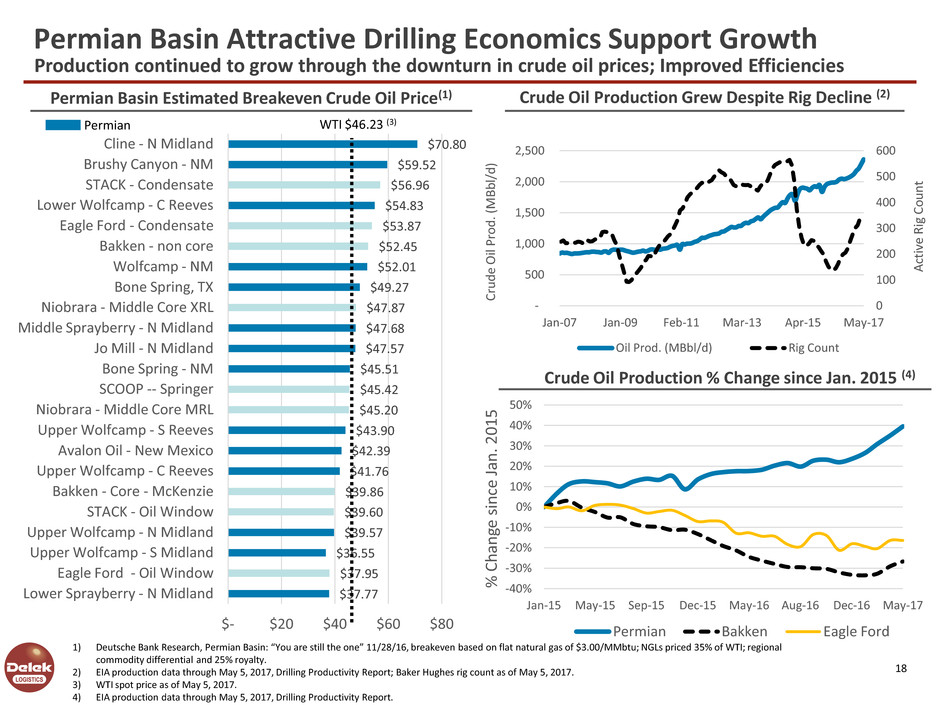
1) Deutsche Bank Research, Permian Basin: “You are still the one” 11/28/16, breakeven based on flat natural gas of $3.00/MMbtu; NGLs priced 35% of WTI; regional
commodity differential and 25% royalty.
2) EIA production data through May 5, 2017, Drilling Productivity Report; Baker Hughes rig count as of May 5, 2017.
3) WTI spot price as of May 5, 2017.
4) EIA production data through May 5, 2017, Drilling Productivity Report.
18
Crude Oil Production Grew Despite Rig Decline (2)
Permian Basin Estimated Breakeven Crude Oil Price(1)
Crude Oil Production % Change since Jan. 2015 (4)
$37.77
$37.95
$36.55
$39.57
$39.60
$39.86
$41.76
$42.39
$43.90
$45.20
$45.42
$45.51
$47.57
$47.68
$47.87
$49.27
$52.01
$52.45
$53.87
$54.83
$56.96
$59.52
$70.80
$- $20 $40 $60 $80
Lower Sprayberry - N Midland
Eagle Ford - Oil Window
Upper Wolfcamp - S Midland
Upper Wolfcamp - N Midland
STACK - Oil Window
Bakken - Core - McKenzie
Upper Wolfcamp - C Reeves
Avalon Oil - New Mexico
Upper Wolfcamp - S Reeves
Niobrara - Middle Core MRL
SCOOP -- Springer
Bone Spring - NM
Jo Mill - N Midland
Middle Sprayberry - N Midland
Niobrara - Middle Core XRL
Bone Spring, TX
Wolfcamp - NM
Bakken - non core
Eagle Ford - Condensate
Lower Wolfcamp - C Reeves
STACK - Condensate
Brushy Canyon - NM
Cline - N Midland
-40%
-30%
-20%
-10%
0%
10%
20%
30%
40%
50%
Jan-15 May-15 Sep-15 Dec-15 May-16 Aug-16 Dec-16 May-17
%
C
h
an
ge
s
inc
e
Ja
n
. 2
0
1
5
Permian Bakken Eagle Ford
0
100
200
300
400
500
600
-
500
1,000
1,500
2,000
2,500
Jan-07 Jan-09 Feb-11 Mar-13 Apr-15 May-17
A
ct
ive
Ri
g
C
o
u
n
t
C
ru
d
e
O
il
P
ro
d
. (
MB
b
l/
d
)
Oil Prod. (MBbl/d) Rig Count
Permian WTI $46.23 (3)
Production continued to grow through the downturn in crude oil prices; Improved Efficiencies
Permian Basin Attractive Drilling Economics Support Growth
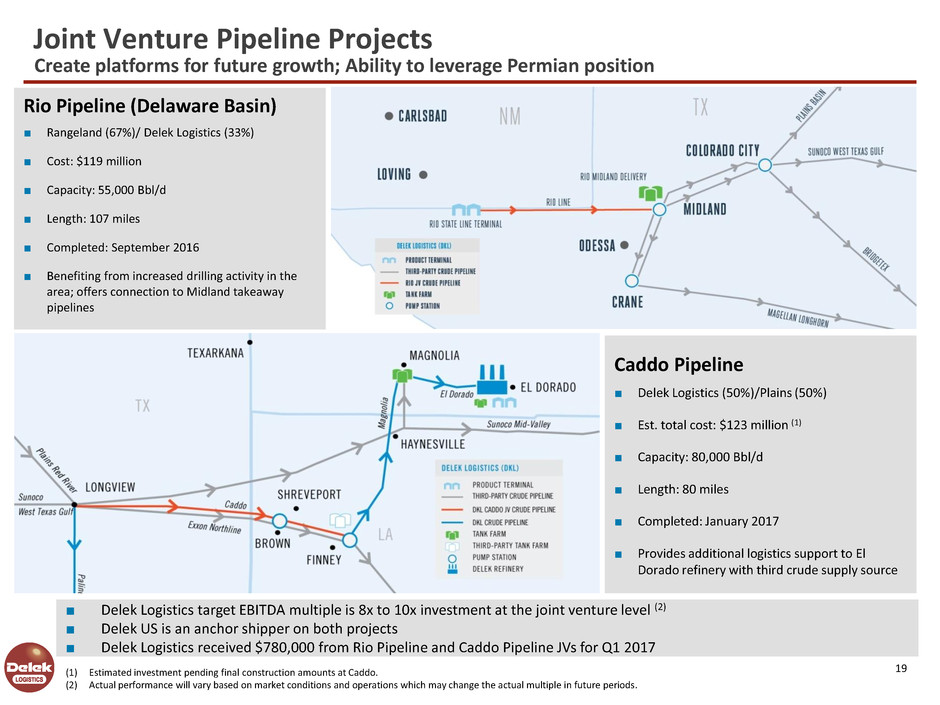
Caddo Pipeline
■ Delek Logistics (50%)/Plains (50%)
■ Est. total cost: $123 million (1)
■ Capacity: 80,000 Bbl/d
■ Length: 80 miles
■ Completed: January 2017
■ Provides additional logistics support to El
Dorado refinery with third crude supply source
Rio Pipeline (Delaware Basin)
■ Rangeland (67%)/ Delek Logistics (33%)
■ Cost: $119 million
■ Capacity: 55,000 Bbl/d
■ Length: 107 miles
■ Completed: September 2016
■ Benefiting from increased drilling activity in the
area; offers connection to Midland takeaway
pipelines
(1) Estimated investment pending final construction amounts at Caddo.
(2) Actual performance will vary based on market conditions and operations which may change the actual multiple in future periods.
■ Delek Logistics target EBITDA multiple is 8x to 10x investment at the joint venture level (2)
■ Delek US is an anchor shipper on both projects
■ Delek Logistics received $780,000 from Rio Pipeline and Caddo Pipeline JVs for Q1 2017
19
Joint Venture Pipeline Projects
Create platforms for future growth; Ability to leverage Permian position
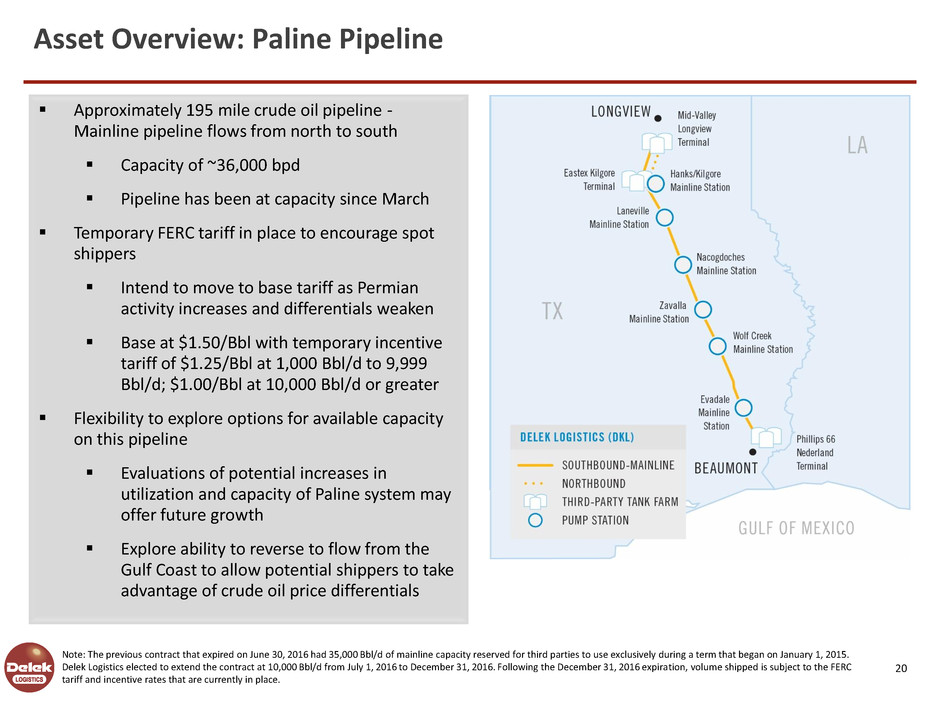
Approximately 195 mile crude oil pipeline -
Mainline pipeline flows from north to south
Capacity of ~36,000 bpd
Pipeline has been at capacity since March
Temporary FERC tariff in place to encourage spot
shippers
Intend to move to base tariff as Permian
activity increases and differentials weaken
Base at $1.50/Bbl with temporary incentive
tariff of $1.25/Bbl at 1,000 Bbl/d to 9,999
Bbl/d; $1.00/Bbl at 10,000 Bbl/d or greater
Flexibility to explore options for available capacity
on this pipeline
Evaluations of potential increases in
utilization and capacity of Paline system may
offer future growth
Explore ability to reverse to flow from the
Gulf Coast to allow potential shippers to take
advantage of crude oil price differentials
Note: The previous contract that expired on June 30, 2016 had 35,000 Bbl/d of mainline capacity reserved for third parties to use exclusively during a term that began on January 1, 2015.
Delek Logistics elected to extend the contract at 10,000 Bbl/d from July 1, 2016 to December 31, 2016. Following the December 31, 2016 expiration, volume shipped is subject to the FERC
tariff and incentive rates that are currently in place.
20
Asset Overview: Paline Pipeline
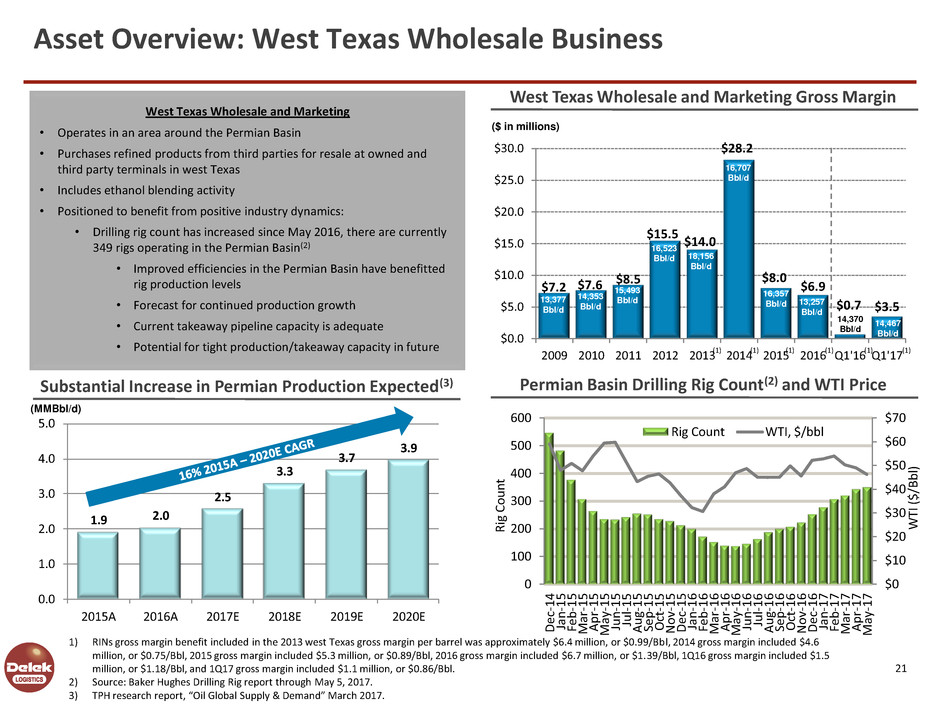
21
Asset Overview: West Texas Wholesale Business
1) RINs gross margin benefit included in the 2013 west Texas gross margin per barrel was approximately $6.4 million, or $0.99/Bbl, 2014 gross margin included $4.6
million, or $0.75/Bbl, 2015 gross margin included $5.3 million, or $0.89/Bbl, 2016 gross margin included $6.7 million, or $1.39/Bbl, 1Q16 gross margin included $1.5
million, or $1.18/Bbl, and 1Q17 gross margin included $1.1 million, or $0.86/Bbl.
2) Source: Baker Hughes Drilling Rig report through May 5, 2017.
3) TPH research report, “Oil Global Supply & Demand” March 2017.
$0
$10
$20
$30
$40
$50
$60
$70
0
100
200
300
400
500
600
De
c-
1
4
Ja
n
-1
5
Fe
b
-1
5
M
ar
-1
5
Ap
r-
1
5
M
ay
-1
5
Ju
n
-1
5
Ju
l-
1
5
Au
g-
1
5
Se
p
-1
5
O
ct
-1
5
No
v-
1
5
De
c-
1
5
Ja
n
-1
6
Fe
b
-1
6
M
ar
-1
6
Ap
r-
1
6
M
ay
-1
6
Ju
n
-1
6
Ju
l-
1
6
Au
g-
1
6
Se
p
-1
6
O
ct
-1
6
No
v-
1
6
De
c-
1
6
Ja
n
-1
7
Fe
b
-1
7
M
ar
-1
7
Ap
r-
1
7
M
ay
-1
7
W
TI
(
$
/Bb
l)
Ri
g
C
o
u
n
t
Rig Count WTI, $/bbl
$7.2 $7.6
$8.5
$15.5
$14.0
$28.2
$8.0
$6.9
$0.7 $3.5
$0.0
$5.0
$10.0
$15.0
$20.0
$25.0
$30.0
2009 2010 2011 2012 2013 2014 2015 2016 Q1'16 Q1'17
West Texas Wholesale and Marketing Gross Margin
13,377
Bbl/d
14,353
Bbl/d
15,493
Bbl/d
16,523
Bbl/d 18,156
Bbl/d
16,707
Bbl/d
16,357
Bbl/d
14,370
Bbl/d
West Texas Wholesale and Marketing
• Operates in an area around the Permian Basin
• Purchases refined products from third parties for resale at owned and
third party terminals in west Texas
• Includes ethanol blending activity
• Positioned to benefit from positive industry dynamics:
• Drilling rig count has increased since May 2016, there are currently
349 rigs operating in the Permian Basin(2)
• Improved efficiencies in the Permian Basin have benefitted
rig production levels
• Forecast for continued production growth
• Current takeaway pipeline capacity is adequate
• Potential for tight production/takeaway capacity in future (1) (1) (1) (1)
($ in millions)
Permian Basin Drilling Rig Count(2) and WTI Price
1.9 2.0
2.5
3.3
3.7
3.9
0.0
1.0
2.0
3.0
4.0
5.0
2015A 20 A 2017E 2018E 2019E 2020E
Substantial Increase in Permian Production Expected(3)
(MMBbl/d)
14,467
Bbl/d
13,257
Bbl/d
(1) (1)
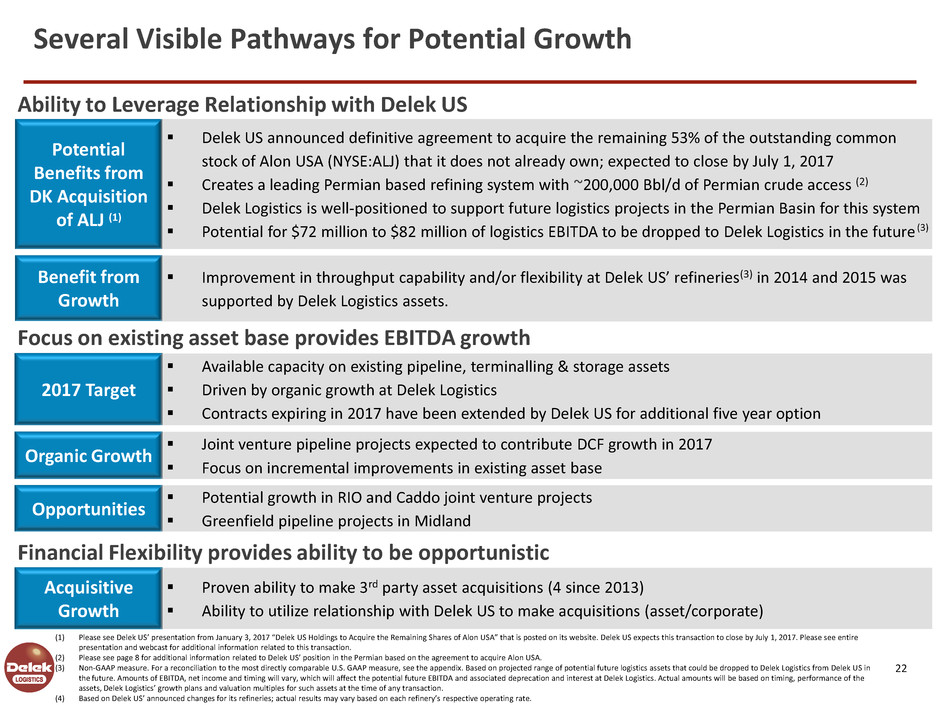
2017 Target
Acquisitive
Growth
Available capacity on existing pipeline, terminalling & storage assets
Driven by organic growth at Delek Logistics
Contracts expiring in 2017 have been extended by Delek US for additional five year option
Proven ability to make 3rd party asset acquisitions (4 since 2013)
Ability to utilize relationship with Delek US to make acquisitions (asset/corporate)
Focus on existing asset base provides EBITDA growth
Organic Growth
Joint venture pipeline projects expected to contribute DCF growth in 2017
Focus on incremental improvements in existing asset base
Financial Flexibility provides ability to be opportunistic
Opportunities
Potential growth in RIO and Caddo joint venture projects
Greenfield pipeline projects in Midland
Benefit from
Growth
Improvement in throughput capability and/or flexibility at Delek US’ refineries(3) in 2014 and 2015 was
supported by Delek Logistics assets.
Ability to Leverage Relationship with Delek US
Potential
Benefits from
DK Acquisition
of ALJ (1)
Delek US announced definitive agreement to acquire the remaining 53% of the outstanding common
stock of Alon USA (NYSE:ALJ) that it does not already own; expected to close by July 1, 2017
Creates a leading Permian based refining system with ~200,000 Bbl/d of Permian crude access (2)
Delek Logistics is well-positioned to support future logistics projects in the Permian Basin for this system
Potential for $72 million to $82 million of logistics EBITDA to be dropped to Delek Logistics in the future
22
Several Visible Pathways for Potential Growth
(1) Please see Delek US’ presentation from January 3, 2017 “Delek US Holdings to Acquire the Remaining Shares of Alon USA” that is posted on its website. Delek US expects this transaction to close by July 1, 2017. Please see entire
presentation and webcast for additional information related to this transaction.
(2) Please see page 8 for additional information related to Delek US’ position in the Permian based on the agreement to acquire Alon USA.
(3) Non-GAAP measure. For a reconciliation to the most directly comparable U.S. GAAP measure, see the appendix. Based on projected range of potential future logistics assets that could be dropped to Delek Logistics from Delek US in
the future. Amounts of EBITDA, net income and timing will vary, which will affect the potential future EBITDA and associated deprecation and interest at Delek Logistics. Actual amounts will be based on timing, performance of the
assets, Delek Logistics’ growth plans and valuation multiples for such assets at the time of any transaction.
(4) Based on Delek US’ announced changes for its refineries; actual results may vary based on each refinery’s respective operating rate.
(3)
Financial Overview
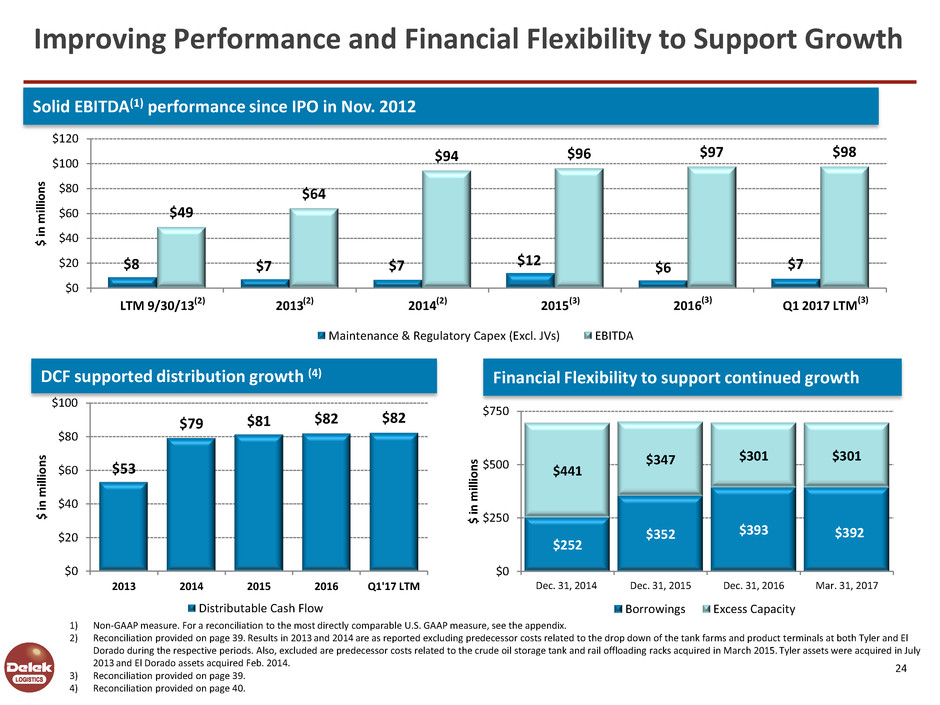
1) Non-GAAP measure. For a reconciliation to the most directly comparable U.S. GAAP measure, see the appendix.
2) Reconciliation provided on page 39. Results in 2013 and 2014 are as reported excluding predecessor costs related to the drop down of the tank farms and product terminals at both Tyler and El
Dorado during the respective periods. Also, excluded are predecessor costs related to the crude oil storage tank and rail offloading racks acquired in March 2015. Tyler assets were acquired in July
2013 and El Dorado assets acquired Feb. 2014.
3) Reconciliation provided on page 39.
4) Reconciliation provided on page 40.
Solid EBITDA(1) performance since IPO in Nov. 2012
$8 $7 $7 $12 $6 $7
$49
$64
$94 $96 $97 $98
$0
$20
$40
$60
$80
$100
$120
LTM 9/30/13 2013 2014 2015 2016 Q1 2017 LTM
$
in
m
ill
io
n
s
Maintenance & Regulatory Capex (Excl. JVs) EBITDA
$53
$79 $81 $82 $82
$0
$20
$40
$60
$80
$100
2013 2014 2015 2016 Q1'17 LTM
$
in
m
ill
io
n
s
Distributable Cash Flow
DCF supported distribution growth (4)
$252
$352 $393 $392
$441
$347 $301 $301
$0
$250
$500
$750
Dec. 31, 2014 Dec. 31, 2015 Dec. 31, 2016 Mar. 31, 2017
$
in
m
ill
io
n
s
Borrowings Excess Capacity
Financial Flexibility to support continued growth
24
(2) (2) (3) (3)
Improving Performance and Financial Flexibility to Support Growth
(3) (2)
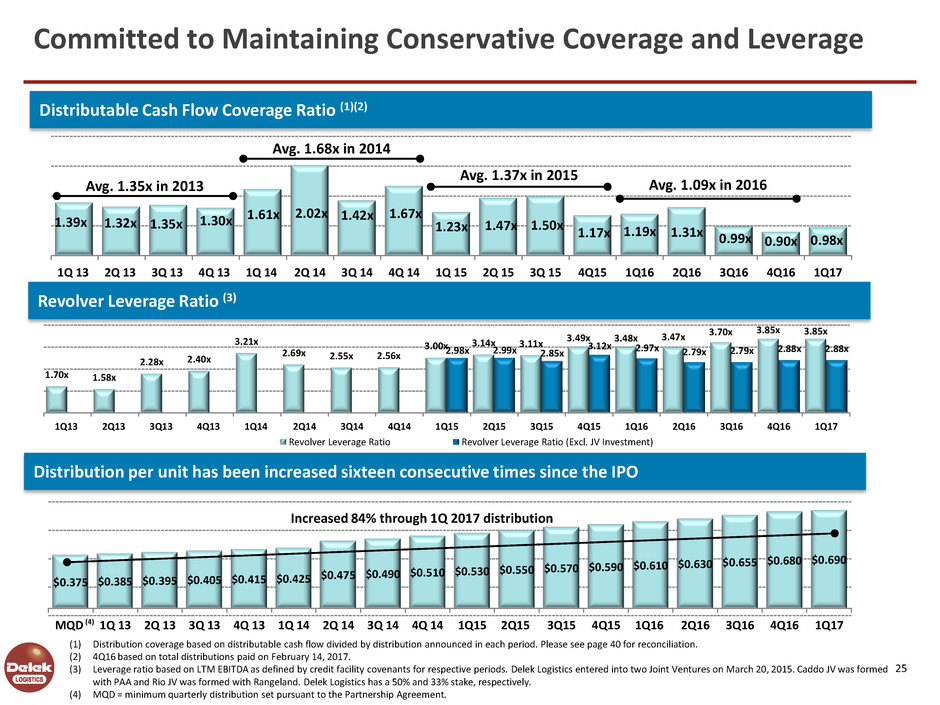
Distribution per unit has been increased sixteen consecutive times since the IPO
$0.375 $0.385 $0.395 $0.405 $0.415 $0.425
$0.475 $0.490 $0.510 $0.530 $0.550
$0.570 $0.590 $0.610 $0.630 $0.655
$0.680 $0.690
MQD 1Q 13 2Q 13 3Q 13 4Q 13 1Q 14 2Q 14 3Q 14 4Q 14 1Q15 2Q15 3Q15 4Q15 1Q16 2Q16 3Q16 4Q16 1Q17
Increased 84% through 1Q 2017 distribution
1.39x 1.32x 1.35x 1.30x
1.61x 2.02x 1.42x 1.67x
1.23x 1.47x 1.50x 1.17x 1.19x 1.31x 0.99x 0.90x 0.98x
1Q 13 2Q 13 3Q 13 4Q 13 1Q 14 2Q 14 3Q 14 4Q 14 1Q 15 2Q 15 3Q 15 4Q15 1Q16 2Q16 3Q16 4Q16 1Q17
Distributable Cash Flow Coverage Ratio (1)(2)
1.70x 1.58x
2.28x 2.40x
3.21x
2.69x 2.55x 2.56x
3.00x 3.14x 3.11x
3.49x 3.48x 3.47x
3.70x 3.85x 3.85x
2.98x 2.99x 2.85x
3.12x 2.97x 2.79x 2.79x 2.88x 2.88x
1Q13 2Q13 3Q13 4Q13 1Q14 2Q14 3Q14 4Q14 1Q15 2Q15 3Q15 4Q15 1Q16 2Q16 3Q16 4Q16 1Q17
Revolver Leverage Ratio Revolver Leverage Ratio (Excl. JV Investment)
Revolver Leverage Ratio (3)
(1) Distribution coverage based on distributable cash flow divided by distribution announced in each period. Please see page 40 for reconciliation.
(2) 4Q16 based on total distributions paid on February 14, 2017.
(3) Leverage ratio based on LTM EBITDA as defined by credit facility covenants for respective periods. Delek Logistics entered into two Joint Ventures on March 20, 2015. Caddo JV was formed
with PAA and Rio JV was formed with Rangeland. Delek Logistics has a 50% and 33% stake, respectively.
(4) MQD = minimum quarterly distribution set pursuant to the Partnership Agreement.
Avg. 1.35x in 2013
Avg. 1.68x in 2014
Avg. 1.37x in 2015
Avg. 1.09x in 2016
25
(4)
Committed to Maintaining Conservative Coverage and Leverage
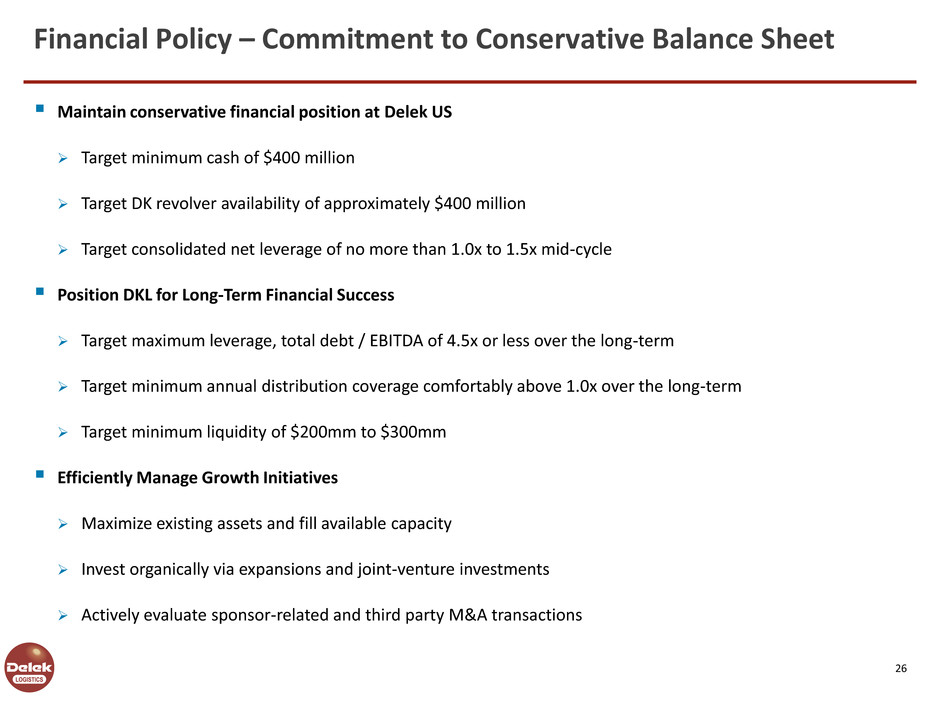
Maintain conservative financial position at Delek US
Target minimum cash of $400 million
Target DK revolver availability of approximately $400 million
Target consolidated net leverage of no more than 1.0x to 1.5x mid-cycle
Position DKL for Long-Term Financial Success
Target maximum leverage, total debt / EBITDA of 4.5x or less over the long-term
Target minimum annual distribution coverage comfortably above 1.0x over the long-term
Target minimum liquidity of $200mm to $300mm
Efficiently Manage Growth Initiatives
Maximize existing assets and fill available capacity
Invest organically via expansions and joint-venture investments
Actively evaluate sponsor-related and third party M&A transactions
26
Financial Policy – Commitment to Conservative Balance Sheet
Appendix
28
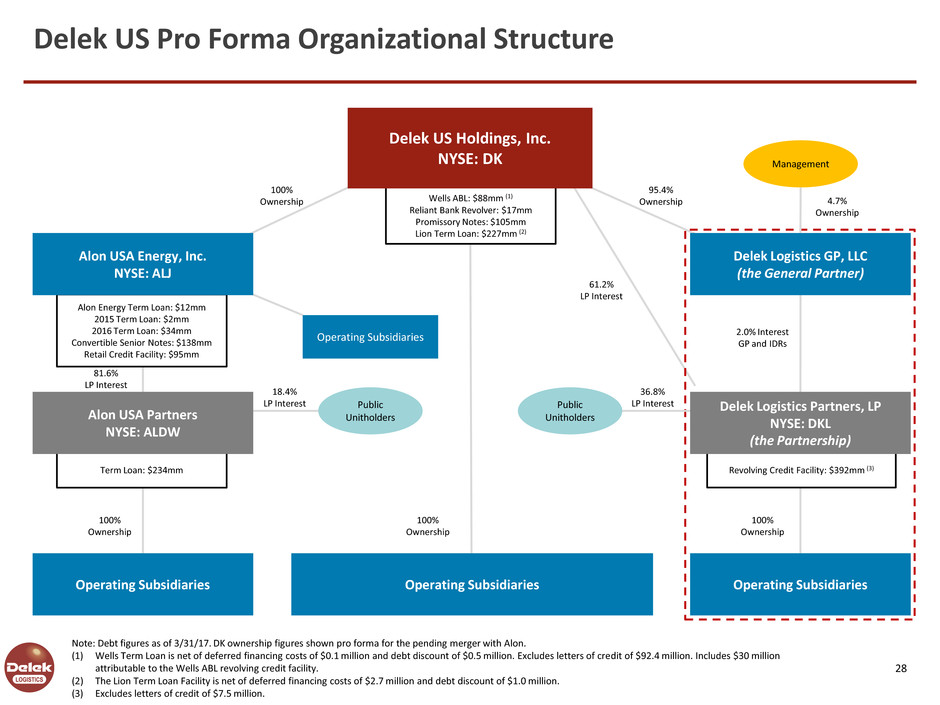
Note: Debt figures as of 3/31/17. DK ownership figures shown pro forma for the pending merger with Alon.
(1) Wells Term Loan is net of deferred financing costs of $0.1 million and debt discount of $0.5 million. Excludes letters of credit of $92.4 million. Includes $30 million
attributable to the Wells ABL revolving credit facility.
(2) The Lion Term Loan Facility is net of deferred financing costs of $2.7 million and debt discount of $1.0 million.
(3) Excludes letters of credit of $7.5 million.
Delek US Pro Forma Organizational Structure
$[250]mm issued [Q3 2016]
Operating Subsidiaries
61.2%
LP Interest
2.0% Interest
GP and IDRs
100%
Ownership
95.4%
Ownership
Revolving Credit Facility: $392mm (3)
Delek Logistics GP, LLC
(the General Partner)
$[250]mm issued Q3 2016]
Operating Subsidiaries
81.6%
LP Interest
100%
Ownership
Operating Subsidiaries
Operating Subsidiaries
100%
Ownership
Term Loan: $234mm
Alon USA Partners
NYSE: ALDW
100%
Ownership
Wells ABL: $88mm (1)
Reliant Bank Revolver: $17mm
Promissory Notes: $105mm
Lion Term Loan: $227mm (2)
Delek US Holdings, Inc.
NYSE: DK
18.4%
LP Interest Public
Unitholders
36.8%
LP Interest
Management
4.7%
Ownership
Alon Energy Term Loan: $12mm
2015 Term Loan: $2mm
2016 Term Loan: $34mm
Convertible Senior Notes: $138mm
Retail Credit Facility: $95mm
Alon USA Energy, Inc.
NYSE: ALJ
Public
Unitholders
Delek Logistics Partners, LP
NYSE: DKL
(the Partnership)
29
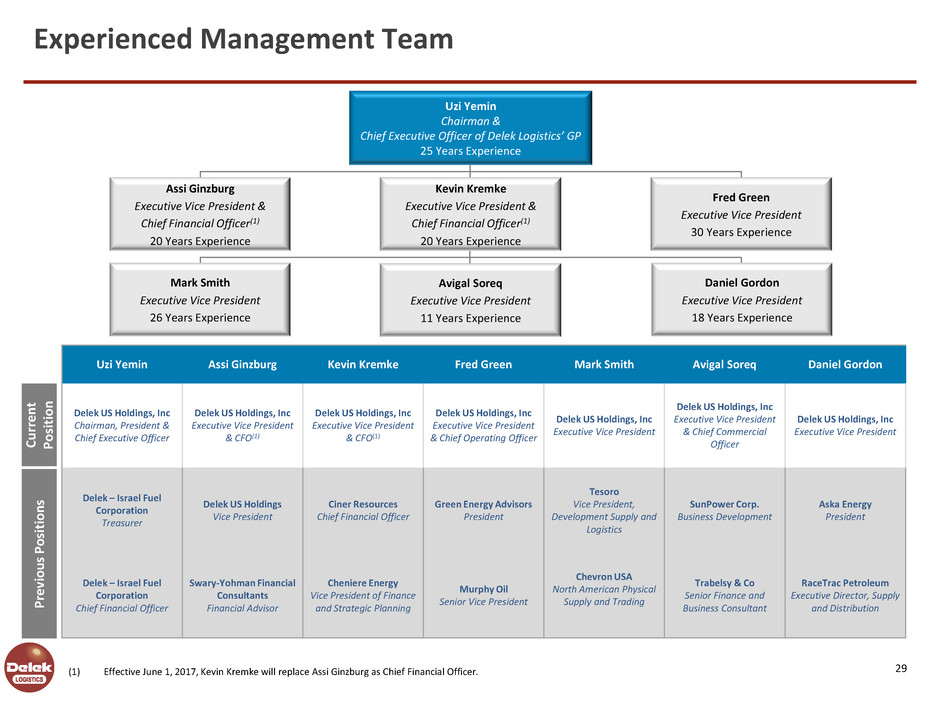
Uzi Yemin Assi Ginzburg Kevin Kremke Fred Green Mark Smith Avigal Soreq Daniel Gordon
Delek US Holdings, Inc
Chairman, President &
Chief Executive Officer
Delek US Holdings, Inc
Executive Vice President
& CFO(1)
Delek US Holdings, Inc
Executive Vice President
& CFO(1)
Delek US Holdings, Inc
Executive Vice President
& Chief Operating Officer
Delek US Holdings, Inc
Executive Vice President
Delek US Holdings, Inc
Executive Vice President
& Chief Commercial
Officer
Delek US Holdings, Inc
Executive Vice President
Delek – Israel Fuel
Corporation
Treasurer
Delek US Holdings
Vice President
Ciner Resources
Chief Financial Officer
Green Energy Advisors
President
Tesoro
Vice President,
Development Supply and
Logistics
SunPower Corp.
Business Development
Aska Energy
President
Delek – Israel Fuel
Corporation
Chief Financial Officer
Swary-Yohman Financial
Consultants
Financial Advisor
Cheniere Energy
Vice President of Finance
and Strategic Planning
Murphy Oil
Senior Vice President
Chevron USA
North American Physical
Supply and Trading
Trabelsy & Co
Senior Finance and
Business Consultant
RaceTrac Petroleum
Executive Director, Supply
and Distribution P
re
vi
o
u
s
P
o
si
ti
o
n
s
C
u
rr
en
t
P
o
si
ti
o
n
Uzi Yemin
Chairman &
Chief Executive Officer of Delek Logistics’ GP
25 Years Experience
(1) Effective June 1, 2017, Kevin Kremke will replace Assi Ginzburg as Chief Financial Officer.
Experienced Management Team
Assi Ginzburg
Executive Vice President &
Chief Financial Officer(1)
20 Years Experience
Fred Green
Executive Vice President
30 Years Experience
Kevin Kremke
Executive Vice President &
Chief Financial Officer(1)
20 Years Experience
Avigal Soreq
Executive Vice President
11 Years Experience
Daniel Gordon
Executive Vice President
18 Years Experience
Mark Smith
Executive Vice President
26 Years Experience
30
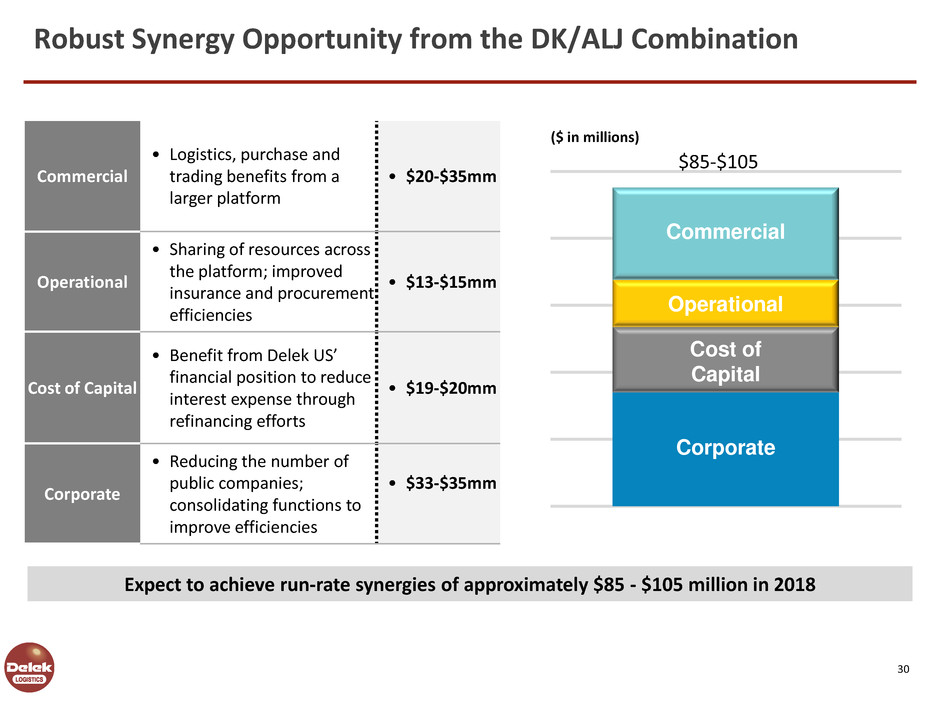
Robust Synergy Opportunity from the DK/ALJ Combination
Expect to achieve run-rate synergies of approximately $85 - $105 million in 2018
Commercial
• Logistics, purchase and
trading benefits from a
larger platform
• $20-$35mm
Operational
• Sharing of resources across
the platform; improved
insurance and procurement
efficiencies
• $13-$15mm
Cost of Capital
• Benefit from Delek US’
financial position to reduce
interest expense through
refinancing efforts
• $19-$20mm
Corporate
• Reducing the number of
public companies;
consolidating functions to
improve efficiencies
• $33-$35mm
$85-$105
($ in millions)
Corporate
Cost of
Capital
Operational
Commercial
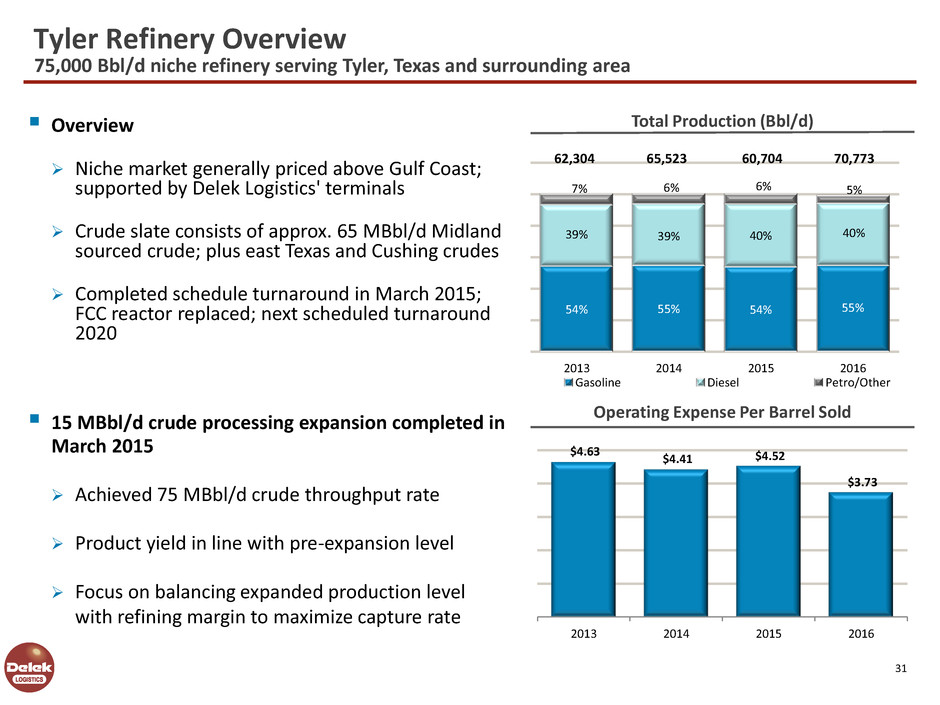
54% 55% 54% 55%
39% 39% 40% 40%
7% 6% 6% 5%
2013 2014 2015 2016
Gasoline Diesel Petro/Other
62,304 65,523 60,704 70,773
Overview
Niche market generally priced above Gulf Coast;
supported by Delek Logistics' terminals
Crude slate consists of approx. 65 MBbl/d Midland
sourced crude; plus east Texas and Cushing crudes
Completed schedule turnaround in March 2015;
FCC reactor replaced; next scheduled turnaround
2020
15 MBbl/d crude processing expansion completed in
March 2015
Achieved 75 MBbl/d crude throughput rate
Product yield in line with pre-expansion level
Focus on balancing expanded production level
with refining margin to maximize capture rate
Total Production (Bbl/d)
$4.63
$4.41 $4.52
$3.73
2013 2014 2015 2016
Operating Expense Per Barrel Sold
31
Tyler Refinery Overview
75,000 Bbl/d niche refinery serving Tyler, Texas and surrounding area
Overview
Inland PADD III refinery located in Southern
Arkansas
Flexible crude sourcing
Access to Gulf Cost crudes beginning in
August 2016
Midland, local Arkansas, east Texas
Rail offloading capability
Mid Valley and Exxon North crude oil
pipeline access
Ability to support a portion of retail fuel needs on
direct/indirect basis through 18 month supply
agreement with COPEC (1)
Improved flexibility and throughput in 1Q 2014
turnaround; next scheduled turnaround 2019
Pre-flash tower project improved light crude
processing capability to approximately 80,000
Bbl/d
Replaced FCC reactor with state of the art
technology
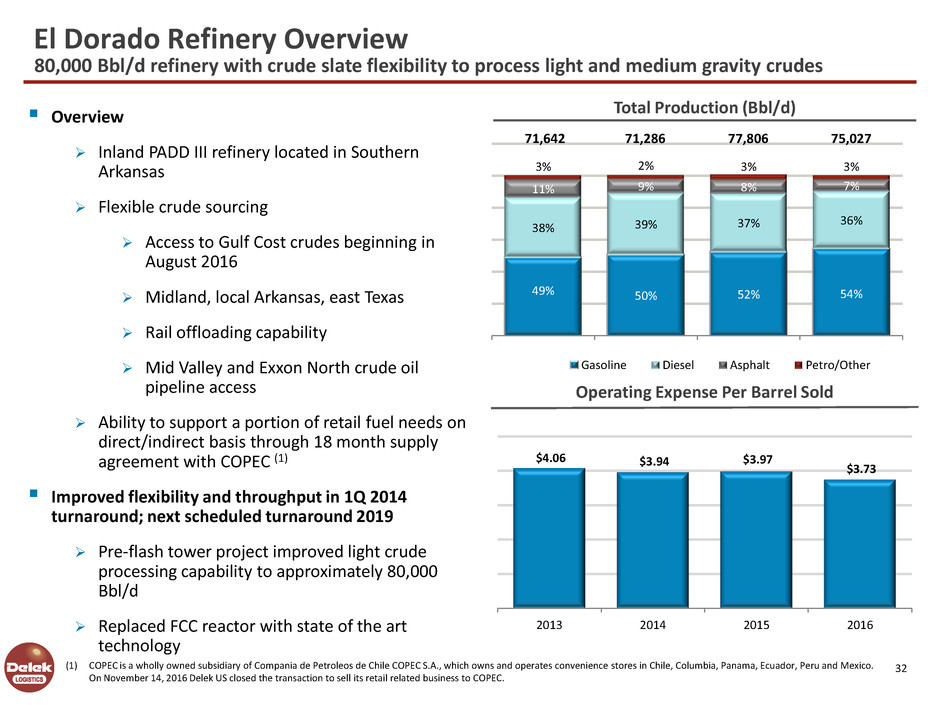
49% 50% 52% 54%
38% 39% 37%
36%
11% 9% 8% 7%
3% 2% 3% 3%
0
0
0
1
1
1
1
2013 2014 2015 2016
Gasoline Diesel Asphalt Petro/Other
71,642 71,286 77,806 75,027
$4.06 $3.94 $3.97
$3.73
2013 2014 2015 2016
Operating Expense Per Barrel Sold
Total Production (Bbl/d)
32
El Dorado Refinery Overview
80,000 Bbl/d refinery with crude slate flexibility to process light and medium gravity crudes
(1) COPEC is a wholly owned subsidiary of Compania de Petroleos de Chile COPEC S.A., which owns and operates convenience stores in Chile, Columbia, Panama, Ecuador, Peru and Mexico.
On November 14, 2016 Delek US closed the transaction to sell its retail related business to COPEC.
Key Retail Cities
Asphalt Terminal
Third-Party Terminal
Alon USA Terminal
Exchange Terminal
Refinery
Third-Party Pipelines
ALON USA
Alon Pipelines (idled)
Oklahoma
638167_1.wor [NY0086JT]
Texas
California
New Mexico
Arizona
Nevada
Oregon
Washington
Arkansas
Louisiana
Midland/i l /aidl ndi li li li la /i l /ai ld ndd ndi li li l
Odessasse ad ssassadeedO
Corpus Christi i ir s r stCo pu Ch i i i i i i i ir r tr r ts is i i is s i iCo pu ChCo pu Chr ri ti i ir r t i i
Abileneile eAbil nililililililAb enee eAb nilililEl Pasol sE Pal ol l l l asl sal E P oE P ol l l
Bakersfieldfi lrsake eB fi ldi li li lr fr fak s i li lsak i lB e e de eB dr fi lfi lr fi l
Mojavejaveojjjavavoj ej eoj
Long Beach L g eacon B h L g ac L g ac on Be heon B h PhoenixiP e xho niiiiixixiPhoenP eho niii
TucsonsT cu oncsscTu onTu on
Paramountr tPa a ounr tr ta aa aP ounP ounr tr t
SouthtSou httSSou hou htt
Marshrsa hrrssa ha hrr
IslandI ls aI l ndlllIIsllslandandI lI lI l
Nederlandlre e ad l ndlllrrlalalede nde ed ndN rllrl
Houstonstou onttssou onou onH tt
LoopLoopLLoopoop
Orlalr allllrrlalalOrllrl
Moriartyir rta yo iiiir rtr rti yi yio aaori rtir rti
LubbockL ckubboL ckL ckubboubbo
Big Springi irg S gBi p ini ii ii irrig S i gi ig S gi iB p nB p ni rii iri i
Wichita Fallsi i llt sc a Fai hi lli i lli i lli i llttic i a Fallsi i llsc a Fai i llhhi it li i lti i l
Fort Worth rt rtFo o h rt rtrt rtF F o o ho o hrt rt rt rt
Dallasll sa aD llllllllallasll sa allD llD l
DuncancaDun ncacaun nun nDD
Albuquerquel re eAlbuqu qulll rrlllA buque quee eA buqu qul rl rl
EmpireirE epiiiirriiiE p eE epiriri
Flagstaffl ffstF ag al fflll t fft ffFlags al sF ag all t fl ftl f
Elk Grovel rE k vel ol l l rrlk vl k vl E o eE eol Grl rl FemleylFe eyllllF l ylF yle ee elll
Richmond Beachi c eacRi h ond B hi i i ic aci c aci R h ond Be heR h ond B hi i i
Krotz Springs ir tz r sS gK o p in i i ir t rr t rz S i gs iz sS g iK o p nK o p nr t ri ir t r i
Bloomfieldl fi leBloo fi ldl i ll i ll i lffl i ll i ll i lB oo e deB oo dl fi ll fi ll fi l
TulsalsT aulllllsalsalTuTulll
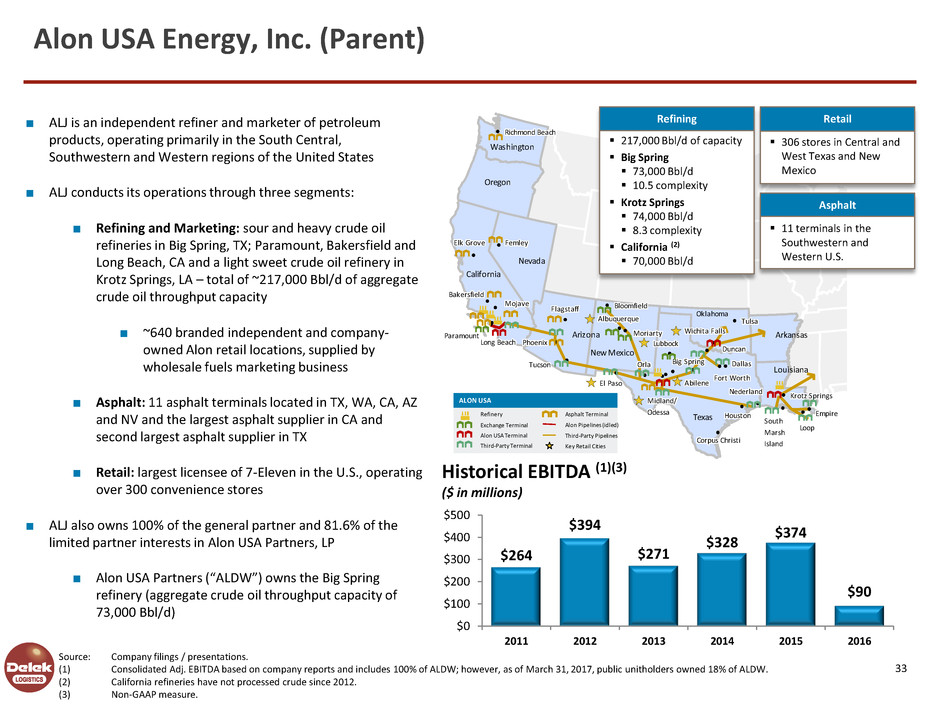
■ ALJ is an independent refiner and marketer of petroleum
products, operating primarily in the South Central,
Southwestern and Western regions of the United States
■ ALJ conducts its operations through three segments:
■ Refining and Marketing: sour and heavy crude oil
refineries in Big Spring, TX; Paramount, Bakersfield and
Long Beach, CA and a light sweet crude oil refinery in
Krotz Springs, LA – total of ~217,000 Bbl/d of aggregate
crude oil throughput capacity
■ ~640 branded independent and company-
owned Alon retail locations, supplied by
wholesale fuels marketing business
■ Asphalt: 11 asphalt terminals located in TX, WA, CA, AZ
and NV and the largest asphalt supplier in CA and
second largest asphalt supplier in TX
■ Retail: largest licensee of 7-Eleven in the U.S., operating
over 300 convenience stores
■ ALJ also owns 100% of the general partner and 81.6% of the
limited partner interests in Alon USA Partners, LP
■ Alon USA Partners (“ALDW”) owns the Big Spring
refinery (aggregate crude oil throughput capacity of
73,000 Bbl/d)
Historical EBITDA (1)(3)
($ in millions)
217,000 Bbl/d of capacity
Big Spring
73,000 Bbl/d
10.5 complexity
Krotz Springs
74,000 Bbl/d
8.3 complexity
California (2)
70,000 Bbl/d
Refining
306 stores in Central and
West Texas and New
Mexico
Retail
Asphalt
11 terminals in the
Southwestern and
Western U.S.
Source: Company filings / presentations.
(1) Consolidated Adj. EBITDA based on company reports and includes 100% of ALDW; however, as of March 31, 2017, public unitholders owned 18% of ALDW.
(2) California refineries have not processed crude since 2012.
(3) Non-GAAP measure.
$264
$394
$271
$328
$374
$90
$0
$100
$200
$300
$400
$500
2011 2012 2013 2014 2015 2016
33
Alon USA Energy, Inc. (Parent)
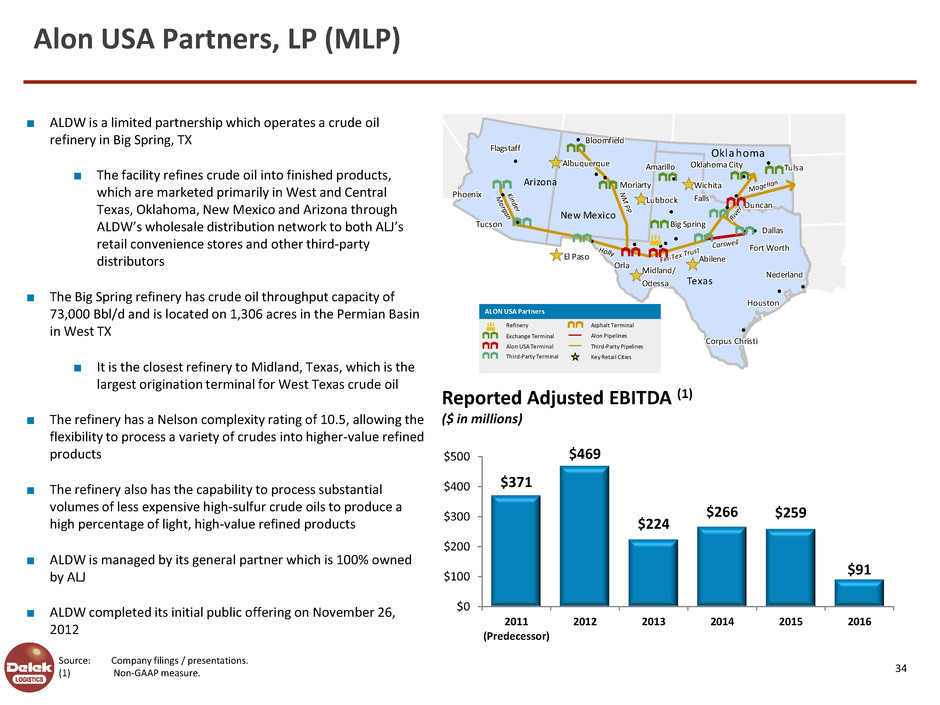
■ ALDW is a limited partnership which operates a crude oil
refinery in Big Spring, TX
■ The facility refines crude oil into finished products,
which are marketed primarily in West and Central
Texas, Oklahoma, New Mexico and Arizona through
ALDW’s wholesale distribution network to both ALJ’s
retail convenience stores and other third-party
distributors
■ The Big Spring refinery has crude oil throughput capacity of
73,000 Bbl/d and is located on 1,306 acres in the Permian Basin
in West TX
■ It is the closest refinery to Midland, Texas, which is the
largest origination terminal for West Texas crude oil
■ The refinery has a Nelson complexity rating of 10.5, allowing the
flexibility to process a variety of crudes into higher-value refined
products
■ The refinery also has the capability to process substantial
volumes of less expensive high-sulfur crude oils to produce a
high percentage of light, high-value refined products
■ ALDW is managed by its general partner which is 100% owned
by ALJ
■ ALDW completed its initial public offering on November 26,
2012
Reported Adjusted EBITDA (1)
($ in millions)
Source: Company filings / presentations.
(1) Non-GAAP measure.
Oklahoma
638167_1.wor [NY0086JT]
Arizona
New Mexico
Texas
Kinder
i
er
Kindi er
iiiiKinder
i
er
Kindi er
iiiii
er
i
er
ii
er
Kindi
Kindi
i
er
i
er
ii
er
M
organ
ro gan
M
rrrro gan
o
gan
M
rr
M
ro gan
o
gan
rrr
Hollyllllylllllllylly
Ho lll
Mage
llanlllllllllle lllag a
nlll
Riv
eri
r
iveRi
r
i
r
i
r
ii
r
R v
eveRi
r
i
r
ii
r
Riv
eri
r
iveRi
r
Fin-Te
x Trus
t
i
-
r st
Fi e
x i
i
i
-
r t
-
r t
Fi Te
x T s
i
s
Fi e
x n
u
i -
r t
i
-
r t
i
Flagstaffl ffstl ffl ffststF ag al ffl ff
TucsonsssT cu on
Albuquerquel rll rre eAlbuqu qul
Moriartyir rtiir rtr rta yo ii
DuncancaDun n
TulsalsllssT aull
Big Springi iri ii irrg S gBi p ini i
Wichitai iti ii ittc ai hii i
FallsllsllllssFa ll
Fort Worth rt rt rt rtrt rtFo o h
Dallasll sllll ssa aD ll
Abileneililile eAbil nil
Midland/i l /i li l //aidl ndi l
Odessasssssse ad
Orlalrllrr all
El Pasol sl l ssE al P ol
Oklahoma Cityl itl il ittk a a yl ho Cil iAmarilloillrillillrraA i loi l
LubbockL ckubbo
Phoenixiiie xPho nii
Nederlandlrllrre e ad l ndl
Corpus Christii ir s C r sti ii ir s C r str s C r stCo pu h i ii i
Houstonstststou on
Carswellllrs llllllllrrs e lls lCar w llr l
NM
PP
N
PP
M
N
PP
N
PP
N
PP
N
PP
M
M
N
PP
N
PP
N
PP
NM
PP
N
PP
M
N
PP
Bloomfieldl i lfl i ll i lff eBloo i ldl i l
Key Retail Cities
Asphalt Terminal
Third-Party Terminal
Alon USA Terminal
Exchange Terminal
Refinery
Third-Party Pipelines
ALON USA Partners
Alon Pipelines
$371
$469
$224
$266 $259
$91
$0
$100
$200
$300
$400
$500
2011
(Predecessor)
2012 2013 2014 2015 2016
34
Alon USA Partners, LP (MLP)
35
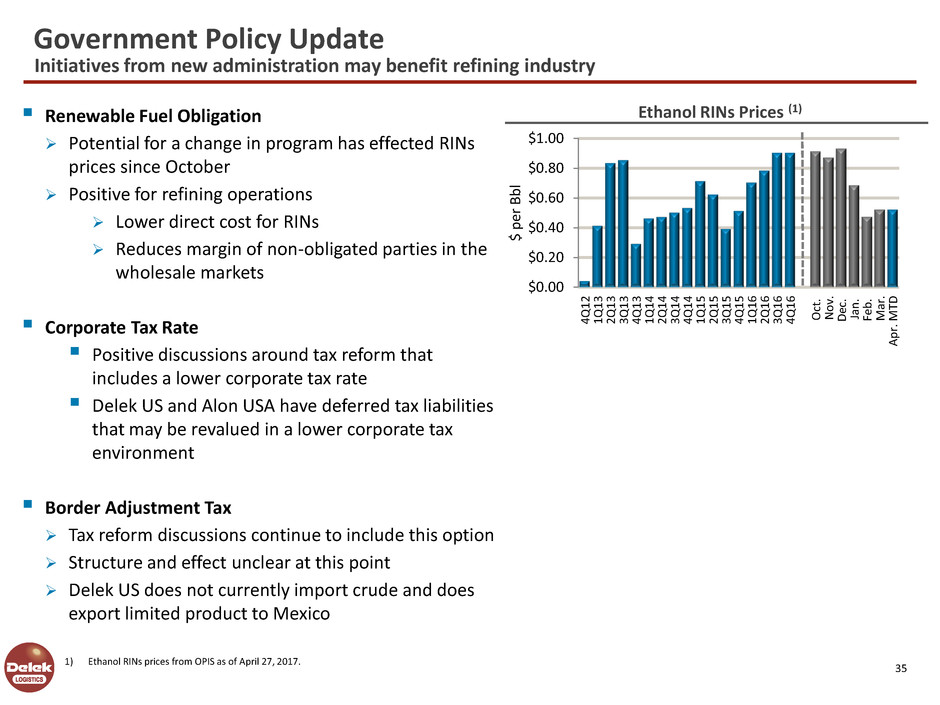
Ethanol RINs Prices (1)
1) Ethanol RINs prices from OPIS as of April 27, 2017.
$0.00
$0.20
$0.40
$0.60
$0.80
$1.00
4Q1
2
1Q1
3
2Q1
3
3Q1
3
4Q1
3
1Q1
4
2Q1
4
3Q1
4
4Q1
4
1Q1
5
2Q1
5
3Q1
5
4Q1
5
1Q
1
6
2Q1
6
3Q1
6
4Q1
6
Oct.
N
o
v.
D
ec.
Ja
n
.
Fe
b
.
M
ar
.
A
p
r.
M
TD
$
p
er
B
b
l
Renewable Fuel Obligation
Potential for a change in program has effected RINs
prices since October
Positive for refining operations
Lower direct cost for RINs
Reduces margin of non-obligated parties in the
wholesale markets
Corporate Tax Rate
Positive discussions around tax reform that
includes a lower corporate tax rate
Delek US and Alon USA have deferred tax liabilities
that may be revalued in a lower corporate tax
environment
Border Adjustment Tax
Tax reform discussions continue to include this option
Structure and effect unclear at this point
Delek US does not currently import crude and does
export limited product to Mexico
Government Policy Update
Initiatives from new administration may benefit refining industry
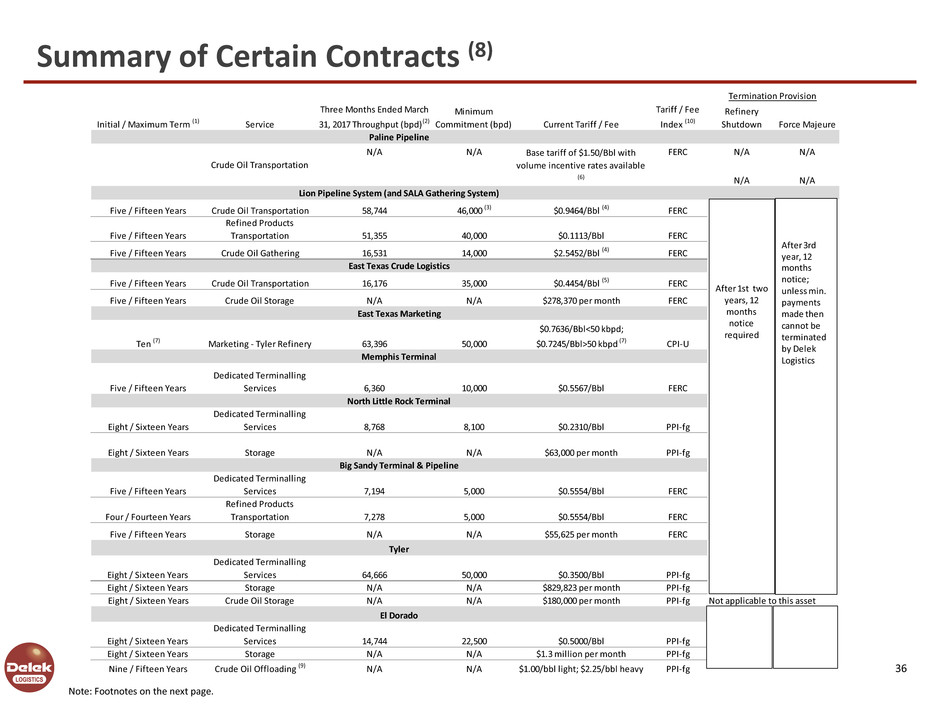
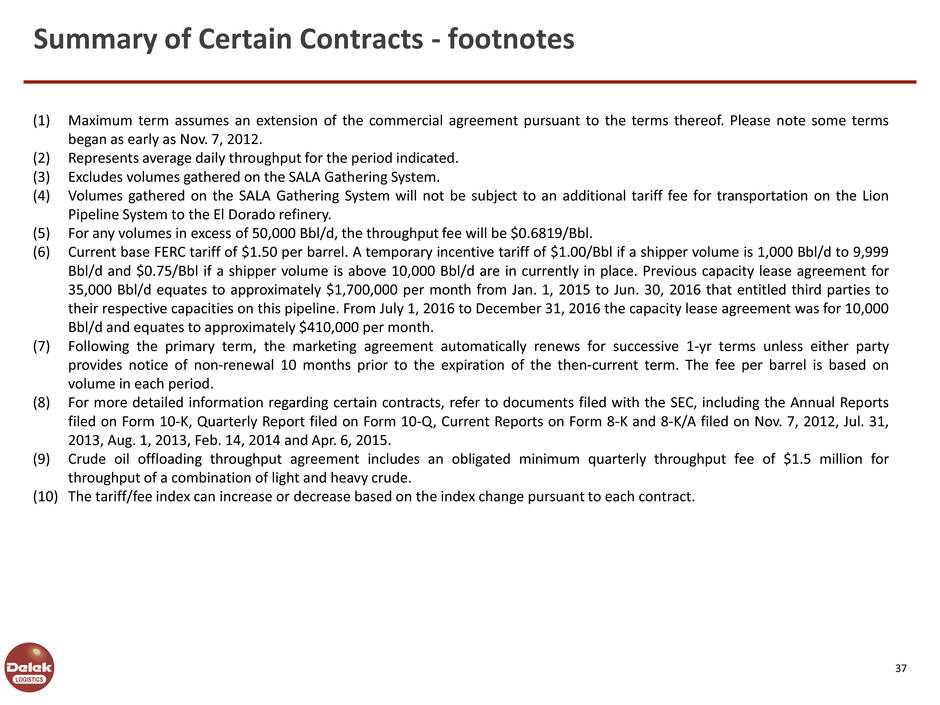
Summary of Certain Contracts (8)
Initial / Maximum Term (1) Service
Three Months Ended March
31, 2017 Throughput (bpd)(2)
Minimum
Commitment (bpd) Current Tariff / Fee
Tariff / Fee
Index (10)
Refinery
Shutdown Force Majeure
N/A N/A FERC N/A N/A
N/A N/A
Five / Fifteen Years Crude Oil Transportation 58,744 46,000 (3) $0.9464/Bbl (4) FERC
Five / Fifteen Years
Refined Products
Transportation 51,355 40,000 $0.1113/Bbl FERC
Five / Fifteen Years Crude Oil Gathering 16,531 14,000 $2.5452/Bbl (4) FERC
Five / Fifteen Years Crude Oil Transportation 16,176 35,000 $0.4454/Bbl (5) FERC
Five / Fifteen Years Crude Oil Storage N/A N/A $278,370 per month FERC
Ten (7) Marketing - Tyler Refinery 63,396 50,000
$0.7636/Bbl<50 kbpd;
$0.7245/Bbl>50 kbpd (7) CPI-U
Five / Fifteen Years
Dedicated Terminalling
Services 6,360 10,000 $0.5567/Bbl FERC
Eight / Sixteen Years
Dedicated Terminalling
Services 8,768 8,100 $0.2310/Bbl PPI-fg
Eight / Sixteen Years Storage N/A N/A $63,000 per month PPI-fg
Five / Fifteen Years
Dedicated Terminalling
Services 7,194 5,000 $0.5554/Bbl FERC
Four / Fourteen Years
Refined Products
Transportation 7,278 5,000 $0.5554/Bbl FERC
Five / Fifteen Years Storage N/A N/A $55,625 per month FERC
Eight / Sixteen Years
Dedicated Terminalling
Services 64,666 50,000 $0.3500/Bbl PPI-fg
Eight / Sixteen Years Storage N/A N/A $829,823 per month PPI-fg
Eight / Sixteen Years Crude Oil Storage N/A N/A $180,000 per month PPI-fg Not applicable to this asset
Eight / Sixteen Years
Dedicated Terminalling
Services 14,744 22,500 $0.5000/Bbl PPI-fg
Eight / Sixteen Years Storage N/A N/A $1.3 million per month PPI-fg
Nine / Fifteen Years Crude Oil Offloading (9) N/A N/A $1.00/bbl light; $2.25/bbl heavy PPI-fg
El Dorado
Paline Pipeline
East Texas Marketing
Memphis Terminal
Termination Provision
East Texas Crude Logistics
North Little Rock Terminal
Crude Oil Transportation
Base tariff of $1.50/Bbl with
volume incentive rates available
(6)
Tyler
Big Sandy Terminal & Pipeline
Lion Pipeline System (and SALA Gathering System)
After 1st two
years, 12
months
notice
required
After 3rd
year, 12
months
notice;
unless min.
payments
made then
cannot be
terminated
by Delek
Logistics
36
Note: Footnotes on the next page.
(1) Maximum term assumes an extension of the commercial agreement pursuant to the terms thereof. Please note some terms
began as early as Nov. 7, 2012.
(2) Represents average daily throughput for the period indicated.
(3) Excludes volumes gathered on the SALA Gathering System.
(4) Volumes gathered on the SALA Gathering System will not be subject to an additional tariff fee for transportation on the Lion
Pipeline System to the El Dorado refinery.
(5) For any volumes in excess of 50,000 Bbl/d, the throughput fee will be $0.6819/Bbl.
(6) Current base FERC tariff of $1.50 per barrel. A temporary incentive tariff of $1.00/Bbl if a shipper volume is 1,000 Bbl/d to 9,999
Bbl/d and $0.75/Bbl if a shipper volume is above 10,000 Bbl/d are in currently in place. Previous capacity lease agreement for
35,000 Bbl/d equates to approximately $1,700,000 per month from Jan. 1, 2015 to Jun. 30, 2016 that entitled third parties to
their respective capacities on this pipeline. From July 1, 2016 to December 31, 2016 the capacity lease agreement was for 10,000
Bbl/d and equates to approximately $410,000 per month.
(7) Following the primary term, the marketing agreement automatically renews for successive 1-yr terms unless either party
provides notice of non-renewal 10 months prior to the expiration of the then-current term. The fee per barrel is based on
volume in each period.
(8) For more detailed information regarding certain contracts, refer to documents filed with the SEC, including the Annual Reports
filed on Form 10-K, Quarterly Report filed on Form 10-Q, Current Reports on Form 8-K and 8-K/A filed on Nov. 7, 2012, Jul. 31,
2013, Aug. 1, 2013, Feb. 14, 2014 and Apr. 6, 2015.
(9) Crude oil offloading throughput agreement includes an obligated minimum quarterly throughput fee of $1.5 million for
throughput of a combination of light and heavy crude.
(10) The tariff/fee index can increase or decrease based on the index change pursuant to each contract.
37
Summary of Certain Contracts - footnotes
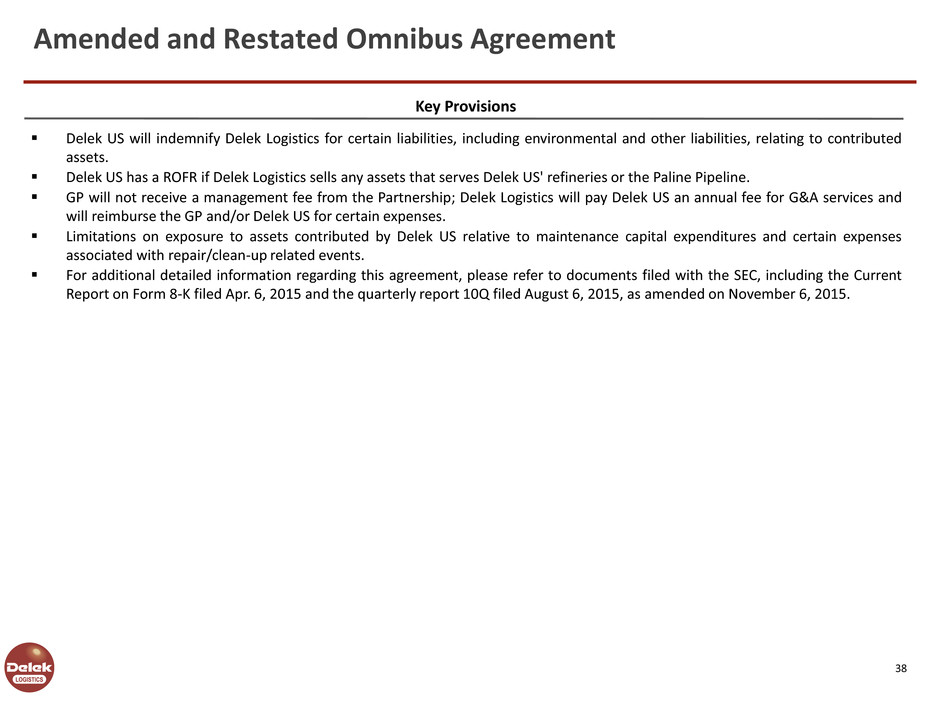
Key Provisions
Delek US will indemnify Delek Logistics for certain liabilities, including environmental and other liabilities, relating to contributed
assets.
Delek US has a ROFR if Delek Logistics sells any assets that serves Delek US' refineries or the Paline Pipeline.
GP will not receive a management fee from the Partnership; Delek Logistics will pay Delek US an annual fee for G&A services and
will reimburse the GP and/or Delek US for certain expenses.
Limitations on exposure to assets contributed by Delek US relative to maintenance capital expenditures and certain expenses
associated with repair/clean-up related events.
For additional detailed information regarding this agreement, please refer to documents filed with the SEC, including the Current
Report on Form 8-K filed Apr. 6, 2015 and the quarterly report 10Q filed August 6, 2015, as amended on November 6, 2015.
38
Amended and Restated Omnibus Agreement
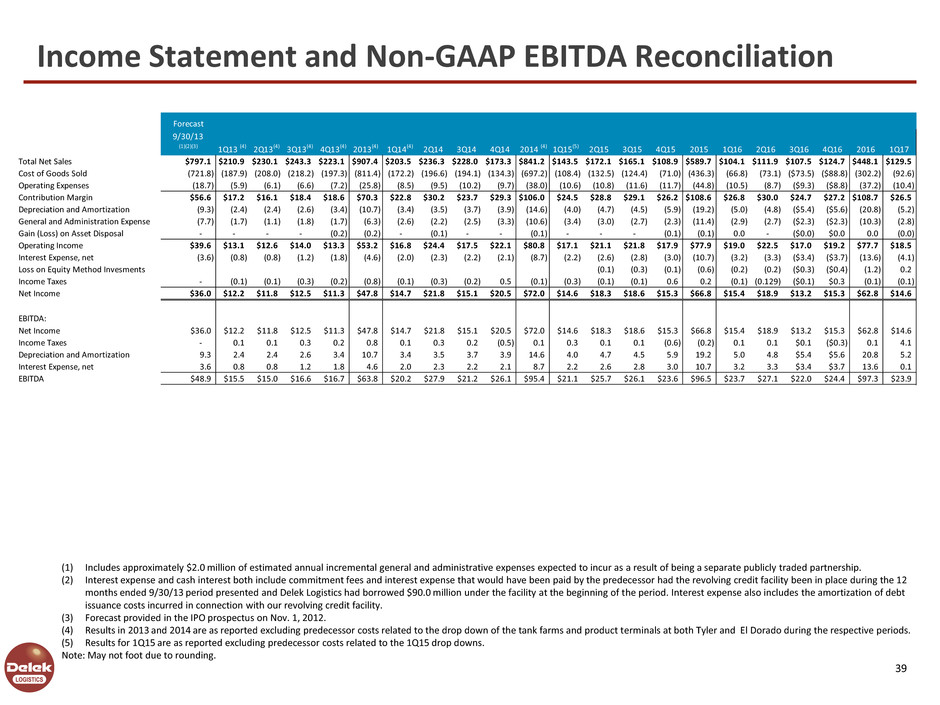
Income Statement and Non-GAAP EBITDA Reconciliation
(1) Includes approximately $2.0 million of estimated annual incremental general and administrative expenses expected to incur as a result of being a separate publicly traded partnership.
(2) Interest expense and cash interest both include commitment fees and interest expense that would have been paid by the predecessor had the revolving credit facility been in place during the 12
months ended 9/30/13 period presented and Delek Logistics had borrowed $90.0 million under the facility at the beginning of the period. Interest expense also includes the amortization of debt
issuance costs incurred in connection with our revolving credit facility.
(3) Forecast provided in the IPO prospectus on Nov. 1, 2012.
(4) Results in 2013 and 2014 are as reported excluding predecessor costs related to the drop down of the tank farms and product terminals at both Tyler and El Dorado during the respective periods.
(5) Results for 1Q15 are as reported excluding predecessor costs related to the 1Q15 drop downs.
Note: May not foot due to rounding.
Forecast12 Months
9/30/13
(1)(2)(3) 1Q13 (4) 2Q13(4) 3Q13(4) 4Q13(4) 2013(4) 1Q14(4) 2Q14 3Q14 4Q14 2014 (4) 1Q15(5) 2Q15 3Q15 4Q15 2015 1Q16 2Q16 3Q16 4Q16 2016 1Q17
Total Net Sales $797.1 $210.9 $230.1 $243.3 $223.1 $907.4 $203.5 $236.3 $228.0 $173.3 $841.2 $143.5 $172.1 $165.1 $108.9 $589.7 $104.1 $111.9 $107.5 $124.7 $448.1 $129.5
Cost of Goods Sold (721.8) (187.9) (208.0) (218.2) (197.3) (811.4) (172.2) (196.6) (194.1) (134.3) (697.2) (108.4) (132.5) (124.4) (71.0) (436.3) (66.8) (73.1) ($73.5) ($88.8) (302.2) (92.6)
Operating Expenses (18.7) (5.9) (6.1) (6.6) (7.2) (25.8) (8.5) (9.5) (10.2) (9.7) (38.0) (10.6) (10.8) (11.6) (11.7) (44.8) (10.5) (8.7) ($9.3) ($8.8) (37.2) (10.4)
Contribution Margin $56.6 $17.2 $16.1 $18.4 $18.6 $70.3 $22.8 $30.2 $23.7 $29.3 $106.0 $24.5 $28.8 $29.1 $26.2 $108.6 $26.8 $30.0 $24.7 $27.2 $108.7 $26.5
Depreciation and Amortization (9.3) (2.4) (2.4) (2.6) (3.4) (10.7) (3.4) (3.5) (3.7) (3.9) (14.6) (4.0) (4.7) (4.5) (5.9) (19.2) (5.0) (4.8) ($5.4) ($5.6) (20.8) (5.2)
General and Administration Expense (7.7) (1.7) (1.1) (1.8) (1.7) (6.3) (2.6) (2.2) (2.5) (3.3) (10.6) (3.4) (3.0) (2.7) (2.3) (11.4) (2.9) (2.7) ($2.3) ($2.3) (10.3) (2.8)
Gain (Loss) on Asset Disposal - - - - (0.2) (0.2) - (0.1) - - (0.1) - - - (0.1) (0.1) 0.0 - ($0.0) $0.0 0.0 (0.0)
Operating Income $39.6 $13.1 $12.6 $14.0 $13.3 $53.2 $16.8 $24.4 $17.5 $22.1 $80.8 $17.1 $21.1 $21.8 $17.9 $77.9 $19.0 $22.5 $17.0 $19.2 $77.7 $18.5
Interest Expense, net (3.6) (0.8) (0.8) (1.2) (1.8) (4.6) (2.0) (2.3) (2.2) (2.1) (8.7) (2.2) (2.6) (2.8) (3.0) (10.7) (3.2) (3.3) ($3.4) ($3.7) (13.6) (4.1)
Loss on Equity Method Invesments (0.1) (0.3) (0.1) (0.6) (0.2) (0.2) ($0.3) ($0.4) (1.2) 0.2
Income Taxes - (0.1) (0.1) (0.3) (0.2) (0.8) (0.1) (0.3) (0.2) 0.5 (0.1) (0.3) (0.1) (0.1) 0.6 0.2 (0.1) (0.129) ($0.1) $0.3 (0.1) (0.1)
Net Income $36.0 $12.2 $11.8 $12.5 $11.3 $47.8 $14.7 $21.8 $15.1 $20.5 $72.0 $14.6 $18.3 $18.6 $15.3 $66.8 $15.4 $18.9 $13.2 $15.3 $62.8 $14.6
EBITDA:
Net Income $36.0 $12.2 $11.8 $12.5 $11.3 $47.8 $14.7 $21.8 $15.1 $20.5 $72.0 $14.6 $18.3 $18.6 $15.3 $66.8 $15.4 $18.9 $13.2 $15.3 $62.8 $14.6
Income Taxes - 0.1 0.1 0.3 0.2 0.8 0.1 0.3 0.2 (0.5) 0.1 0.3 0.1 0.1 (0.6) (0.2) 0.1 0.1 $0.1 ($0.3) 0.1 4.1
Depreciation and Amortization 9.3 2.4 2.4 2.6 3.4 10.7 3.4 3.5 3.7 3.9 14.6 4.0 4.7 4.5 5.9 19.2 5.0 4.8 $5.4 $5.6 20.8 5.2
Interest Expense, net 3.6 0.8 0.8 1.2 1.8 4.6 2.0 2.3 2.2 2.1 8.7 2.2 2.6 2.8 3.0 10.7 3.2 3.3 $3.4 $3.7 13.6 0.1
EBITDA $48.9 $15.5 $15.0 $16.6 $16.7 $63.8 $20.2 $27.9 $21.2 $26.1 $95.4 $21.1 $25.7 $26.1 $23.6 $96.5 $23.7 $27.1 $22.0 $24.4 $97.3 $23.9
39
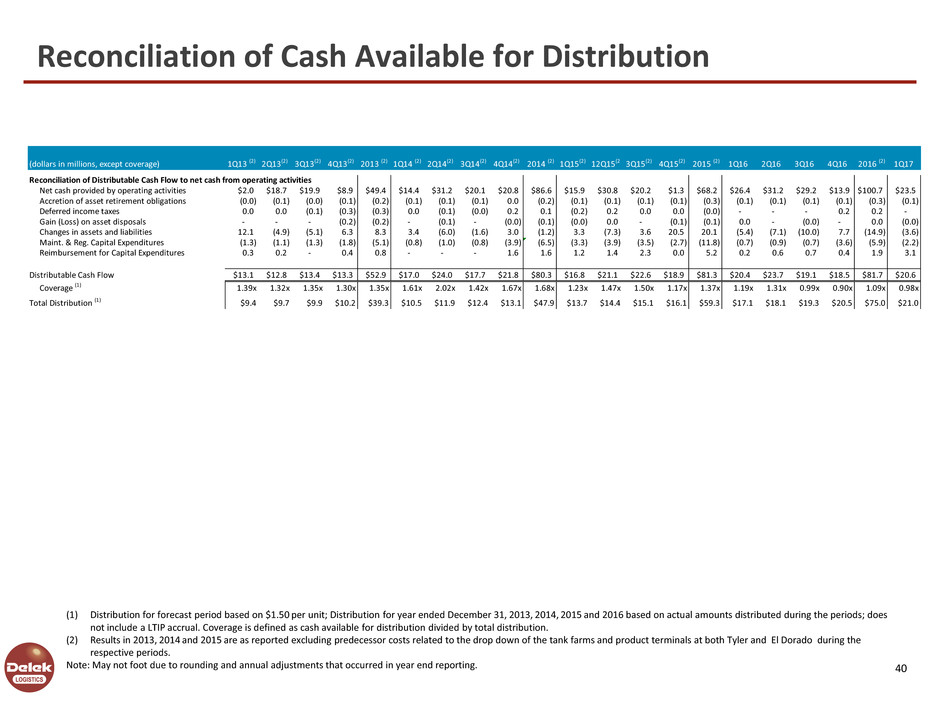
Reconciliation of Cash Available for Distribution
(1) Distribution for forecast period based on $1.50 per unit; Distribution for year ended December 31, 2013, 2014, 2015 and 2016 based on actual amounts distributed during the periods; does
not include a LTIP accrual. Coverage is defined as cash available for distribution divided by total distribution.
(2) Results in 2013, 2014 and 2015 are as reported excluding predecessor costs related to the drop down of the tank farms and product terminals at both Tyler and El Dorado during the
respective periods.
Note: May not foot due to rounding and annual adjustments that occurred in year end reporting.
(dollars in millions, except coverage) 1Q13 (2) 2Q13(2) 3Q13(2) 4Q13(2) 2013 (2) 1Q14 (2) 2Q14(2) 3Q14(2) 4Q14(2) 2014 (2) 1Q15(2) 12Q15(2 3Q15(2) 4Q15(2) 2015 (2) 1Q16 2Q16 3Q16 4Q16 2016 (2) 1Q17
Reconciliation of Distributable Cash Flow to net cash from operating activities
Net cash provided by operating activities $2.0 $18.7 $19.9 $8.9 $49.4 $14.4 $31.2 $20.1 $20.8 $86.6 $15.9 $30.8 $20.2 $1.3 $68.2 $26.4 $31.2 $29.2 $13.9 $100.7 $23.5
Accretion of asset retirement obligations (0.0) (0.1) (0.0) (0.1) (0.2) (0.1) (0.1) (0.1) 0.0 (0.2) (0.1) (0.1) (0.1) (0.1) (0.3) (0.1) (0.1) (0.1) (0.1) (0.3) (0.1)
Deferred income taxes 0.0 0.0 (0.1) (0.3) (0.3) 0.0 (0.1) (0.0) 0.2 0.1 (0.2) 0.2 0.0 0.0 (0.0) - - - 0.2 0.2 -
Gain (Loss) on asset disposals - - - (0.2) (0.2) - (0.1) - (0.0) (0.1) (0.0) 0.0 - (0.1) (0.1) 0.0 - (0.0) - 0.0 (0.0)
Ch nges in assets and liabilities 12.1 (4.9) (5.1) 6.3 8.3 3.4 (6.0) (1.6) 3.0 (1.2) 3.3 (7.3) 3.6 20.5 20.1 (5.4) (7.1) (10.0) 7.7 (14.9) (3.6)
Maint. & Reg. Capital Expenditures (1.3) (1.1) (1.3) (1.8) (5.1) (0.8) (1.0) (0.8) (3.9) (6.5) (3.3) (3.9) (3.5) (2.7) (11.8) (0.7) (0.9) (0.7) (3.6) (5.9) (2.2)
Reimbursement for Capital Expenditures 0.3 0.2 - 0.4 0.8 - - - 1.6 1.6 1.2 1.4 2.3 0.0 5.2 0.2 0.6 0.7 0.4 1.9 3.1
Distributable Cash Flow $13.1 $12.8 $13.4 $13.3 $52.9 $17.0 $24.0 $17.7 $21.8 $80.3 $16.8 $21.1 $22.6 $18.9 $81.3 $20.4 $23.7 $19.1 $18.5 $81.7 $20.6
Coverage (1) 1.39x 1.32x 1.35x 1.30x 1.35x 1.61x 2.02x 1.42x 1.67x 1.68x 1.23x 1.47x 1.50x 1.17x 1.37x 1.19x 1.31x 0.99x 0.90x 1.09x 0.98x
Total Distribution (1) $9.4 $9.7 $9.9 $10.2 $39.3 $10.5 $11.9 $12.4 $13.1 $47.9 $13.7 $14.4 $15.1 $16.1 $59.3 $17.1 $18.1 $19.3 $20.5 $75.0 $21.0
40
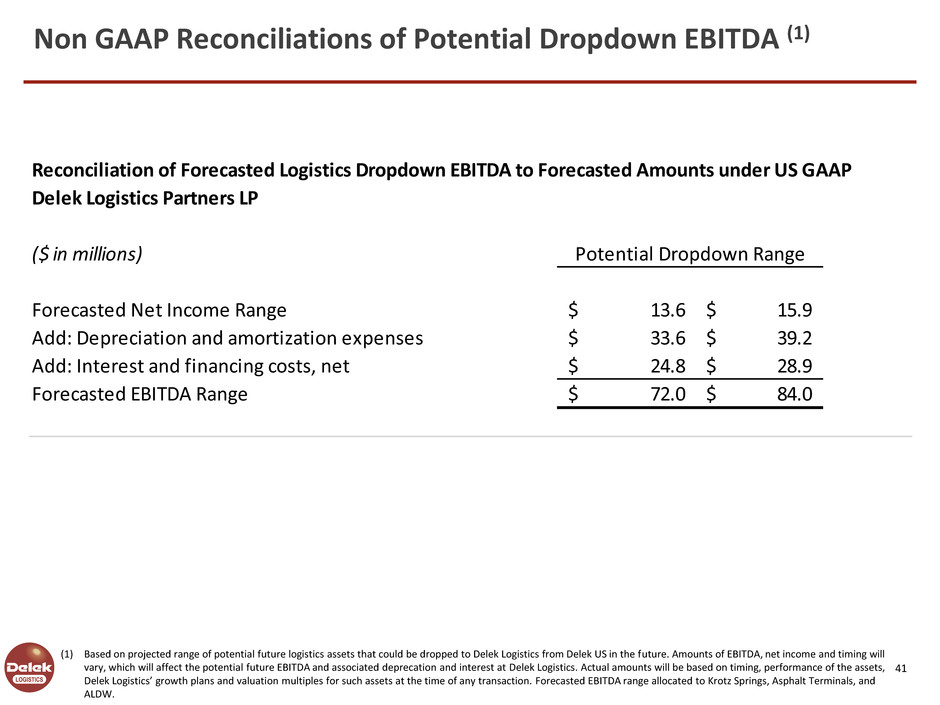
(1) Based on projected range of potential future logistics assets that could be dropped to Delek Logistics from Delek US in the future. Amounts of EBITDA, net income and timing will
vary, which will affect the potential future EBITDA and associated deprecation and interest at Delek Logistics. Actual amounts will be based on timing, performance of the assets,
Delek Logistics’ growth plans and valuation multiples for such assets at the time of any transaction. Forecasted EBITDA range allocated to Krotz Springs, Asphalt Terminals, and
ALDW.
Reconciliation of Forecasted Logistics Dropdown EBITDA to Forecasted Amounts under US GAAP
Delek Logistics Partners LP
($ in millions)
Forecasted Net Income Range 13.6$ 15.9$
Add: Depreciation and amortization expenses 33.6$ 39.2$
Add: Interest and financing costs, net 24.8$ 28.9$
Forecasted EBITDA Range 72.0$ 84.0$
Potential Dropdown Range
41
Non GAAP Reconciliations of Potential Dropdown EBITDA (1)
