Attached files
| file | filename |
|---|---|
| 8-K - FORM 8-K - DELTIC TIMBER CORP | dp76012_8k.htm |
Exhibit 99.1
Deltic Timber Investor Presentation May 2017
Forward - Looking Statements 2 These slides, and statements made during this presentation, contain forward - looking statements within the meaning of the Private Securities Litigation Reform Act of 1995 . These statements reflect management’s current views and are subject to risks and uncertainties that could cause actual results to differ materially from those expressed or implied in these statements . Some forward - looking statements discuss the Company’s plans, strategies, and intentions, and use words such as “expects”, “may”, “will”, “believes”, “should”, “approximately”, “anticipates”, “estimates”, and “plans” . Factors which could cause actual results to differ relate to ( 1 ) general economic conditions, including but not limited to the level of interest rates, availability of financing for home mortgages and commercial real estate development, employment rates, housing starts, and strength of the U . S . dollar ; ( 2 ) political environment, including but not limited to changes in legislation or tax rules ; the effect of forestry, land use, environmental, and other governmental regulations ; and changes in pension and health care costs ; ( 3 ) industry conditions, including but not limited to changes in the cost and availability of raw materials, energy and transportation costs, competition from domestic and foreign producers, cyclicality, demand, and pricing for our products ; ( 4 ) the effects of weather and the risk of loss from fires, floods, windstorms, pest infestation, and other natural disasters ; ( 5 ) legal proceedings ; ( 6 ) changes in accounting principles ; and ( 7 ) performance of the Company’s manufacturing operations, including maintenance requirements and operating efficiencies . We undertake no obligation to publicly update any forward - looking statements, whether as a result of new information, future events, or otherwise . These and other factors that could cause or contribute to actual results differing materially from such forward - looking statements are discussed in greater detail in the Company’s Securities and Exchange Commission filings .
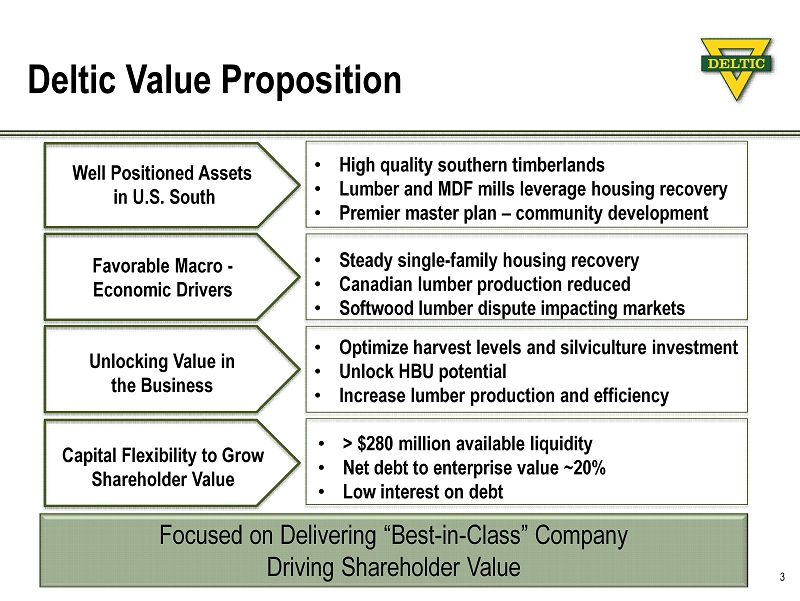
Deltic Value Proposition 3 Well Positioned Assets in U.S. South Favorable Macro - Economic Drivers Unlocking Value in the Business Capital Flexibility to Grow Shareholder Value • High quality s outhern timberlands • Lumber and MDF mills leverage housing recovery • Premier master plan – community development • Steady single - family housing recovery • Canadian lumber production reduced • Softwood l umber dispute impacting markets • Optimize harvest levels and silviculture investment • Unlock HBU potential • Increase lumber production and efficiency • > $280 million available liquidity • Net debt to enterprise value ~20% • Low interest on debt Focused on Delivering “Best - in - Class” Company Driving Shareholder Value
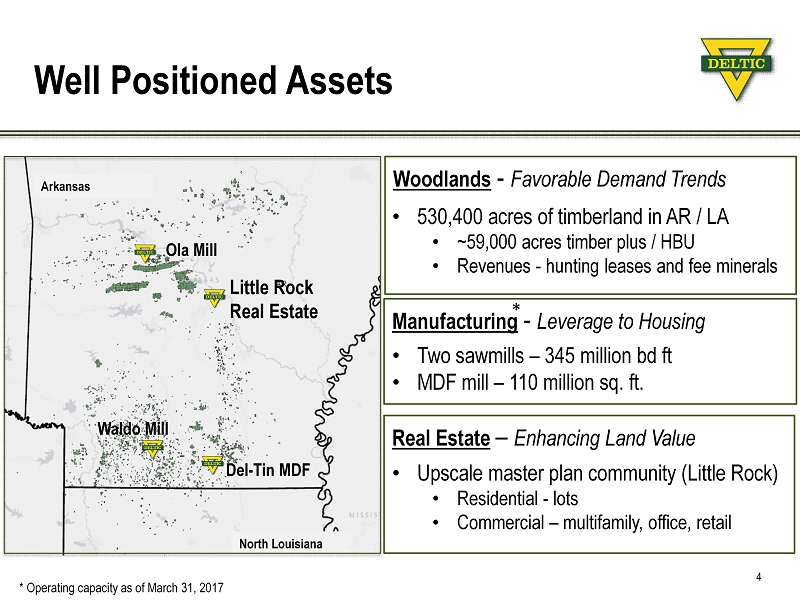
Real Estate – Enhancing Land Value Woodlands - Favorable Demand Trends Manufacturing - Leverage to Housing • 530,400 acres of timberland in AR / LA • ~59,000 acres timber plus / HBU • Revenues - h unting leases and fee minerals • Two sawmills – 345 million bd ft • MDF mill – 110 million sq. ft. • Upscale master plan community (Little Rock ) • Residential - lots • Commercial – multifamily, office, retail Well Positioned Assets 4 North Louisiana Ola Mill Waldo Mill Del - Tin MDF Little Rock Real Estate Arkansas * Operating capacity as of March 31, 2017 *
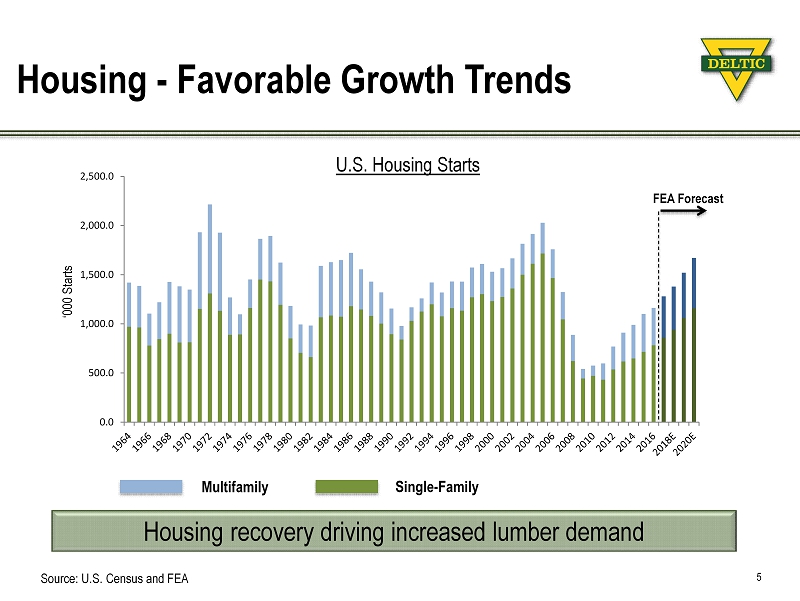
Housing - Favorable Growth Trends 5 Housing recovery driving increased lumber demand ‘000 Starts U.S. Housing Starts 0.0 500.0 1,000.0 1,500.0 2,000.0 2,500.0 FEA Forecast Multifamily Single - Family Source: U.S. Census and FEA
Changes Benefit Southern Wood Baskets 6 • Long - term reduction in Annual Allowable Cut in Canada • Historically Canada supplied approximately 1/3 of U.S. lumber demand • Beetle infestation British Columbia and reduced Eastern Canada AAC • Higher lumber exports to China • New investment / modernization of lumber mills beginning in southern US • Announced capacity expansions in mid - south could increase sawlog demand by nearly 4 million tons per year • Softwood Lumber Tariff / Dispute Southern U.S. timber baskets well positioned for longer - term demand growth due to structural shifts in lumber industry
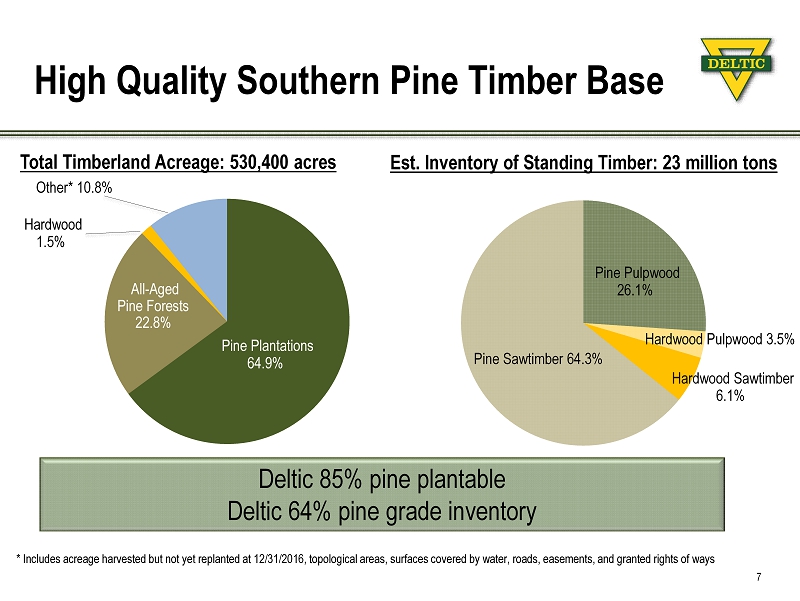
Deltic 85% pine plantable Deltic 64% pine grade inventory High Quality Southern Pine Timber Base 7 * Includes acreage harvested but not yet replanted at 12/31/2016, topological areas, surfaces covered by water, roads, easements, and granted rights of ways All - Aged Pine Forests 22.8% Pine Plantations 64.9% Other* 10.8% Hardwood 1.5% Total Timberland Acreage: 530,400 acres Pine Sawtimber 64.3% Pine Pulpwood 26.1% Hardwood Sawtimber 6.1% Hardwood Pulpwood 3.5% Est. Inventory of Standing Timber: 23 million tons
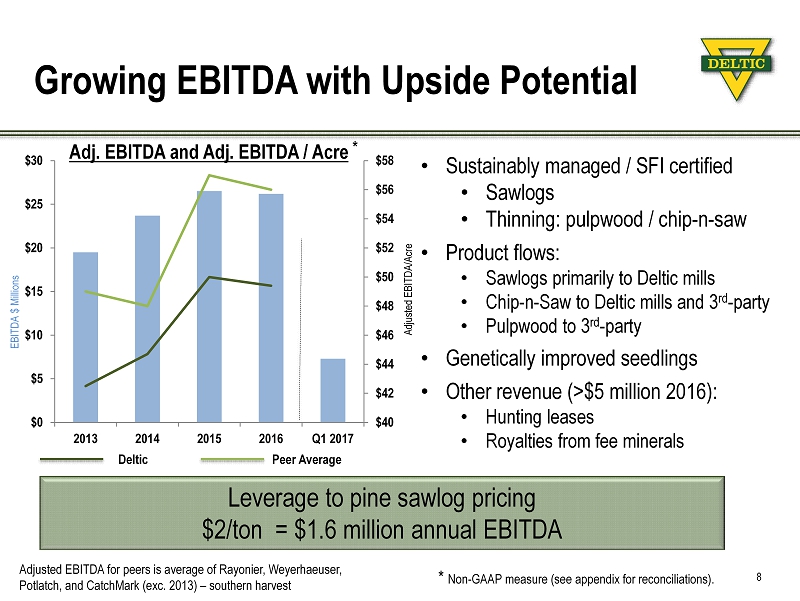
Growing EBITDA with Upside Potential 8 • Sustainably managed / SFI certified • Sawlogs • Thinning: pulpwood / chip - n - saw • Product flows: • Sawlogs primarily to Deltic mills • Chip - n - Saw to Deltic mills and 3 rd - party • Pulpwood to 3 rd - party • Genetically improved seedlings • Other revenue (>$5 million 2016): • Hunting leases • R oyalties from fee minerals $40 $42 $44 $46 $48 $50 $52 $54 $56 $58 $0 $5 $10 $15 $20 $25 $30 2013 2014 2015 2016 Q1 2017 Adj. EBITDA and Adj. EBITDA / Acre Leverage to pine sawlog pricing $2/ton = $1.6 million annual EBITDA Adjusted EBITDA/Acre EBITDA $ Millions Deltic Peer Average Adjusted EBITDA for peers is average of Rayonier, Weyerhaeuser, Potlatch, and CatchMark (exc. 2013) – southern harvest * * Non - GAAP measure (see appendix for reconciliations).
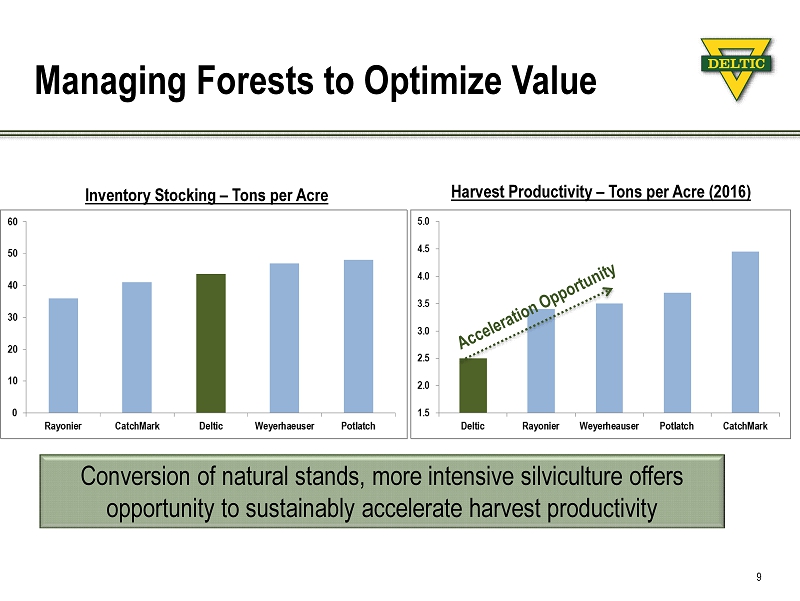
Managing Forests to Optimize Value 9 Inventory Stocking – Tons per Acre Harvest Productivity – Tons per Acre (2016) Conversion of natural stands, more intensive silviculture offers opportunity to sustainably accelerate harvest productivity
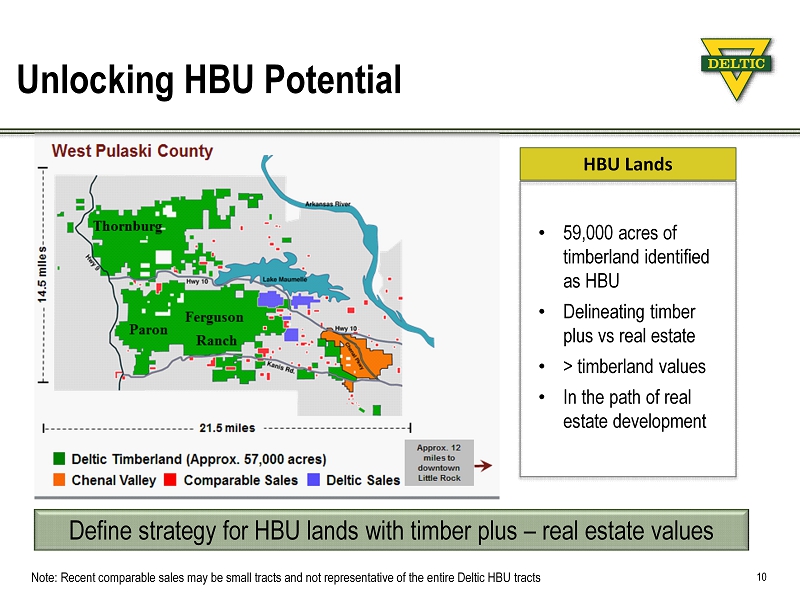
Unlocking HBU Potential 10 Define strategy for HBU lands with timber plus – real estate values HBU Lands • 59,000 acres of timberland identified as HBU • Delineating timber plus vs real estate • > timberland values • In the path of real estate development Note: Recent comparable sales may be small tracts and not representative of the entire Deltic HBU tracts
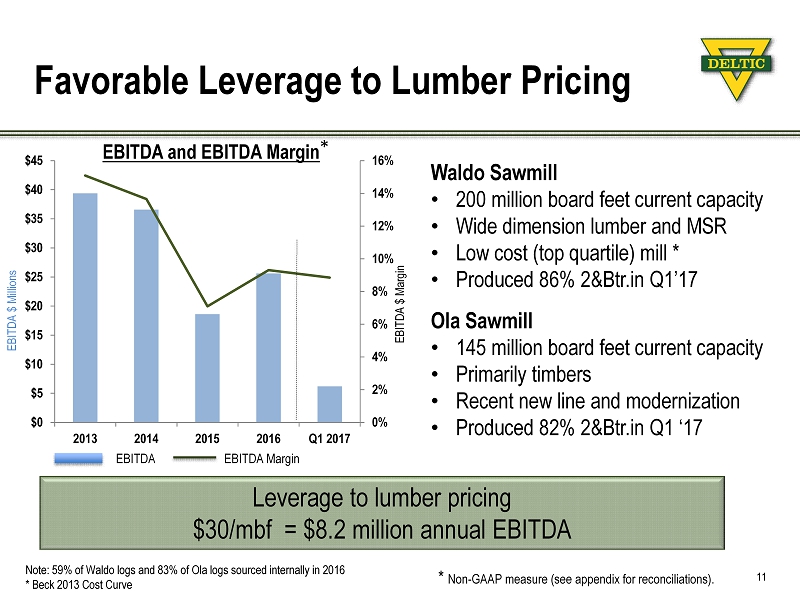
Favorable Leverage to Lumber Pricing 11 Leverage to lumber pricing $30/ mbf = $8.2 million annual EBITDA Ola Sawmill • 145 million board feet current capacity • Primarily timbers • Recent new line and modernization • Produced 82% 2&Btr.in Q1 ‘17 Waldo Sawmill • 200 million board feet current capacity • Wide dimension lumber and MSR • Low cost (top quartile) mill * • Produced 86% 2&Btr.in Q1’17 0% 2% 4% 6% 8% 10% 12% 14% 16% $0 $5 $10 $15 $20 $25 $30 $35 $40 $45 2013 2014 2015 2016 Q1 2017 EBITDA and EBITDA Margin Note: 59% of Waldo logs and 83% of Ola logs sourced internally in 2016 * Beck 2013 Cost Curve EBITDA EBITDA Margin EBITDA $ Millions EBITDA $ Margin * Non - GAAP measure (see appendix for reconciliations). *
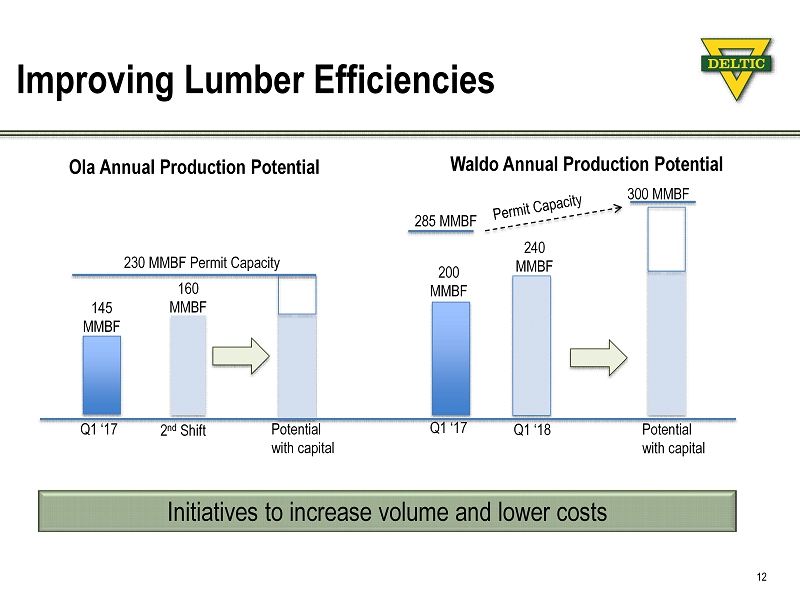
Improving Lumber Efficiencies 12 Initiatives to increase volume and lower costs Waldo Annual Production Potential 285 MMBF 300 MMBF 200 MMBF Q1 ‘17 Q1 ‘18 240 MMBF Potential with capital Ola Annual Production Potential 145 MMBF 230 MMBF Permit Capacity Q1 ‘17 2 nd Shift 160 MMBF Potential with capital
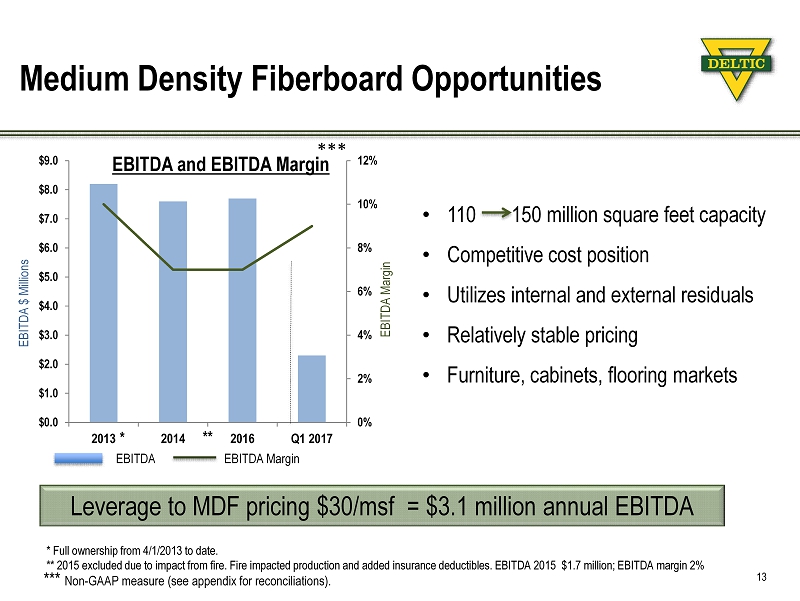
Medium Density Fiberboard Opportunities 13 Leverage to MDF pricing $30/ msf = $3.1 million annual EBITDA • 110 150 million square feet capacity • Competitive cost position • Utilizes internal and external residuals • Relatively stable p ricing • F urniture, cabinets, flooring markets 0% 2% 4% 6% 8% 10% 12% $0.0 $1.0 $2.0 $3.0 $4.0 $5.0 $6.0 $7.0 $8.0 $9.0 2013 2014 2016 Q1 2017 EBITDA and EBITDA Margin EBITDA $ Millions EBITDA Margin * Full ownership from 4/1/2013 to date. ** 2015 excluded due to impact from fire. Fire impacted production and added insurance deductibles. EBITDA 2015 $1.7 million ; E BITDA margin 2% ** * EBITDA EBITDA Margin *** Non - GAAP measure (see appendix for reconciliations). ***
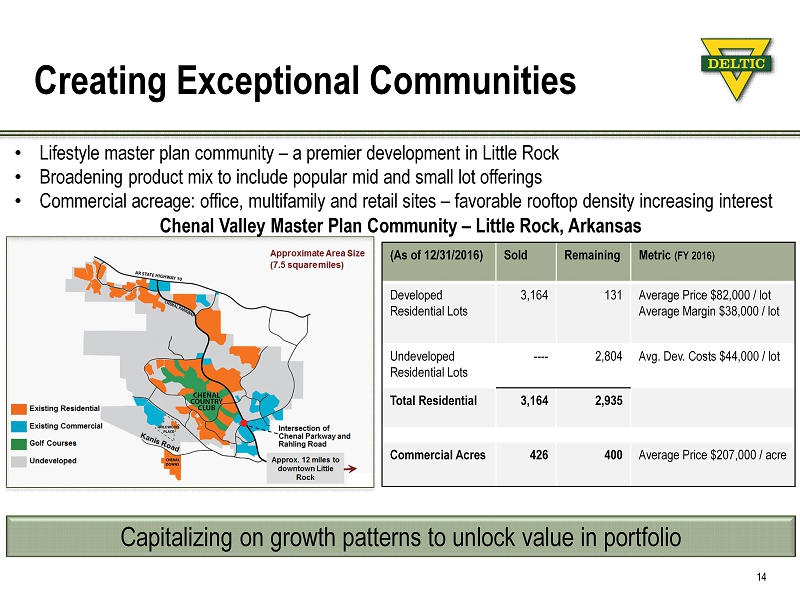
Creating Exceptional Communities 14 Capitalizing on growth patterns to unlock value in portfolio (As of 12/31/2016) Sold Remaining Metric (FY 2016) Developed Residential Lots 3,164 131 Average Price $82,000 / lot Average Margin $38,000 / lot Undeveloped Residential Lots ---- 2,804 Avg. Dev. Costs $44,000 / lot Total Residential 3,164 2,935 Commercial Acres 426 400 Average Price $207,000 / acre • Lifestyle master plan community – a premier development in Little Rock • Broadening product mix to include popular mid and small lot offerings • Commercial acreage: office, multifamily and retail sites – favorable rooftop density increasing interest Chenal Valley Master Plan Community – Little Rock, Arkansas
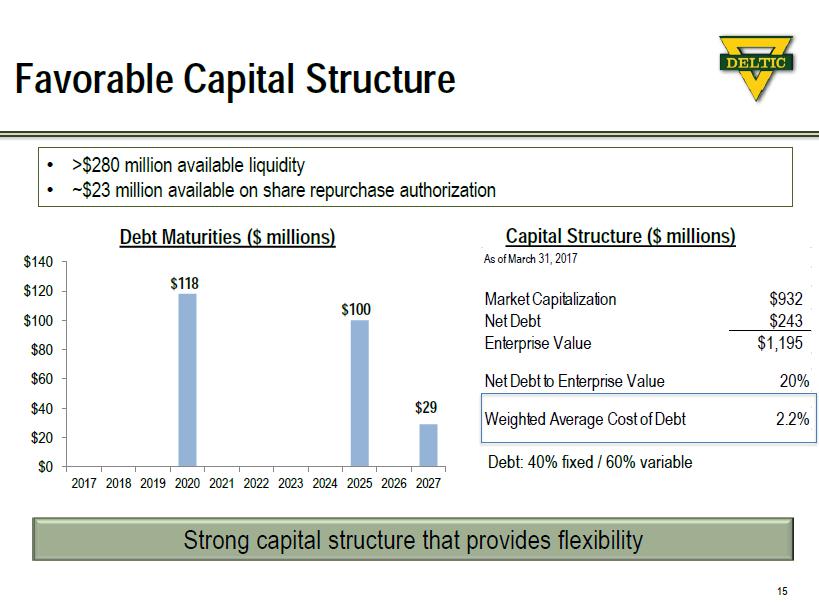
Favorable Capital Structure 15 Strong capital structure that provides flexibility • >$280 million available liquidity • ~$23 million available on share repurchase authorization $0 $20 $40 $60 $80 $100 $120 $140 2017 2018 2019 2020 2021 2022 2023 2024 2025 2026 2027 $118 $100 $29 Debt Maturities ($ millions) Capital Structure ($ millions) As of March 31, 2017 Market Capitalization $932 Net Debt $243 Enterprise Value $1,195 Net Debt to Enterprise Value 20% Weighted Average Cost of Debt 2.2% Leverage Ratio -Requirement <0.65 to 1 Leverage Ratio - March 31, 2017 0.496 to 1 Debt: 40% fixed / 60% variable
The Deltic Opportunity 16 • Massive shifts in competitive landscape since spinoff: • Significant consolidation in lumber & timberlands • Emergence of tax advantaged structures • Post - Recession log supply & demand balance • Unique opportunity to reassess strategic direction • Focused on driving shareholder value • Delivering a “Best - in - Class” company • Place to Work • Neighbor to have • Company to Own
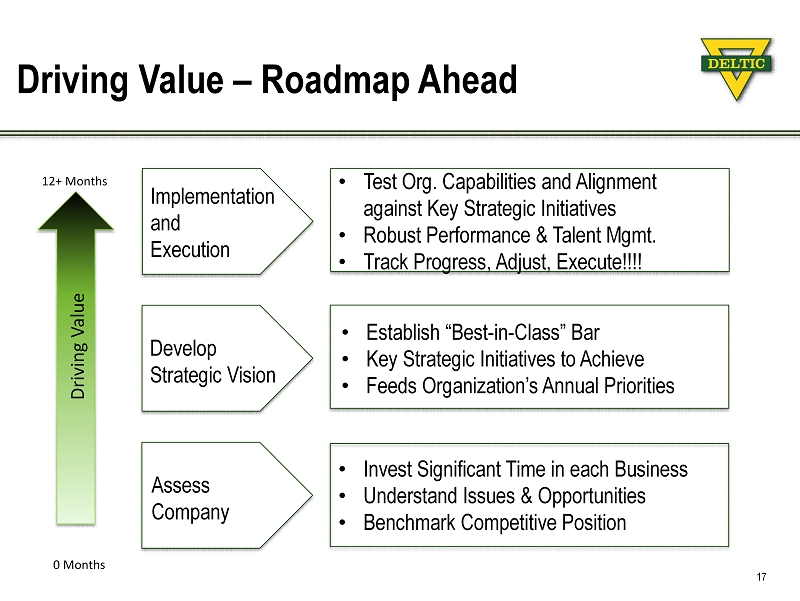
Driving Value – Roadmap Ahead 17 • Invest Significant Time in each Business • Understand Issues & Opportunities • Benchmark Competitive Position • Establish “Best - in - Class” Bar • Key Strategic Initiatives to Achieve • Feeds Organization’s Annual Priorities • Test Org. Capabilities and Alignment against Key Strategic Initiatives • Robust Performance & Talent Mgmt. • Track Progress, Adjust, Execute!!!! Assess Company Develop Strategic Vision Implementation and Execution 0 Months 12+ Months Driving Value
Appendix 18 EBITDA & Segment EBITDA Reconciliation
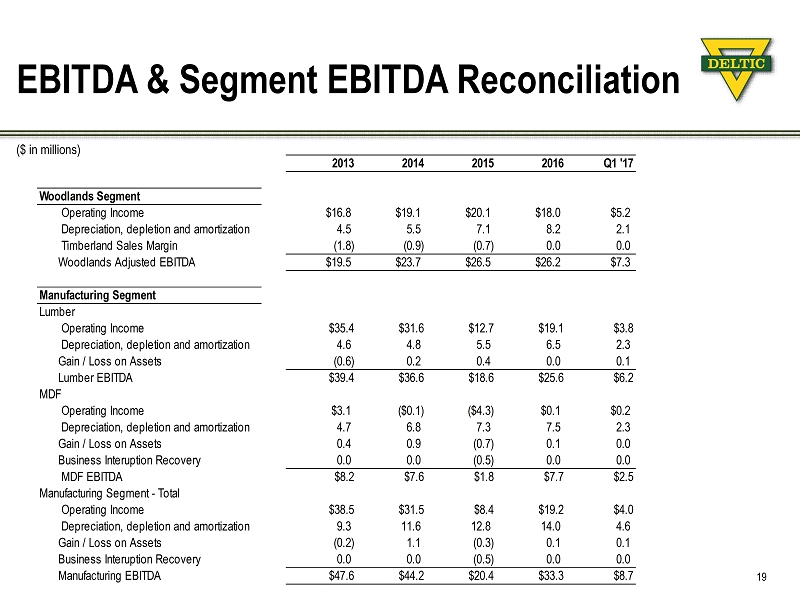
2013 2014 2015 2016 Q1 '17 Woodlands Segment Operating Income $16.8 $19.1 $20.1 $18.0 $5.2 Depreciation, depletion and amortization 4.5 5.5 7.1 8.2 2.1 Timberland Sales Margin (1.8) (0.9) (0.7) 0.0 0.0 Woodlands Adjusted EBITDA $19.5 $23.7 $26.5 $26.2 $7.3 Manufacturing Segment Lumber Operating Income $35.4 $31.6 $12.7 $19.1 $3.8 Depreciation, depletion and amortization 4.6 4.8 5.5 6.5 2.3 Gain / Loss on Assets (0.6) 0.2 0.4 0.0 0.1 Lumber EBITDA $39.4 $36.6 $18.6 $25.6 $6.2 MDF Operating Income $3.1 ($0.1) ($4.3) $0.1 $0.2 Depreciation, depletion and amortization 4.7 6.8 7.3 7.5 2.3 Gain / Loss on Assets 0.4 0.9 (0.7) 0.1 0.0 Business Interuption Recovery 0.0 0.0 (0.5) 0.0 0.0 MDF EBITDA $8.2 $7.6 $1.8 $7.7 $2.5 Manufacturing Segment - Total Operating Income $38.5 $31.5 $8.4 $19.2 $4.0 Depreciation, depletion and amortization 9.3 11.6 12.8 14.0 4.6 Gain / Loss on Assets (0.2) 1.1 (0.3) 0.1 0.1 Business Interuption Recovery 0.0 0.0 (0.5) 0.0 0.0 Manufacturing EBITDA $47.6 $44.2 $20.4 $33.3 $8.7 EBITDA & Segment EBITDA Reconciliation 19 ($ in millions)
John D. Enlow - President and Chief Executive Officer Byrom L. Walker – Interim Vice President and Chief Financial Officer Investor Relations Anna Torma Corporate Strategy and Investor Relations 870 - 881 - 6463 Anna_Torma@Deltic.com Deltic Timber NYSE: DEL www.Deltic.co m