Attached files
| file | filename |
|---|---|
| 8-K - 8-K - National Bank Holdings Corp | nbhc-20170505x8k.htm |
Exhibit 99.1
|
|
Q1 2017 Investor Presentation 1 |
|
|
|
|
|
|
|
|
|

|
|
Forward-Looking Statements This presentation contains “forward-looking statements” within the meaning of the Private Securities Litigation Reform Act of 1995. Forward-looking statements contain words such as “anticipate,” “believe,” “can,” “would,” “should,” “could,” “may,” “predict,” “seek,” “potential,” “will,” “estimate,” “target,” “plan,” “project,” “continuing,” “ongoing,” “expect,” “intend” or similar expressions that relate to the Company’s strategy, plans or intentions. Forward-looking statements involve certain important risks, uncertainties and other factors, any of which could cause actual results to differ materially from those in such statements. Such factors include, without limitation, the “Risk Factors” referenced in our most recent Form 10-K filed with the Securities and Exchange Commission (SEC), other risks and uncertainties listed from time to time in our reports and documents filed with the SEC, and the following factors: ability to execute our business strategy; business and economic conditions; economic, market, operational, liquidity, credit and interest rate risks associated with the Company’s business; effects of any changes in trade, monetary and fiscal policies and laws; changes imposed by regulatory agencies to increase capital standards; effects of inflation, as well as interest rate, securities market and monetary supply fluctuations; changes in the economy or supply-demand imbalances affecting local real estate values; changes in consumer spending, borrowings and savings habits; the Company’s ability to identify potential candidates for, consummate, integrate and realize operating efficiencies from, acquisitions or consolidations; the Company's ability to realize anticipated benefits from enhancements or updates to its core operating systems from time to time without significant change in client service or risk to the Company's control environment; the Company's dependence on information technology and telecommunications systems of third party service providers and the risk of systems failures, interruptions or breaches of security; the Company’s ability to achieve organic loan and deposit growth and the composition of such growth; changes in sources and uses of funds; increased competition in the financial services industry; the effect of changes in accounting policies and practices; the share price of the Company’s stock; the Company's ability to realize deferred tax assets or the need for a valuation allowance; continued consolidation in the financial services industry; ability to maintain or increase market share and control expenses; costs and effects of changes in laws and regulations and of other legal and regulatory developments; technological changes; the timely development and acceptance of new products and services; the Company’s continued ability to attract and maintain qualified personnel; ability to implement and/or improve operational management and other internal risk controls and processes and reporting system and procedures; regulatory limitations on dividends from the Company’s bank subsidiary; changes in estimates of future loan reserve requirements based upon the periodic review thereof under relevant regulatory and accounting requirements; widespread natural and other disasters, dislocations, political instability, acts of war or terrorist activities, cyberattacks or international hostilities; impact of reputational risk; and success at managing the risks involved in the foregoing items. The Company can give no assurance that any goal or plan or expectation set forth in forward-looking statements can be achieved and readers are cautioned not to place undue reliance on such statements. The forward-looking statements are made as of the date of this presentation, and the Company does not intend, and assumes no obligation, to update any forward-looking statement to reflect events or circumstances after the date on which the statement is made or to reflect the occurrence of unanticipated events or circumstances, except as required by applicable law. Further Information This presentation should be read together with “Management’s Discussion and Analysis of Financial Condition and Results of Operations” and the consolidated financial statements and the related notes thereto included in our Form 10-K and quarterly reports. Non-GAAP Measures We consider the use of select non-GAAP financial measures and ratios to be useful for financial and operational decision making and useful in evaluating period-to-period comparisons. These non-GAAP financial measures should not be considered a substitute for financial information presented in accordance with GAAP and you should not rely on non-GAAP financial measures alone as measures of our performance. Please see the Appendix to this presentation and our Form 10-K and quarterly reports for a further description of our use of non-GAAP financial measures and a reconciliation of the differences from the most directly comparable GAAP financial measures. 2 |
|
|
|
|
|
|
|
|
Company Overview 3 |

|
|
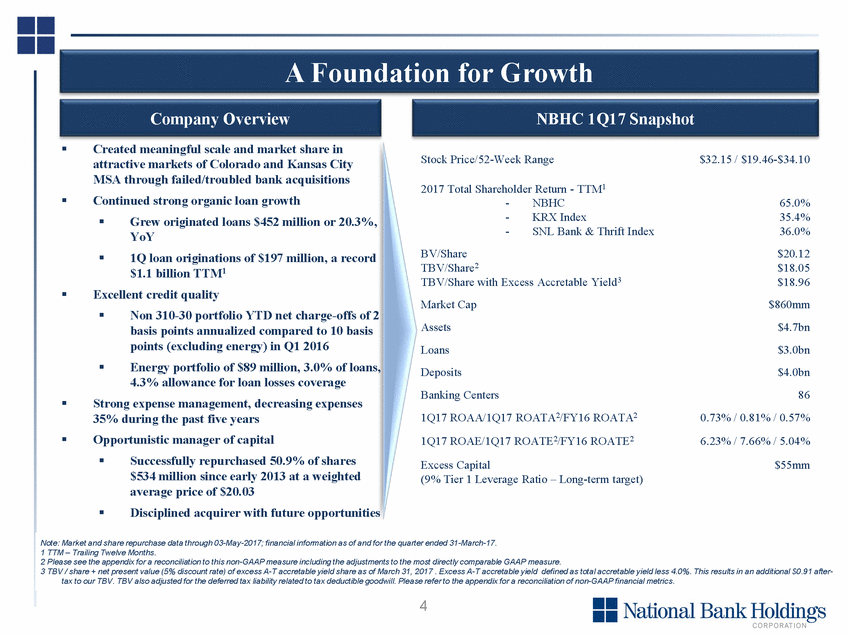
A Foundation for Growth Company Overview Created meaningful scale and market share in attractive markets of Colorado and Kansas City MSA through failed/troubled bank acquisitions Continued strong organic loan growth NBHC 1Q17 Snapshot Stock Price/52-Week Range $32.15 / $19.46-$34.10 2017 Total Shareholder Return - TTM1 - - - NBHC KRX Index SNL Bank & Thrift Index 65.0% 35.4% 36.0% $20.12 $18.05 $18.96 $860mm $4.7bn $3.0bn $4.0bn 86 0.73% / 0.81% / 0.57% 6.23% / 7.66% / 5.04% Grew originated loans $452 million or 20.3%, YoY 1Q loan originations of $197 million, a record $1.1 billion TTM1 BV/Share TBV/Share2 TBV/Share with Excess Accretable Yield3 Market Cap Assets Loans Deposits Banking Centers 1Q17 ROAA/1Q17 ROATA2/FY16 ROATA2 1Q17 ROAE/1Q17 ROATE2/FY16 ROATE2 Excess Capital (9% Tier 1 Leverage Ratio – Long-term target) Excellent credit quality Non 310-30 portfolio YTD net charge-offs of 2 basis points annualized compared to 10 basis points (excluding energy) in Q1 2016 Energy portfolio of $89 million, 3.0% of loans, 4.3% allowance for loan losses coverage Strong expense management, decreasing expenses 35% during the past five years Opportunistic manager of capital Successfully repurchased 50.9% of shares $534 million since early 2013 at a weighted average price of $20.03 Disciplined acquirer with future opportunities $55mm 4 Note: Market and share repurchase data through 03-May-2017; financial information as of and for the quarter ended 31-March-17. 1 TTM – Trailing Twelve Months. 2 Please see the appendix for a reconciliation to this non-GAAP measure including the adjustments to the most directly comparable GAAP measure. 3 TBV / share + net present value (5% discount rate) of excess A-T accretable yield share as of March 31, 2017 . Excess A-T accretable yield defined as total accretable yield less 4.0%. This results in an additional $0.91 after-tax to our TBV. TBV also adjusted for the deferred tax liability related to tax deductible goodwill. Please refer to the appendix for a reconciliation of non-GAAP financial metrics. |
|
|
|
|
|
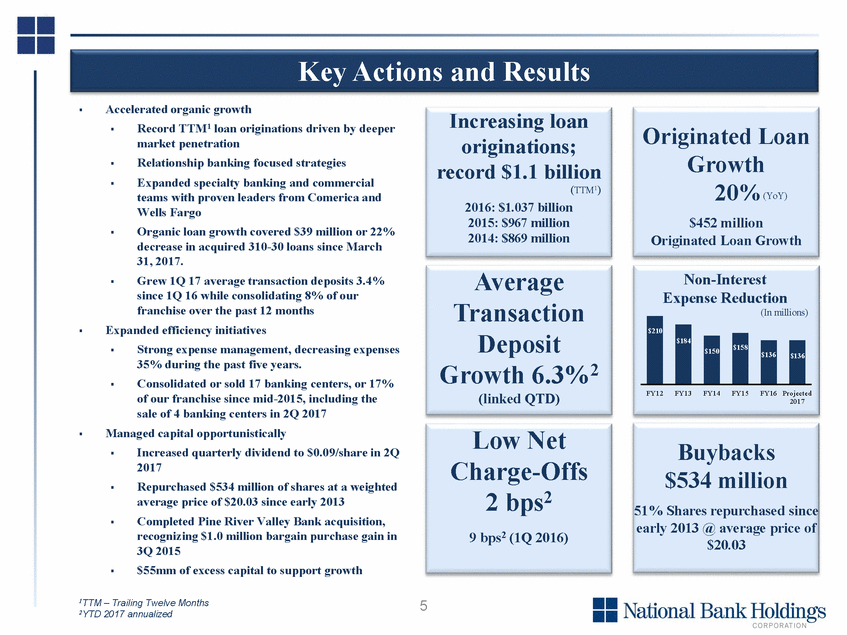
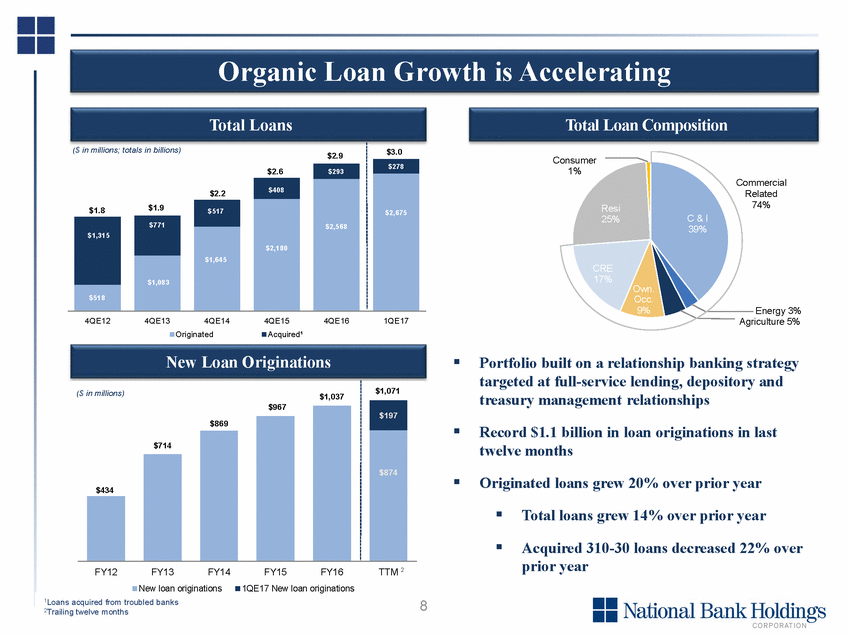
Key Actions and Results Accelerated organic growth Increasing loan originations; record $1.1 billion (TTM1) 2016: $1.037 billion 2015: $967 million 2014: $869 million Record TTM1 loan originations driven by deeper market penetration Relationship banking focused strategies Expanded specialty banking and commercial teams with proven leaders from Comerica and Wells Fargo Organic loan growth covered $39 million or 22% decrease in acquired 310-30 loans since March 31, 2017. Grew 1Q 17 average transaction deposits 3.4% since 1Q 16 while consolidating 8% of our franchise over the past 12 months Originated Loan Growth 20%(YoY) $452 million Originated Loan Growth Average Transaction Deposit Growth 6.3%2 (linked QTD) Non-Interest Expense Reduction (In millions) Expanded efficiency initiatives Strong expense management, decreasing expenses 35% during the past five years. Consolidated or sold 17 banking centers, or 17% of our franchise since mid-2015, including the sale of 4 banking centers in 2Q 2017 FY12 FY13 FY14 FY15 FY16 Projected 2017 Managed capital opportunistically Low Net Charge-Offs 2 bps2 9 bps2 (1Q 2016) Buybacks $534 million 51% Shares repurchased since early 2013 @ average price of $20.03 Increased quarterly dividend to $0.09/share in 2Q 2017 Repurchased $534 million of shares at a weighted average price of $20.03 since early 2013 Completed Pine River Valley Bank acquisition, recognizing $1.0 million bargain purchase gain in 3Q 2015 $55mm of excess capital to support growth 1TTM – Trailing Twelve Months 2YTD 2017 annualized 5 $210 $184 $150 $158 $136 $136 |
|
|
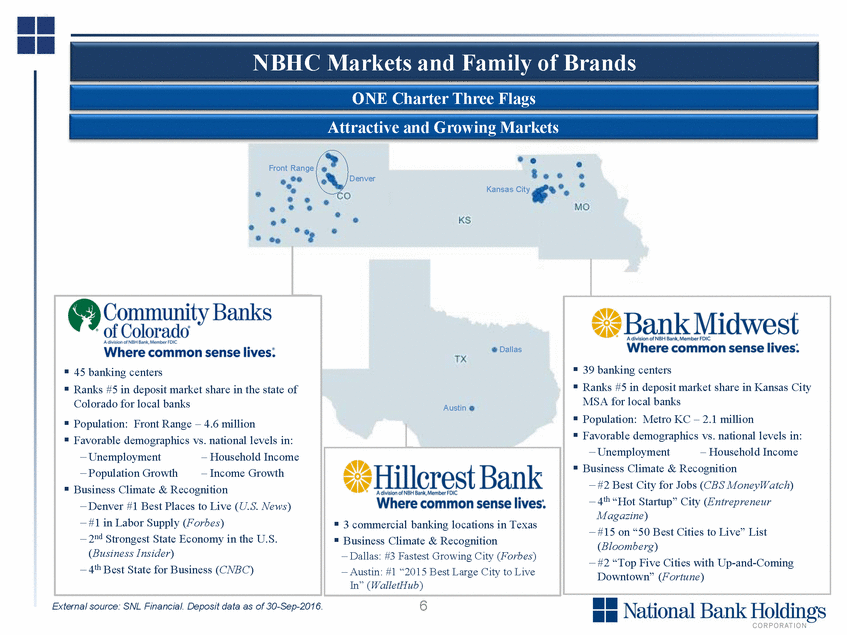
NBHC Markets and Family of Brands ONE Charter Three Flags Attractive and Growing Markets Front Range Denver Kansas City MSA for local banks Favorable demographics vs. national levels in: Business Climate & Recognition ‒ 4th “Hot Startup” City (Entrepreneur ‒ #15 on “50 Best Cities to Live” List ‒ #2 “Top Five Cities with Up-and-Coming 6 External source: SNL Financial. Deposit data as of 30-Sep-2016. 45 banking centers Ranks #5 in deposit market share in the state of Colorado for local banks Population: Front Range – 4.6 million Favorable demographics vs. national levels in: ‒ Unemployment‒ Household Income ‒ Population Growth‒ Income Growth Business Climate & Recognition ‒ Denver #1 Best Places to Live (U.S. News) ‒ #1 in Labor Supply (Forbes) ‒ 2nd Strongest State Economy in the U.S. (Business Insider) ‒ 4th Best State for Business (CNBC) Dallas Austin 3 commercial banking locations in Texas Business Climate & Recognition ‒ Dallas: #3 Fastest Growing City (Forbes) ‒ Austin: #1 “2015 Best Large City to Live In” (WalletHub) 39 banking centers Ranks #5 in deposit market share in Kansas City Population: Metro KC – 2.1 million ‒ Unemployment‒ Household Income ‒ #2 Best City for Jobs (CBS MoneyWatch) Magazine) (Bloomberg) Downtown” (Fortune) |
|
|
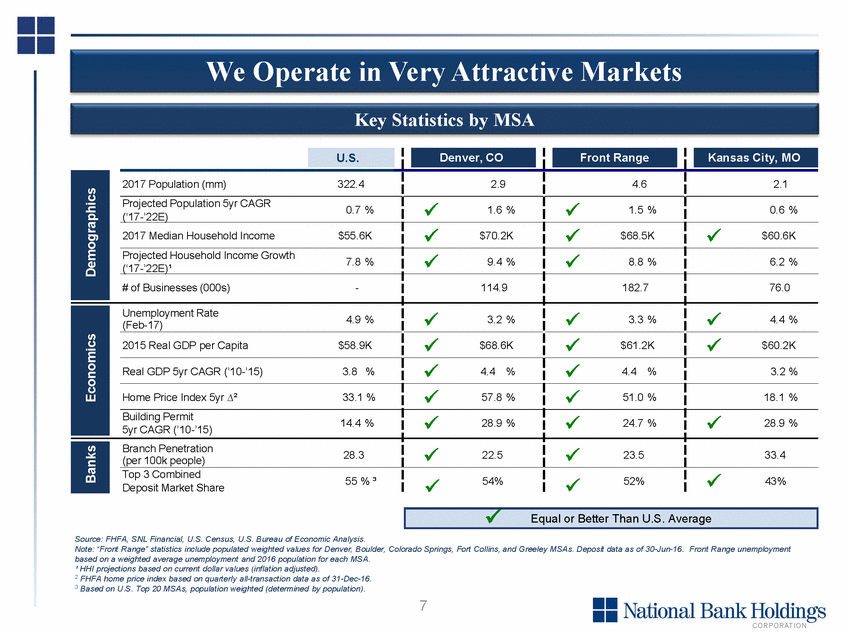
We Operate in Very Attractive Key Statistics by MSA Markets Source: FHFA, SNL Financial, U.S. Census, U.S. Bureau of Economic Analysis. Note: “Front Range” statistics include populated weighted values for Denver, Boulder, Colorado Springs, Fort Collins, and Greeley MSAs. Deposit data as of 30-Jun-16. Front Range unemployment based on a weighted average unemployment and 2016 population for each MSA. ¹ HHI projections based on current dollar values (inflation adjusted). 2 FHFA home price index based on quarterly all-transaction data as of 31-Dec-16. 3 Based on U.S. Top 20 MSAs, population weighted (determined by population). 7 Equal or Better Than U.S. Average Demographics 2017 Population (mm)322.4 2.9 4.6 2.1 Projected Population 5yr CAGR (‘17-’22E)0.7 % 1.6 % 1.5 % 0.6 % 2017 Median Household Income$55.6K $70.2K $68.5K $60.6K Projected Household Income Growth (‘17-’22E)¹7.8 % 9.4 % 8.8 % 6.2 % # of Businesses (000s)-114.9 182.7 76.0 Economics Unemployment Rate (Feb-17)4.9 % 2015 Real GDP per Capita$58.9K 3.2 % $68.6K 3.3 % $61.2K 4.4 % $60.2K Real GDP 5yr CAGR (’10-’15)3.8 % 4.4 % 4.4 % 3.2 % Home Price Index 5yr ∆²33.1 % 57.8 % 51.0 % 18.1 % Building Permit 5yr CAGR (’10-’15)14.4 % 28.9 % 24.7 % 28.9 % Banks Branch Penetration (per 100k people)28.3 22.5 23.5 33.4 Top 3 Combined Deposit Market Share55 % ³ 54% 52% 43% Kansas City, MO Front Range Denver, CO U.S. |
|
|
Organic Loan Growth is Accelerating Total Loans Total Loan Composition Consumer 1% Commercial Related 74% Resi 25% C & I 39% CRE 17% Own. Occ. Energy 3% 4QE12 4QE13 4QE14 Originated 4QE15 4QE16 1QE17 Agriculture 5% Acquired¹ New Loan Originations Portfolio built on a relationship banking strategy targeted at full-service lending, depository and treasury management relationships ($ in millions) $1,037 Record $1.1 billion in loan originations in last twelve months Originated loans grew 20% over prior year Total loans grew 14% over prior year Acquired 310-30 loans decreased 22% over prior year TTM 2 FY12 FY13 FY14 FY15 FY16 New loan originations 1QE17 New loan originations 1Loans acquired from troubled banks 8 2Trailing twelve months $1,071 $197 $967 $869 $874 $714 $434 ($ in millions; totals in billions) $2.9 $3.0 $278 $2.6 $293 $2,675 $2.2 $408 $2,568 $1.8$1.9 $517 $2,180 $1,315 $771 $1,645 $1,083 $518 |
|
|
9 |
|
|
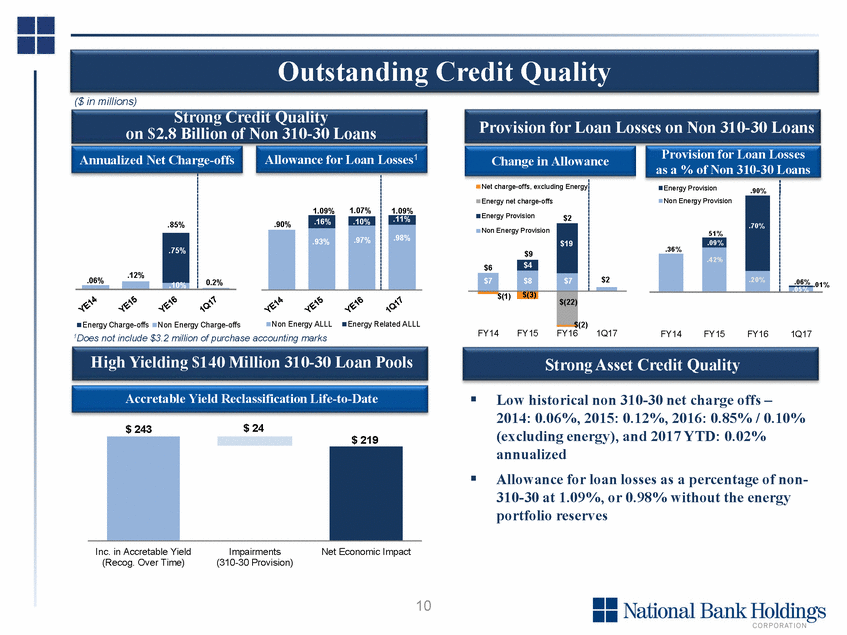
Outstanding Strong Credit Quality on $2.8 Billion of Non 310-30 Loans Credit Quality ($ in millions) Provision for Loan Losses on Non 310-30 Loans Provision for Loan Losses as a % of Non 310-30 Loans Allowance for Loan Losses1 Annualized Net Charge-offs Change in Allowance .06% % Energy Charge-offs Non Energy Charge-offs Non Energy ALLL Energy Related ALLL $(2) FY14 FY15FY16 1Q17 FY14 FY15FY16 1Q17 1Does not include $3.2 million of purchase accounting marks High Yielding $140 Million 310-30 Loan Pools Strong Asset Credit Quality Accretable Yield Reclassification Life-to-Date Low historical non 310-30 net charge offs – 2014: 0.06%, 2015: 0.12%, 2016: 0.85% / 0.10% (excluding energy), and 2017 YTD: 0.02% annualized Allowance for loan losses as a percentage of non-310-30 at 1.09%, or 0.98% without the energy portfolio reserves $ 24 $ 243 Inc. in Accretable Yield (Recog. Over Time) Impairments (310-30 Provision) Net Economic Impact 10 $ 219 .85% .12% 0.2% .10% .75% Net charge-offs, excluding Energy Energy net charge-offs Energy Provision$2 $2 Non Energy Provision $9 $19 $6 $4 $7 $7 $8 $(1) $(3) $(22) 1.09%1.07% 1.09% .90% .16% .10% .11% .97% .98% .93% Energy Provision.90% .06% .05% .01 Non Energy Provision 51% .70% .36% .09% .42% .20% |
|
|
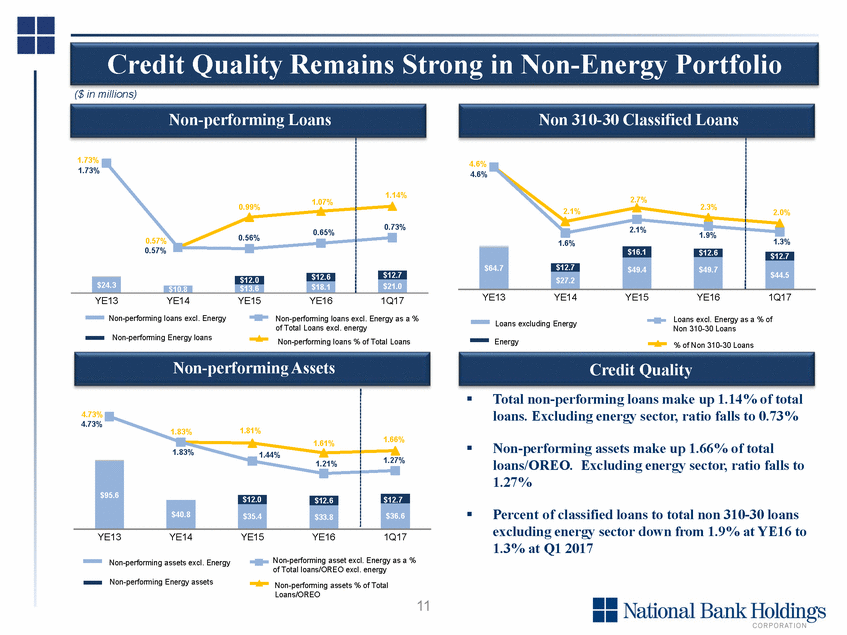
Credit Quality Remains ($ in millions) Strong in Non-Energy Portfolio Non-performing Loans Non 310-30 Classified Loans 1.73% 0.99% 0.57% YE13 YE14 YE15 YE16 1Q17 YE13 YE14 YE15 YE16 1Q17 Non-performing loans excl. Energy Non-performing loans excl. Energy as a % of Total Loans excl. energy Non-performing loans % of Total Loans Loans excl. Energy as a % of Non 310-30 Loans Loans excluding Energy Non-performing Energy loans Energy % of Non 310-30 Loans Non-performing Assets Credit Quality Total non-performing loans make up 1.14% of total loans. Excluding energy sector, ratio falls to 0.73% 1.81% 1.83% Non-performing assets make up 1.66% of total loans/OREO. Excluding energy sector, ratio falls to 1.27% Percent of classified loans to total non 310-30 loans excluding energy sector down from 1.9% at YE16 to 1.3% at Q1 2017 YE13 YE14 YE15 YE16 1Q17 Non-performing asset excl. Energy as a % of Total loans/OREO excl. energy Non-performing assets excl. Energy Non-performing Energy assets Non-performing assets % of Total Loans/OREO 11 4.73% 4.73% 1.61% 1.83%1.44% 1.66% 1.27% $95.6 1.21% $12.0 $12.6 $12.7 $40.8 $35.4 $33.8 $36.6 1.73% 1.07% 0.56%0.65% 0.57% 1.14% 0.73% $12.6 $12.7 $24.3 $12.0 $18.1 $21.0 $10.8 $13.6 4.6% 4.6% 2.7% 2.1%2.3% 2.1% 1.9% 1.6% 2.0% 1.3% $64.7 $16.1 $12.6 $12.7 $49.4 $49.7 $44.5 $12.7 $27.2 |
|
|
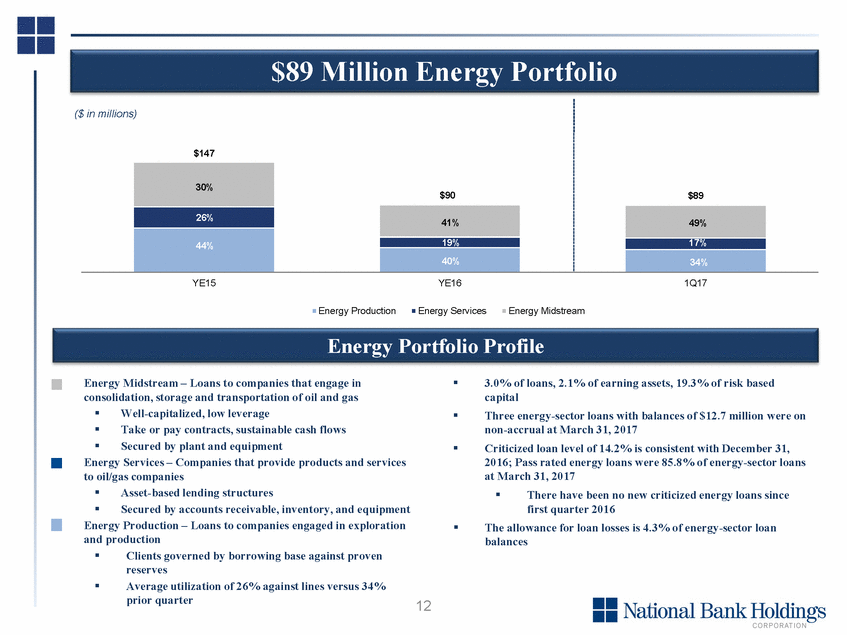
$89 Million Energy Portfolio ($ in millions) YE15 YE16 1Q17 Energy Production Energy Services Energy Midstream Energy Portfolio Profile Energy Midstream – Loans to companies that engage in consolidation, storage and transportation of oil and gas 3.0% of loans, 2.1% of earning assets, 19.3% of risk based capital Three energy-sector loans with balances of $12.7 million were on non-accrual at March 31, 2017 Criticized loan level of 14.2% is consistent with December 31, 2016; Pass rated energy loans were 85.8% of energy-sector loans at March 31, 2017 Well-capitalized, low leverage Take or pay contracts, sustainable cash flows Secured by plant and equipment Energy Services – Companies that provide products and services to oil/gas companies Asset-based lending structures Secured by accounts receivable, inventory, and equipment There have been no new criticized energy loans since first quarter 2016 Energy Production – Loans to companies engaged in exploration and production The allowance for loan losses is 4.3% of energy-sector loan balances Clients governed by borrowing base against proven reserves Average utilization of 26% against lines versus 34% prior quarter 12 $147 $89 30% $90 26% 41% 49% 44% 19% 17% 40% 34% |
|
|
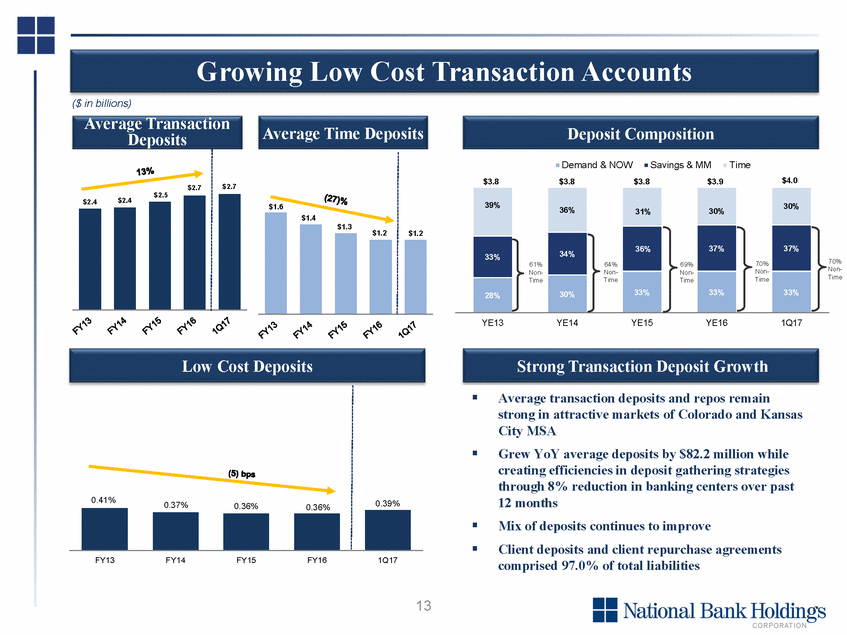
Growing Low Cost Transaction Accounts ($ in billions) Average Transaction Deposits Average Time Deposits Deposit Composition Demand & NOW Savings & MM Time $4.0 $3.8 $3.8 $3.8 $3.9 $2.5 $2.4 $2.4 $1.2 70% Non-Time YE13 YE14 YE15 YE16 1Q17 Low Cost Deposits Strong Transaction Deposit Growth Average transaction deposits and repos remain strong in attractive markets of Colorado and Kansas City MSA Grew YoY average deposits by $82.2 million while creating efficiencies in deposit gathering strategies through 8% reduction in banking centers over past 12 months Mix of deposits continues to improve Client deposits and client repurchase agreements comprised 97.0% of total liabilities FY13 FY14 FY15 FY16 1Q17 13 0.41% 0.37% 0.36% 0.36% 0.39% $1.6 $1.2 $1.4 $1.3 $2.7 $2.7 39% 61% Non-Time 36% 64% Non-Time 31% 69% Non-Time 30% 70% Non-Time 30% 36% 37% 37% 34% 33% 33% 33% 33% 30% 28% |
|
|
Financial Overview 14 |

|
|
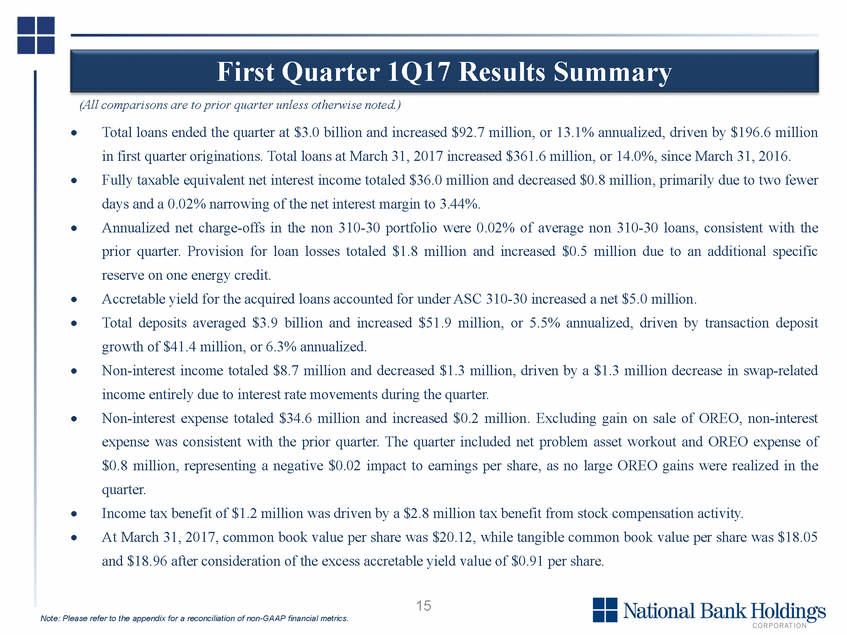
First Quarter 1Q17 Results Summary (All comparisons are to prior quarter unless otherwise noted.) • Total loans ended the quarter at $3.0 billion and increased $92.7 million, or 13.1% annualized, driven by $196.6 million in first quarter originations. Total loans at March 31, 2017 increased $361.6 million, or 14.0%, since March 31, 2016. Fully taxable equivalent net interest income totaled $36.0 million and decreased $0.8 million, primarily due to two fewer days and a 0.02% narrowing of the net interest margin to 3.44%. Annualized net charge-offs in the non 310-30 portfolio were 0.02% of average non 310-30 loans, consistent with the prior quarter. Provision for loan losses totaled $1.8 million and increased $0.5 million due to an additional specific reserve on one energy credit. Accretable yield for the acquired loans accounted for under ASC 310-30 increased a net $5.0 million. Total deposits averaged $3.9 billion and increased $51.9 million, or 5.5% annualized, driven by transaction deposit growth of $41.4 million, or 6.3% annualized. Non-interest income totaled $8.7 million and decreased $1.3 million, driven by a $1.3 million decrease in swap-related income entirely due to interest rate movements during the quarter. Non-interest expense totaled $34.6 million and increased $0.2 million. Excluding gain on sale of OREO, non-interest expense was consistent with the prior quarter. The quarter included net problem asset workout and OREO expense of $0.8 million, representing a negative $0.02 impact to earnings per share, as no large OREO gains were realized in the quarter. Income tax benefit of $1.2 million was driven by a $2.8 million tax benefit from stock compensation activity. At March 31, 2017, common book value per share was $20.12, while tangible common book value per share was $18.05 and $18.96 after consideration of the excess accretable yield value of $0.91 per share. • • • • • • • • 15 Note: Please refer to the appendix for a reconciliation of non-GAAP financial metrics. |
|
|
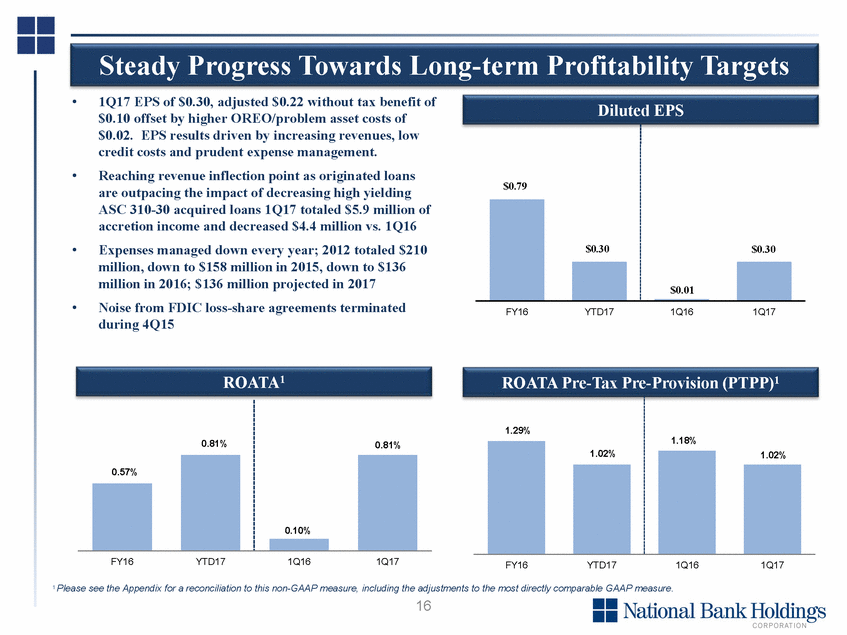
Steady Progress Towards Long-term 1Q17 EPS of $0.30, adjusted $0.22 without tax benefit of Profitability Diluted EPS Targets • $0.10 offset by higher OREO/problem asset costs of $0.02. EPS results driven by increasing revenues, low credit costs and prudent expense management. Reaching revenue inflection point as originated loans are outpacing the impact of decreasing high yielding ASC 310-30 acquired loans 1Q17 totaled $5.9 million of accretion income and decreased $4.4 million vs. 1Q16 Expenses managed down every year; 2012 totaled $210 million, down to $158 million in 2015, down to $136 million in 2016; $136 million projected in 2017 Noise from FDIC loss-share agreements terminated during 4Q15 • • • FY16 YTD17 1Q16 1Q17 ROATA1 ROATA Pre-Tax Pre-Provision (PTPP)1 FY16 YTD17 1Q16 1Q17 FY16 YTD17 1Q16 1Q17 1 Please see the Appendix for a reconciliation to this non-GAAP measure, including the adjustments to the most directly comparable GAAP measure. 16 0.81% 0.81% 0.57% 0.10% 1.29% 1.18% 1.02% 1.02% $0.79 $0.30 $0.30 $0.01 |
|
|
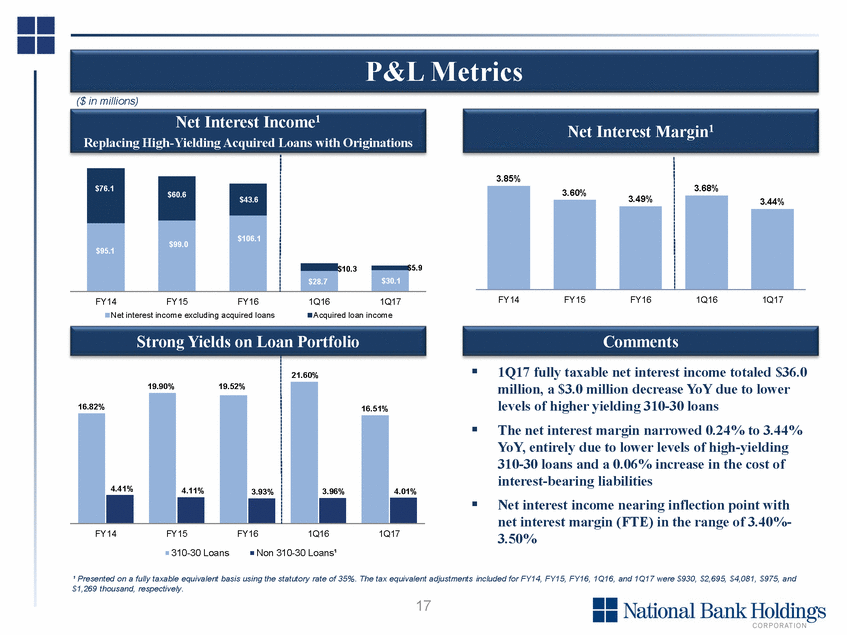
P&L Metrics ($ in millions) Net Interest Income1 Replacing High-Yielding Acquired Loans with Originations Net Interest Margin1 3.49% $5.9 FY14 FY15 FY16 1Q16 1Q17 FY14 FY15 FY16 1Q16 1Q17 Net interest income excluding acquired loans Acquired loan income Strong Yields on Loan Portfolio Comments 1Q17 fully taxable net interest income totaled $36.0 million, a $3.0 million decrease YoY due to lower levels of higher yielding 310-30 loans The net interest margin narrowed 0.24% to 3.44% YoY, entirely due to lower levels of high-yielding 310-30 loans and a 0.06% increase in the cost of interest-bearing liabilities Net interest income nearing inflection point with net interest margin (FTE) in the range of 3.40%-3.50% FY14 FY15 FY16 1Q16 1Q17 310-30 Loans Non 310-30 Loans¹ ¹ Presented on a fully taxable equivalent basis using the statutory rate of 35%. The tax equivalent adjustments included for FY14, FY15, FY16, 1Q16, and 1Q17 were $930, $2,695, $4,081, $975, and $1,269 thousand, respectively. 17 19.90%19.52% 21.60% 16.51% 16.82% 4.11% 3.93% 4.41% 3.96% 4.01% 3.85% 3.68% 3.60% 3.44% $76.1 $60.6 $43.6 $106.1 $95.1 $99.0 $28.7 $10.3 $30.1 |
|
|
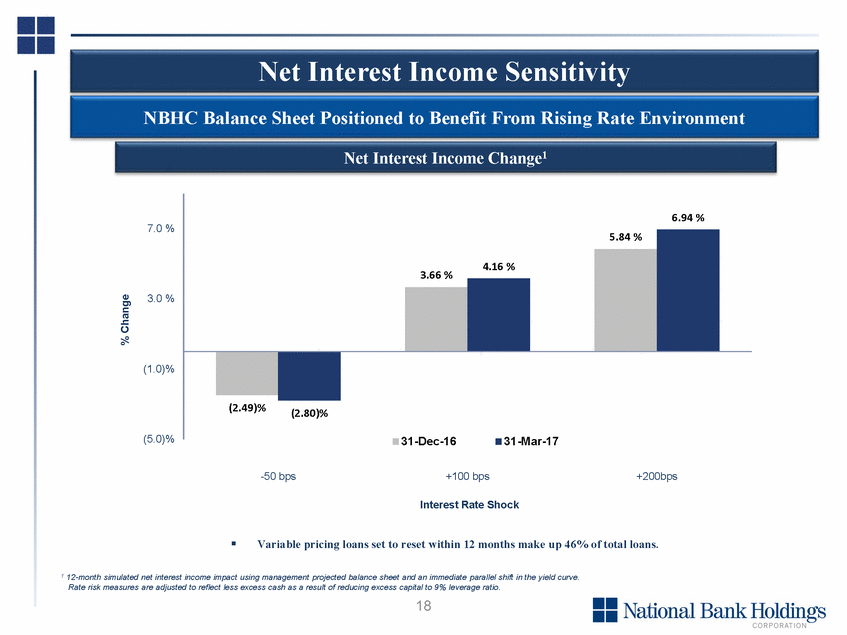
Net Interest Income Sensitivity NBHC Balance Sheet Positioned to Benefit From Rising Rate Environment Net Interest Income Change1 7.0 % 3.66 % 3.0 % (1.0)% (5.0)% 31-Dec-16 31-Mar-17 -50 bps +100 bps +200bps Interest Rate Shock Variable pricing loans set to reset within 12 months make up 46% of total loans. 1 12-month simulated net interest income impact using management projected balance sheet and an immediate parallel shift in the yield curve. Rate risk measures are adjusted to reflect less excess cash as a result of reducing excess capital to 9% leverage ratio. 18 % Change 6.94 % 5.84 % 4.16 % (2.49)%(2.80)% |
|
|
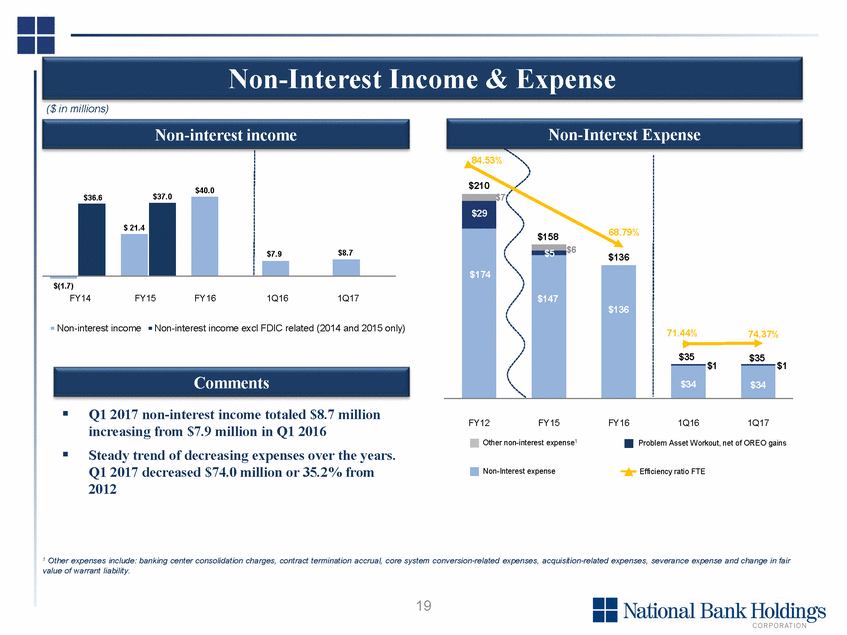
Non-Interest Income & Expense ($ in millions) Non-interest income Non-Interest Expense $7 $(1.7) FY14 FY15 FY16 1Q16 1Q17 Non-interest incomeNon-interest income excl FDIC related (2014 and 2015 only) $1 $1 Comments Q1 2017 non-interest income totaled $8.7 million increasing from $7.9 million in Q1 2016 Steady trend of decreasing expenses over the years. Q1 2017 decreased $74.0 million or 35.2% from 2012 FY12 FY15 FY16 1Q16 1Q17 Other non-interest expense1 Problem Asset Workout, net of OREO gains Non-Interest expense Efficiency ratio FTE 1 Other expenses include: banking center consolidation charges, contract termination accrual, core system conversion-related expenses, acquisition-related expenses, severance expense and change in fair value of warrant liability. 19 84.53% $210 71.44%74.37% $35$35 $29 $15868.79% $6 $174 $147 $136 $136 $34 $34 $40.0 $7.9$8.7 $36.6$37.0 $ 21.4 |
|
|
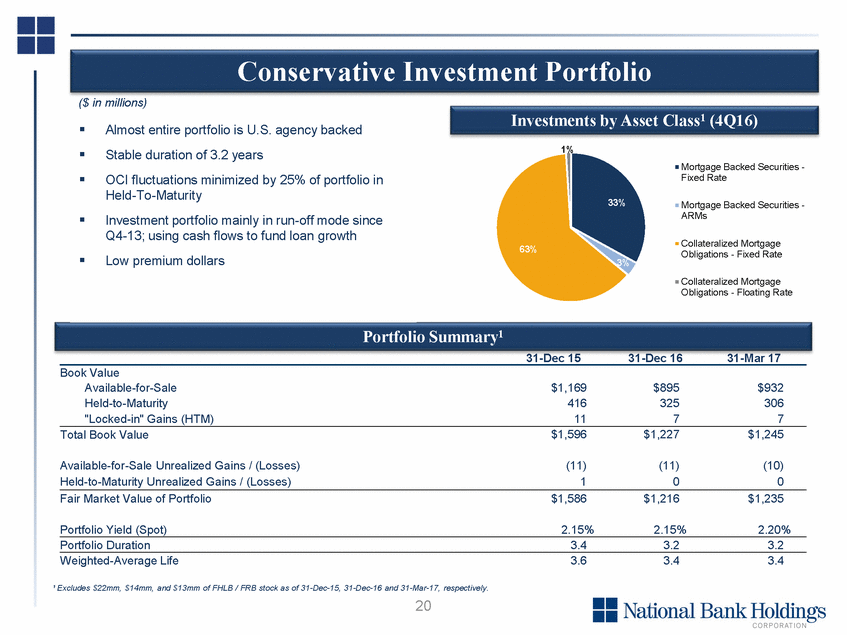
Conservative Investment Portfolio ($ in millions) Investments by Asset Class1 (4Q16) 1% Almost entire portfolio is U.S. agency backed Stable duration of 3.2 years OCI fluctuations minimized by 25% of portfolio in Held-To-Maturity Investment portfolio mainly in run-off mode since Q4-13; using cash flows to fund loan growth Low premium dollars Mortgage Backed Securities - Fixed Rate 33% Mortgage Backed Securities - ARMs Collateralized Mortgage Obligations - Fixed Rate 63% Collateralized Mortgage Obligations - Floating Rate Portfolio Summary1 31-Dec 15 31-Dec 16 31-Mar 17 Book Value Available-for-Sale Held-to-Maturity "Locked-in" Gains (HTM) $1,169 416 11 $895 325 7 $932 306 7 Total Book Value $1,596 $1,227 $1,245 Available-for-Sale Unrealized Gains / (Losses) Held-to-Maturity Unrealized Gains / (Losses) (11) 1 (11) 0 (10) 0 Fair Market Value of Portfolio $1,586 $1,216 $1,235 Portfolio Yield (Spot) 2.15% 2.15% 2.20% Portfolio Duration 3.4 3.2 3.2 Weighted-Average Life 3.6 3.4 3.4 ¹ Excludes $22mm, $14mm, and $13mm of FHLB / FRB stock as of 31-Dec-15, 31-Dec-16 and 31-Mar-17, respectively. 20 |
|
|
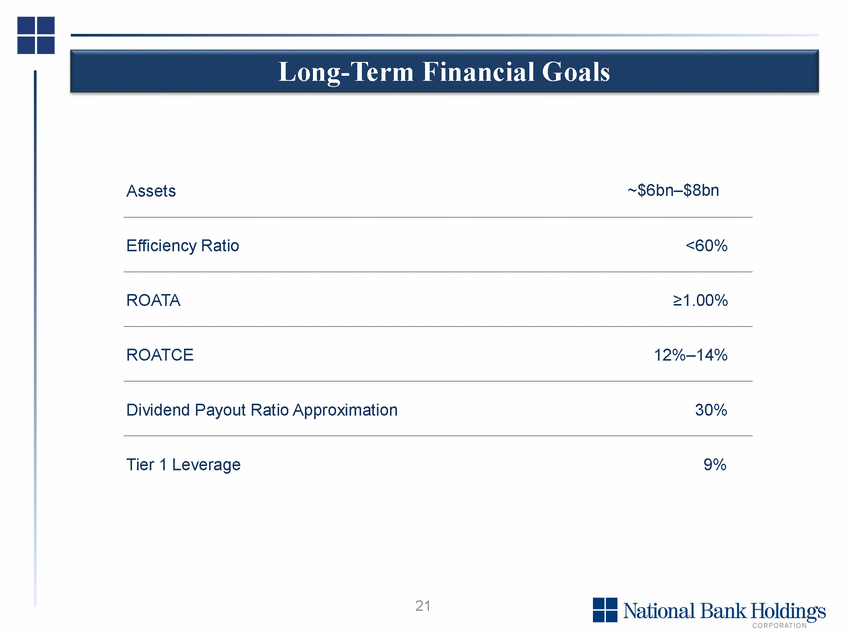
Long-Term Financial Goals ~$6bn–$8bn Assets Efficiency Ratio <60% ROATA ≥1.00% ROATCE 12%–14% Dividend Payout Ratio Approximation 30% Tier 1 Leverage 9% 21 |
|
|
Investment Highlights Attractive markets of Colorado and Kansas City MSA with a presence in Austin and Dallas, Texas Relationship banking strategies driving record new loan originations of $1.1 billion TTM and good low-cost deposit growth Granular and well-diversified loan portfolio well positioned to absorb future stress Improving profitability and returns Steady trend of decreasing expenses over the years Demonstrated opportunistic manager of capital Expertise in mergers and acquisitions with future opportunities Experienced and respected management team and board of directors 22 |
|
|
Appendix 23 |
|
|
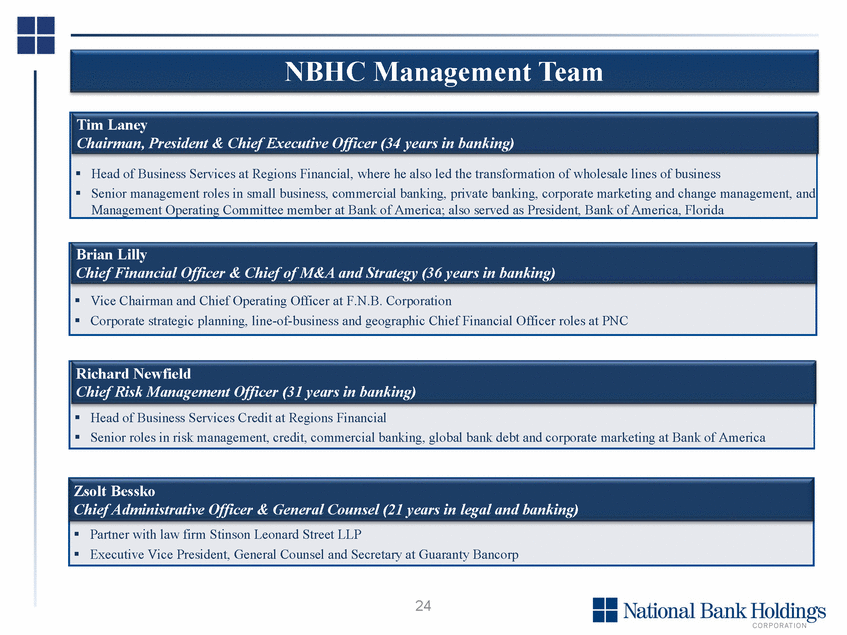
NBHC Management Team 24 Zsolt Bessko Chief Administrative Officer & General Counsel (21 years in legal and banking) Partner with law firm Stinson Leonard Street LLP Executive Vice President, General Counsel and Secretary at Guaranty Bancorp Richard Newfield Chief Risk Management Officer (31 years in banking) Head of Business Services Credit at Regions Financial Senior roles in risk management, credit, commercial banking, global bank debt and corporate marketing at Bank of America Brian Lilly Chief Financial Officer & Chief of M&A and Strategy (36 years in banking) Vice Chairman and Chief Operating Officer at F.N.B. Corporation Corporate strategic planning, line-of-business and geographic Chief Financial Officer roles at PNC Tim Laney Chairman, President & Chief Executive Officer (34 years in banking) Head of Business Services at Regions Financial, where he also led the transformation of wholesale lines of business Senior management roles in small business, commercial banking, private banking, corporate marketing and change management, and Management Operating Committee member at Bank of America; also served as President, Bank of America, Florida |
|
|
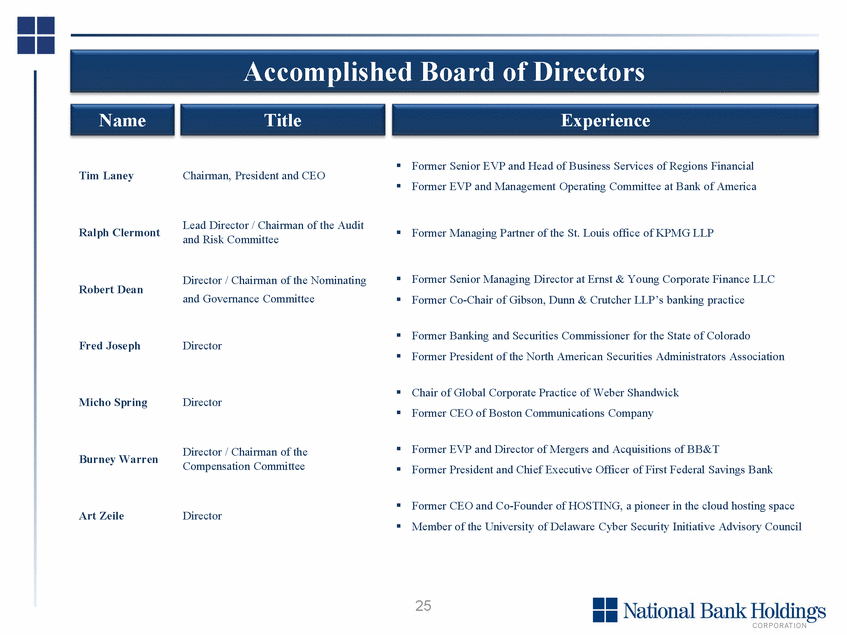
Accomplished Board of Directors Name Title Experience Former Senior EVP and Head of Business Services of Regions Financial Former EVP and Management Operating Committee at Bank of America Tim Laney Chairman, President and CEO Lead Director / Chairman of the Audit and Risk Committee Ralph Clermont Former Managing Partner of the St. Louis office of KPMG LLP Former Senior Managing Director at Ernst & Young Corporate Finance LLC Former Co-Chair of Gibson, Dunn & Crutcher LLP’s banking practice Director / Chairman of the Nominating and Governance Committee Robert Dean Former Banking and Securities Commissioner for the State of Colorado Former President of the North American Securities Administrators Association Fred Joseph Director Chair of Global Corporate Practice of Weber Shandwick Former CEO of Boston Communications Company Micho Spring Director Former EVP and Director of Mergers and Acquisitions of BB&T Former President and Chief Executive Officer of First Federal Savings Bank Director / Chairman of the Compensation Committee Burney Warren Former CEO and Co-Founder of HOSTING, a pioneer in the cloud hosting space Member of the University of Delaware Cyber Security Initiative Advisory Council Art Zeile Director 25 |
|
|
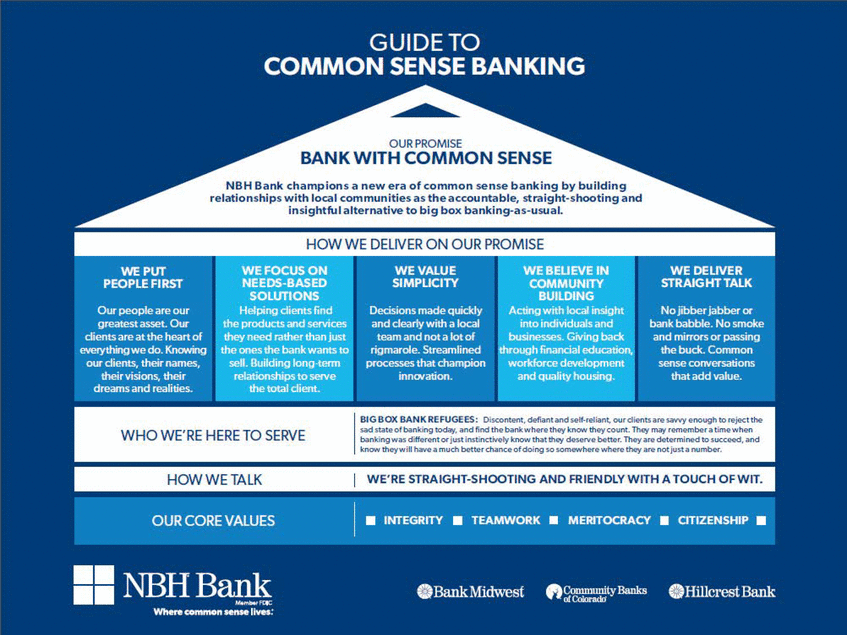
OURPROMJSE BANK WITH COMMON SENSE NBH Bank champions a new era of common sense banking by building relationshi ps with local communities as the accountable, straight-shooting and insightful alternative to big box banking-as-usual. Bl G BOX BANK REFUGEES: Discontent,defiantandself-·reliant. ourdie.ntsareSiNVY enough to reject the sad state of banking today,and find the bankwhere they knowtheycount.They may remembe-ra timewhen WHO WE'RE HERE TO SERVE bankingwas d fferent or justinstinctively know that IIIey desE!fVebetter.They aredetermined tos.ucceed,a.nd knowtheywillhave a much betterchanceofdoing so somewhere where they arenotjusta number. I WE'RE STRAIGHT-SHOOTING AND FRIENDLY WITH A TOUCH OFWIT. |
|
|
|
|
|
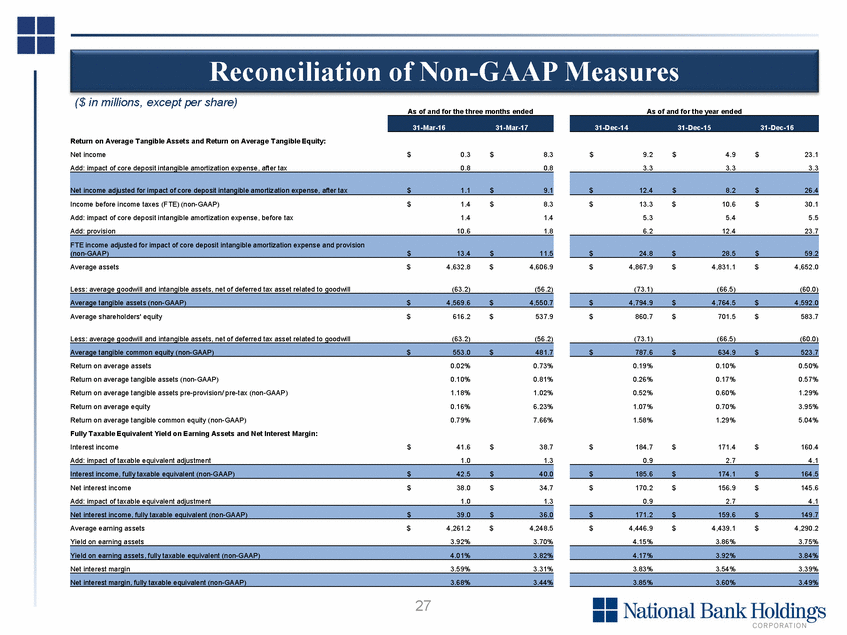
Reconciliation ($ in millions, except per share) of Non-GAAP Measures As of and for the three months ended As of and for the year ended Return on Average Tangible Assets and Return on Average Tangible Equity: Net income Add: impact of core deposit intangible amortization expense, after tax $ 0.3 0.8 $ 8.3 0.8 $ 9.2 3.3 $ 4.9 3.3 $ 23.1 3.3 Income before income taxes (FTE) (non-GAAP) Add: impact of core deposit intangible amortization expense, before tax Add: provision $ 1.4 1.4 10.6 $ 8.3 1.4 1.8 $ 13.3 5.3 6.2 $ 10.6 5.4 12.4 $ 30.1 5.5 23.7 Average assets $ 4,632.8 $ 4,606.9 $ 4,867.9 $ 4,831.1 $ 4,652.0 Less: average goodwill and intangible assets, net of deferred tax asset related to goodwill (63.2) (56.2) (73.1) (66.5) (60.0) Average shareholders' equity $ 616.2 $ 537.9 $ 860.7 $ 701.5 $ 583.7 Less: average goodwill and intangible assets, net of deferred tax asset related to goodwill (63.2) (56.2) (73.1) (66.5) (60.0) Return on average assets Return on average tangible assets (non-GAAP) Return on average tangible assets pre-provision/ pre-tax (non-GAAP) Return on average equity Return on average tangible common equity (non-GAAP) Fully Taxable Equivalent Yield on Earning Assets and Net Interest Margin: Interest income Add: impact of taxable equivalent adjustment 0.02% 0.10% 1.18% 0.16% 0.79% 0.73% 0.81% 1.02% 6.23% 7.66% 0.19% 0.26% 0.52% 1.07% 1.58% 0.10% 0.17% 0.60% 0.70% 1.29% 0.50% 0.57% 1.29% 3.95% 5.04% $ 41.6 1.0 $ 38.7 1.3 $ 184.7 0.9 $ 171.4 2.7 $ 160.4 4.1 Net interest income Add: impact of taxable equivalent adjustment $ 38.0 1.0 $ 34.7 1.3 $ 170.2 0.9 $ 156.9 2.7 $ 145.6 4.1 Average earning assets Yield on earning assets $ 4,261.2 3.92% $ 4,248.5 3.70% $ 4,446.9 4.15% $ 4,439.1 3.86% $ 4,290.2 3.75% Net interest margin 3.59% 3.31% 3.83% 3.54% 3.39% 27 3.85%3.60%3.49% Net interest margin, fully taxable equivalent (non-GAAP)3.68%3.44% 4.17%3.92%3.84% Yield on earning assets, fully taxable equivalent (non-GAAP)4.01%3.82% $171.2$159.6$149.7 Net interest income, fully taxable equivalent (non-GAAP)$39.0$36.0 $185.6$174.1$164.5 Interest income, fully taxable equivalent (non-GAAP)$42.5$40.0 $787.6$634.9$523.7 Average tangible common equity (non-GAAP)$553.0$481.7 $4,794.9$4,764.5$4,592.0 Average tangible assets (non-GAAP)$4,569.6$4,550.7 $24.8$28.5$59.2 FTE income adjusted for impact of core deposit intangible amortization expense and provision (non-GAAP)$13.4$11.5 $12.4$8.2$26.4 Net income adjusted for impact of core deposit intangible amortization expense, after tax$1.1$9.1 31-Dec-1431-Dec-1531-Dec-16 31-Mar-1631-Mar-17 |
|
|
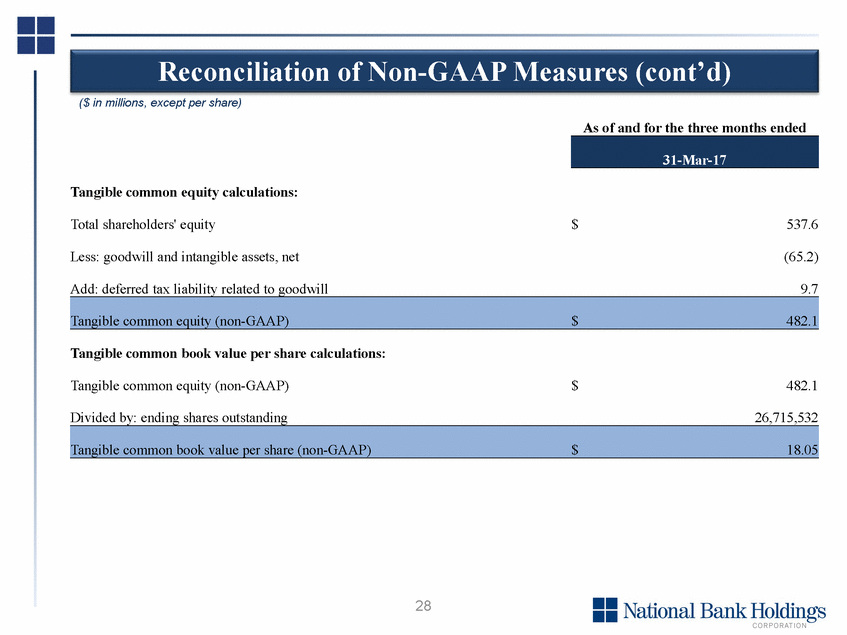
Reconciliation ($ in millions, except per share) of Non-GAAP Measures (cont’d) As of and for the three months ended Tangible common equity calculations: Total shareholders' equity $ 537.6 Less: goodwill and intangible assets, net (65.2) Add: deferred tax liability related to goodwill 9.7 Tangible common book value per share calculations: Tangible common equity (non-GAAP) $ 482.1 Divided by: ending shares outstanding 26,715,532 28 Tangible common book value per share (non-GAAP)$18.05 Tangible common equity (non-GAAP)$482.1 31-Mar-17 |