Attached files
| file | filename |
|---|---|
| 8-K - FORM 8-K - HomeStreet, Inc. | a8-kfor1q2017investorslides.htm |
FIRST QUARTER
2017
NASDAQ:HMST
Important Disclosures
Forward-Looking Statements
This presentation includes forward-looking statements, as that term is defined for purposes of applicable securities laws, about our industry, our future financial performance and business plans
and expectations. These statements are, in essence, attempts to anticipate or forecast future events, and thus subject to many risks and uncertainties. These forward-looking statements are
based on our management's current expectations, beliefs, projections, future plans and strategies, anticipated events or trends, and similar expressions concerning matters that are not
historical facts, as well as a number of assumptions concerning future events. Forward-looking statements in this release include, among other matters, statements regarding our business plans
and strategies (including our expansion strategies) and the expected effects of those initiatives, general economic trends (particularly those that affect mortgage origination and refinance
activity) and growth scenarios and performance targets. Readers should note, however, that all statements in this presentation other than assertions of historical fact are forward-looking in
nature. These statements are subject to risks, uncertainties, assumptions and other important factors set forth in our SEC filings, including but not limited to our Annual Report on Form 10-K for
the year ended December 31, 2016 and our quarterly report on Form 10-Q for the quarter ended March 31, 2107, which we expect to file on or before May 5, 2017. Many of these factors and
events that affect the volatility in our stock price and shareholders’ response to those events and factors are beyond our control. Such factors could cause actual results to differ materially from
the results discussed or implied in the forward-looking statements. These limitations and risks include without limitation changes in general political and economic conditions that impact our
markets and our business, actions by the Federal Reserve Board and financial market conditions that affect monetary and fiscal policy, regulatory and legislative findings or actions that may
increase capital requirements or otherwise constrain our ability to do business, including restrictions that could be imposed by our regulators on certain aspects of our operations or on our
growth initiatives and acquisition activities, risks related to our ability to realize the expected value of our recent acquisitions, continue to expand our banking operations geographically and
across market sectors, grow our franchise and capitalize on market opportunities, manage our growth efforts cost-effectively and attain the desired operational and financial outcomes, manage
the losses inherent in our loan portfolio, and make accurate estimates of the value of our non-cash assets and liabilities, maintain electronic and physical security of customer data, respond to
restrictive and complex regulatory environment, and attract and retain key personnel. In addition, the ratio of loan lock to closed loan volume may fluctuate due to challenges our customers may
face in meeting current underwriting standards, a change in interest rates, an increase in competition for such loans, changes in general economic conditions, including housing prices and
inventory levels, the job market, consumer confidence and spending habits either nationally or in the regional and local market areas in which the Company does business, and legislative or
regulatory actions or reform that may affect our business or the banking or mortgage industries more generally. Actual results may fall materially short of our expectations and projections, and
we may change our plans or take additional actions that differ in material ways from our current intentions. Accordingly, we can give no assurance of future performance, and you should not rely
unduly on forward-looking statements. All forward-looking statements are based on information available to the Company as of the date hereof, and we do not undertake to update or revise any
forward-looking statements, for any reason.
Basis of Presentation of Financial Data
Unless noted otherwise in this presentation, all reported financial data is being presented as of the period ending March 31, 2017, and is unaudited, although certain information related to the
year ended December 31, 2016, has been derived from our audited financial statements. All financial data should be read in conjunction with the notes in our consolidated financial statements.
Non-GAAP Financial Measures
Information on any non-GAAP financial measures such as core measures or tangible measures referenced in this presentation, including a reconciliation of those measures to GAAP measures,
may also be found in the appendix, our SEC filings, and in the earnings release available on our web site.
2
Growing Western U.S. Franchise
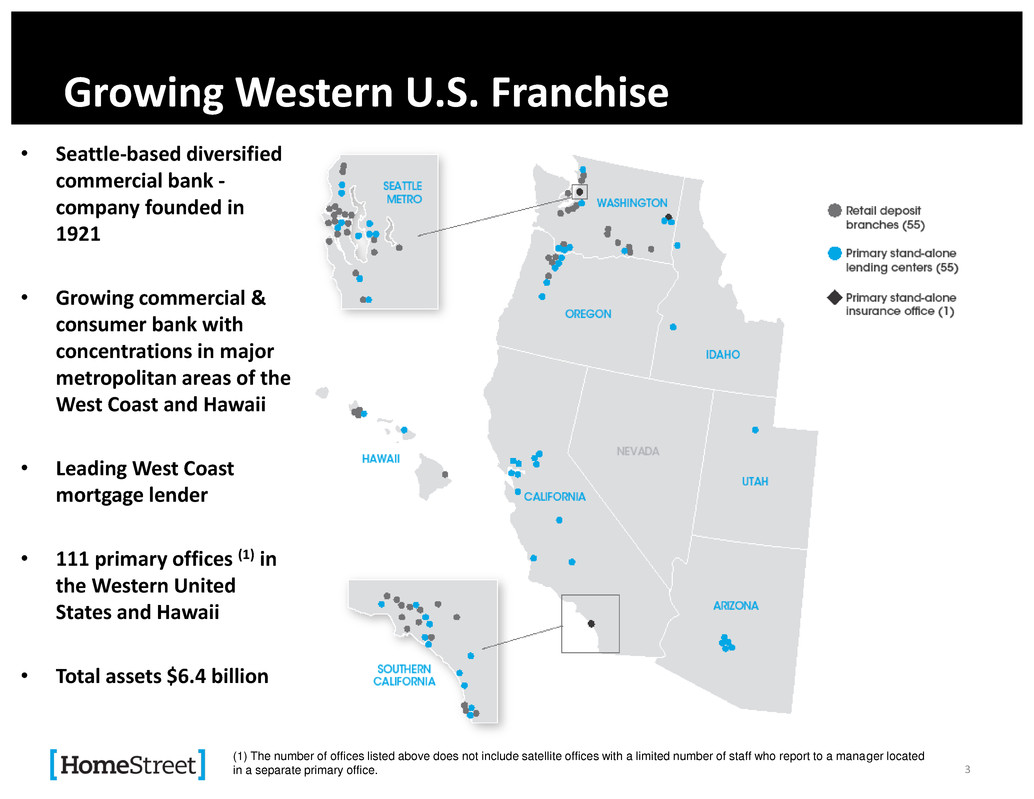
• Seattle-based diversified
commercial bank -
company founded in
1921
• Growing commercial &
consumer bank with
concentrations in major
metropolitan areas of the
West Coast and Hawaii
• Leading West Coast
mortgage lender
• 111 primary offices (1) in
the Western United
States and Hawaii
• Total assets $6.4 billion
3
(1) The number of offices listed above does not include satellite offices with a limited number of staff who report to a manager located
in a separate primary office.
Strategy
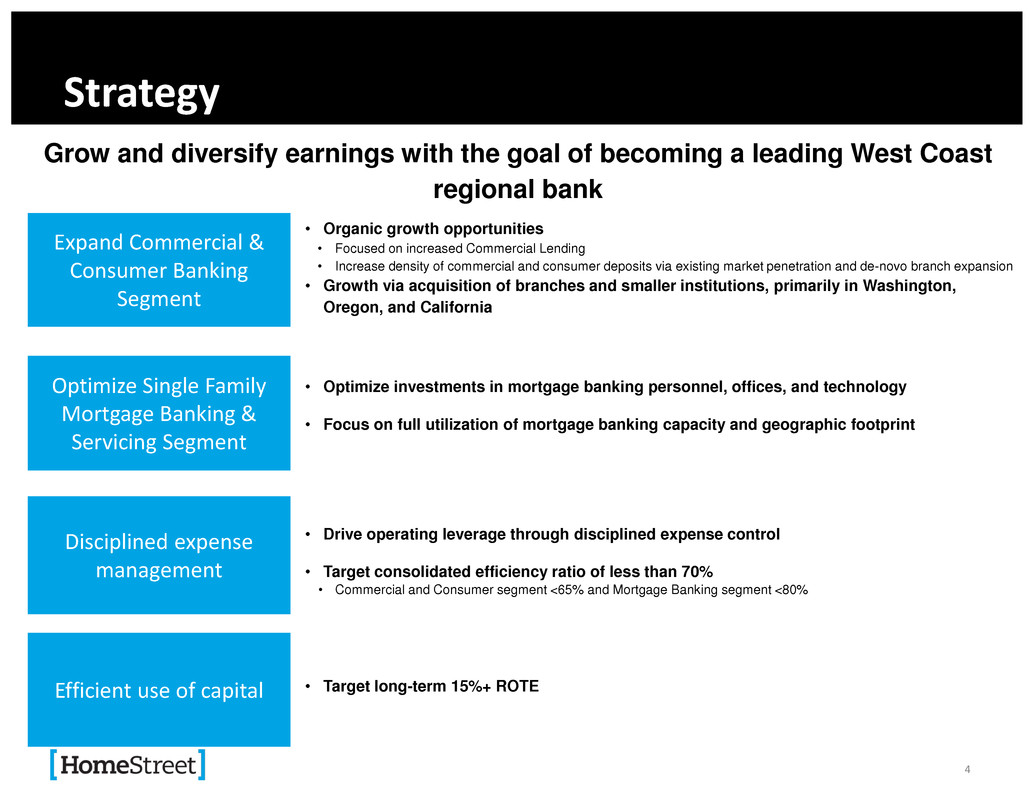
Optimize Single Family
Mortgage Banking &
Servicing Segment
• Organic growth opportunities
• Focused on increased Commercial Lending
• Increase density of commercial and consumer deposits via existing market penetration and de-novo branch expansion
• Growth via acquisition of branches and smaller institutions, primarily in Washington,
Oregon, and California
• Optimize investments in mortgage banking personnel, offices, and technology
• Focus on full utilization of mortgage banking capacity and geographic footprint
• Drive operating leverage through disciplined expense control
• Target consolidated efficiency ratio of less than 70%
• Commercial and Consumer segment <65% and Mortgage Banking segment <80%
• Target long-term 15%+ ROTE
Expand Commercial &
Consumer Banking
Segment
Disciplined expense
management
Efficient use of capital
Grow and diversify earnings with the goal of becoming a leading West Coast
regional bank
4
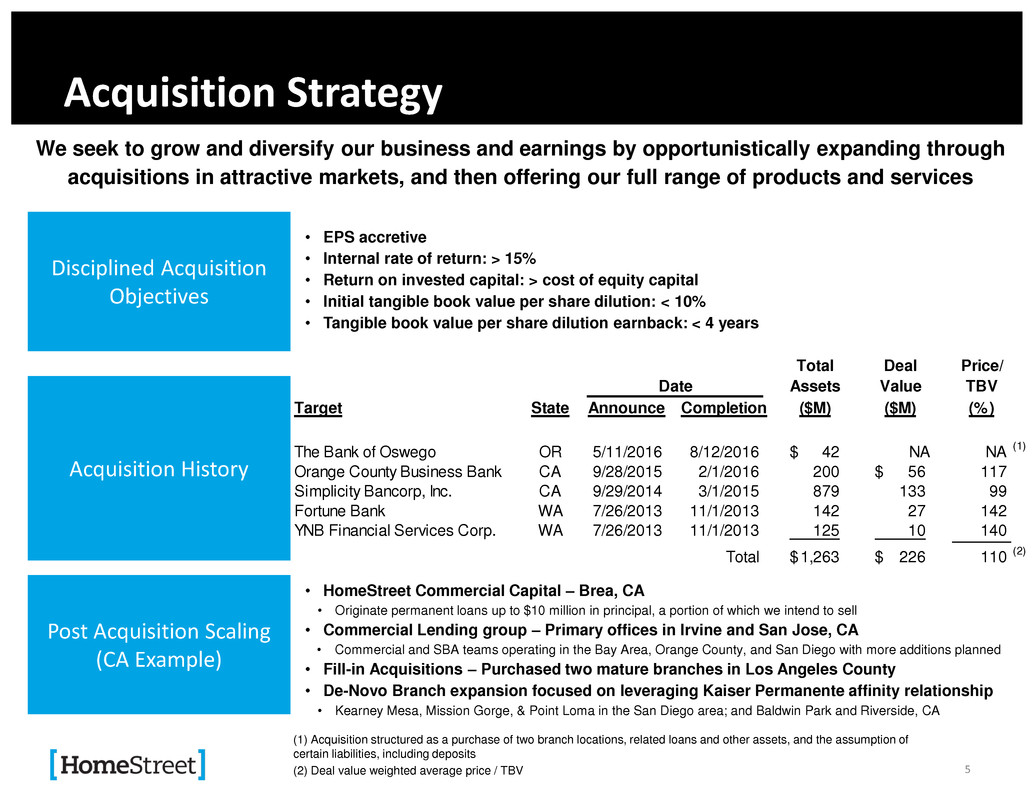
Acquisition Strategy
Post Acquisition Scaling
(CA Example)
• EPS accretive
• Internal rate of return: > 15%
• Return on invested capital: > cost of equity capital
• Initial tangible book value per share dilution: < 10%
• Tangible book value per share dilution earnback: < 4 years
Disciplined Acquisition
Objectives
Acquisition History
We seek to grow and diversify our business and earnings by opportunistically expanding through
acquisitions in attractive markets, and then offering our full range of products and services
5
• HomeStreet Commercial Capital – Brea, CA
• Originate permanent loans up to $10 million in principal, a portion of which we intend to sell
• Commercial Lending group – Primary offices in Irvine and San Jose, CA
• Commercial and SBA teams operating in the Bay Area, Orange County, and San Diego with more additions planned
• Fill-in Acquisitions – Purchased two mature branches in Los Angeles County
• De-Novo Branch expansion focused on leveraging Kaiser Permanente affinity relationship
• Kearney Mesa, Mission Gorge, & Point Loma in the San Diego area; and Baldwin Park and Riverside, CA
(1) Acquisition structured as a purchase of two branch locations, related loans and other assets, and the assumption of
certain liabilities, including deposits
(2) Deal value weighted average price / TBV
Total Deal Price/
Assets Value TBV
Target State Announce Completion ($M) ($M) (%)
he B nk of Oswego OR 5/11/2016 8/12/2016 42$ NA NA
(1)
Orange County Business Bank CA 9/28/2015 2/1/2016 200 56$ 117
Simplicity Bancorp, Inc. CA 9/29/2014 3/1/2015 879 133 99
Fortune Bank WA 7/26/2013 11/1/2013 142 27 142
YNB Financial Services Corp. WA 7/26/2013 11/1/2013 125 10 140
Total 1,263$ 226$ 110
(2)
Date
Diversification
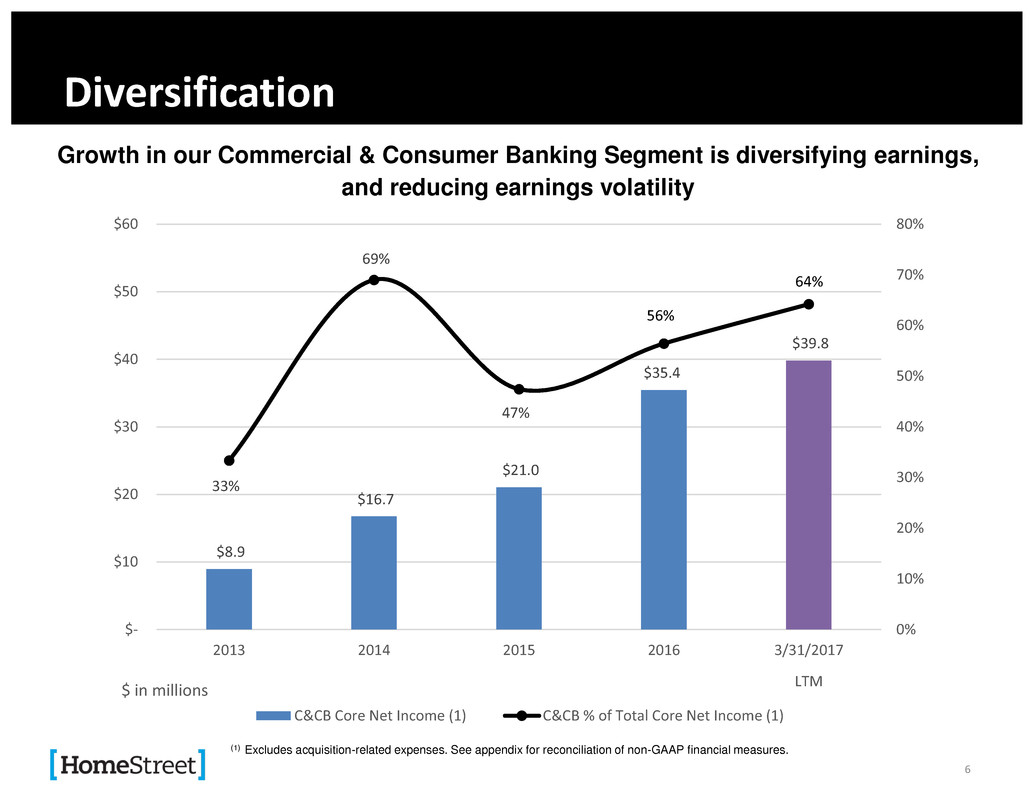
Growth in our Commercial & Consumer Banking Segment is diversifying earnings,
and reducing earnings volatility
6
(1) Excludes acquisition-related expenses. See appendix for reconciliation of non-GAAP financial measures.
$8.9
$16.7
$21.0
$35.4
$39.8
33%
69%
47%
56%
64%
0%
10%
20%
30%
40%
50%
60%
70%
80%
$-
$10
$20
$30
$40
$50
$60
2013 2014 2015 2016 3/31/2017
LTM
$ in millions
C&CB Core Net Income (1) C&CB % of Total Core Net Income (1)
7
Recent Highlights
Results of Operations
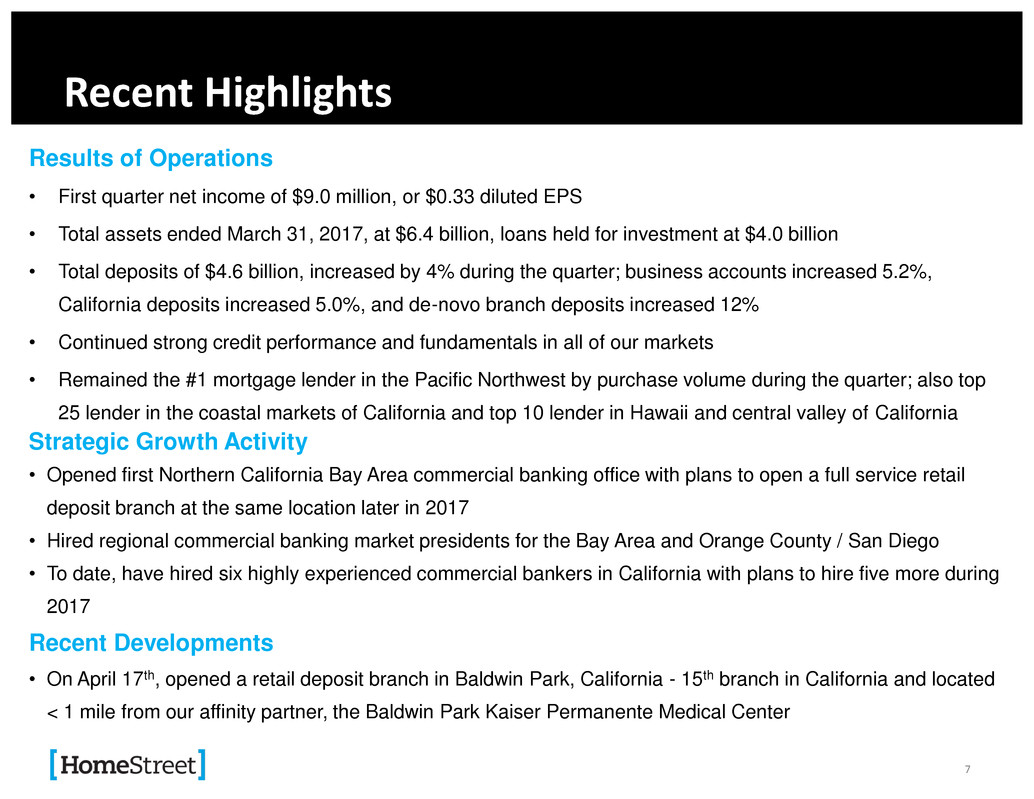
• First quarter net income of $9.0 million, or $0.33 diluted EPS
• Total assets ended March 31, 2017, at $6.4 billion, loans held for investment at $4.0 billion
• Total deposits of $4.6 billion, increased by 4% during the quarter; business accounts increased 5.2%,
California deposits increased 5.0%, and de-novo branch deposits increased 12%
• Continued strong credit performance and fundamentals in all of our markets
• Remained the #1 mortgage lender in the Pacific Northwest by purchase volume during the quarter; also top
25 lender in the coastal markets of California and top 10 lender in Hawaii and central valley of California
Strategic Growth Activity
• Opened first Northern California Bay Area commercial banking office with plans to open a full service retail
deposit branch at the same location later in 2017
• Hired regional commercial banking market presidents for the Bay Area and Orange County / San Diego
• To date, have hired six highly experienced commercial bankers in California with plans to hire five more during
2017
Recent Developments
• On April 17th, opened a retail deposit branch in Baldwin Park, California - 15th branch in California and located
< 1 mile from our affinity partner, the Baldwin Park Kaiser Permanente Medical Center
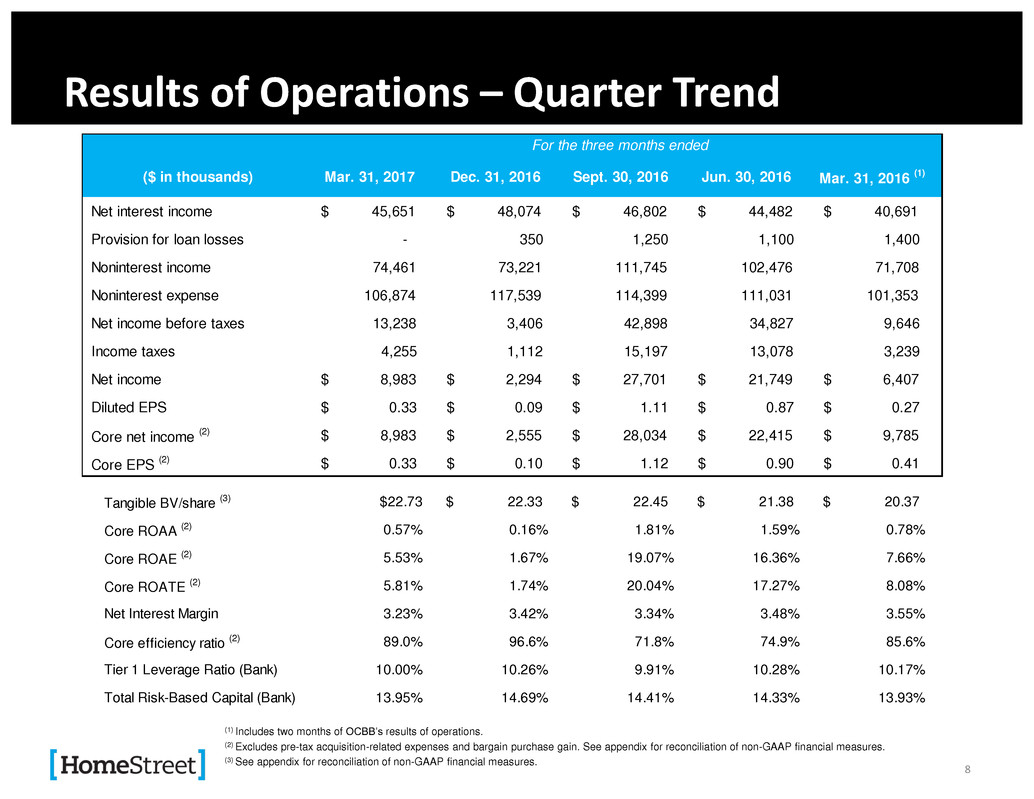
Results of Operations – Quarter Trend
For the three months ended
(1) Includes two months of OCBB’s results of operations.
(2) Excludes pre-tax acquisition-related expenses and bargain purchase gain. See appendix for reconciliation of non-GAAP financial measures.
(3) See appendix for reconciliation of non-GAAP financial measures.
For the nine months ended
8
($ in thousands) Mar. 31, 2017 Dec. 31, 2016 Sept. 30, 2016 Jun. 30, 2016 Mar. 31, 2016
(1)
Net interest income $ 45,651 $ 48,074 $ 46,802 $ 44,482 $ 40,691
Provision for loan losses - 350 1,250 1,100 1,400
Noninterest income 74,461 73,221 111,745 102,476 71,708
Noninterest expense 106,874 117,539 114,399 111,031 101,353
Net income before taxes 13,238 3,406 42,898 34,827 9,646
Income taxes 4,255 1,112 15,197 13,078 3,239
Net income $ 8,983 $ 2,294 $ 27,701 $ 21,749 $ 6,407
Diluted EPS $ 0.33 $ 0.09 $ 1.11 $ 0.87 $ 0.27
Core net income
(2) $ 8,983 $ 2,555 $ 28,034 $ 22,415 $ 9,785
Core EPS
(2) $ 0.33 $ 0.10 $ 1.12 $ 0.90 $ 0.41
Tangible BV/share (3) $22.73 $ 22.33 $ 22.45 $ 21.38 $ 20.37
Core ROAA (2) 0.57% 0.16% 1.81% 1.59% 0.78%
Core ROAE (2) 5.53% 1.67% 19.07% 16.36% 7.66%
Core ROATE (2) 5.81% 1.74% 20.04% 17.27% 8.08%
Net Interest Margin 3.23% 3.42% 3.34% 3.48% 3.55%
Core efficiency ratio (2) 89.0% 96.6% 71.8% 74.9% 85.6%
Tier 1 Leverage Ratio (Bank) 10.00% 10.26% 9.91% 10.28% 10.17%
Total Risk-Based Capital (Bank) 13.95% 14.69% 14.41% 14.33% 13.93%
For the three months ended
3.55%
0.03
0.032
0.034
0.036
0.038
0.04
0.042
0.00%
0.50%
1.00%
1.50%
2.00%
2.50%
3.00%
3.50%
4.00%
Ne
t In
ter
est
Ma
rgi
n (%
)
Ne
t In
ter
est
Inc
om
e (i
n m
illio
ns)
$40.7
$44.5
$46.8
$48.1
$45.7
3.55%
3.48%
3.34%
3.42%
3.23%
2.75%
2.95%
3.15%
3.35%
3.55%
3.75%
3.95%
4.15%
$-
$10.0
$2 .0
$30.0
$40.0
$50.0
$6 .0
1Q16 2Q16 3Q16 4Q16 1Q17
Ne
t In
ter
est
Ma
rgi
n (%
)
Ne
t In
ter
est
Inc
om
e (i
n m
illio
ns)
Net Interest Income & Margin
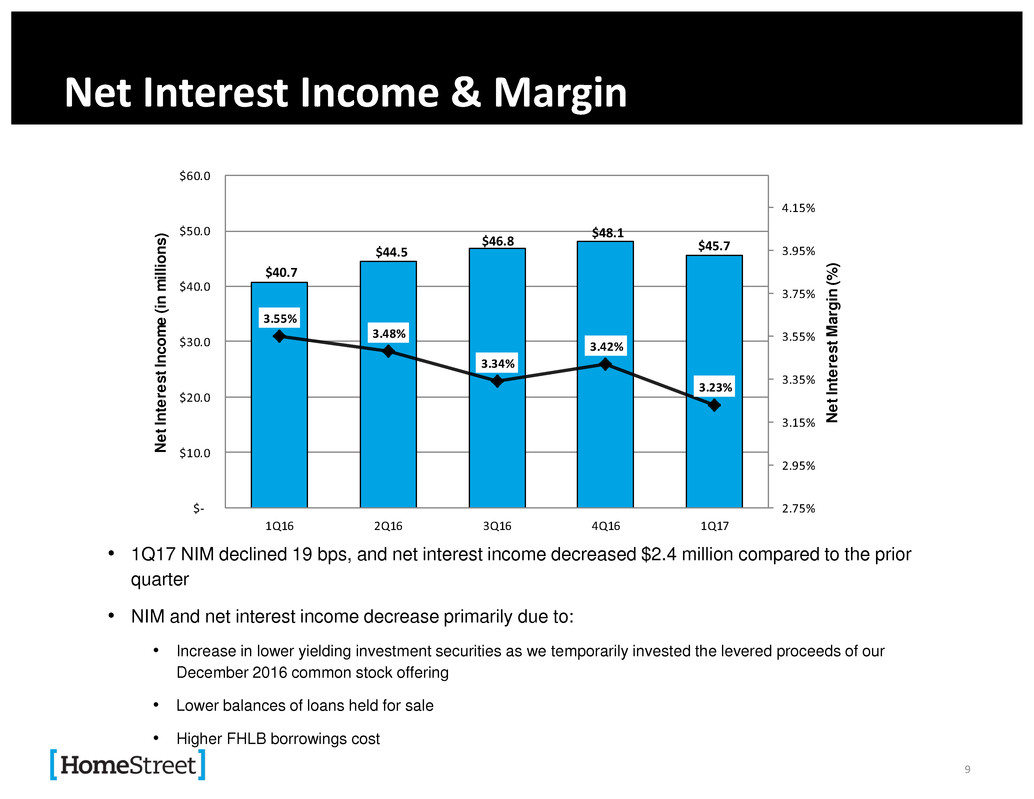
• 1Q17 NIM declined 19 bps, and net interest income decreased $2.4 million compared to the prior
quarter
• NIM and net interest income decrease primarily due to:
• Increase in lower yielding investment securities as we temporarily invested the levered proceeds of our
December 2016 common stock offering
• Lower balances of loans held for sale
• Higher FHLB borrowings cost
9
Avg. Yield
$4.63
$5.19
$5.69 $5.71 $5.78
3.20%
3.40%
3.60%
3.80%
4.00%
4.20%
$0.00
$1.00
$2.00
$3.00
$4.00
$5.00
$6.00
$7.00
1Q16 2Q16 3Q16 4Q16 1Q17
Av
era
ge
Yi
eld
Av
era
ge
Ba
lan
ce
s (
in
bil
lio
ns
)
Loans Held for Sale
Cash & Cash Equivalents
Investment Securities
Loans Held for Investment
Average Yield
Interest-Earning Assets
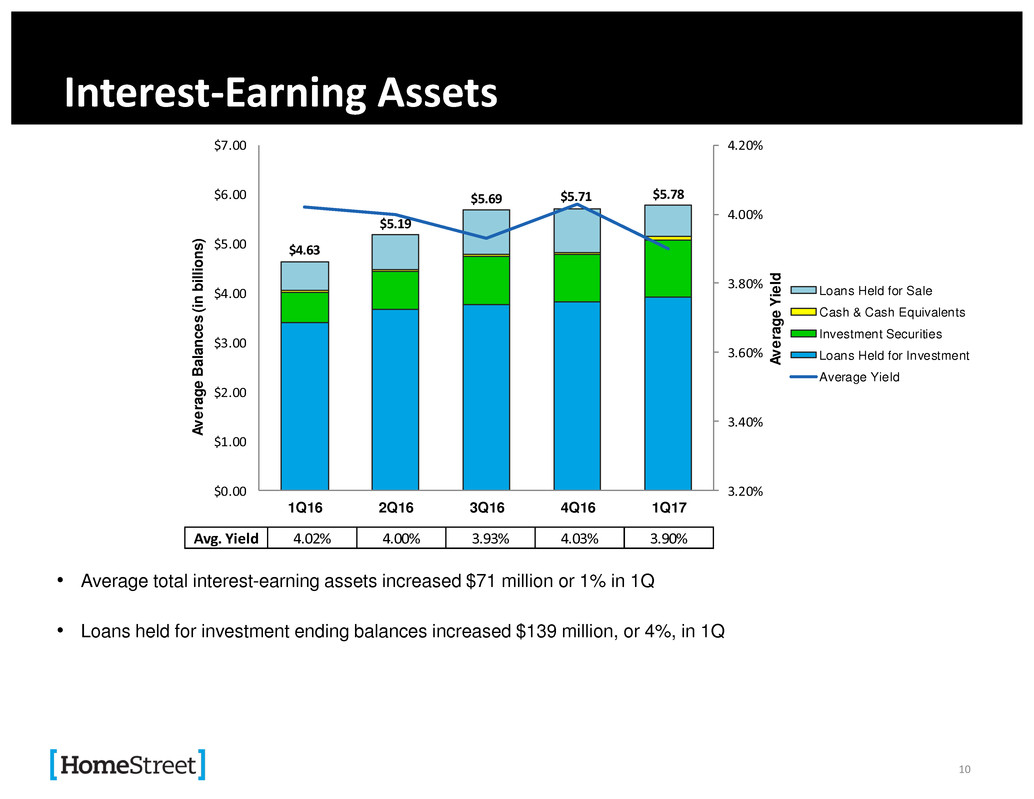
• Average total interest-earning assets increased $71 million or 1% in 1Q
• Loans held for investment ending balances increased $139 million, or 4%, in 1Q
Avg. Yield 4.02% 4.00% 3.93% 4.03% 3.90%
10
HomeStreet Investment Securities Portfolio Yield
As of 03/31/2017 2017 YTD Total
Return (1)
Yield (2)
Duration (2)
HomeStreet Investment Portfolio 0.84 2.59 4.60
Composition Adjusted Barclays US Aggregate Index (4) 1.02 2.94 5.12
HMST performance data: Bloomberg PORT+
(1) As of March 31, 2017
(2) Yield and duration Include FTE adjustment. Yields are at current market prices, not book.
(3) Performance Trust proprietary models as of 12/31/16, YOY
(4) Barclays US Aggregate Index Adjusted to reflect HMST portfolio composition
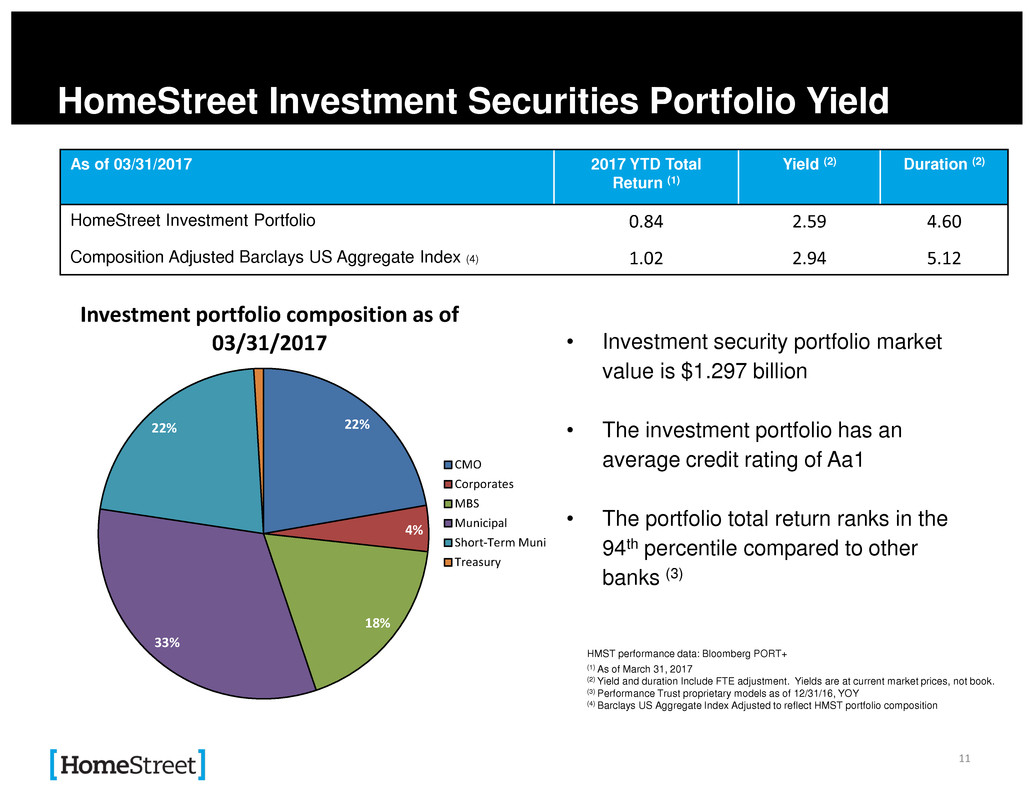
• Investment security portfolio market
value is $1.297 billion
• The investment portfolio has an
average credit rating of Aa1
• The portfolio total return ranks in the
94th percentile compared to other
banks (3)
11
22%
4%
18%
33%
22%
1%
Investment portfolio composition as of
03/31/2017
CMO
Corporates
MBS
Municipal
Short-Term Muni
Treasury
$4.1 $6.5 $5.7 $4.9
$61.3
$85.6
$92.6
$67.8
$60.3
$71.7
$102.5
$111.7
$73.2 $74.5
$8.0
$12.7
$12.6
$9.2
$-
$20.0
$40.0
$60.0
$80.0
$100.0
$120.0
1Q16 2Q16 3Q16 4Q16 1Q17
No
nin
ter
st I
nc
om
e (i
n m
illio
ns
)
Net gain on mortgage loan
origination and sale activities
Mortgage servicing income
Other noninterest income
Noninterest Income
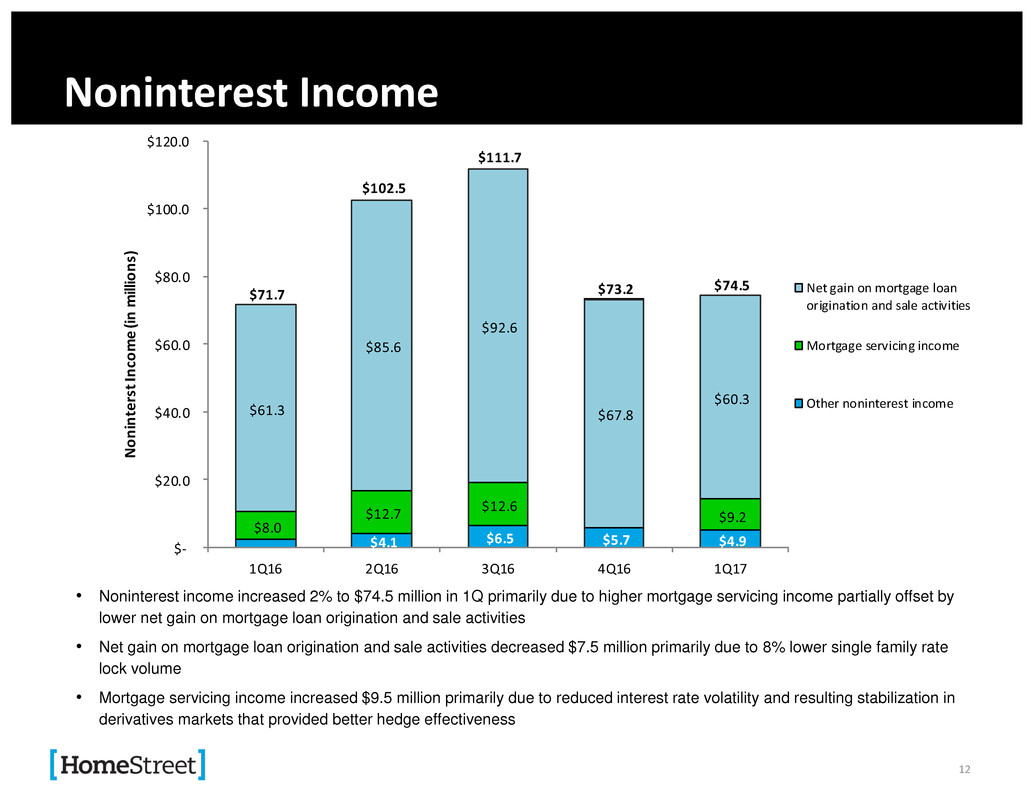
• Noninterest income increased 2% to $74.5 million in 1Q primarily due to higher mortgage servicing income partially offset by
lower net gain on mortgage loan origination and sale activities
• Net gain on mortgage loan origination and sale activities decreased $7.5 million primarily due to 8% lower single family rate
lock volume
• Mortgage servicing income increased $9.5 million primarily due to reduced interest rate volatility and resulting stabilization in
derivatives markets that provided better hedge effectiveness
12
$101.4
$111.0 $114.4
$117.5
$106.9
1,000
1,400
1,800
2,200
2,600
3,000
$-
$20.0
$40.0
$60.0
$80.0
$100.0
$120.0
$140.0
1Q16 2Q16 3Q16 4Q16 1Q17
FTE
No
nin
ter
st E
xpe
nse
(in
mi
llio
ns)
Core noninterest expense Merger-related expenses FTE
Total noninterest expense $101.4 $111.0 $114.4 $117.5 $106.9
Merger-related expenses $5.2 $1.0 $0.5 $0.4 $0.0
Core noninterest expense (1) $96.2 $110.0 $113.9 $117.1 $106.9
Salaries & related costs (1) $63.8 $74.5 $79.2 $81.7 $71.3
General & administrative (1) $15.7 $17.1 $15.5 $15.9 $17.1
Other noninterest expense (1) $16.7 $18.4 $19.2 $19.5 $18.5
FTE 2,264 2,335 2,431 2,552 2,581
Core efficiency ratio (1) 85.6% 74.9% 71.8% 96.6% 89.0%
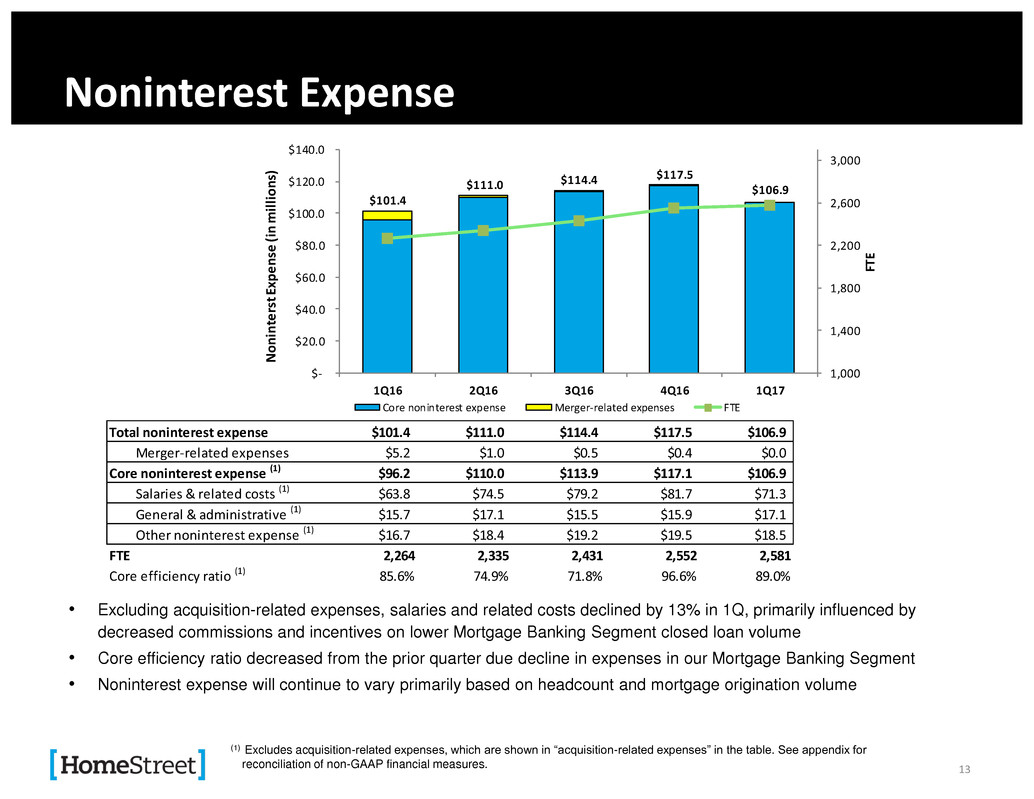
Noninterest Expense
• Excluding acquisition-related expenses, salaries and related costs declined by 13% in 1Q, primarily influenced by
decreased commissions and incentives on lower Mortgage Banking Segment closed loan volume
• Core efficiency ratio decreased from the prior quarter due decline in expenses in our Mortgage Banking Segment
• Noninterest expense will continue to vary primarily based on headcount and mortgage origination volume
(1) Excludes acquisition-related expenses, which are shown in “acquisition-related expenses” in the table. See appendix for
reconciliation of non-GAAP financial measures. 13
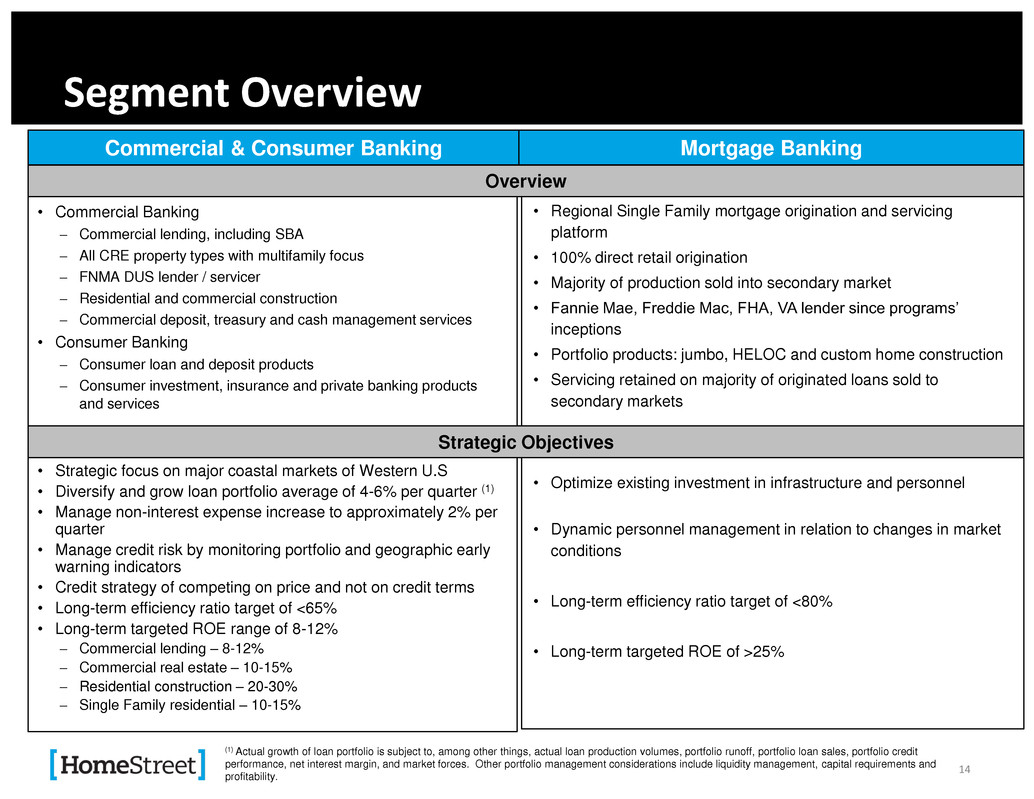
Segment Overview
Commercial & Consumer Banking
• Regional Single Family mortgage origination and servicing
platform
• 100% direct retail origination
• Majority of production sold into secondary market
• Fannie Mae, Freddie Mac, FHA, VA lender since programs’
inceptions
• Portfolio products: jumbo, HELOC and custom home construction
• Servicing retained on majority of originated loans sold to
secondary markets
• Optimize existing investment in infrastructure and personnel
• Dynamic personnel management in relation to changes in market
conditions
• Long-term efficiency ratio target of <80%
• Long-term targeted ROE of >25%
Mortgage Banking
Overview
• Commercial Banking
Commercial lending, including SBA
All CRE property types with multifamily focus
FNMA DUS lender / servicer
Residential and commercial construction
Commercial deposit, treasury and cash management services
• Consumer Banking
Consumer loan and deposit products
Consumer investment, insurance and private banking products
and services
• Strategic focus on major coastal markets of Western U.S
• Diversify and grow loan portfolio average of 4-6% per quarter (1)
• Manage non-interest expense increase to approximately 2% per
quarter
• Manage credit risk by monitoring portfolio and geographic early
warning indicators
• Credit strategy of competing on price and not on credit terms
• Long-term efficiency ratio target of <65%
• Long-term targeted ROE range of 8-12%
Commercial lending – 8-12%
Commercial real estate – 10-15%
Residential construction – 20-30%
Single Family residential – 10-15%
Strategic Objectives
(1) Actual growth of loan portfolio is subject to, among other things, actual loan production volumes, portfolio runoff, portfolio loan sales, portfolio credit
performance, net interest margin, and market forces. Other portfolio management considerations include liquidity management, capital requirements and
profitability.
14
Commercial & Consumer Banking
15
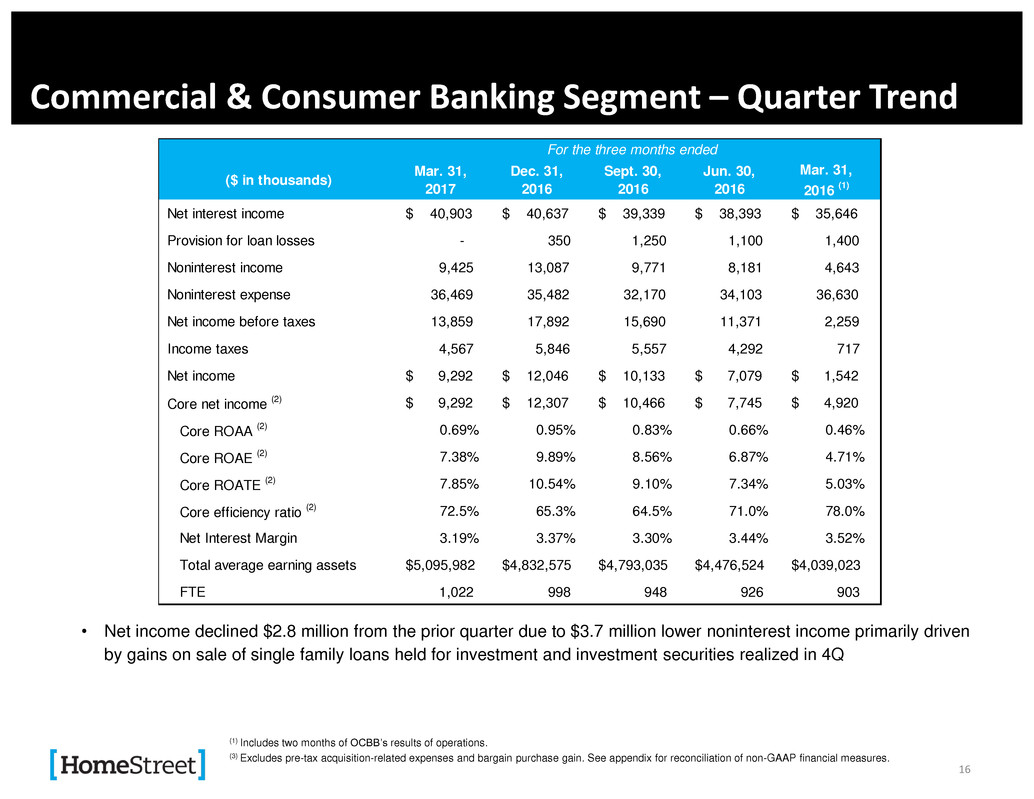
Commercial & Consumer Banking Segment – Quarter Trend
• Net income declined $2.8 million from the prior quarter due to $3.7 million lower noninterest income primarily driven
by gains on sale of single family loans held for investment and investment securities realized in 4Q
16
(1) Includes two months of OCBB’s results of operations.
(3) Excludes pre-tax acquisition-related expenses and bargain purchase gain. See appendix for reconciliation of non-GAAP financial measures.
($ in thousands)
Mar. 31,
2017
Dec. 31,
2016
Sept. 30,
2016
Jun. 30,
2016
Mar. 31,
2016
(1)
Net interest income $ 40,903 $ 40,637 $ 39,339 $ 38,393 $ 35,646
Provision for loan losses - 350 1,250 1,100 1,400
Noninterest income 9,425 13,087 9,771 8,181 4,643
Noninterest expense 36,469 35,482 32,170 34,103 36,630
Net income before taxes 13,859 17,892 15,690 11,371 2,259
Income taxes 4,567 5,846 5,557 4,292 717
Net income $ 9,292 $ 12,046 $ 10,133 $ 7,079 $ 1,542
Core net income
(2) $ 9,292 $ 12,307 $ 10,466 $ 7,745 $ 4,920
Core ROAA
(2) 0.69% 0.95% 0.83% 0.66% 0.46%
Core ROAE
(2) 7.38% 9.89% 8.56% 6.87% 4.71%
Core ROATE
(2) 7.85% 10.54% 9.10% 7.34% 5.03%
Core efficiency ratio
(2) 72.5% 65.3% 64.5% 71.0% 78.0%
Net Interest Margin 3.19% 3.37% 3.30% 3.44% 3.52%
Total average earning assets $5,095,982 $4,832,575 $4,793,035 $4,476,524 $4,039,023
FTE 1,022 998 948 926 903
For the three months ended
Loan Production/Loan Balance Trend
17
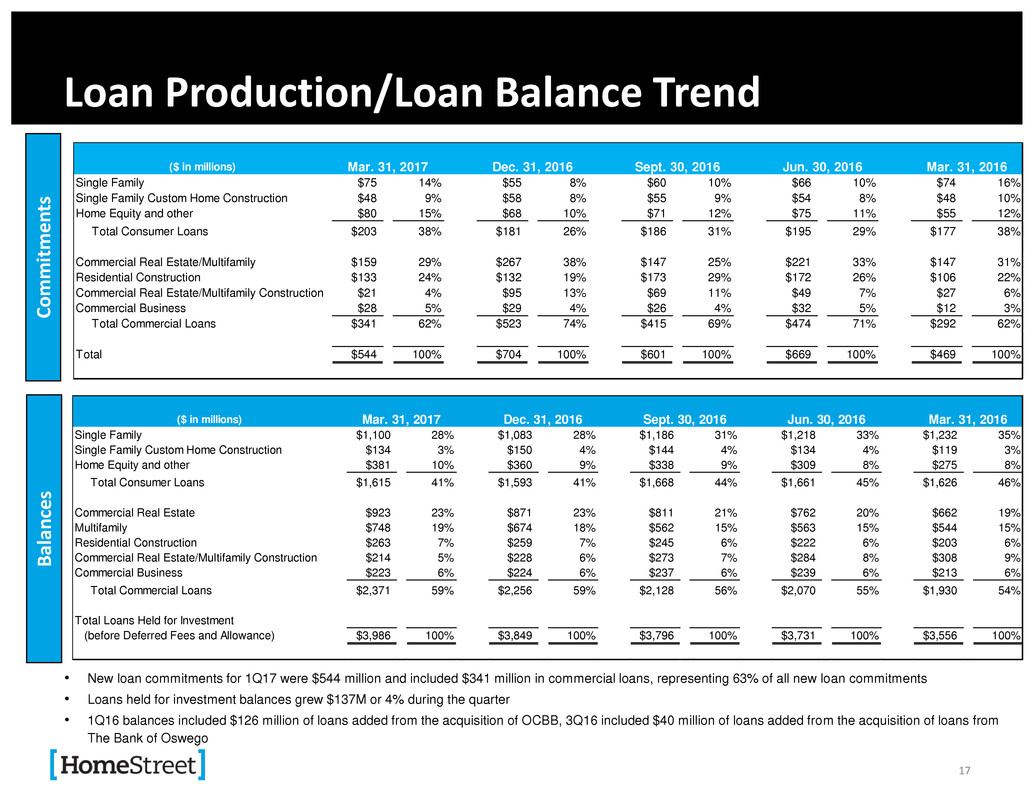
• New loan commitments for 1Q17 were $544 million and included $341 million in commercial loans, representing 63% of all new loan commitments
• Loans held for investment balances grew $137M or 4% during the quarter
• 1Q16 balances included $126 million of loans added from the acquisition of OCBB, 3Q16 included $40 million of loans added from the acquisition of loans from
The Bank of Oswego
Commitme
n
ts
B
al
an
ce
s
($ in millions)
Single Family $75 14% $55 8% $60 10% $66 10% $74 16%
Single Family Custom Home Construction $48 9% $58 8% $55 9% $54 8% $48 10%
Home Equity and other $80 15% $68 10% $71 12% $75 11% $55 12%
Total Consumer Loans $203 38% $181 26% $186 31% $195 29% $177 38%
Commercial Real Estate/Multifamily $159 29% $267 38% $147 25% $221 33% $147 31%
Residential Construction $133 24% $132 19% $173 29% $172 26% $106 22%
Commercial Real Estate/Multifamily Construction $21 4% $95 13% $69 11% $49 7% $27 6%
Commercial Business $28 5% $29 4% $26 4% $32 5% $12 3%
Total Commercial Loans $341 62% $523 74% $415 69% $474 71% $292 62%
Total $544 100% $704 100% $601 100% $669 100% $469 100%
Mar. 31, 2017 Dec. 31, 2016 Sept. 30, 2016 Jun. 30, 2016 Mar. 31, 2016
($ in illions)
Single Family $1,100 28% $1,083 28% $ ,186 31% $1,218 33% $1,232 35%
Single Family Custom Home Construction $134 3% $150 4% $144 4% $134 4% $119 3%
Home Equity and other $381 10% $360 9% $338 9% $309 8% $275 8%
Total Consumer Loans $1,615 41% $1,593 41% $1,668 44% $ ,661 45% $1,626 46%
ial eal state $923 23% $871 23% $811 21% $762 20% $662 19%
Multifamily $748 19% $674 18% $562 15% $563 15% $544 15%
Residential Construction $263 7% $259 7% $245 6% $222 6% $203 6%
Commercial Real Estate/Multifamily Construction $214 5% $228 6% $273 7% $284 8% $308 9%
Commercial Business $223 6% $224 6% $237 6% $239 6% $213 6%
Total Commercial Loans $2,371 59% $2,256 59% $2,128 56% $2,070 55% $1,930 54%
Total Loans Held for Investment
(before Deferred Fees and Allowance) $3,986 100% $3,849 100% $3,796 100% $3,731 100% $3,556 100%
Mar. 31, 2017 Dec. 31, 2016 Sept. 30, 2016 Jun. 30, 2016 Mar. 31, 2016
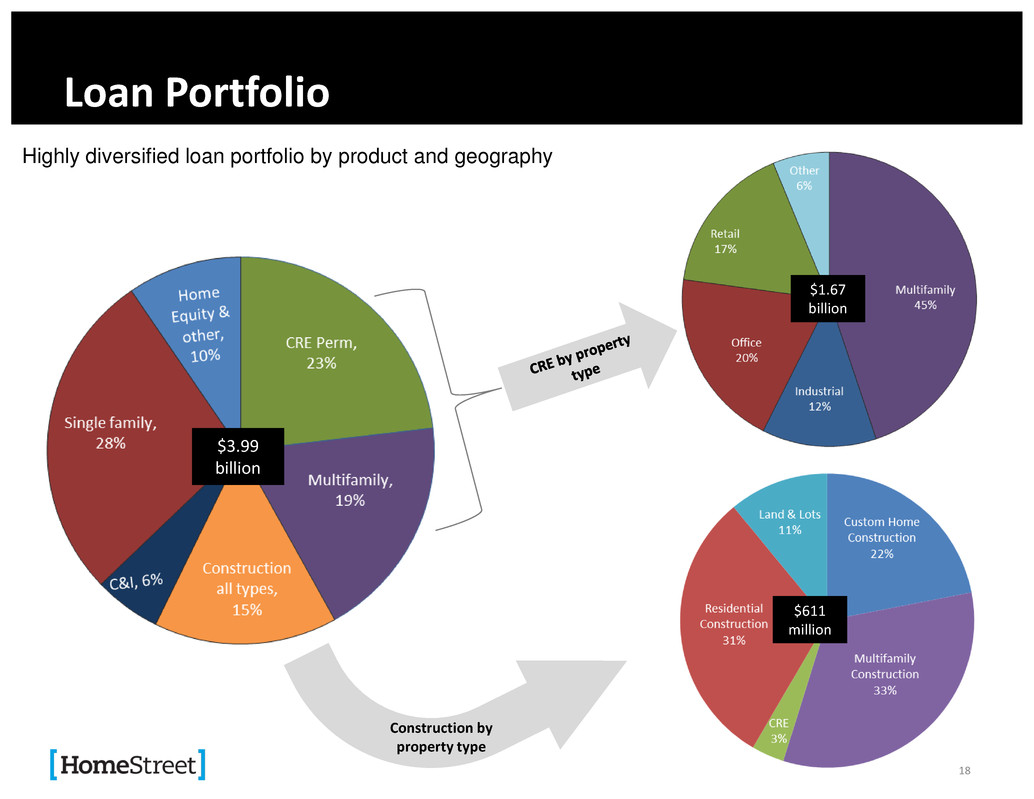
$1.67
billion
Loan Portfolio
18
Highly diversified loan portfolio by product and geography
$3.99
billion
$611
million
Construction by
property type
Other Includes: AK,AZ, CO,HI,ID,NV,TX,UT CA-Los Angeles County
•Additional property types are
reviewed on a case by case basis
• Includes acquired loan types
• Examples include: Self Storage &
Hotel
•Up To 15 Year Term
• $30MM Loan Amt. Max
• ≥ 1.25 DSCR
•Avg. LTV @ Orig. ~ 62%
•Up To 15 Year Term
• $30MM Loan Amt. Max
• ≥ 1.25 DSCR
•Avg. LTV @ Orig. ~ 67%
•Up To 30 Year Term
• $30MM Loan Amt. Max
• ≥ 1.15 DSCR
•Avg. LTV @ Orig. ~ 62%
•Up To 15 Year Term
• $30MM Loan Amt. Max
• ≥ 1.25 DSCR
•Avg. LTV @ Orig. ~ 63%
CA-Other Oregon WA-Other WA-Puget Sound
Commercial Real Estate Perm Lending Overview
19
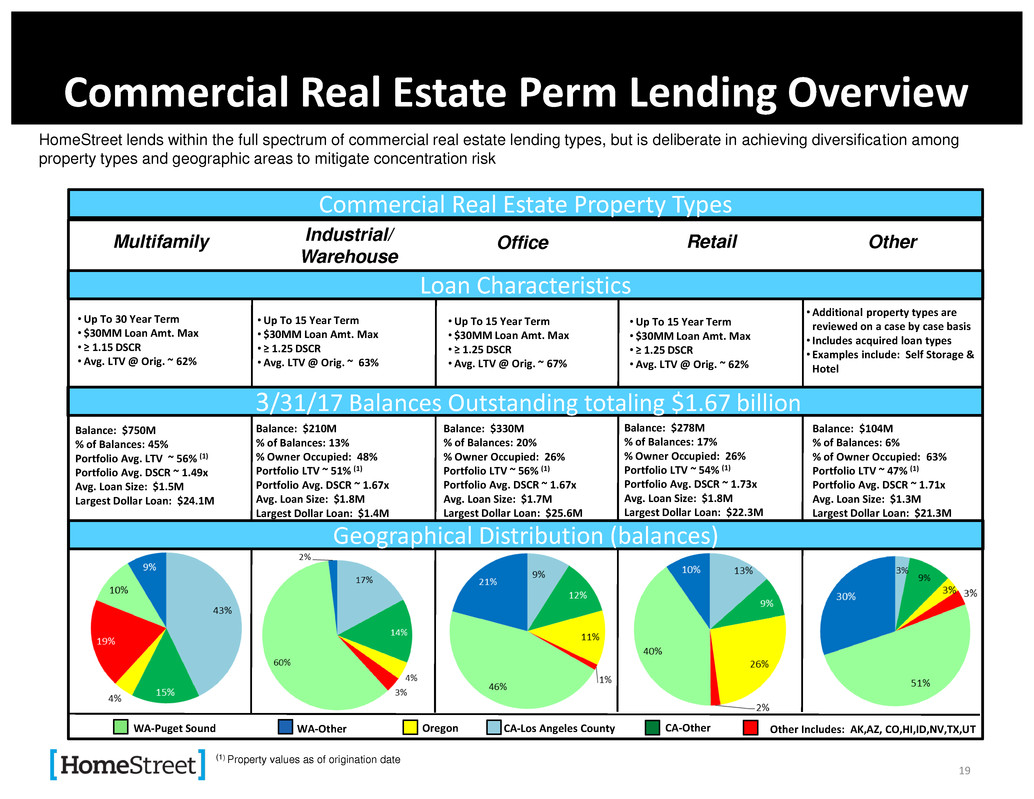
HomeStreet lends within the full spectrum of commercial real estate lending types, but is deliberate in achieving diversification among
property types and geographic areas to mitigate concentration risk
Balance: $278M
% of Balances: 17%
% Owner Occupied: 26%
Portfolio LTV ~ 54% (1)
Portfolio Avg. DSCR ~ 1.73x
Avg. Loan Size: $1.8M
Largest Dollar Loan: $22.3M
3/31/17 Balances Outstanding totaling $1.67 billion
Loan Characteristics
Commercial Real Estate Property Types
Multifamily Office Industrial/
Warehouse
Retail Other
Balance: $750M
% of Balances: 45%
Portfolio Avg. LTV ~ 56% (1)
Portfolio Avg. DSCR ~ 1.49x
Avg. Loan Size: $1.5M
Largest Dollar Loan: $24.1M
Geographical Distribution (balances)
Balance: $210M
% of Balances: 13%
% Owner Occupied: 48%
Portfolio LTV ~ 51% (1)
Portfolio Avg. DSCR ~ 1.67x
Avg. Loan Size: $1.8M
Largest Dollar Loan: $1.4M
Balance: $330M
% of Balances: 20%
% Owner Occupied: 26%
Portfolio LTV ~ 56% (1)
Portfolio Avg. DSCR ~ 1.67x
Avg. Loan Size: $1.7M
Largest Dollar Loan: $25.6M
Balance: $104M
% of Balances: 6%
% of Owner Occupied: 63%
Portfolio LTV ~ 47% (1)
Portfolio Avg. DSCR ~ 1.71x
Avg. Loan Size: $1.3M
Largest Dollar Loan: $21.3M
(1) Property values as of origination date

Construction Lending Overview
20
Construction lending is a broad category that includes many different loan types, which are often characterized by different risk profiles.
HomeStreet lends within the full spectrum of construction lending types, but is deliberate in achieving diversification among the types to
mitigate risk. Additionally, recent geographic expansion has provided an opportunity to increase diversification.
Balance: $187M
Unfunded Commitments: $236M
% of Balances: 31%
% of Unfunded Commitments: 40%
Avg. Loan Size: $276K
Largest Dollar Loan: $5.3M
3/31/17 Balances and Commitments totaling $611 million
Loan Characteristics
Construction Lending Types
Custom Home
Construction
Multifamily Commercial Residential
Construction
Land & Lots
•12 Month Term
•Consumer Owner Occupied
•Borrower Underwritten
similar to Single Family
Balance: $134M
Unfunded Commitments: $117M
% of Balances: 22%
% of Unfunded Commitments: 20%
Avg. Loan Size: $443K
Largest Dollar Loan: $2.0M
Geographical Distribution (balances)
Balance: $201M
Unfunded Commitments: $201M
% of Balances: 33%
% of Unfunded Commitments: 34%
Avg. Loan Size: $3.5M
Largest Dollar Loan: $25.4M
Balance: $22M
Unfunded Commitments: $24M
% of Balances: 4%
% of Unfunded Commitments: 4%
Avg. Loan Size: $14.5M
Largest Dollar Loan: $17.6M
Balance: $67M
Unfunded Commitments: $14M
% of Balances: 11%
% of Commitments: 2%
Avg. Loan Size: $662K
Largest Dollar Loan: $3.7M
Seattle Metro Puget Sound Other WA Other Portland Metro OR Other Hawaii California Utah Idaho
•18-36 Month Term
•≤ 80% LTC
•Minimum 15% Cash Equity
•≥ 1.15 DSC
•Portfolio LTV ~ 62%
•18-36 Month Term
•≤ 80% LTC
•Minimum 15% Cash Equity
•≥ 1.25 DSC
•≥ 50% pre-leased office/retail
•Portfolio LTV ~75%
•12-18 Month Term
• LTC: ≤ 95% Presale & Spec
•Leverage, Liquid. & Net Worth
Covenants as appropriate
•Portfolio LTV ~ 65%
•12-24 Month Term
•≤ 50% -80% LTC
• Strong, experienced,
vertically integrated builders
•Portfolio LTV ~ 64%
Credit Quality
21
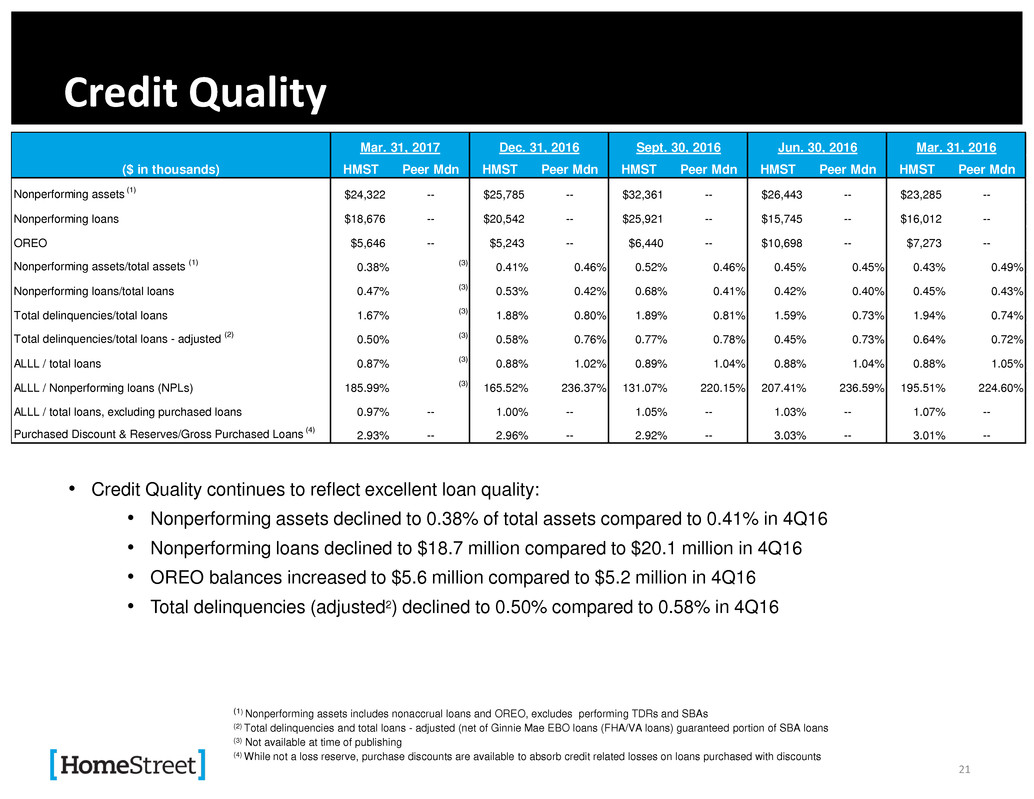
• Credit Quality continues to reflect excellent loan quality:
• Nonperforming assets declined to 0.38% of total assets compared to 0.41% in 4Q16
• Nonperforming loans declined to $18.7 million compared to $20.1 million in 4Q16
• OREO balances increased to $5.6 million compared to $5.2 million in 4Q16
• Total delinquencies (adjusted2) declined to 0.50% compared to 0.58% in 4Q16
(1) Nonperforming assets includes nonaccrual loans and OREO, excludes performing TDRs and SBAs
(2) Total delinquencies and total loans - adjusted (net of Ginnie Mae EBO loans (FHA/VA loans) guaranteed portion of SBA loans
(3) Not available at time of publishing
(4) While not a loss reserve, purchase discounts are available to absorb credit related losses on loans purchased with discounts
($ in thousands) HMST Peer Mdn HMST Peer Mdn HMST Peer Mdn HMST Peer Mdn HMST Peer Mdn
Nonperforming assets
(1)
$24,322 -- $25,785 -- $32,361 -- $26,443 -- $23,285 --
Nonperforming loans $18,676 -- $20,542 -- $25,921 -- $15,745 -- $16,012 --
OREO $5,646 -- $5,243 -- $6,440 -- $10,698 -- $7,273 --
Nonperforming assets/total assets
(1)
0.38%
(3)
0.41% 0.46% 0.52% 0.46% 0.45% 0.45% 0.43% 0.49%
Nonperforming loans/total loans 0.47%
(3)
0.53% 0.42% 0.68% 0.41% 0.42% 0.40% 0.45% 0.43%
Total delinquencies/total loans 1.67%
(3)
1.88% 0.80% 1.89% 0.81% 1.59% 0.73% 1.94% 0.74%
Total delinquencies/total loans - adjusted
(2)
0.50%
(3)
0.58% 0.76% 0.77% 0.78% 0.45% 0.73% 0.64% 0.72%
ALLL / total loans 0.87%
(3)
0.88% 1.02% 0.89% 1.04% 0.88% 1.04% 0.88% 1.05%
ALLL / Nonperforming loans (NPLs) 185.99%
(3)
165.52% 236.37% 131.07% 220.15% 207.41% 236.59% 195.51% 224.60%
ALLL / total loans, excluding purchased loans 0.97% -- 1.00% -- 1.05% -- 1.03% -- 1.07% --
Purchased Discount & Reserves/Gross Purchased Loans
(4)
2.93% -- 2.96% -- 2.92% -- 3.03% -- 3.01% --
Mar. 31, 2017 Dec. 31, 2016 Sept. 30, 2016 Jun. 30, 2016 Mar. 31, 2016
Deposits
22
Total Cost of Deposits
11% 10% 13% 10% 9%
24% 27%
24%
25% 26%
53%
52%
51% 54% 52%
12%
12%
11% 12%
13%
$3,823
$4,239
$4,504 $4,430
$4,596
$-
$500
$1,000
$1,500
$2,000
$2,500
$3,000
$3,500
$4,000
$4,500
$5,000
3/31/2016 6/30/2016 9/30/2016 12/31/2016 3/31/2017
Bala
nce
s (in
mil
lion
s)
Noninterest-Bearing Transaction &
Savings Deposits
Interest-Bearing Transaction &
Savings Deposits
Time Deposits
Mortgage Svcg. Escrow Accts. &
Other
Total Cost of Deposits 0.42% 0.46% 0.50% 0.51% 0.52%
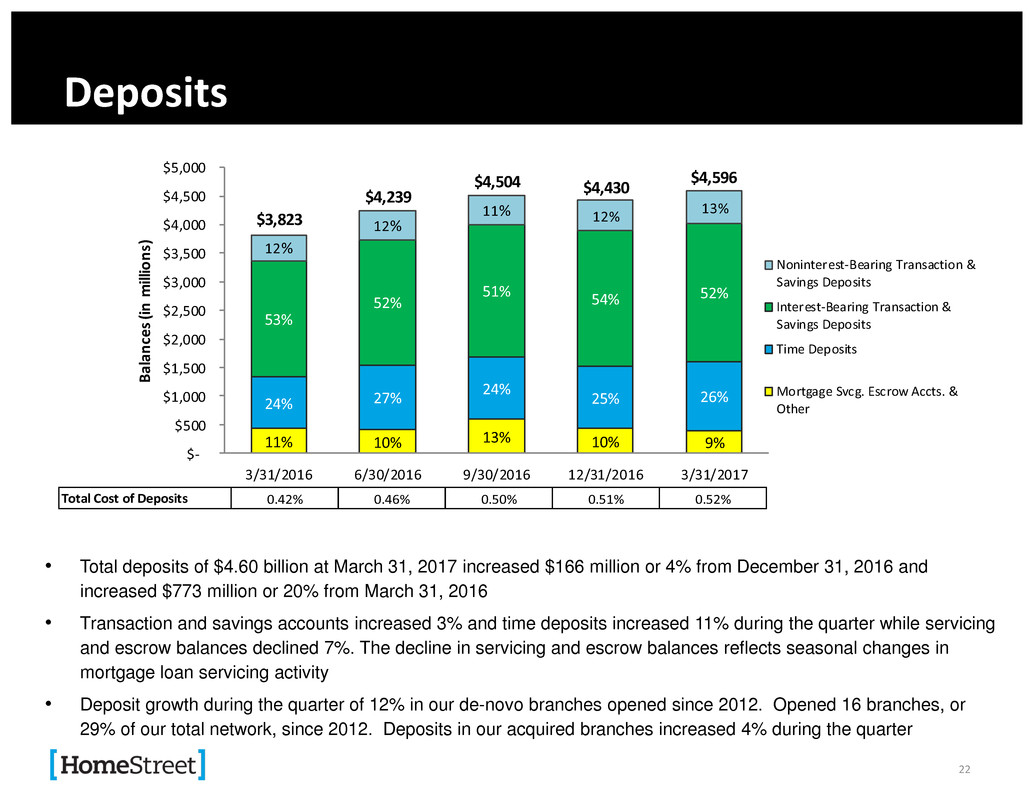
• Total deposits of $4.60 billion at March 31, 2017 increased $166 million or 4% from December 31, 2016 and
increased $773 million or 20% from March 31, 2016
• Transaction and savings accounts increased 3% and time deposits increased 11% during the quarter while servicing
and escrow balances declined 7%. The decline in servicing and escrow balances reflects seasonal changes in
mortgage loan servicing activity
• Deposit growth during the quarter of 12% in our de-novo branches opened since 2012. Opened 16 branches, or
29% of our total network, since 2012. Deposits in our acquired branches increased 4% during the quarter
Mortgage Banking
23
Mortgage Banking Segment – Quarter Trend
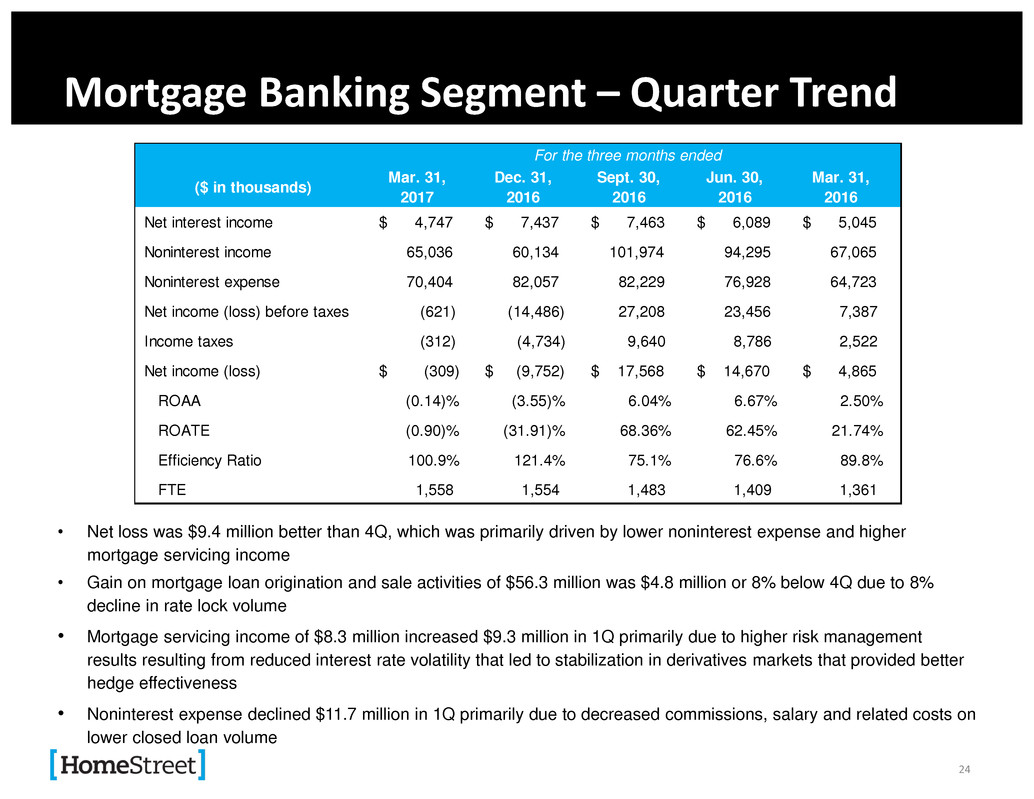
• Net loss was $9.4 million better than 4Q, which was primarily driven by lower noninterest expense and higher
mortgage servicing income
• Gain on mortgage loan origination and sale activities of $56.3 million was $4.8 million or 8% below 4Q due to 8%
decline in rate lock volume
• Mortgage servicing income of $8.3 million increased $9.3 million in 1Q primarily due to higher risk management
results resulting from reduced interest rate volatility that led to stabilization in derivatives markets that provided better
hedge effectiveness
• Noninterest expense declined $11.7 million in 1Q primarily due to decreased commissions, salary and related costs on
lower closed loan volume
24
($ in thousands)
Mar. 31,
2017
Dec. 31,
2016
Sept. 30,
2016
Jun. 30,
2016
Mar. 31,
2016
Net interest income $ 4,747 $ 7,437 $ 7,463 $ 6,089 $ 5,045
Noninterest income 65,036 60,134 101,974 94,295 67,065
Noninterest expense 70,404 82,057 82,229 76,928 64,723
Net income (loss) before taxes (621) (14,486) 27,208 23,456 7,387
Income taxes (312) (4,734) 9,640 8,786 2,522
Net income (loss) $ (309) $ (9,752) $ 17,568 $ 14,670 $ 4,865
ROAA (0.14)% (3.55)% 6.04% 6.67% 2.50%
ROATE (0.90)% (31.91)% 68.36% 62.45% 21.74%
Efficiency Ratio 100.9% 121.4% 75.1% 76.6% 89.8%
FTE 1,558 1,554 1,483 1,409 1,361
For the three months ended
Mortgage Origination
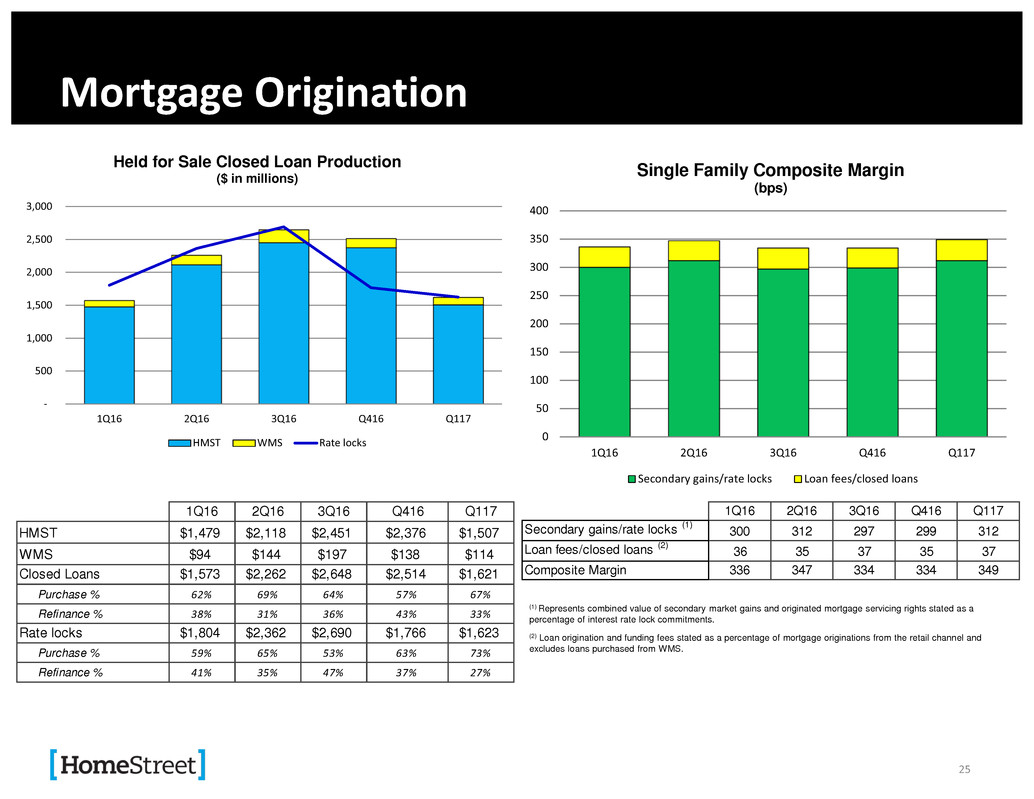
(1) Represents combined value of secondary market gains and originated mortgage servicing rights stated as a
percentage of interest rate lock commitments.
(2) Loan origination and funding fees stated as a percentage of mortgage originations from the retail channel and
excludes loans purchased from WMS.
25
-
500
1,000
1,500
2,000
2,500
3,000
1Q16 2Q16 3Q16 Q416 Q117
Held for Sale Closed Loan Production
($ in millions)
HMST WMS Rate locks
Bps
0
50
100
150
200
250
300
350
400
1Q16 2Q16 3Q16 Q416 Q117
Single Family Composite Margin
(bps)
Secondary gains/rate locks Loan fees/closed loans
1Q16 2Q16 3Q16 Q416 Q117
HMST $1,479 $2,118 $2,451 $2,376 $1,507
WMS $94 $144 $197 $138 $114
Closed Loans $1,573 $2,262 $2,648 $2,514 $1,621
Purchase % 62% 69% 64% 57% 67%
Refinance % 38% 31% 36% 43% 33%
Rate locks $1,804 $2,362 $2,690 $1,766 $1,623
Purchase % 59% 65% 53% 63% 73%
Refinance % 41% 35% 47% 37% 27%
1Q16 2Q16 3Q16 Q416 Q117
Secondary gains/rate locks (1) 300 312 297 299 312
Loan fees/closed loans (2) 36 35 7 35 37
Composite Margin 336 47 4 334 349
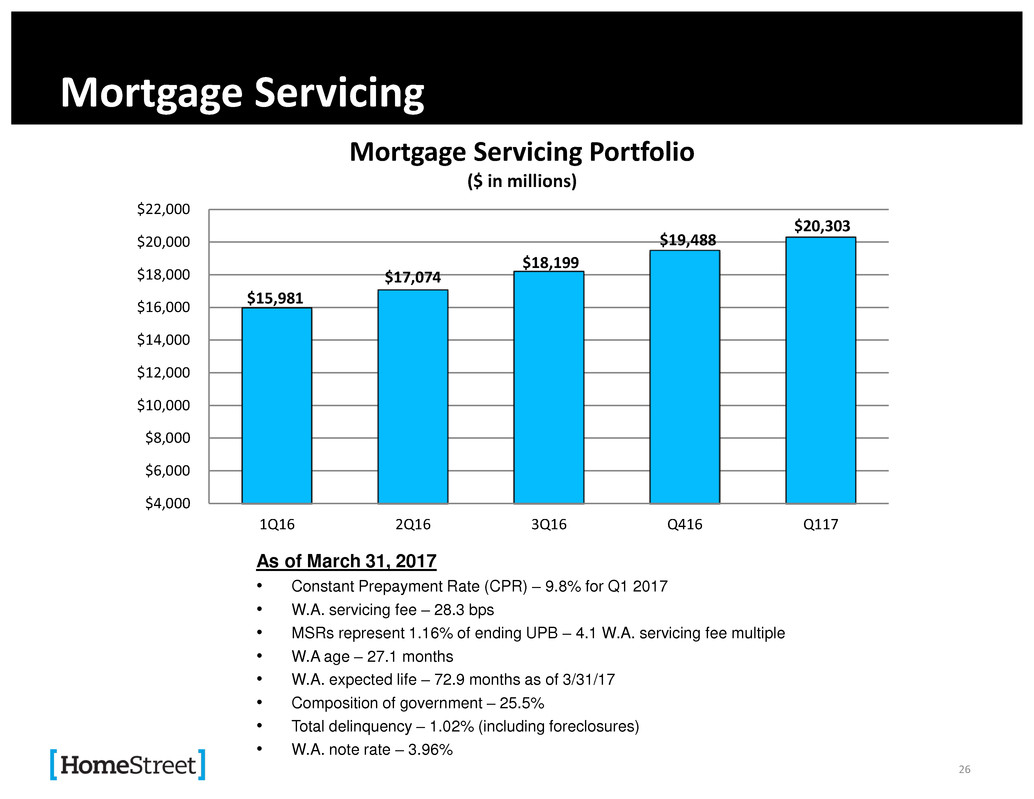
Mortgage Servicing
As of March 31, 2017
• Constant Prepayment Rate (CPR) – 9.8% for Q1 2017
• W.A. servicing fee – 28.3 bps
• MSRs represent 1.16% of ending UPB – 4.1 W.A. servicing fee multiple
• W.A age – 27.1 months
• W.A. expected life – 72.9 months as of 3/31/17
• Composition of government – 25.5%
• Total delinquency – 1.02% (including foreclosures)
• W.A. note rate – 3.96%
26
$15,981
$17,074
$18,199
$19,488
$20,303
$4,000
$6,000
$8,000
$10,000
$12,000
$14,000
$16,000
$18,000
$20,000
$22,000
1Q16 2Q16 3Q16 Q416 Q117
Mortgage Servicing Portfolio
($ in millions)
Mortgage Market & Competitive Landscape
27
Mortgage Market
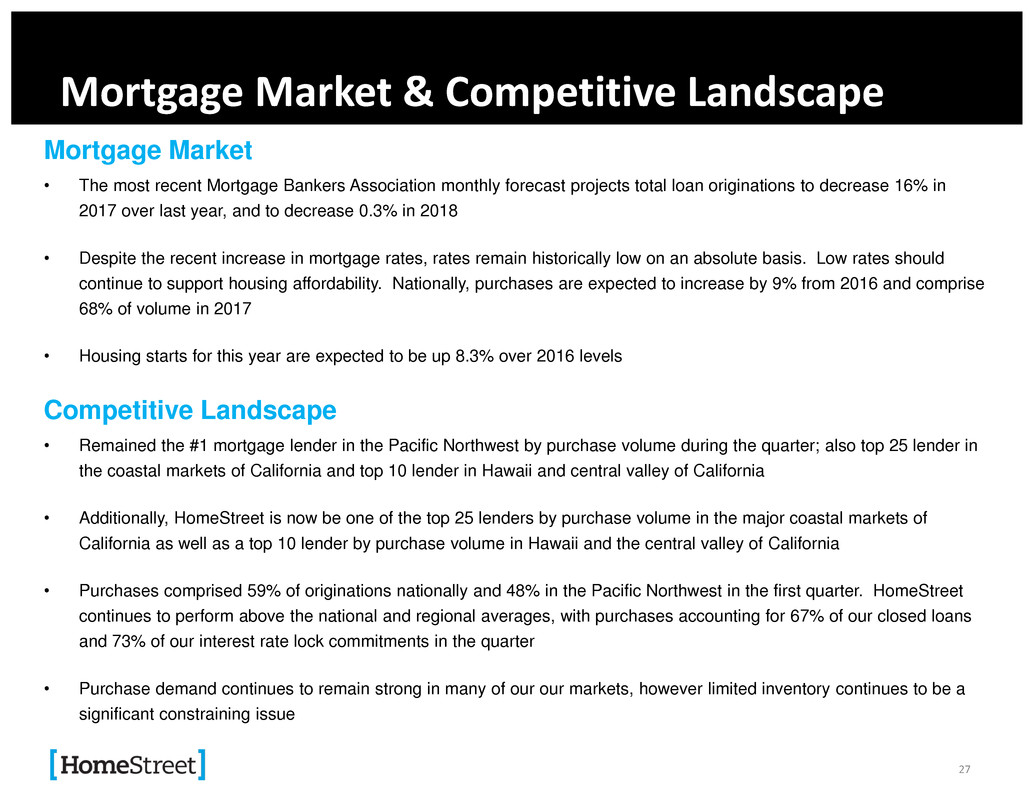
• The most recent Mortgage Bankers Association monthly forecast projects total loan originations to decrease 16% in
2017 over last year, and to decrease 0.3% in 2018
• Despite the recent increase in mortgage rates, rates remain historically low on an absolute basis. Low rates should
continue to support housing affordability. Nationally, purchases are expected to increase by 9% from 2016 and comprise
68% of volume in 2017
• Housing starts for this year are expected to be up 8.3% over 2016 levels
Competitive Landscape
• Remained the #1 mortgage lender in the Pacific Northwest by purchase volume during the quarter; also top 25 lender in
the coastal markets of California and top 10 lender in Hawaii and central valley of California
• Additionally, HomeStreet is now be one of the top 25 lenders by purchase volume in the major coastal markets of
California as well as a top 10 lender by purchase volume in Hawaii and the central valley of California
• Purchases comprised 59% of originations nationally and 48% in the Pacific Northwest in the first quarter. HomeStreet
continues to perform above the national and regional averages, with purchases accounting for 67% of our closed loans
and 73% of our interest rate lock commitments in the quarter
• Purchase demand continues to remain strong in many of our our markets, however limited inventory continues to be a
significant constraining issue
Key Drivers Guidance
28
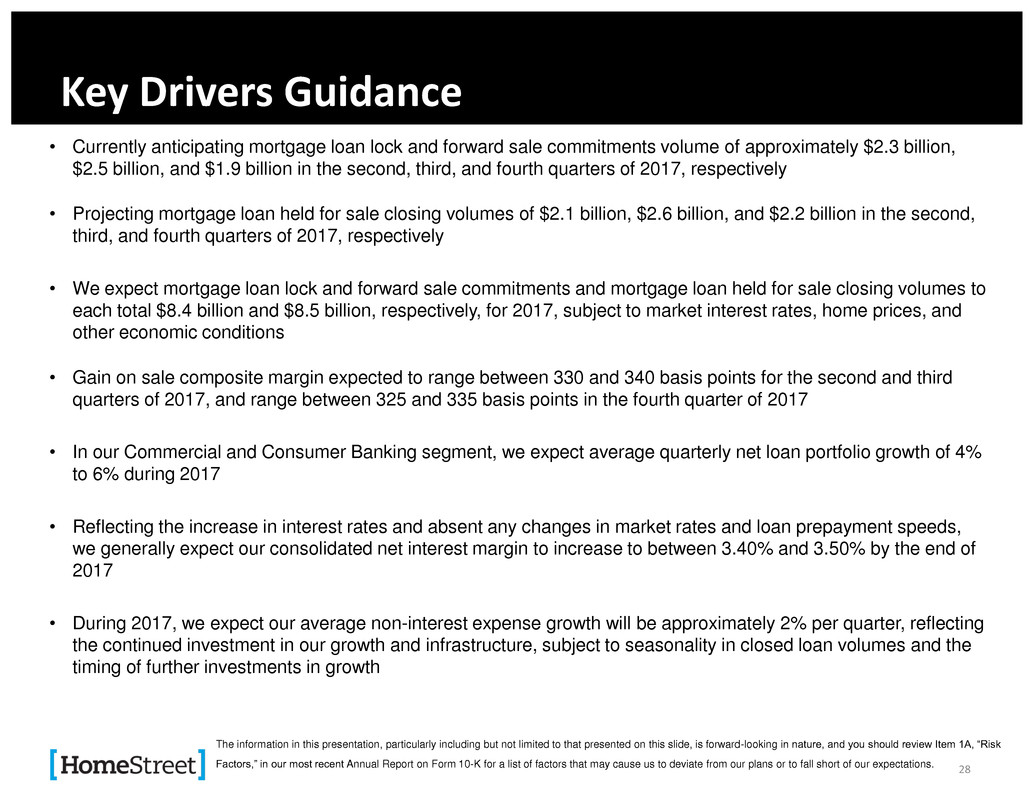
• Currently anticipating mortgage loan lock and forward sale commitments volume of approximately $2.3 billion,
$2.5 billion, and $1.9 billion in the second, third, and fourth quarters of 2017, respectively
• Projecting mortgage loan held for sale closing volumes of $2.1 billion, $2.6 billion, and $2.2 billion in the second,
third, and fourth quarters of 2017, respectively
• We expect mortgage loan lock and forward sale commitments and mortgage loan held for sale closing volumes to
each total $8.4 billion and $8.5 billion, respectively, for 2017, subject to market interest rates, home prices, and
other economic conditions
• Gain on sale composite margin expected to range between 330 and 340 basis points for the second and third
quarters of 2017, and range between 325 and 335 basis points in the fourth quarter of 2017
• In our Commercial and Consumer Banking segment, we expect average quarterly net loan portfolio growth of 4%
to 6% during 2017
• Reflecting the increase in interest rates and absent any changes in market rates and loan prepayment speeds,
we generally expect our consolidated net interest margin to increase to between 3.40% and 3.50% by the end of
2017
• During 2017, we expect our average non-interest expense growth will be approximately 2% per quarter, reflecting
the continued investment in our growth and infrastructure, subject to seasonality in closed loan volumes and the
timing of further investments in growth
The information in this presentation, particularly including but not limited to that presented on this slide, is forward-looking in nature, and you should review Item 1A, “Risk
Factors,” in our most recent Annual Report on Form 10-K for a list of factors that may cause us to deviate from our plans or to fall short of our expectations.
.
Appendix
29
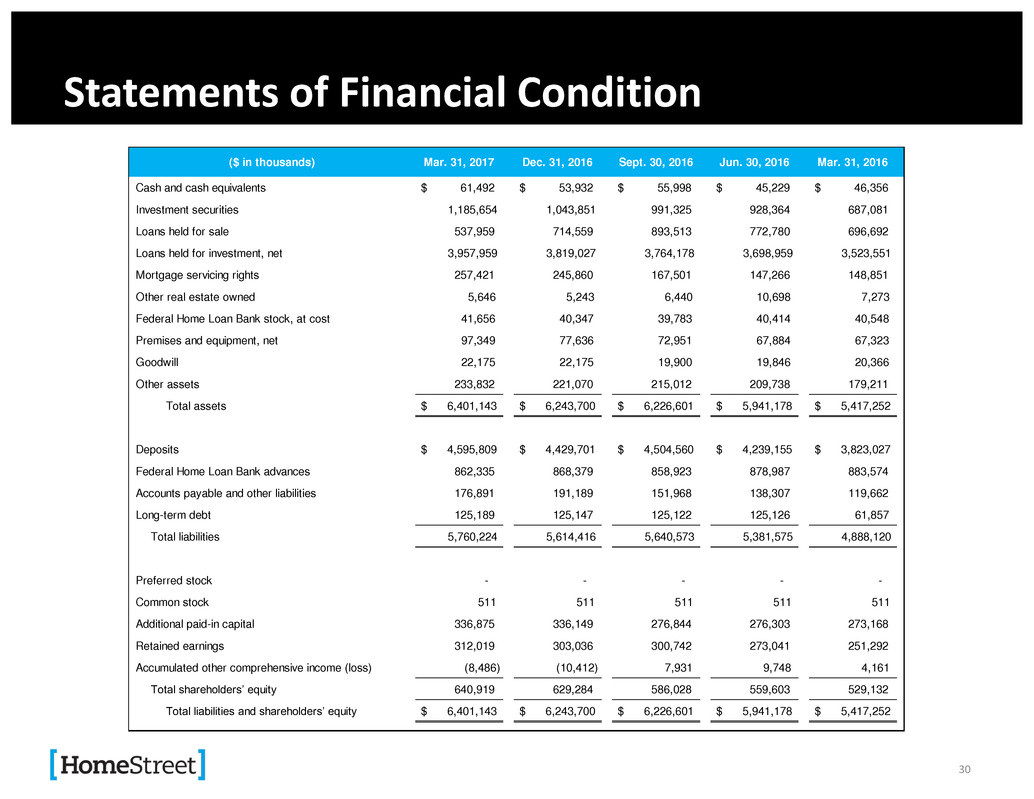
Statements of Financial Condition
30
($ in thousands) Mar. 31, 2017 Dec. 31, 2016 Sept. 30, 2016 Jun. 30, 2016 Mar. 31, 2016
Cash and cash equivalents $ 61,492 $ 53,932 $ 55,998 $ 45,229 $ 46,356
Investment securities 1,185,654 1,043,851 991,325 928,364 687,081
Loans held for sale 537,959 714,559 893,513 772,780 696,692
Loans held for investment, net 3,957,959 3,819,027 3,764,178 3,698,959 3,523,551
Mortgage servicing rights 257,421 245,860 167,501 147,266 148,851
Other real estate owned 5,646 5,243 6,440 10,698 7,273
Federal Home Loan Bank stock, at cost 41,656 40,347 39,783 40,414 40,548
Premises and equipment, net 97,349 77,636 72,951 67,884 67,323
Goodwill 22,175 22,175 19,900 19,846 20,366
Other assets 233,832 221,070 215,012 209,738 179,211
Total assets $ 6,401,143 $ 6,243,700 $ 6,226,601 $ 5,941,178 $ 5,417,252
Deposits $ 4,595,809 $ 4,429,701 $ 4,504,560 $ 4,239,155 $ 3,823,027
Federal Home Loan Bank advances 862,335 868,379 858,923 878,987 883,574
Accounts payable and other liabilities 176,891 191,189 151,968 138,307 119,662
Long-term debt 125,189 125,147 125,122 125,126 61,857
Total liabilities 5,760,224 5,614,416 5,640,573 5,381,575 4,888,120
Preferred stock - - - - -
Common stock 511 511 511 511 511
Additional paid-in capital 336,875 336,149 276,844 276,303 273,168
Retained earnings 312,019 303,036 300,742 273,041 251,292
Accumulated other comprehensive income (loss) (8,486) (10,412) 7,931 9,748 4,161
Total shareholders’ equity 640,919 629,284 586,028 559,603 529,132
Total liabilities and shareholders’ equity $ 6,401,143 $ 6,243,700 $ 6,226,601 $ 5,941,178 $ 5,417,252
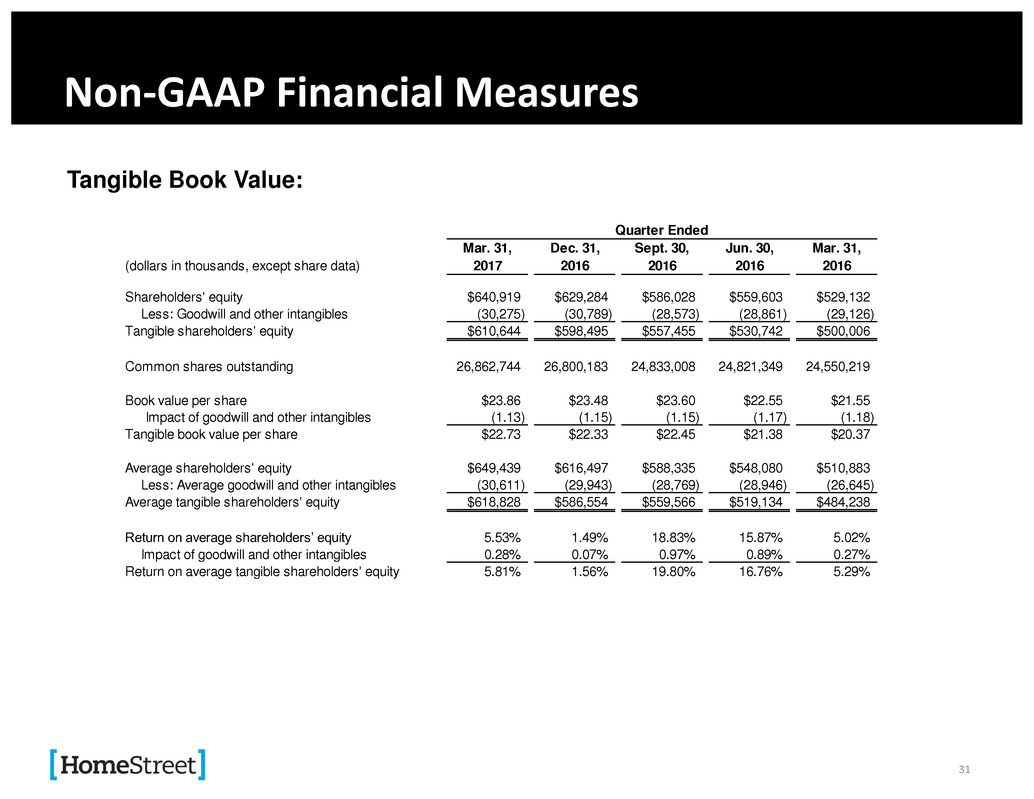
Non-GAAP Financial Measures
Tangible Book Value:
31
Mar. 31, Dec. 31, Sept. 30, Jun. 30, Mar. 31,
(dollars in thousands, except share data) 2017 2016 2016 2016 2016
Shareholders' equity $640,919 $629,284 $586,028 $559,603 $529,132
Less: Goodwill and other intangibles (30,275) (30,789) (28,573) (28,861) (29,126)
Tangible shareholders' equity $610,644 $598,495 $557,455 $530,742 $500,006
Common shares outstanding 26,862,744 26,800,183 24,833,008 24,821,349 24,550,219
Book value per share $23.86 $23.48 $23.60 $22.55 $21.55
Impact of goodwill and other intangibles (1.13) (1.15) (1.15) (1.17) (1.18)
Tangible book value per share $22.73 $22.33 $22.45 $21.38 $20.37
Average shareholders' equity $649,439 $616,497 $588,335 $548,080 $510,883
Less: Average goodwill and other intangibles (30,611) (29,943) (28,769) (28,946) (26,645)
Average tangible shareholders' equity $618,828 $586,554 $559,566 $519,134 $484,238
Return on average shareholders’ equity 5.53% 1.49% 18.83% 15.87% 5.02%
Impact of goodwill and other intangibles 0.28% 0.07% 0.97% 0.89% 0.27%
Return on average tangible shareholders' equity 5.81% 1.56% 19.80% 16.76% 5.29%
Quarter Ended
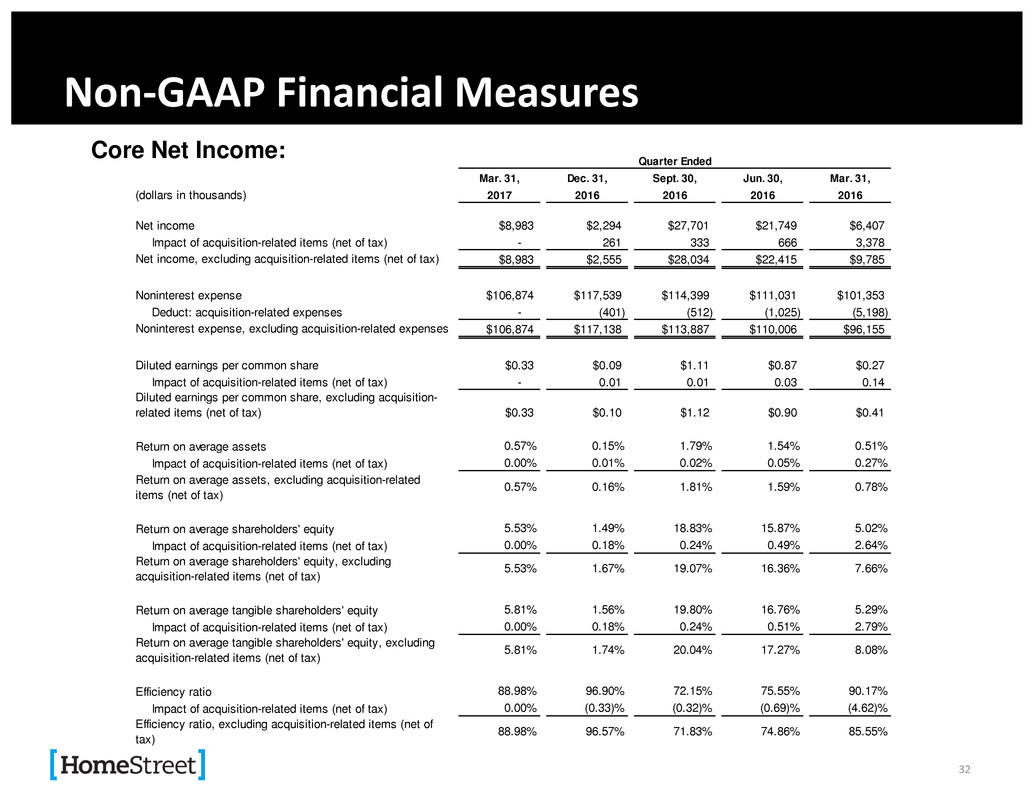
Non-GAAP Financial Measures
Core Net Income:
32
Mar. 31, Dec. 31, Sept. 30, Jun. 30, Mar. 31,
(dollars in thousands) 2017 2016 2016 2016 2016
Net income $8,983 $2,294 $27,701 $21,749 $6,407
Impact of acquisition-related items (net of tax) - 261 333 666 3,378
Net income, excluding acquisition-related items (net of tax) $8,983 $2,555 $28,034 $22,415 $9,785
Noninterest expense $106,874 $117,539 $114,399 $111,031 $101,353
Deduct: acquisition-related expenses - (401) (512) (1,025) (5,198)
Noninterest expense, excluding acquisition-related expenses $106,874 $117,138 $113,887 $110,006 $96,155
Diluted earnings per common share $0.33 $0.09 $1.11 $0.87 $0.27
Impact of acquisition-related items (net of tax) - 0.01 0.01 0.03 0.14
Diluted earnings per common share, excluding acquisition-
related items (net of tax) $0.33 $0.10 $1.12 $0.90 $0.41
Return on average assets 0.57% 0.15% 1.79% 1.54% 0.51%
Impact of acquisition-related items (net of tax) 0.00% 0.01% 0.02% 0.05% 0.27%
Return on average assets, excluding acquisition-related
items (net of tax)
0.57% 0.16% 1.81% 1.59% 0.78%
Return on average shareholders' equity 5.53% 1.49% 18.83% 15.87% 5.02%
Impact of acquisition-related items (net of tax) 0.00% 0.18% 0.24% 0.49% 2.64%
Return on average shareholders' equity, excluding
acquisition-related items (net of tax)
5.53% 1.67% 19.07% 16.36% 7.66%
Return on average tangible shareholders' equity 5.81% 1.56% 19.80% 16.76% 5.29%
Impact of acquisition-related items (net of tax) 0.00% 0.18% 0.24% 0.51% 2.79%
Return on average tangible shareholders' equity, excluding
acquisition-related items (net of tax)
5.81% 1.74% 20.04% 17.27% 8.08%
Efficiency ratio 88.98% 96.90% 72.15% 75.55% 90.17%
Impact of acquisition-related items (net of tax) 0.00% (0.33)% (0.32)% (0.69)% (4.62)%
Efficiency ratio, excluding acquisition-related items (net of
tax)
88.98% 96.57% 71.83% 74.86% 85.55%
Quarter Ended
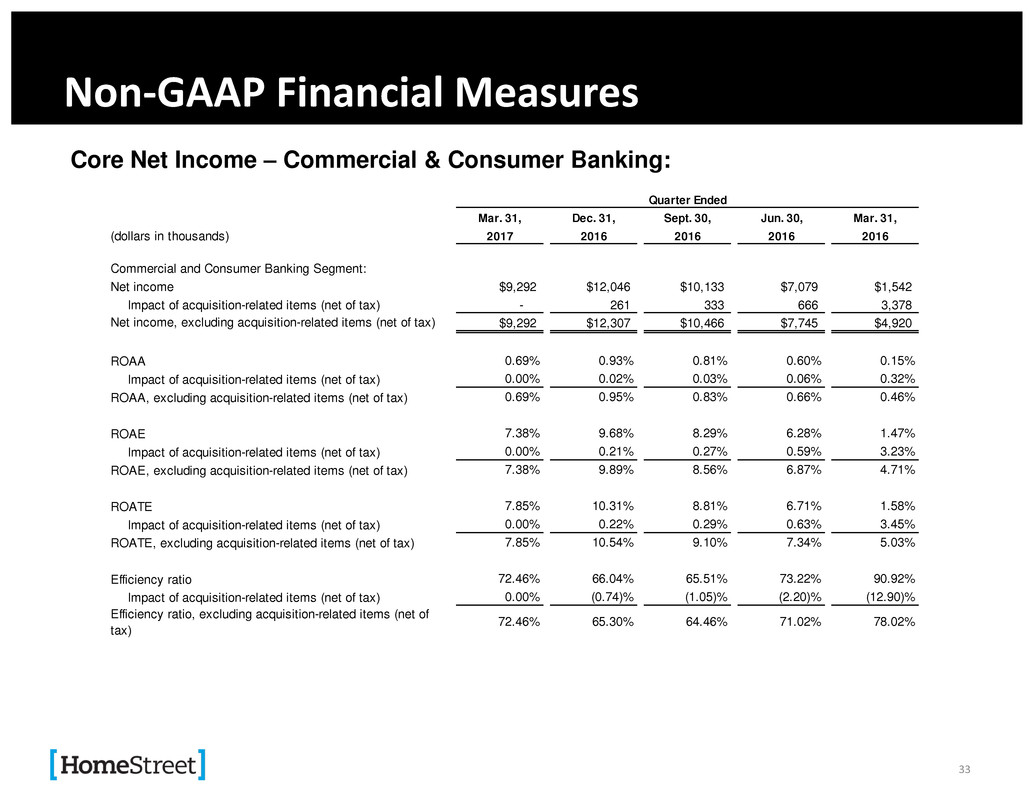
Non-GAAP Financial Measures
Core Net Income – Commercial & Consumer Banking:
33
Mar. 31, Dec. 31, Sept. 30, Jun. 30, Mar. 31,
(dollars in thousands) 2017 2016 2016 2016 2016
Commercial and Consumer Banking Segment:
Net income $9,292 $12,046 $10,133 $7,079 $1,542
Impact of acquisition-related items (net of tax) - 261 333 666 3,378
Net income, excluding acquisition-related items (net of tax) $9,292 $12,307 $10,466 $7,745 $4,920
ROAA 0.69% 0.93% 0.81% 0.60% 0.15%
Impact of acquisition-related items (net of tax) 0.00% 0.02% 0.03% 0.06% 0.32%
ROAA, excluding acquisition-related items (net of tax) 0.69% 0.95% 0.83% 0.66% 0.46%
ROAE 7.38% 9.68% 8.29% 6.28% 1.47%
Impact of acquisition-related items (net of tax) 0.00% 0.21% 0.27% 0.59% 3.23%
ROAE, excluding acquisition-related items (net of tax) 7.38% 9.89% 8.56% 6.87% 4.71%
ROATE 7.85% 10.31% 8.81% 6.71% 1.58%
Impact of acquisition-related items (net of tax) 0.00% 0.22% 0.29% 0.63% 3.45%
ROATE, excluding acquisition-related items (net of tax) 7.85% 10.54% 9.10% 7.34% 5.03%
Efficiency ratio 72.46% 66.04% 65.51% 73.22% 90.92%
Impact of acquisition-related items (net of tax) 0.00% (0.74)% (1.05)% (2.20)% (12.90)%
Efficiency ratio, excluding acquisition-related items (net of
tax)
72.46% 65.30% 64.46% 71.02% 78.02%
Quarter Ended
