Attached files
| file | filename |
|---|---|
| EX-99.1 - EXHIBIT 99.1 - FB Financial Corp | a51554166ex99_1.htm |
| 8-K - FB FINANCIAL CORPORATION 8-K - FB Financial Corp | a51554166.htm |
Exhibit 99.2

Second Quarter 2017 Investor Presentation
This investor presentation contains “forward-looking statements” made pursuant to the safe harbor provisions of the Private Securities Litigation Reform Act of 1995. All statements other than statements of historical fact are forward-looking statements. You can identify these forward-looking statements through the Company’s use of words such as “believes,” “anticipates,” “expects,” “may,” “will,” “assumes,” “should,” “predicts,” “could,” “would,” “intends,” “targets,” “estimates,” “projects,” “plans,” “potential” and other similar words and expressions of the future or otherwise regarding the outlook for the Company’s future business and financial performance and/or the performance of the banking and mortgage industry and economy in general and the Company’s proposed acquisition of the Clayton Banks and the anticipated timing, benefits, cost, and financial impact thereof. Investors are cautioned that any such forward-looking statements are not guarantees of future performance and involve known and unknown risks and uncertainties which may cause the actual results, performance or achievements of the Company to be materially different from the future results, performance or achievements expressed or implied by such forward-looking statements. Forward-looking statements are based on the information known to, and current beliefs and expectations of, the Company’s management and are subject to significant risks and uncertainties. Actual results may differ materially from those contemplated by such forward-looking statements. A number of factors could cause actual results to differ materially from those contemplated by the forward-looking statements in this news release including, without limitation, the risks and other factors set forth in the Company’s December 31, 2016 Form 10-K, filed with the SEC on March 31, 2017 under the captions “Cautionary note regarding forward-looking statements” and “Risk factors.” Many of these factors are beyond the Company’s ability to control or predict. The Company believes the forward-looking statements contained herein are reasonable; however, undue reliance should not be placed on any forward-looking statements, which are based on current expectations and speak only as of the date that they are made. The Company does not assume any obligation to update any forward-looking statements as a result of new information, future developments or otherwise, except as otherwise may be required by law. Forward looking statements

Additional Information and Participants in the Solicitation This investor presentation is for informational purposes only and does not constitute a solicitation of any vote or approval with respect to the Company’s proposed acquisition of the Clayton Banks. The issuance of the shares of the Company’s common stock in connection with the proposed acquisition of the Clayton Banks by the Company will be submitted to the shareholders of the Company for their consideration as required. The Company will file with the SEC a proxy statement and deliver the proxy statement to its shareholders as required by applicable law. The Company may also file other documents with the SEC regarding the proposed acquisition. This investor presentation is not a substitute for any proxy statement or any other document which the Company may file with the SEC in connection with the proposed acquisition. INVESTORS AND SECURITY HOLDERS OF THE COMPANY ARE URGED TO READ THE PROXY STATEMENT AND ANY OTHER RELEVANT DOCUMENTS THAT WILL BE FILED WITH THE SEC CAREFULLY AND IN THEIR ENTIRETY WHEN THEY BECOME AVAILABLE BECAUSE THEY WILL CONTAIN IMPORTANT INFORMATION ABOUT THE COMPANY, THE PROPOSED ACQUISITION AND RELATED MATTERS. Investors and shareholders will be able to obtain free copies of the proxy statement and other documents containing important information about the Company and the proposed acquisition, once such documents are filed with the SEC, through the website maintained by the SEC at www.sec.gov. The Company makes available free of charge at www.firstbankonline.com (in the “Investor Relations” section of such website) copies of the materials it files with, or furnishes to, the SEC. The Company and certain of its directors, executive officers and other members of management and employees may be deemed to be participants in the solicitation of proxies from the shareholders of the Company in connection with the proposed acquisition. Information about the directors and executive officers of the Company is set forth in in the Company’s proxy statement for its 2017 annual meeting of shareholders, which was filed with the U.S. Securities and Exchange Commission on April 28, 2017. Such proxy statement can be obtained free of charge from the sources indicated above. Other information regarding those persons who are, under the rules of the SEC, participants in the proxy solicitation and a description of their direct and indirect interests, by security holdings or otherwise, will be contained in the proxy statement and other relevant materials to be filed with the SEC when they become available.
Use of non-GAAP financial measures This presentation contains certain financial measures that are not measures recognized under U.S. generally accepted accounting principles (GAAP) and therefore are considered non-GAAP financial measures. The Company’s management uses these non-GAAP financial measures in their analysis of the Company’s performance, financial condition and the efficiency of its operations. Management believes that these non-GAAP financial measures provide a greater understanding of ongoing operations and enhance comparability of results with prior periods as well as demonstrating the effects of significant gains and charges in the current period. The Company’s management also believes that investors find these non-GAAP financial measures useful as they assist investors in understanding our underlying operating performance and the analysis of ongoing operating trends. However, the non-GAAP financial measures discussed herein should not be considered in isolation or as a substitute for the most directly comparable or other financial measures calculated in accordance with GAAP. Moreover, the manner in which we calculate the non-GAAP financial measures discussed herein may differ from that of other companies reporting measures with similar names. You should understand how such other banking organizations calculate their financial measures similar or with names similar to the non-GAAP financial measures we have discussed herein when comparing such non-GAAP financial measures. Below is a listing of the non-GAAP financial measures used in this presentation. Core net income, core diluted earning per share, the core efficiency ratio, and core return on average assets and equity are non-GAAP measures that excludes securities gains (losses), merger-related and conversion expenses, one time IPO equity grants and other selected items. The Company’s management uses this measure in their analysis of the Company’s performance. The Company’s management believes this measure provides a greater understanding of ongoing operations and enhances comparability of results with prior periods, as well as demonstrates the effects of significant gains and charges. The most directly comparable financial measure calculated in accordance with GAAP is the efficiency ratio. Tangible book value per common share and tangible common equity to tangible assets are non-GAAP measures that exclude the impact of goodwill and other intangibles used by the Company’s management to evaluate capital adequacy. Because intangible assets such as goodwill and other intangibles vary extensively from company to company, we believe that the presentation of this information allows investors to more easily compare the Company’s capital position to other company companies. The most directly comparable financial measure calculated in accordance with GAAP is book value per common share and our total shareholder’s equity to total assets.Core deposits is a non-GAAP financial measure used by management and investors to evaluate organic growth of deposits and the quality of deposits as a funding source. We calculate core deposits by excluding jumbo time deposits (greater than $250,000) from total deposits. The most directly comparable financial measure calculated in accordance with GAAP is total deposits.A reconciliation of these non-GAAP financial measures to the most directly comparable GAAP measures are provided on the appendix to this presentation.
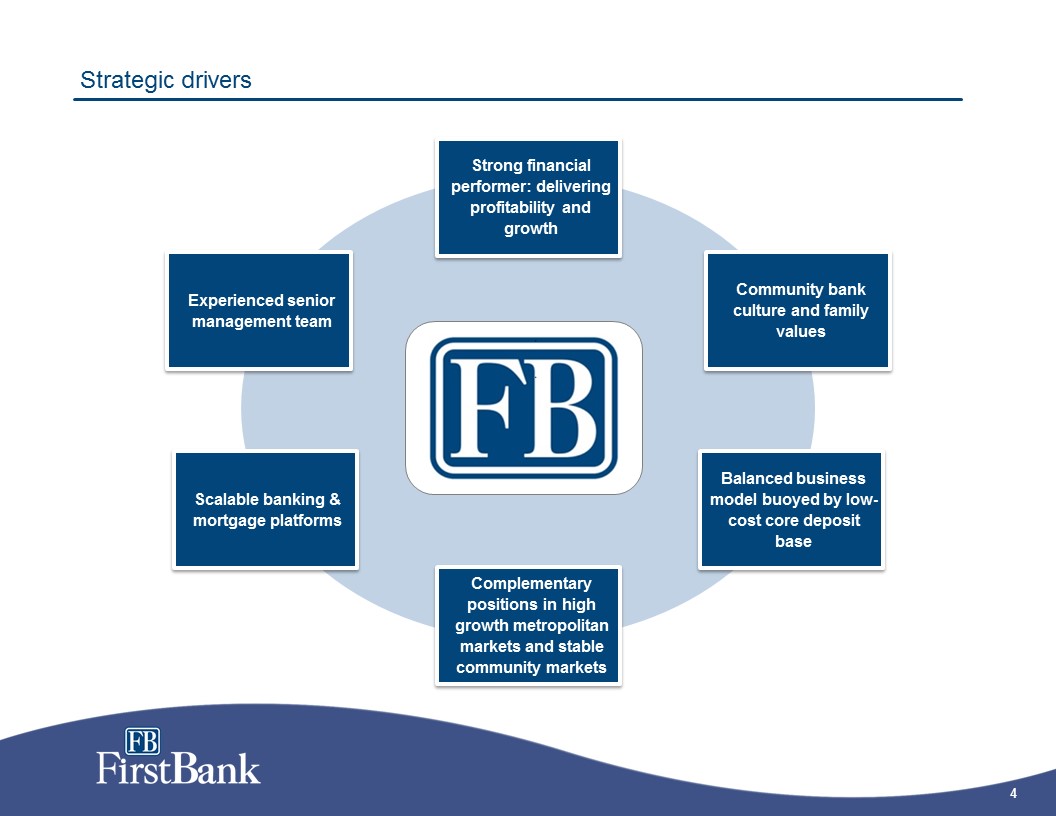
Strategic drivers Balanced business model buoyed by low-cost core deposit base Experienced senior management team Strong financial performer: delivering profitability and growth Community bank culture and family values Scalable banking & mortgage platforms Complementary positions in high growth metropolitan markets and stable community markets
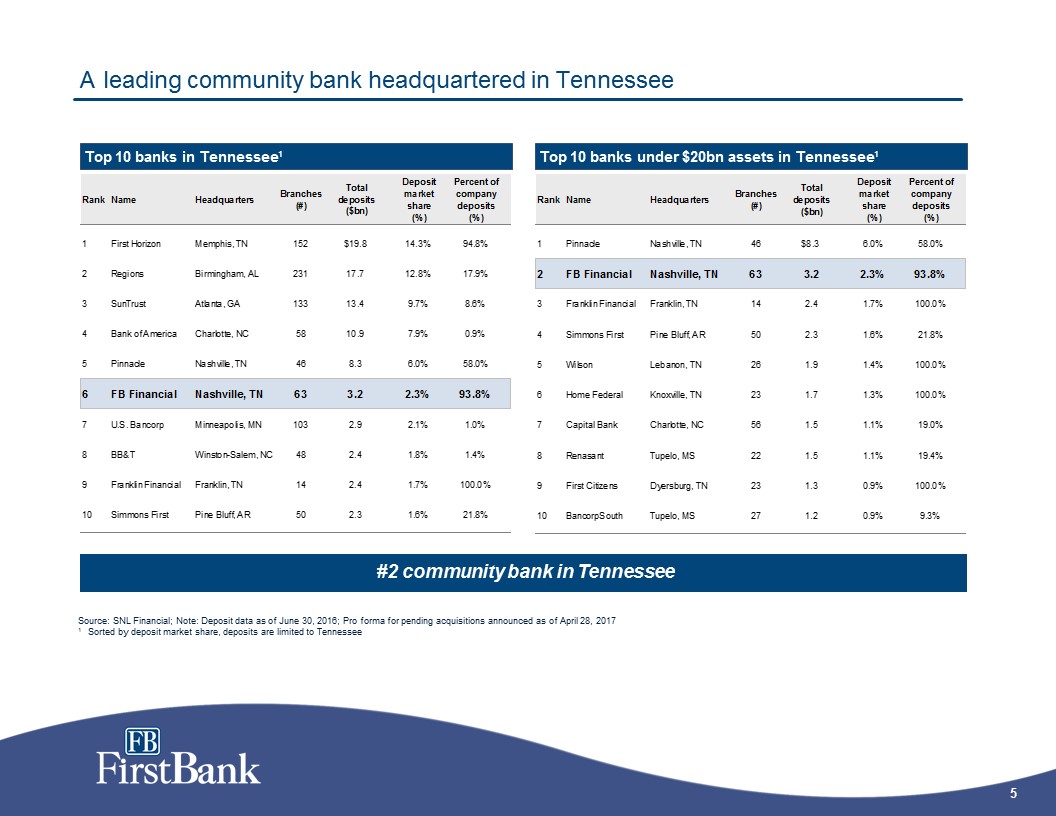
A leading community bank headquartered in Tennessee Top 10 banks in Tennessee¹ Top 10 banks under $20bn assets in Tennessee¹ Source: SNL Financial; Note: Deposit data as of June 30, 2016; Pro forma for pending acquisitions announced as of April 28, 20171 Sorted by deposit market share, deposits are limited to Tennessee #2 community bank in Tennessee
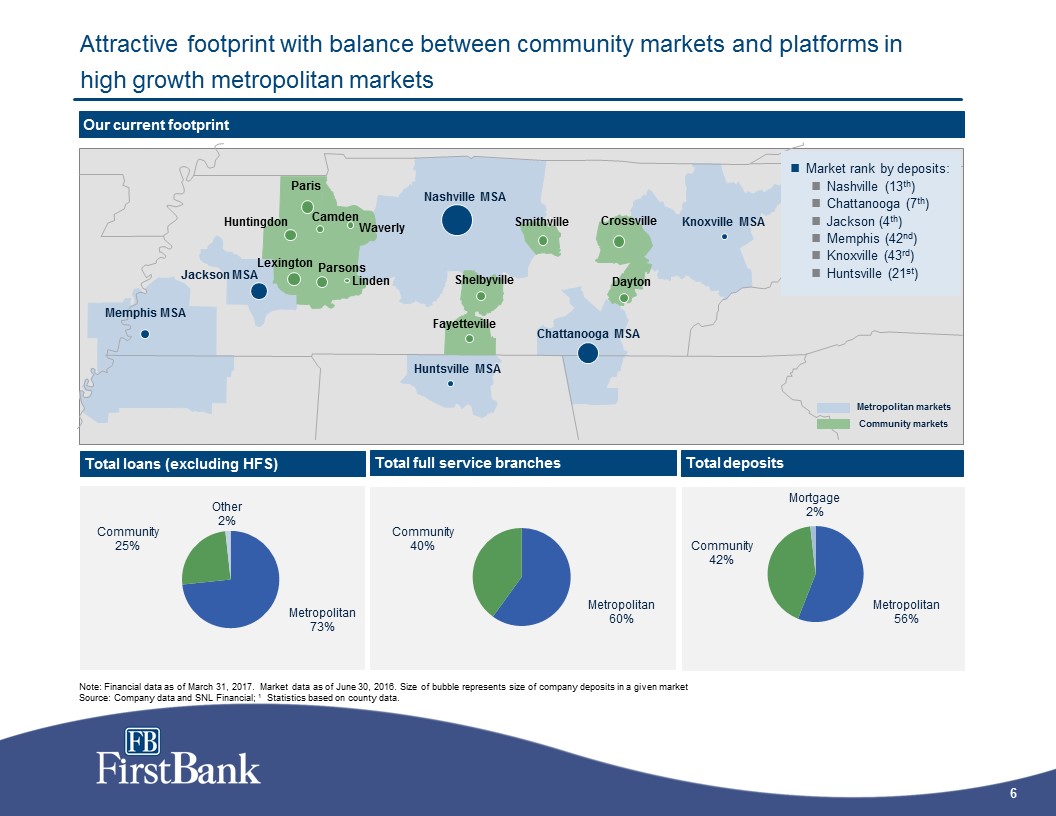
Attractive footprint with balance between community markets and platforms in high growth metropolitan markets 269123Blue dots 193210228Metro markets 130131135Highway 167169172State county outlines 8715487Green dots 148194148Community markets Source files are619754_FirstBank Bancorp.ai and mapinfo Note: Financial data as of March 31, 2017. Market data as of June 30, 2016. Size of bubble represents size of company deposits in a given marketSource: Company data and SNL Financial; 1 Statistics based on county data. Nashville MSA Knoxville MSA Chattanooga MSA Huntsville MSA Memphis MSA Jackson MSA Metropolitan marketsCommunity markets Our current footprint Total loans (excluding HFS) Total full service branches Total deposits Market rank by deposits: Nashville (13th)Chattanooga (7th) Jackson (4th) Memphis (42nd)Knoxville (43rd) Huntsville (21st) Paris Crossville Dayton Shelbyville Smithville Fayetteville Waverly Linden Parsons Camden Huntingdon Lexington
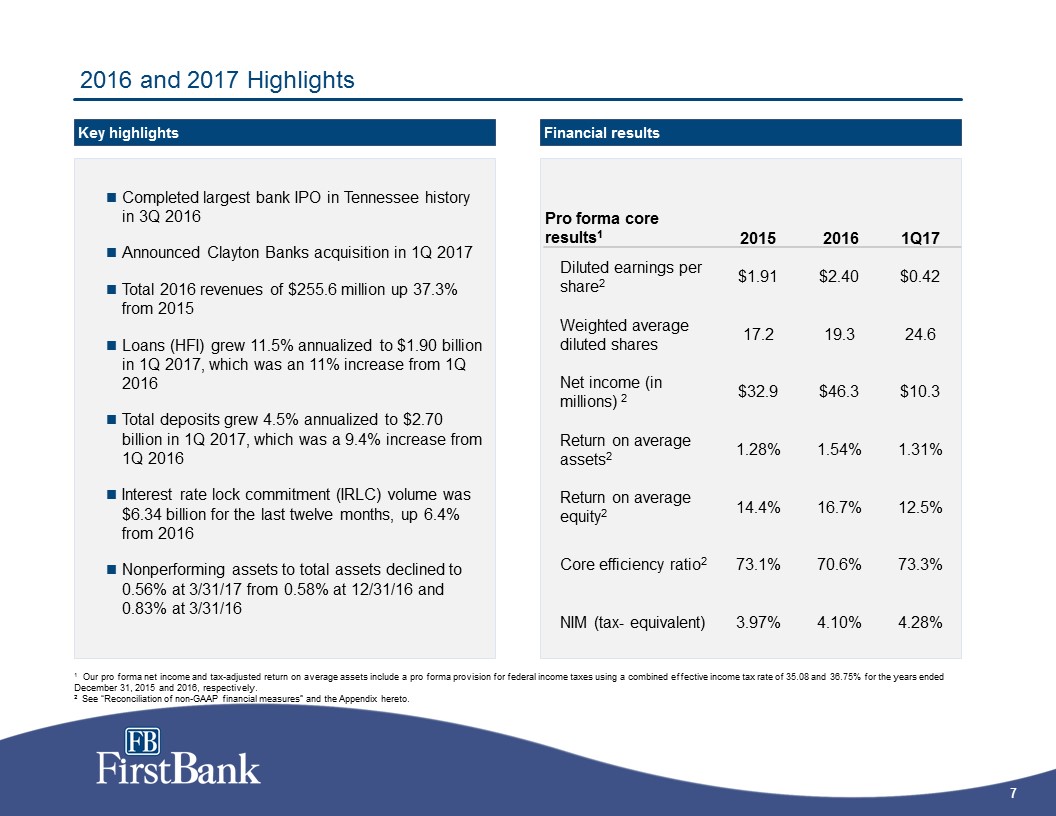
Pro forma core results1 2015 2016 1Q17 Diluted earnings per share2 $1.91 $2.40 $0.42 Weighted average diluted shares 17.2 19.3 24.6 Net income (in millions) 2 $32.9 $46.3 $10.3 Return on average assets2 1.28% 1.54% 1.31% Return on average equity2 14.4% 16.7% 12.5% Core efficiency ratio2 73.1% 70.6% 73.3% NIM (tax- equivalent) 3.97% 4.10% 4.28% 2016 and 2017 Highlights Completed largest bank IPO in Tennessee history in 3Q 2016Announced Clayton Banks acquisition in 1Q 2017Total 2016 revenues of $255.6 million up 37.3% from 2015Loans (HFI) grew 11.5% annualized to $1.90 billion in 1Q 2017, which was an 11% increase from 1Q 2016Total deposits grew 4.5% annualized to $2.70 billion in 1Q 2017, which was a 9.4% increase from 1Q 2016Interest rate lock commitment (IRLC) volume was $6.34 billion for the last twelve months, up 6.4% from 2016Nonperforming assets to total assets declined to 0.56% at 3/31/17 from 0.58% at 12/31/16 and 0.83% at 3/31/16 Key highlights Financial results 1 Our pro forma net income and tax-adjusted return on average assets include a pro forma provision for federal income taxes using a combined effective income tax rate of 35.08 and 36.75% for the years ended December 31, 2015 and 2016, respectively.2 See “Reconciliation of non-GAAP financial measures” and the Appendix hereto.
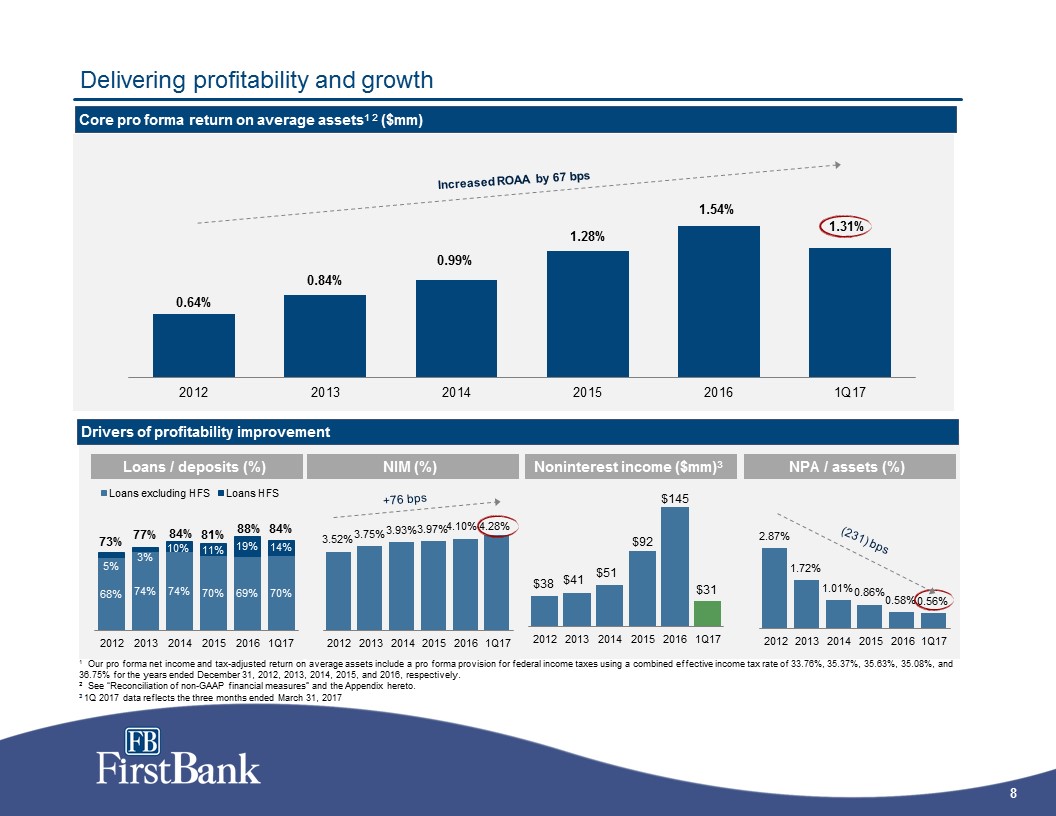
Delivering profitability and growth Drivers of profitability improvement 1 Our pro forma net income and tax-adjusted return on average assets include a pro forma provision for federal income taxes using a combined effective income tax rate of 33.76%, 35.37%, 35.63%, 35.08%, and 36.75% for the years ended December 31, 2012, 2013, 2014, 2015, and 2016, respectively.2 See “Reconciliation of non-GAAP financial measures” and the Appendix hereto.3 1Q 2017 data reflects the three months ended March 31, 2017 Core pro forma return on average assets1 2 ($mm) NIM (%) Noninterest income ($mm)3 +76 bps Loans / deposits (%) NPA / assets (%) (231) bps Increased ROAA by 67 bps
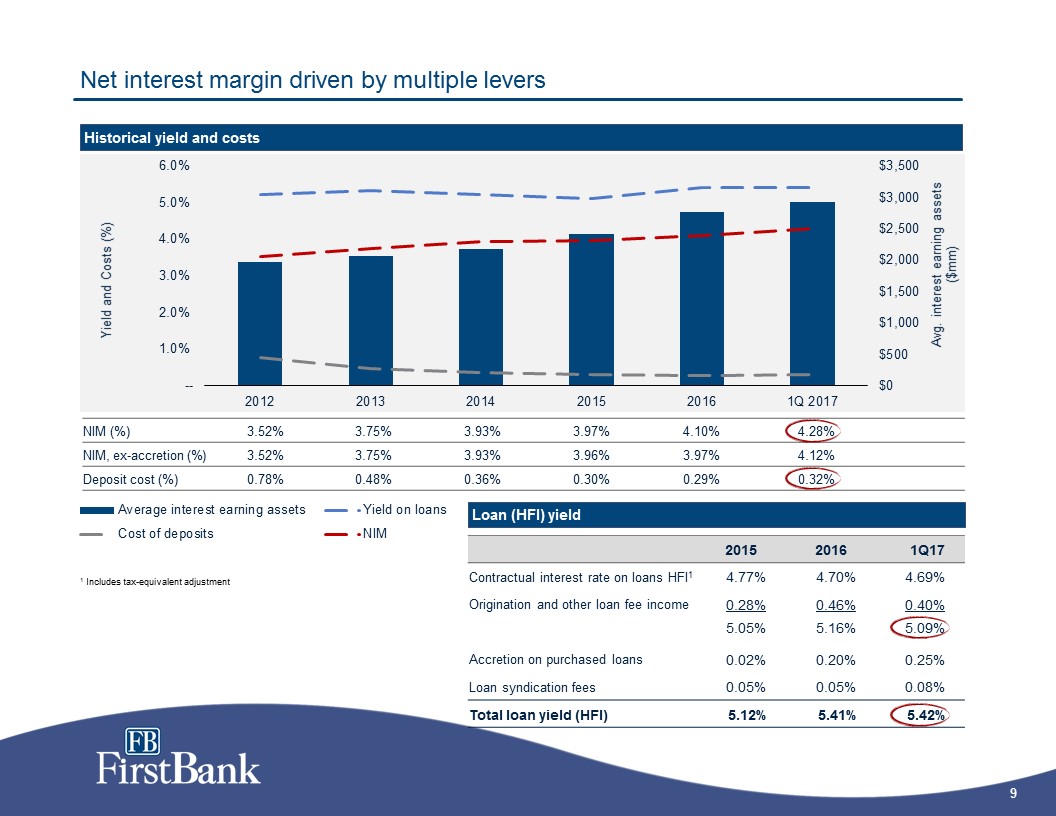
Net interest margin driven by multiple levers Historical yield and costs 1 Includes tax-equivalent adjustment NIM (%) 3.52% 3.75% 3.93% 3.97% 4.10% 4.28% NIM, ex-accretion (%) 3.52% 3.75% 3.93% 3.96% 3.97% 4.12% Deposit cost (%) 0.78% 0.48% 0.36% 0.30% 0.29% 0.32% Loan (HFI) yield 2015 2016 1Q17 Contractual interest rate on loans HFI1 4.77% 4.70% 4.69% Origination and other loan fee income 0.28% 0.46% 0.40% 5.05% 5.16% 5.09% Accretion on purchased loans 0.02% 0.20% 0.25% Loan syndication fees 0.05% 0.05% 0.08% Total loan yield (HFI) 5.12% 5.41% 5.42%
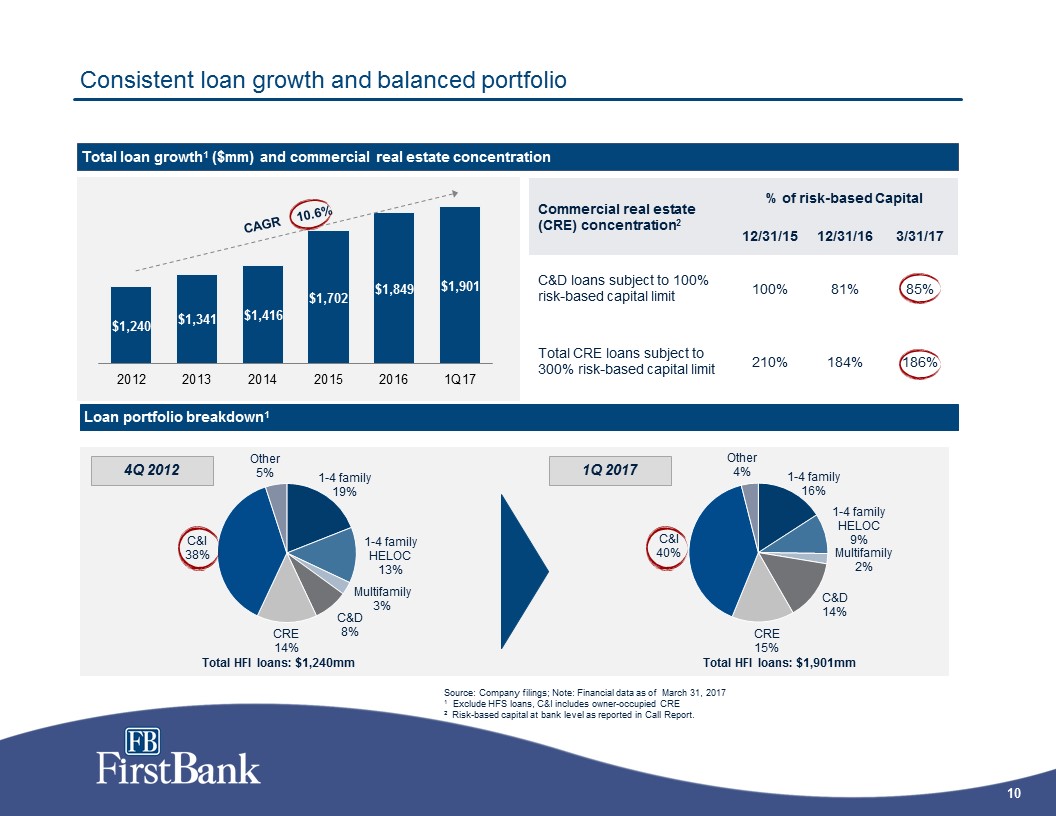
Consistent loan growth and balanced portfolio Total loan growth1 ($mm) and commercial real estate concentration Loan portfolio breakdown1 4Q 2012 1Q 2017 Total HFI loans: $1,901mm Source: Company filings; Note: Financial data as of March 31, 20171 Exclude HFS loans, C&I includes owner-occupied CRE2 Risk-based capital at bank level as reported in Call Report. Commercial real estate (CRE) concentration2 % of risk-based Capital 12/31/15 12/31/16 3/31/17 C&D loans subject to 100% risk-based capital limit 100% 81% 85% Total CRE loans subject to 300% risk-based capital limit 210% 184% 186%
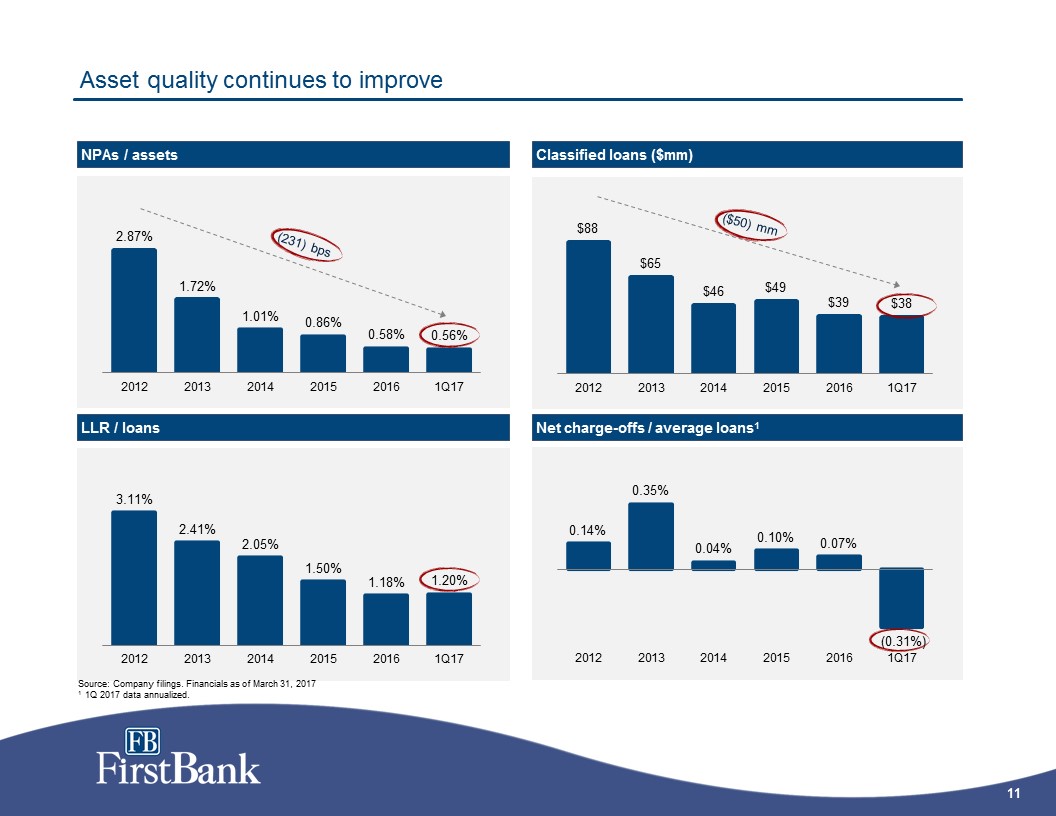
Asset quality continues to improve Source: Company filings. Financials as of March 31, 20171 1Q 2017 data annualized. Classified loans ($mm) Net charge-offs / average loans1 NPAs / assets LLR / loans (231) bps ($50) mm
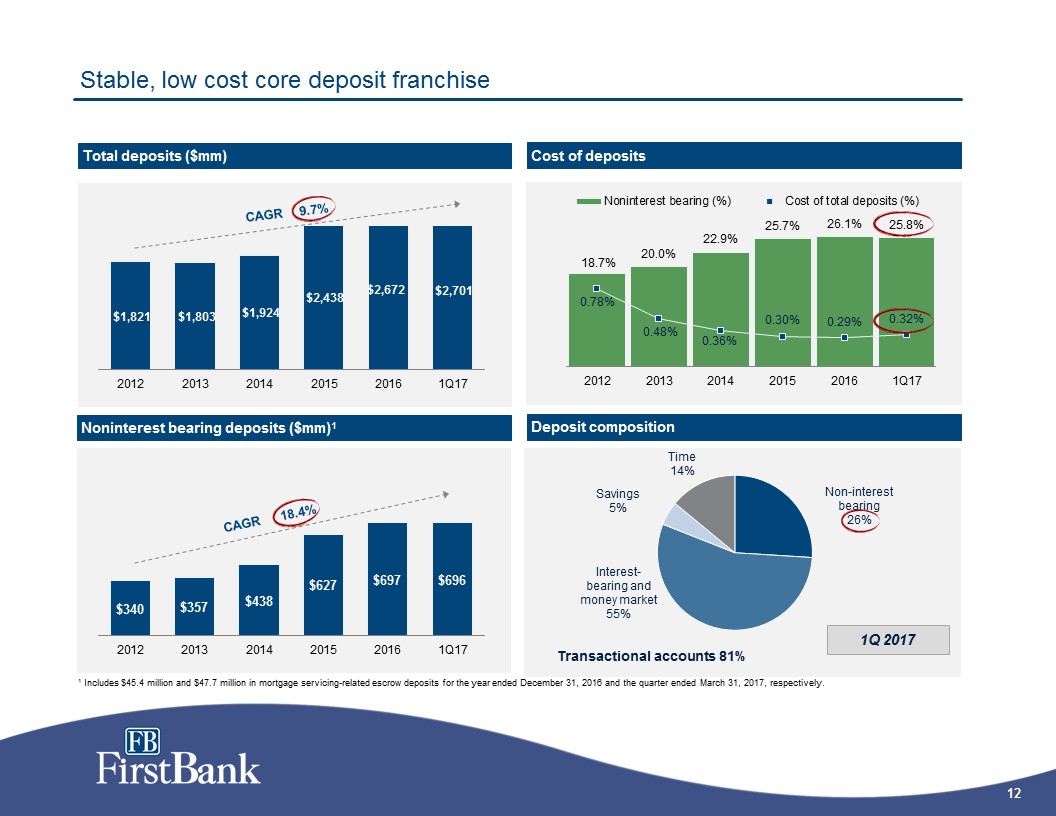
Stable, low cost core deposit franchise Total deposits ($mm) 1 Includes $45.4 million and $47.7 million in mortgage servicing-related escrow deposits for the year ended December 31, 2016 and the quarter ended March 31, 2017, respectively. Noninterest bearing deposits ($mm)1 CAGR 18.4% Deposit composition Cost of deposits CAGR 9.7%
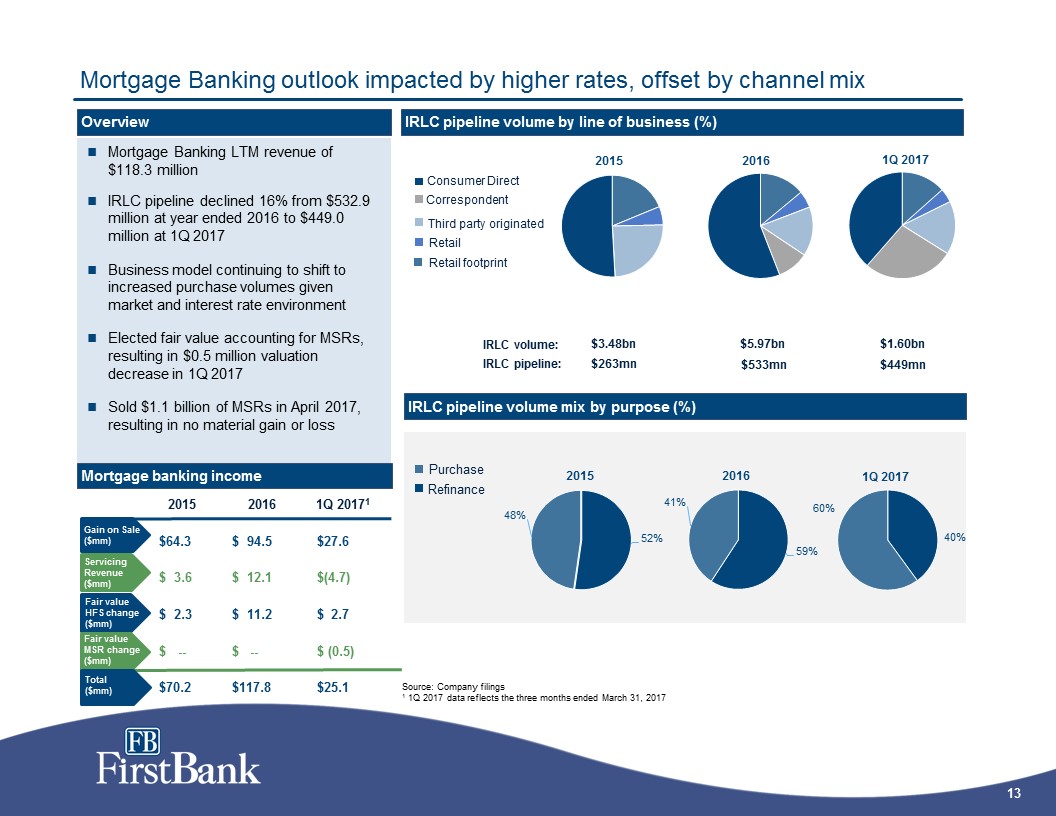
Mortgage Banking outlook impacted by higher rates, offset by channel mix Mortgage Banking LTM revenue of $118.3 millionIRLC pipeline declined 16% from $532.9 million at year ended 2016 to $449.0 million at 1Q 2017Business model continuing to shift to increased purchase volumes given market and interest rate environment Elected fair value accounting for MSRs, resulting in $0.5 million valuation decrease in 1Q 2017Sold $1.1 billion of MSRs in April 2017, resulting in no material gain or loss Overview Source: Company filings1 1Q 2017 data reflects the three months ended March 31, 2017 IRLC pipeline volume mix by purpose (%) IRLC pipeline volume by line of business (%) Consumer Direct Correspondent Third party originated Retail Retail footprint Refinance Purchase $3.48bn $5.97bn IRLC volume: IRLC pipeline: $263mn $533mn Gain on Sale ($mm) Servicing Revenue ($mm) Fair value HFS change($mm) Fair value MSR change($mm) Mortgage banking income Total($mm) 2015 2016 1Q 20171 $64.3 $ 94.5 $27.6 $ 3.6 $ 12.1 $(4.7) $ 2.3 $ 11.2 $ 2.7 $ -- $ -- $ (0.5) $70.2 $117.8 $25.1 $449mn $1.60bn
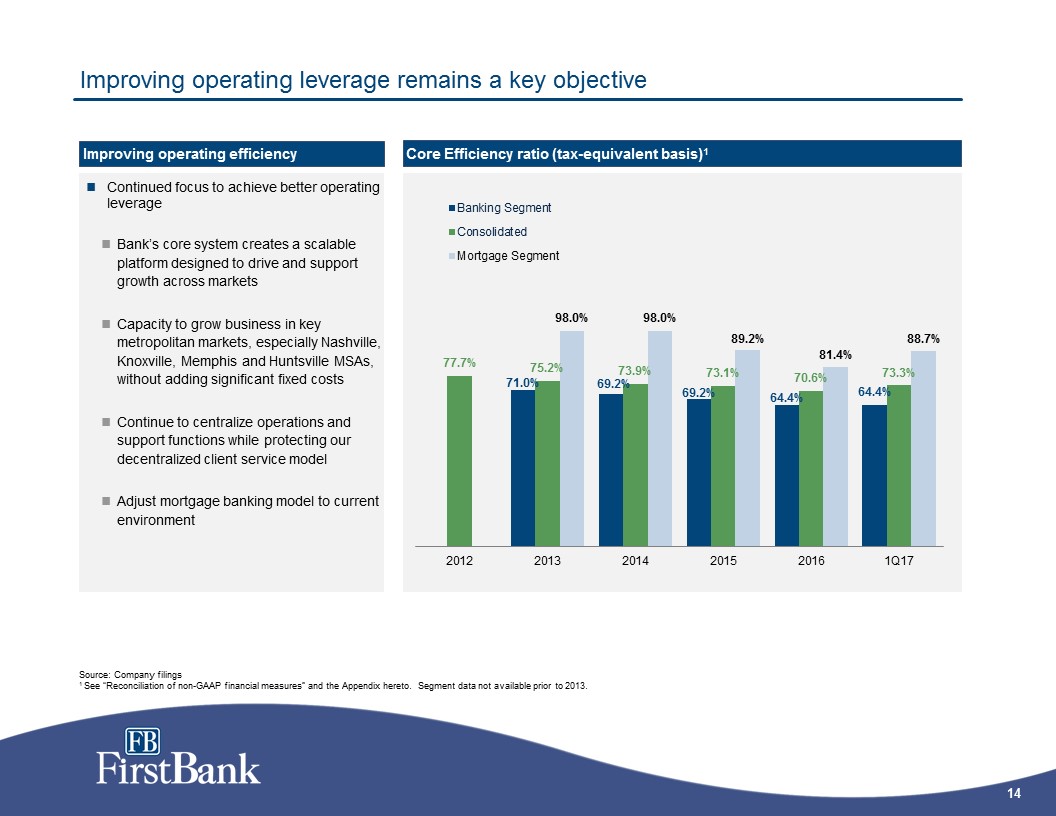
Improving operating leverage remains a key objective Continued focus to achieve better operating leverageBank’s core system creates a scalable platform designed to drive and support growth across marketsCapacity to grow business in key metropolitan markets, especially Nashville, Knoxville, Memphis and Huntsville MSAs, without adding significant fixed costsContinue to centralize operations and support functions while protecting our decentralized client service modelAdjust mortgage banking model to current environment Core Efficiency ratio (tax-equivalent basis)1 Improving operating efficiency Source: Company filings1 See “Reconciliation of non-GAAP financial measures” and the Appendix hereto. Segment data not available prior to 2013.
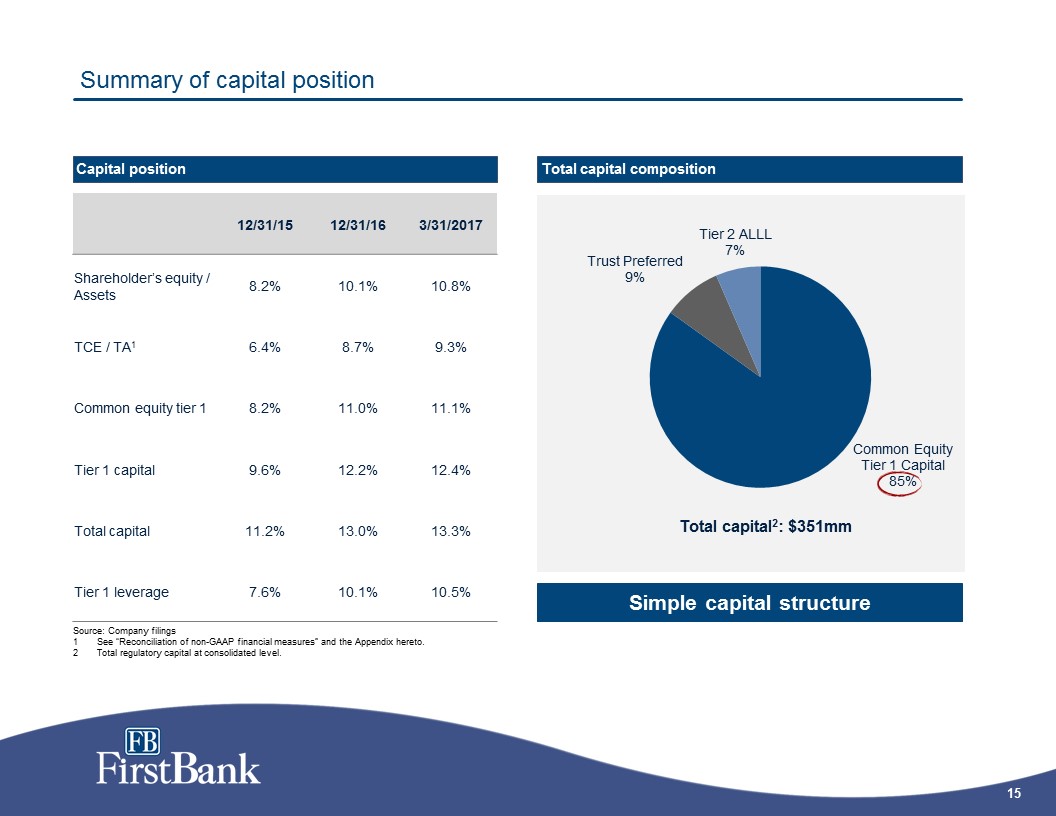
Summary of capital position Source: Company filingsSee “Reconciliation of non-GAAP financial measures” and the Appendix hereto. Total regulatory capital at consolidated level. Capital position Total capital composition 12/31/15 12/31/16 3/31/2017 Shareholder’s equity / Assets 8.2% 10.1% 10.8% TCE / TA1 6.4% 8.7% 9.3% Common equity tier 1 8.2% 11.0% 11.1% Tier 1 capital 9.6% 12.2% 12.4% Total capital 11.2% 13.0% 13.3% Tier 1 leverage 7.6% 10.1% 10.5% Simple capital structure
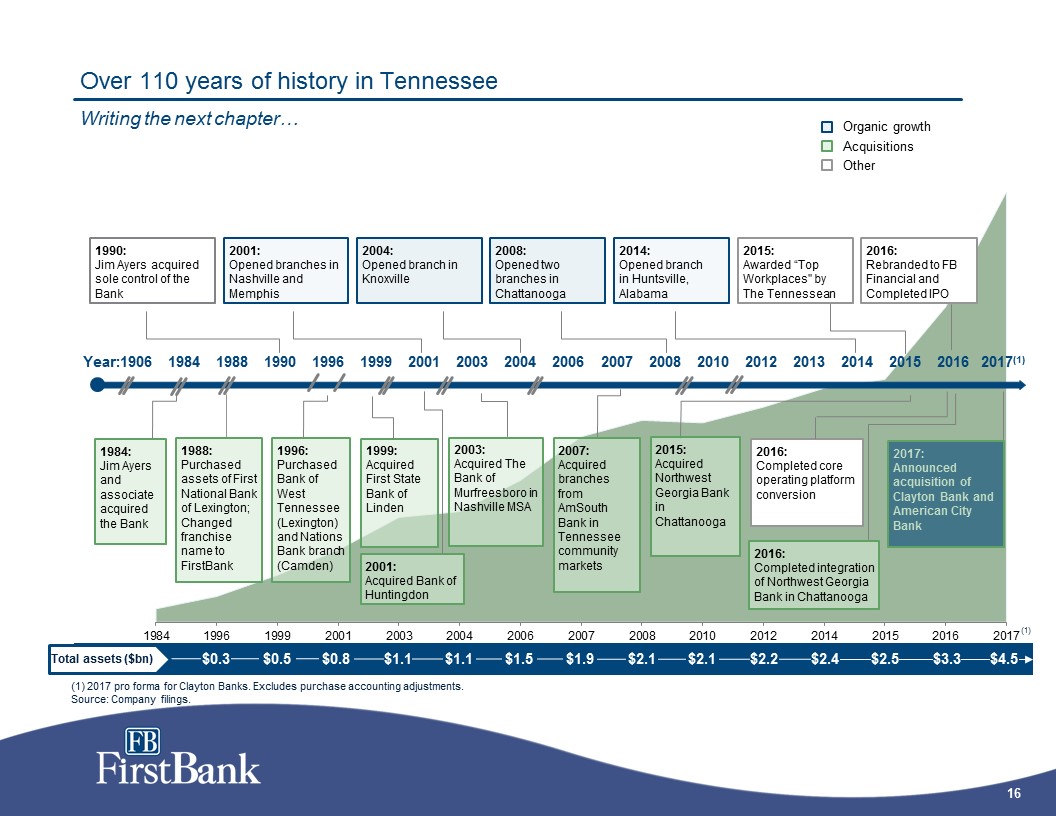
Over 110 years of history in TennesseeWriting the next chapter… 2003: Acquired The Bank of Murfreesboro in Nashville MSA 2007: Acquired branches from AmSouth Bank in Tennessee community markets 1984 1988 1996 1999 2001 2003 2004 2006 2012 2013 2015 Year: 2001: Opened branches in Nashville and Memphis 2004: Opened branch in Knoxville Acquisitions Organic growth Other (1) 2017 pro forma for Clayton Banks. Excludes purchase accounting adjustments.Source: Company filings. 1999: Acquired First State Bank of Linden 1906 2010 2007 2008 2008: Opened two branches in Chattanooga 1990 1996: Purchased Bank of West Tennessee (Lexington) and Nations Bank branch (Camden) 2001: Acquired Bank of Huntingdon 2014 2014: Opened branch in Huntsville, Alabama 1990: Jim Ayers acquired sole control of the Bank 2016 $0.3 $0.5 $0.8 $1.1 $1.1 $1.5 $2.2 $2.4 $2.5 $3.3 $1.9 $2.1 $2.1 $4.5 2016:Completed core operating platform conversion 2016:Completed integration of Northwest Georgia Bank in Chattanooga 2015: Awarded “Top Workplaces" by The Tennessean 2016:Rebranded to FB Financial and Completed IPO 1988: Purchased assets of First National Bank of Lexington; Changed franchise name to FirstBank 1984: Jim Ayers and associate acquired the Bank 2015: Acquired Northwest Georgia Bank in Chattanooga Total assets ($bn) 2017(1) 2017:Announced acquisition of Clayton Bank and American City Bank (1)
Acquisition of the Wholly-Owned Banks of Clayton HC, Inc. Pending acquisition highlights
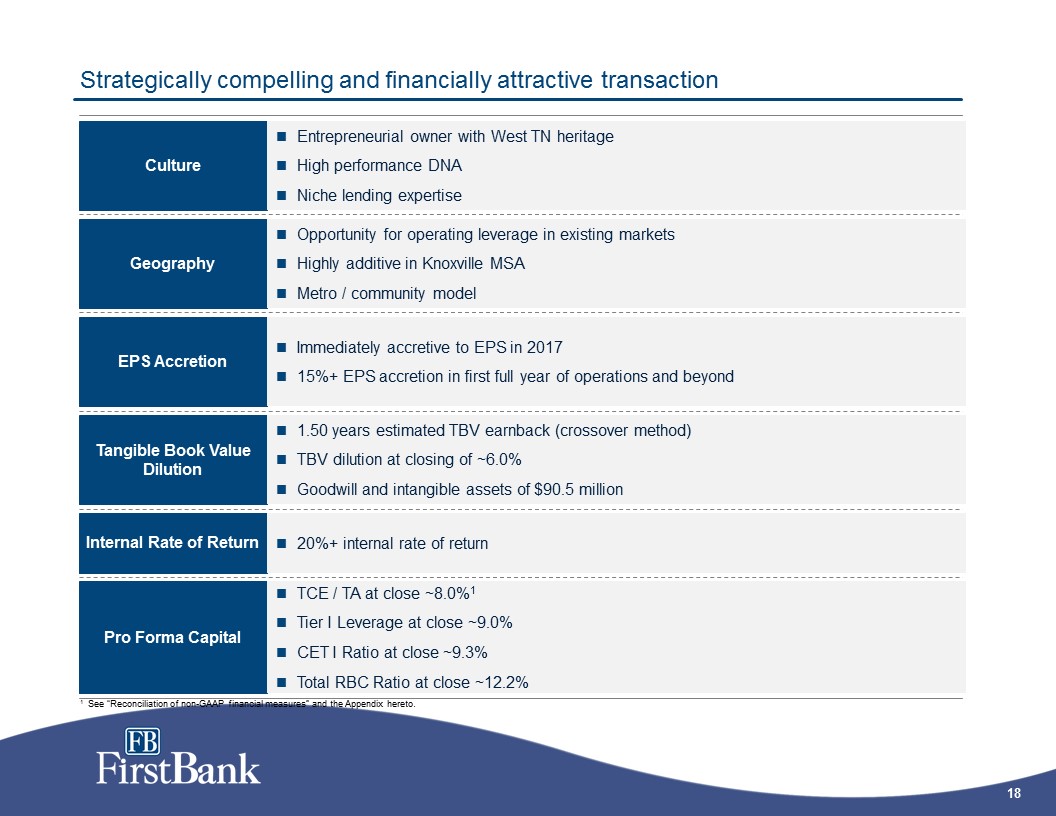
Culture EPS Accretion Geography Strategically compelling and financially attractive transaction Tangible Book Value Dilution Entrepreneurial owner with West TN heritageHigh performance DNANiche lending expertise Internal Rate of Return Opportunity for operating leverage in existing marketsHighly additive in Knoxville MSAMetro / community model Immediately accretive to EPS in 201715%+ EPS accretion in first full year of operations and beyond 1.50 years estimated TBV earnback (crossover method)TBV dilution at closing of ~6.0%Goodwill and intangible assets of $90.5 million 20%+ internal rate of return Pro Forma Capital TCE / TA at close ~8.0%1Tier I Leverage at close ~9.0%CET I Ratio at close ~9.3%Total RBC Ratio at close ~12.2% 1 See “Reconciliation of non-GAAP financial measures” and the Appendix hereto.
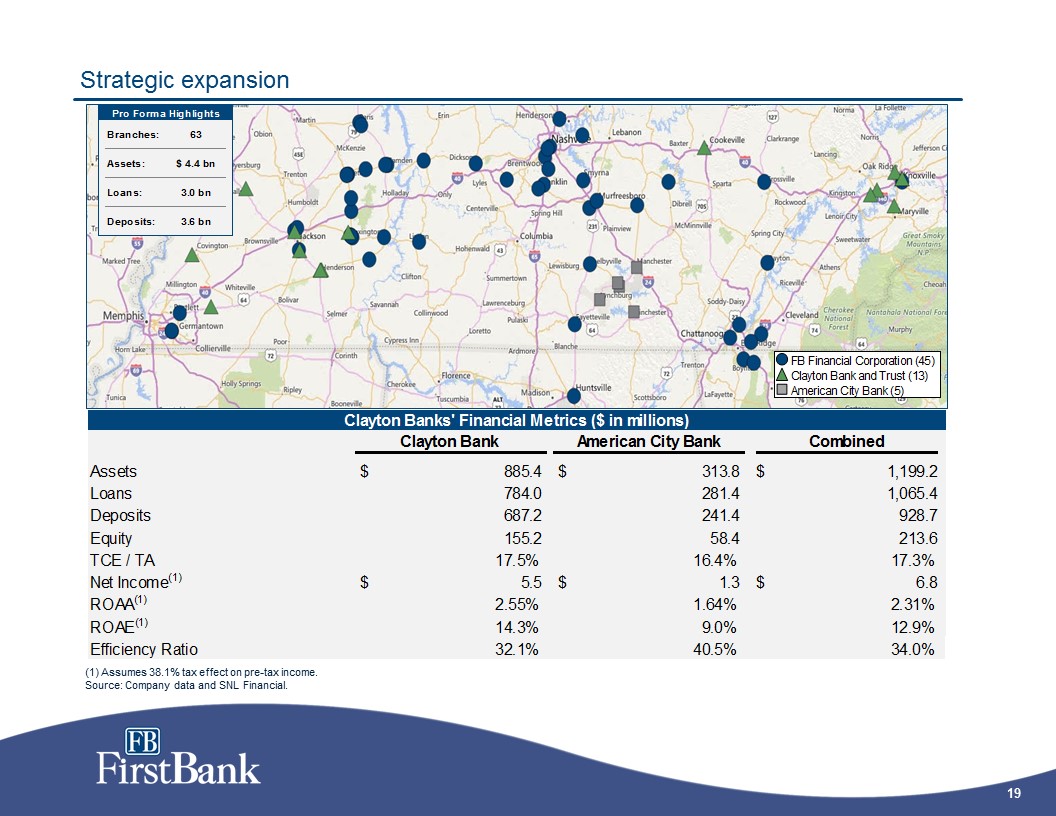
Strategic expansion (1) Assumes 38.1% tax effect on pre-tax income.Source: Company data and SNL Financial.
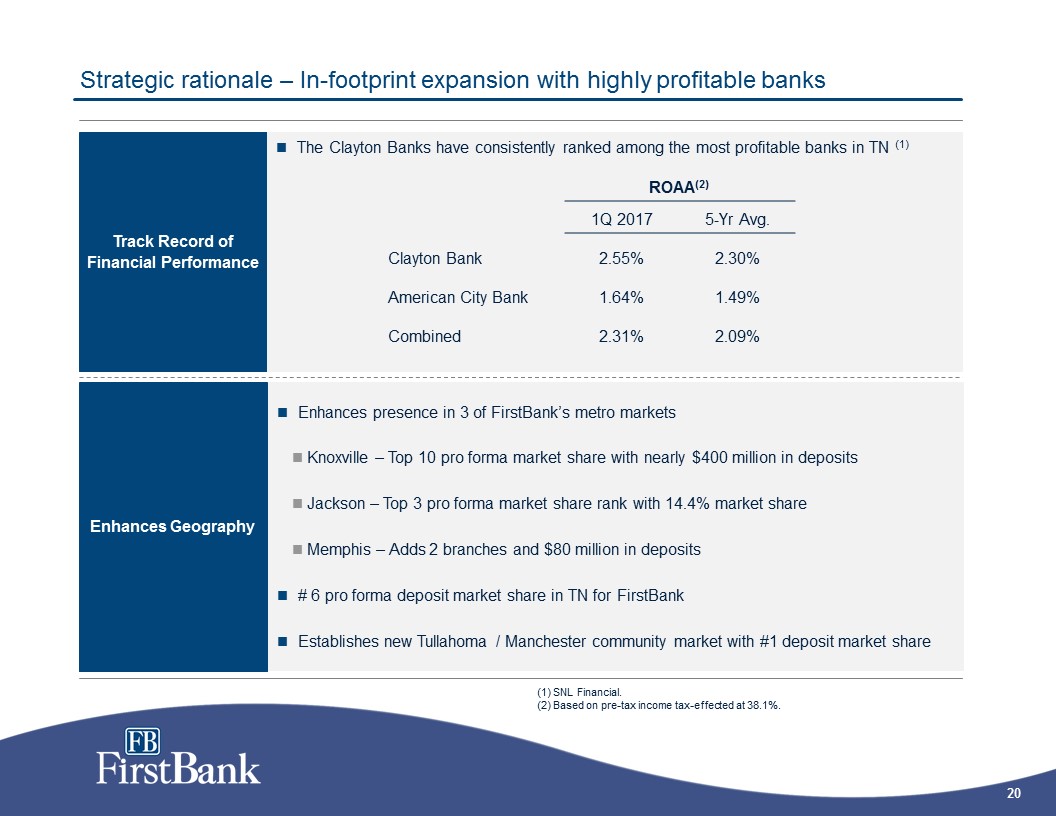
Strategic rationale – In-footprint expansion with highly profitable banks Track Record of Financial Performance The Clayton Banks have consistently ranked among the most profitable banks in TN (1) ROAA(2) 1Q 2017 5-Yr Avg. Clayton Bank 2.55% 2.30% American City Bank 1.64% 1.49% Combined 2.31% 2.09% Enhances Geography Enhances presence in 3 of FirstBank’s metro marketsKnoxville – Top 10 pro forma market share with nearly $400 million in depositsJackson – Top 3 pro forma market share rank with 14.4% market shareMemphis – Adds 2 branches and $80 million in deposits# 6 pro forma deposit market share in TN for FirstBankEstablishes new Tullahoma / Manchester community market with #1 deposit market share (1) SNL Financial. (2) Based on pre-tax income tax-effected at 38.1%.
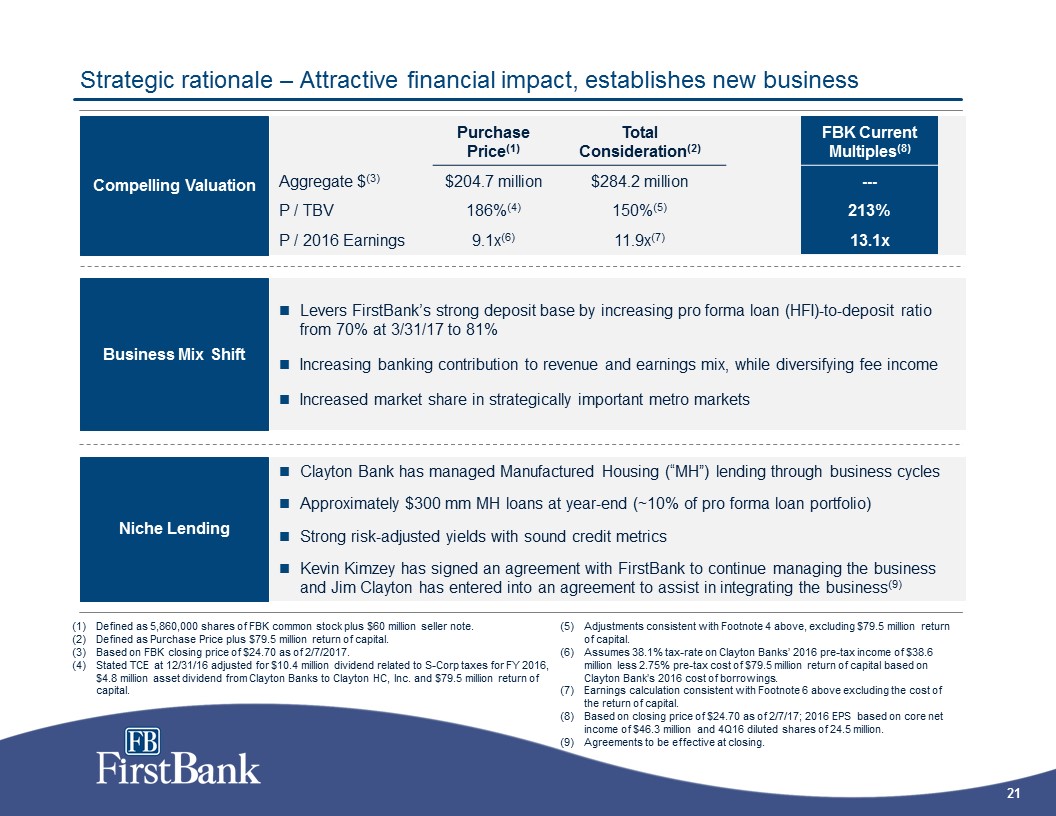
Strategic rationale – Attractive financial impact, establishes new business Niche Lending Clayton Bank has managed Manufactured Housing (“MH”) lending through business cyclesApproximately $300 mm MH loans at year-end (~10% of pro forma loan portfolio)Strong risk-adjusted yields with sound credit metricsKevin Kimzey has signed an agreement with FirstBank to continue managing the business and Jim Clayton has entered into an agreement to assist in integrating the business(9) Adjustments consistent with Footnote 4 above, excluding $79.5 million return of capital.Assumes 38.1% tax-rate on Clayton Banks’ 2016 pre-tax income of $38.6 million less 2.75% pre-tax cost of $79.5 million return of capital based on Clayton Bank’s 2016 cost of borrowings.Earnings calculation consistent with Footnote 6 above excluding the cost of the return of capital.Based on closing price of $24.70 as of 2/7/17; 2016 EPS based on core net income of $46.3 million and 4Q16 diluted shares of 24.5 million.Agreements to be effective at closing. Business Mix Shift Levers FirstBank’s strong deposit base by increasing pro forma loan (HFI)-to-deposit ratio from 70% at 3/31/17 to 81%Increasing banking contribution to revenue and earnings mix, while diversifying fee incomeIncreased market share in strategically important metro markets Compelling Valuation Purchase Price(1) Total Consideration(2) FBK Current Multiples(8) Aggregate $(3) $204.7 million $284.2 million --- P / TBV 186%(4) 150%(5) 213% P / 2016 Earnings 9.1x(6) 11.9x(7) 13.1x Mess with footnotesAdd FBK multiples somewhere Defined as 5,860,000 shares of FBK common stock plus $60 million seller note.Defined as Purchase Price plus $79.5 million return of capital.Based on FBK closing price of $24.70 as of 2/7/2017.Stated TCE at 12/31/16 adjusted for $10.4 million dividend related to S-Corp taxes for FY 2016, $4.8 million asset dividend from Clayton Banks to Clayton HC, Inc. and $79.5 million return of capital.
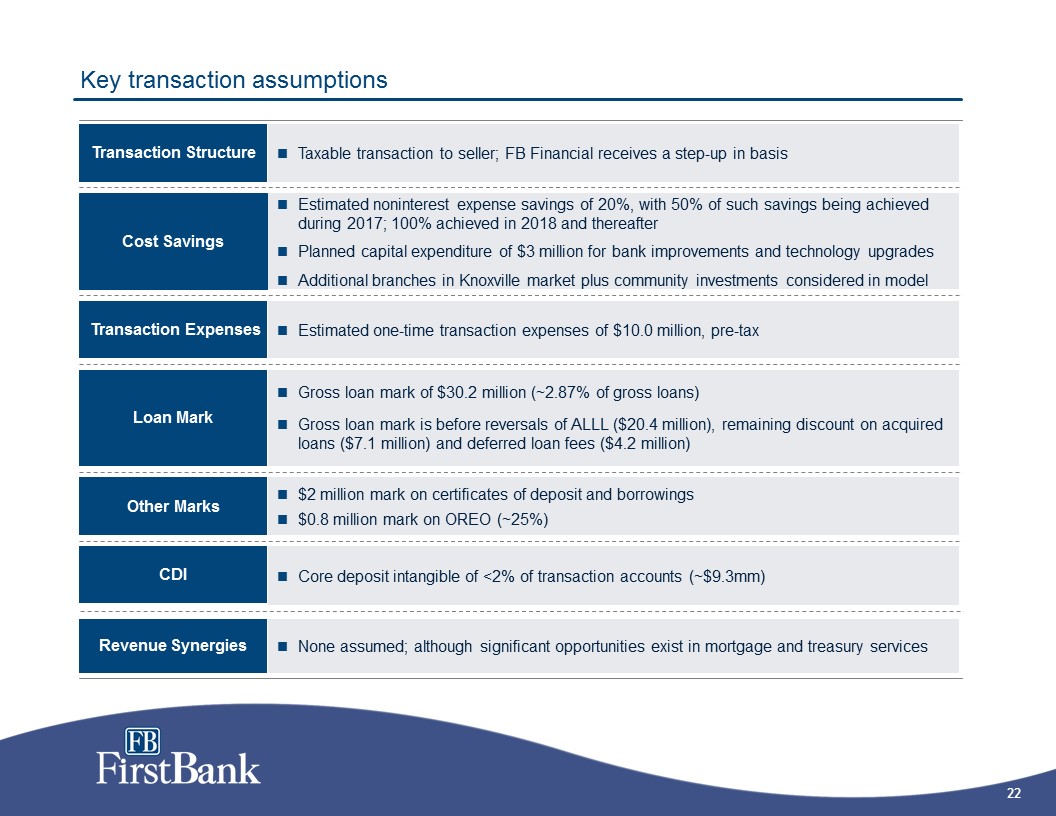
Cost Savings Transaction Expenses Estimated one-time transaction expenses of $10.0 million, pre-tax Key transaction assumptions Loan Mark Gross loan mark of $30.2 million (~2.87% of gross loans)Gross loan mark is before reversals of ALLL ($20.4 million), remaining discount on acquired loans ($7.1 million) and deferred loan fees ($4.2 million) Transaction Structure Taxable transaction to seller; FB Financial receives a step-up in basis Estimated noninterest expense savings of 20%, with 50% of such savings being achieved during 2017; 100% achieved in 2018 and thereafterPlanned capital expenditure of $3 million for bank improvements and technology upgradesAdditional branches in Knoxville market plus community investments considered in model CDI Core deposit intangible of <2% of transaction accounts (~$9.3mm) Other Marks $2 million mark on certificates of deposit and borrowings$0.8 million mark on OREO (~25%) Revenue Synergies None assumed; although significant opportunities exist in mortgage and treasury services Community investment and branding
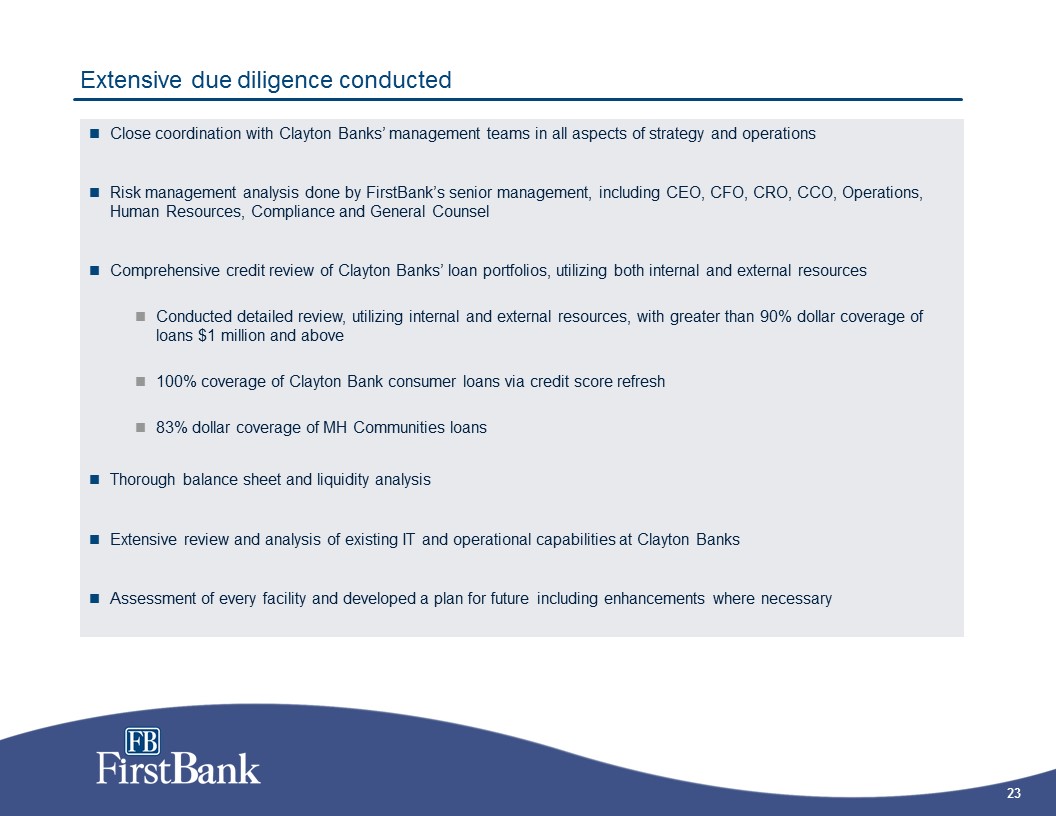
Extensive due diligence conducted Close coordination with Clayton Banks’ management teams in all aspects of strategy and operationsRisk management analysis done by FirstBank’s senior management, including CEO, CFO, CRO, CCO, Operations, Human Resources, Compliance and General CounselComprehensive credit review of Clayton Banks’ loan portfolios, utilizing both internal and external resourcesConducted detailed review, utilizing internal and external resources, with greater than 90% dollar coverage of loans $1 million and above100% coverage of Clayton Bank consumer loans via credit score refresh83% dollar coverage of MH Communities loansThorough balance sheet and liquidity analysisExtensive review and analysis of existing IT and operational capabilities at Clayton BanksAssessment of every facility and developed a plan for future including enhancements where necessary
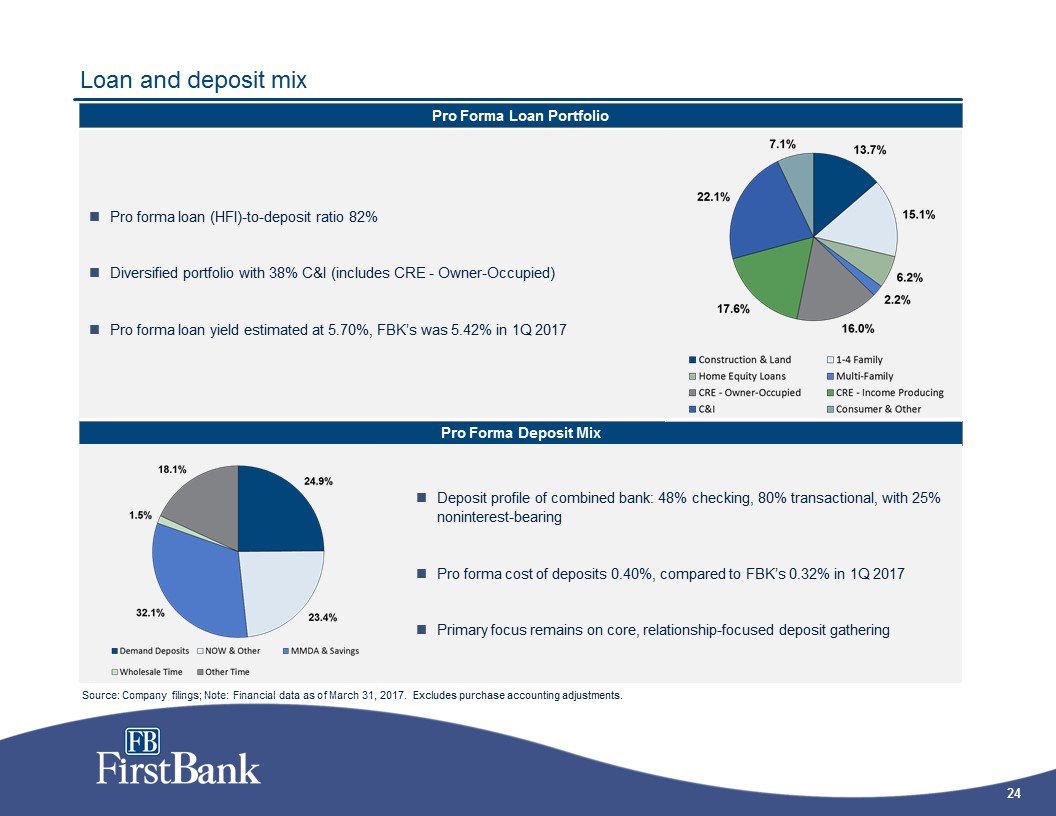
Loan and deposit mix Pro Forma Loan Portfolio Pro Forma Deposit Mix Pro forma loan (HFI)-to-deposit ratio 82%Diversified portfolio with 38% C&I (includes CRE - Owner-Occupied) Pro forma loan yield estimated at 5.70%, FBK’s was 5.42% in 1Q 2017 Deposit profile of combined bank: 48% checking, 80% transactional, with 25% noninterest-bearingPro forma cost of deposits 0.40%, compared to FBK’s 0.32% in 1Q 2017Primary focus remains on core, relationship-focused deposit gathering Source: Company filings; Note: Financial data as of March 31, 2017. Excludes purchase accounting adjustments.
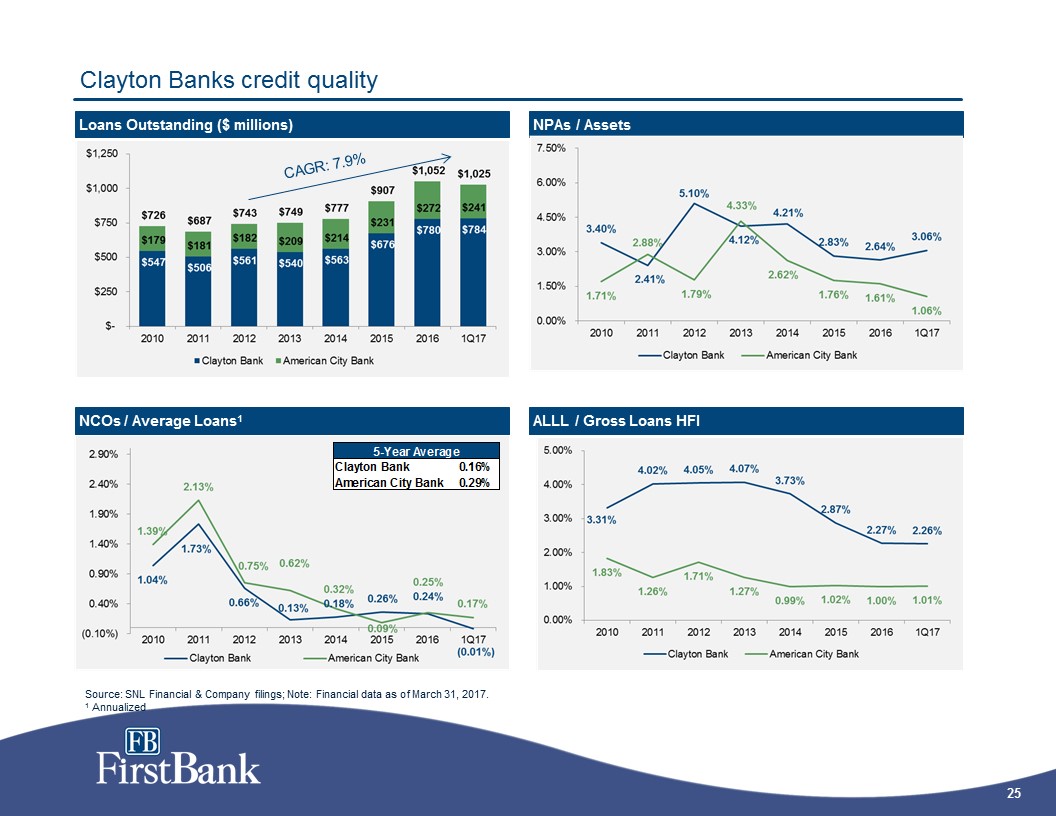
Clayton Banks credit quality Loans Outstanding ($ millions) NPAs / Assets NCOs / Average Loans1 ALLL / Gross Loans HFI CAGR: 7.9% Source: SNL Financial & Company filings; Note: Financial data as of March 31, 2017.1 Annualized
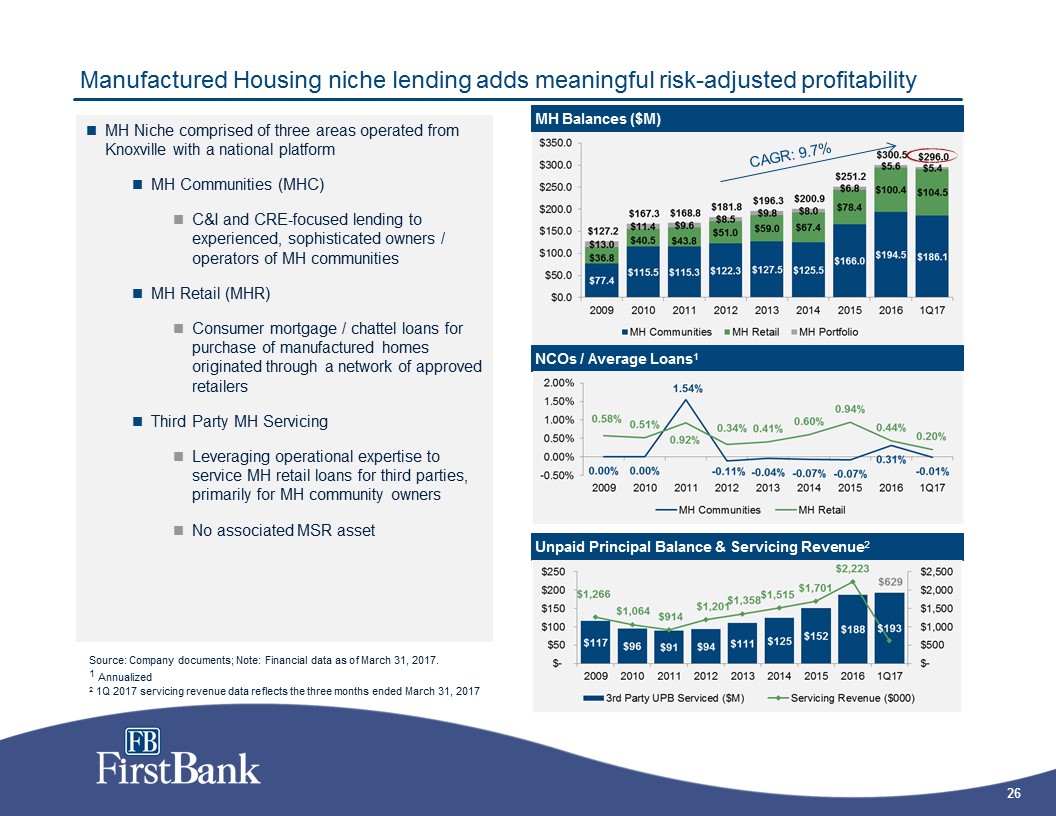
Manufactured Housing niche lending adds meaningful risk-adjusted profitability MH Balances ($M) MH Niche comprised of three areas operated from Knoxville with a national platformMH Communities (MHC) C&I and CRE-focused lending to experienced, sophisticated owners / operators of MH communities MH Retail (MHR)Consumer mortgage / chattel loans for purchase of manufactured homes originated through a network of approved retailersThird Party MH ServicingLeveraging operational expertise to service MH retail loans for third parties, primarily for MH community ownersNo associated MSR asset Unpaid Principal Balance & Servicing Revenue2 NCOs / Average Loans1 CAGR: 9.7% Source: Company documents; Note: Financial data as of March 31, 2017.1 Annualized2 1Q 2017 servicing revenue data reflects the three months ended March 31, 2017
Appendix: FB Financial Standalone
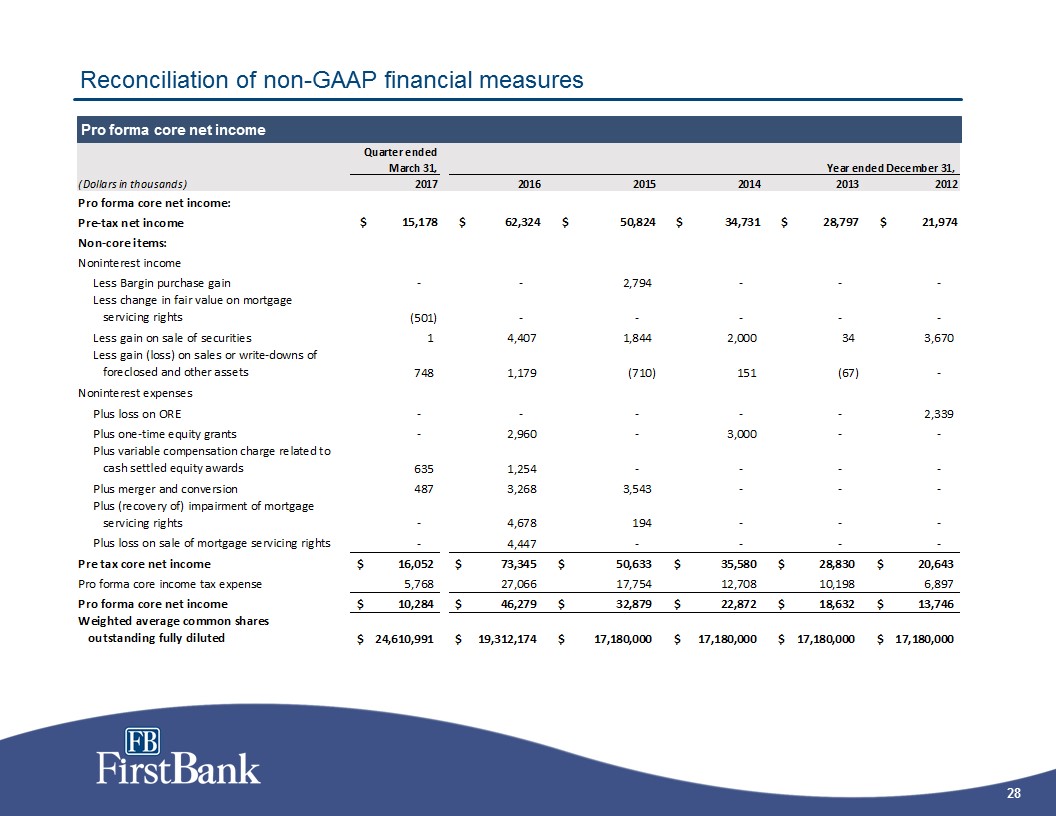
Reconciliation of non-GAAP financial measures Pro forma core net income
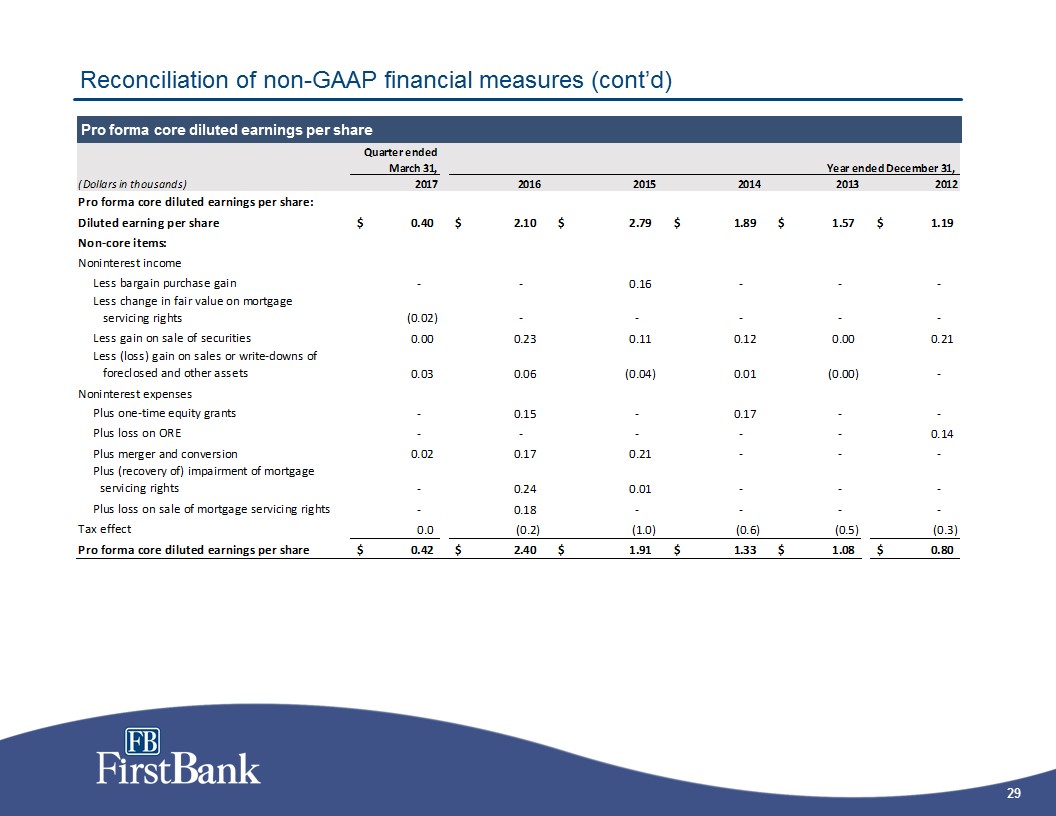
Reconciliation of non-GAAP financial measures (cont’d) Pro forma core diluted earnings per share
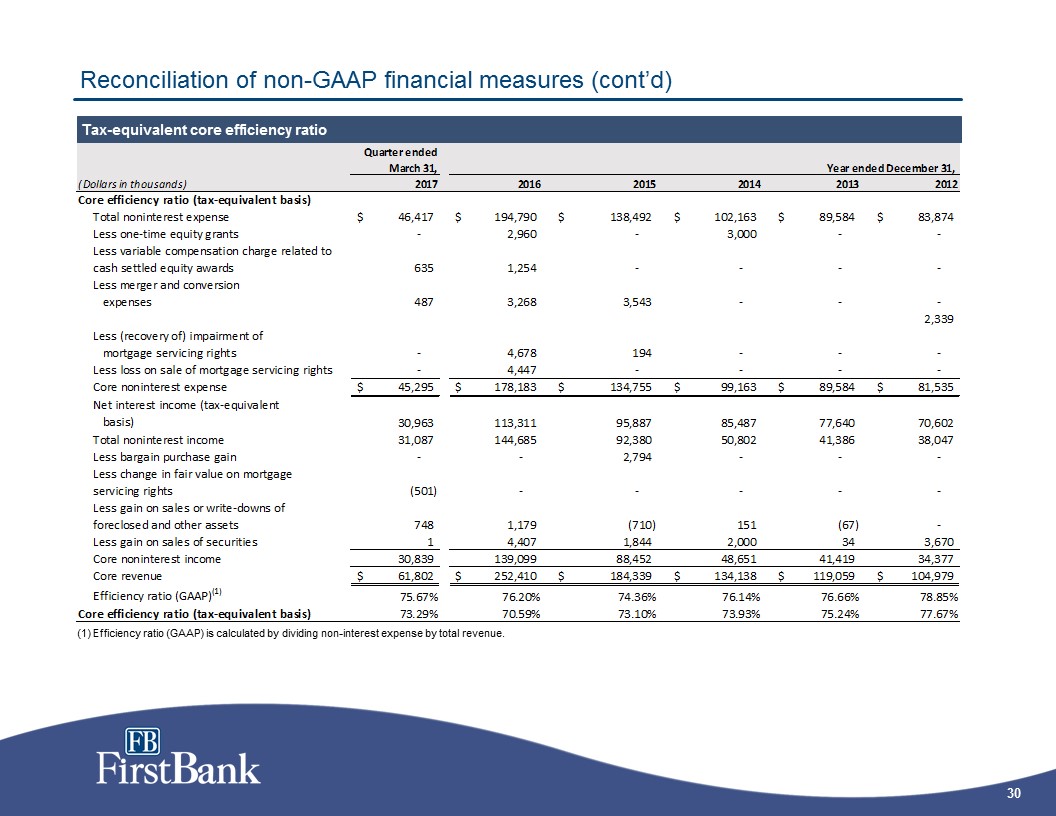
Reconciliation of non-GAAP financial measures (cont’d) Tax-equivalent core efficiency ratio (1) Efficiency ratio (GAAP) is calculated by dividing non-interest expense by total revenue.

Tangible book value per common share and tangible common equity to tangible assets Reconciliation of non-GAAP financial measures (cont’d) On June 28, 2016, the Company declared a 100-for-1 stock split, increasing the number of issued and authorized shares from 171,800 to 17,180,000 and 250,000 to 25,000,000, respectively. Additional shares issued as a result of the stock split were distributed immediately upon issuance to the shareholder on that date. Share and per share amounts included in the consolidated financial statements and notes thereto reflect the effect of the split for all periods presented. Additionally, in July 2016, the Company increased the authorized shares from 25,000,000 to 75,000,000.

Core deposits Reconciliation of non-GAAP financial measures (cont’d) Core pro forma return on average assets and equity
Appendix: Clayton Banks
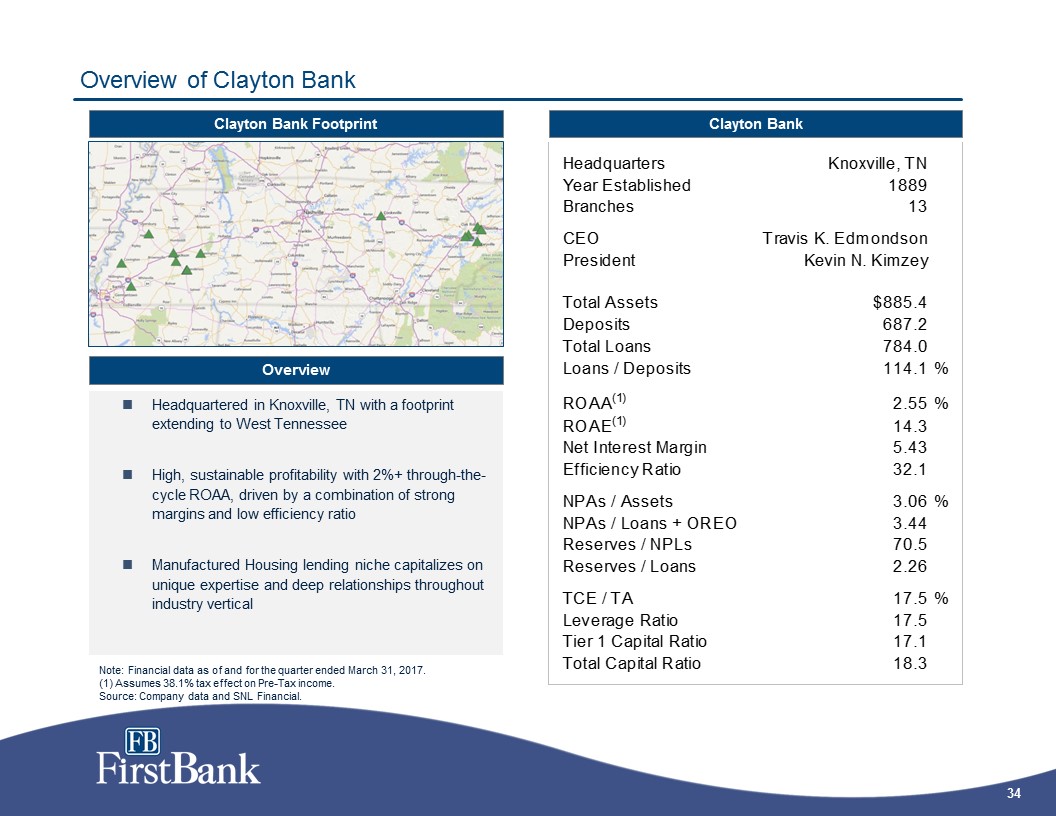
Headquartered in Knoxville, TN with a footprint extending to West TennesseeHigh, sustainable profitability with 2%+ through-the-cycle ROAA, driven by a combination of strong margins and low efficiency ratioManufactured Housing lending niche capitalizes on unique expertise and deep relationships throughout industry vertical Overview of Clayton Bank Clayton Bank Footprint Overview Note: Financial data as of and for the quarter ended March 31, 2017.(1) Assumes 38.1% tax effect on Pre-Tax income.Source: Company data and SNL Financial. Clayton Bank
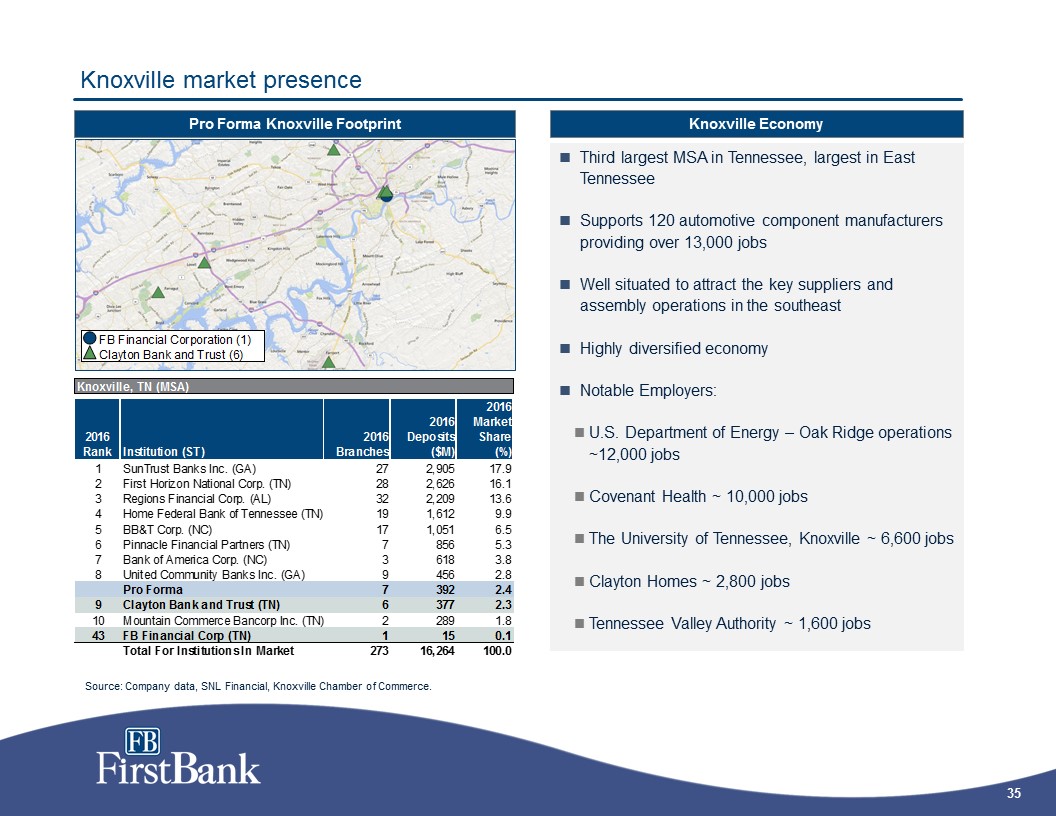
Knoxville market presence Pro Forma Knoxville Footprint Third largest MSA in Tennessee, largest in East TennesseeSupports 120 automotive component manufacturers providing over 13,000 jobsWell situated to attract the key suppliers and assembly operations in the southeastHighly diversified economy Notable Employers:U.S. Department of Energy – Oak Ridge operations ~12,000 jobsCovenant Health ~ 10,000 jobsThe University of Tennessee, Knoxville ~ 6,600 jobsClayton Homes ~ 2,800 jobsTennessee Valley Authority ~ 1,600 jobs Knoxville Economy Source: Company data, SNL Financial, Knoxville Chamber of Commerce.
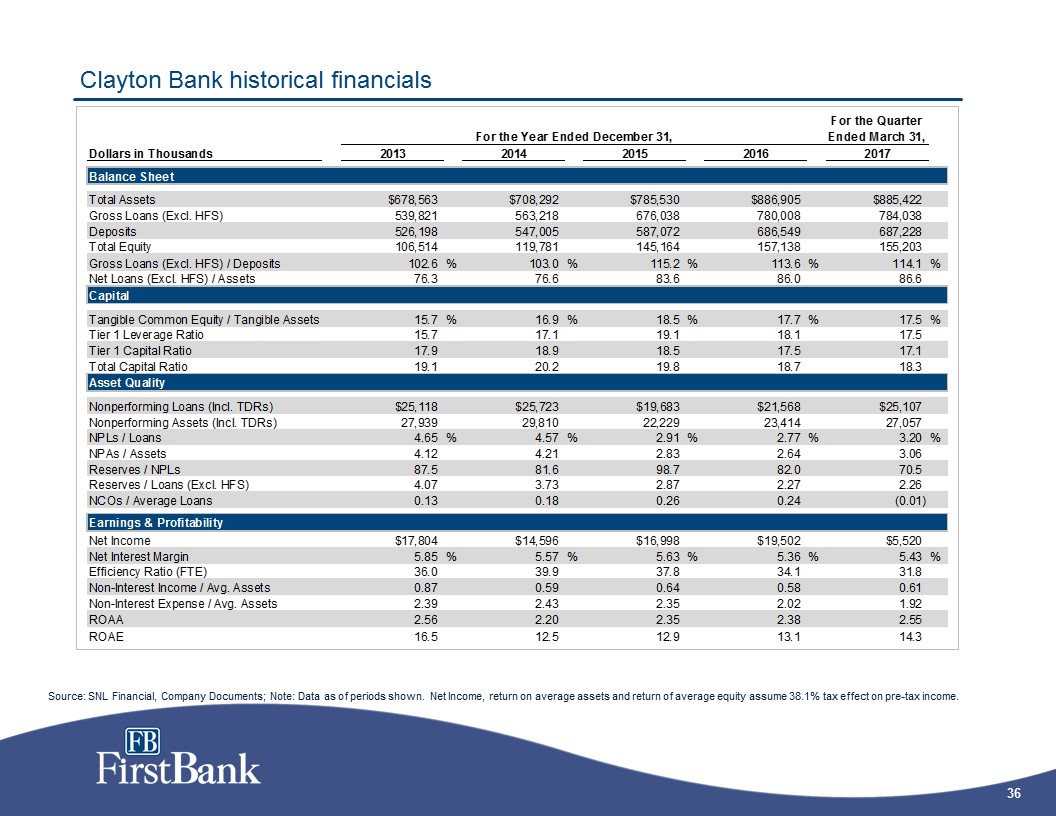
Clayton Bank historical financials Source: SNL Financial, Company Documents; Note: Data as of periods shown. Net Income, return on average assets and return of average equity assume 38.1% tax effect on pre-tax income.

Overview of American City Bank American City Bank Footprint Overview Headquartered in Tullahoma, TN with branches also in Manchester, TNEfficiently run, profitable institution with sustainable ROAA of ~1.5%, pricing power and strong capitalizationCustomer-focused business model driven by strong relationships and local market knowledge American City Bank Note: Financial data as of and for the quarter ended March 31, 2017.(1) Assumes 38.1% tax effect on Pre-Tax income.Source: Company data and SNL Financial.
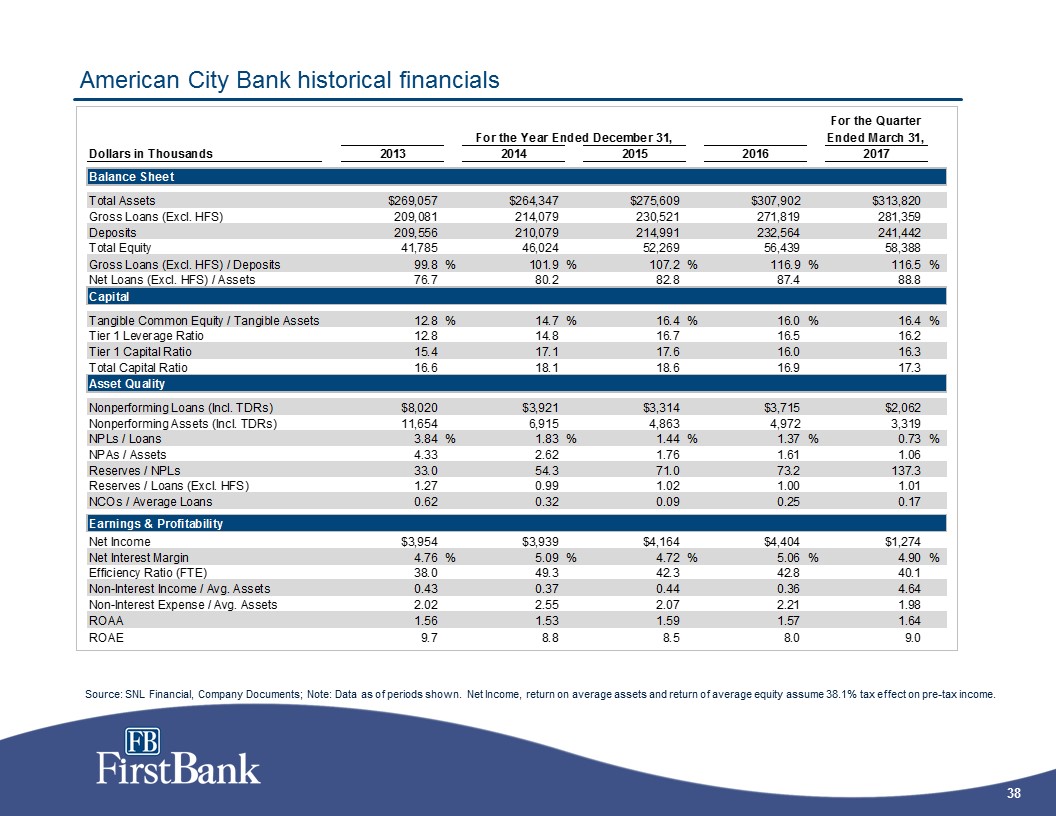
American City Bank historical financials Source: SNL Financial, Company Documents; Note: Data as of periods shown. Net Income, return on average assets and return of average equity assume 38.1% tax effect on pre-tax income.
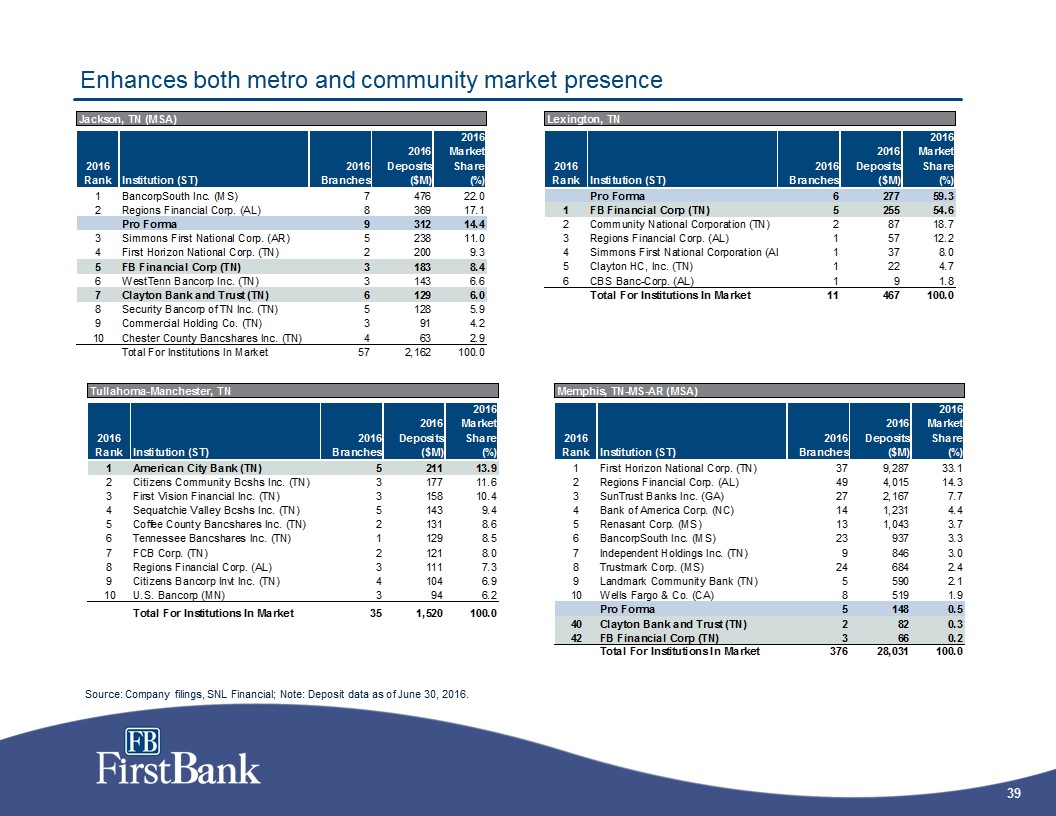
Enhances both metro and community market presence Source: Company filings, SNL Financial; Note: Deposit data as of June 30, 2016.

Pro forma loan portfolio bolsters commercial lending platform Source: Company filings; Note: Financial data (including pro forma data) as of March 31, 2017. FB Financial data based on GAAP data. Clayton Bank and Trust and American City Bank based on regulatory data. Excludes purchase accounting adjustments.
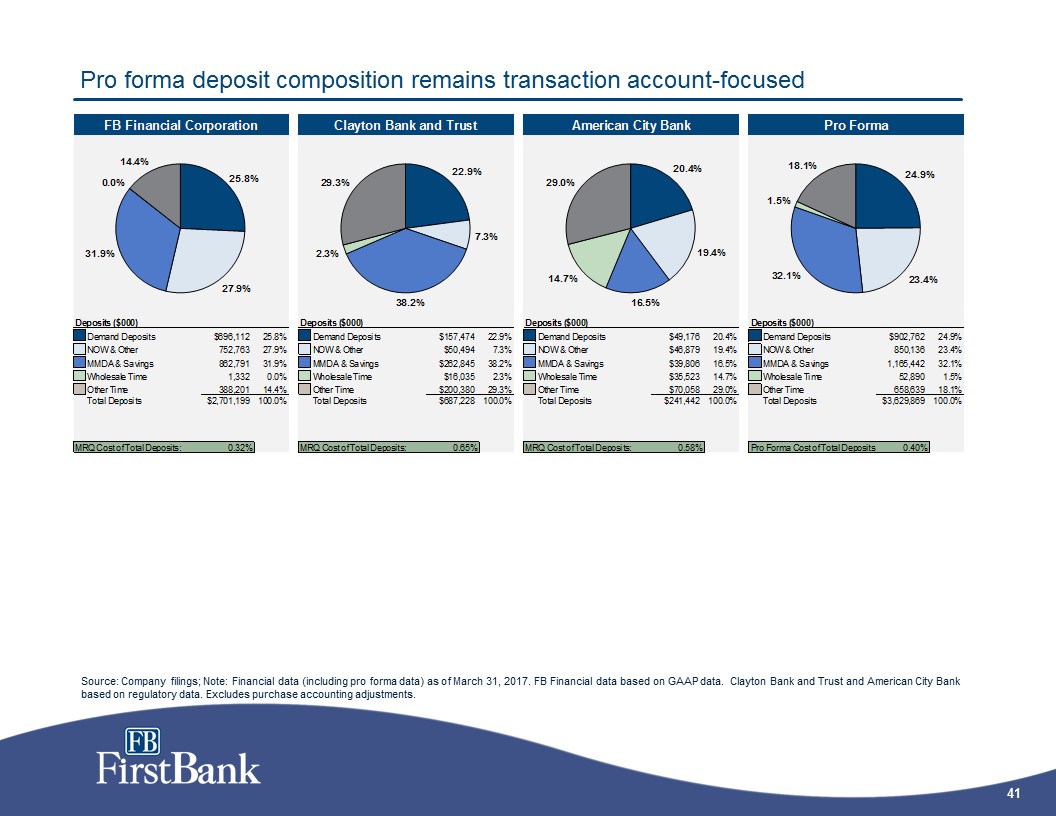
Pro forma deposit composition remains transaction account-focused Source: Company filings; Note: Financial data (including pro forma data) as of March 31, 2017. FB Financial data based on GAAP data. Clayton Bank and Trust and American City Bank based on regulatory data. Excludes purchase accounting adjustments.