Attached files
| file | filename |
|---|---|
| 8-K - 8-K - Gogo Inc. | d391585d8k.htm |
| EX-99.1 - EX-99.1 - Gogo Inc. | d391585dex991.htm |
1st Quarter 2017 Earnings Results Michael Small – Chief Executive Officer John Wade – Chief Operating Officer Barry Rowan– Incoming Chief Financial Officer May 4, 2017 Exhibit 99.2
SAFE HARBOR STATEMENT Safe Harbor Statement This presentation contains “forward-looking statements” within the meaning of Section 27A of the Securities Act of 1933 and Section 21E of the Securities Exchange Act of 1934 that are based on management’s beliefs and assumptions and on information currently available to management. Most forward-looking statements contain words that identify them as forward-looking, such as “anticipates,” “believes,” “continues,” “could,” “seeks,” “estimates,” “expects,” “intends,” “may,” “plans,” “potential,” “predicts,” “projects,” “should,” “will,” “would” or similar expressions and the negatives of those terms that relate to future events. Forward-looking statements involve known and unknown risks, uncertainties and other factors that may cause Gogo’s actual results, performance or achievements to be materially different from any projected results, performance or achievements expressed or implied by the forward-looking statements. Forward-looking statements represent the beliefs and assumptions of Gogo only as of the date of this presentation and Gogo undertakes no obligation to update or revise publicly any such forward-looking statements, whether as a result of new information, future events or otherwise. As such, Gogo’s future results may vary from any expectations or goals expressed in, or implied by, the forward-looking statements included in this presentation, possibly to a material degree. Gogo cannot assure you that the assumptions made in preparing any of the forward-looking statements will prove accurate or that any long-term financial or operational goals and targets will be realized. In particular, the availability and performance of certain technology solutions yet to be implemented by the Company set forth in this presentation represent aspirational long-term goals based on current expectations. For a discussion of some of the important factors that could cause Gogo’s results to differ materially from those expressed in, or implied by, the forward-looking statements included in this presentation, investors should refer to the disclosures contained under the headings “Risk Factors” and “Cautionary Note Regarding Forward-Looking Statements” in the Company’s Annual Report on Form 10-K and Quarterly Reports on Form 10-Q. Note to Certain Operating and Financial Data In addition to disclosing financial results that are determined in accordance with U.S. generally accepted accounting principles (“GAAP”), Gogo also discloses in this presentation certain non-GAAP financial information, including Adjusted EBITDA, Adjusted EBITDA margin and Cash CAPEX. These financial measures are not recognized measures under GAAP, and when analyzing our performance or liquidity, as applicable, investors should (i) use Adjusted EBITDA and Adjusted EBITDA margin in addition to, and not as an alternative to, net loss attributable to common stock as a measure of operating results, and (ii) use Cash CAPEX in addition to, and not as an alternative to, consolidated capital expenditures when evaluating our liquidity. See the Appendix for a reconciliation of each of Adjusted EBITDA and Cash CAPEX to the comparable GAAP measure. No reconciliation of the forecasted range for Adjusted EBITDA for fiscal 2017 is included in this release because we are unable to quantify certain amounts that would be required to be included in the respective corresponding GAAP measure without unreasonable efforts and we believe such reconciliations would imply a degree of precision that would be confusing or misleading to investors. In particular, we are not able to provide a reconciliation for the forecasted range of Adjusted EBITDA for 2017 due to variability in the timing of aircraft installations and de-installations impacting depreciation expense and amortization of deferred airborne leasing proceeds. In addition, this presentation contains various customer metrics and operating data, including numbers of aircraft or units online, that are based on internal company data, as well as information relating to the commercial and business aviation market, and our position within those markets. While management believes such information and data are reliable, they have not been verified by an independent source and there are inherent challenges and limitations involved in compiling data across various geographies and from various sources.
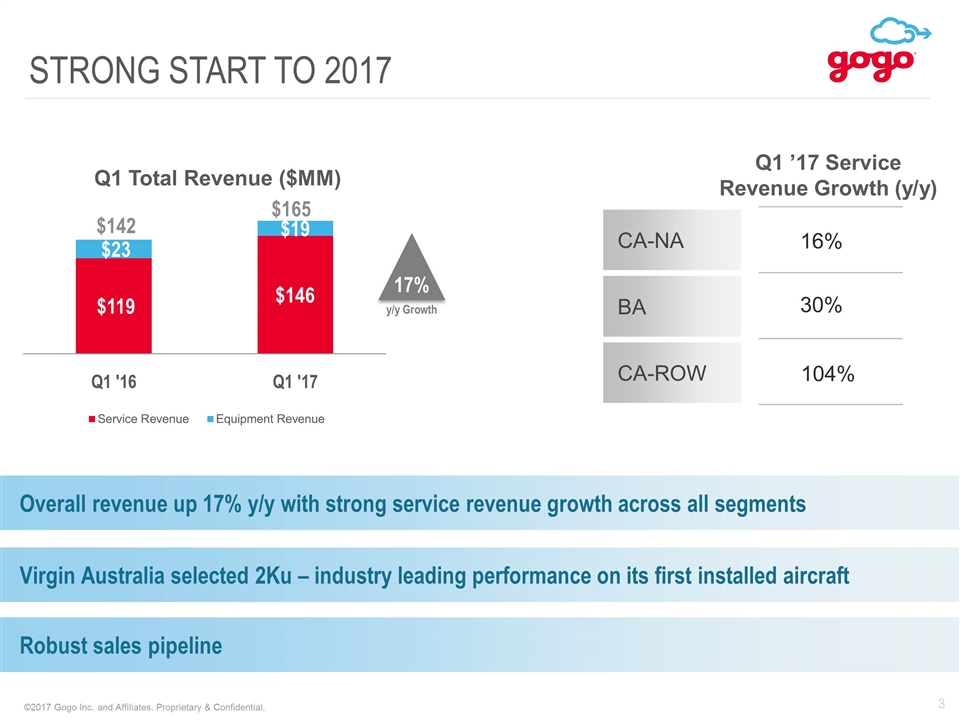
STRONG START TO 2017 $142 $165 17% y/y Growth Overall revenue up 17% y/y with strong service revenue growth across all segments Virgin Australia selected 2Ku – industry leading performance on its first installed aircraft Robust sales pipeline Q1 ’17 Service Revenue Growth (y/y) CA-NA CA-ROW BA 16% 104% 30%
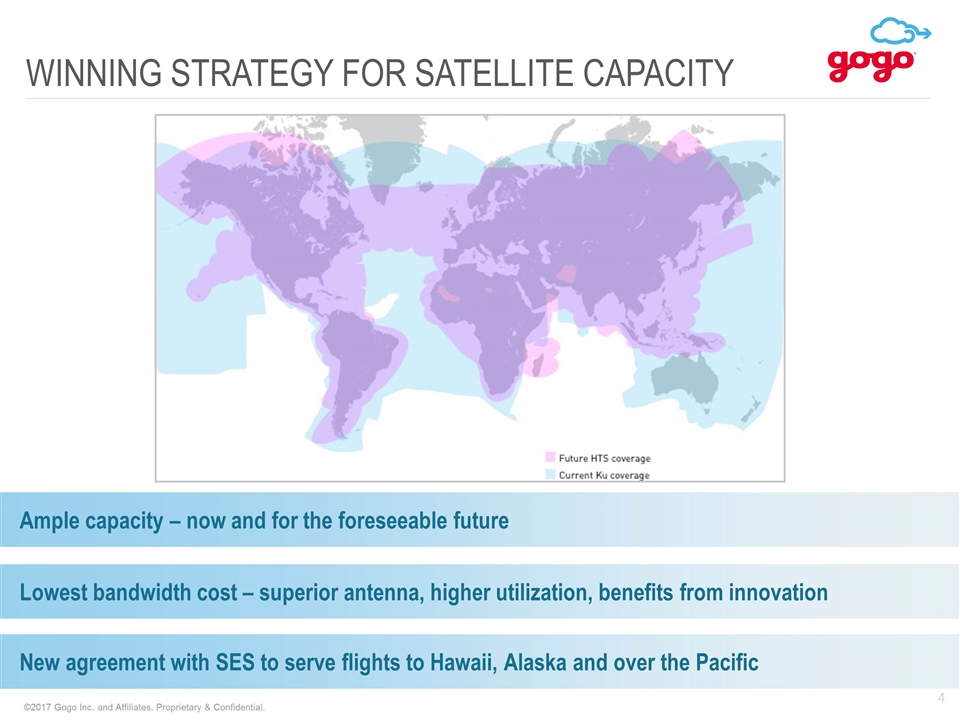
WINNING STRATEGY FOR SATELLITE CAPACITY Ample capacity – now and for the foreseeable future Lowest bandwidth cost – superior antenna, higher utilization, benefits from innovation New agreement with SES to serve flights to Hawaii, Alaska and over the Pacific
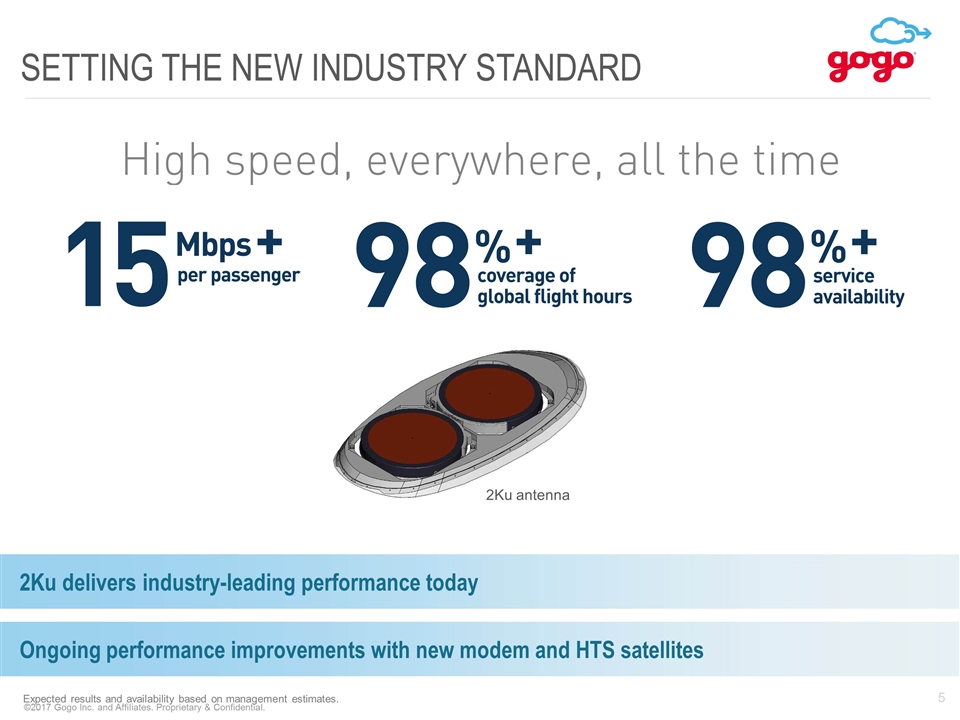
SETTING THE NEW INDUSTRY STANDARD Expected results and availability based on management estimates. 2Ku delivers industry-leading performance today Ongoing performance improvements with new modem and HTS satellites 2Ku antenna 5
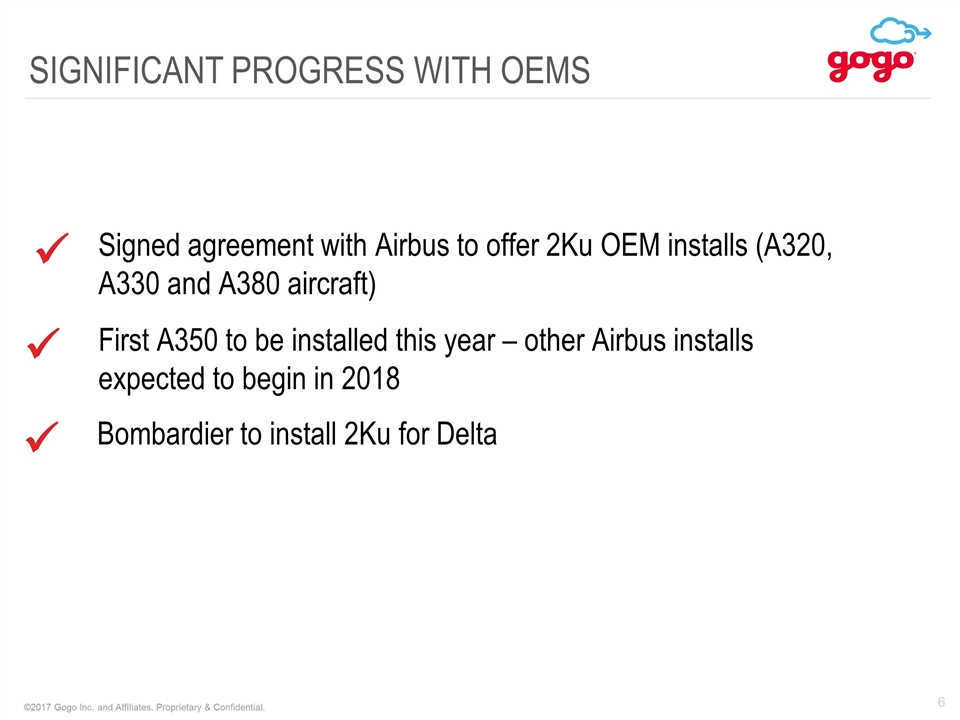
ü First A350 to be installed this year – other Airbus installs expected to begin in 2018 Signed agreement with Airbus to offer 2Ku OEM installs (A320, A330 and A380 aircraft) ü ü Bombardier to install 2Ku for Delta SIGNIFICANT PROGRESS WITH OEMS
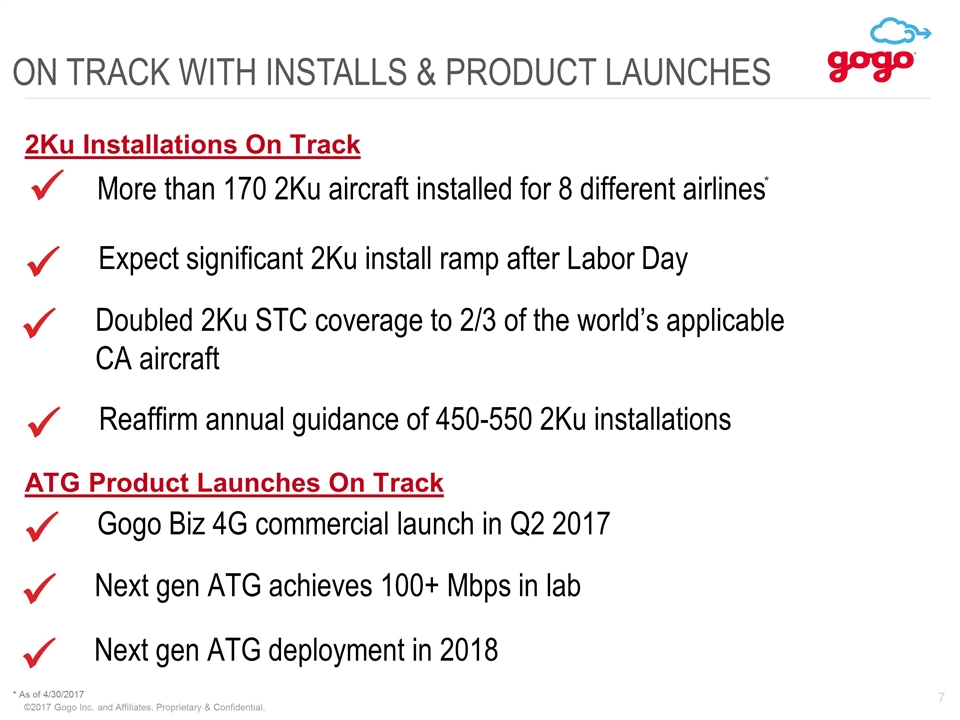
ü ON TRACK WITH INSTALLS & PRODUCT LAUNCHES Expect significant 2Ku install ramp after Labor Day More than 170 2Ku aircraft installed for 8 different airlines ü ü Gogo Biz 4G commercial launch in Q2 2017 ü Reaffirm annual guidance of 450-550 2Ku installations ü Doubled 2Ku STC coverage to 2/3 of the world’s applicable CA aircraft * * As of 4/30/2017 ü Next gen ATG achieves 100+ Mbps in lab 2Ku Installations On Track ATG Product Launches On Track ü Next gen ATG deployment in 2018 7
ü INTRODUCING NEW CFO Previously CFO at multiple public companies including Vonage and Nextel Partners Barry Rowan joined as EVP, Finance and will become Chief Financial Officer following the filing of the Q1 ’17 10-Q ü ü Long track record of success in achieving significant value creation
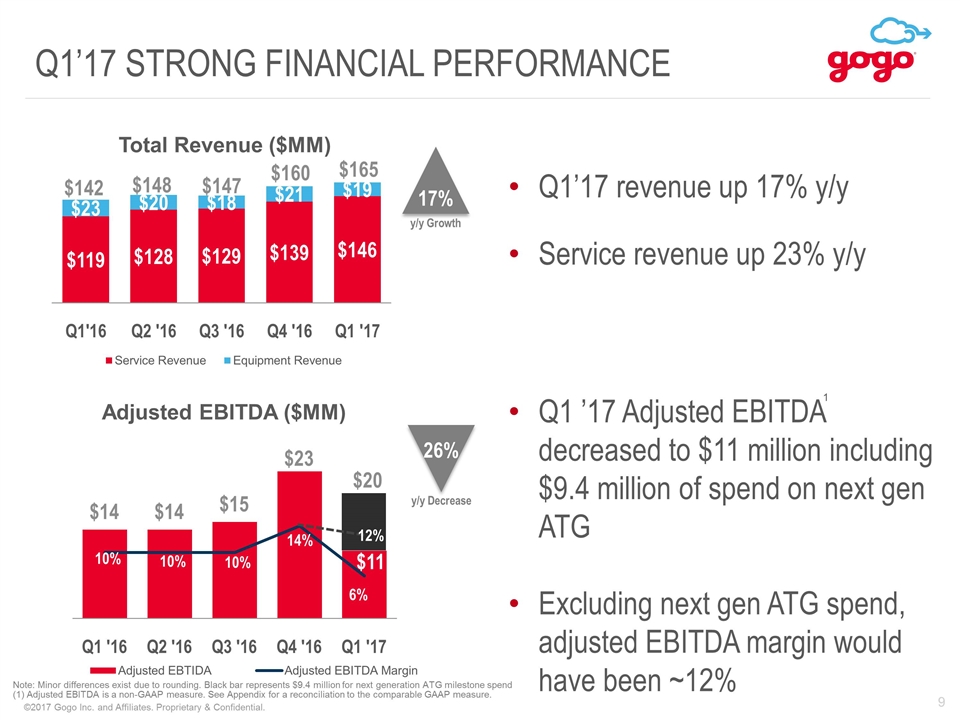
Q1’17 STRONG FINANCIAL PERFORMANCE 17% y/y Growth Q1’17 revenue up 17% y/y Service revenue up 23% y/y $142 $160 $148 $147 $165 Q1 ’17 Adjusted EBITDA decreased to $11 million including $9.4 million of spend on next gen ATG Excluding next gen ATG spend, adjusted EBITDA margin would have been ~12% Note: Minor differences exist due to rounding. Black bar represents $9.4 million for next generation ATG milestone spend (1) Adjusted EBITDA is a non-GAAP measure. See Appendix for a reconciliation to the comparable GAAP measure. 1 26% y/y Decrease 12% $20
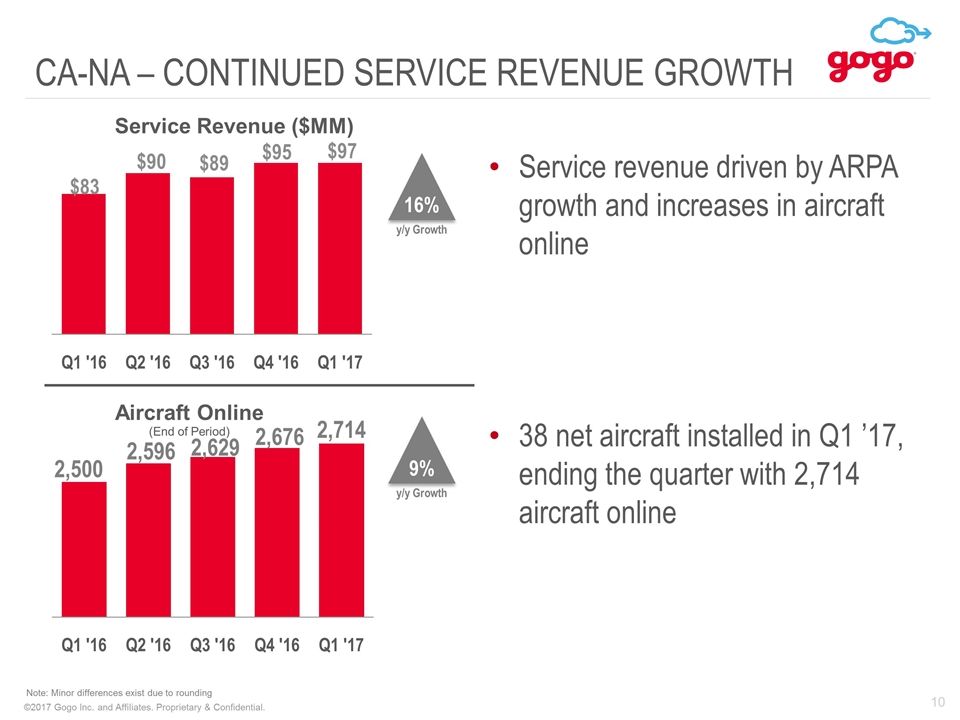
CA-NA – CONTINUED SERVICE REVENUE GROWTH 16% y/y Growth Service revenue driven by ARPA growth and increases in aircraft online 38 net aircraft installed in Q1 ’17, ending the quarter with 2,714 aircraft online 9% y/y Growth Note: Minor differences exist due to rounding
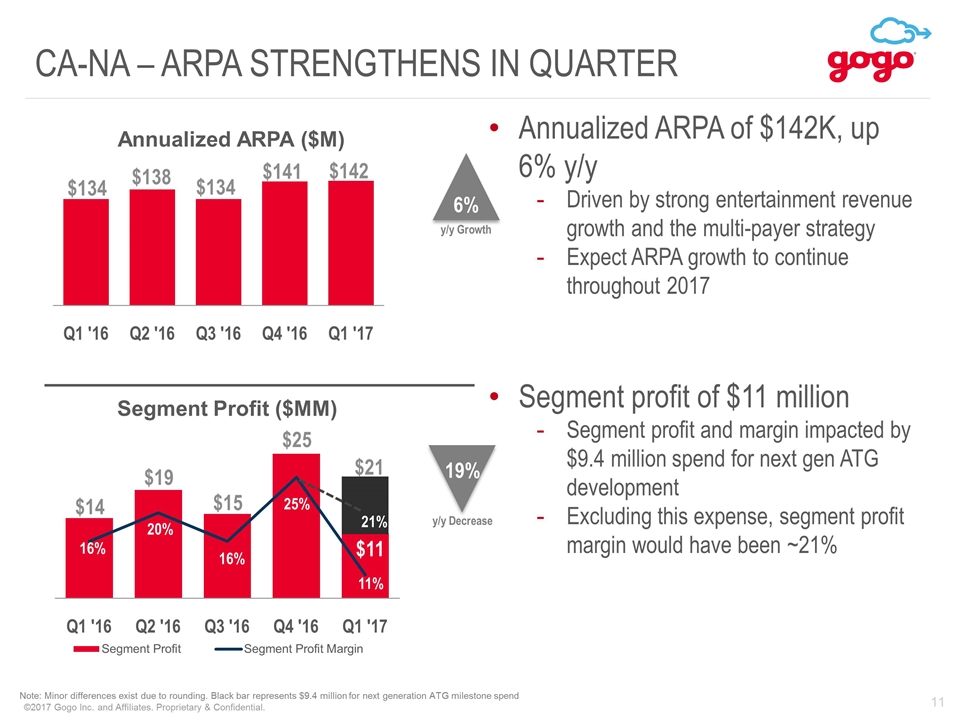
CA-NA – ARPA STRENGTHENS IN QUARTER Annualized ARPA of $142K, up 6% y/y Driven by strong entertainment revenue growth and the multi-payer strategy Expect ARPA growth to continue throughout 2017 Segment profit of $11 million Segment profit and margin impacted by $9.4 million spend for next gen ATG development Excluding this expense, segment profit margin would have been ~21% $134 $138 $134 $141 $142 19% y/y Decrease 6% y/y Growth 21% $21 Note: Minor differences exist due to rounding. Black bar represents $9.4 million for next generation ATG milestone spend
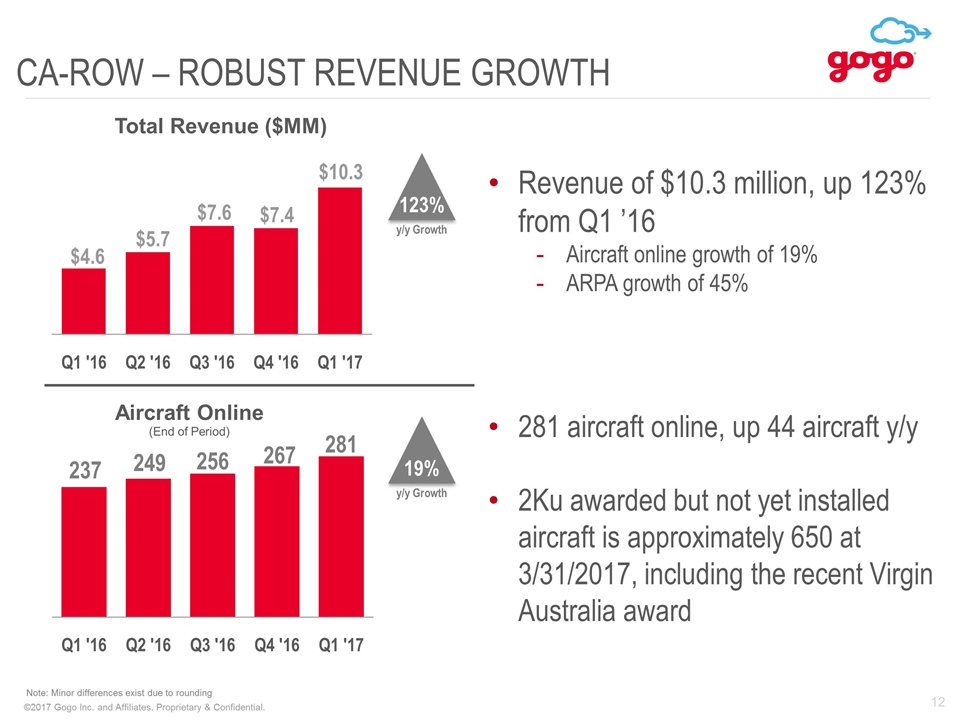
CA-ROW – ROBUST REVENUE GROWTH 123% y/y Growth 19% y/y Growth Note: Minor differences exist due to rounding Revenue of $10.3 million, up 123% from Q1 ’16 Aircraft online growth of 19% ARPA growth of 45% 281 aircraft online, up 44 aircraft y/y 2Ku awarded but not yet installed aircraft is approximately 650 at 3/31/2017, including the recent Virgin Australia award
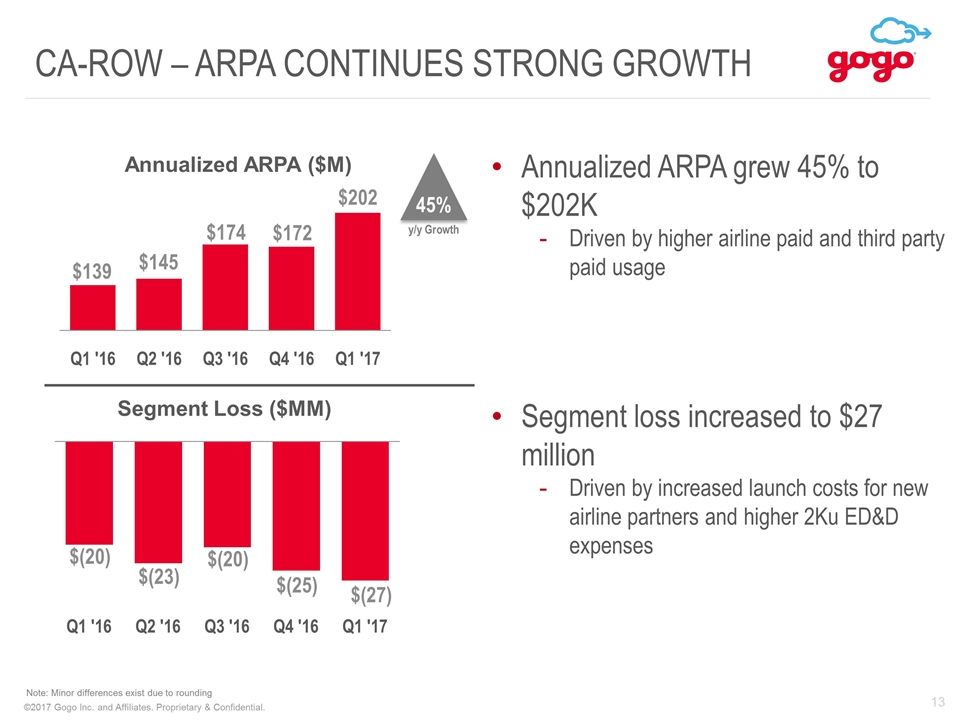
CA-ROW – ARPA CONTINUES STRONG GROWTH Note: Minor differences exist due to rounding $139 $202 45% y/y Growth Annualized ARPA grew 45% to $202K Driven by higher airline paid and third party paid usage Segment loss increased to $27 million Driven by increased launch costs for new airline partners and higher 2Ku ED&D expenses $145 $174 $172
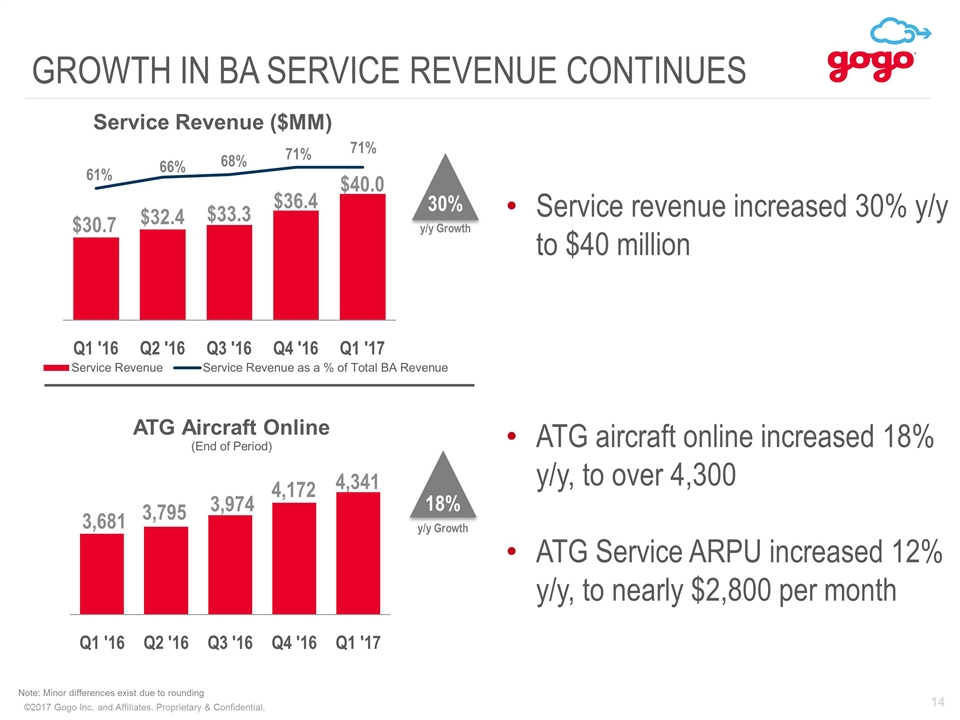
GROWTH IN BA SERVICE REVENUE CONTINUES Service revenue increased 30% y/y to $40 million ATG aircraft online increased 18% y/y, to over 4,300 ATG Service ARPU increased 12% y/y, to nearly $2,800 per month 30% y/y Growth 61% Note: Minor differences exist due to rounding 66% 68% 71% 71% 18% y/y Growth
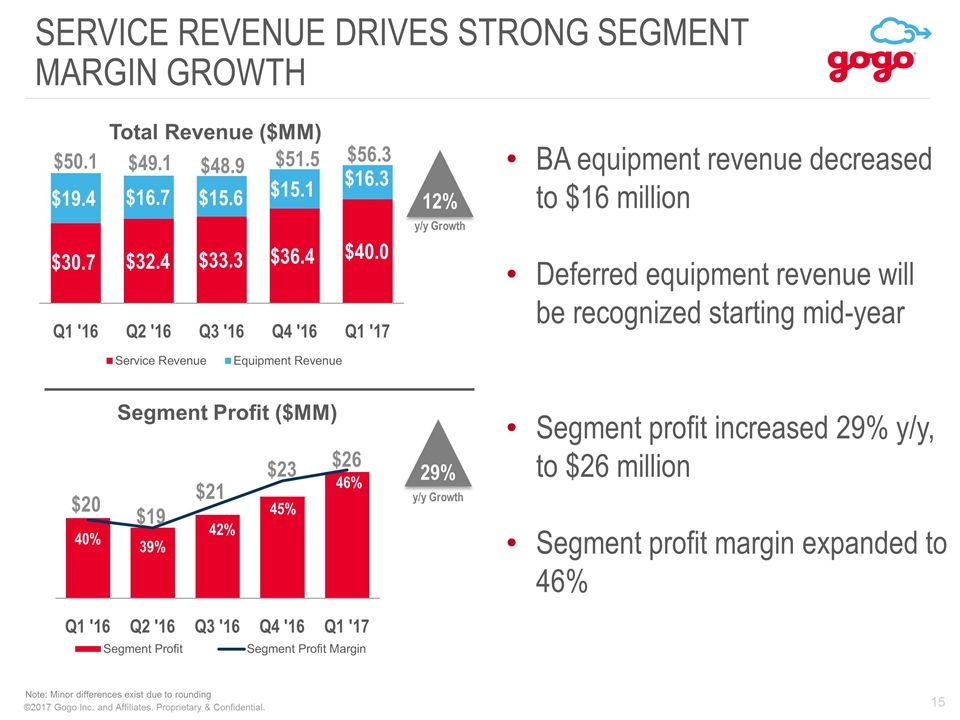
SERVICE REVENUE drives STRONG segment MARGIN GROWTH BA equipment revenue decreased to $16 million Deferred equipment revenue will be recognized starting mid-year Segment profit increased 29% y/y, to $26 million Segment profit margin expanded to 46% Note: Minor differences exist due to rounding 29% y/y Growth 12% y/y Growth $50.1 $49.1 $48.9 $51.5 $56.3
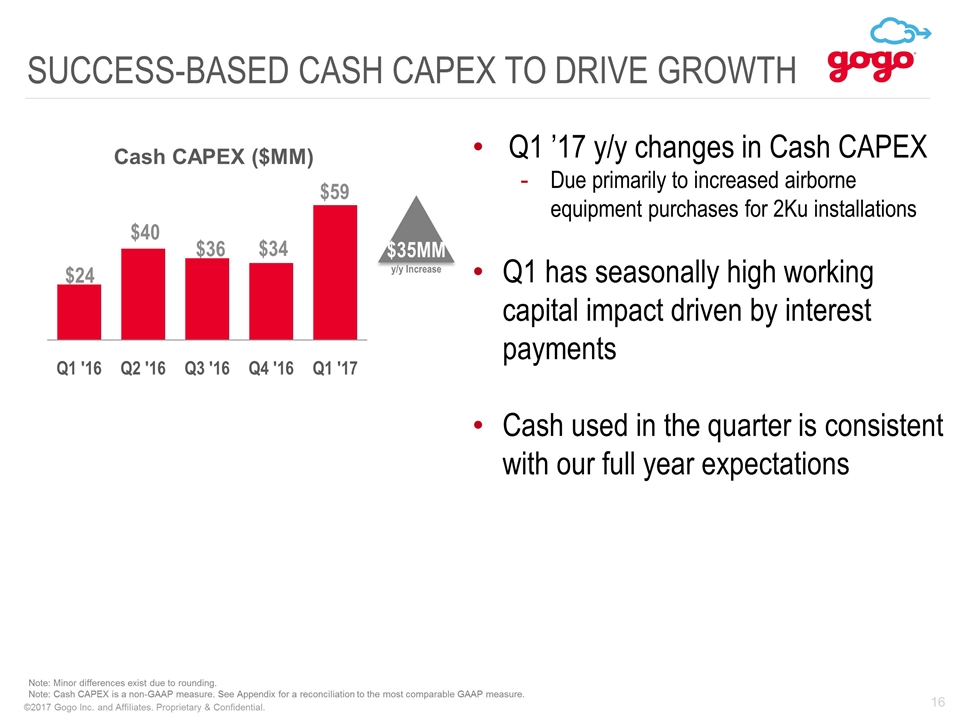
SUCCESS-BASED Cash CAPEX TO DRIVE GROWTH 16 Note: Minor differences exist due to rounding. Note: Cash CAPEX is a non-GAAP measure. See Appendix for a reconciliation to the most comparable GAAP measure. $35MM y/y Increase Q1 ’17 y/y changes in Cash CAPEX Due primarily to increased airborne equipment purchases for 2Ku installations Q1 has seasonally high working capital impact driven by interest payments Cash used in the quarter is consistent with our full year expectations
ü Strong financial performance in Q1 Q1 KEY TAKEAWAYS Reaffirming 2017 and long-term guidance ü 17

Q&A
Appendix
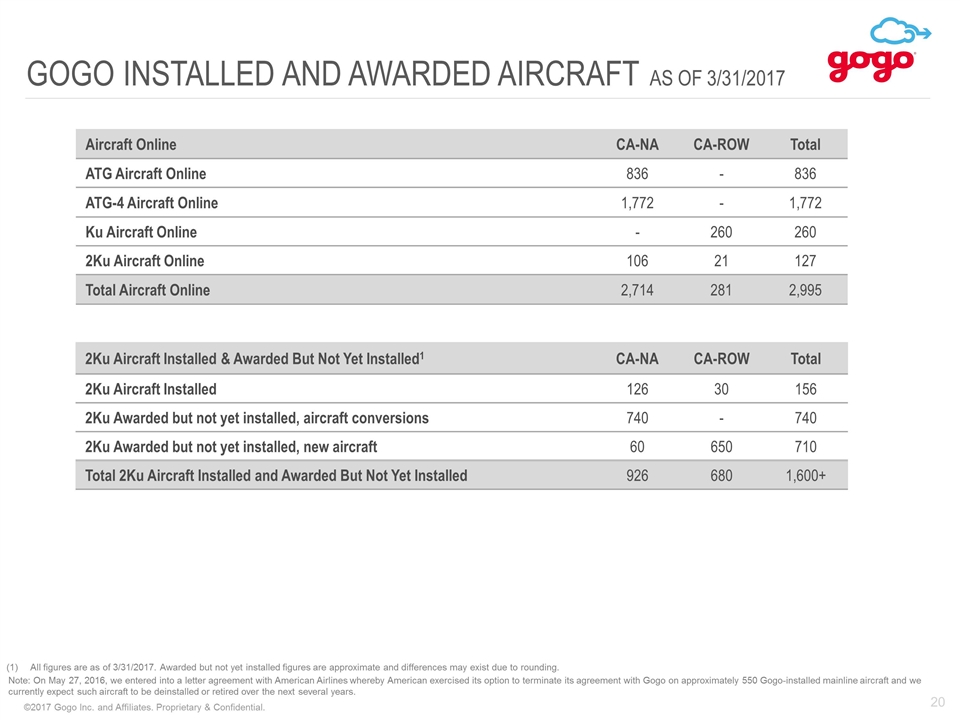
GOGO INSTALLED AND AWARDED AIRCRAFT AS OF 3/31/2017 All figures are as of 3/31/2017. Awarded but not yet installed figures are approximate and differences may exist due to rounding. Note: On May 27, 2016, we entered into a letter agreement with American Airlines whereby American exercised its option to terminate its agreement with Gogo on approximately 550 Gogo-installed mainline aircraft and we currently expect such aircraft to be deinstalled or retired over the next several years. Aircraft Online CA-NA CA-ROW Total ATG Aircraft Online 836 - 836 ATG-4 Aircraft Online 1,772 - 1,772 Ku Aircraft Online - 260 260 2Ku Aircraft Online 106 21 127 Total Aircraft Online 2,714 281 2,995 2Ku Aircraft Installed & Awarded But Not Yet Installed1 CA-NA CA-ROW Total 2Ku Aircraft Installed 126 30 156 2Ku Awarded but not yet installed, aircraft conversions 740 - 740 2Ku Awarded but not yet installed, new aircraft 60 650 710 Total 2Ku Aircraft Installed and Awarded But Not Yet Installed 926 680 1,600+
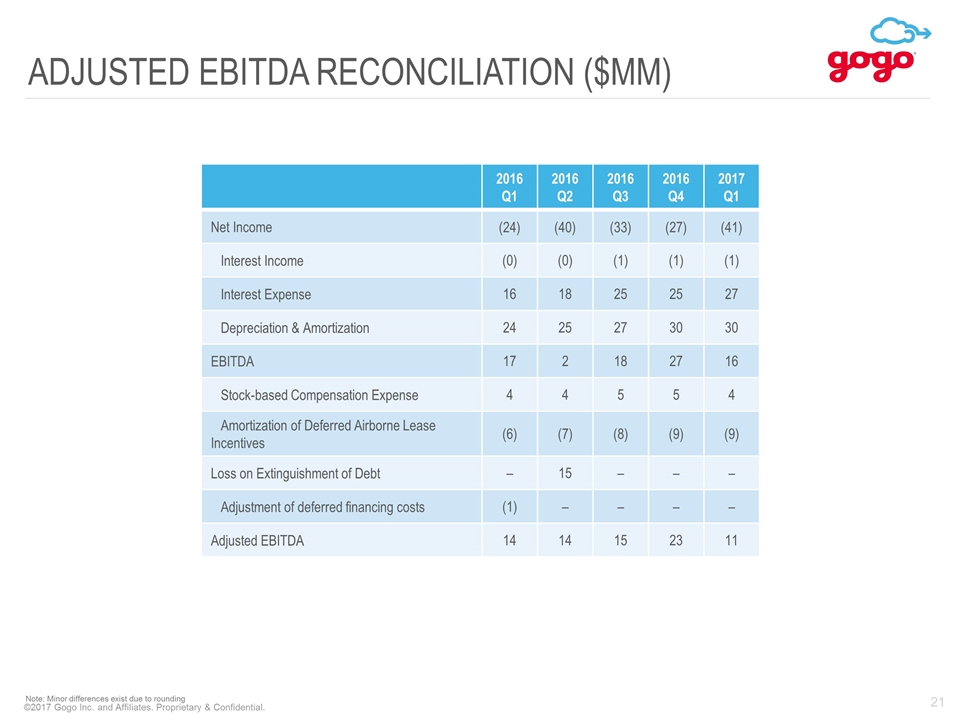
ADJUSTED EBITDA RECONCILIATION ($MM) 2016 Q1 2016 Q2 2016 Q3 2016 Q4 2017 Q1 Net Income (24) (40) (33) (27) (41) Interest Income (0) (0) (1) (1) (1) Interest Expense 16 18 25 25 27 Depreciation & Amortization 24 25 27 30 30 EBITDA 17 2 18 27 16 Stock-based Compensation Expense 4 4 5 5 4 Amortization of Deferred Airborne Lease Incentives (6) (7) (8) (9) (9) Loss on Extinguishment of Debt – 15 – – – Adjustment of deferred financing costs (1) – – – – Adjusted EBITDA 14 14 15 23 11 Note: Minor differences exist due to rounding
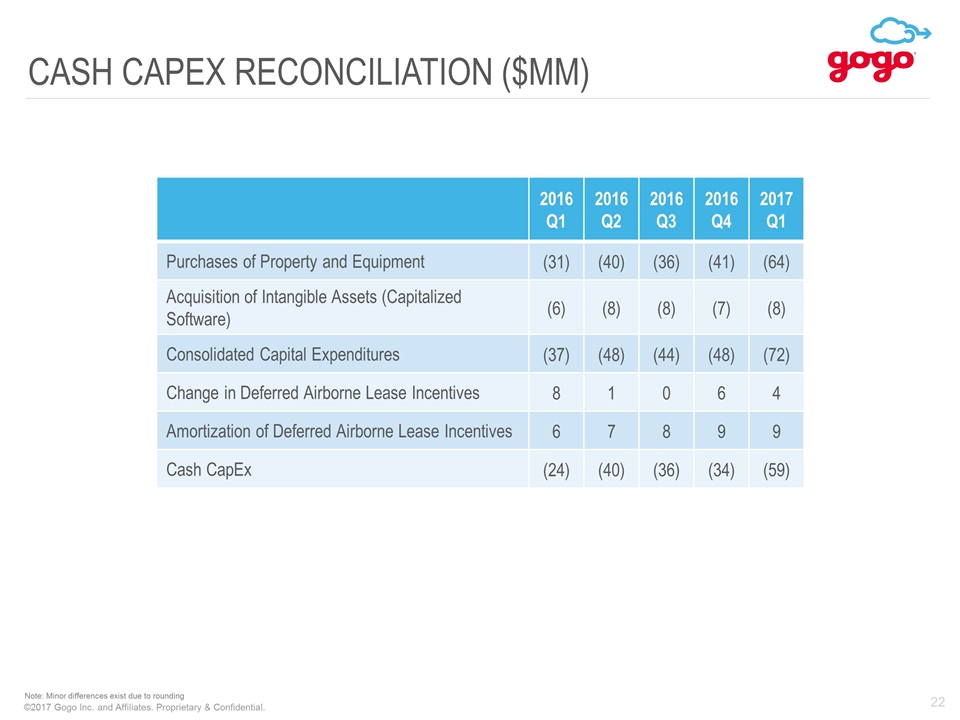
CASH CAPEX RECONCILIATION ($MM) 2016 Q1 2016 Q2 2016 Q3 2016 Q4 2017 Q1 Purchases of Property and Equipment (31) (40) (36) (41) (64) Acquisition of Intangible Assets (Capitalized Software) (6) (8) (8) (7) (8) Consolidated Capital Expenditures (37) (48) (44) (48) (72) Change in Deferred Airborne Lease Incentives 8 1 0 6 4 Amortization of Deferred Airborne Lease Incentives 6 7 8 9 9 Cash CapEx (24) (40) (36) (34) (59) Note: Minor differences exist due to rounding
