Attached files
| file | filename |
|---|---|
| 8-K - 8-K - GARTNER INC | it-03312017x8xk.htm |
| EX-99.1 - EXHIBIT 99.1 - GARTNER INC | it-03312017xex991.htm |

0 CONFIDENTIAL AND PROPRIETARY I © 2017 Gartner, Inc. and/or its affiliates. All rights reserved.
First Quarter 2017 Results
May 4th, 2017
1 CONFIDENTIAL AND PROPRIETARY I © 2017 Gartner, Inc. and/or its affiliates. All rights reserved.
Statements contained in this presentation regarding the growth and prospects of the business, the Company’s projected
2017 financial results, long-term objectives and all other statements in this presentation other than recitation of historical
facts are forward looking statements (as defined in the Private Securities Litigation Reform Act of 1995). Such forward
looking statements involve known and unknown risks, uncertainties and other factors; consequently, actual results may
differ materially from those expressed or implied thereby.
Factors that could cause actual results to differ materially include, but are not limited to, the ability to achieve and effectively
manage growth, including the ability to integrate our recent CEB acquisition, other acquisitions and consummate
acquisitions in the future; the ability to pay Gartner’s debt obligations, which have increased substantially with the recent
CEB acquisition; the ability to maintain and expand Gartner’s products and services; the ability to expand or retain Gartner’s
customer base; the ability to grow or sustain revenue from individual customers; the ability to attract and retain a
professional staff of research analysts and consultants upon whom Gartner is dependent; the ability to achieve continued
customer renewals and achieve new contract value, backlog and deferred revenue growth in light of competitive pressures;
the ability to carry out Gartner’s strategic initiatives and manage associated costs; the ability to successfully compete with
existing competitors and potential new competitors; the ability to enforce and protect our intellectual property rights;
additional risks associated with international operations including foreign currency fluctuations; the impact of restructuring
and other charges on Gartner’s businesses and operations; general economic conditions; risks associated with the credit
worthiness and budget cuts of governments and agencies; and other risks listed from time to time in Gartner’s reports filed
with the Securities and Exchange Commission, including Gartner’s most recent Annual Report on Form 10-K and Quarterly
Reports on Form 10-Q.
The Company’s SEC filings can be found on Gartner’s website at investor.gartner.com and on the SEC’s website at
www.sec.gov.. Forward looking statements included herein speak only as of May 4, 2017 and the Company disclaims
any obligation to revise or update such statements to reflect events or circumstances after this date or to reflect the
occurrence of unanticipated events or circumstances.
Forward Looking Statements
2 CONFIDENTIAL AND PROPRIETARY I © 2017 Gartner, Inc. and/or its affiliates. All rights reserved.
First Quarter 2017: Highlights
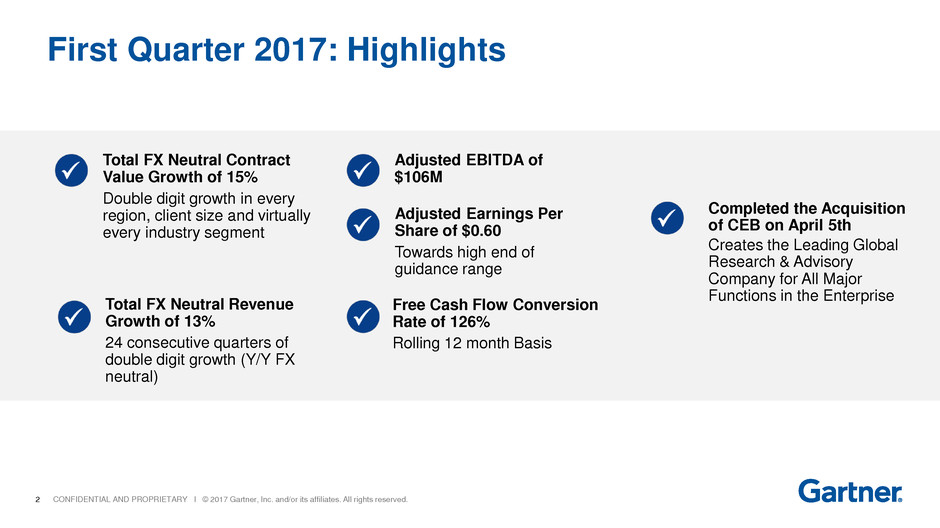
Total FX Neutral Contract
Value Growth of 15%
Double digit growth in every
region, client size and virtually
every industry segment
Total FX Neutral Revenue
Growth of 13%
24 consecutive quarters of
double digit growth (Y/Y FX
neutral)
Adjusted EBITDA of
$106M
Free Cash Flow Conversion
Rate of 126%
Rolling 12 month Basis
Completed the Acquisition
of CEB on April 5th
Creates the Leading Global
Research & Advisory
Company for All Major
Functions in the Enterprise
Adjusted Earnings Per
Share of $0.60
Towards high end of
guidance range
3 CONFIDENTIAL AND PROPRIETARY I © 2017 Gartner, Inc. and/or its affiliates. All rights reserved.
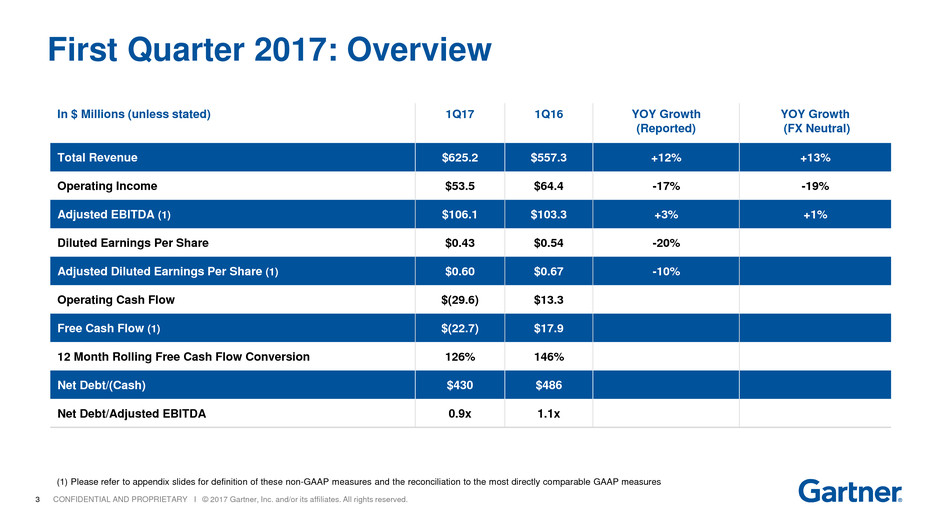
In $ Millions (unless stated) 1Q17 1Q16 YOY Growth
(Reported)
YOY Growth
(FX Neutral)
Total Revenue $625.2 $557.3 +12% +13%
Operating Income $53.5 $64.4 -17% -19%
Adjusted EBITDA (1) $106.1 $103.3 +3% +1%
Diluted Earnings Per Share $0.43 $0.54 -20%
Adjusted Diluted Earnings Per Share (1) $0.60 $0.67 -10%
Operating Cash Flow $(29.6) $13.3
Free Cash Flow (1) $(22.7) $17.9
12 Month Rolling Free Cash Flow Conversion 126% 146%
Net Debt/(Cash) $430 $486
Net Debt/Adjusted EBITDA 0.9x 1.1x
First Quarter 2017: Overview
(1) Please refer to appendix slides for definition of these non-GAAP measures and the reconciliation to the most directly comparable GAAP measures
4 CONFIDENTIAL AND PROPRIETARY I © 2017 Gartner, Inc. and/or its affiliates. All rights reserved.
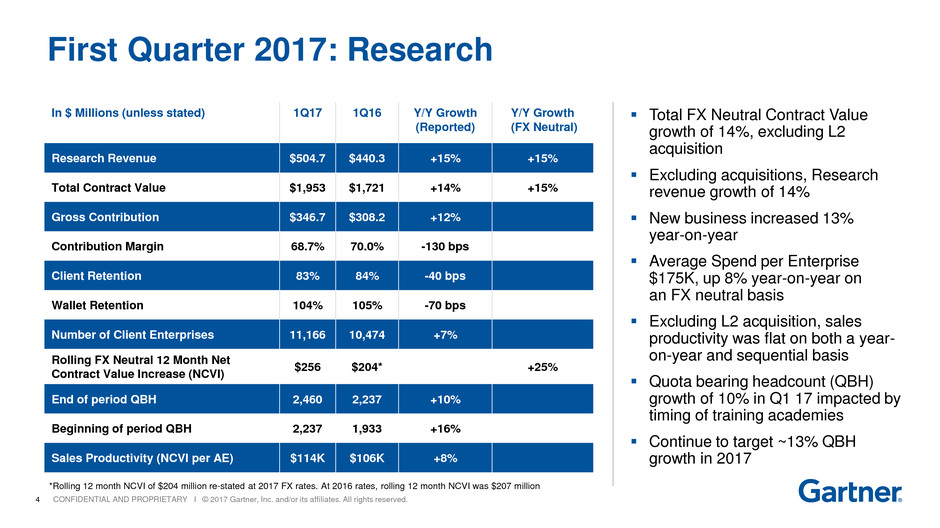
In $ Millions (unless stated) 1Q17 1Q16 Y/Y Growth
(Reported)
Y/Y Growth
(FX Neutral)
Research Revenue $504.7 $440.3 +15% +15%
Total Contract Value $1,953 $1,721 +14% +15%
Gross Contribution $346.7 $308.2 +12%
Contribution Margin 68.7% 70.0% -130 bps
Client Retention 83% 84% -40 bps
Wallet Retention 104% 105% -70 bps
Number of Client Enterprises 11,166 10,474 +7%
Rolling FX Neutral 12 Month Net
Contract Value Increase (NCVI)
$256 $204* +25%
End of period QBH 2,460 2,237 +10%
Beginning of period QBH 2,237 1,933 +16%
Sales Productivity (NCVI per AE) $114K $106K +8%
First Quarter 2017: Research
Total FX Neutral Contract Value
growth of 14%, excluding L2
acquisition
Excluding acquisitions, Research
revenue growth of 14%
New business increased 13%
year-on-year
Average Spend per Enterprise
$175K, up 8% year-on-year on
an FX neutral basis
Excluding L2 acquisition, sales
productivity was flat on both a year-
on-year and sequential basis
Quota bearing headcount (QBH)
growth of 10% in Q1 17 impacted by
timing of training academies
Continue to target ~13% QBH
growth in 2017
*Rolling 12 month NCVI of $204 million re-stated at 2017 FX rates. At 2016 rates, rolling 12 month NCVI was $207 million
5 CONFIDENTIAL AND PROPRIETARY I © 2017 Gartner, Inc. and/or its affiliates. All rights reserved.
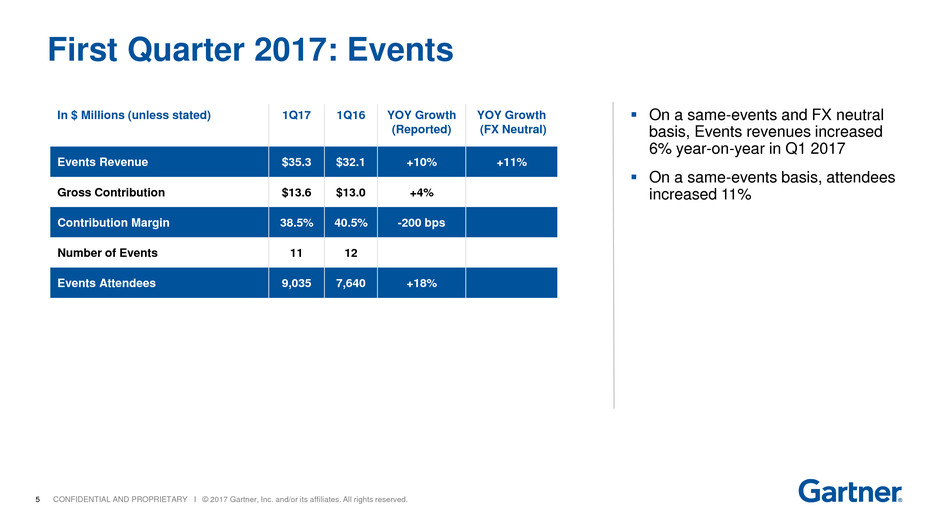
In $ Millions (unless stated) 1Q17 1Q16 YOY Growth
(Reported)
YOY Growth
(FX Neutral)
Events Revenue $35.3 $32.1 +10% +11%
Gross Contribution $13.6 $13.0 +4%
Contribution Margin 38.5% 40.5% -200 bps
Number of Events 11 12
Events Attendees 9,035 7,640 +18%
First Quarter 2017: Events
On a same-events and FX neutral
basis, Events revenues increased
6% year-on-year in Q1 2017
On a same-events basis, attendees
increased 11%
6 CONFIDENTIAL AND PROPRIETARY I © 2017 Gartner, Inc. and/or its affiliates. All rights reserved.
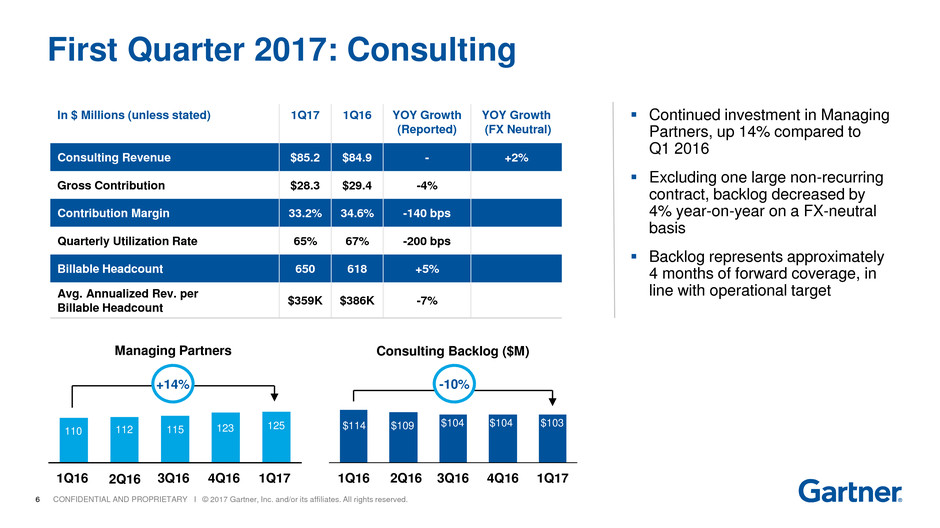
In $ Millions (unless stated) 1Q17 1Q16 YOY Growth
(Reported)
YOY Growth
(FX Neutral)
Consulting Revenue $85.2 $84.9 - +2%
Gross Contribution $28.3 $29.4 -4%
Contribution Margin 33.2% 34.6% -140 bps
Quarterly Utilization Rate 65% 67% -200 bps
Billable Headcount 650 618 +5%
Avg. Annualized Rev. per
Billable Headcount
$359K $386K -7%
First Quarter 2017: Consulting
Continued investment in Managing
Partners, up 14% compared to
Q1 2016
Excluding one large non-recurring
contract, backlog decreased by
4% year-on-year on a FX-neutral
basis
Backlog represents approximately
4 months of forward coverage, in
line with operational target
110 112 115 123
4Q163Q162Q161Q16 1Q17 3Q162Q161Q16
$114
4Q16 1Q17
Managing Partners Consulting Backlog ($M)
+14% -10%
$109 $104$104 $103125
7 CONFIDENTIAL AND PROPRIETARY I © 2017 Gartner, Inc. and/or its affiliates. All rights reserved.
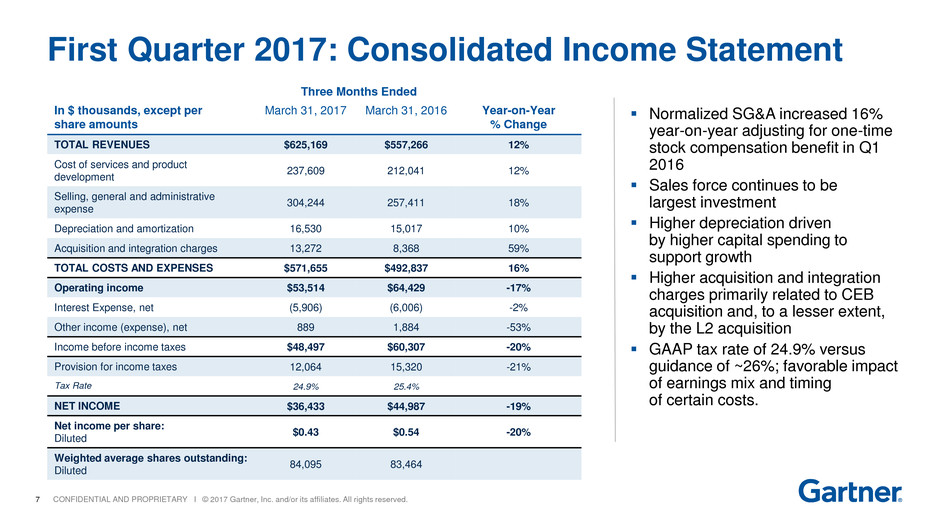
First Quarter 2017: Consolidated Income Statement
In $ thousands, except per
share amounts
March 31, 2017 March 31, 2016 Year-on-Year
% Change
TOTAL REVENUES $625,169 $557,266 12%
Cost of services and product
development
237,609 212,041 12%
Selling, general and administrative
expense
304,244 257,411 18%
Depreciation and amortization 16,530 15,017 10%
Acquisition and integration charges 13,272 8,368 59%
TOTAL COSTS AND EXPENSES $571,655 $492,837 16%
Operating income $53,514 $64,429 -17%
Interest Expense, net (5,906) (6,006) -2%
Other income (expense), net 889 1,884 -53%
Income before income taxes $48,497 $60,307 -20%
Provision for income taxes 12,064 15,320 -21%
Tax Rate 24.9% 25.4%
NET INCOME $36,433 $44,987 -19%
Net income per share:
Diluted
$0.43 $0.54 -20%
Weighted average shares outstanding:
Diluted
84,095 83,464
Normalized SG&A increased 16%
year-on-year adjusting for one-time
stock compensation benefit in Q1
2016
Sales force continues to be
largest investment
Higher depreciation driven
by higher capital spending to
support growth
Higher acquisition and integration
charges primarily related to CEB
acquisition and, to a lesser extent,
by the L2 acquisition
GAAP tax rate of 24.9% versus
guidance of ~26%; favorable impact
of earnings mix and timing
of certain costs.
Three Months Ended

8 CONFIDENTIAL AND PROPRIETARY I © 2017 Gartner, Inc. and/or its affiliates. All rights reserved.
First Quarter 2017: Adjusted Earnings Per Share(a)
In $ thousands, except per
share amounts
March 31, 2017 March 31, 2016 Year-on-Year
% Change
Net Income $36,433 $44,987 -19%
Acquisition and other adjustments:
Amortization of acquired intangibles (b) 6,196 6,089 N/M
Acquisition and integration adjustments (c) 13,415 8,368 N/M
Tax impact of adjustments (d) (5,406) (3,715) N/M
Adjusted net income $50,638 $55,729 -9%
Adjusted diluted earnings per share (e):
Diluted $0.60 $0.67 -10%
Weighted average shares outstanding:
Diluted 84,095 83,464
a) Adjusted earnings per share represents GAAP diluted earnings per share adjusted for the impact of certain items directly related to acquisitions and other items.
b) Consists of non-cash amortization charges from acquired intangibles.
c) Consists of directly-related incremental charges and adjustments from acquisitions.
d) The effective tax rates were 28% and 26% for the three months ended March 31, 2017 and 2016, respectively.
e) The EPS is calculated based on 84.1 million shares and 83.5 million shares for the three months ended March 31, 2017 and 2016, respectively.
Three Months Ended
9 CONFIDENTIAL AND PROPRIETARY I © 2017 Gartner, Inc. and/or its affiliates. All rights reserved.
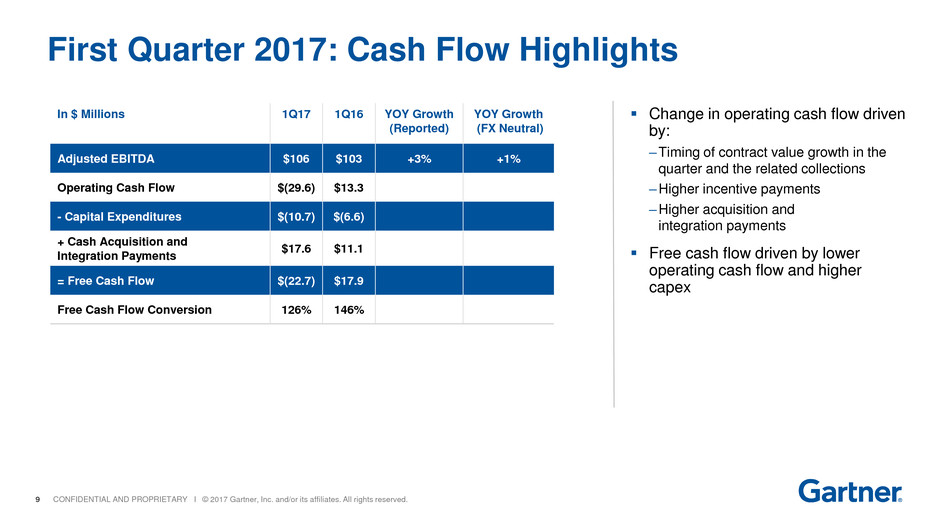
In $ Millions 1Q17 1Q16 YOY Growth
(Reported)
YOY Growth
(FX Neutral)
Adjusted EBITDA $106 $103 +3% +1%
Operating Cash Flow $(29.6) $13.3
- Capital Expenditures $(10.7) $(6.6)
+ Cash Acquisition and
Integration Payments
$17.6 $11.1
= Free Cash Flow $(22.7) $17.9
Free Cash Flow Conversion 126% 146%
First Quarter 2017: Cash Flow Highlights
Change in operating cash flow driven
by:
–Timing of contract value growth in the
quarter and the related collections
–Higher incentive payments
–Higher acquisition and
integration payments
Free cash flow driven by lower
operating cash flow and higher
capex
10 CONFIDENTIAL AND PROPRIETARY I © 2017 Gartner, Inc. and/or its affiliates. All rights reserved.
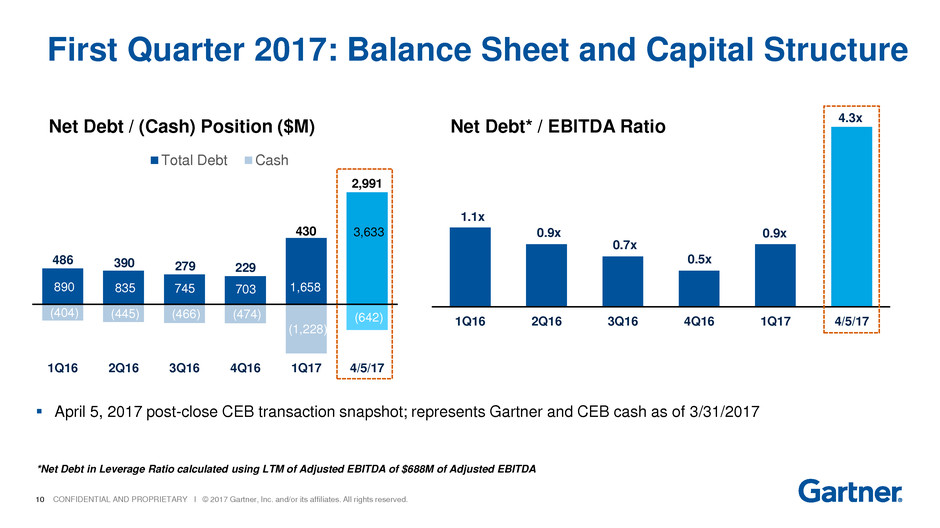
1.1x
0.9x
0.7x
0.5x
0.9x
4.3x
1Q16 2Q16 3Q16 4Q16 1Q17 4/5/17
April 5, 2017 post-close CEB transaction snapshot; represents Gartner and CEB cash as of 3/31/2017
Net Debt / (Cash) Position ($M) Net Debt* / EBITDA Ratio
First Quarter 2017: Balance Sheet and Capital Structure
890 835 745 703 1,658
3,633
(404) (445) (466) (474)
(1,228)
(642)
1Q16 2Q16 3Q16 4Q16 1Q17 4/5/17
Total Debt Cash
486 390 279 229
430
2,991
*Net Debt in Leverage Ratio calculated using LTM of Adjusted EBITDA of $688M of Adjusted EBITDA
11 CONFIDENTIAL AND PROPRIETARY I © 2017 Gartner, Inc. and/or its affiliates. All rights reserved.
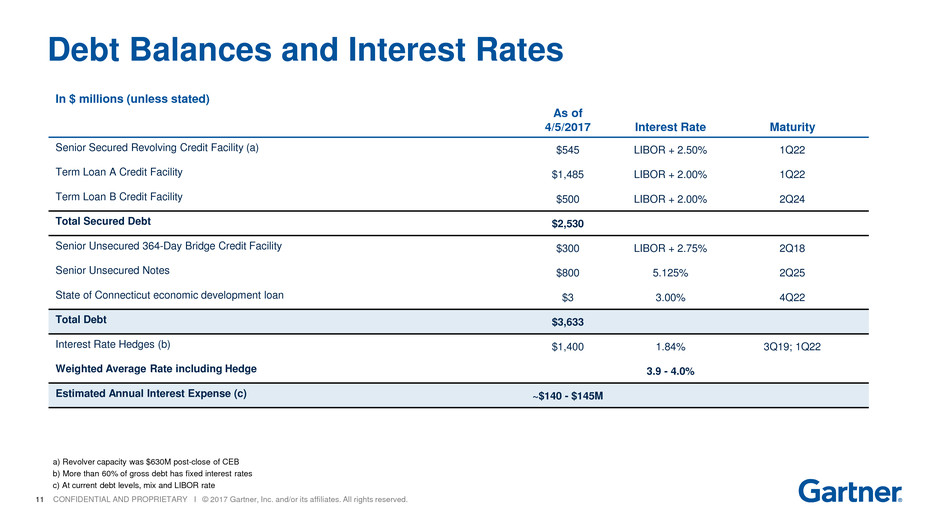
In $ millions (unless stated)
As of
4/5/2017 Interest Rate Maturity
Senior Secured Revolving Credit Facility (a) $545 LIBOR + 2.50% 1Q22
Term Loan A Credit Facility $1,485 LIBOR + 2.00% 1Q22
Term Loan B Credit Facility $500 LIBOR + 2.00% 2Q24
Total Secured Debt $2,530
Senior Unsecured 364-Day Bridge Credit Facility $300 LIBOR + 2.75% 2Q18
Senior Unsecured Notes $800 5.125% 2Q25
State of Connecticut economic development loan $3 3.00% 4Q22
Total Debt $3,633
Interest Rate Hedges (b) $1,400 1.84% 3Q19; 1Q22
Weighted Average Rate including Hedge 3.9 - 4.0%
Estimated Annual Interest Expense (c) ~$140 - $145M
Debt Balances and Interest Rates
a) Revolver capacity was $630M post-close of CEB
b) More than 60% of gross debt has fixed interest rates
c) At current debt levels, mix and LIBOR rate

12 CONFIDENTIAL AND PROPRIETARY I © 2017 Gartner, Inc. and/or its affiliates. All rights reserved.
First Quarter 2017
Financial Highlights

13 CONFIDENTIAL AND PROPRIETARY I © 2017 Gartner, Inc. and/or its affiliates. All rights reserved.
CEB First Quarter 2017: Highlights(1)
Total Adjusted
Revenue of $214M(2)
Adjusted EBITDA
of $36M(2)
CEB Segment Contract
Value declined by
approximately 1%*
Core CEB Wallet
Retention of 89%*
Increased 1pt
sequentially
*CEB Segment Contract Value and Wallet Retention based on constant currency
(1) Above results are what CEB would have reported as an independent company
(2) Please refer to appendix slides for definition of these non-GAAP measures and reconciliation to the most directly comparable GAAP measures

14 CONFIDENTIAL AND PROPRIETARY I © 2017 Gartner, Inc. and/or its affiliates. All rights reserved.
Fiscal Year 2017
Outlook
15 CONFIDENTIAL AND PROPRIETARY I © 2017 Gartner, Inc. and/or its affiliates. All rights reserved.
Updated 2017 Guidance
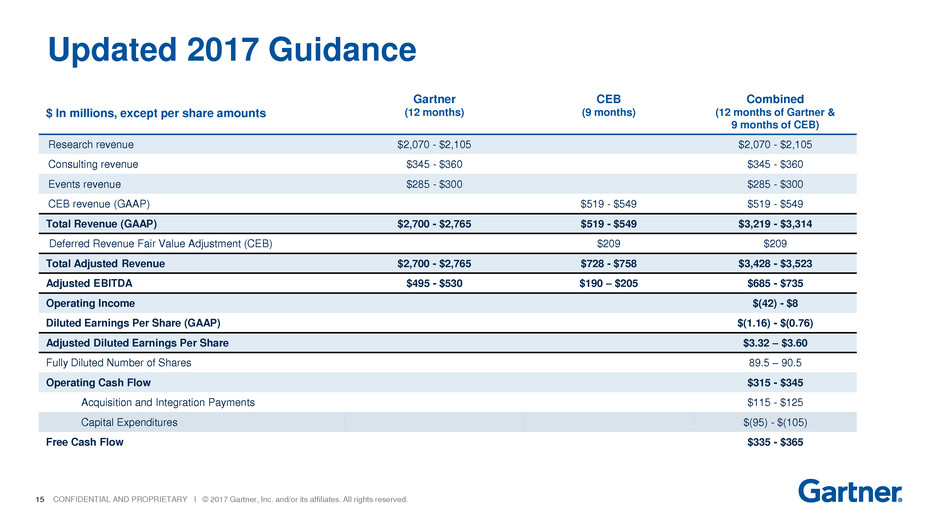
$ In millions, except per share amounts
Gartner
(12 months)
CEB
(9 months)
Combined
(12 months of Gartner &
9 months of CEB)
Research revenue $2,070 - $2,105 $2,070 - $2,105
Consulting revenue $345 - $360 $345 - $360
Events revenue $285 - $300 $285 - $300
CEB revenue (GAAP) $519 - $549 $519 - $549
Total Revenue (GAAP) $2,700 - $2,765 $519 - $549 $3,219 - $3,314
Deferred Revenue Fair Value Adjustment (CEB) $209 $209
Total Adjusted Revenue $2,700 - $2,765 $728 - $758 $3,428 - $3,523
Adjusted EBITDA $495 - $530 $190 – $205 $685 - $735
Operating Income $(42) - $8
Diluted Earnings Per Share (GAAP) $(1.16) - $(0.76)
Adjusted Diluted Earnings Per Share $3.32 – $3.60
Fully Diluted Number of Shares 89.5 – 90.5
Operating Cash Flow $315 - $345
Acquisition and Integration Payments $115 - $125
Capital Expenditures $(95) - $(105)
Free Cash Flow $335 - $365

16 CONFIDENTIAL AND PROPRIETARY I © 2017 Gartner, Inc. and/or its affiliates. All rights reserved.
$0.31
$(1.59)
Amortization
of acquired
intangibles
Deferred
Revenue Fair
Value Adjustment
GAAP EPS
Guidance Range
Adjusted EPS
Guidance
Range
Acquisition and
Integration
Charges
Real
Estate
Related &
Other
Charges
$0.94
$1.49
Reconciliation of 2017 Adjusted to GAAP EPS Outlook
~$(1.16)
~$(1.46)
~$(1.55)
~$(0.25)
$3.32 – $3.60
$(1.16) – $(0.76)
**Adjusting items calculated at the midpoint of guidance range
17 CONFIDENTIAL AND PROPRIETARY I © 2017 Gartner, Inc. and/or its affiliates. All rights reserved.
Appendix
18 CONFIDENTIAL AND PROPRIETARY I © 2017 Gartner, Inc. and/or its affiliates. All rights reserved.
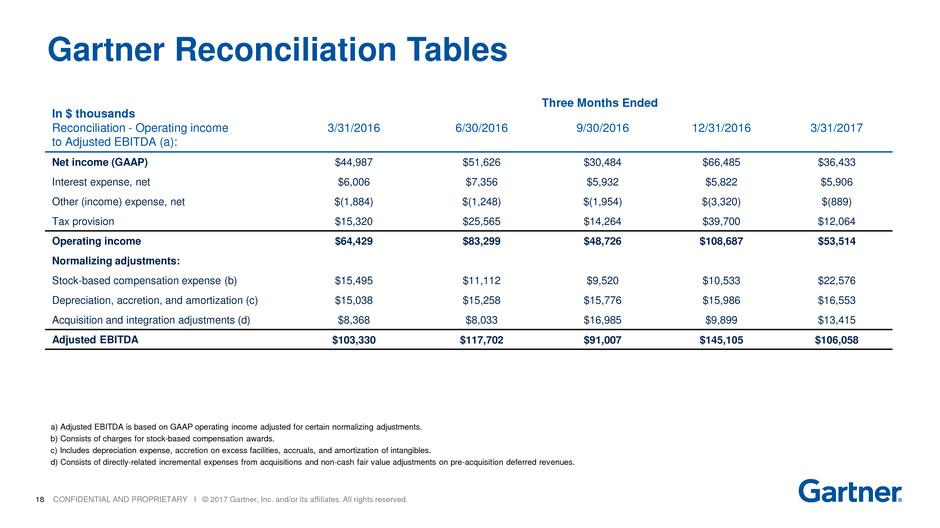
Gartner Reconciliation Tables
In $ thousands
Reconciliation - Operating income
to Adjusted EBITDA (a):
3/31/2016 6/30/2016 9/30/2016 12/31/2016 3/31/2017
Net income (GAAP) $44,987 $51,626 $30,484 $66,485 $36,433
Interest expense, net $6,006 $7,356 $5,932 $5,822 $5,906
Other (income) expense, net $(1,884) $(1,248) $(1,954) $(3,320) $(889)
Tax provision $15,320 $25,565 $14,264 $39,700 $12,064
Operating income $64,429 $83,299 $48,726 $108,687 $53,514
Normalizing adjustments:
Stock-based compensation expense (b) $15,495 $11,112 $9,520 $10,533 $22,576
Depreciation, accretion, and amortization (c) $15,038 $15,258 $15,776 $15,986 $16,553
Acquisition and integration adjustments (d) $8,368 $8,033 $16,985 $9,899 $13,415
Adjusted EBITDA $103,330 $117,702 $91,007 $145,105 $106,058
a) Adjusted EBITDA is based on GAAP operating income adjusted for certain normalizing adjustments.
b) Consists of charges for stock-based compensation awards.
c) Includes depreciation expense, accretion on excess facilities, accruals, and amortization of intangibles.
d) Consists of directly-related incremental expenses from acquisitions and non-cash fair value adjustments on pre-acquisition deferred revenues.
Three Months Ended
19 CONFIDENTIAL AND PROPRIETARY I © 2017 Gartner, Inc. and/or its affiliates. All rights reserved.
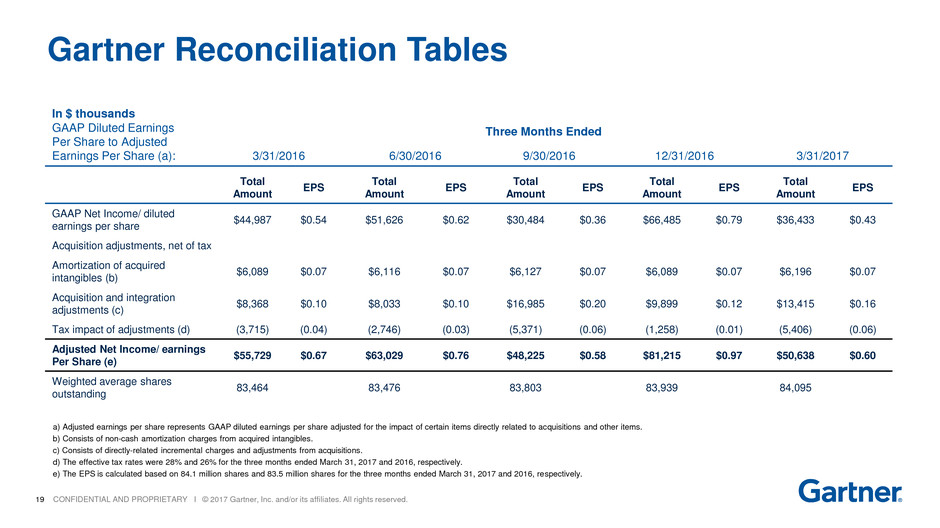
Gartner Reconciliation Tables
a) Adjusted earnings per share represents GAAP diluted earnings per share adjusted for the impact of certain items directly related to acquisitions and other items.
b) Consists of non-cash amortization charges from acquired intangibles.
c) Consists of directly-related incremental charges and adjustments from acquisitions.
d) The effective tax rates were 28% and 26% for the three months ended March 31, 2017 and 2016, respectively.
e) The EPS is calculated based on 84.1 million shares and 83.5 million shares for the three months ended March 31, 2017 and 2016, respectively.
In $ thousands
GAAP Diluted Earnings
Per Share to Adjusted
Earnings Per Share (a): 3/31/2016 6/30/2016 9/30/2016 12/31/2016 3/31/2017
Three Months Ended
Total
Amount
EPS
Total
Amount
EPS
Total
Amount
EPS
Total
Amount
EPS
Total
Amount
EPS
GAAP Net Income/ diluted
earnings per share
$44,987 $0.54 $51,626 $0.62 $30,484 $0.36 $66,485 $0.79 $36,433 $0.43
Acquisition adjustments, net of tax
Amortization of acquired
intangibles (b)
$6,089 $0.07 $6,116 $0.07 $6,127 $0.07 $6,089 $0.07 $6,196 $0.07
Acquisition and integration
adjustments (c)
$8,368 $0.10 $8,033 $0.10 $16,985 $0.20 $9,899 $0.12 $13,415 $0.16
Tax impact of adjustments (d) (3,715) (0.04) (2,746) (0.03) (5,371) (0.06) (1,258) (0.01) (5,406) (0.06)
Adjusted Net Income/ earnings
Per Share (e)
$55,729 $0.67 $63,029 $0.76 $48,225 $0.58 $81,215 $0.97 $50,638 $0.60
Weighted average shares
outstanding
83,464 83,476 83,803 83,939 84,095
20 CONFIDENTIAL AND PROPRIETARY I © 2017 Gartner, Inc. and/or its affiliates. All rights reserved.
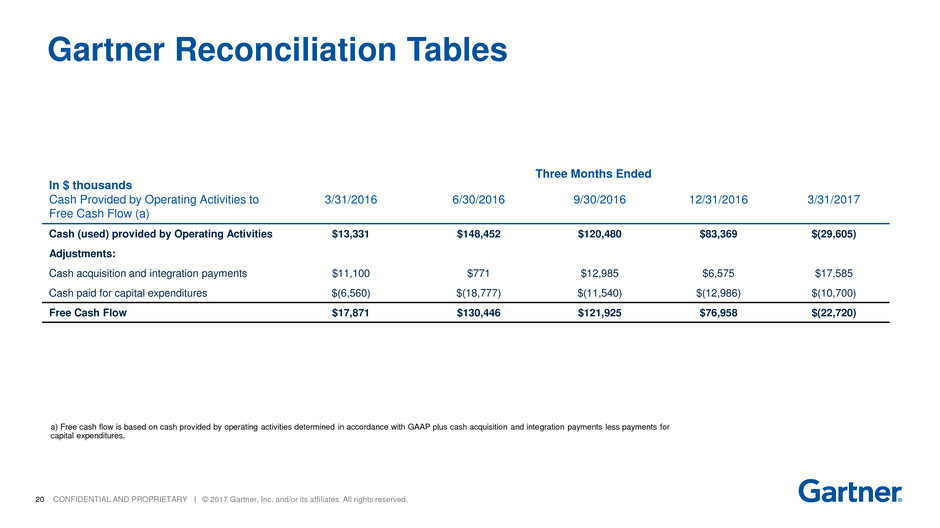
Gartner Reconciliation Tables
In $ thousands
Cash Provided by Operating Activities to
Free Cash Flow (a)
3/31/2016 6/30/2016 9/30/2016 12/31/2016 3/31/2017
Cash (used) provided by Operating Activities $13,331 $148,452 $120,480 $83,369 $(29,605)
Adjustments:
Cash acquisition and integration payments $11,100 $771 $12,985 $6,575 $17,585
Cash paid for capital expenditures $(6,560) $(18,777) $(11,540) $(12,986) $(10,700)
Free Cash Flow $17,871 $130,446 $121,925 $76,958 $(22,720)
a) Free cash flow is based on cash provided by operating activities determined in accordance with GAAP plus cash acquisition and integration payments less payments for
capital expenditures.
Three Months Ended
21 CONFIDENTIAL AND PROPRIETARY I © 2017 Gartner, Inc. and/or its affiliates. All rights reserved.
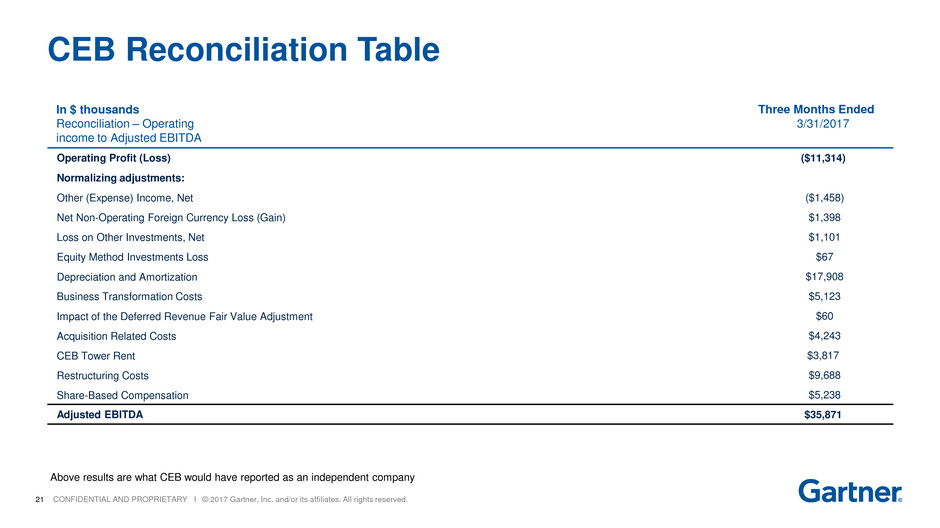
CEB Reconciliation Table
In $ thousands
Reconciliation – Operating
income to Adjusted EBITDA
3/31/2017
Operating Profit (Loss) ($11,314)
Normalizing adjustments:
Other (Expense) Income, Net ($1,458)
Net Non-Operating Foreign Currency Loss (Gain) $1,398
Loss on Other Investments, Net $1,101
Equity Method Investments Loss $67
Depreciation and Amortization $17,908
Business Transformation Costs $5,123
Impact of the Deferred Revenue Fair Value Adjustment $60
Acquisition Related Costs $4,243
CEB Tower Rent $3,817
Restructuring Costs $9,688
Share-Based Compensation $5,238
Adjusted EBITDA $35,871
Three Months Ended
Above results are what CEB would have reported as an independent company
22 CONFIDENTIAL AND PROPRIETARY I © 2017 Gartner, Inc. and/or its affiliates. All rights reserved.
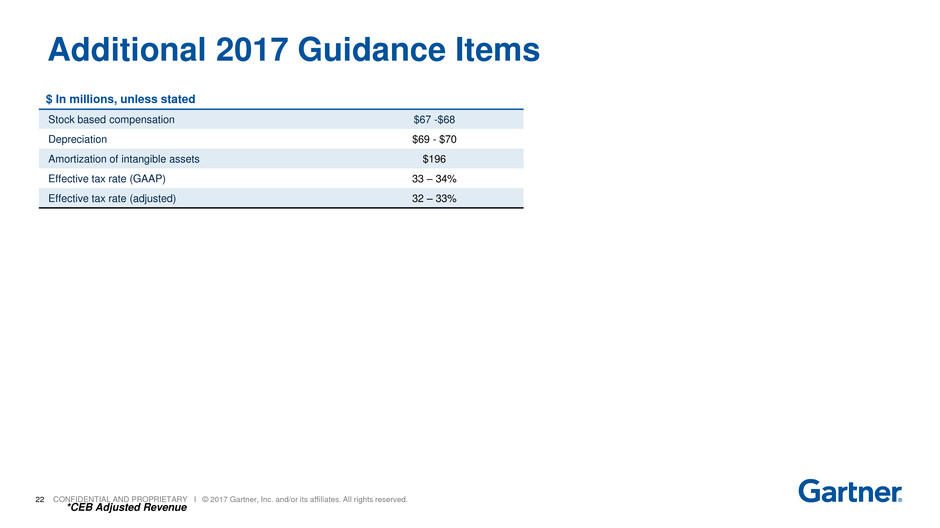
Additional 2017 Guidance Items
$ In millions, unless stated
Stock based compensation $67 -$68
Depreciation $69 - $70
Amortization of intangible assets $196
Effective tax rate (GAAP) 33 – 34%
Effective tax rate (adjusted) 32 – 33%
*CEB Adjusted Revenue

23 CONFIDENTIAL AND PROPRIETARY I © 2017 Gartner, Inc. and/or its affiliates. All rights reserved.
Definitions
Adjusted Revenue: Represents revenue calculated in accordance with GAAP plus non-cash fair value adjustments on pre
acquisition deferred revenues. The majority of the pre-acquisition deferred revenue is recognized ratably over the remaining
period of the underlying revenue contract
Gartner Adjusted EBITDA: Represents GAAP operating income excluding stock-based compensation expense, depreciation
and amortization, accretion on obligations related to excess facilities, acquisition and integration adjustments, and
other charges.
CEB Adjusted EBITDA: refers to net income (loss), excluding: provision for income taxes; interest expense, net; debt
modification costs; net non-operating foreign currency gain (loss); loss on other investments, net; equity method investment
loss; depreciation and amortization; business transformation costs, the impact of the deferred revenue fair value adjustment;
acquisition related costs; CEO non-competition obligation; restructuring costs and share-based compensation.
Adjusted Earnings Per Share: Represents GAAP diluted earnings per share adjusted for the impact of certain items
directly related to acquisitions and other charges.
Free Cash Flow: Represents cash provided by operating activities plus cash acquisition and integration payments less
payments for capital expenditures.
24 CONFIDENTIAL AND PROPRIETARY I © 2017 Gartner, Inc. and/or its affiliates. All rights reserved.
