Attached files
| file | filename |
|---|---|
| EX-99.1 - EXHIBIT 99.1 - CURTISS WRIGHT CORP | a51552686ex99_1.htm |
| 8-K - CURTISS-WRIGHT CORPORATION 8-K - CURTISS WRIGHT CORP | a51552686.htm |
Exhibit 99.2

1 | May 4, 2017 | © 2017 Curtiss-Wright 1Q 2017 Earnings Conference Call May 4, 2017 NYSE: CW
2 | May 4, 2017 | © 2017 Curtiss-Wright Safe Harbor Statement Please note that the information provided in this presentation is accurate as of the date of the original presentation. The presentation will remain posted on this website from one to twelve months following the initial presentation, but content will not be updated to reflect new information that may become available after the original presentation posting. The presentation contains forward-looking statements including, among other things, management's estimates of future performance, revenue and earnings, our management's growth objectives and our management's ability to produce consistent operating improvements. These forward-looking statements are based on expectations as of the time the statements were made only, and are subject to a number of risks and uncertainties which could cause us to fail to achieve our then-current financial projections and other expectations. This presentation also includes certain non-GAAP financial measures with reconciliations being made available in the earnings release that is posted to our website and furnished with the SEC. We undertake no duty to update this information. More information about potential factors that could affect our business and financial results is included in our filings with the Securities and Exchange Commission, including our Annual Reports on Form 10-K and Quarterly Reports on Form 10-Q, including, among other sections, under the captions, "Risk Factors" and "Management's Discussion and Analysis of Financial Condition and Results of Operations," which is on file with the SEC and available at the SEC's website at www.sec.gov.
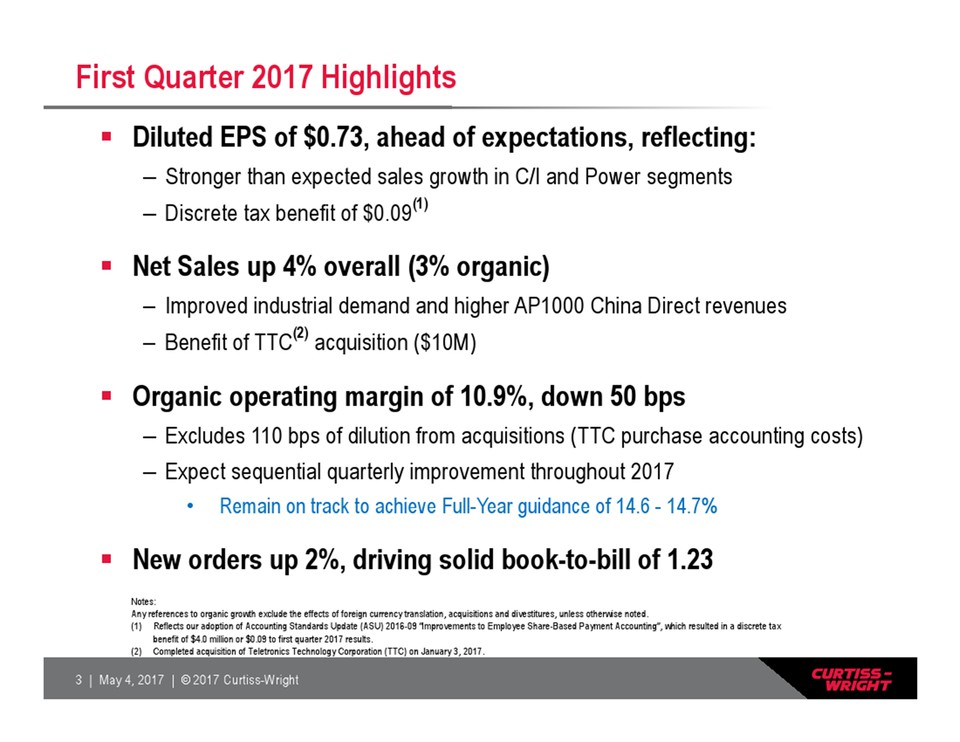
3 | May 4, 2017 | © 2017 Curtiss-Wright First Quarter 2017 Highlights Diluted EPS of $0.73, ahead of expectations, reflecting: – Stronger than expected sales growth in C/I and Power segments – Discrete tax benefit of $0.09(1) Net Sales up 4% overall (3% organic) – Improved industrial demand and higher AP1000 China Direct revenues – Benefit of TTC(2) acquisition ($10M) Organic operating margin of 10.9%, down 50 bps – Excludes 110 bps of dilution from acquisitions (TTC purchase accounting costs) – Expect sequential quarterly improvement throughout 2017 Remain on track to achieve Full-Year guidance of 14.6 - 14.7% New orders up 2%, driving solid book-to-bill of 1.23 Notes: Any references to organic growth exclude the effects of foreign currency translation, acquisitions and divestitures, unless otherwise noted. (1) Reflects our adoption of Accounting Standards Update (ASU) 2016-09 “Improvements to Employee Share-Based Payment Accounting”, which resulted in a discrete tax benefit of $4.0 million or $0.09 to first quarter 2017 results. (2) Completed acquisition of Teletronics Technology Corporation (TTC) on January 3, 2017.
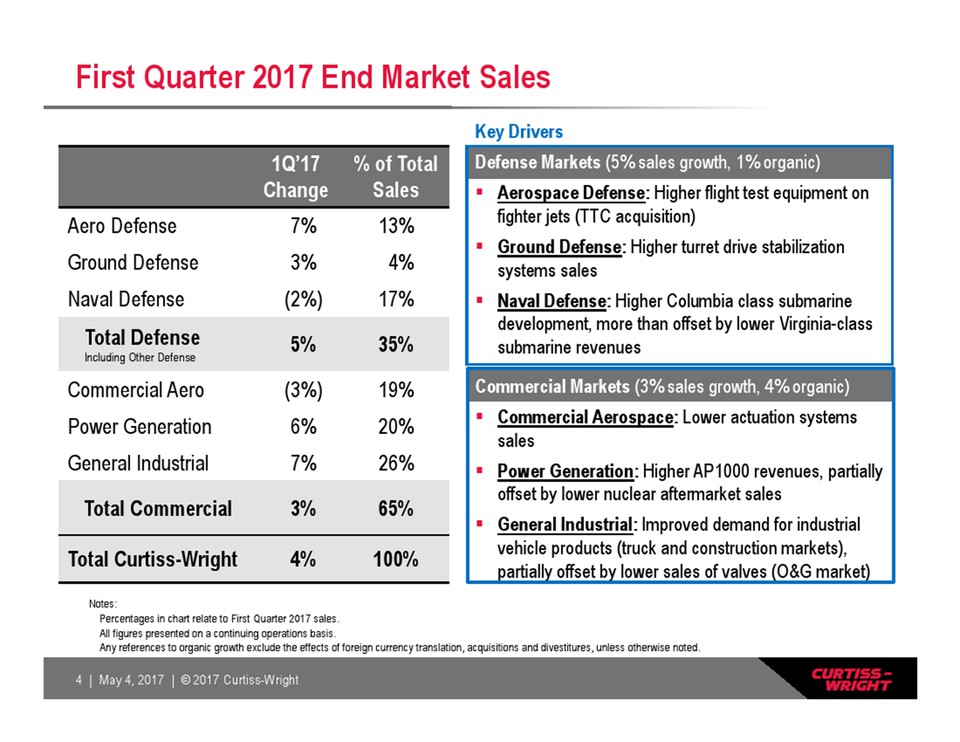
4 | May 4, 2017 | © 2017 Curtiss-Wright Key Drivers Defense Markets (5% sales growth, 1% organic) Aerospace Defense: Higher flight test equipment on fighter jets (TTC acquisition) Ground Defense: Higher turret drive stabilization systems sales Naval Defense: Higher Columbia class submarine development, more than offset by lower Virginia-class submarine revenues Commercial Markets (3% sales growth, 4% organic) Commercial Aerospace: Lower actuation systems sales Power Generation: Higher AP1000 revenues, partially offset by lower nuclear aftermarket sales General Industrial: Improved demand for industrial vehicle products (truck and construction markets), partially offset by lower sales of valves (O&G market) First Quarter 2017 End Market Sales Notes: Percentages in chart relate to First Quarter 2017 sales. All figures presented on a continuing operations basis. Any references to organic growth exclude the effects of foreign currency translation, acquisitions and divestitures, unless otherwise noted. 1Q’17 Change % of Total Sales Aero Defense 7% 13% Ground Defense 3% 4% Naval Defense (2%) 17% Total Defense Including Other Defense 5% 35% Commercial Aero (3%) 19% Power Generation 6% 20% General Industrial 7% 26% Total Commercial 3% 65% Total Curtiss-Wright 4% 100%
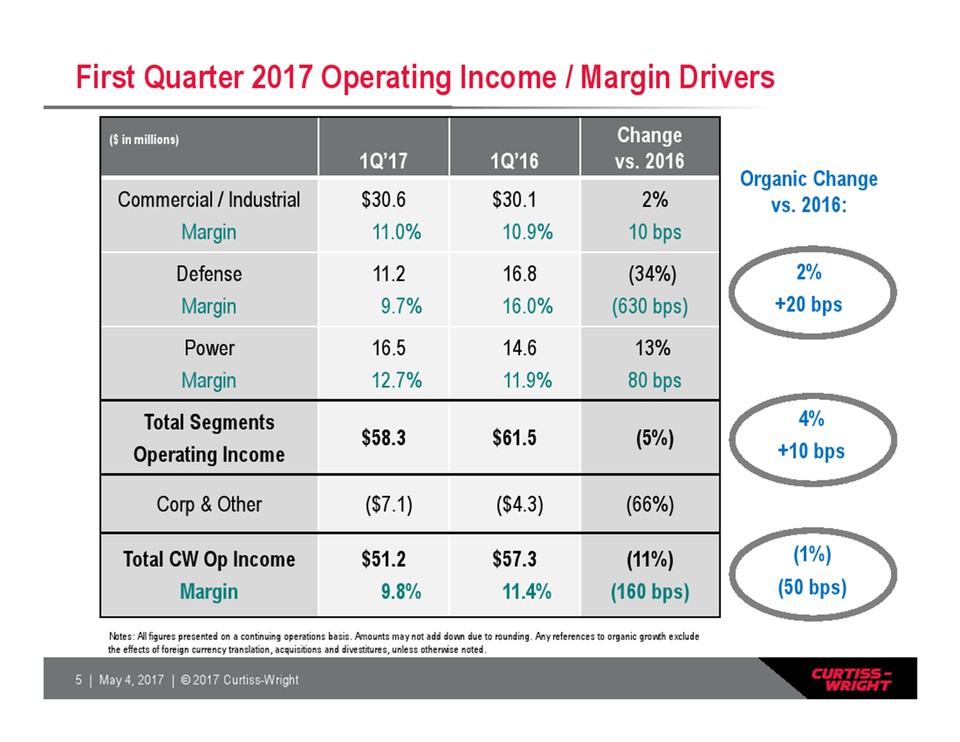
5 | May 4, 2017 | © 2017 Curtiss-Wright First Quarter 2017 Operating Income / Margin Drivers ($ in millions) 1Q’17 1Q’16 Change vs. 2016 Commercial / Industrial Margin $30.6 11.0% $30.1 10.9% 2% 10 bps Defense Margin 11.2 9.7% 16.8 16.0% (34%) (630 bps) Power Margin 16.5 12.7% 14.6 11.9% 13%80 bps Total Segments Operating Income $58.3 $61.5 (5%) Corp & Other ($7.1) ($4.3) (66%) Total CW Op Income Margin $51.2 9.8% $57.3 11.4% (11%) (160 bps) Notes: All figures presented on a continuing operations basis. Amounts may not add down due to rounding. Any references to organic growth exclude the effects of foreign currency translation, acquisitions and divestitures, unless otherwise noted. (1%) (50 bps) Organic Change vs. 2016: 2% +20 bps 4% +10 bps
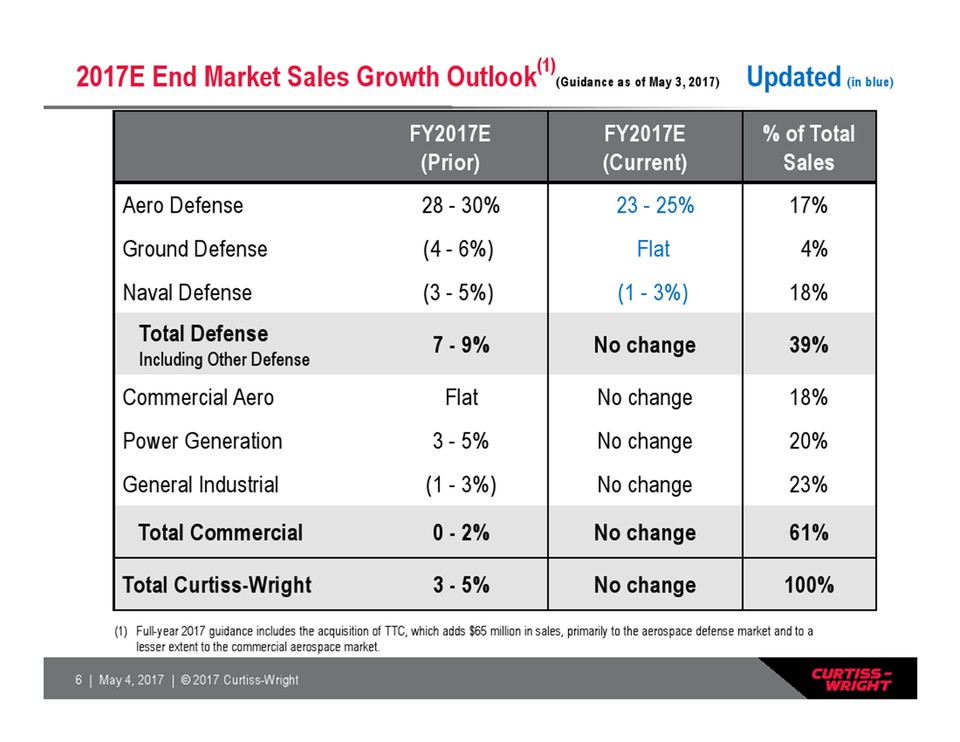
6 | May 4, 2017 | © 2017 Curtiss-Wright 2017E End Market Sales Growth Outlook(1) (Guidance as of May 3, 2017) Updated (in blue) FY2017E (Prior) FY2017E (Current) % of Total Sales Aero Defense 28 - 30% 23 - 25% 17% Ground Defense (4 - 6%) Flat 4% Naval Defense (3 - 5%) (1 - 3%) 18% Total Defense Including Other Defense 7 - 9% No change 39% Commercial Aero Flat No change 18% Power Generation 3 - 5% No change 20% General Industrial (1 - 3%) No change 23% Total Commercial 0 - 2% No change 61% Total Curtiss-Wright 3 - 5% No change 100% (1) Full-year 2017 guidance includes the acquisition of TTC, which adds $65 million in sales, primarily to the aerospace defense market and to a lesser extent to the commercial aerospace market.
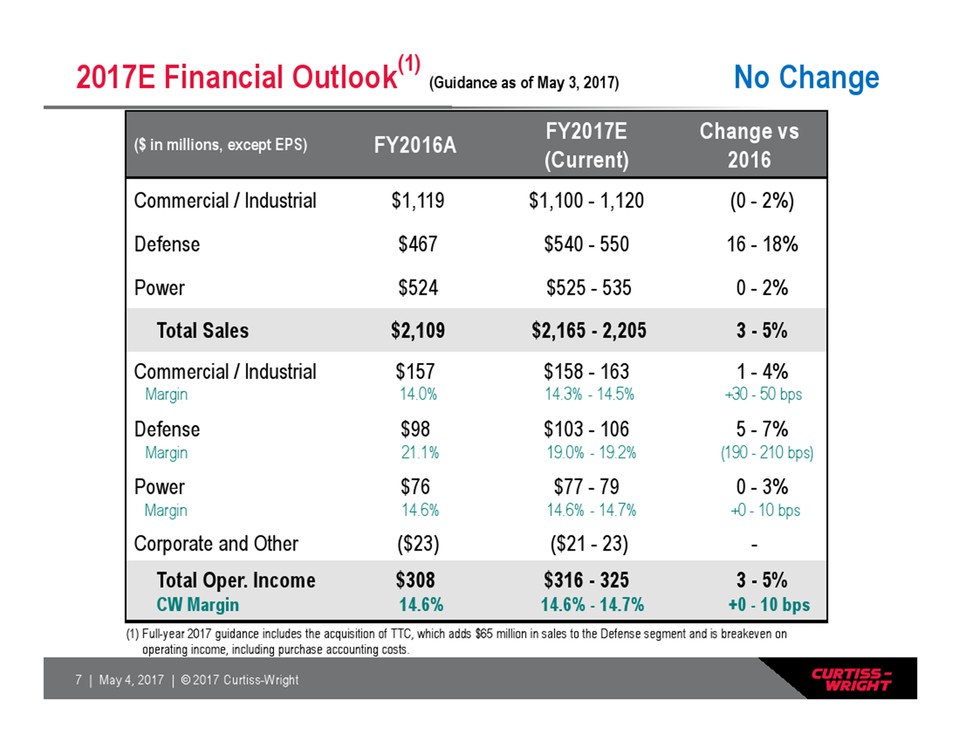
7 | May 4, 2017 | © 2017 Curtiss-Wright ($ in millions, except EPS) FY2016A FY2017E (Current) Change vs 2016 Commercial / Industrial $1,119 $1,100 - 1,120 (0 - 2%) Defense $467 $540 - 550 16 - 18% Power $524 $525 - 535 0 - 2% Total Sales $2,109 $2,165 - 2,205 3 - 5% Commercial / Industrial Margin $157 14.0% $158 – 163 14.3% - 14.5% 1 - 4% +30 - 50 bps Defense Margin $98 21.1% $103 – 106 19.0% - 19.2% 5 - 7% (190 - 210 bps) Power Margin $76 14.6% $77 – 79 14.6% - 14.7% 0 - 3% +0 - 10 bps Corporate and Other ($23) ($21 - 23) - Total Oper. Income CW Margin $308 14.6% $316 – 325 14.6% - 14.7% 3 - 5% +0 - 10 bps 2017E Financial Outlook(1) (Guidance as of May 3, 2017) No Change (1) Full-year 2017 guidance includes the acquisition of TTC, which adds $65 million in sales to the Defense segment and is breakeven on operating income, including purchase accounting costs.
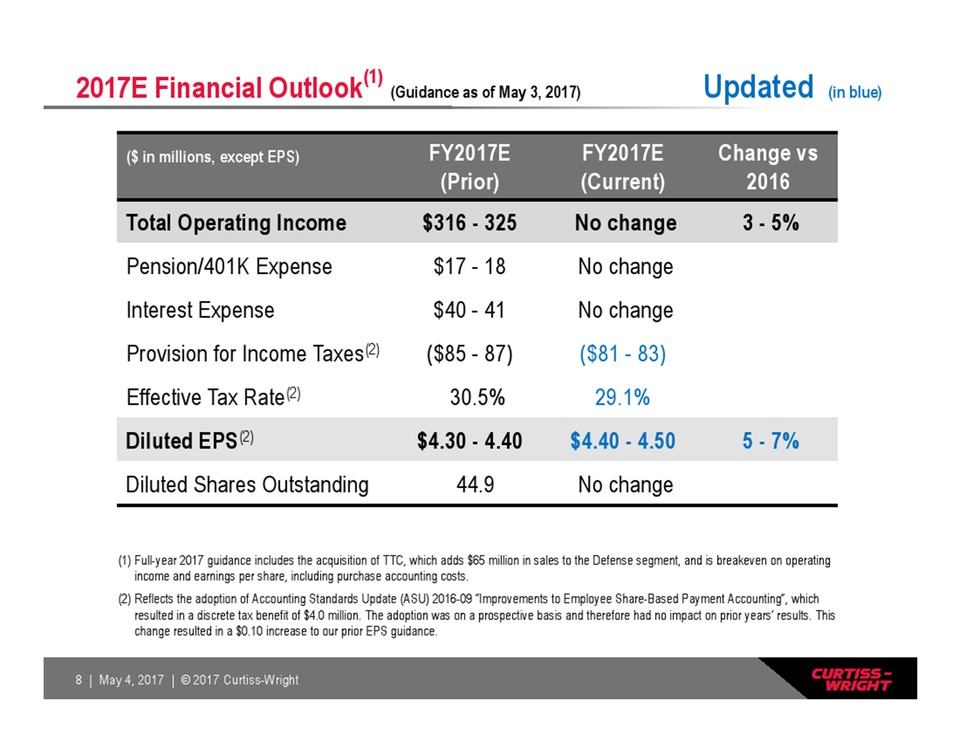
8 | May 4, 2017 | © 2017 Curtiss-Wright ($ in millions, except EPS) FY2017E (Prior) FY2017E (Current) Change vs 2016 Total Operating Income $316 - 325 No change 3 - 5% Pension/401K Expense $17 - 18 No change Interest Expense $40 - 41 No change Provision for Income Taxes(2) ($85 - 87) ($81 - 83) Effective Tax Rate(2) 30.5% 29.1% Diluted EPS(2) $4.30 - 4.40 $4.40 - 4.50 5 - 7% Diluted Shares Outstanding 44.9 No change 2017E Financial Outlook(1) (Guidance as of May 3, 2017) Updated (in blue) (1) Full-year 2017 guidance includes the acquisition of TTC, which adds $65 million in sales to the Defense segment, and is breakeven on operating income and earnings per share, including purchase accounting costs. (2) Reflects the adoption of Accounting Standards Update (ASU) 2016-09 “Improvements to Employee Share-Based Payment Accounting”, which resulted in a discrete tax benefit of $4.0 million. The adoption was on a prospective basis and therefore had no impact on prior years’ results. This change resulted in a $0.10 increase to our prior EPS guidance.
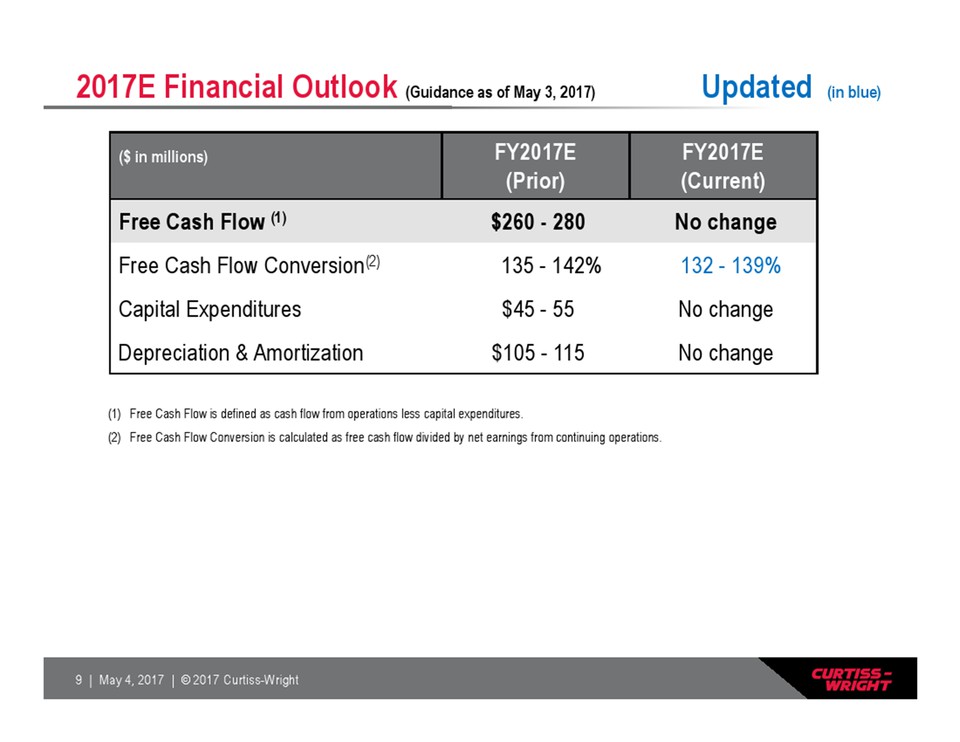
9 | May 4, 2017 | © 2017 Curtiss-Wright 2017E Financial Outlook (Guidance as of May 3, 2017) Updated (in blue) ($ in millions) FY2017E (Prior) FY2017E (Current) Free Cash Flow (1) $260 - 280 No change Free Cash Flow Conversion(2) 135 - 142% 132 - 139% Capital Expenditures $45 - 55 No change Depreciation & Amortization $105 - 115 No change (1) Free Cash Flow is defined as cash flow from operations less capital expenditures. (2) Free Cash Flow Conversion is calculated as free cash flow divided by net earnings from continuing operations.
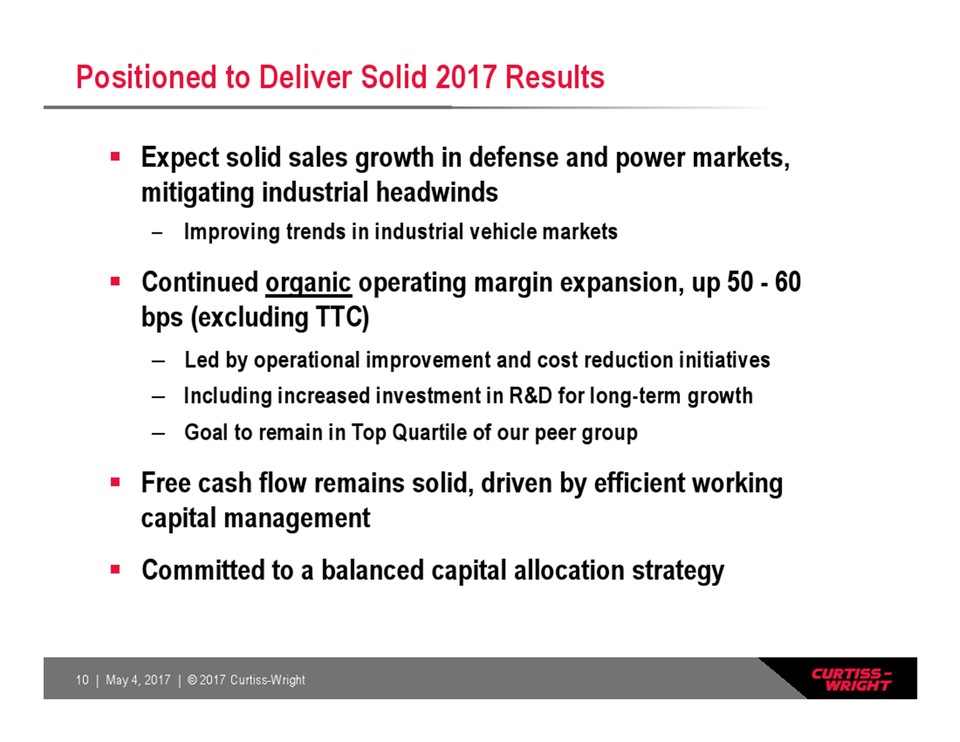
10 | May 4, 2017 | © 2017 Curtiss-Wright Positioned to Deliver Solid 2017 Results Expect solid sales growth in defense and power markets, mitigating industrial headwinds – Improving trends in industrial vehicle markets Continued organic operating margin expansion, up 50 – 60 bps (excluding TTC) – Led by operational improvement and cost reduction initiatives – Including increased investment in R&D for long-term growth – Goal to remain in Top Quartile of our peer group Free cash flow remains solid, driven by efficient working capital management Committed to a balanced capital allocation strategy
11 | May 4, 2017 | © 2017 Curtiss-Wright Appendix
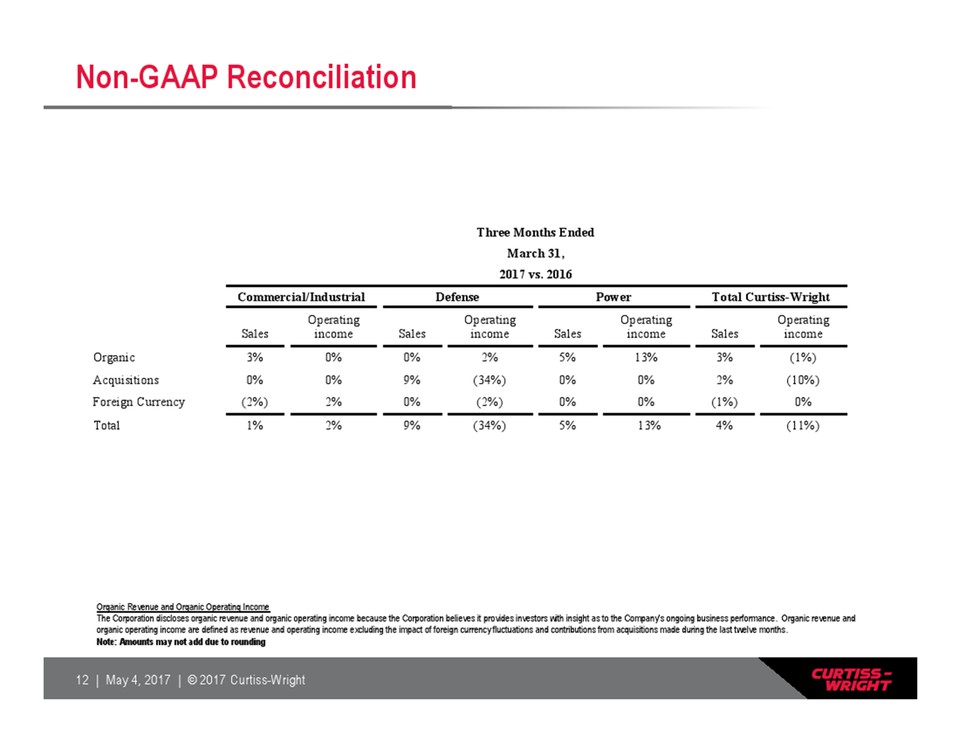
12 | May 4, 2017 | © 2017 Curtiss-Wright Non-GAAP Reconciliation Organic Revenue and Organic Operating Income The Corporation discloses organic revenue and organic operating income because the Corporation believes it provides investors with insight as to the Company’s ongoing business performance. Organic revenue and organic operating income are defined as revenue and operating income excluding the impact of foreign currency fluctuations and contributions from acquisitions made during the last twelve months. Note: Amounts may not add due to rounding Three Months Ended March 31, 2017 vs. 2016 Commercial/Industrial Defense Power Total Curtiss-Wright Sales Operating income Sales Operating income Sales Operating income Sales Operating income Organic 3% 0% 0% 2% 5% 13% 3% (1%) Acquisitions 0% 0% 9% (34%) 0% 0% 2% (10%) Foreign Currency (2%) 2% 0% (2%) 0% 0% (1%) 0% Total 1% 2% 9% (34%) 5% 13% 4% (11%)
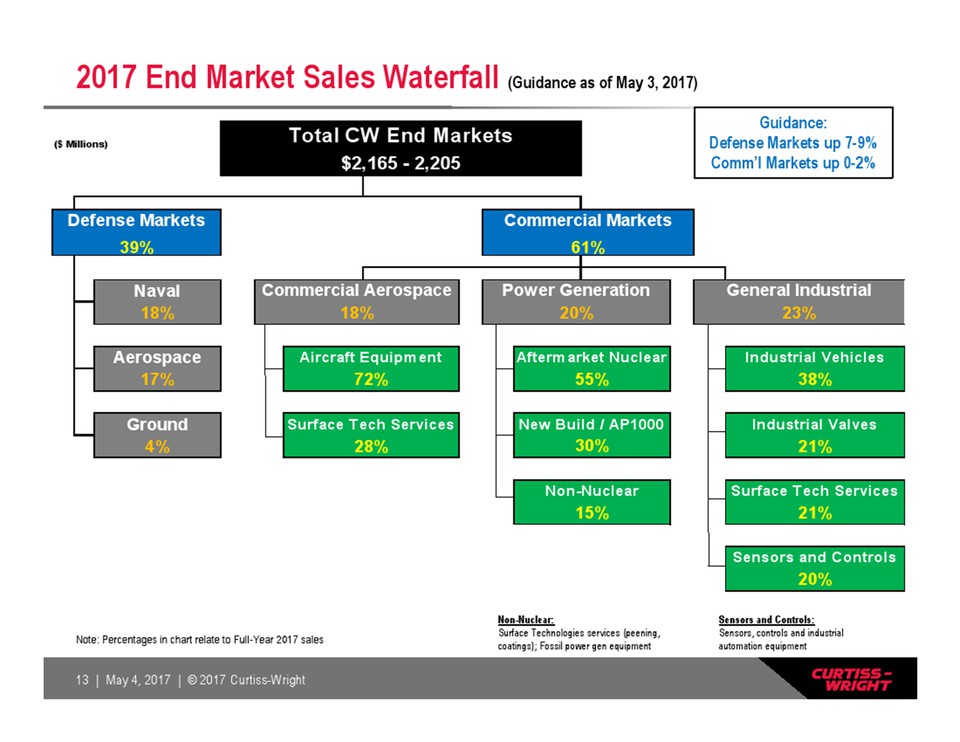
13 | May 4, 2017 | © 2017 Curtiss-Wright 2017 End Market Sales Waterfall (Guidance as of May 3, 2017) Sensors and Controls: Sensors, controls and industrial automation equipment Non-Nuclear: Surface Technologies services (peening, Note: Percentages in chart relate to Full-Year 2017 sales coatings); Fossil power gen equipment ($ Millions) Naval Aerospace Industrial Vehicles Ground Industrial Valves Surface Tech Services Sensors and Controls 15% Commercial Markets Aftermarket Nuclear 55% New Build / AP1000 General Industrial 20% 23% 61% 30% Non-Nuclear 20% 21% 21% 17% Power Generation 4% 18% Aircraft Equipment 72% Surface Tech Services 28% 18% 39% Defense Markets Total CW End Markets $2,165 - 2,205 38% Commercial Aerospace Guidance: Defense Markets up 7-9% Comm’l Markets up 0-2%