Attached files
| file | filename |
|---|---|
| 8-K - 8-K - Tesla, Inc. | tsla-8k_20170503.htm |
Exhibit 99.1
|
|
|
Tesla First Quarter 2017 Update
•Record vehicle production, deliveries and revenue in Q1 •Model 3 on track for initial production in July •Completed transition to internally developed Autopilot software •Q1 Automotive gross margin improved to 27.4% (GAAP) and 27.8% (non-GAAP) •$4.0 billion of cash on hand heading into Q2 •Q1 GAAP and Non-GAAP loss from operations improved from Q4
|

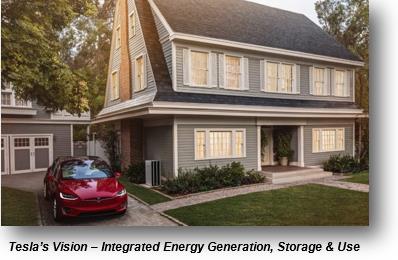
We have made a solid start to what should be an exciting 2017. Vehicle production in Q1 increased by 64% compared to a year ago, which enabled us to set new quarterly records of 25,051 deliveries and $2.7 billion in GAAP revenue. Model 3 activities related to vehicle development, manufacturing equipment installation and supplier readiness remain on plan to start production in July. Over the past several months, we have been deploying our internally-developed software into the vehicle fleet, to provide additional safety and convenience features for vehicles with the newest generation of Autopilot hardware. Finally, we have started expanding the number of stores displaying our comprehensive product portfolio of energy generation and storage products for home use.
ADVANCING SUSTAINABLE TRANSPORT
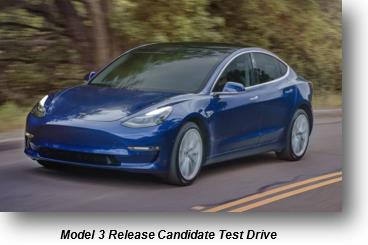
Model 3 vehicle development is nearly complete as we approach the start of production. Release Candidate vehicles, built using production-intent tooling and processes, are being tested to assess fit and finish, to support vehicle software development and to ensure a smooth and predictable homologation process. Road testing is also underway to refine driving dynamics and ensure vehicle durability.
Simultaneously, preparations at our production facilities are on track to support the ramp of Model 3 production to 5,000 vehicles per week at some point in 2017, and to 10,000 vehicles per week at some point in 2018. We recently powered on our newest Schuler press line, and have started the commissioning process. This will allow sufficient time to install and tune die sets ahead of volume production. Paint shop preparation has been completed and installations of our dedicated Model 3 body welding and general assembly lines are progressing well. Equipment installation is also underway for volume manufacturing of cells, modules, battery packs and drive units at Gigafactory 1. We are working closely with all Model 3 suppliers to ensure their readiness ahead of start of production.
|
As part of our Model 3 launch preparations, we are significantly expanding our infrastructure to support Tesla owners by increasing the density and geographic footprint of our presence. This year, we plan to add nearly 100 retail, delivery and service locations globally, representing an approximately 30% increase in facilities. These additions include the Q1 openings of our first stores in Dubai and South Korea. To significantly improve the customer experience with out-of-warranty body repairs, we intend to open the first Tesla-owned body repair shops later this year and expand the existing network of third-party Tesla certified body shops.
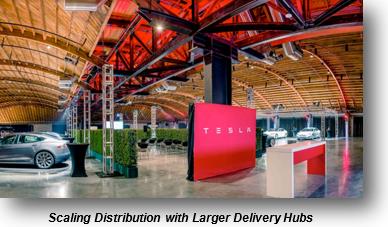
Our new facilities are generally larger than they were in the past. For example, new service locations commonly have many more service bays, and we have tested the implementation of large delivery hubs in Los Angeles, San Francisco, Hong Kong and Beijing. Delivery hubs create an exciting reception for new customers and support much higher delivery levels, so we plan to expand this customer experience to more cities. |
|
We are also taking advantage of our vehicle technology and design to improve service efficiency. Using remote diagnostics, our service technicians are increasingly able to identify repair needs in advance of meeting with customers and even before customers notice issues. This has helped reduce repair times by 35% this year. Our goal is to reduce repair times even further.
Since December, we have been rolling out updated Autopilot features over the air to customer vehicles. These updates allowed our cars equipped with the latest version of Autopilot hardware to have automatic emergency braking, “Summon” (in which a driver can call or return the car from their garage or parking space), automatic lane changing, lane departure warning, and an increased speed limit for Autosteer to 80 miles per hour on highways. In only a few quarters, we have developed industry-leading vision technology that we had previously sourced from a third party. This internally developed technology stack will allow us to continue to roll out new features over the air to existing Autopilot customers at an accelerated pace.
Our efforts to improve energy conversion efficiency and reduce vehicle weight coupled with the development of a larger battery pack have expanded the market appeal of our vehicles. For example, during the quarter, we received EPA certification for the 335-mile range Model S 100D. This is 26% more range than the first Model S cars we produced in 2012, and sets a new record as the longest-range production electric vehicle ever built, beating our own past range record.
ADVANCING SUSTAINABLE ENERGY
|
• |
150 MW of solar energy generation deployed in Q1 |
|
• |
60 MWh of energy storage installed in Q1 |
Rather than prioritizing the growth of MW of solar deployed at any cost, we are selectively deploying projects that have higher margin and generate cash up front. Consequently, solar energy generation deployments in Q1 2017 declined year-over-year, but had better financial results. Furthermore, the portion of residential customers who elected to purchase rather than lease a solar system grew to 31% of deployments in Q1, up from 9% a year ago, improving the cash generation of this business.
|
|
Recently, we tested sales of our solar and storage products in several Tesla stores, and saw sales productivity improve 50% to 100% relative to the best non-Tesla retail locations. Based on these results, we are working towards fully staffing more than 70 Tesla stores in the U.S. and abroad with dedicated Tesla energy sales people over the next two quarters.
We plan to start pilot manufacturing of Solar Roof tiles in Q2 at our Fremont facility. Shortly thereafter, production will transition to Gigafactory 2 in Buffalo, New York. Our partner, Panasonic, will provide capital and operational support to manufacture photovoltaic (PV) cells, thus enabling high volume integrated tile and PV cell production at a single facility.
In Q1, we installed 60 MWh of energy storage, including a 52 MWh storage project for Kauai Island Utility Cooperative (KIUC) in Kauai, Hawaii. Final testing on the KIUC project will be completed very shortly, triggering the start of revenue recognition. |
Combined with an 18 MW ground-mounted solar array, the KIUC project was the first to be designed as a “dispatchable” utility-scale solar project that provides solar energy generated during the day to power the grid in the evening when demand is highest. The project provides KIUC with energy for less than the cost of hydrocarbon-fueled alternatives and cuts oil consumption by over 2 million gallons per year.
Q1 2017 RESULTS
Our Q1 financial statements reflect a full quarter of results for the recent SolarCity and Grohmann acquisitions.
To calculate non-GAAP results we eliminate non-cash stock-based compensation (SBC), acquisition-related transaction costs and the gain (loss) that resulted from the purchase accounting for the SolarCity acquisition. When calculating non-GAAP automotive gross margin, we eliminate the sale of Zero Emission Vehicle (ZEV) credits as well as SBC. For all references to non-GAAP measures, please see the Reconciliation of GAAP to Non-GAAP Financial Information at the end of this letter.
Revenue & Gross Margin
|
|
Three Months Ended |
|
|
Change |
|
|||||||||||
|
|
March 31, |
|
December 31, |
|
March 31, |
|
|
|
|
|
|
|
|
|||
|
|
2017 |
|
2016 |
|
2016 |
|
|
QoQ |
|
YoY |
|
|||||
|
Automotive revenue ($000) |
$ |
2,289,600 |
|
$ |
1,994,123 |
|
$ |
1,026,064 |
|
|
|
15 |
% |
|
123 |
% |
|
Automotive gross margin - GAAP |
|
27.4 |
% |
|
22.6 |
% |
|
24.0 |
% |
|
|
480 |
bp |
|
340 |
bp |
|
Automotive gross margin excluding SBC and ZEV credit - Non-GAAP |
|
27.8 |
% |
|
22.2 |
% |
|
20.2 |
% |
|
|
560 |
bp |
|
760 |
bp |
|
• |
A 13% sequential increase in Q1 deliveries drove much of the sequential increase in Automotive revenue. In addition, average transaction prices (ATPs) improved from Q4 2016, driven primarily by favorable product mix shift and higher option uptake. |
|
• |
Automotive gross margin increased sequentially because of improved ATPs and manufacturing efficiencies. Enhanced Autopilot revenue recognized in Q1 on cars delivered in Q4 contributed $35 million to gross profits. This was partially offset by $26 million in warranty reserve for the Takata airbag recall and equipment impairment charges. We have yet to recognize a significant amount of deferred revenue from future functionalities related to Enhanced Autopilot and Full Self-Driving Capability options. There were no ZEV credit sales during the quarter. |
|
• |
Consistent with Q4 2016, about 26% of Q1 deliveries were subject to lease accounting as we retained some residual risk on these transactions. When we do retain residual risk through a Resale Value Guarantee (RVG) or a direct lease, our vehicles are holding value better than estimated. Thus, we expect we will re-acquire less than half of these cars, and when we do, we normally break even on re-selling them. |
|
|
Three Months Ended |
|
|
Change |
|
|||||||||||
|
|
March 31, |
|
December 31, |
|
March 31, |
|
|
|
|
|
|
|
|
|||
|
|
2017 |
|
2016 |
|
2016 |
|
|
QoQ |
|
YoY |
|
|||||
|
Energy generation and storage revenue ($000) |
$ |
213,944 |
|
$ |
131,385 |
|
$ |
22,728 |
|
|
|
63 |
% |
|
841 |
% |
|
Energy generation and storage gross margin |
|
29.1 |
% |
|
2.7 |
% |
|
20.3 |
% |
|
|
2,640 |
bp |
|
880 |
bp |
|
• |
Q1 Energy generation and storage revenue increased primarily because we recognized a full quarter of SolarCity contribution, compared to only six weeks of activity for Q4 2016. Gross margin increased sequentially because of improved energy storage margins, sale of energy credits and higher production of solar energy due to seasonality. |
Other Highlights
|
• |
Total Q1 operating expenses increased sequentially as the period now reflects a full quarter of SolarCity operating expenses, and due to $67 million of non-recurring charges related to the SolarCity and Grohmann acquisitions and the end of our work for Daimler. Excluding these items, vehicle-related operating expenses increased only 8% sequentially despite significant Model 3 vehicle development progress and expansion of our customer support infrastructure. |
|
• |
Significantly higher gross profit more than offset higher operating expenses in Q1, improving the GAAP and non-GAAP loss from operations by $9 million. |
|
• |
Q1 GAAP net loss attributable to common stockholders increased by $209 million sequentially, primarily because of changes in non-cash items related to purchase accounting for SolarCity ($100 million), foreign currency translation ($35 million), net loss attributable to noncontrolling interests ($31 million), and non-cash portion of interest expense ($11 million). |
|
• |
Q1 non-GAAP net loss increased by $108 million sequentially, primarily for the same changes in non-cash items described above except purchase accounting of SolarCity. |
|
• |
The Q1 2017 share count amounts reflect the full quarter impact of shares issued related to the acquisition of SolarCity, and 171,000 shares on a weighted average basis related to our equity offering in March. We ended the quarter with about 164 million basic shares outstanding. |
|
|
Three Months Ended |
|
|
Change |
|
|||||||||||
|
|
March 31, |
|
December 31, |
|
March 31, |
|
|
|
|
|
|
|
|
|||
|
($000) |
2017 |
|
2016 |
|
2016 |
|
|
QoQ |
|
YoY |
|
|||||
|
Cash flows used in operating activities |
|
(69,811 |
) |
|
(448,209 |
) |
|
(249,605 |
) |
|
|
84 |
% |
|
72 |
% |
|
Change in collateralized lease borrowing |
|
186,355 |
|
|
212,040 |
|
|
241,763 |
|
|
|
-12 |
% |
|
-23 |
% |
|
Operating cash flows plus change in collateralized lease borrowing |
$ |
116,544 |
|
$ |
(236,169 |
) |
$ |
(7,842 |
) |
|
|
149 |
% |
|
1586 |
% |
|
• |
Q1 cash used in operating activities improved significantly from Q4 2016 to $70 million, driven by record vehicle deliveries, as well as higher overall gross margin. We generated $117 million in cash in Q1 after adding the cash received for vehicle sales to our leasing partners but classified in the financing section of our statement of cash flows. |
|
• |
Capital expenditures were $553 million in Q1, primarily for Model 3 and energy storage manufacturing capacity in Fremont and at Gigafactory 1, as well as for the expansion of customer support infrastructure. |
|
• |
During Q1, we raised $1.22 billion in net proceeds from the sale of common stock and convertible notes, including the cost of a call spread that increased the effective conversion price of the convertible notes to $655 per share. |
|
• |
$4.0 billion in cash at the end of Q1 is the highest level of cash we have had at quarter-end in our history. |
OUTLOOK
Based on our current order and production rates, our first half outlook remains unchanged at 47,000 to 50,000 deliveries, which represents 61% to 71% annual vehicle delivery growth. Moving past Q2, particularly as Model 3 becomes available, one of our challenges will be to eliminate any misperception about the differences between Model S and Model 3. We have seen a belief among some that Model 3 is the newest and more advanced generation of Model S. This is not correct. Model S will always have more range, more acceleration, more power, more passenger cargo room, more displays (two), and more customization choices, and Model S, X and 3 will all have equivalent Autopilot functionality. We will continue to clearly communicate these distinctions to avoid any misperceptions.
We will provide guidance on vehicle deliveries for the second half of this year after we have started Model 3 production in July. Given that we will be ramping Model 3 production so quickly, as we’ve noted before, even a couple-week shift in timing can have a meaningful impact on total deliveries.
Our energy generation and storage business is positioned for accelerating growth later this year, and we continue to be confident about achieving the cost synergies and cash generation targets established when we acquired SolarCity.
Non-GAAP Automotive gross margin should decline by about 250 basis points in Q2 due to the absence of the one-time benefit of Autopilot software revenue recognized in Q1 and fluctuations in product mix. At the same time, we expect that Model S and Model X vehicle costs should continue to decline each quarter based on the execution of our roadmap to improve manufacturing efficiencies.
We expect Q2 GAAP and non-GAAP operating expenses to be flat to slightly up from Q1, including expenses associated with the final stages of Model 3 development and growth in our customer support infrastructure. Q2 interest expense will reflect the full quarter of impact for the convertible securities we issued in Q1, leading to about $115 million of interest expense per quarter.
We expect that year-to-date capital expenditures will be slightly over $2 billion by the time we start Model 3 production. We expect additional investments through the remainder of the year as we increase automation and add production capacity.
This year will have many major milestones for Tesla with the introduction of innovative products that advance electric transport as well as energy generation and storage. We remain confident in our 2017 plan and long-term mission of accelerating the world’s transition to sustainable energy.

Tesla will provide a live webcast of its first quarter 2017 financial results conference call beginning at 2:30 p.m. PT on May 3, 2017, at ir.tesla.com. This webcast will also be available for replay for approximately one year thereafter.
NON-GAAP FINANCIAL INFORMATION
Consolidated financial information has been presented in accordance with GAAP as well as on a non-GAAP basis to supplement our consolidated financial results. Our non-GAAP financial measures include non-GAAP gross margin, non-GAAP net income (loss) attributable to common stockholders, non-GAAP net income (loss) attributable to common stockholders on a per share basis, and operating cash flows plus change in collateralized lease borrowing. Management believes that it is useful to supplement its GAAP financial statements with this non-GAAP information because management uses such information internally for its operating, budgeting and financial planning purposes. These non-GAAP financial measures also facilitate management’s internal comparisons to Tesla’s historical performance as well as comparisons to the operating results of other companies. Management also believes that presentation of the non-GAAP financial measures provides useful information to our investors regarding our financial condition and results of operations because it allows investors greater transparency to the information used by Tesla management in its financial and operational decision-making so that investors can see through the eyes of Tesla management regarding important financial metrics that Tesla management uses to run the business as well as allows investors to better understand Tesla’s performance. Non-GAAP information is not prepared under a comprehensive set of accounting rules and therefore, should only be read in conjunction with financial information reported under U.S. GAAP when understanding Tesla’s operating performance. A reconciliation between GAAP and non-GAAP financial information is provided below.
FORWARD-LOOKING STATEMENTS
Certain statements in this shareholder letter, including statements in the “Outlook” section; statements relating to the progress Tesla is making with respect to product development, such as Model 3 and Solar Roof; statements regarding growth in the number of Tesla store, service center, delivery hub, Supercharger and destination charger locations and in other service and repair capabilities; statements relating to the production, production rate and delivery timing of future products such as Model 3 and Solar Roof and completion of energy generation and storage projects; statements regarding growth of our energy business and means to achieve such growth; growth in demand and orders for Tesla products and the catalysts for that growth; the ability to achieve product demand, volume, production, delivery, revenue, cash generation, cash flow, leasing, gross margin, spending, capital expenditure and profitability targets; productivity improvements and capacity expansion plans, such as for Gigafactory 1; Gigafactory 1 and Gigafactory 2 timing, plans and output expectations, including those related to battery and photovoltaic cell and other production; expected cost synergies associated with the SolarCity acquisition; and statements regarding future features, capabilities and residual values of our vehicles, are “forward-looking statements” that are subject to risks and uncertainties. These forward-looking statements are based on management’s current expectations, and as a result of certain risks and uncertainties, actual results may differ materially from those projected. The following important factors, without limitation, could cause actual results to differ materially from those in the forward-looking statements: the risk of delays in the manufacture, production, delivery and/or completion of our vehicles and energy products, particularly Model 3; the ability to design and achieve and grow simultaneous and separate market acceptance of Model S, Model X and their variants, as well as new vehicle models, specifically Model 3; the ability of suppliers to meet quality and part delivery expectations at increasing volumes; adverse foreign exchange movements; any failures by Tesla products to perform as expected or if product recalls occur; Tesla’s ability to continue to reduce or control manufacturing and other costs; consumers’ willingness to adopt electric vehicles; competition in the automotive and energy product markets generally and the alternative fuel vehicle market and the premium sedan, premium SUV and small to medium-sized sedan markets in particular; Tesla’s ability to establish, maintain and strengthen the Tesla brand; Tesla’s ability to manage future growth effectively as we rapidly grow, especially internationally; the unavailability, reduction or elimination of government and economic incentives for electric vehicles and energy products; Tesla’s ability to establish, maintain and strengthen its relationships with strategic partners such as Panasonic; potential difficulties in finalizing, performing and realizing potential benefits under definitive agreements for the Gigafactory 1 and Gigafactory 2, maintaining Gigafactory 1 and Gigafactory 2 implementation schedules, output and cost estimates; and Tesla’s ability to execute on its strategy for new store, service center, Supercharger and other locations and capabilities. More information on potential factors that could affect our financial results is included from time to time in our Securities and Exchange Commission filings and reports, including the risks identified under the section captioned “Risk Factors” in our annual report on Form 10-K filed with the SEC on March 1, 2017. Tesla disclaims any obligation to update information contained in these forward-looking statements whether as a result of new information, future events, or otherwise.
|
Investor Relations Contact: Jeff Evanson Investor Relations ir@tesla.com |
|
|
|
Press Contact: David Arnold Communications press@tesla.com |
Condensed Consolidated Statements of Operations
(Unaudited)
(In thousands, except per share data)
|
|
|
Three Months Ended |
|
|||||||||
|
|
|
March 31, |
|
|
December 31, |
|
|
March 31, |
|
|||
|
|
|
2017 |
|
|
2016 |
|
|
2016 |
|
|||
|
Revenues |
|
|
|
|
|
|
|
|
|
|
|
|
|
Automotive |
|
$ |
2,035,060 |
|
|
$ |
1,739,449 |
|
|
$ |
901,892 |
|
|
Automotive leasing |
|
|
254,540 |
|
|
|
254,674 |
|
|
|
124,172 |
|
|
Total automotive revenue |
|
|
2,289,600 |
|
|
|
1,994,123 |
|
|
|
1,026,064 |
|
|
Energy generation and storage |
|
|
213,944 |
|
|
|
131,385 |
|
|
|
22,728 |
|
|
Services and other |
|
|
192,726 |
|
|
|
159,123 |
|
|
|
98,256 |
|
|
Total revenues |
|
|
2,696,270 |
|
|
|
2,284,631 |
|
|
|
1,147,048 |
|
|
Cost of revenues |
|
|
|
|
|
|
|
|
|
|
|
|
|
Automotive |
|
|
1,496,649 |
|
|
|
1,372,604 |
|
|
|
713,149 |
|
|
Automotive leasing |
|
|
166,026 |
|
|
|
171,818 |
|
|
|
66,167 |
|
|
Total automotive cost of revenues |
|
|
1,662,675 |
|
|
|
1,544,422 |
|
|
|
779,316 |
|
|
Energy generation and storage |
|
|
151,773 |
|
|
|
127,779 |
|
|
|
18,113 |
|
|
Services and other |
|
|
213,876 |
|
|
|
177,152 |
|
|
|
97,151 |
|
|
Total cost of revenues (1) |
|
|
2,028,324 |
|
|
|
1,849,353 |
|
|
|
894,580 |
|
|
Gross profit |
|
|
667,946 |
|
|
|
435,278 |
|
|
|
252,468 |
|
|
Operating expenses |
|
|
|
|
|
|
|
|
|
|
|
|
|
Research and development (1) |
|
|
322,040 |
|
|
|
245,960 |
|
|
|
182,482 |
|
|
Selling, general and administrative (1) |
|
|
603,455 |
|
|
|
456,016 |
|
|
|
318,210 |
|
|
Total operating expenses |
|
|
925,495 |
|
|
|
701,976 |
|
|
|
500,692 |
|
|
Loss from operations |
|
|
(257,549 |
) |
|
|
(266,698 |
) |
|
|
(248,224 |
) |
|
Interest income |
|
|
3,090 |
|
|
|
2,179 |
|
|
|
1,251 |
|
|
Interest expense (2)(3) |
|
|
(99,346 |
) |
|
|
(65,104 |
) |
|
|
(40,625 |
) |
|
Other (expense) income, net (4) |
|
|
(18,098 |
) |
|
|
121,224 |
|
|
|
9,177 |
|
|
Loss before income taxes |
|
|
(371,903 |
) |
|
|
(208,399 |
) |
|
|
(278,421 |
) |
|
Provision for income taxes |
|
|
25,278 |
|
|
|
11,070 |
|
|
|
3,846 |
|
|
Net loss |
|
|
(397,181 |
) |
|
|
(219,469 |
) |
|
|
(282,267 |
) |
|
Net loss attributable to noncontrolling interests and redeemable noncontrolling interests |
|
|
(66,904 |
) |
|
|
(98,132 |
) |
|
|
— |
|
|
Net loss attributable to common stockholders |
|
$ |
(330,277 |
) |
|
$ |
(121,337 |
) |
|
$ |
(282,267 |
) |
|
Net loss per share of common stock attributable to common stockholders - basic and diluted |
|
$ |
(2.04 |
) |
|
$ |
(0.78 |
) |
|
$ |
(2.13 |
) |
|
Weighted average shares used in computing net loss per share of common stock - basic and diluted |
|
|
162,129 |
|
|
|
155,024 |
|
|
|
132,676 |
|
Notes:
(1) Includes stock-based compensation expense of the following for the periods presented:
|
Cost of revenue |
|
$ |
10,031 |
|
|
$ |
8,562 |
|
|
$ |
6,403 |
|
|
Research and development |
|
|
49,192 |
|
|
|
41,304 |
|
|
|
39,602 |
|
|
Selling, general and administrative |
|
|
44,494 |
|
|
|
37,845 |
|
|
|
43,652 |
|
|
Total stock-based compensation expense |
|
$ |
103,717 |
|
|
$ |
87,711 |
|
|
$ |
89,657 |
|
|
(2) Interest expense includes non-cash interest expense related to convertible notes and other borrowing for the periods presented: |
|
$ |
51,196 |
|
|
$ |
39,915 |
|
|
$ |
28,902 |
|
(3) Interest expense includes the following as a result of the assumed debt from SolarCity:
|
Interest expense (excluding amortization of debt discount and fees) - recourse debt |
|
$ |
12,183 |
|
|
$ |
5,476 |
|
|
$ |
— |
|
|
Interest expense (excluding amortization of debt discount and fees) - non-recourse debt |
|
|
24,084 |
|
|
|
10,007 |
|
|
|
— |
|
|
|
|
$ |
36,267 |
|
|
$ |
15,483 |
|
|
$ |
— |
|
(4) Includes one-time gain on acquisition of SolarCity of $88.7 million recognized during Q4 2016.
Condensed Consolidated Balance Sheets
(Unaudited)
(In thousands)
|
|
|
March 31, |
|
|
December 31, |
|
||
|
|
|
2017 |
|
|
2016 |
|
||
|
Assets |
|
|
|
|
|
|
|
|
|
Current assets |
|
|
|
|
|
|
|
|
|
Cash and cash equivalents |
|
$ |
4,006,593 |
|
|
$ |
3,393,216 |
|
|
Restricted cash |
|
|
88,946 |
|
|
|
105,519 |
|
|
Accounts receivable, net |
|
|
440,349 |
|
|
|
499,142 |
|
|
Inventory |
|
|
2,220,336 |
|
|
|
2,067,454 |
|
|
Prepaid expenses and other current assets |
|
|
271,665 |
|
|
|
194,465 |
|
|
Total current assets |
|
|
7,027,889 |
|
|
|
6,259,796 |
|
|
Operating lease vehicles, net |
|
|
3,452,595 |
|
|
|
3,134,080 |
|
|
Solar energy systems, leased and to be leased, net |
|
|
6,085,990 |
|
|
|
5,919,880 |
|
|
Property, plant and equipment, net |
|
|
7,016,551 |
|
|
|
5,982,957 |
|
|
Goodwill and intangible assets, net |
|
|
429,592 |
|
|
|
376,145 |
|
|
MyPower customer notes receivable, net of current portion |
|
|
486,350 |
|
|
|
506,302 |
|
|
Restricted cash, net of current portion |
|
|
330,223 |
|
|
|
268,165 |
|
|
Other assets |
|
|
224,536 |
|
|
|
216,751 |
|
|
Total assets |
|
$ |
25,053,726 |
|
|
$ |
22,664,076 |
|
|
Liabilities and Equity |
|
|
|
|
|
|
|
|
|
Current liabilities |
|
|
|
|
|
|
|
|
|
Accounts payable |
|
$ |
2,075,333 |
|
|
$ |
1,860,341 |
|
|
Accrued liabilities and other |
|
|
1,460,367 |
|
|
|
1,210,028 |
|
|
Deferred revenue |
|
|
841,494 |
|
|
|
763,126 |
|
|
Resale value guarantees |
|
|
248,536 |
|
|
|
179,504 |
|
|
Customer deposits |
|
|
616,398 |
|
|
|
663,859 |
|
|
Current portion of long-term debt and capital leases (1) |
|
|
1,003,311 |
|
|
|
1,150,147 |
|
|
Total current liabilities |
|
|
6,245,439 |
|
|
|
5,827,005 |
|
|
Long-term debt and capital leases, net of current portion (1) |
|
|
7,158,956 |
|
|
|
5,969,500 |
|
|
Deferred revenue, net of current portion |
|
|
955,078 |
|
|
|
851,790 |
|
|
Resale value guarantees, net of current portion |
|
|
2,444,058 |
|
|
|
2,210,423 |
|
|
Other long-term liabilities |
|
|
2,081,822 |
|
|
|
1,891,449 |
|
|
Total liabilities |
|
|
18,885,353 |
|
|
|
16,750,167 |
|
|
Redeemable noncontrolling interests in subsidiaries |
|
|
364,296 |
|
|
|
367,039 |
|
|
Convertible senior notes (1)(2) |
|
|
7,283 |
|
|
|
8,784 |
|
|
Total stockholders' equity |
|
|
4,987,719 |
|
|
|
4,752,911 |
|
|
Noncontrolling interests in subsidiaries |
|
|
809,075 |
|
|
|
785,175 |
|
|
Total liabilities and equity |
|
$ |
25,053,726 |
|
|
$ |
22,664,076 |
|
|
(1) |
Breakdown of our debt and assumed debt from the SolarCity acquisition is as follows: |
|
Recourse debt |
|
$ |
5,365,050 |
|
|
$ |
4,630,886 |
|
|
Non-recourse debt |
|
$ |
2,536,289 |
|
|
$ |
2,375,782 |
|
|
(2) |
Our common stock price exceeded the conversion threshold price of our convertible senior notes due 2018 (2018 Notes) issued in May 2013; therefore, the 2018 Notes are convertible at the holder’s option during the first quarter of 2017. As such, the carrying value of the 2018 Notes was classified as a current liability as of March 31, 2017 and the difference between the principal amount and the carrying value of the 2018 Notes was reflected as convertible debt in mezzanine equity on our condensed consolidated balance sheet as of March 31, 2017. |
(Unaudited)
(In thousands)
Condensed Consolidated Statement of Cash Flows
|
|
|
Three Months Ended |
|
|||||||||
|
|
|
March 31, |
|
|
December 31, |
|
|
March 31, |
|
|||
|
|
|
2017 |
|
|
2016 |
|
|
2016 |
|
|||
|
Cash Flows From Operating Activities |
|
|
|
|
|
|
|
|
|
|
|
|
|
Net loss |
|
$ |
(397,181 |
) |
|
$ |
(219,469 |
) |
|
$ |
(282,267 |
) |
|
Adjustments to reconcile net loss to net cash used in operating activities: |
|
|
|
|
|
|
|
|
|
|
|
|
|
Depreciation and amortization |
|
|
376,602 |
|
|
|
326,939 |
|
|
|
156,460 |
|
|
Stock-based compensation |
|
|
103,717 |
|
|
|
87,711 |
|
|
|
89,658 |
|
|
Losses (gains) related to the SolarCity acquisition |
|
|
11,571 |
|
|
|
(88,727 |
) |
|
|
— |
|
|
Other |
|
|
98,260 |
|
|
|
(8,068 |
) |
|
|
57,573 |
|
|
Changes in operating assets and liabilities, net of effect of business combinations |
|
|
(262,780 |
) |
|
|
(546,595 |
) |
|
|
(271,029 |
) |
|
Net cash used in operating activities |
|
|
(69,811 |
) |
|
|
(448,209 |
) |
|
|
(249,605 |
) |
|
Cash Flows From Investing Activities |
|
|
|
|
|
|
|
|
|
|
|
|
|
Capital expenditures |
|
|
(552,624 |
) |
|
|
(521,612 |
) |
|
|
(216,859 |
) |
|
Payments for the cost of solar energy systems, leased and to be leased |
|
|
(219,948 |
) |
|
|
(159,669 |
) |
|
|
— |
|
|
Business combinations, net of cash acquired |
|
|
(109,147 |
) |
|
|
213,523 |
|
|
|
— |
|
|
Change in restricted cash and other |
|
|
(45,224 |
) |
|
|
(126,993 |
) |
|
|
(16,960 |
) |
|
Net cash used in investing activities |
|
|
(926,943 |
) |
|
|
(594,751 |
) |
|
|
(233,819 |
) |
|
Cash Flows From Financing Activities |
|
|
|
|
|
|
|
|
|
|
|
|
|
Proceeds from debt activities, net |
|
|
858,547 |
|
|
|
968,613 |
|
|
|
430,000 |
|
|
Collateralized borrowing |
|
|
186,355 |
|
|
|
212,040 |
|
|
|
241,763 |
|
|
Net cash flows from noncontrolling interests |
|
|
78,307 |
|
|
|
180,277 |
|
|
|
— |
|
|
Proceeds from issuance of common stock in a public offering, net of underwriting fees |
|
|
400,175 |
|
|
|
— |
|
|
|
— |
|
|
Other |
|
|
75,365 |
|
|
|
11,897 |
|
|
|
43,672 |
|
|
Net cash provided by financing activities |
|
|
1,598,749 |
|
|
|
1,372,827 |
|
|
|
715,435 |
|
|
Effect of exchange rate changes on cash and cash equivalents |
|
|
11,382 |
|
|
|
(20,908 |
) |
|
|
12,870 |
|
|
Net increase in cash and cash equivalents |
|
|
613,377 |
|
|
|
308,959 |
|
|
|
244,881 |
|
|
Cash and cash equivalents at beginning of period |
|
|
3,393,216 |
|
|
|
3,084,257 |
|
|
|
1,196,908 |
|
|
Cash and cash equivalents at end of period |
|
$ |
4,006,593 |
|
|
$ |
3,393,216 |
|
|
$ |
1,441,789 |
|
Supplemental Consolidated Financial Information
|
|
|
Three Months Ended |
|
|||||||||
|
|
|
March 31, |
|
|
December 31, |
|
|
March 31, |
|
|||
|
|
|
2017 |
|
|
2016 |
|
|
2016 |
|
|||
|
Other Selected Financial Information |
|
|
|
|
|
|
|
|
|
|
|
|
|
Cash flows used in operating activities |
|
$ |
(69,811 |
) |
|
$ |
(448,209 |
) |
|
$ |
(249,605 |
) |
|
Change in collateralized lease borrowing |
|
|
186,355 |
|
|
|
212,040 |
|
|
|
241,763 |
|
|
Operating cash flows plus change in collateralized lease borrowing |
|
$ |
116,544 |
|
|
$ |
(236,169 |
) |
|
$ |
(7,842 |
) |
|
|
|
|
|
|
|
|
|
|
|
|
|
|
|
Free Cash Flow |
|
|
|
|
|
|
|
|
|
|
|
|
|
Cash flows used in operating activities |
|
$ |
(69,811 |
) |
|
$ |
(448,209 |
) |
|
$ |
(249,605 |
) |
|
Capital expenditures |
|
|
(552,624 |
) |
|
|
(521,612 |
) |
|
|
(216,859 |
) |
|
Free cash flow |
|
$ |
(622,435 |
) |
|
$ |
(969,821 |
) |
|
$ |
(466,464 |
) |
Reconciliation of GAAP to Non-GAAP Financial Information
(Unaudited)
(In thousands, except per share data)
|
|
|
Three Months Ended |
|
|||||||||
|
|
|
March 31, |
|
|
December 31, |
|
|
March 31, |
|
|||
|
|
|
2017 |
|
|
2016 |
|
|
2016 |
|
|||
|
Automotive gross profit - GAAP |
|
$ |
626,925 |
|
|
$ |
449,701 |
|
|
$ |
246,748 |
|
|
Stock-based compensation expense |
|
|
10,031 |
|
|
|
8,562 |
|
|
|
6,403 |
|
|
ZEV credit revenue recognized |
|
|
— |
|
|
|
(19,840 |
) |
|
|
(56,987 |
) |
|
Automotive gross profit excluding SBC and ZEV credit - Non-GAAP |
|
$ |
636,956 |
|
|
$ |
438,423 |
|
|
$ |
196,164 |
|
|
|
|
|
|
|
|
|
|
|
|
|
|
|
|
Automotive gross margin - GAAP |
|
|
27.4 |
% |
|
|
22.6 |
% |
|
|
24.0 |
% |
|
Stock-based compensation expense |
|
|
0.4 |
% |
|
|
0.4 |
% |
|
|
0.6 |
% |
|
ZEV credit revenue recognized |
|
|
0.0 |
% |
|
|
-0.8 |
% |
|
|
-4.4 |
% |
|
Automotive gross margin excluding SBC and ZEV credit - Non-GAAP |
|
|
27.8 |
% |
|
|
22.2 |
% |
|
|
20.2 |
% |
|
|
|
|
|
|
|
|
|
|
|
|
|
|
|
Net Income (loss) attributable to common stockholders - GAAP |
|
$ |
(330,277 |
) |
|
$ |
(121,337 |
) |
|
$ |
(282,267 |
) |
|
Stock-based compensation expense |
|
|
103,717 |
|
|
|
87,711 |
|
|
|
89,657 |
|
|
Acquisition related transaction costs |
|
|
— |
|
|
|
15,807 |
|
|
|
— |
|
|
(Gains) losses related to the acquisition of SolarCity |
|
|
11,571 |
|
|
|
(88,727 |
) |
|
|
— |
|
|
Net income (loss) attributable to common stockholders - Non-GAAP |
|
$ |
(214,989 |
) |
|
$ |
(106,546 |
) |
|
$ |
(192,610 |
) |
|
|
|
|
|
|
|
|
|
|
|
|
|
|
|
Net income (loss) per share attributable to common stockholders, basic and diluted - GAAP |
|
$ |
(2.04 |
) |
|
$ |
(0.78 |
) |
|
$ |
(2.13 |
) |
|
Stock-based compensation expense |
|
|
0.64 |
|
|
|
0.56 |
|
|
|
0.67 |
|
|
Acquisition related transaction costs |
|
|
— |
|
|
|
0.10 |
|
|
|
— |
|
|
(Gains) losses related to the acquisition of SolarCity |
|
|
0.07 |
|
|
|
(0.57 |
) |
|
|
— |
|
|
Net income (loss) per share attributable to common stockholders, basic and diluted - Non-GAAP |
|
$ |
(1.33 |
) |
|
$ |
(0.69 |
) |
|
$ |
(1.46 |
) |
|
Shares used in per share calculation, basic and dilutive - GAAP and Non-GAAP |
|
|
162,129 |
|
|
|
155,024 |
|
|
|
132,676 |
|