Attached files
| file | filename |
|---|---|
| EX-99.1 - EXHIBIT 99.1 - Sucampo Pharmaceuticals, Inc. | exh_991.htm |
| 8-K - FORM 8-K - Sucampo Pharmaceuticals, Inc. | f8k_050317.htm |
EXHIBIT 99.2

First Quarter 2017 Corporate Update and Financial Results May 3, 2017 1

Introductions and Forward - Looking Statements Silvia Taylor, SVP Investor Relations & Corporate Affairs

Agenda Introductions and Forward - Looking Statements Silvia Taylor Corporate Update Peter Greenleaf Pipeline Update Peter Kiener , D. Phil Financial Update Peter Pfreundschuh Closing Remarks Peter Greenleaf 3

Forward Looking Statement This presentation contains "forward - looking statements" as that term is defined in the Private Securities Litigation Reform Act of 1995. These statements are based on management's current expectations and involve risks and uncertainties, which may cause results to dif fer materially from those set forth in the statements. The forward - looking statements may include statements regarding product development, and othe r statements that are not historical facts. The following factors, among others, could cause actual results to differ from those set forth in t he forward - looking statements: the impact of pharmaceutical industry regulation and health care legislation; Sucampo's ability to accurately predict future market conditions; Sucampo’s ability to successfully integrate the operations of acquired businesses; dependence on the effectiveness of Sucampo's patents and other protections for innovative products; the effects of competitive products on Sucampo’s products; and the exposure to litigation and/or regulatory actions. No forward - looking statement can be guaranteed and actual results may differ materially from those projected. Sucampo undertakes no obligation to publicly update any forward - looking statement, whether as a result of new information, future events, or otherwise. Forward - look ing statements in this presentation should be evaluated together with the many uncertainties that affect Sucampo's business, particularly those ment ion ed in the risk factors and cautionary statements in Sucampo's most recent Form 10 - K as filed with the Securities and Exchange Commission on March 8, 20 17, as well as its filings with the Securities and Exchange Commission on Forms 8 - K and 10 - Q since the filing of the Form 10 - K, all of which Su campo incorporates by reference. 4

Non - GAAP Metrics This presentation contains three financial metrics ( Adjusted Net Income, EBITDA , Adjusted EBITDA and Free Cash Flow ) that are considered “non - GAAP” financial metrics under applicable Securities and Exchange Commission rules and regulations. These non - GAAP financial metrics should be considered supplemental to and not a substitute for financial information prepared in accordance with generally acc ept ed accounting principles. The company’s definition of these non - GAAP metrics may differ from similarly titled metrics used by others. Adjusted Net Income adjusts for specified items that can be highly variable or difficult to predict, and various non - cash items, which includes amortization of acquired intangibles, inventory step - up adjustment, R&D intangible asset impairment, one - time severance payments, restructuring costs, acquisition rel ated expenses, amortization of debt financing costs, debt extinguishment, R&D license option expense, foreign currency translations and the tax impact of these adjustments. EBITDA reflects net income excluding the impact of provision for income taxes, interest expense, interest incom e, depreciation, R&D intangible asset impairment, amortization of acquired intangibles and inventory step up adjustment. Adjusted EBITDA reflects EB ITDA and adjusts for specified items that can be highly variable or difficult to predict, and various non - cash items, which includes share based comp ensation expense, restructuring costs, one time severance payments, acquisition related expenses, debt extinguishment, R&D license option, and for eign currency translations. Free cash flow reflects net cash provided by operating activities less expenditures made for property and equi pme nt. The company views these non - GAAP financial metrics as a means to facilitate management’s financial and operational decision - making, includin g evaluation of the company’s historical operating results and comparison to competitors’ operating results. These non - GAAP financial metrics reflec t an additional way of viewing aspects of the company’s operations that, when viewed with GAAP results may provide a more complete understanding of factors and trends affecting the company’s business. The determination of the amounts that are excluded from these non - GAAP financial metrics is a matter of management judgment and depends upon, among other factors, the nature of the underlying expense or income amounts. Because non - GAAP financial metrics exclude the effe ct of items that will increase or decrease the company’s reported results of operations, management strongly encourages investors to review th e c ompany’s consolidated financial statements and publicly - filed reports in their entirety. 5

Q1 2017 Corporate Update Peter Greenleaf, Chairman and CEO

Vtesse Inc. Acquisition • Sucampo acquired Vtesse, including its orphan drug candidate for Niemann - Pick Type C1 (NPC - 1), VTS - 270, for $200 million upfront consideration • VTS - 270 for the treatment of NPC - 1 in global pivotal registration program • Ultra - rare disorder with devastating and ultimately fatal outcome • Fully enrolled, results in 2018 • Builds on Sucampo’s capabilities, global development platform and focus on specialized areas of high, unmet medical need • Complementary to FAP program with CPP • Additive to orphan and pediatric development focus • Accretive to earnings beginning in 2019

Strong Q1 2017 U.S. AMITIZA Performance • Takeda’s AMITIZA net sales for royalty calculation purposes • Q1 grew 12% YoY to $102M • Driven by increased volume and price • Royalty revenue grew 12% YoY to $18M • U.S. AMITIZA product sales to Takeda of $11M • Total U.S. revenue of $30M • AMITIZA TRx • Q1 IMS: ~381,000 TRx , increase of approximately 5% YoY • Believe related to re - gaining CVS/Caremark commercial business 8

Strong Japan AMITIZA Performance • Sucampo Q1 revenue: $20M, growth of 38% YoY • Growth driven by volume • Increased 34% YoY • Patient demand remains strong 9

2017 Guidance Maintained • Total revenue: $220 million to $230 million • Adjusted net income: $56 million to $66 million • Adjusted EBITDA: $109 million to $119 million • Adjusted EPS: $1.00 to $1.10 • Free cash flow of $86 million to $96 million 10

Pipeline Update Peter Kiener, D. Phil, CSO 11

VTS - 270 for Treatment of NPC - 1 • VTS - 270 is a highly - purified mixture of 2 - hydroxypropyl - ß - cyclodextrins with a specific compositional fingerprint that targets cholesterol and sphingolipid storage • Early pre - clinical and clinical data have shown encouraging results • Recently, data published in PLOS ONE, which add further to the scientific rationale for the drug to be used in NPC - 1 • Results support specific compositional fingerprint and purity of VTS - 270 • Likely linked to potential clinical efficacy and safety

VTS - 270 Pivotal Trial 13 13 Until regulatory decision • IT injections every 2 weeks • Trial fully enrolled • Pivotal data expected in mid - 2018 • Potential regulatory approval in U.S. and EU in 1H19 • Phase 1 patients currently in Part C on therapy >36 months 12 months for any single subject Part A N = 12 subjects Part B N = 39 subjects for a total of 51 Part C Sham control 3 subjects 1,800 mg 3 subjects 1,200 mg 3 subjects 900 mg 3 subjects 900 mg dose 35 subjects total on active Sham control 16 subjects total Open label extension No control group 900 mg dose Open for Phase 1 subjects RESCUE OPTION (*) 13

Product Pipeline 14 Sucampo Program Option

Financial Update Peter Pfreundschuh , CFO 15

Continued Financial and Operational Performance Q1 REVENUE • Overall revenue grew 19% YoY to $56M • Product sales grew 28% to $34M • Product royalty revenue grew 12% to $18M EARNINGS Summary of Results Q1 - 17 % Increase / (Decrease) over Q1 - 16 Net Income GAAP $4.6M 214% EPS GAAP – diluted $0.10 200% EBITDA $18.0M 26% Adjusted Net Income $13.0M 33% Adjusted EPS – diluted $0.23 0% Adjusted EBITDA $28.0M 38%
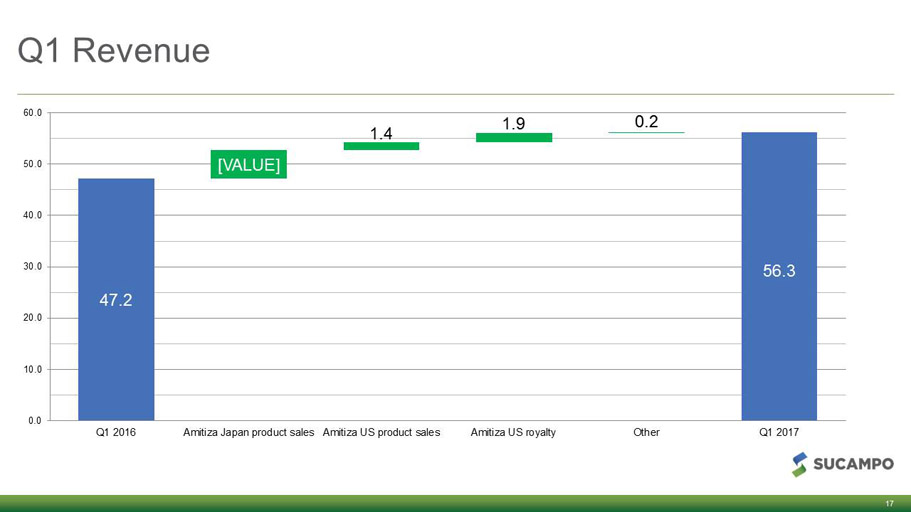
Q1 Revenue 17 [VALUE] 1.4 1.9 0.2 56.3 47.2 0.0 10.0 20.0 30.0 40.0 50.0 60.0 Q1 2016 Amitiza Japan product sales Amitiza US product sales Amitiza US royalty Other Q1 2017

Q1 Adjusted Net Income 18 13.0 8.9 7.1 3.0 0.3 11.5 6.5 3.9 0.7 9.8 0.0 5.0 10.0 15.0 20.0 25.0 30.0 35.0 Q1 2016 Gross margin Acquisition related exp Non-Operating expense Restructuring/ severance Inventory step-up Tax rate R&D License Option Exp Other Q1 2017

Key Balance Sheet Items 19

Closing Remarks Peter Greenleaf, Chairman and CEO 20

2017 Areas of Focus 1. Deliver outstanding financial performance 2. Progress proprietary pipeline programs 3. Evaluate and execute on additional opportunities for growth

Q&A Session

Reconciliation of GAAP Net Loss to Non - GAAP Net Income RECONCILIATION OF GAAP NET INCOME TO ADJUSTED NET INCOME (in thousands, except per share amounts) Three Months Ended Three Months Ended March 31, 2017 March 31, 2016 Adjusted Net Income: GAAP net income (loss) 4,624 (4,057) Amortization intangibles 6,753 5,911 Amortization inventory step - up 0 8,932 R&D License Option Expense 0 3,000 Restructuring costs 365 183 One time severance payments 476 0 Acquisition related expenses 7,010 527 Amortization of financing costs 472 922 Foreign Currency Translation (194) 351 Tax effect on adjustments (6,528) (6,019) Total Non - GAAP Adjustments 8,354 13,808 Adjusted Net Income 12,978 9,750 GAAP Weighted Average Shares - Dilutive 62,107 42,539 Adjusted Weighted Average Shares - Diluted 62,107 42,539 GAAP Net Income per Share - Diluted 0.10 (0.10) Adjusted Net Income per Share - Diluted 0.23 0.23

Reconciliation of Income from Operations to Adjusted EBITDA RECONCILIATION OF GAAP NET INCOME TO ADJUSTED EBITDA (in thousands, except per share amounts) Three Months Ended Three Months Ended March 31, 2017 March 31, 2016 GAAP net income 4,624 (4,057) Adjustments: Taxes 3,585 (3,038) Interest expense 2,890 6,270 Interest income (28) (25) Depreciation and amortization 198 259 Amortization intangibles 6,753 5,911 Amortization inventory step - up 0 8,932 EBITDA 18,022 14,252 Non - GAAP Adjustments: Share Based Compensation 2,275 1,915 R
&D License Option expense 0 3,000 Restructuring costs 365 183 One time severance payments 476 0 Acquisition related expenses 7,010 527 Foreign Currency Translation (194) 351 Total Non - GAAP Adjustments 9,932 5,976 Adjusted EBITDA 27,954 20,228