Attached files
| file | filename |
|---|---|
| EX-99.1 - EX-99.1 - Howard Hughes Corp | ex-99d1.htm |
| 8-K - 8-K - Howard Hughes Corp | f8-k.htm |
Exhibit 99.2
NYSE: HHC
|
Supplemental Information |
|
3/31/2017 |

|
|
|
|
The Howard Hughes Corporation |
|
|
13355 Noel Road, 22nd Floor |
Phone: 214.741.7744 |
|
Dallas, TX 75240 |
www.howardhughes.com |
|
|
Cautionary Statements |

Forward Looking Statements
This presentation includes forward-looking statements. Forward-looking statements give our current expectations relating to our financial condition, results of operations, plans, objectives, future performance and business. You can identify forward-looking statements by the fact that they do not relate strictly to current or historical facts. These statements may include words such as “anticipate,” “believe,” “estimate,” “expect,” “forecast,” “intend,” “likely,” “may,” “plan,” “project,” “realize,” “should,” “transform,” “would,” and other statements of similar expression. Forward-looking statements should not be relied upon. They give our expectations about the future and are not guarantees. These statements involve known and unknown risks, uncertainties and other factors that may cause our actual results, performance and achievements to materially differ from any future results, performance and achievements expressed or implied by such forward-looking statements. For a discussion of the risk factors that could have an impact these forward-looking statements, see our Annual Report on Form 10-K for the fiscal year ended December 31, 2016. The statements made herein speak only as of the date of this presentation and we do not undertake to update this information except as required by law. Past performance does not guarantee future results. Performance during time periods shown is limited and may not reflect the performance in different economic and market cycles.
Non-GAAP Financial Measures
We use certain non-GAAP performance measures, in addition to the required GAAP presentations, as we believe these measures improve the understanding of our operational results and makes comparisons of operating results among peer companies more meaningful. Management continually evaluates the usefulness, relevance, limitations, and calculation of the Company’s reported non-GAAP performance measures to determine how best to provide relevant information to the public, and thus such reported measures could change. The non-GAAP financial measures used in this presentation are funds from operations, or FFO, core funds from operations, or Core FFO, and net operating income, or NOI.
FFO is defined by the National Association of Real Estate Investment Trusts (NAREIT) as net income calculated in accordance with GAAP, excluding gains or losses from real estate dispositions, plus real estate depreciation and amortization and impairment charges (which we believe are not indicative of the performance of our operating portfolio). We calculate FFO in accordance with NAREIT’s definition. Since FFO excludes depreciation and amortization and gains and losses from depreciable property dispositions, and impairments, it can provide a performance measure that, when compared year over year, reflects the impact on operations from trends in occupancy rates, rental rates, operating costs, acquisition and development activities, and financing costs. This provides a perspective of our financial performance not immediately apparent from net income determined in accordance with GAAP. Core FFO is calculated by adjusting FFO to exclude the impact of certain non-cash and/or nonrecurring income and expense items, as set forth in the calculation herein. These items can vary greatly from period to period, depending upon the volume of our acquisition activity and debt retirements, among other factors. We believe that by excluding these items, Core FFO serves as a useful, supplementary measure of the ongoing operating performance of our core operations, and we believe it is used by investors in a similar manner. Core FFO is a non-GAAP and non-standardized measure and may be calculated differently by other peer companies.
We define NOI as operating revenues (rental income, tenant recoveries and other revenue) less operating expenses (real estate taxes, repairs and maintenance, marketing and other property expenses). NOI excludes straight-line rents and amortization of tenant incentives, net interest expense, ground rent amortization, demolition costs, amortization, depreciation, and development-related marketing costs. We also generally include our share of NOI from equity method joint ventures and distributions from cost basis investments herein unless otherwise noted.
While Core FFO, FFO and NOI are relevant and widely used measures of operating performance of real estate companies, they do not represent cash flows from operations or net income as defined by GAAP and should not be considered an alternative to those measures in evaluating our liquidity or operating performance. FFO, Core FFO and NOI do not purport to be indicative of cash available to fund our future cash requirements. Further, our computations of FFO, Core FFO and NOI may not be comparable to FFO, Core FFO and NOI reported by other real estate companies. We have included a reconciliation of NOI, FFO and Core FFO to GAAP net income in this presentation. Non-GAAP financial measures should not be considered independently, or as a substitute, for financial information presented in accordance with GAAP.
Additional Information
Our website address is www.howardhughes.com. Our Annual Report on Form 10-K, Quarterly Reports on Form 10-Q, Current Reports on Form 8-K and other publicly filed documents are available and may be accessed free of charge through the “Investors” section of our website under the SEC Filings subsection, as soon as reasonably practicable after those documents are filed with, or furnished to, the SEC. Also available through our Investors section of our website are beneficial ownership reports filed by our directors and executive officers on Forms 3, 4 and 5.
|
1 |
www.howardhughes.com |
|
|
Table of Contents |
|
FINANCIAL OVERVIEW |
PORTFOLIO OVERVIEW |
PORTFOLIO PERFORMANCE |
DEBT & OTHER |
|||||||
| 3 | 10 | 12 | 19 | |||||||
| 4 | 11 | 13 | 20 | |||||||
| 5 | 14 | 21 | ||||||||
| 6 | 15 | 22 | ||||||||
| 7 | 16 |
Reconciliation of Non-GAAP |
23 | |||||||
| 8 | 17 | |||||||||
| 9 | 18 |
|
2 |
www.howardhughes.com |
|
Company Overview – Q1-17 |
|
Recent Company Highlights |
|||||||||
|
Exchange / Ticker Share Price - March 31, 2017 Earnings / share FFO / Share Core FFO / Share
|
NYSE: HHC $ 117.25 $ 0.13 $ 0.23 $ 1.66 |
|
LAS VEGAS--(BUSINESS WIRE)--May 1, 2017-- The Howard Hughes Corporation® (NYSE: HHC) announced today that it has finalized a 15-year, build-to-suit lease with Aristocrat Technologies, Inc., allowing the leading global provider of land-based and online gaming solutions to consolidate several of its Las Vegas facilities to a new campus in the Summerlin® master planned community. Aristocrat’s new campus will be located minutes away from Downtown Summerlin®, reflecting the growth of commercial offerings in the community’s urban core as Summerlin continues to gain appeal as a workplace. The relocation is in line with the growing corporate trend to locate workplaces closer to where employees live in an effort to shorten commutes and boost quality of life.
DALLAS--(BUSINESS WIRE)--Mar. 30, 2017-- The Howard Hughes Corporation® (NYSE: HHC) (the “Company”) today announced the expiration of its previously announced tender offer and consent solicitation (the “Tender Offer”) for any and all of its existing 6.875% senior notes due 2021 (the “Notes”), which commenced on March 2, 2017 and is described in the Offer to Purchase and Consent Solicitation Statement, dated March 2, 2017 (the “Offer to Purchase”), and a related Consent and Letter of Transmittal (together with the Offer to Purchase, the “Offer Documents”). The Company has also completed the redemption of all of its outstanding Notes not tendered in the Tender Offer at a redemption price equal to 105.156% of the unpaid principal amount (or $158.3 million, plus $8.2 million, or approximately $5.16 per $1,000 principal amount of Notes) plus accrued and unpaid interest on such Notes up to, but excluding, the redemption date. The Company used a portion of its offering of $800 million in aggregate principal amount of 5.375% senior notes due 2025, which closed on March 16, 2017, to redeem the outstanding Notes not tendered by the holders.
CHICAGO--(BUSINESS WIRE)--Mar. 17, 2017-- The Howard Hughes Corporation® (NYSE: HHC) received unanimous approval at today’s Chicago Planning Commission meeting for its future trophy-class office building to be built at 110 North Wacker Drive, in collaboration with Riverside Investment & Development, Goettsch Partners and CBRE – the development, design and leasing team behind the recently completed 150 North Riverside Plaza office tower. With its prominent riverfront location, 110 North Wacker is a highly desirable office development site in the heart of the city, designed to be a dynamic addition to Chicago’s iconic skyline.
For more press releases, please visit www.howardhughes.com/press |
||||||||
|
|
|
|
|
|
|||||||
|
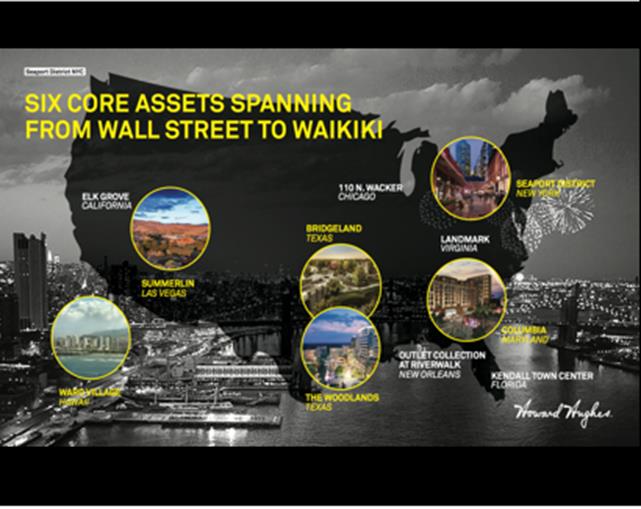
Operating Portfolio by Region |
|
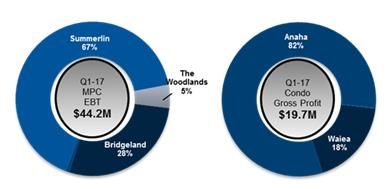
Q1-17 MPC & Condominium Results |
|||||||||
|
|
|
$ in millions |
|
$ in millions |
|||||||
|
|
|
||||||||||
|
|
Q1-17 MPC EBT |
|
Q1-17 Condo Gross Profit |
||||||||
|
|
Bridgeland |
|
$13.4 |
|
Waiea |
|
$3.5 |
||||
|
|
Columbia |
|
(0.3) |
|
Anaha |
|
16.2 |
||||
|
|
Summerlin |
|
30.0 |
|
Ke Kilohana |
|
0.0 |
||||
|
|
The Woodlands |
|
1.1 |
|
Ae`o |
|
— |
||||
|
|
Total |
|
$44.2 |
|
Total |
|
$19.7 |
||||
|
|
|
|
|
||||||||
|
|
|
|
|
||||||||
|
3 |
www.howardhughes.com |
|
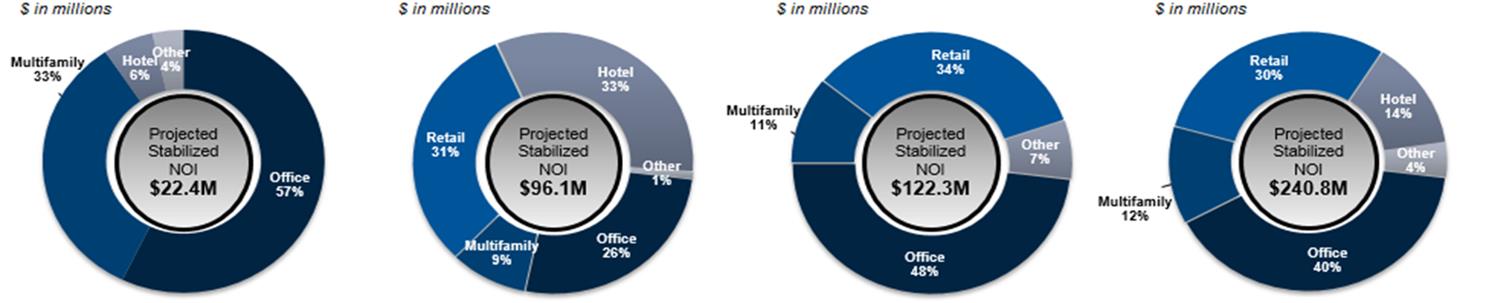
Path to Annual Stabilized NOI |
||||||||||||||
|
Currently Under Construction |
Currently Unstabilized |
Currently Stabilized |
Total |
|||||||||||
|
Retail & Office S.F. |
513,000 |
Retail & Office S.F. |
2,043,656 |
Retail & Office S.F. |
4,569,966 |
Retail & Office S.F. |
7,126,622 | |||||||
|
Multifamily Units |
729 |
Multifamily Units |
514 |
Multifamily Units |
1,108 |
Multifamily Units |
2,351 | |||||||
|
Hotel Keys |
72 |
Hotel Keys |
913 |
Hotel Keys |
- |
Hotel Keys |
985 | |||||||
|
Other Units |
784 |
Other Units |
654 |
Other Units |
- |
Other Units |
1,438 | |||||||
|
Projected Stabilized NOI |
$ 22.4
|
Projected Stabilized NOI |
$ 96.1
|
Projected Stabilized NOI |
$ 122.3
|
Projected Stabilized NOI |
$ 240.8
|
|||||||
|
|
|
|
|
|
|
|
|
|
|
|
|
|
|
|
|
Q1-17 - Operating Results by Property Type |
|
Currently Under Construction |
|
Currently Unstabilized |
|
Currently Stabilized |
|
Total |
|
|
||||||
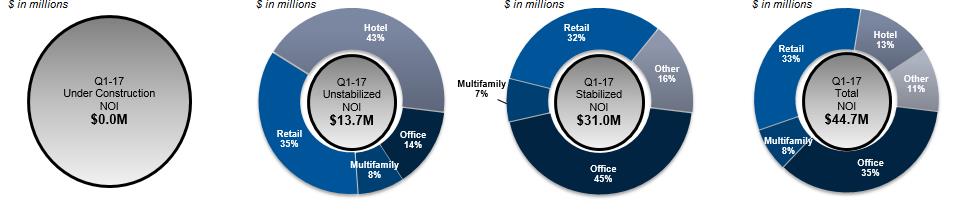
Note: Path to NOI Stabilization charts above exclude Seaport NOI until we have greater clarity with respect to the performance of our tenants. See page 13 for Stabilized NOI Yield and other project information.
|
4 |
www.howardhughes.com |
|
Company Profile |
|
Q1 2017 |
|
Q4 2016 |
|
Q3 2016 |
|
Q2 2016 |
|
Q1 2016 |
|
|
FY 2016 |
|
FY 2015 |
|
|||||||
|
Share price |
|
$ |
117.25 |
|
$ |
114.10 |
|
$ |
114.50 |
|
$ |
114.32 |
|
$ |
105.89 |
|
|
$ |
114.10 |
|
$ |
113.16 |
|
|
Market Capitalization |
|
$ |
5.1 |
b |
$ |
4.9 |
b |
$ |
4.9 |
b |
$ |
4.9b |
b |
$ |
4.5 |
b |
|
$ |
4.9 |
b |
$ |
4.9 |
b |
|
Enterprise Value1 |
|
$ |
7.3 |
b |
$ |
6.9 |
b |
$ |
7.1 |
b |
$ |
6.9b |
b |
$ |
6.3 |
b |
|
$ |
6.9 |
b |
$ |
6.9 |
b |
|
Dilutive effect of stock options |
|
|
241 |
|
|
289 |
|
|
299 |
|
|
277 |
|
|
239 |
|
|
|
277 |
|
|
316 |
|
|
Warrants2 |
|
|
2,641 |
|
|
2,894 |
|
|
2,892 |
|
|
2,835 |
|
|
2,570 |
|
|
|
2,894 |
|
|
2,873 |
|
|
Weighted avg. shares - basic |
|
|
39,799 |
|
|
39,492 |
|
|
39,502 |
|
|
39,492 |
|
|
39,473 |
|
|
|
39,492 |
|
|
39,470 |
|
|
Weighted avg. shares - diluted |
|
|
42,757 |
|
|
42,753 |
|
|
42,760 |
|
|
42,664 |
|
|
42,400 |
|
|
|
42,729 |
|
|
42,754 |
|
|
Diluted shares outstanding (in thousands) |
|
|
43,194 |
|
|
42,973 |
|
|
43,030 |
|
|
42,946 |
|
|
42,633 |
|
|
|
42,961 |
|
|
42,904 |
|
|
|
|
|
|
|
|
|
|
|
|
|
|
|
|
|
|
|
|
|
|
|
|
|
|
|
Earnings Profile |
|
|
|
|
|
|
|
|
|
|
|
|
|
|
|
|
|
|
|
|
|
|
|
|
|
|
|
|
|
|
|
|
|
|
|
|
|
|
|
|
|
|
|
|
|
|
|
|
|
Operating Segment Income |
|
|
|
|
|
|
|
|
|
|
|
|
|
|
|
|
|
|
|
|
|
|
|
|
Revenues |
|
$ |
79,856 |
|
$ |
76,000 |
|
$ |
71,238 |
|
$ |
72,224 |
|
$ |
63,593 |
|
|
$ |
283,057 |
|
$ |
251,414 |
|
|
Expenses |
|
$ |
39,265 |
|
$ |
38,436 |
|
$ |
39,893 |
|
$ |
36,982 |
|
$ |
36,142 |
|
|
$ |
152,329 |
|
$ |
135,666 |
|
|
Company's Share of Equity Method Investments NOI and Cost Basis Investment |
|
$ |
4,129 |
|
$ |
888 |
|
$ |
569 |
|
$ |
2,272 |
|
$ |
3,932 |
|
|
$ |
8,893 |
|
$ |
4,951 |
|
|
Net Operating Income3 |
|
$ |
44,720 |
|
$ |
38,454 |
|
$ |
31,914 |
|
$ |
37,514 |
|
$ |
31,383 |
|
|
$ |
139,621 |
|
$ |
120,699 |
|
|
Avg. NOI margin |
|
|
56 |
% |
|
51 |
% |
|
45 |
% |
|
52 |
% |
|
49 |
% |
|
|
49 |
% |
|
48 |
% |
|
|
|
|
|
|
|
|
|
|
|
|
|
|
|
|
|
|
|
|
|
|
|
|
|
|
MPC Segment Earnings |
|
|
|
|
|
|
|
|
|
|
|
|
|
|
|
|
|
|
|
|
|
|
|
|
Total revenues |
|
$ |
68,706 |
|
$ |
81,738 |
|
$ |
51,304 |
|
$ |
70,507 |
|
$ |
49,755 |
|
|
$ |
253,304 |
|
$ |
229,865 |
|
|
Total expenses4 |
|
$ |
35,357 |
|
$ |
45,429 |
|
$ |
30,720 |
|
$ |
36,895 |
|
$ |
25,365 |
|
|
$ |
138,409 |
|
$ |
133,612 |
|
|
Interest income, net5 |
|
$ |
5,557 |
|
$ |
5,468 |
|
$ |
5,253 |
|
$ |
5,009 |
|
$ |
5,355 |
|
|
$ |
21,085 |
|
$ |
18,113 |
|
|
Equity in earnings in Real Estate and |
|
|
5,280 |
|
|
20,928 |
|
|
13,699 |
|
|
8,874 |
|
|
— |
|
|
|
43,501 |
|
|
— |
|
|
MPC Segment EBT5 |
|
$ |
44,186 |
|
$ |
62,705 |
|
$ |
39,536 |
|
$ |
47,495 |
|
$ |
29,745 |
|
|
$ |
179,481 |
|
$ |
114,366 |
|
|
|
|
|
|
|
|
|
|
|
|
|
|
|
|
|
|
|
|
|
|
|
|
|
|
|
Condo Gross Profit |
|
|
|
|
|
|
|
|
|
|
|
|
|
|
|
|
|
|
|
|
|
|
|
|
Revenues6 |
|
$ |
80,145 |
|
$ |
123,021 |
|
$ |
115,407 |
|
$ |
125,112 |
|
$ |
122,094 |
|
|
$ |
485,634 |
|
$ |
305,284 |
|
|
Expenses6 |
|
$ |
60,483 |
|
$ |
81,566 |
|
$ |
83,218 |
|
$ |
79,726 |
|
$ |
74,815 |
|
|
$ |
319,325 |
|
$ |
191,606 |
|
|
Condo Net Income |
|
$ |
19,662 |
|
$ |
41,455 |
|
$ |
32,189 |
|
$ |
45,386 |
|
$ |
47,279 |
|
|
$ |
166,309 |
|
$ |
113,678 |
|
|
|
|
|
|
|
|
|
|
|
|
|
|
|
|
|
|
|
|
|
|
|
|
|
|
|
Debt Summary |
|
|
|
|
|
|
|
|
|
|
|
|
|
|
|
|
|
|
|
|
|
|
|
|
|
|
|
|
|
|
|
|
|
|
|
|
|
|
|
|
|
|
|
|
|
|
|
|
|
Total debt payable7 |
|
$ |
2,771,492 |
|
$ |
2,708,460 |
|
$ |
2,865,456 |
|
$ |
2,668,522 |
|
$ |
2,561,944 |
|
|
$ |
2,708,460 |
|
$ |
2,463,122 |
|
|
Fixed rate |
|
$ |
1,324,634 |
|
$ |
1,184,141 |
|
$ |
1,152,897 |
|
$ |
1,114,735 |
|
$ |
1,120,393 |
|
|
$ |
1,184,141 |
|
$ |
1,121,669 |
|
|
Weighted avg. rate |
|
|
4.94 |
% |
|
5.89 |
% |
|
5.99 |
% |
|
6.29 |
% |
|
6.17 |
% |
|
|
5.89 |
% |
|
6.08 |
% |
|
Variable rate |
|
$ |
1,309,169 |
|
$ |
1,363,472 |
|
$ |
1,425,276 |
|
$ |
1,403,762 |
|
$ |
1,374,211 |
|
|
$ |
1,363,472 |
|
$ |
1,313,636 |
|
|
Weighted avg. rate |
|
|
3.45 |
% |
|
3.33 |
% |
|
3.08 |
% |
|
2.76 |
% |
|
2.8 |
% |
|
|
3.33 |
% |
|
2.92 |
% |
|
Short term condominium financing |
|
$ |
137,689 |
|
$ |
160,847 |
|
$ |
287,283 |
|
$ |
150,025 |
|
$ |
67,340 |
|
|
$ |
160,847 |
|
$ |
27,817 |
|
|
Weighted avg. rate |
|
|
7.68 |
% |
|
7.47 |
% |
|
7.28 |
% |
|
7.20 |
% |
|
7.19 |
% |
|
|
7.47 |
% |
|
7.11 |
% |
|
Leverage ratio (debt to enterprise value) |
|
|
38.0 |
% |
|
39.0 |
% |
|
39.9 |
% |
|
38.4 |
% |
|
40.1 |
% |
|
|
38.8 |
% |
|
35.6 |
% |
|
(1) |
Enterprise Value = (Market value of common stock + book value of debt + noncontrolling interest) - cash and equivalents |
|
(2) |
Warrants assume net share settlement. |
|
(3) |
Net Operating Income = Operating Assets NOI excluding properties sold or in redevelopment + Company's Share of Equity Method Investments NOI and the annual Distribution from our Cost Basis Investment. |
|
(4) |
Expenses include both actual and estimated future costs of sales allocated on a relative sales value to land parcels sold, including MPC-level G&A and real estate taxes on remaining residential and commercial land. |
|
(5) |
MPC Segment EBT (Earnings before tax, as discussed in our GAAP financial statements), includes negative interest expense relating to capitalized interest for the segment relating to debt held in other segments and at corporate. |
|
(6) |
Revenues represent "Condominium rights and unit sales" and expenses represent "Condominium rights and unit cost of sales" as stated in our GAAP financial statements, based on the percentage of completion method ("POC"). |
|
(7) |
Represents Total mortgages, notes, and loans payable, as stated in our GAAP financial statements, excluding unamortized deferred financing costs and underwriting fees. |
|
5 |
www.howardhughes.com |
|
In thousands |
|
|
|
|
|
|
|
|
|
||||
|
ASSETS |
|
Q1 2017 |
|
Q1 2016 |
|
|
FY 2016 |
|
FY 2015 |
||||
|
Real estate assets |
|
|
Unaudited |
|
|
Unaudited |
|
|
|
|
|
|
|
|
Master Planned Community assets |
|
$ |
1,672,484 |
|
$ |
1,647,947 |
|
|
$ |
1,669,561 |
|
$ |
1,642,842 |
|
Land |
|
|
314,259 |
|
|
325,412 |
|
|
|
320,936 |
|
|
322,462 |
|
Buildings and equipment |
|
|
2,131,973 |
|
|
1,884,772 |
|
|
|
2,027,363 |
|
|
1,772,401 |
|
Less: accumulated depreciation |
|
|
(266,260) |
|
|
(252,095) |
|
|
|
(245,814) |
|
|
(232,969) |
|
Developments |
|
|
994,864 |
|
|
806,862 |
|
|
|
961,980 |
|
|
1,036,927 |
|
Net property and equipment |
|
|
4,847,320 |
|
|
4,412,898 |
|
|
|
4,734,026 |
|
|
4,541,663 |
|
Net investment in Real Estate and Other Affiliates |
|
|
70,381 |
|
|
56,295 |
|
|
|
76,376 |
|
|
57,811 |
|
Total Real Estate Assets |
|
$ |
4,917,701 |
|
$ |
4,469,193 |
|
|
$ |
4,810,402 |
|
$ |
4,599,474 |
|
Cash and cash equivalents |
|
|
541,508 |
|
|
736,834 |
|
|
|
665,510 |
|
|
445,301 |
|
Accounts Receivable |
|
|
10,177 |
|
|
54,194 |
|
|
|
10,038 |
|
|
11,626 |
|
MUD receivables, net |
|
|
160,189 |
|
|
157,282 |
|
|
|
150,385 |
|
|
139,946 |
|
Deferred expenses |
|
|
64,155 |
|
|
63,532 |
|
|
|
64,531 |
|
|
61,804 |
|
Prepaid expenses and other assets |
|
|
714,412 |
|
|
550,939 |
|
|
|
666,516 |
|
|
463,431 |
|
Total Assets |
|
$ |
6,408,142 |
|
$ |
6,031,974 |
|
|
$ |
6,367,382 |
|
$ |
5,721,582 |
|
|
|
|
|
|
|
|
|
|
|
|
|
|
|
|
LIABILITIES AND EQUITY |
|
|
|
|
|
|
|
|
|
|
|
|
|
|
Liabilities |
|
|
|
|
|
|
|
|
|
|
|
|
|
|
Mortgages, notes and loans payable |
|
$ |
2,750,254 |
|
$ |
2,543,638 |
|
|
$ |
2,690,747 |
|
$ |
2,443,962 |
|
Deferred tax liabilities |
|
|
210,043 |
|
|
141,972 |
|
|
|
200,945 |
|
|
89,221 |
|
Warrant liabilities |
|
|
313,797 |
|
|
277,940 |
|
|
|
332,170 |
|
|
307,760 |
|
Uncertain tax position liability |
|
|
— |
|
|
3,340 |
|
|
|
— |
|
|
1,396 |
|
Accounts payable and accrued expenses |
|
|
516,742 |
|
|
564,621 |
|
|
|
572,010 |
|
|
515,354 |
|
Total Liabilities |
|
$ |
3,790,836 |
|
$ |
3,531,511 |
|
|
$ |
3,795,872 |
|
$ |
3,357,693 |
|
Equity |
|
|
|
|
|
|
|
|
|
|
|
|
|
|
Capital stock |
|
$ |
404 |
|
$ |
398 |
|
|
$ |
398 |
|
$ |
398 |
|
Additional paid-in capital |
|
|
2,893,042 |
|
|
2,851,343 |
|
|
|
2,853,269 |
|
|
2,847,823 |
|
Accumulated deficit |
|
|
(272,253) |
|
|
(336,450) |
|
|
|
(277,912) |
|
|
(480,215) |
|
Accumulated other loss |
|
|
(6,428) |
|
|
(17,760) |
|
|
|
(6,786) |
|
|
(7,889) |
|
Treasury stock |
|
|
(1,231) |
|
|
(840) |
|
|
|
(1,231) |
|
|
— |
|
Total stockholders' equity |
|
|
2,613,534 |
|
|
2,496,691 |
|
|
|
2,567,738 |
|
|
2,360,117 |
|
Non-controlling interest |
|
|
3,772 |
|
|
3,772 |
|
|
|
3,772 |
|
|
3,772 |
|
Total Equity |
|
$ |
2,617,306 |
|
$ |
2,500,463 |
|
|
$ |
2,571,510 |
|
$ |
2,363,889 |
|
|
|
|
|
|
|
|
|
|
|
|
|
|
|
|
Total Liabilities and Equity |
|
$ |
6,408,142 |
|
$ |
6,031,974 |
|
|
$ |
6,367,382 |
|
$ |
5,721,582 |
|
Share Count Details (in thousands) |
|
|
|
|
|
|
|
|
|
|
|
|
|
|
Shares outstanding |
|
|
40,312 |
|
|
39,824 |
|
|
|
39,790 |
|
|
39,715 |
|
Dilutive effect of stock options |
|
|
241 |
|
|
239 |
|
|
|
277 |
|
|
316 |
|
Warrants (assumes net share settlement) |
|
|
2,641 |
|
|
2,570 |
|
|
|
2,894 |
|
|
2,873 |
|
Total Diluted Share Equivalents Outstanding |
|
|
43,194 |
|
|
42,633 |
|
|
|
42,961 |
|
|
42,904 |
|
6 |
www.howardhughes.com |
|
In thousands |
|
Q1 2017 |
|
Q1 2016 |
|
|
FY 2016 |
|
FY 2015 |
||||
|
Revenues: |
|
Unaudited |
|
Unaudited |
|
|
|
|
|
|
|
||
|
Condominium rights and unit sales |
|
$ |
80,145 |
|
$ |
122,094 |
|
|
$ |
485,634 |
|
|
305,284 |
|
Master Planned Community land sales |
|
|
53,481 |
|
|
41,942 |
|
|
|
215,318 |
|
|
187,399 |
|
Builder price participation |
|
|
4,661 |
|
|
4,647 |
|
|
|
21,386 |
|
|
26,846 |
|
Minimum rents |
|
|
46,326 |
|
|
41,309 |
|
|
|
173,268 |
|
|
150,805 |
|
Tenant recoveries |
|
|
11,399 |
|
|
10,528 |
|
|
|
44,330 |
|
|
39,542 |
|
Hospitality revenues |
|
|
19,711 |
|
|
12,909 |
|
|
|
62,252 |
|
|
45,374 |
|
Other land revenues |
|
|
10,582 |
|
|
3,033 |
|
|
|
16,232 |
|
|
14,803 |
|
Other rental and property revenues |
|
|
5,457 |
|
|
3,204 |
|
|
|
16,585 |
|
|
27,035 |
|
Total revenues |
|
$ |
231,762 |
|
$ |
239,666 |
|
|
$ |
1,035,005 |
|
$ |
797,088 |
|
|
|
|
|
|
|
|
|
|
|
|
|
|
|
|
Expenses: |
|
|
|
|
|
|
|
|
|
|
|
|
|
|
Condominium rights and unit cost of sales |
|
$ |
60,483 |
|
$ |
74,815 |
|
|
$ |
319,325 |
|
$ |
191,606 |
|
Master Planned Community cost of sales |
|
|
25,869 |
|
|
15,688 |
|
|
|
95,727 |
|
|
88,065 |
|
Master Planned Community operations |
|
|
9,394 |
|
|
9,594 |
|
|
|
42,371 |
|
|
44,907 |
|
Other property operating costs |
|
|
18,508 |
|
|
15,742 |
|
|
|
65,978 |
|
|
72,751 |
|
Rental property real estate taxes |
|
|
7,537 |
|
|
6,748 |
|
|
|
26,847 |
|
|
24,138 |
|
Rental property maintenance costs |
|
|
3,028 |
|
|
3,132 |
|
|
|
12,392 |
|
|
10,712 |
|
Hospitality operating costs |
|
|
13,845 |
|
|
10,475 |
|
|
|
49,359 |
|
|
34,839 |
|
Provision for doubtful accounts |
|
|
535 |
|
|
3,041 |
|
|
|
5,664 |
|
|
4,030 |
|
Demolition costs |
|
|
65 |
|
|
472 |
|
|
|
2,212 |
|
|
3,297 |
|
Development-related marketing costs |
|
|
4,205 |
|
|
4,531 |
|
|
|
22,184 |
|
|
25,466 |
|
General and administrative |
|
|
18,117 |
|
|
20,324 |
|
|
|
86,588 |
|
|
81,345 |
|
Depreciation and amortization |
|
|
25,524 |
|
|
22,972 |
|
|
|
95,864 |
|
|
98,997 |
|
Total expenses |
|
$ |
187,110 |
|
$ |
187,534 |
|
|
$ |
824,511 |
|
$ |
680,153 |
|
|
|
|
|
|
|
|
|
|
|
|
|
|
|
|
Operating income before other items |
|
|
44,652 |
|
|
52,132 |
|
|
|
210,494 |
|
|
116,935 |
|
|
|
|
|
|
|
|
|
|
|
|
|
|
|
|
Other: |
|
|
|
|
|
|
|
|
|
|
|
|
|
|
Provision for impairment |
|
|
— |
|
|
— |
|
|
|
(35,734) |
|
|
— |
|
Gain on sale of properties |
|
|
32,215 |
|
|
140,479 |
|
|
|
140,549 |
|
|
— |
|
Other income, net |
|
|
687 |
|
|
359 |
|
|
|
11,453 |
|
|
1,829 |
|
Total other |
|
$ |
32,902 |
|
$ |
140,838 |
|
|
$ |
116,268 |
|
$ |
1,829 |
|
|
|
|
|
|
|
|
|
|
|
|
|
|
|
|
Operating Income |
|
$ |
77,554 |
|
$ |
192,970 |
|
|
$ |
326,762 |
|
$ |
118,764 |
|
|
|
|
|
|
|
|
|
|
|
|
|
|
|
|
Interest expense, net of interest income |
|
|
(17,236) |
|
|
(15,724) |
|
|
|
(64,365) |
|
|
(59,158) |
|
Loss on early extinguishment of debt |
|
|
(46,410) |
|
|
— |
|
|
|
— |
|
|
— |
|
Warrant liability (loss) / gain |
|
|
(12,562) |
|
|
29,820 |
|
|
|
(24,410) |
|
|
58,320 |
|
Gain on acquisition of joint venture partner's interest |
|
|
5,490 |
|
|
— |
|
|
|
27,088 |
|
|
— |
|
(Loss) / gain on disposal of operating assets |
|
|
— |
|
|
— |
|
|
|
(1,117) |
|
|
29,073 |
|
Equity in earnings from Real Estate and Other Affiliates |
|
|
8,520 |
|
|
1,932 |
|
|
|
56,818 |
|
|
3,721 |
|
Income (loss) before taxes |
|
|
15,356 |
|
|
208,998 |
|
|
|
320,776 |
|
|
150,720 |
|
Provision for income taxes |
|
|
(9,697) |
|
|
(65,233) |
|
|
|
(118,450) |
|
|
(24,001) |
|
Net income |
|
|
5,659 |
|
|
143,765 |
|
|
|
202,326 |
|
|
126,719 |
|
Net income attributable to noncontrolling interests |
|
|
— |
|
|
— |
|
|
|
(23) |
|
|
— |
|
Net income (loss) attributable to common stockholders |
|
$ |
5,659 |
|
$ |
143,765 |
|
|
$ |
202,303 |
|
$ |
126,719 |
|
7 |
www.howardhughes.com |
|
In thousands |
|
Q1 2017 |
|
Q1 2016 |
|
|
FY 2016 |
|
FY 2015 |
|
||||
|
RECONCILIATION OF NET INCOME TO FFO |
|
|
|
|
|
|
|
|
|
|
|
|
|
|
|
Net income attributable to common shareholders |
|
$ |
5,659 |
|
$ |
143,765 |
|
|
$ |
202,303 |
|
$ |
126,719 |
|
|
Add: |
|
|
|
|
|
|
|
|
|
|
|
|
|
|
|
Segment real estate related depreciation and amortization |
|
|
23,549 |
|
|
21,943 |
|
|
|
89,368 |
|
|
92,955 |
|
|
Loss (gain) on disposal of depreciable real estate operating assets |
|
|
— |
|
|
— |
|
|
|
1,117 |
|
|
(29,073) |
|
|
Gains on sales of properties |
|
|
(32,215) |
|
|
(140,549) |
|
|
|
(140,549) |
|
|
— |
|
|
Income tax expense (benefit) adjustments - deferred |
|
|
|
|
|
|
|
|
|
|
|
|
|
|
|
Loss (gain) on disposal of depreciable real estate operating assets |
|
|
— |
|
|
— |
|
|
|
(419) |
|
|
10,176 |
|
|
Gains on sales of properties |
|
|
12,081 |
|
|
52,706 |
|
|
|
52,706 |
|
|
— |
|
|
Impairment of depreciable real estate properties |
|
|
— |
|
|
— |
|
|
|
35,734 |
|
|
— |
|
|
Reconciling items related to noncontrolling interests |
|
|
— |
|
|
— |
|
|
|
23 |
|
|
— |
|
|
Our share of the above reconciling items included in earnings from unconsolidated joint ventures |
|
|
830 |
|
|
1,196 |
|
|
|
863 |
|
|
2,255 |
|
|
FFO |
|
|
9,904 |
|
|
79,061 |
|
|
|
241,146 |
|
|
203,032 |
|
|
|
|
|
|
|
|
|
|
|
|
|
|
|
|
|
|
Adjustments to arrive at Core FFO: |
|
|
|
|
|
|
|
|
|
|
|
|
|
|
|
Acquisition expenses |
|
|
32 |
|
|
— |
|
|
|
526 |
|
|
— |
|
|
Loss on redemption of senior notes due 2021 |
|
|
46,410 |
|
|
— |
|
|
|
— |
|
|
— |
|
|
Gain on acquisition of joint venture partner's interest |
|
|
(5,490) |
|
|
— |
|
|
|
(27,088) |
|
|
— |
|
|
Warrant (gain) loss |
|
|
12,562 |
|
|
(29,820) |
|
|
|
24,410 |
|
|
(58,320) |
|
|
Severance expenses |
|
|
828 |
|
|
190 |
|
|
|
487 |
|
|
767 |
|
|
Non-real estate related depreciation and amortization |
|
|
1,975 |
|
|
1,029 |
|
|
|
6,496 |
|
|
6,042 |
|
|
Straight-line rent adjustment |
|
|
1,961 |
|
|
3,121 |
|
|
|
10,689 |
|
|
7,391 |
|
|
Deferred income tax expense (benefit) |
|
|
(3,193) |
|
|
7,509 |
|
|
|
61,411 |
|
|
10,976 |
|
|
Non-cash fair value adjustments related to hedging instruments |
|
|
(198) |
|
|
351 |
|
|
|
1,364 |
|
|
1,745 |
|
|
Share based compensation |
|
|
1,906 |
|
|
2,722 |
|
|
|
6,707 |
|
|
7,284 |
|
|
Other non-recurring expenses (development related marketing and demolition costs) |
|
|
4,270 |
|
|
5,003 |
|
|
|
24,396 |
|
|
28,763 |
|
|
Our share of the above reconciling items included in earnings from unconsolidated joint ventures |
|
|
75 |
|
|
227 |
|
|
|
206 |
|
|
(3) |
|
|
Core FFO |
|
$ |
71,042 |
|
$ |
69,393 |
|
|
$ |
350,750 |
|
$ |
207,677 |
|
|
|
|
|
|
|
|
|
|
|
|
|
|
|
|
|
|
|
|
|
|
|
|
|
|
|
|
|
|
|
|
|
|
FFO per diluted share value |
|
$ |
0.23 |
|
$ |
1.86 |
|
|
$ |
5.64 |
|
$ |
4.75 |
|
|
|
|
|
|
|
|
|
|
|
|
|
|
|
|
|
|
Core FFO per diluted share value |
|
$ |
1.66 |
|
$ |
1.64 |
|
|
$ |
8.21 |
|
$ |
4.86 |
|
|
8 |
www.howardhughes.com |
|
Dollars in thousands |
|
|
|
|
|
|
|
|
|
|
|
|
|
|
|
|
|
|
|
|
|
|
|
% |
|
|
|
|
|
|
|
|
|
|
|
1Q17 |
|
|
|
Time to |
||
|
Property |
|
Ownership |
|
Total |
|
1Q17 SF/Units |
|
1Q17 |
|
1Q17 |
|
1Q17 |
|
|
Annualized |
|
Stabilized |
|
Stabilize |
|
|
|
|
(a) |
|
SF / Units |
|
Occupied |
|
SF/Units Leased |
|
% Occupied |
|
% Leased |
|
|
Cash NOI (a) (b) |
|
NOI (a) (c) |
|
(Years) |
|
|
Stabilized Properties |
|
|
|
|
|
|
|
|
|
|
|
|
|
|
|
|
|
|
|
|
|
Office - Houston |
|
100 |
% |
1,452,473 |
|
1,420,111 |
|
1,430,452 |
|
98 |
% |
98 |
% |
$ |
35,972 |
|
$ |
38,200 |
|
NA |
|
Office - Columbia |
|
100 |
% |
1,085,070 |
|
978,897 |
|
1,010,821 |
|
90 |
% |
93 |
% |
|
13,544 |
|
|
14,500 |
|
NA |
|
Office - Other |
|
100 |
% |
226,000 |
|
226,000 |
|
226,000 |
|
100 |
% |
100 |
% |
|
6,064 |
|
|
6,100 |
|
NA |
|
Retail - Houston (d) |
|
100 |
% |
233,362 |
|
224,308 |
|
225,948 |
|
96 |
% |
97 |
% |
|
6,952 |
|
|
6,500 |
|
NA |
|
Retail - Columbia |
|
100 |
% |
88,556 |
|
68,100 |
|
88,556 |
|
77 |
% |
100 |
% |
|
1,564 |
|
|
2,200 |
|
NA |
|
Retail - Hawaii |
|
100 |
% |
1,143,533 |
|
1,070,347 |
|
1,078,352 |
|
94 |
% |
94 |
% |
|
23,600 |
|
|
25,600 |
|
NA |
|
Retail - Other |
|
100 |
% |
340,972 |
|
333,699 |
|
333,699 |
|
98 |
% |
98 |
% |
|
7,352 |
|
|
7,200 |
|
NA |
|
Multi-Family - Houston |
|
100 |
% |
707 |
|
617 |
|
646 |
|
87 |
% |
91 |
% |
|
6,204 |
|
|
9,100 |
|
NA |
|
Multi-Family - Columbia |
|
50 |
% |
380 |
|
350 |
|
355 |
|
92 |
% |
93 |
% |
|
2,764 |
|
|
3,500 |
|
NA |
|
Multi-Family - New York |
|
100 |
% |
21 |
|
20 |
|
20 |
|
96 |
% |
96 |
% |
|
476 |
|
|
600 |
|
NA |
|
Other Assets (e) |
|
NA |
|
NA |
|
NA |
|
NA |
|
NA |
|
NA |
|
|
8,821 |
|
|
8,821 |
|
NA |
|
Total Stabilized Properties (f) |
|
|
|
|
|
|
|
|
|
|
|
|
|
$ |
113,313 |
|
$ |
122,321 |
|
NA |
|
|
|
|
|
|
|
|
|
|
|
|
|
|
|
|
|
|
|
|
|
|
|
Unstabilized Properties |
|
|
|
|
|
|
|
|
|
|
|
|
|
|
|
|
|
|
|
|
|
Office - Houston |
|
100 |
% |
676,688 |
|
243,609 |
|
306,095 |
|
36 |
% |
45 |
% |
$ |
2,384 |
|
$ |
14,500 |
|
3.0 |
|
Office - Columbia |
|
100 |
% |
204,020 |
|
97,930 |
|
122,412 |
|
48 |
% |
60 |
% |
|
1,488 |
|
|
5,100 |
|
3.0 |
|
Office - Summerlin |
|
100 |
% |
208,347 |
|
137,926 |
|
160,636 |
|
66 |
% |
77 |
% |
|
3,720 |
|
|
5,700 |
|
1.0 |
|
Retail - Houston (d) |
|
100 |
% |
157,641 |
|
104,208 |
|
110,182 |
|
66 |
% |
70 |
% |
|
2,504 |
|
|
3,600 |
|
0.5 |
|
Retail - Summerlin |
|
100 |
% |
796,443 |
|
670,605 |
|
699,277 |
|
84 |
% |
88 |
% |
|
17,916 |
|
|
26,300 |
|
1.0 |
|
Multi-Family - Houston |
|
100 |
% |
390 |
|
300 |
|
336 |
|
77 |
% |
86 |
% |
|
4,244 |
|
|
7,500 |
|
1.0 |
|
Multi-Family - Summerlin |
|
50 |
% |
124 |
|
96 |
|
106 |
|
77 |
% |
86 |
% |
|
— |
|
|
1,100 |
|
1.0 |
|
Hospitality - Houston |
|
100 |
% |
913 |
|
605 |
|
605 |
|
66 |
% |
66 |
% |
|
23,464 |
|
|
31,500 |
|
2.9 |
|
Self Storage - Houston |
|
100 |
% |
654 |
|
— |
|
— |
|
NA |
|
NA |
|
|
— |
|
|
800 |
|
2.0 |
|
Total Unstabilized Properties |
|
|
|
|
|
|
|
|
|
|
|
|
|
$ |
55,720 |
|
$ |
96,100 |
|
1.7 |
|
|
|
|
|
|
|
|
|
|
|
|
|
|
|
|
|
|
|
|
|
|
|
Under Construction Properties |
|
|
|
|
|
|
|
|
|
|
|
|
|
|
|
|
|
|
|
|
|
Office - Houston |
|
100 |
% |
203,000 |
|
— |
|
203,000 |
|
NA |
|
100 |
% |
|
NA |
|
$ |
5,100 |
|
2.0 |
|
Office - Columbia |
|
100 |
% |
130,000 |
|
— |
|
97,500 |
|
NA |
|
75 |
% |
|
NA |
|
|
3,600 |
|
4.0 |
|
Office - Summerlin |
|
100 |
% |
180,000 |
|
— |
|
180,000 |
|
0 |
% |
100 |
% |
|
NA |
|
|
4,100 |
|
2.0 |
|
Multi-Family - Houston |
|
100 |
% |
292 |
|
— |
|
— |
|
NA |
|
0 |
% |
|
NA |
|
|
3,500 |
|
2.0 |
|
Multi-Family - Columbia |
|
50 |
% |
437 |
|
— |
|
— |
|
NA |
|
0 |
% |
|
NA |
|
|
4,000 |
|
2.0 |
|
Hospitality - New York |
|
35 |
% |
72 |
|
— |
|
— |
|
NA |
|
0 |
% |
|
NA |
|
|
1,300 |
|
1.0 |
|
Self Storage - Houston |
|
100 |
% |
784 |
|
— |
|
— |
|
NA |
|
NA |
|
|
NA |
|
|
800 |
|
2.0 |
|
Total Under Construction Properties |
|
|
|
|
|
|
|
|
|
|
|
|
|
|
NA |
|
$ |
22,400 |
|
2.1 |
|
|
|
|
|
|
|
|
|
|
|
|
|
|
|
|
|
|
|
|
|
|
|
Total/ Wtd. Avg for Portfolio |
|
|
|
|
|
|
|
|
|
|
|
|
|
$ |
169,033 |
|
$ |
240,821 |
|
1.9 |
Notes
|
(a) |
Includes our share of NOI where we do not own 100%. |
|
(b) |
Annualized 1Q17 NOI includes distribution received from our cost basis investment. For purposes of this calculation, these one time annual distributions are not annualized. |
|
(c) |
Table above excludes Seaport NOI until we have greater clarity. Please reference page 13 for Stabilized NOI Yield and other project information. |
|
(d) |
Retail - Houston is inclusive of retail in The Woodlands and Bridgeland. |
|
(e) |
Other Assets are primarily made up of income from Kewalo Basin, Summerlin Baseball and Hockey ground lease, and our share of other equity method investments not included in other categories. |
|
(f) |
For Stabilized Properties, the difference between 1Q17 cash NOI and Stabilized NOI is attributable to a number of factors which may include timing, free rent or other temporary abatements, tenant turnover and market factors considered nonpermanent. |
|
9 |
www.howardhughes.com |
|
(Dollars in thousands) |
Nevada |
Texas |
Maryland |
Total |
|||
|
MPC Performance - FY-16 & Q1-17 |
|||||||
|
MPC Net Contribution (FY-16) (a) |
$136,500 |
$7,583 |
($1,179) |
$142,904 |
|||
|
MPC Net Contribution (Q1-17) (a) |
$20,395 |
$2,478 |
($303) |
$22,570 |
|||
|
Operating Asset Performance - 2017 & Future |
|||||||
|
Annualized 1Q17 In-Place Cash NOI |
$25,016 |
$81,724 |
$19,360 |
$126,100 |
|||
|
Est. Stabilized NOI (Future) |
$40,580 |
$121,100 |
$32,900 |
$194,580 |
|||
|
Wtd. Avg. Time to Stab. (yrs.) |
1.0 |
1.9 |
3.0 |
— |
Note
|
(a) |
Reconciliation from GAAP MPC segment EBT to MPC Net Contribution for the three months ended March 31, 2017 is found on Reconciliation of non-GAAP Measures. |
|
10 |
www.howardhughes.com |
|
|
|
MPC Regions |
|
|
|
Non-MPC Regions |
||||||||||||||
|
|
|
Woodlands |
|
Woodlands Hills |
|
Bridgeland |
|
Summerlin |
|
Columbia |
|
Total |
|
Hawaii |
|
Seaport |
|
Other |
|
Total |
|
|
|
Houston, TX |
|
Houston, TX |
|
Houston, TX |
|
Las Vegas, NV |
|
Columbia, MD |
|
MPC Regions |
|
Honolulu, HI |
|
New York, NY |
|
|
|
Non-MPC |
|
Operating - Stabilized Properties |
|
|
|
|
|
|
|
|
|
|
|
|
|
|
|
|
|
|
|
|
|
Office s.f. |
|
1,452,473 |
|
— |
|
— |
|
— |
|
1,085,070 |
|
2,537,543 |
|
— |
|
— |
|
226,000 |
|
226,000 |
|
Retail s.f. |
|
233,362 |
|
— |
|
— |
|
— |
|
88,556 |
|
321,918 |
|
1,143,533 |
|
— |
|
340,972 |
|
1,484,505 |
|
Multifamily units |
|
707 |
|
— |
|
— |
|
— |
|
380 |
|
1,087 |
|
— |
|
21 |
|
— |
|
21 |
|
Hotel Rooms |
|
— |
|
— |
|
— |
|
— |
|
— |
|
— |
|
— |
|
— |
|
— |
|
— |
|
Self Storage |
|
— |
|
— |
|
— |
|
— |
|
— |
|
— |
|
— |
|
— |
|
— |
|
— |
|
|
|
|
|
|
|
|
|
|
|
|
|
|
|
|
|
|
|
|
|
|
|
Operating - Unstabilized Properties |
|
|
|
|
|
|
|
|
|
|
|
|
|
|
|
|
|
|
|
|
|
Office s.f. |
|
676,688 |
|
— |
|
— |
|
208,347 |
|
204,020 |
|
1,089,055 |
|
— |
|
— |
|
— |
|
— |
|
Retail s.f. (a) |
|
74,669 |
|
— |
|
82,972 |
|
796,443 |
|
— |
|
954,084 |
|
— |
|
— |
|
— |
|
— |
|
Multifamily units |
|
390 |
|
— |
|
— |
|
124 |
|
— |
|
514 |
|
— |
|
— |
|
— |
|
— |
|
Hotel rooms |
|
913 |
|
— |
|
— |
|
— |
|
— |
|
913 |
|
— |
|
— |
|
— |
|
— |
|
Self Storage |
|
654 |
|
— |
|
— |
|
— |
|
— |
|
654 |
|
— |
|
— |
|
— |
|
— |
|
|
|
|
|
|
|
|
|
|
|
|
|
|
|
|
|
|
|
|
|
|
|
Operating - Under Construction Properties |
|
|
|
|
|
|
|
|
|
|
|
|
|
|
|
|
|
|
|
|
|
Office s.f. |
|
203,000 |
|
— |
|
— |
|
180,000 |
|
130,000 |
|
513,000 |
|
— |
|
— |
|
— |
|
— |
|
Retail s.f. (b) |
|
— |
|
— |
|
— |
|
— |
|
— |
|
— |
|
— |
|
— |
|
— |
|
— |
|
Multifamily units |
|
292 |
|
— |
|
— |
|
— |
|
437 |
|
729 |
|
— |
|
— |
|
— |
|
— |
|
Hotel rooms |
|
— |
|
— |
|
— |
|
— |
|
— |
|
— |
|
— |
|
72 |
|
— |
|
72 |
|
Self Storage |
|
784 |
|
— |
|
— |
|
— |
|
— |
|
784 |
|
— |
|
— |
|
— |
|
— |
|
|
|
|
|
|
|
|
|
|
|
|
|
|
|
|
|
|
|
|
|
|
|
Residential Land |
|
|
|
|
|
|
|
|
|
|
|
|
|
|
|
|
|
|
|
|
|
Total gross acreage/condos (c) |
|
28,475 ac. |
|
2,055 ac. |
|
11,400 ac. |
|
22,500 ac. |
|
16,450 ac. |
|
80,880 ac. |
|
1,381 |
|
n.a. |
|
n.a. |
|
1,381 |
|
Current Residents (c) |
|
115,000 |
|
— |
|
8,300 |
|
107,000 |
|
112,000 |
|
342,300 |
|
n.a. |
|
n.a. |
|
n.a. |
|
— |
|
Remaining saleable acres/condos |
|
307 |
|
1,439 |
|
2,474 |
|
3,740 |
|
n.a. |
|
7,998 |
|
241 |
|
n.a. |
|
n.a. |
|
241 |
|
Estimated price per acre (d) |
|
$560 |
|
$207 |
|
$372 |
|
$577 |
|
n.a. |
|
|
|
n.a. |
|
n.a. |
|
n.a. |
|
|
|
|
|
|
|
|
|
|
|
|
|
|
|
|
|
|
|
|
|
|
|
|
|
Commercial Land |
|
|
|
|
|
|
|
|
|
|
|
|
|
|
|
|
|
|
|
|
|
Total acreage remaining |
|
752 |
|
171 |
|
1,530 |
|
826 |
|
108 |
|
3,387 |
|
n.a. |
|
n.a. |
|
n.a. |
|
— |
|
Estimated price per acre (e) |
|
$957 |
|
$552 |
|
$394 |
|
$759 |
|
$316 |
|
|
|
n.a. |
|
n.a. |
|
n.a. |
|
|
Notes
Portfolio key metrics herein include square feet, units and rooms included in joint venture projects.
|
(a) |
Retail s.f. within the Summerlin region excludes 381,767 sq. ft. of anchors. |
|
(b) |
Retail s.f. within New York region excludes Pier 17 and Uplands, pending final plans for this project. |
|
(c) |
Acreage and current residents shown as of December 31, 2016. |
|
(d) |
Residential pricing: average 2016 acreage pricing for Bridgeland, Summerlin and The Woodlands. Summerlin avarage pricing excludes the sale of approximately 117 acres to Pulte with an atypical economic structure. Pro forma acreage pricing for The Woodlands Hills. |
|
(e) |
Commercial pricing: estimate of current value based upon recent sales, third party appraisals and third party MPC experts. The Woodlands Hills commercial is valued at cost. |
|
11 |
www.howardhughes.com |
|
|
|
Office Expirations |
|
Retail Expirations |
||||||||||
|
|
|
Annualized Cash |
|
Percentage of |
|
Wtd. Avg. Annualized |
|
Annualized Cash |
|
Percentage of |
|
Wtd. Avg. Annualized |
||
|
|
|
Rent |
|
Annualized Cash |
|
Cash Rent Per Leased Sq. |
|
Rent |
|
Annualized Cash |
|
Cash Rent Per Leased Sq. |
||
|
Expiration Year |
($ in thousands) |
|
Rent |
|
Ft. |
|
($ in thousands) |
|
Rent |
|
Ft. |
|||
|
|
|
|
|
|
|
|
|
|
|
|
|
|
|
|
|
2017 |
|
$ |
5,022 |
|
6.25 |
% |
28.47 |
|
$ |
8,843 |
|
8.56 |
% |
29.43 |
|
2018 |
|
|
3,768 |
|
4.69 |
% |
25.16 |
|
|
7,975 |
|
7.72 |
% |
40.44 |
|
2019 |
|
|
7,187 |
|
8.95 |
% |
29.67 |
|
|
4,368 |
|
4.23 |
% |
36.55 |
|
2020 |
|
|
8,537 |
|
10.63 |
% |
28.19 |
|
|
7,183 |
|
6.95 |
% |
48.47 |
|
2021 |
|
|
5,179 |
|
6.45 |
% |
32.97 |
|
|
7,123 |
|
6.89 |
% |
28.65 |
|
2022 |
|
|
8,965 |
|
11.16 |
% |
29.92 |
|
|
4,734 |
|
4.58 |
% |
50.17 |
|
2023 |
|
|
9,411 |
|
11.71 |
% |
28.71 |
|
|
6,296 |
|
6.09 |
% |
47.13 |
|
2024 |
|
|
10,345 |
|
12.88 |
% |
29.55 |
|
|
4,442 |
|
4.30 |
% |
34.90 |
|
2025 |
|
|
8,908 |
|
11.09 |
% |
33.55 |
|
|
27,854 |
|
26.95 |
% |
55.98 |
|
2026 |
|
|
947 |
|
1.18 |
% |
35.99 |
|
|
5,536 |
|
5.36 |
% |
37.79 |
|
Thereafter |
|
|
12,069 |
|
15.02 |
% |
23.17 |
|
|
18,991 |
|
18.38 |
% |
15.08 |
|
Total |
|
$ |
80,337 |
|
100.00 |
% |
|
|
$ |
103,345 |
|
100.00 |
% |
|
|
12 |
www.howardhughes.com |
|
Dollars in thousands, except per sq. ft. and unit amounts |
|
|
|
|
|
|
|
|
|
|
|
|
|
|
|
|
|
|
|
|
|
|
|
|
|||
|
Owned & Managed |
|
|
|
|
|
|
|
|
|
|
|
|
Const. |
|
Est. |
|
Develop. |
|
Est. |
|
Est. |
|
Stabilized |
|
|||
|
Project |
|
City, |
|
% |
|
Est. Rentable |
|
|
Percent |
|
|
|
Start |
|
Stabilized |
|
Costs |
|
Total |
|
Stabilized |
|
NOI |
|
|||
|
Name |
|
State |
|
Ownership |
|
Sq. Ft. |
|
|
Pre-Leased1 |
|
Project Status |
|
Date |
|
Date2 |
|
Incurred |
|
Cost |
|
NOI3 |
|
Yield |
|
|||
|
Office |
|
|
|
|
|
|
|
|
|
|
|
|
|
|
|
|
|
|
|
|
|
|
|
|
|
|
|
|
100 Fellowship Dr |
|
Houston, TX |
|
100 |
% |
203,000 |
|
|
100 |
% |
Under construction |
|
Q2 2017 |
|
Q4 2019 |
|
$ |
1,323 |
|
$ |
63,278 |
|
$ |
5,062 |
|
8 |
% |
|
Two Merriweather |
|
Columbia, MD |
|
100 |
% |
130,000 |
|
|
58 |
% |
Under construction |
|
Q3 2016 |
|
Q2 2020 |
|
$ |
8,833 |
|
$ |
40,941 |
|
$ |
3,685 |
|
9 |
% |
|
Aristocrat |
|
Las Vegas, NV |
|
100 |
% |
180,000 |
|
|
100 |
% |
Under construction |
|
Q2 2017 |
|
2019 |
|
$ |
201 |
|
$ |
45,085 |
|
$ |
4,071 |
|
9 |
% |
|
|
|
|
|
|
|
|
|
|
|
|
|
|
|
|
|
|
|
|
|
|
|
|
|
|
|
|
|
|
Retail |
|
|
|
|
|
|
|
|
|
|
|
|
|
|
|
|
|
|
|
|
|
|
|
|
|
|
|
|
Seaport - Uplands / Pier 17 |
|
New York, NY |
|
100 |
% |
401,787 |
|
|
49 |
% |
Under construction |
|
Q4 2013 |
|
Q1 2021 |
|
$ |
364,227 |
|
$ |
731,000 |
|
$ |
43,000 - $58,000 |
|
6%-8 |
% |
|
|
|
|
|
|
|
|
|
|
|
|
|
|
|
|
|
|
|
|
|
|
|
|
|
|
|
|
|
|
Total |
|
|
|
|
|
914,787 |
|
|
|
|
|
|
|
|
|
|
$ |
374,584 |
|
$ |
880,304 |
|
|
|
|
|
|
|
|
|
|
|
|
|
|
|
|
|
|
|
|
|
|
|
|
|
|
|
|
|
|
|
|
|
|
|
|
|
|
|
|
|
|
|
|
|
Monthly |
|
|
|
Const. |
|
Est. |
|
|
Develop. |
|
|
Est. |
|
|
Est. |
|
Stabilized |
|
|
Project |
|
City, |
|
% |
|
Est. Number |
|
|
Est. Rent |
|
|
|
Start |
|
Stabilized |
|
|
Costs |
|
|
Total |
|
|
Stabilized |
|
NOI |
|
|
Name |
|
State |
|
Ownership |
|
of Units |
|
|
Per Unit |
|
Project Status |
|
Date |
|
Date2 |
|
|
Incurred |
|
|
Cost |
|
|
NOI3 |
|
Yield |
|
|
Multifamily |
|
|
|
|
|
|
|
|
|
|
|
|
|
|
|
|
|
|
|
|
|
|
|
|
|
|
|
|
Creekside Apartments |
|
Houston, TX |
|
100 |
% |
292 |
|
$ |
1,538 |
|
Under construction |
|
Q1 2017 |
|
Q4 2019 |
|
$ |
1,403 |
|
$ |
42,111 |
|
$ |
3,499 |
|
8 |
% |
|
m.flats/Ten.M Building4 |
|
Columbia, MD |
|
50 |
% |
437 |
|
$ |
1,982 |
|
Under construction |
|
Q1 2016 |
|
Q3 2019 |
|
$ |
63,900 |
|
$ |
109,345 |
|
$ |
8,100 |
|
7 |
% |
|
|
|
|
|
|
|
|
|
|
|
|
|
|
|
|
|
|
|
|
|
|
|
|
|
|
|
|
|
|
Self-Storage |
|
|
|
|
|
|
|
|
|
|
|
|
|
|
|
|
|
|
|
|
|
|
|
|
|
|
|
|
HHC 2978 Self Storage |
|
Houston, TX |
|
100 |
% |
784 |
|
$ |
142 |
|
Under construction |
|
Q1 2016 |
|
Q2 2020 |
|
$ |
5,964 |
|
$ |
8,476 |
|
$ |
759 |
|
9 |
% |
|
|
|
|
|
|
|
|
|
|
|
|
|
|
|
|
|
|
|
|
|
|
|
|
|
|
|
|
|
|
Total |
|
|
|
|
|
1,513 |
|
|
|
|
|
|
|
|
|
|
$ |
71,267 |
|
$ |
159,932 |
|
|
|
|
|
|
Note: Seaport - Uplands / Pier 17 Estimated Rentable sq. ft. and costs are inclusive of the Tin Building, the status of which is still pending. All costs are shown net of insurance proceeds of approximately $55 million.
|
(1) |
Based on leases signed as of Q1 2017 and is calculated as the total est. rentable square feet leased divided by total est. rentable square feet, expressed as a percentage. |
|
(2) |
Represents management's estimate of the first quarter of operations in which the asset may be stabilized. |
|
(3) |
Total NOI shown gross, not at share. |
|
(4) |
The remaining costs in this non-consolidated joint-venture are expected to be funded by the in-place construction financing. |
|
13 |
www.howardhughes.com |
|
Dollars in thousands |
|
|
|
|
|
|
|
|
|
|
|
Develop. |
|
Est. |
|
Annualized |
|
Annualized |
|
|
|
|
|
|
|
% |
|
Rentable |
|
1Q17 |
|
1Q17 |
|
Costs |
|
Total |
|
1Q17 |
|
Est. |
|
Est. |
|
Project Name |
|
Location |
|
Ownership |
|
Sq. Ft. / Units |
|
% Occ. |
|
% Leased |
|
Incurred |
|
Cost |
|
Cash NOI |
|
Stab. NOI (a) |
|
Stab. Date |
|
Office |
|
|
|
|
|
|
|
|
|
|
|
|
|
|
|
|
|
|
|
|
|
Three Hughes Landing |
|
Houston, TX |
|
100 |
% |
320,815 |
|
18 |
% |
23 |
% |
$ 60,778
|
|
$ 90,162
|
|
NM |
|
$ 7,600
|
|
2020 |
|
1725 Hughes Landing (b) |
|
Houston, TX |
|
100 |
% |
331,754 |
|
54 |
% |
68 |
% |
50,185 |
|
74,994 |
|
3,060 |
|
6,900 |
|
2020 |
|
One Merriweather |
|
Columbia, MD |
|
100 |
% |
204,020 |
|
48 |
% |
60 |
% |
57,549 |
|
78,187 |
|
1,488 |
|
5,100 |
|
2020 |
|
One Summerlin (c) |
|
Las Vegas, NV |
|
100 |
% |
208,347 |
|
66 |
% |
77 |
% |
— |
|
— |
|
3,720 |
|
5,700 |
|
2018 |
|
|
|
|
|
|
|
|
|
|
|
|
|
|
|
|
|
|
|
|
|
|
|
Retail |
|
|
|
|
|
|
|
|
|
|
|
|
|
|
|
|
|
|
|
|
|
Creekside Village Green |
|
Houston, TX |
|
100 |
% |
74,669 |
|
84 |
% |
84 |
% |
15,779 |
|
15,779 |
|
2,028 |
|
1,900 |
|
2017 |
|
Lakeland Village Center |
|
Houston, TX |
|
100 |
% |
82,972 |
|
50 |
% |
57 |
% |
12,721 |
|
16,274 |
|
476 |
|
1,700 |
|
2018 |
|
Downtown Summerlin (c) |
|
Las Vegas, NV |
|
100 |
% |
796,443 |
|
84 |
% |
88 |
% |
415,074 |
|
418,304 |
|
17,916 |
|
26,300 |
|
2018 |
|
|
|
|
|
|
|
|
|
|
|
|
|
|
|
|
|
|
|
|
|
|
|
Residential |
|
|
|
|
|
|
|
|
|
|
|
|
|
|
|
|
|
|
|
|
|
One Lakes Edge |
|
Houston, TX |
|
100 |
% |
390 |
|
77 |
% |
86 |
% |
81,729 |
|
81,729 |
|
4,244 |
|
7,500 |
|
2018 |
|
Constellation |
|
Las Vegas, NV |
|
50 |
% |
124 |
|
77 |
% |
84 |
% |
20,760 |
|
20,760 |
|
256 |
|
1,100 |
|
2018 |
|
|
|
|
|
|
|
|
|
|
|
|
|
|
|
|
|
|
|
|
|
|
|
Hotel |
|
|
|
|
|
|
|
|
|
|
|
|
|
|
|
|
|
|
|
|
|
Embassy Suites at Hughes Landing |
|
Houston, TX |
|
100 |
% |
205 |
|
84 |
% |
N/A |
|
42,911 |
|
46,363 |
|
6,156 |
|
4,500 |
|
2019 |
|
The Woodlands Resort & Conference Center |
|
Houston, TX |
|
100 |
% |
406 |
|
55 |
% |
N/A |
|
72,360 |
|
72,360 |
|
9,836 |
|
16,500 |
|
2020 |
|
The Westin at The Woodlands |
|
Houston, TX |
|
100 |
% |
302 |
|
70 |
% |
N/A |
|
91,349 |
|
97,380 |
|
7,472 |
|
10,500 |
|
2020 |
|
|
|
|
|
|
|
|
|
|
|
|
|
|
|
|
|
|
|
|
|
|
|
Other |
|
|
|
|
|
|
|
|
|
|
|
|
|
|
|
|
|
|
|
|
|
HHC 242 Self-Storage |
|
Houston, TX |
|
100 |
% |
654 |
|
7 |
% |
7 |
% |
7,034 |
|
8,607 |
|
NM |
|
800 |
|
2019 |
Notes
|
(a) |
Company estimates of stabilized NOI based solely on current leasing velocity, excluding inflationary and organic growth. |
|
(b) |
Shown net of tenant reimbursements. |
|
(c) |
One Summerlin development costs are combined with Downtown Summerlin. |
|
14 |
www.howardhughes.com |
|
In thousands, except rentable sq. ft. and acres |
|
|
|
|
|
|
|
|
|
|
|
|
|
|
1Q2017 Acquisitions |
|
|
|
|
|
|
|
|
|
|
|
|
|
|
|
|
|
|
Type of |
|
|
|
|
|
Rentable |
|
Acquisition |
|
|
Date Acquired |
|
Property |
|
Ownership |
|
% Ownership |
|
Location |
|
Sq. Ft./ Acres |
|
Price |
|
|
|
|
|
|
|
|
|
|
|
|
|
|
|
|
|
1/6/2017 |
|
Macy's Parcel |
|
NA |
|
100 |
% |
Alexandria, VA |
|
11.4 |
|
$ |
22,200 |
|
|
|
|
|
|
|
|
|
|
|
|
|
|
|
|
3/1/2017 |
|
LV51s Baseball Team (a) |
|
NA |
|
100 |
% |
Las Vegas, NV |
|
n.a. |
|
$ |
16,400 |
|
|
|
|
|
|
|
|
|
|
|
|
|
|
|
|
|
|
|
|
|
|
|
|
|
|
|
|
|
|
|
|
|
|
|
|
|
|
|
|
|
|
|
|
|
|
1Q2017 Dispositions |
|
|
|
|
|
|
|
|
|
|
|
|
|
|
|
|
|
|
Type of |
|
|
|
|
|
Rentable |
|
|
|
|
Date Sold |
|
Property |
|
Ownership |
|
% Ownership |
|
Location |
|
Sq. Ft./ Acres |
|
Sale Price |
|
|
|
|
|
|
|
|
|
|
|
|
|
|
|
|
|
1/18/2017 |
|
Elk Grove Casino Site |
|
NA |
|
NA |
|
Elk Grove, CA |
|
36.0 |
|
$ |
36,000 |
|
Note (a) On March 1, 2017, we acquired our joint venture partner’s 50.0% interest in the Las Vegas 51s minor league baseball team for $16.4 million. Upon completion of the transaction, we became the sole owner (100%) of this Triple-A baseball team affiliated with the New York Mets. Team NOI is included in Other Assets on page 9 and generates a stabilized NOI of $0.4 million. |
|
15 |
www.howardhughes.com |
|
|
|
Woodlands |
|
Woodlands Hills |
|
Bridgeland |
|
Summerlin |
|
Maryland |
|
Total |
||||||||||||||||||||||||
|
Dollars in thousands |
|
Q1 2017 |
|
Q1 2016 |
|
Q1 2017 |
|
Q1 2016 |
|
Q1 2017 |
|
Q1 2016 |
|
Q1 2017 |
|
Q1 2016 |
|
Q1 2017 |
|
Q1 2016 |
|
Q1 2017 |
|
Q1 2016 |
||||||||||||
|
Revenues: |
|
|
|
|
|
|
|
|
|
|
|
|
|
|
|
|
|
|
|
|
|
|
|
|
|
|
|
|
|
|
|
|
|
|
|
|
|
Residential land sale revenues |
|
$ |
2,361 |
|
$ |
2,464 |
|
$ |
0 |
|
$ |
0 |
|
$ |
8,723 |
|
$ |
4,281 |
|
$ |
38,598 |
|
$ |
23,777 |
|
$ |
— |
|
$ |
— |
|
$ |
49,682 |
|
$ |
30,522 |
|
Commercial land sale revenues |
|
|
3,799 |
|
|
10,405 |
|
|
— |
|
|
— |
|
|
— |
|
|
— |
|
|
— |
|
|
1,015 |
|
|
— |
|
|
— |
|
|
3,799 |
|
|
11,420 |
|
Builder price participation |
|
|
274 |
|
|
503 |
|
|
— |
|
|
— |
|
|
15 |
|
|
255 |
|
|
4,372 |
|
|
3,889 |
|
|
— |
|
|
— |
|
|
4,661 |
|
|
4,647 |
|
Other land sale revenues |
|
|
1,909 |
|
|
129 |
|
|
10 |
|
|
0 |
|
|
6,629 |
|
|
75 |
|
|
2,015 |
|
|
2,960 |
|
|
2 |
|
|
2 |
|
|
10,565 |
|
|
3,166 |
|
Total revenues |
|
$ |
8,343 |
|
$ |
13,501 |
|
$ |
10 |
|
$ |
0 |
|
$ |
15,367 |
|
$ |
4,611 |
|
$ |
44,984 |
|
$ |
31,641 |
|
$ |
2 |
|
$ |
2 |
|
$ |
68,706 |
|
$ |
49,755 |
|
|
|
|
|
|
|
|
|
|
|
|
|
|
|
|
|
|
|
|
|
|
|
|
|
|
|
|
|
|
|
|
|
|
|
|
|
|
|
Expenses: |
|
|
|
|
|
|
|
|
|
|
|
|
|
|
|
|
|
|
|
|
|
|
|
|
|
|
|
|
|
|
|
|
|
|
|
|
|
Cost of sales - residential land |
|
$ |
(1,127) |
|
$ |
(955) |
|
|
— |
|
|
— |
|
$ |
(2,675) |
|
$ |
(1,447) |
|
$ |
(21,167) |
|
$ |
(9,141) |
|
|
— |
|
|
— |
|
|
(24,969) |
|
|
(11,543) |
|
Cost of sales - commercial land |
|
|
(900) |
|
|
(4,145) |
|
|
— |
|
|
— |
|
|
— |
|
|
— |
|
|
— |
|
|
— |
|
|
— |
|
|
— |
|
|
(900) |
|
|
(4,145) |
|
Real estate taxes |
|
|
(1,265) |
|
|
(1,329) |
|
|
(75) |
|
|
(23) |
|
|
(331) |
|
|
(236) |
|
|
(590) |
|
|
(541) |
|
|
(164) |
|
|
(165) |
|
|
(2,424) |
|
|
(2,294) |
|
Land sales operations |
|
|
(3,005) |
|
|
(3,659) |
|
|
(62) |
|
|
(52) |
|
|
(1,372) |
|
|
(1,003) |
|
|
(2,408) |
|
|
(2,505) |
|
|
(123) |
|
|
(81) |
|
|
(6,970) |
|
|
(7,300) |
|
Depreciation and amortization |
|
|
(30) |
|
|
(30) |
|
|
— |
|
|
— |
|
|
(35) |
|
|
(24) |
|
|
(25) |
|
|
(24) |
|
|
(3) |
|
|
(5) |
|
|
(93) |
|
|
(83) |
|
Total Expenses |
|
$ |
(6,327) |
|
$ |
(10,118) |
|
$ |
(137) |
|
$ |
(75) |
|
$ |
(4,413) |
|
$ |
(2,710) |
|
$ |
(24,190) |
|
$ |
(12,211) |
|
$ |
(290) |
|
$ |
(251) |
|
$ |
(35,356) |
|
$ |
(25,365) |
|
|
|
|
|
|
|
|
|
|
|
|
|
|
|
|
|
|
|
|
|
|
|
|
|
|
|
|
|
|
|
|
|
|
|
|
|
|
|
Net interest capitalized (expense) |
|
|
(912) |
|
|
(1,624) |
|
|
142 |
|
|
137 |
|
|
2,462 |
|
|
2,466 |
|
|
3,868 |
|
|
4,367 |
|
|
(3) |
|
|
9 |
|
|
5,557 |
|
|
5,355 |
|
Equity in earnings from real estate affiliates |
|
|
— |
|
|
— |
|
|
— |
|
|
— |
|
|
— |
|
|
— |
|
|
5,280 |
|
|
— |
|
|
— |
|
|
— |
|
|
5,280 |
|
|
— |
|
|
|
|
|
|
|
|
|
|
|
|
|
|
|
|
|
|
|
|
|
|
|
|
|
|
|
|
|
|
|
|
|
|
|
|
|
|
|
EBT |
|
$ |
1,104 |
|
$ |
1,759 |
|
$ |
15 |
|
$ |
62 |
|
$ |
13,416 |
|
$ |
4,367 |
|
$ |
29,942 |
|
$ |
23,797 |
|
$ |
(291) |
|
$ |
(240) |
|
$ |
44,186 |
|
$ |
29,745 |
|
|
|
|
|
|
|
|
|
|
|
|
|
|
|
|
|
|
|
|
|
|
|
|
|
|
|
|
|
|
|
|
|
|
|
|
|
|
|
Key Performance Metrics: |
|
|
|
|
|
|
|
|
|
|
|
|
|
|
|
|
|
|
|
|
|
|
|
|
|
|
|
|
|
|
|
|
|
|
|
|
|
Residential |
|
|
|
|
|
|
|
|
|
|
|
|
|
|
|
|
|
|
|
|
|
|
|
|
|
|
|
|
|
|
|
|
|
|
|
|
|
Total acres sold |
|
|
4.5 |
|
|
4.1 |
|
|
— |
|
|
— |
|
|
18.6 |
|
|
11.1 |
|
|
37.7 |
|
|
118.1 |
|
|
NM |
|
|
NM |
|
|
|
|
|
|
|
Price per acre achieved |
|
$ |
525 |
|
$ |
601 |
|
|
NM |
|
|
NM |
|
$ |
390 |
|
$ |
380 |
|
$ |
697 |
|
$ |
357 |
|
|
NM |
|
|
NM |
|
|
|
|
|
|
|
Avg. gross margins |
|
|
52 |
% |
|
61 |
% |
|
NM |
|
|
NM |
|
|
69 |
% |
|
66 |
% |
|
45 |
% |
|
63 |
% |
|
NM |
|
|
NM |
|
|
|
|
|
|
|
Commercial |
|
|
|
|
|
|
|
|
|
|
|
|
|
|
|
|
|
|
|
|
|
|
|
|
|
|
|
|
|
|
|
|
|
|
|
|
|
Total acres sold |
|
|
10.4 |
|
|
4.3 |
|
|
— |
|
|
— |
|
|
— |
|
|
— |
|
|
— |
|
|
— |
|
|
NM |
|
|
NM |
|
|
|
|
|
|
|
Price per acre achieved |
|
$ |
365 |
|
$ |
2,420 |
|
|
NM |
|
|
NM |
|
|
NM |
|
|
NM |
|
|
NM |
|
|
NM |
|
|
NM |
|
|
NM |
|
|
|
|
|
|
|
Avg. gross margins |
|
|
76 |
% |
|
60 |
% |
|
NM |
|
|
NM |
|
|
NM |
|
|
NM |
|
|
NM |
|
|
NM |
|
|
NM |
|
|
NM |
|
|
|
|
|
|
|
Avg. combined before-tax net margins |
|
|
67 |
% |
|
60 |
% |
|
NM |
|
|
NM |
|
|
69 |
% |
|
66 |
% |
|
45 |
% |
|
63 |
% |
|
NM |
|
|
NM |
|
|
|
|
|
|
|
|
|
|
|
|
|
|
|
|
|
|
|
|
|
|
|
|
|
|
|
|
|
|
|
|
|
|
|
|
|
|
|
|
|
|
|
|
|
Key Valuation Metrics: |
|
Woodlands |
|
Woodlands Hills |
|
Bridgeland |
|
Summerlin |
|
Maryland |
||||||||||||||||
|
Remaining saleable acres |
|
|
|
|
|
|
|
|
|
|
|
|
|
|
|
|
|
|
|
|
|
|
|
|
|
|
|
Residential |
|
|
|
307 |
|
|
|
|
|
1,439 |
|
|
|
|
|
2,474 |
|
|
|
|
|
3,740 |
|
|
|
NM |
|
Commercial |
|
|
|
752 |
|
|
|
|
|
171 |
|
|
|
|
|
1,530 |
|
|
|
|
|
826 |
|
|
|
108(a) |
|
Projected est. % superpads / lot size |
|
0 |
% |
|
|
— |
|
0 |
% |
|
|
— |
|
0 |
% |
|
|
— |
|
79 |
% |
|
|
0.25 ac |
|
NM |
|
Projected est. % single-family detached lots / lot size |
|
75 |
% |
|
|
0.28 ac |
|
87 |
% |
|
|
0.32 ac |
|
89 |
% |
|
|
0.16 ac |
|
0 |
% |
|
|
— |
|
NM |
|
Projected est. % single-family attached lots / lot size |
|
25 |
% |
|
|
0.07 ac |
|
13 |
% |
|
|
0.13 ac |
|
10 |
% |
|
|
0.12 ac |
|
0 |
% |
|
|
— |
|
NM |
|
Projected est. % custom homes / lot size |
|
0 |
% |
|
|
— |
|
0 |
% |
|
|
— |
|
1 |
% |
|
|
1.0 ac |
|
21 |
% |
|
|
0.4 ac |
|
NM |
|
Estimated builder sale velocity (blended total) - Q1 2017 |
|
|
|
20 |
|
|
|
|
|
— |
|
|
|
|
|
40 |
|
|
|
|
|
70 |
|
|
|
NM |
|
Gross margin (GAAP), net of MUDs (b) |
|
|
|
67.1 |
% |
|
|
|
|
NM |
|
|
|
|
|
69.3 |
% |
|
|
|
|
45 |
% |
|
|
NM |
|
Projected cash gross margin, net of MUDs (b) |
|
|
|
96.6 |
% |
|
|
|
|
80.0 |
% |
|
|
|
|
85.5 |
% |
|
|
|
|
66.8 |
% |
|
|
NM |
|
Sellout date estimate |
|
|
|
|
|
|
|
|
|
|
|
|
|
|
|
|
|
|
|
|
|
|
|
|
|
|
|
Residential |
|
|
|
2022 |
|
|
|
|
|
2029 |
|
|
|
|
|
2036 |
|
|
|
|
|
2035 |
|
|
|
— |
|
Commercial |
|
|
|
2025 |
|
|
|
|
|
2028 |
|
|
|
|
|
2045 |
|
|
|
|
|
2039 |
|
|
|
— |
Notes
|
(a) |
Does not include 31 commercial acres held in the Strategic Development segment in Downtown Columbia. |
|
(b) |
GAAP gross margin is based on GAAP revenues and expenses which exclude revenues deferred on sales closed where revenue did not meet criteria for recognition, and includes revenues previously deferred that met criteria for recognition in the current period. Gross margin for each MPC may vary from period to period based on the locations of the land sold and the related costs associated with developing the land sold. Projected cash gross margin includes all future projected revenue less all future projected development costs, net of expected reimbursable costs, and capitalized overhead, taxes and interest. |
|
16 |
www.howardhughes.com |
|
|
|
Waiea (a) |
|
Anaha |
|
Ae'o |
|
Ke Kilohana (b) |
|
|
Total |
|
|||||
|
Key Metrics |
|
|
|
|
|
|
|
|
|
|
|
|
|
|
|
|
|
|
Type of building |
|
Ultra-Luxury |
|
Luxury |
|
Upscale |
|
Workforce |
|
|
|
|
|
||||
|
Number of units |
|
|
174 |
|
|
317 |
|
|
466 |
|
|
424 |
|
|
|
1,381 |
|
|
Avg. unit s.f. |
|
|
2,174 |
|
|
1,417 |
|
|
836 |
|
|
694 |
|
|
|
5,121 |
|
|
Condo s.f. |
|
|
378,238 |
|
|
449,205 |
|
|
389,368 |
|
|
294,273 |
|
|
|
1,511,084 |
|
|
Street retail s.f. |
|
|
8,000 |
|
|
16,000 |
|
|
67,000 |
|
|
22,000 |
|
|
|
113,000 |
|
|
Total s.f. |
|
|
386,238 |
|
|
465,205 |
|
|
456,368 |
|
|
316,273 |
|
|
|
1,624,084 |
|
|
|
|
|
|
|
|
|
|
|
|
|
|
|
|
|
|
|
|
|
Development progress |
|
|
|
|
|
|
|
|
|
|
|
|
|
|
|
|
|
|
Status |
|
|
Opened |
|
|
U/C |
|
|
U/C |
|
|
U/C |
|
|
|
|
|
|
Start date (actual or est.) |
|
|
2Q14 |
|
|
4Q14 |
|
|
1Q16 |
|
|
4Q16 |
|
|
|
|
|
|
Completion date (actual or est.) |
|
|
2Q17 |
|
|
3Q17 |
|
|
4Q18 |
|
|
2019 |
|
|
|
|
|
|
Total development cost ($m) |
|
$ |
414.2 |
|
$ |
401.3 |
|
$ |
428.5 |
|
$ |
218.9 |
|
|
|
$ 1,462.9 |
|
|
Cost-to-date ($m) |
|
$ |
377.0 |
|
$ |
257.3 |
|
$ |
92.6 |
|
$ |
28.6 |
|
|
|
755.5 |
|
|
Remaining to be funded ($m) |
|
$ |
37.2 |
|
$ |
144.0 |
|
$ |
335.9 |
|
$ |
190.3 |
|
|
|
$ 707.4 |
|
|
|
|
|
|
|
|
|
|
|
|
|
|
|
|
|
|
|
|
|
Financial Summary (Dollars in thousands, except per sq. ft.) |
|
|
|
|
|
|
|
|
|
|
|
|
|
|
|
|
|
|
# of units closed or under contract in 1Q17 |
|
|
163 |
|
|
301 |
|
|
289 |
|
|
387 |
|
|
|
1,140 |
|
|
Total % of units closed or under contract |
|
|
94 |
% |
|
95 |
% |
|
62 |
% |
|
91 |
% |
|
|
83 |
% |
|
Number of units closed or under contract (current quarter) |
|
|
3 |
|
|
3 |
|
|
24 |
|
|
1 |
|
|
|
31 |
|
|
Square footage closed or under contract (total) |
|
|
335,991 |
|
|
401,304 |
|
|
219,328 |
|
|
256,666 |
|
|
|
1,213,289 |
|
|
Total % square footage closed or under contract |
|
|
89 |
% |
|
89 |
% |
|
56 |
% |
|
87 |
% |
|
|
80 |
% |
|
Target condo profit margin at completion (excl. land cost) |
|
|
— |
|
|
— |
|
|
— |
|
|
— |
|
|
|
30 |
% |
|
Total cash received (closings & deposits) |
|
|
— |
|
|
— |
|
|
— |
|
|
— |
|
|
|
$ 725,504 |
|
|
Total GAAP revenue recognized |
|
|
— |
|
|
— |
|
|
— |
|
|
— |
|
|
|
$ 940,097 |
|
|
Expected avg. price per sq. ft. |
|
$ |
1,900 - $1,950 |
|
$ |
1,100 - $1,150 |
|
$ |
1,300 - $1,350 |
|
$ |
700 - $750 |
|
|
|
$1,300 - $1,325 |
|
|
Expected construction costs per retail sq. ft. |
|
|
— |
|
|
— |
|
|
— |
|
|
— |
|
|
|
$ 1,100 |
|
|
|
|
|
|
|
|
|
|
|
|
|
|
|
|
|
|
|
|
|
Deposit Reconciliation (Dollars in thousands) |
|
|
|
|
|
|
|
|
|
|
|
|
|
|
|
|
|
|
Deposits from sales commitment |
|
|
|
|
|
|
|
|
|
|
|
|
|
|
|
|
|
|
spent towards construction |
|
|
N/A |
|
$ |
79,850 |
|
$ |
0 |
|
$ |
0 |
|
|
|
$ 79,850 |
|
|
held for future use (c) (d) |
|
|
N/A |
|
|
13,069 |
|
|
66,766 |
|
|
19,220 |
|
|
|
99,055 |
|
|
Total deposits from sales commitment |
|
|
N/A |
|
$ |
92,919 |
|
$ |
66,766 |
|
$ |
19,220 |
|
|
|
$ 178,905 |
|
Notes
|
(a) |
We began delivering units at Waiea in November 2016. As of April 18, 2017, we've closed 150 units, we have 13 under contract, and 11 units remaining to be sold. |
|
(b) |
Ke Kilohana consists of 375 workforce units and 49 market rate units. |
|
(c) |
Only $0.8 million, $52.0 million, and $19.0 million can be used for development at Anaha, Ae`o and Ke Kilohana, respectively. |
|
(d) |
Total deposits held for future use are shown in Other Assets on the balance sheet. |
|
17 |
www.howardhughes.com |
|
Property |
|
City, |
|
% |
|
|
|
|
|
Name |
|
State |
|
Own |
|
Acres |
|
Notes |
|
Future Development |
|
|
|
|
|
|
|
|
|
The Elk Grove Collection |
|
Elk Grove, CA |
|
100 |
% |
64 |
|
Plan to build a 400,000 Sq. Ft. outlet retail center. Recently sold 36 acres for $36 million in total proceeds. |
|
Landmark Mall |
|
Alexandria, VA |
|
100 |
% |
33 |
|
Plan to transform the mall into an open-air, mixed-use community. In January 2017, we acquired the 11.4 acre Macy's site for $22.2 million. |
|
Cottonwood Mall |
|
Holladay, UT |
|
100 |
% |
54 |
|
Under contract to sell in pieces. First closing expected in 2017. |
|
Century Plaza Mall |
|
Birmingham, AL |
|
100 |
% |
59 |
|
Mall is completely vacant. We are evaluating potential redevelopment opportunities. |
|
Circle T Ranch and Power Center |
|
Westlake, TX |
|
50 |
% |
207 |
|
50/50 joint venture with Hillwood Development Company. We sold 72-acres to an affiliate of Charles Schwab Corporation. |
|
Kendall Town Center |
|
Kendall, FL |
|
100 |
% |
70 |
|
Zoned for 730,000 Sq. Ft. of commercial space. Going through re-entitlement process. |
|
West Windsor |
|
West Windsor, NJ |
|
100 |
% |
658 |
|
Current zoning allows for approximately 6 million Sq. Ft. of commercial uses. |
|
AllenTowne |
|
Allen, TX |
|
100 |
% |
238 |
|
Located 27 miles north of Downtown Dallas. Agricultural property tax exemptions are in place for most of the property, significantly reducing carrying costs. |
|
Bridges at Mint Hill |
|
Charlotte, NC |
|
91 |
% |
210 |
|
Zoned for approximately 1.3 million Sq. Ft. of commercial uses. |
|
Lakemoor Land |
|
Volo, IL |
|
100 |
% |
40 |
|
Located 50 miles north of Chicago. The project is currently designated as farmland. |
|
Maui Ranch Land |
|
Maui, HI |
|
100 |
% |
20 |
|
Two, non-adjacent, ten-acre parcels zoned for native vegetation. |
|
Fashion Show Air Rights |
|
Las Vegas, NV |
|
80 |
% |
N/A |
|
Air rights above the Fashion Show Mall located on the Las Vegas Strip. |
|
18 |
www.howardhughes.com |
|
|
|
|
|
|
March 31, |
|
December 31, |
|
|
|
|
|
|
|
|
|
||
|
(In thousands) |
|
|
|
|
2017 |
|
2016 |
|
|
|
|
|
|
|
|
|
||
|
Fixed-rate debt: |
|
|
|
|
|
|
|
|
|
|
|
|
|
|
|
|
|
|
|
Collateralized mortgages, notes and loans payable |
|
|
|
|
$ |
1,283,481 |
|
$ |
1,140,118 |
|
|
|
|
|
|
|
|
|
|
Special Improvement District bonds |
|
|
|
|
|
40,886 |
|
|
44,023 |
|
|
|
|
|
|
|
|
|
|
Variable-rate debt: |
|
|
|
|
|
|
|
|
|
|
|
|
|
|
|
|
|
|
|
Collateralized mortgages, notes and loans payable, excluding condominium financing |
|
|
|
|
|
1,309,436 |
|
|
1,363,472 |
|
|
|
|
|
|
|
|
|
|
Condominium financing |
|
|
|
|
|
137,689 |
|
|
160,847 |
|
|
|
|
|
|
|
|
|
|
Mortgages, notes and loans payable |
|
|
|
|
$ |
2,771,492 |
|
$ |
2,708,460 |
|
|
|
|
|
|
|
|
|
|
Deferred Financing Costs, net |
|
|
|
|
|
(21,238) |
|
|
(17,713) |
|
|
|
|
|
|
|
|
|
|
Total consolidated mortgages, notes and loans payable |
|
|
|
|
$ |
2,750,254 |
|
$ |
2,690,747 |
|
|
|
|
|
|
|
|
|
|
Total unconsolidated mortgages, notes and loans payable at pro-rata share |
|
|
|
|
$ |
71,520 |
|
$ |
55,481 |
|
|
|
|
|
|
|
|
|
|
Total Debt |
|
|
|
|
$ |
2,821,773 |
|
$ |
2,746,228 |
|
|
|
|
|
|
|
|
|
|
|
|
|
|
|
|
|
|
|
|
|
|
|
|
|
|
|
|
|
|
|
|
|
|
|
|
|
|
|
|
|
|
|
|
|
|
|
|
|
|
|
|
|
|
|
|
|
|
|
|
|
|
|
|
|
|
|
|
|
|
|
|
Consolidated Debt Maturities and Contractual Obligations by Final Due Date (a) |
|
|
|
|||||||||||||
|
(In thousands) |
|
2017 |
|
2018-2020 |
|
2021-2022 |
|
|
2023 and thereafter |
|
|
Total |
|
|
|
|||
|
Mortgages, notes and loans payable, excluding condominium financing |
|
$ |
66,228 |
|
$ |
860,692 |
(b) |
$ |
281,105 |
|
$ |
1,425,778 |
|
$ |
2,633,803 |
|
|
|
|
Condominium financing |
|
|
— |
|
|
137,689 |
|
|
— |
|
|
— |
|
|
137,689 |
|
|
|
|
Interest Payments |
|
|
95,898 |
|
|
293,762 |
|
|
148,694 |
|
|
208,589 |
|
|
746,943 |
|
|
|
|
Ground lease and other leasing commitments |
|
|
9,885 |
|
|
16,094 |
|
|
15,283 |
|
|
298,881 |
|
|
340,143 |
|
|
|
|
Total consolidated debt maturities and contractual obligations |
|
$ |
172,011 |
|
$ |
1,308,237 |
|
$ |
445,082 |
|
$ |
1,933,248 |
|
$ |
3,858,578 |
|
|
|
|
|
|
|
|
|
|
|
|
|
|
|
|
|
|
|
|
|
|
|
|
|
|
|
|
|
|
|
|
|
|
|
|
|
|
|
|
|
|
|
|
|
|
|
|
|
|
|
|
|
|
|
|
|
|
|
|
|
|
|
|
|
|
Net Debt on a Segment Basis, at share |
||||||||||||||||
|
|
|
Master |
|
|
|
|
|
|
|
Non- |
|
|
||||||
|
(In thousands) |
|
Planned |
|
Operating |
|
Strategic |
|
Segment |
|
Segment |
|
Total |
||||||
|
Segment Basis (c) |
|
Communities |
|
Assets |
|
Developments |
|
Totals |
|
Amounts |
|
|
||||||
|
Mortgages, notes and loans payable, excluding condominium financing (c) |
|
$ |
252,535 |
|
$ |
1,604,927 |
|
$ |
32,153 |
|
$ |
1,889,615 |
|
$ |
794,469 |
|
$ |
2,684,084 |
|
Condominium financing |
|
|
— |
|
|
— |
|
|
137,689 |
|
|
137,689 |
|
|
— |
|
|
137,689 |
|
Less: cash and cash equivalents (c) |
|
|
(102,732) |
|
|
(85,281) |
|
|
(21,260) |
|
|
(209,273) |
|
|
(387,651) |
|
|
(596,924) |
|
Special Improvement District receivables |
|
|
(61,129) |
|
|
— |
|
|
— |
|
|
(61,129) |
|
|
— |
|
|
(61,129) |
|
Municipal Utility District receivables |
|
|
(160,189) |
|
|
— |
|
|
— |
|
|
(160,189) |
|
|
— |
|
|
(160,189) |
|
Net Debt |
|
$ |
(71,515) |
|
$ |
1,519,646 |
|
$ |
148,582 |
|
$ |
1,596,713 |
|
$ |
406,818 |
|
$ |
2,003,531 |
|
(a) |
Mortgages, notes and loans payable and Short term condominium financing are presented based on extended maturity date. Extension periods generally can be exercised at our option at the initial maturity date, subject to customary extension terms that are based on property performance as of the initial maturity date and/or extension date. Such extension terms may include, but are not limited to, minimum debt service coverage, minimum occupancy levels or condominium sales levels, as applicable, and other performance criteria. In certain cases due to property performance not meeting covenants, we may have to pay down a portion of the loan in order to obtain the extension. |
|
(b) |
Of this total, $150.0 million has been refinanced subsequent to March 31, 2017 and has an extended maturity date of 2021 (initial maturity in 2020 with a one-year extension option). |
|
(c) |
Each segment includes our share of related cash and debt balances for all joint ventures included in Investments in Real estate and Other Affiliates. See our quarterly filing on Form 10-Q for further details. |
|
19 |
www.howardhughes.com |
|
|
|
|
|
Contract |
|
Interest Rate |
|
Current Annual |
|
|
|
|
Asset |
|
Principal Balance |
|
Interest Rate |
|
Hedge |
|
Interest Rate |
|
Maturity Date (a) |
|
|
Master Planned Communities |
|
|
|
|
|
|
|
|
|
|
|
|
The Woodlands Master Credit Facility (b) |
|
$ |
150,000 |
|
L+275 |
|
Floating |
|
3.68 |
% |
Mar-21 |
|
Bridgeland Credit Facility |
|
|
65,000 |
|
4.60 |
% |
Fixed |
|
4.6 |
% |
Nov-22 |
|
|
|
$ |
215,000 |
|
|
|
|
|
|
|
|
|
Operating Assets |
|
|
|
|
|
|
|
|
|
|
|
|
1701 Lake Robbins (c) |
|
$ |
4,600 |
|
5.81 |
% |
Fixed |
|
5.81 |
% |
Apr-17 |
|
1723-35 Hughes Landing Boulevard |
|
|
109,876 |
|
L+165 |
|
Floating |
|
2.58 |
% |
Jun-19 |
|
70 Corporate Center |
|
|
20,000 |
|
L+225 |
|
Floating |
|
3.18 |
% |
Jul-19 |
|
Downtown Summerlin |
|
|
305,888 |
|
L+225 |
|
Floating |
|
3.18 |
% |
Jul-19 |
|
The Westin at The Woodlands |
|
|
58,077 |
|
L+265 |
|
Floating |
|
3.68 |
% |
Aug-19 |
|
110 N. Wacker |
|
|
21,759 |
|
5.21 |
% |
Fixed |
|
5.21 |
% |
Oct-19 |
|
Outlet Collection at Riverwalk |
|
|
55,293 |
|
L+275 |
|
Floating |
|
3.68 |
% |
Oct-19 |
|
Three Hughes Landing |
|
|
36,462 |
|
L+235 |
|
Floating |
|
3.28 |
% |
Dec-19 |
|
Lakeland Village Center at Bridgeland |
|
|
10,644 |
|
L+235 |
|
Floating |
|
3.28 |
% |
May-20 |
|
Embassy Suites at Hughes Landing |
|
|
30,223 |
|
L+250 |
|
Floating |
|
3.43 |
% |
Oct-20 |
|
The Woodlands Resort & Conference Center |
|
|
70,000 |
|
L+275 |
|
Floating |
|
4.18 |
% |
Dec-20 |
|
One Merriweather |
|
|
34,072 |
|
L+215 |
|
Floating |
|
3.08 |
% |
Feb-21 |
|
HHC 242 Self-Storage |
|
|
4,995 |
|
L+260 |
|
Floating |
|
3.53 |
% |
Oct-21 |
|
10-60 Corporate Centers / One Mall North |
|
|
94,463 |
|
L+175 |
|
Floating |
|
3.04 |
% |
May-22 |
|
20/25 Waterway |
|
|
13,825 |
|
4.79 |
% |
Fixed |
|
4.79 |
% |
May-22 |
|
Millennium Waterway Apartments |
|
|
55,584 |
|
3.75 |
% |
Fixed |
|
3.75 |
% |
Jun-22 |
|
Ward Village |
|
|
238,718 |
|
L+320 |
|
Floating |
|
3.54 |
% |
Sep-23 |
|
9303 New Trails |
|
|
12,286 |
|
4.88 |
% |
Fixed |
|
4.88 |
% |
Dec-23 |
|
4 Waterway Square |
|
|
35,979 |
|
4.88 |
% |
Fixed |
|
4.88 |
% |
Dec-23 |
|
3831 Technology Forest Drive |
|
|
22,282 |
|
4.50 |
% |
Fixed |
|
4.50 |
% |
Mar-26 |
|
Millennium Six Pines Apartments |
|
|
42,500 |
|
3.39 |
% |
Fixed |
|
3.39 |
% |
Aug-28 |
|
3 Waterway Square |
|
|
51,279 |
|
3.94 |
% |
Fixed |
|
3.94 |
% |
Aug-28 |
|
One Lake's Edge |
|
|
69,440 |
|
4.50 |
% |
Fixed |
|
4.50 |
% |
Mar-29 |
|
One Hughes Landing |
|
|
52,000 |
|
4.30 |
% |
Fixed |
|
4.30 |
% |
Dec-29 |
|
Two Hughes Landing |
|
|
48,000 |
|
4.20 |
% |
Fixed |
|
4.20 |
% |
Dec-30 |
|
Hughes Landing Retail |
|
|
35,000 |
|
3.50 |
% |
Fixed |
|
3.50 |
% |
Dec-36 |
|
Columbia Regional Building |
|
|
25,000 |
|
4.48 |
% |
Fixed |
|
4.48 |
% |
Feb-37 |
|
|
|
$ |
1,558,245 |
|
|
|
|
|
|
|
|
|
|
|
|
|
|
|
|
|
|
|
|
|
|
Strategic Developments |
|
|
|
|
|
|
|
|
|
|
|
|
Waiea and Anaha |
|
$ |
137,689 |
|
L+675 |
|
Floating |
|
7.68 |
% |
Nov-19 |
|
Ke Kilohana |
|
|
— |
|
L+325 |
|
Floating |
|
4.18 |
% |
Dec-20 |
|
Two Merriweather |
|
|
— |
|
L+250 |
|
Floating |
|
3.43 |
% |
Oct-21 |
|
Ae'o |
|
|
— |
|
L+400 |
|
Floating |
|
4.93 |
% |
Dec-21 |
|
HHC 2978 Self-Storage |
|
|
3,729 |
|
L+260 |
|
Floating |
|
3.53 |
% |
Jan-22 |
|
|
|
$ |
141,418 |
|
|
|
|
|
|
|
|
|
|
|
|
|
|
|
|
|
|
|
|
|
|
Total (d) |
|
$ |
1,914,663 |
|
|
|
|
|
|
|
|
Notes
|
(a) |
Maturity dates shown assumes all extension options are exercised. |
|
(b) |
The Woodlands Master Credit Facility has been extended to 2021. |
|
(c) |
Debt related to 1701 Lake Robbins was paid down in full in Q2-17. |
|
(d) |
Excludes JV debt, Corporate level debt, and SID bond debt related to Summerlin MPC & Retail. Above balances are as of March 31, 2017. |
|
20 |
www.howardhughes.com |
Minimum Contractual Ground Lease Payments ($ in thousands)
|
|
|
|
|
|
|
|
|
|
|
Future Cash Payments |
||||||||||||
|
|
|
Pro-Rata |
|
|
|
Three months ended |
|
|
|
Year Ended December 31 |
|
|
|
|
||||||||
|
Ground Leased Asset |
|
Share |
|
Expiration Date |
|
March 31, 2017 |
|
2016 |
|
2017 |
|
2018 |
|
Thereafter |
|
Total |
||||||
|
|
|
|
|
|
|
|
|
|
|
|
|
|
|
|
|
|
|
|
|
|
|
|
|
Riverwalk (a) |
|
100 |
% |
2044-2046 |
(b) |
$ |
492 |
|
$ |
3,334 |
|
$ |
3,334 |
|
$ |
2,454 |
|
$ |
60,424 |
|
$ |
66,212 |
|
Seaport |
|
100 |
% |
2031 |
(c) |
|
381 |
|
|
1,429 |
|
|
1,550 |
|
|
1,594 |
|
|
205,641 |
|
|
208,786 |
|
Kewalo Basin Harbor |
|
100 |
% |
2049 |
|
|
75 |
|
|
300 |
|
|
300 |
|
|
300 |
|
|
9,300 |
|
|
9,900 |
|
|
|
|
|
|
|
|
|
|
$ |
5,064 |
|
$ |
5,185 |
|
$ |
4,348 |
|
$ |
275,365 |
|
$ |
284,898 |
|
(a) |
Includes base ground rent, deferred ground rent and the participation rent floor, as appropriate. |
|
(b) |
Except for Port of New Orleans ground lease which has no termination date, and WTC license agreement expires in 2019 but can be extended by agreement of the parties. |
|
(c) |
Initially expires 12/30/2031 but subject to options to extend through 12/31/2072. |
|
21 |
www.howardhughes.com |
Under Construction - Projects that reside in the Strategic segment for which construction has commenced as of March 31, 2017. This excludes MPC and condominium development.
Unstabilized - Properties in the Operating segment that have not been in service for more than 36 months and do not exceed 90% occupancy. If an office, retail or multifamily property has been in service for more than 36 months but does not exceed 90% occupany, the asset is considered underperforming and is included in Stabilized.
Stabilized - Properties in the Operating segment that have been in service for more than 36 months or have reached 90% occupancy, which ever occurs first. If an office, retail or multifamily property has been in service for more than 36 months but does not exceed 90% occupany, the asset is considered underperforming.
NOI - We define NOI as operating cash revenues (rental income, tenant recoveries and other revenue) less operating cash expenses (real estate taxes, repairs and maintenance, marketing and other property expenses). NOI excludes straight-line rents and amortization of tenant incentives, net interest expense, ground rent amortization, demolition costs, amortization, depreciation, development-related marketing costs and, unless otherwise indicated, Equity in earnings from Real Estate and Other Affiliates. We use NOI to evaluate our operating performance on a property-by-property basis because NOI allows us to evaluate the impact that factors, which vary by property, such as lease structure, lease rates and tenant base have on our operating results, gross margins and investment returns. We believe that net operating income (“NOI”) is a useful supplemental measure of the performance of our Operating Assets because it provides a performance measure that, when compared year over year, reflects the revenues and expenses directly associated with owning and operating real estate properties and the impact on operations from trends in rental and occupancy rates and operating costs.
|
22 |
www.howardhughes.com |
|
|
Reconciliations of Non-GAAP Measures |
|
Reconciliation of Operating Assets segment EBT to Total NOI: |
|||||||||||||||||||||
|
as filed |
as filed |
as filed |
as filed |
as filed |
|||||||||||||||||
|
(In thousands) |
Q1 2017 (a) |
Q4 2016 |
Q3 2016 |
Q2 2016 |
Q1 2016 (a) |
FY 2016 |
FY 2015 |
||||||||||||||
|
Total Operating Assets segment EBT |
$ |
7,922 |
$ |
5,761 |
$ |
(34,316) |
$ |
8,131 |
$ |
403 |
$ |
(19,132) |
$ |
(9,902) | |||||||
|
Straight-line lease amortization |
1,961 | 1,057 | 2,550 | 4,079 | 3,121 | 10,689 | 7,391 | ||||||||||||||
|
Demolition costs |
(65) | (629) | (16) | (6) |
— |
(1,123) | (2,675) | ||||||||||||||
|
Development-related marketing costs |
(418) | (2,072) | (1,950) | (1,988) | (256) | (7,110) | (9,747) | ||||||||||||||
|
Depreciation and Amortization |
(22,789) | (21,767) | (20,732) | (22,613) | (21,201) | (86,313) | (89,075) | ||||||||||||||
|
Provision for impairment |
— |
— |
(35,734) |
— |
— |
(35,734) |
— |
||||||||||||||
|
Write-off of lease intangibles and other |
(27) | (60) |
— |
(117) | (1) | (60) | (671) | ||||||||||||||
|
Other income, net |
(178) | 1,475 | 13 | 2,750 | 363 | 4,601 | 524 | ||||||||||||||
|
Equity in earnings from Real Estate Affiliates |
3,385 | 185 | (209) | 899 | 1,908 | 2,802 | 1,883 | ||||||||||||||
|
Interest, net |
(14,524) | (10,425) | (9,769) | (10,108) | (11,329) | (39,447) | (31,111) | ||||||||||||||
|
Total Operating Assets NOI - Consolidated |
40,577 | 37,997 | 31,531 | 35,235 | 27,798 | 132,563 | 113,579 | ||||||||||||||
|
Redevelopments |
|||||||||||||||||||||
|
South Street Seaport |
— |
92 | 186 | (7) |
— |
(532) | (2,692) | ||||||||||||||
|
Landmark Mall |
— |
(150) |
— |
— |
(151) | (676) | (347) | ||||||||||||||
|
Total Operating Asset Redevelopments NOI |
— |
(58) | 186 | (7) | (151) | (1,208) | (3,039) | ||||||||||||||
|
Dispositions |
|||||||||||||||||||||
|
The Club at Carlton Woods |
— |
— |
— |
— |
— |
— |
(942) | ||||||||||||||
|
Park West |
(14) | 489 |
— |
— |
498 | 1,835 | 1,812 | ||||||||||||||
|
Total Operating Asset Dispositions NOI |
(14) | 489 |
— |
— |
498 | 1,835 | 870 | ||||||||||||||
|
Consolidated Operating Assets NOI excluding properties sold or in redevelopment |
$ |
40,591 |
$ |
37,566 |
$ |
31,345 |
$ |
35,242 |
$ |
27,451 |
$ |
131,936 |
$ |
115,748 | |||||||
|
Company's Share NOI - Equity investees |
746 | 888 | 569 | 2,272 | 1,316 | 5,069 | 3,204 | ||||||||||||||
|
Distributions from Summerlin Hospital Investment |
3,383 |
— |
— |
— |
2,616 | 2,616 | 1,747 | ||||||||||||||
|
Total NOI |
$ |
44,720 |
$ |
38,454 |
$ |
31,914 |
$ |
37,514 |
$ |
31,383 |
$ |
139,621 |
$ |
120,699 | |||||||
Note:
|
(a) |
- Effective January 1, 2017, we moved South Street Seaport assets under construction and related activities out of the Operating Assets segment into the Strategic Developments segment. Amounts presented for Q1 2016 have been adjusted from previously reported to reflect this change. |
|
23 |
www.howardhughes.com |
|
|
Reconciliations of Non-GAAP Measures
|
|
Reconciliation of MPC Land Sales Closed to GAAP Land Sales Revenue: |
||||||||||||
|
(In thousands) |
Q1 2017 |
Q1 2016 |
FY 2016 |
FY 2015 |
||||||||
|
Total residential land sales closed in period |
$ |
35,881 |
$ |
48,817 |
$ |
163,142 |
$ |
157,806 | ||||
|
Total commercial land sales closed in period |
3,799 | 10,405 | 10,753 | 36,002 | ||||||||
|
Net recognized (deferred) revenue: |
||||||||||||
|
Bridgeland |
1,467 | 68 | 3,780 | (11,136) | ||||||||
|
Summerlin |
9,712 | (17,380) | 29,596 | (16,043) | ||||||||
|
Total net recognized (deferred) revenue |
11,179 | (17,312) | 33,376 | (27,179) | ||||||||
|
Special Improvement District bond revenue |
2,622 | 32 | 8,047 | 20,770 | ||||||||
|
Total land sales revenue - GAAP basis |
$ |
53,481 |
$ |
41,942 |
$ |
215,318 |
$ |
187,399 | ||||
|
Total MPC segment revenue - GAAP basis |
$ |
68,706 |
$ |
49,755 |
$ |
253,304 |
$ |
229,865 | ||||
|
24 |
www.howardhughes.com |