Attached files
| file | filename |
|---|---|
| EX-32.1 - EXHIBIT 32.1 - EZCORP INC | a2017-q210qex321_3312017.htm |
| EX-31.2 - EXHIBIT 31.2 - EZCORP INC | a2017-q210qex312_3312017.htm |
| EX-31.1 - EXHIBIT 31.1 - EZCORP INC | a2017-q210qex311_3312017.htm |
UNITED STATES
SECURITIES AND EXCHANGE COMMISSION
WASHINGTON, DC 20549
FORM 10-Q
x | QUARTERLY REPORT PURSUANT TO SECTION 13 OR 15(d) OF THE SECURITIES EXCHANGE ACT OF 1934 |
For the quarterly period ended March 31, 2017
or
¨ | TRANSITION REPORT PURSUANT TO SECTION 13 OR 15(d) OF THE SECURITIES EXCHANGE ACT OF 1934 |
For the transition period from to
Commission File No. 0-19424

EZCORP, INC.
(Exact name of registrant as specified in its charter)
Delaware | 74-2540145 |
(State or other jurisdiction of incorporation or organization) | (I.R.S. Employer Identification No.) |
2500 Bee Cave Road, Bldg One, Suite 200, Rollingwood, Texas | 78746 |
(Address of principal executive offices) | (Zip Code) |
Registrant’s telephone number, including area code: (512) 314-3400
Indicate by check mark whether the registrant (1) has filed all reports required to be filed by Section 13 or 15(d) of the Securities Exchange Act of 1934 during the preceding 12 months (or for such shorter period that the registrant was required to file such reports), and (2) has been subject to such filing requirements for the past 90 days. Yes x No ¨
Indicate by check mark whether the registrant has submitted electronically and posted on its corporate Web site, if any, every Interactive Data File required to be submitted and posted pursuant to Rule 405 of Regulation S-T (§232.405 of this chapter) during the preceding 12 months (or for such shorter period that the registrant was required to submit and post such files). Yes x No ¨
Indicate by check mark whether the registrant is a large accelerated filer, an accelerated filer, a non-accelerated filer, smaller reporting company, or an emerging growth company. See definition of “large accelerated filer,” “accelerated filer,” “smaller reporting company,” and "emerging growth company" in Rule 12b-2 of the Exchange Act.
Large accelerated filer | ¨ | Accelerated filer | x |
Non-accelerated filer | ¨ | (Do not check if a smaller reporting company) | |
Smaller reporting company | ¨ | ||
Emerging growth company | ¨ | ||
If an emerging growth company, indicate by check mark if the registrant has elected not to use the extended transition period for complying with any new or revised financial accounting standards provided pursuant to Section 13(a) of the Exchange Act. ¨
Indicate by check mark whether the registrant is a shell company (as defined in Rule 12b-2 of the Exchange Act). Yes ¨ No x
APPLICABLE ONLY TO CORPORATE ISSUERS:
The only class of voting securities of the registrant issued and outstanding is the Class B Voting Common Stock, par value $.01 per share, all of which is owned by an affiliate of the registrant. There is no trading market for the Class B Voting Common Stock.
As of April 30, 2017, 51,321,915 shares of the registrant’s Class A Non-voting Common Stock, par value $.01 per share, and 2,970,171 shares of the registrant’s Class B Voting Common Stock, par value $.01 per share, were outstanding.
EZCORP, Inc.
INDEX TO FORM 10-Q
PART I — FINANCIAL INFORMATION
ITEM 1. FINANCIAL STATEMENTS
EZCORP, Inc. CONDENSED CONSOLIDATED BALANCE SHEETS (in thousands, except share and per share amounts) | |||||||
March 31, 2017 | September 30, 2016 | ||||||
(Unaudited) | |||||||
Assets: | |||||||
Current assets: | |||||||
Cash and cash equivalents | $ | 120,099 | $ | 65,737 | |||
Pawn loans | 143,267 | 167,329 | |||||
Pawn service charges receivable, net | 27,028 | 31,062 | |||||
Inventory, net | 137,008 | 140,224 | |||||
Notes receivable, net | 29,978 | 41,946 | |||||
Prepaid expenses and other current assets | 31,011 | 35,845 | |||||
Total current assets | 488,391 | 482,143 | |||||
Investment in unconsolidated affiliate | 38,334 | 37,128 | |||||
Property and equipment, net | 53,630 | 58,455 | |||||
Goodwill | 254,217 | 253,976 | |||||
Intangible assets, net | 31,768 | 30,681 | |||||
Non-current notes receivable, net | 40,319 | 41,119 | |||||
Deferred tax asset, net | 37,134 | 35,303 | |||||
Other assets, net | 18,174 | 44,439 | |||||
Total assets | $ | 961,967 | $ | 983,244 | |||
Liabilities and equity: | |||||||
Current liabilities: | |||||||
Accounts payable, accrued expenses and other current liabilities | $ | 62,339 | $ | 84,285 | |||
Customer layaway deposits | 10,992 | 10,693 | |||||
Total current liabilities | 73,331 | 94,978 | |||||
Long-term debt, net | 266,724 | 283,611 | |||||
Other long-term liabilities | 8,448 | 10,450 | |||||
Total liabilities | 348,503 | 389,039 | |||||
Commitments and contingencies (Note 7) | |||||||
Stockholders’ equity: | |||||||
Class A Non-voting Common Stock, par value $.01 per share; shares authorized: 100 million as of March 31, 2017 and September 30, 2016; issued and outstanding: 51,321,915 as of March 31, 2017 and 51,129,144 as of September 30, 2016 | 513 | 511 | |||||
Class B Voting Common Stock, convertible, par value $.01 per share; 3 million shares authorized; issued and outstanding: 2,970,171 | 30 | 30 | |||||
Additional paid-in capital | 321,531 | 318,723 | |||||
Retained earnings | 334,996 | 319,808 | |||||
Accumulated other comprehensive loss | (42,544 | ) | (44,089 | ) | |||
EZCORP, Inc. stockholders’ equity | 614,526 | 594,983 | |||||
Noncontrolling interest | (1,062 | ) | (778 | ) | |||
Total equity | 613,464 | 594,205 | |||||
Total liabilities and equity | $ | 961,967 | $ | 983,244 | |||
See accompanying notes to unaudited interim condensed consolidated financial statements.
1
EZCORP, Inc. CONDENSED CONSOLIDATED STATEMENTS OF OPERATIONS | |||||||||||||||
Three Months Ended March 31, | Six Months Ended March 31, | ||||||||||||||
2017 | 2016 | 2017 | 2016 | ||||||||||||
(Unaudited) | |||||||||||||||
(in thousands, except per share amounts) | |||||||||||||||
Revenues: | |||||||||||||||
Merchandise sales | $ | 110,238 | $ | 109,343 | $ | 221,751 | $ | 217,927 | |||||||
Jewelry scrapping sales | 10,219 | 12,780 | 20,017 | 22,401 | |||||||||||
Pawn service charges | 67,092 | 64,130 | 136,105 | 130,724 | |||||||||||
Other revenues | 2,079 | 1,959 | 4,379 | 4,717 | |||||||||||
Total revenues | 189,628 | 188,212 | 382,252 | 375,769 | |||||||||||
Merchandise cost of goods sold | 70,493 | 68,332 | 142,225 | 134,591 | |||||||||||
Jewelry scrapping cost of goods sold | 8,841 | 11,085 | 17,185 | 19,161 | |||||||||||
Other cost of revenues | 397 | 431 | 980 | 1,043 | |||||||||||
Net revenues | 109,897 | 108,364 | 221,862 | 220,974 | |||||||||||
Operating expenses: | |||||||||||||||
Operations | 74,460 | 72,256 | 152,106 | 148,274 | |||||||||||
Administrative | 13,283 | 15,621 | 27,210 | 35,604 | |||||||||||
Depreciation and amortization | 6,030 | 6,606 | 12,403 | 14,148 | |||||||||||
Loss (gain) on sale or disposal of assets | 71 | 649 | (6 | ) | 682 | ||||||||||
Restructuring | — | 218 | — | 1,910 | |||||||||||
Total operating expenses | 93,844 | 95,350 | 191,713 | 200,618 | |||||||||||
Operating income | 16,053 | 13,014 | 30,149 | 20,356 | |||||||||||
Interest expense | 5,628 | 3,951 | 11,193 | 8,078 | |||||||||||
Interest income | (2,240 | ) | (7 | ) | (4,856 | ) | (16 | ) | |||||||
Equity in net income of unconsolidated affiliate | (1,243 | ) | (1,877 | ) | (2,721 | ) | (3,932 | ) | |||||||
Other expense (income) | 228 | 213 | (195 | ) | 315 | ||||||||||
Income from continuing operations before income taxes | 13,680 | 10,734 | 26,728 | 15,911 | |||||||||||
Income tax expense | 5,449 | 8,427 | 10,231 | 10,185 | |||||||||||
Income from continuing operations, net of tax | 8,231 | 2,307 | 16,497 | 5,726 | |||||||||||
Loss from discontinued operations, net of tax | (375 | ) | (78,250 | ) | (1,603 | ) | (89,935 | ) | |||||||
Net income (loss) | 7,856 | (75,943 | ) | 14,894 | (84,209 | ) | |||||||||
Net loss attributable to noncontrolling interest | (167 | ) | (5,131 | ) | (294 | ) | (5,923 | ) | |||||||
Net income (loss) attributable to EZCORP, Inc. | $ | 8,023 | $ | (70,812 | ) | $ | 15,188 | $ | (78,286 | ) | |||||
Basic earnings per share attributable to EZCORP, Inc. — continuing operations | $ | 0.15 | $ | 0.05 | $ | 0.31 | $ | 0.11 | |||||||
Diluted earnings per share attributable to EZCORP, Inc. — continuing operations | $ | 0.15 | $ | 0.05 | $ | 0.31 | $ | 0.11 | |||||||
Weighted-average basic shares outstanding | 54,291 | 54,843 | 54,224 | 54,869 | |||||||||||
Weighted-average diluted shares outstanding | 54,346 | 54,936 | 54,278 | 54,943 | |||||||||||
See accompanying notes to unaudited interim condensed consolidated financial statements.
2
EZCORP, Inc. CONDENSED CONSOLIDATED STATEMENTS OF COMPREHENSIVE INCOME (LOSS) | |||||||||||||||
Three Months Ended March 31, | Six Months Ended March 31, | ||||||||||||||
2017 | 2016 | 2017 | 2016 | ||||||||||||
(Unaudited) | |||||||||||||||
(in thousands) | |||||||||||||||
Net income (loss) | $ | 7,856 | $ | (75,943 | ) | $ | 14,894 | $ | (84,209 | ) | |||||
Other comprehensive income (loss): | |||||||||||||||
Foreign currency translation gain (loss), net of income tax benefit (expense) for our investment in unconsolidated affiliate of $974 and $530 for the three and six months ended March 31, 2017 respectively, and ($789) and $1,814 for the three and six months ended March 31, 2016, respectively | 5,020 | (2,137 | ) | 1,555 | (11,496 | ) | |||||||||
Amounts reclassified from accumulated other comprehensive loss | — | — | — | 22 | |||||||||||
Comprehensive income (loss) | 12,876 | (78,080 | ) | 16,449 | (95,683 | ) | |||||||||
Comprehensive loss attributable to noncontrolling interest | (180 | ) | (5,451 | ) | (284 | ) | (6,293 | ) | |||||||
Comprehensive income (loss) attributable to EZCORP, Inc. | $ | 13,056 | $ | (72,629 | ) | $ | 16,733 | $ | (89,390 | ) | |||||
EZCORP, Inc. CONDENSED CONSOLIDATED STATEMENT OF STOCKHOLDERS' EQUITY | ||||||||||||||||||||||
Common Stock | Additional Paid-in Capital | Retained Earnings | Accumulated Other Comprehensive Loss | EZCORP, Inc. Stockholders’ Equity | ||||||||||||||||||
Shares | Par Value | |||||||||||||||||||||
(Unaudited, except balances as of September 30, 2016) | ||||||||||||||||||||||
(in thousands) | ||||||||||||||||||||||
Balances as of September 30, 2016 | 54,099 | $ | 541 | $ | 318,723 | $ | 319,808 | $ | (44,089 | ) | $ | 594,983 | ||||||||||
Stock compensation | — | — | 3,575 | — | — | 3,575 | ||||||||||||||||
Release of restricted stock | 193 | 2 | — | — | — | 2 | ||||||||||||||||
Taxes paid related to net share settlement of equity awards | — | — | (767 | ) | — | — | (767 | ) | ||||||||||||||
Foreign currency translation adjustment | — | — | — | — | 1,545 | 1,545 | ||||||||||||||||
Net income attributable to EZCORP, Inc. | — | — | — | 15,188 | — | 15,188 | ||||||||||||||||
Balances as of March 31, 2017 | 54,292 | $ | 543 | $ | 321,531 | $ | 334,996 | $ | (42,544 | ) | $ | 614,526 | ||||||||||
See accompanying notes to unaudited interim condensed consolidated financial statements.
3
EZCORP, Inc. CONDENSED CONSOLIDATED STATEMENTS OF CASH FLOWS | |||||||
Six Months Ended March 31, | |||||||
2017 | 2016 | ||||||
(Unaudited) | |||||||
(in thousands) | |||||||
Operating activities: | |||||||
Net income (loss) | $ | 14,894 | $ | (84,209 | ) | ||
Adjustments to reconcile net income (loss) to net cash flows from operating activities: | |||||||
Depreciation and amortization | 12,403 | 15,141 | |||||
Amortization of debt discount and deferred financing costs | 5,755 | 5,932 | |||||
Amortization of prepaid commissions | — | 7,754 | |||||
Accretion of notes receivable discount | (1,928 | ) | — | ||||
Consumer loan loss provision | 980 | 18,662 | |||||
Deferred income taxes | (664 | ) | (12,635 | ) | |||
Impairment of goodwill | — | 73,244 | |||||
Other adjustments | (63 | ) | (2,149 | ) | |||
(Gain) loss on sale or disposal of assets | (6 | ) | 682 | ||||
Stock compensation | 3,575 | 2,149 | |||||
Income from investment in unconsolidated affiliate | (2,721 | ) | (3,932 | ) | |||
Changes in operating assets and liabilities: | |||||||
Service charges and fees receivable | 4,151 | 10,140 | |||||
Inventory | 708 | (993 | ) | ||||
Prepaid expenses, other current assets and other assets | 3,171 | (10,795 | ) | ||||
Accounts payable, accrued expenses and other liabilities | (30,120 | ) | (8,702 | ) | |||
Customer layaway deposits | 240 | 851 | |||||
Income taxes receivable and payable, current, net of excess tax benefit from stock compensation | 7,590 | 51,300 | |||||
Payments of restructuring charges | — | (6,701 | ) | ||||
Net cash provided by operating activities | 17,965 | 55,739 | |||||
Investing activities: | |||||||
Loans made | (300,604 | ) | (323,980 | ) | |||
Loans repaid | 199,080 | 225,138 | |||||
Recovery of pawn loan principal through sale of forfeited collateral | 128,238 | 121,830 | |||||
Additions to property and equipment | (5,293 | ) | (2,950 | ) | |||
Acquisitions, net of cash acquired | — | (6,000 | ) | ||||
Principal collections on notes receivable | 15,051 | — | |||||
Net cash provided by investing activities | 36,472 | 14,038 | |||||
Financing activities: | |||||||
Taxes paid related to net share settlement of equity awards | (767 | ) | — | ||||
Payout of deferred consideration | — | (14,875 | ) | ||||
Repurchase of redeemable common stock issued due to acquisitions | — | (11,750 | ) | ||||
Proceeds from settlement of forward currency contracts | — | 3,557 | |||||
Change in restricted cash | — | 6,519 | |||||
Proceeds from borrowings, net of issuance costs | — | 14,302 | |||||
Payments on borrowings | — | (47,698 | ) | ||||
Net cash used in financing activities | (767 | ) | (49,945 | ) | |||
Effect of exchange rate changes on cash and cash equivalents | 692 | (3,620 | ) | ||||
Net increase in cash and cash equivalents | 54,362 | 16,212 | |||||
Cash and cash equivalents at beginning of period | 65,737 | 59,124 | |||||
Cash and cash equivalents at end of period | $ | 120,099 | $ | 75,336 | |||
Non-cash investing and financing activities: | |||||||
Pawn loans forfeited and transferred to inventory | $ | 125,165 | $ | 122,709 | |||
Dividend reinvestment acquisition of additional ownership in unconsolidated affiliate | 1,153 | — | |||||
See accompanying notes to unaudited interim condensed consolidated financial statements.
4
EZCORP, Inc.
Notes to Interim Condensed Consolidated Financial Statements (Unaudited)
March 31, 2017
NOTE 1: ORGANIZATION AND SUMMARY OF SIGNIFICANT ACCOUNTING POLICIES
Description of Business
When used in this report, the terms “we,” “us,” “our,” “EZCORP” and the “Company” mean EZCORP, Inc. and its consolidated subsidiaries, collectively.
We are a leading provider of pawn loans in the United States and Mexico. Pawn loans are non-recourse loans collateralized by tangible property. We also sell merchandise, primarily collateral forfeited from pawn lending operations and used merchandise purchased from customers, and operate a small number of financial services stores in Canada.
Basis of Presentation
The accompanying unaudited interim condensed consolidated financial statements have been prepared in accordance with accounting principles generally accepted in the United States (“GAAP”) for interim financial information and with the instructions to Form 10-Q and Article 10 of Regulation S-X. Accordingly, they do not include all the information and footnotes required by generally accepted accounting principles for complete financial statements. Our management has included all adjustments it considers necessary for a fair presentation. These adjustments are of a normal, recurring nature except for those related to discontinued operations described in Note 9. All intercompany accounts and transactions have been eliminated in consolidation.
The accompanying financial statements should be read in conjunction with the consolidated financial statements and notes included in our Annual Report on Form 10-K for the year ended September 30, 2016. The balance sheet as of September 30, 2016 has been derived from the audited financial statements at that date but does not include all of the information and footnotes required by GAAP for complete financial statements.
Our business is subject to seasonal variations, and operating results for the three and six months ended March 31, 2017 and 2016 (the "current quarter" and "current six-months" and "prior-year quarter" and "prior-year six-months," respectively) are not necessarily indicative of the results of operations for the full fiscal year.
There have been no changes in significant accounting policies as described in our Annual Report on Form 10-K for the year ended September 30, 2016, other than those described below, and we have eliminated certain disclosures previously presented in our historical financial statements that we do not consider material to the overall financial statements presented herein.
Reclassifications to Prior Period Financial Statements
Certain reclassifications of prior period amounts have been made. These reclassifications, other than those pertaining to discontinued operations discussed in Note 9, the adoption of Financial Accounting Standards Board ("FASB") Accounting Standards Updates ("ASUs") discussed below and immaterial corrections for the three months ended March 31, 2016 discussed in "Part II, Item 8 — Financial Statements and Supplementary Data — Note 2" of our Annual Report on Form 10-K for the year ended September 30, 2016, were made to conform to the current period presentation.
Use of Estimates and Assumptions
The preparation of these financial statements requires us to make estimates and assumptions that affect the reported amounts of assets, liabilities, revenues and expenses and related disclosure of contingent assets and liabilities. On an ongoing basis, we evaluate our estimates and judgments, including those related to revenue recognition, inventories, loan loss allowances, long-lived and intangible assets, share-based compensation, income taxes, contingencies and litigation. We base our estimates on historical experience, observable trends and various other assumptions that we believe are reasonable under the circumstances. We use this information to make judgments about the carrying values of assets and liabilities that are not readily apparent from other sources. Actual results may differ materially from these estimates under different assumptions or conditions.
Recently Adopted Accounting Policies
• | We early adopted ASU 2016-09, Compensation — Stock Compensation (Topic 718): Improvements to Employee Share-Based Payment Accounting during the quarter ended December 31, 2016. This ASU simplifies several aspects of the accounting for share-based payment transactions, including income tax consequences, calculation of the dilutive impact of awards, classification of awards as either equity or liabilities and classification on the statement of cash |
5
flows. We prospectively applied the requirement to present excess tax benefits as an operating activity on the statement of cash flows. Further, we continue to estimate the number of award forfeitures in recording costs for share-based awards. The financial impact of adopting ASU 2016-09 was a $0.4 million income tax benefit during the three and six months ended March 31, 2017 for excess tax benefits on vested awards which previously would have been recorded to "Additional paid-in capital" prior to adoption of ASU 2016-09.
• | We further adopted ASU 2015-11, Inventory (Topic 330): Simplifying the Measurement of Inventory, ASU 2015-05, Intangibles — Goodwill and Other — Internal-Use Software (Subtopic 350-40): Customer's Accounting for Fees Paid in a Cloud Computing Arrangement and ASU 2014-15, Presentation of Financial Statements — Going Concern (Subtopic 205-40) during the quarter ended December 31, 2016. The impacts of adoption for each ASU are as follows: |
• | We early adopted ASU 2015-11 during the quarter ended December 31, 2016 on a prospective basis, and such adoption did not have a material impact on our consolidated financial position, results of operations or cash flows. We now measure our inventories at the lower of cost or net realizable value, where net realizable value is "estimated selling prices in the ordinary course of business, less reasonably predictable costs of completion, disposal, and transportation." Inventory was previously required to be measured at the lower of cost or market value, where the measurement of market value had several potential outcomes. |
• | We adopted ASU 2015-05 during the quarter ended December 31, 2016 on a prospective basis for all arrangements entered into or materially modified after adoption of the ASU, and such adoption did not have a material impact on our consolidated financial position, results of operations or cash flows. We now consider whether cloud computing arrangements include a software license. If a cloud computing arrangement includes a software license, then we account for the software license element of the arrangement consistent with the acquisition of other software licenses. If a cloud computing arrangement does not include a software license, we account for the arrangement as a service contract. |
• | We early adopted ASU 2014-15 during the quarter ended December 31, 2016. Upon adoption of the ASU, management has the responsibility to evaluate whether there is substantial doubt about our ability to continue as a going concern for a period of one year after the date that the financial statements are issued (or available to be issued) or to provide related footnote disclosures. |
Recently Issued Accounting Pronouncements and Significant Accounting Policies
• | In January 2017, the FASB issued ASU 2017-04, Intangibles — Goodwill and Other (Topic 350): Simplifying the Test for Goodwill Impairment. This ASU eliminates Step 2 from the goodwill impairment test which previously required measurement of any goodwill impairment loss by comparing the implied fair value of a reporting unit’s goodwill with the carrying amount of that goodwill. Under the new standard, an entity should perform its annual, or interim, goodwill impairment test by comparing the fair value of a reporting unit with its carrying amount and recognize an impairment charge for the amount by which the carrying amount exceeds the reporting unit’s fair value; without exceeding the total amount of goodwill allocated to that reporting unit. The provisions of this ASU are effective for fiscal years, and any interim goodwill impairment tests within those fiscal years beginning after December 15, 2019. Early adoption is permitted for interim or annual goodwill impairment tests performed on testing dates after January 1, 2017. A reporting entity should apply the amendment on a prospective basis. We currently anticipate adoption of ASU 2017-04 in the fourth quarter of our fiscal 2017 with little to no impact on our consolidated financial position, results of operations or cash flows. |
• | In February 2016, the FASB issued ASU 2016-02, Leases (Topic 842). This ASU requires companies to generally recognize on the balance sheet operating and financing lease liabilities and corresponding right-of-use assets. The provisions of this ASU are effective for fiscal years, and interim periods within those fiscal years, beginning after December 15, 2018. Early adoption is permitted based upon guidance issued within the ASU. Although we are in the process of evaluating the impact of adopting ASU 2016-02 on our consolidated financial position, results of operations and cash flows, we anticipate a material impact on our consolidated financial position. Additionally, we are evaluating the disclosure requirements under this ASU and are identifying and preparing to implement changes to our accounting policies, practices and controls to support adoption of the ASU and are evaluating upgrades to our third party software solution concurrently with our adoption. We believe we are following an appropriate timeline to allow for proper recognition, presentation and disclosure upon adoption of the ASU which is effective for our fiscal 2020. |
• | In May 2014, the FASB issued ASU 2014-09, Revenue from Contracts with Customers (Topic 606). In August 2015, the FASB issued ASU 2015-14, Revenue from Contracts with Customers (Topic 606) to defer the effective date to December 15, 2017 for annual reporting periods beginning after that date, with early adoption permitted, but not before the original effective date of December 15, 2016. The core principle of ASU 2014-09, and the subsequently |
6
issued ASUs modifying or clarifying ASU 2014-09, is that an entity should recognize revenue to depict the transfer of goods or services to customers in an amount that reflects the consideration to which the entity expects to be entitled in exchange for those goods or services. To achieve this core principle, the guidance provides that an entity should apply the following steps: (1) identify the contract(s) with a customer; (2) identify the performance obligations in the contract; (3) determine the transaction price; (4) allocate the transaction price to the performance obligations in the contract; and (5) recognize revenue when, or as, the entity satisfies a performance obligation. The new standard allows for two methods of adoption: (a) full retrospective adoption, meaning the standard is applied to all periods presented, or (b) modified retrospective adoption, meaning the cumulative effect of applying the new standard is recognized as an adjustment to the opening retained earnings balance.
We are evaluating the impact that will result from adopting ASU 2014-09 on our consolidated financial position, results of operations, and cash flows. We currently anticipate adopting the ASU using the modified retrospective method. We do not believe the adoption will have an impact on our pawn service charge revenue recognition as we do not believe such charges are within the scope of the ASU. Further, we have not identified any impacts to our financial statements that we believe will be material as a result of the adoption of the ASU for other revenue streams, although we continue to evaluate the impact of adoption. We believe we are following an appropriate timeline to allow for proper recognition, presentation and disclosure upon adoption of the ASU which is effective for our fiscal 2019.
Please refer to Note 1, Summary of Significant Accounting Policies, of Notes to Consolidated Financial Statements included in "Part II, Item 8 — Financial Statements and Supplementary Data" of our Annual Report on Form 10-K for the year ended September 30, 2016 for discussion of our significant accounting policies and other accounting pronouncements issued but not yet adopted.
7
NOTE 2: EARNINGS PER SHARE
Components of basic and diluted earnings per share and excluded antidilutive potential common shares are as follows:
Three Months Ended March 31, | Six Months Ended March 31, | ||||||||||||||
2017 | 2016 | 2017 | 2016 | ||||||||||||
(in thousands, except per share amounts) | |||||||||||||||
Net income from continuing operations attributable to EZCORP (A) | $ | 8,398 | $ | 2,630 | $ | 16,791 | $ | 6,049 | |||||||
Loss from discontinued operations, net of tax (B) | (375 | ) | (73,442 | ) | (1,603 | ) | (84,335 | ) | |||||||
Net income (loss) attributable to EZCORP (C) | $ | 8,023 | $ | (70,812 | ) | $ | 15,188 | $ | (78,286 | ) | |||||
Weighted-average outstanding shares of common stock (D) | 54,291 | 54,843 | 54,224 | 54,869 | |||||||||||
Dilutive effect of restricted stock | 55 | 93 | 54 | 74 | |||||||||||
Weighted-average common stock and common stock equivalents (E) | 54,346 | 54,936 | 54,278 | 54,943 | |||||||||||
Basic earnings (loss) per share attributable to EZCORP: | |||||||||||||||
Continuing operations (A / D) | $ | 0.15 | $ | 0.05 | $ | 0.31 | $ | 0.11 | |||||||
Discontinued operations (B / D) | (0.01 | ) | (1.34 | ) | (0.03 | ) | (1.54 | ) | |||||||
Basic earnings (loss) per share (C / D) | $ | 0.14 | $ | (1.29 | ) | $ | 0.28 | $ | (1.43 | ) | |||||
Diluted earnings (loss) per share attributable to EZCORP: | |||||||||||||||
Continuing operations (A / E) | $ | 0.15 | $ | 0.05 | $ | 0.31 | $ | 0.11 | |||||||
Discontinued operations (B / E) | (0.01 | ) | (1.34 | ) | (0.03 | ) | (1.53 | ) | |||||||
Diluted earnings (loss) per share (C / E) | $ | 0.14 | $ | (1.29 | ) | $ | 0.28 | $ | (1.42 | ) | |||||
Potential common shares excluded from the calculation of diluted earnings (loss) per share above: | |||||||||||||||
Restricted stock* | 2,602 | 1,484 | 2,443 | 1,400 | |||||||||||
Warrants** | 14,317 | 14,317 | 14,317 | 14,317 | |||||||||||
Total potential common shares excluded | 16,919 | 15,801 | 16,760 | 15,717 | |||||||||||
* | Includes antidilutive share-based awards as well as performance-based and market conditioned share-based awards that are contingently issuable, but for which the condition for issuance has not been met as of the end of the reporting period. |
** | See Note 5 for discussion of the terms and conditions of these potential common shares. |
8
NOTE 3: STRATEGIC INVESTMENTS
As of March 31, 2017, we owned 156,552,484 shares, or approximately 32%, of our unconsolidated affiliate Cash Converters International Limited ("Cash Converters International"). The following tables present summary financial information for Cash Converters International’s most recently reported results as of March 31, 2017 after translation to U.S. dollars:
December 31, | |||||||
2016 | 2015 | ||||||
(in thousands) | |||||||
Current assets | $ | 158,235 | $ | 176,105 | |||
Non-current assets | 141,218 | 143,466 | |||||
Total assets | $ | 299,453 | $ | 319,571 | |||
Current liabilities | $ | 70,468 | $ | 68,857 | |||
Non-current liabilities | 48,181 | 48,263 | |||||
Shareholders’ equity: | |||||||
Equity attributable to owners of the parent | $ | 180,803 | $ | 202,450 | |||
Noncontrolling interest | 1 | 1 | |||||
Total liabilities and shareholders’ equity | $ | 299,453 | $ | 319,571 | |||
Half Year Ended December 31, | |||||||
2016 | 2015 | ||||||
(in thousands) | |||||||
Gross revenues* | $ | 108,161 | $ | 110,219 | |||
Gross profit* | 74,343 | 81,139 | |||||
Net profit | 8,633 | 11,483 | |||||
* | Cash Converters International announced during its fiscal 2016 that certain of its United Kingdom operations would be discontinued, including a historical recasting of such operations as discontinued operations. We have recast the above information pertaining to the half year ended December 31, 2015 to reflect this historical recasting. |
NOTE 4: FAIR VALUE MEASUREMENTS
In accordance with FASB Accounting Standards Codification ("ASC") 820-10, our assets and liabilities discussed below are classified in one of the following three categories based on the inputs used to develop their fair values: Level 1 — Quoted market prices in active markets for identical assets or liabilities; Level 2 — Other observable market-based inputs or unobservable inputs that are corroborated by market data; and Level 3 — Unobservable inputs that are not corroborated by market data.
Recurring Fair Value Measurements
The tables below present our financial assets (liabilities) that were carried and measured at fair value on a recurring basis:
Financial Assets (Liabilities) | Balance Sheet Location | March 31, 2017 | September 30, 2016 | |||||||
(in thousands) | ||||||||||
Guarantee asset — Level 3 | Prepaid expenses and other current assets | $ | 562 | $ | 1,209 | |||||
Guarantee liability — Level 3 | Accounts payable, accrued expenses and other current liabilities | (584 | ) | (1,258 | ) | |||||
Cash Convertible Notes Hedges — Level 2 | Other assets, net | 15,138 | 37,692 | |||||||
Cash Convertible Notes Embedded Derivative — Level 2 | Long-term debt, net | (15,138 | ) | (37,692 | ) | |||||
We initially measured the guarantee asset and liability at fair value and are subsequently amortizing the guarantees based upon the principal payments received on the associated notes receivable, which approximates the fair value of the guarantees on a recurring basis.
9
We measured the fair value of the Cash Convertible Notes Hedges and the Cash Convertible Notes Embedded Derivative using an option pricing model based on observable Level 1 and Level 2 inputs such as conversion price of underlying shares, current share price, implied volatility, risk free interest rate and other factors. See Note 5 for additional discussion.
There were no transfers in or out of Level 1 or Level 2 for financial assets or liabilities measured at fair value on a recurring basis during the periods presented.
Financial Assets and Liabilities Not Measured at Fair Value
The tables below present our financial assets and liabilities that were not measured at fair value (including those discussed below the following tables) on a recurring basis:
Carrying Value | Estimated Fair Value | |||||||||||||||||||
March 31, 2017 | March 31, 2017 | Fair Value Measurement Using | ||||||||||||||||||
Level 1 | Level 2 | Level 3 | ||||||||||||||||||
(in thousands) | ||||||||||||||||||||
Financial assets: | ||||||||||||||||||||
Notes receivable, net | $ | 70,297 | $ | 71,921 | $ | — | $ | — | $ | 71,921 | ||||||||||
Investment in unconsolidated affiliate | 38,334 | 37,101 | 37,101 | — | — | |||||||||||||||
Financial liabilities: | ||||||||||||||||||||
Cash Convertible Notes | $ | 203,464 | $ | 213,417 | $ | — | $ | 213,417 | $ | — | ||||||||||
Term Loan Facility | 48,122 | 50,403 | — | — | 50,403 | |||||||||||||||
Carrying Value | Estimated Fair Value | |||||||||||||||||||
September 30, 2016 | September 30, 2016 | Fair Value Measurement Using | ||||||||||||||||||
Level 1 | Level 2 | Level 3 | ||||||||||||||||||
(in thousands) | ||||||||||||||||||||
Financial assets: | ||||||||||||||||||||
Notes receivable, net | $ | 83,065 | $ | 83,065 | $ | — | $ | — | $ | 83,065 | ||||||||||
Investment in unconsolidated affiliate | 37,128 | 37,128 | 37,128 | — | — | |||||||||||||||
Financial liabilities: | ||||||||||||||||||||
Cash Convertible Notes | $ | 197,954 | $ | 227,332 | $ | — | $ | 227,332 | $ | — | ||||||||||
Term Loan Facility | 47,965 | 48,688 | — | — | 48,688 | |||||||||||||||
Based on the short-term nature of cash and cash equivalents, pawn loans, pawn service charges receivable and current consumer loans, fees and interest receivable, we estimate that their carrying value approximates fair value. We consider our cash and cash equivalents to be measured using Level 1 inputs and our pawn loans, pawn service charges receivable and current consumer loans, fees and interest receivable to be measured using Level 3 inputs. Significant increases or decreases in the underlying assumptions used to value pawn loans, pawn service charges receivable and current consumer loans, fees and interest receivable could significantly increase or decrease these fair value estimates.
We measured the fair value of the notes receivable under a discounted cash flow approach considering the synthetic credit ratings for Prestaciones Finmart, S.A.P.I. de C.V., SOFOM, E.N.R. ("Grupo Finmart") and Alpha Holding, S.A. de C.V. (“AlphaCredit”), as applicable, with discount rates ranging primarily from 8% to 15%. Certain of the significant inputs used for the valuation were not observable in the market. Significant increases or decreases in the underlying assumptions used to value the notes receivable could significantly increase or decrease these fair value estimates.
The inputs used to generate the fair value of the investment in unconsolidated affiliate Cash Converters International were considered Level 1 inputs. These inputs are comprised of (a) the quoted stock price on the Australian Stock Exchange multiplied by (b) the number of shares we owned multiplied by (c) the applicable foreign currency exchange rate as of the end of our reporting period. We included no control premium for owning a large percentage of outstanding shares.
We measured the fair value of the Cash Convertible Notes using quoted price inputs from Bloomberg. The Cash Convertible Notes are not actively traded and thus the price inputs represent a Level 2 measurement. As the Cash Convertible Notes are not
10
actively traded, the quoted price inputs obtained from Bloomberg are highly variable from day to day and thus the fair value estimates disclosed above could significantly increase or decrease.
We measured the fair value of the Term Loan Facility under a discounted cash flow approach considering our synthetic credit rating, including inputs that are not observable in the market, with discount rates up to approximately 8%. A 50 basis point increase or decrease in the calculated credit spread based on our underlying synthetic credit rating would increase or decrease the fair value of our Term Loan Facility by approximately $1.3 million. The fair value of the Term Loan Facility approximated its carrying value, inclusive of issuance costs and exclusive of deferred financing costs, as of September 30, 2016. Significant increases or decreases in the underlying assumptions used to value our notes receivable could significantly increase or decrease these fair value estimates.
Notes Receivable from Grupo Finmart Divestiture
Subsequent to the sale of Grupo Finmart in September 2016, we determined that we retained a variable interest in Grupo Finmart, including notes receivable and a guarantee liability of the future cash outflows of certain Grupo Finmart foreign exchange forward contracts with a backup guarantee provided by AlphaCredit for any payments we make under the guarantee. We determined that we are not the primary beneficiary of Grupo Finmart subsequent to its disposition as we lack a controlling financial interest in Grupo Finmart. As of March 31, 2017, we had a total gross outstanding balance on our notes receivable of $75.1 million. We have collected $7.3 million and $15.1 million, respectively, in principal on these notes receivable during the three and six months ended March 31, 2017.
The following table presents the carrying amount and classification of the assets and liabilities pertaining to our variable interest compared to the maximum exposure to loss for each asset and liability:
March 31, 2017 | September 30, 2016 | |||||||||||||||||
Instrument | Balance Sheet Location | Asset (Liability) Recorded in Consolidated Balance Sheet | Maximum Exposure to Loss | Asset (Liability) Recorded in Consolidated Balance Sheet | Maximum Exposure to Loss | |||||||||||||
(in thousands) | ||||||||||||||||||
Notes receivable | Notes receivable, net (including discount of $4.8 million and $6.7 million as of March 31, 2017 and September 30, 2016, respectively) | $ | 70,297 | $ | 70,297 | $ | 83,065 | $ | 83,065 | |||||||||
Guarantee asset | Prepaid expenses and other current assets | 562 | — | 1,209 | — | |||||||||||||
Guarantee liability* | Accounts payable, accrued expenses and other current liabilities | (584 | ) | — | (1,258 | ) | — | |||||||||||
* | Maximum exposure to loss under the guarantee liability was $11.8 million and $25.3 million as of March 31, 2017 and September 30, 2016, respectively. However such amount is included within the maximum exposure to loss for the notes receivable above, as the guarantee liability is a guarantee by us of Grupo Finmart’s repayment of our notes receivable owed by Grupo Finmart. |
11
NOTE 5: LONG-TERM DEBT
The following tables present our long-term debt instruments outstanding as well as future principal payments due:
March 31, 2017 | September 30, 2016 | ||||||||||||||||||||||
Gross Amount | Debt Discount and Issuance Costs | Carrying Amount | Gross Amount | Debt Discount and Issuance Costs | Carrying Amount | ||||||||||||||||||
(in thousands) | |||||||||||||||||||||||
Recourse to EZCORP: | |||||||||||||||||||||||
2.125% Cash convertible senior notes due 2019 | $ | 230,000 | $ | (26,536 | ) | $ | 203,464 | $ | 230,000 | $ | (32,046 | ) | $ | 197,954 | |||||||||
Cash convertible senior notes due 2019 embedded derivative | 15,138 | — | 15,138 | 37,692 | — | 37,692 | |||||||||||||||||
Term loan facility | 50,000 | (1,878 | ) | 48,122 | 50,000 | (2,035 | ) | 47,965 | |||||||||||||||
$ | 295,138 | (28,414 | ) | 266,724 | 317,692 | (34,081 | ) | 283,611 | |||||||||||||||
Principal Payment Schedule | |||||||||||||||||||
Total | Less Than 1 Year | 1 - 3 Years | 3 - 5 Years | More Than 5 Years | |||||||||||||||
(in thousands) | |||||||||||||||||||
2.125% Cash convertible senior notes due 2019 (a) | $ | 230,000 | $ | — | $ | 230,000 | $ | — | $ | — | |||||||||
Term loan facility (b) | 50,000 | — | — | — | 50,000 | ||||||||||||||
$ | 280,000 | $ | — | $ | 230,000 | $ | — | $ | 50,000 | ||||||||||
(a) | Excludes the potential impact of the embedded derivative. |
(b) | See discussion regarding acceleration of maturity date below. |
Term Loan Facility up to $100 Million
On September 12, 2016 (the “Closing Date”), EZCORP, Inc. (as borrower) and certain of its subsidiaries (as guarantors) entered into a “Financing Agreement” with certain lenders (the “Lenders”) and Fortress Credit Co LLC (as collateral and administrative agent for the Lenders). The Financing Agreement provides for a senior secured credit facility in an aggregate principal amount of $100 million, subject to various terms and conditions contained in the Financing Agreement. The credit facility (“Term Loan Facility”) consists of an initial Term Loan of $50 million (“Initial Term Loan”) that was drawn on the Closing Date, and one or more “Delayed Draw Term Loans” of up to $50 million in the aggregate that may be drawn in whole or in part at any time and from time to time during the first 18 months from the Closing Date.
Borrowings under the facility bear interest at an annual rate initially equal to the London Interbank Offered Rate (“LIBOR”) plus 7.5% or, at our election, a “Reference Rate” plus 6.5%, but will be reduced to LIBOR plus 6.5% or, at our election, the Reference Rate plus 5.5% upon the later of December 31, 2017 or the occurrence of a specified investment return event. The LIBOR is subject to a floor of 1% and the Reference Rate is subject to a floor of 3%. We pay a monthly fee of 2.75% per annum on the average daily unused portion of the Delayed Draw Term Loan facility and a quarterly loan servicing fee of $15,000. At the time of each draw under the Delayed Draw Term Loan facility, we will pay a funding fee of .875% of the funded Delayed Draw Term Loan.
All amounts outstanding under the new facility must be repaid on the Final Maturity Date, which will occur on September 12, 2022 (six years after the Closing Date); provided, however, that the Final Maturity Date will occur on May 15, 2019 if, on that date, more than 10% of our 2.125% Cash Convertible Senior Notes Due 2019 (“Cash Convertible Notes”) remain outstanding or there is no lender-approved plan to refinance any lesser outstanding amount of the Cash Convertible Notes. The facility is subject to mandatory prepayments upon the occurrence of certain specified events, such as asset sales, certain debt issuances, certain equity issuances, casualty and condemnation events and receipt of tax refunds or proceeds of settlements or judgments (subject to customary exceptions, materiality thresholds and reinvestment rights). We may voluntarily prepay the facility at any time subject to a prepayment premium of 2% during the first year after the Closing Date and 1% during the second year after the Closing Date.
The Financing Agreement contains affirmative and negative covenants, indemnities, representations and warranties, and other terms and conditions customary for financings of this type, including limitations on certain indebtedness, liens, acquisitions and
12
other investments, fundamental changes (including mergers, consolidations and dissolutions), asset dispositions, dividends and other distributions, prepayments of other indebtedness, sale and leaseback transactions, and transactions with affiliates. The Financing Agreement also contains quarterly financial covenants consisting of a maximum Senior Leverage Ratio and a minimum Fixed Charge Coverage Ratio, as well as customary events of default. We were not in default of any of these covenants as of March 31, 2017.
2.125% Cash Convertible Senior Notes Due 2019
In June 2014 ("Original Issuance Date"), we issued $200 million aggregate principal amount of 2.125% Cash Convertible Notes, with an additional $30 million principal amount of Cash Convertible Notes issued in July 2014. All of the Cash Convertible Notes were issued pursuant to an indenture dated June 23, 2014 (the "Indenture") by and between EZCORP and Wells Fargo Bank, National Association, as the trustee. The Cash Convertible Notes were issued in a private offering and resold under Rule 144A under the Securities Act of 1933. The Cash Convertible Notes pay interest semi-annually in arrears at a rate of 2.125% per annum on June 15 and December 15 of each year and mature on June 15, 2019 (the "Maturity Date").
Prior to December 15, 2018, the Cash Convertible Notes will be convertible only upon the occurrence of certain events and during certain periods, and thereafter, at any time prior to the close of business on the second scheduled trading day immediately preceding the Maturity Date. At maturity, the holders of the Cash Convertible Notes will be entitled to receive cash equal to the principal amount of the Cash Convertible Notes plus unpaid accrued interest.
Cash Convertible Notes Embedded Derivative
We account for the cash conversion feature of the Cash Convertible Notes as a separate derivative instrument (the “Cash Convertible Notes Embedded Derivative”). The Cash Convertible Notes are convertible into cash, subject to satisfaction of certain conditions and during the periods described below, based on an initial "Conversion Rate" of 62.2471 shares of Class A Common Stock per $1,000 principal amount of Cash Convertible Notes (equivalent to an initial "Conversion Price" of approximately $16.065 per share of our Class A Common Stock). Upon conversion of a note, we will pay cash based on a daily conversion value calculated on a proportionate basis for each trading day in the applicable 80 trading day observation period as described in the Indenture. The conversion rate will not be adjusted for any accrued and unpaid interest.
Holders may surrender their Cash Convertible Notes for conversion into cash prior to December 15, 2018 only under the following circumstances (the “Early Conversion Conditions”): (1) during any fiscal quarter commencing after the fiscal quarter ending on September 30, 2014 (and only during such fiscal quarter), if the last reported sale price of our Class A Common Stock for at least 20 trading days (whether or not consecutive) during a period of 30 consecutive trading days ending on the last trading day of the immediately preceding fiscal quarter is greater than or equal to 130% of the conversion price on each applicable trading day; (2) during the five business day period after any five consecutive trading day period (the “measurement period”) in which the trading price, as defined in the Indenture, per $1,000 principal amount of notes for each trading day of the measurement period was less than 98% of the product of the last reported sale price of our Class A Common Stock and the conversion rate on such trading day; or (3) upon the occurrence of specified corporate events, as defined in the Indenture. On or after December 15, 2018 until the close of business on the second scheduled trading day immediately preceding the Maturity Date, holders may convert their notes into cash at any time, regardless of the foregoing circumstances.
If a holder elects to convert its Cash Convertible Notes in connection with certain make-whole fundamental changes, as that term is defined in the Indenture, that occur prior to the Maturity Date, we will in certain circumstances increase the conversion rate for Cash Convertible Notes converted in connection with such make-whole fundamental changes by a specified number of shares of Class A Common Stock. In addition, the conversion rate is subject to customary anti-dilution adjustments (for example, certain dividend distributions or tender or exchange offer of our Class A Common Stock).
Upon the occurrence of a fundamental change, as defined in the Indenture, holders may require us to repurchase for cash all or any portion of the then outstanding Cash Convertible Notes at a repurchase price equal to 100% of the principal amount of the notes to be repurchased, plus accrued and unpaid interest.
As of March 31, 2017, none of the note holders had elected to convert their Cash Convertible Notes.
Cash Convertible Notes Hedges
In connection with the issuance of the Cash Convertible Notes, we purchased cash-settled call options (the “Cash Convertible Notes Hedges”) in privately negotiated transactions with certain of the initial purchasers or their affiliates (in this capacity, the “Option Counterparties”). The Cash Convertible Notes Hedges provide us with the option to acquire, on a net settlement basis, approximately 14.3 million shares of our Class A Common Stock at a strike price of $16.065, which is equal to the number of shares of our Class A Common Stock that notionally underlie the Cash Convertible Notes and corresponds to the Conversion
13
Price of the Cash Convertible Notes. The Cash Convertible Notes Hedges have an expiration date that is the same as the Maturity Date of the Cash Convertible Notes, subject to earlier exercise. The Cash Convertible Notes Hedges have customary anti-dilution provisions similar to the Cash Convertible Notes. If we exercise the Cash Convertible Notes Hedges, the aggregate amount of cash we will receive from the option counterparties to the Cash Convertible Notes Hedges will cover the aggregate amount of cash that we would be required to pay to the holders of the converted Cash Convertible Notes, less the principal amount thereof. As of March 31, 2017, we have not purchased any shares under the Cash Convertible Notes Hedges.
The aggregate cost of the Cash Convertible Notes Hedges was $46.5 million (or $21.3 million net of the total proceeds from the Warrants sold, as discussed below). The Cash Convertible Notes Hedges are accounted for as a derivative asset and are recorded in the condensed consolidated balance sheets at their estimated fair value. The Cash Convertible Notes Embedded Derivative liability and the Cash Convertible Notes Hedges asset will be adjusted to fair value each reporting period and unrealized gains and losses will be reflected in the condensed consolidated statements of operations. The Cash Convertible Notes Embedded Derivative and the Cash Convertible Notes Hedges are designed to have similar fair values. Accordingly, the changes in the fair values of these instruments are expected to offset and not have a net impact on the condensed consolidated statements of operations. See Note 4 for discussion of fair value of the Cash Convertible Notes Embedded Derivative liability and the Cash Convertible Notes Hedges asset.
Cash Convertible Notes Warrants
In connection with the issuance of the Cash Convertible Notes, we also sold net-share-settled warrants (the “Warrants”) in privately negotiated transactions with the Option Counterparties for the purchase of up to approximately 14.3 million shares of our Class A Common Stock at a strike price of $20.83 per share, for total proceeds of $25.1 million, net of issuance costs, which was recorded as an increase in stockholders' equity. The Warrants have customary anti-dilution provisions similar to the Cash Convertible Notes. As a result of the Warrants, we will experience dilution to our diluted earnings per share if our average closing stock price exceeds $20.83 for any fiscal quarter. The Warrants expire on various dates from September 2019 through February 2020 and must be settled in net shares of our Class A Common Stock. Therefore, upon expiration of the Warrants, we will issue shares of Class A Common Stock to the purchasers of the Warrants that represent the value by which the price of the Class A Common Stock exceeds the strike price stipulated within the particular warrant agreement. As of March 31, 2017, there were 14.3 million warrants outstanding.
NOTE 6: STOCK COMPENSATION
On May 1, 2010 our Board of Directors approved the adoption of the EZCORP, Inc. 2010 Long-Term Incentive Plan (the “2010 Plan”). As of September 30, 2016, the 2010 Plan permitted grants of options, restricted stock awards and stock appreciation rights covering up to 3,485,649 shares of our Class A Common Stock. In December 2016, the Board of Directors and the voting stockholder approved the addition of 500,000 shares to the 2010 Plan.
In November and December 2016, we granted 919,898 restricted stock unit awards to employees and 72,500 restricted stock awards to non-employee directors with a grant date fair value of primarily $9.60 per share. The awards granted to employees vest on September 30, 2019 subject to the achievement of certain performance targets. As of March 31, 2017, we considered the achievement of these performance targets probable. The awards granted to non-employee directors vest over two years, 50% on September 30, 2017 and 50% on September 30, 2018 and are subject only to service conditions.
NOTE 7: CONTINGENCIES
We are involved in various claims, suits, investigations and legal proceedings, including those described below. We are unable to determine the ultimate outcome of any current litigation or regulatory actions. An unfavorable outcome could have a material adverse effect on our financial condition, results of operations or liquidity. Except as noted below, we have not recorded a liability for any of these matters as of March 31, 2017 because we do not believe at this time that any loss is probable or that the amount of any probable loss can be reasonably estimated. The following is a description of significant proceedings.
Shareholder derivative litigation — On July 28, 2014, Lawrence Treppel, a purported holder of Class A Non-voting Common Stock, filed a derivative action in the Court of Chancery of the State of Delaware styled Treppel v. Cohen, et al. (C.A. No. 9962-VCP). The complaint, as originally filed and as amended on September 23, 2014, names as defendants Phillip E. Cohen, the beneficial owner of all of our outstanding Class B Voting Common Stock; several current and former members of our Board of Directors (Joseph J. Beal, Sterling B. Brinkley, John Farrell, Pablo Lagos Espinosa, William C. Love, Thomas C. Roberts and Paul E. Rothamel); three entities controlled by Mr. Cohen (MS Pawn Limited Partnership, the record holder of our Class B Voting Common Stock; MS Pawn Corporation, the general partner of MS Pawn Limited Partnership; and Madison Park LLC); and EZCORP, Inc., as nominal defendant. The amended complaint asserts the following claims:
14
• | Claims against the current and former Board members for breach of fiduciary duties and waste of corporate assets in connection with the Board’s decision to enter into advisory services agreements with Madison Park from October 2004 to June 2014 (Counts I and II, respectively); |
• | Claims against Mr. Cohen and MS Pawn Limited Partnership for aiding and abetting the breaches of fiduciary duties relating to the advisory services agreements with Madison Park (Count III); and |
• | Claims against Mr. Cohen and Madison Park for unjust enrichment for payments under the advisory services agreements (Count IV). |
The plaintiff seeks (a) recovery for the Company in the amount of the damages the Company has sustained as a result of the alleged breach of fiduciary duties, waste of corporate assets and aiding and abetting, (b) disgorgement by Mr. Cohen and Madison Park of the benefits they received as a result of the related party transactions and (c) reimbursement of costs and expenses, including reasonable attorney’s fees.
On November 13, 2014, pursuant to the parties’ stipulation, the Court dismissed the action as to Mr. Brinkley, Mr. Rothamel and Mr. Lagos.
The remaining defendants filed motions to dismiss, and a hearing on those motions was held before the Court on September 8, 2015. Prior to that hearing, the plaintiff proposed a dismissal without prejudice for the claims against Mr. Beal, Mr. Love and Mr. Farrell. Those defendants continued to seek a dismissal with prejudice that would bind all potential plaintiffs. On January 15, 2016, the Court issued an opinion dismissing the action as to Mr. Beal, Mr. Love and Mr. Farrell with prejudice only as to the plaintiff.
On January 25, 2016, the Court issued a separate opinion granting in part and denying in part the motions to dismiss filed by the remaining defendants. Specifically, the Court granted the motion to dismiss Count IV (unjust enrichment) for failure to state a claim. The Court also dismissed Count III (aiding and abetting) as to Mr. Cohen, but interpreted Count I (breach of fiduciary duty) to state a claim against Mr. Cohen and MS Pawn, as well as Mr. Roberts. The Court otherwise denied the motions to dismiss, including the motion to dismiss Count III (aiding and abetting) against MS Pawn.
On February 4, 2016, the remaining defendants filed an Application for Certification of Interlocutory Appeal, which the plaintiff opposed on February 15, 2016, and the Court set a hearing on the application. On February 22, 2016, the Court denied the Application for Certification of Interlocutory Appeal and provided the plaintiff the opportunity to amend its complaint to add a fiduciary-duty claim as to Mr. Cohen and Madison Park, staying proceedings pending a ruling from the Delaware Supreme Court. After the Application for Certification of Interlocutory Appeal was denied, Mr. Roberts, MS Pawn Corporation and MS Pawn Limited Partnership filed notices of appeal from the interlocutory opinion and order denying the motions to dismiss. On March 10, 2016, the Delaware Supreme Court denied those petitions for an interlocutory appeal.
On March 4, 2016, the plaintiff filed a Second Amended Derivative Complaint against Mr. Roberts, Mr. Cohen, Madison Park, MS Pawn Corporation and MS Pawn Limited Partnership with EZCORP, Inc., as nominal defendant. The case is now in the discovery stage.
We intend to continue to defend vigorously against the claims asserted in this lawsuit. Although the lawsuit does not seek relief against the Company, we have certain indemnification obligations to the other defendants (including Madison Park and Mr. Cohen), which obligations include the payment of attorney’s fees in advance of the outcome. We cannot predict the outcome of this lawsuit, or the amount of time and expense that will be required to resolve it.
Federal securities litigation (SDNY) — On August 22, 2014, Jason Close, a purported holder of Class A Non-voting Common Stock, for himself and on behalf of other similarly situated holders of Class A Non-voting Common Stock, filed a lawsuit in the United States District Court for the Southern District of New York styled Close v. EZCORP, Inc., et al. (Case No. 1:14-cv-06834-ALC). That lawsuit named as defendants EZCORP, Inc., Paul. E. Rothamel (the Company's former Chief Executive Officer) and Mark Kuchenrither (the Company's former Chief Financial Officer). That lawsuit was consolidated with a similar lawsuit filed in the same court on October 17, 2014 by the Automotive Machinists Pension Plan and styled Automotive Machinists Pension Plan v. EZCORP, Inc., et al. (Case No. 1:14-cv-8349-ALC). On November 18, 2014, the court consolidated the two lawsuits under the caption In Re EZCORP, Inc. Securities Litigation (Case No. 1:14-cv-06834-ALC).
The Consolidated Amended Class Action Complaint asserted violations of Sections 10(b) and 20(a) of the Securities Exchange Act of 1934, as well as Rule 10b-5 promulgated thereunder, alleging generally that:
• | EZCORP and the officer defendants issued false and misleading statements and omissions regarding the Company's online lending operations in the U.K. (Cash Genie) and Cash Genie's compliance history; |
15
• | EZCORP and the officer defendants issued false and misleading statements and omissions regarding the nature of the Company's consulting relationship with Madison Park LLC (as entity owned by Mr. Cohen) and the process the Board of Directors used in agreeing to it; |
• | EZCORP's financial statements were false and misleading, and violated GAAP and SEC rules and regulations, by failing to properly recognize impairment charges with respect to the Company's investment in Albemarle & Bond; and |
• | Mr. Cohen and MS Pawn Limited Partnership, as controlling persons of EZCORP, were aware of and controlled the Company's alleged false and misleading statements and omissions. |
On March 31, 2016, the Court, in response to the defendants' motions to dismiss, dismissed the Section 10(b) and Rule 10b-5 claims insofar as they were based on (1) the alleged misstatements about the nature of and approval process related to the Company's consulting relationship with Madison Park, (2) the alleged misstatements regarding the impairment of the Company's investment in Albemarle & Bond, and (3) some of the alleged misstatements about Cash Genie. The Section 10(b) and Rule 10b-5 claims survived the motions to dismiss insofar as they were based on certain alleged misstatements about Cash Genie. The Section 20(a) claims also survived the motions to dismiss.
On November 23, 2016, the parties agreed to a mediated settlement of all remaining claims. The settlement provides for the payment of $5.9 million by the defendants, which was covered by applicable directors’ and officers’ liability insurance. Following a Settlement Hearing on April 25, 2017, the Court entered an order to approve the settlement and dismiss the case.
Federal Securities Litigation (WDT) — On July 20, 2015, Wu Winfred Huang, a purported holder of Class A Non-voting Common Stock, for himself and on behalf of other similarly situated holders of Class A Non-voting Common Stock, filed a lawsuit in the United States District Court for the Western District of Texas styled Huang v. EZCORP, Inc., et al. (Case No. 1:15-cv-00608-SS). The complaint names as defendants EZCORP, Inc., Stuart I. Grimshaw (our chief executive officer) and Mark E. Kuchenrither (our former chief financial officer) and asserts violations of Sections 10(b) and 20(a) of the Securities Exchange Act of 1934 and Rule 10b-5 promulgated thereunder. The original complaint related to the Company’s announcement on July 17, 2015 that it will restate the financial statements for fiscal 2014 and the first quarter of fiscal 2015, and alleged generally that the Company issued materially false or misleading statements concerning the Company, its finances, business operations and prospects and that the Company misrepresented the financial performance of the Grupo Finmart business.
On August 14, 2015, a substantially identical lawsuit, styled Rooney v. EZCORP, Inc., et al. (Case No. 1:15-cv-00700-SS) was also filed in the United States District Court for the Western District of Texas. On September 28, 2015, the plaintiffs in these two lawsuits filed an agreed stipulation to be appointed co-lead plaintiffs and agreed that their two actions should be consolidated. On November 3, 2015, the Court entered an order consolidating the two actions under the caption In re EZCORP, Inc. Securities Litigation (Master File No. 1:15-cv-00608-SS), and appointed the two plaintiffs as co-lead plaintiffs, with their respective counsel appointed as co-lead counsel.
On January 11, 2016, the plaintiffs filed an Amended Class Action Complaint (the "Amended Complaint"). In the Amended Complaint, the plaintiffs seek to represent a class of purchasers of our Class A Common Stock between November 6, 2012 and October 20, 2015. The Amended Complaint asserts that the Company and Mr. Kuchenrither violated Section 10(b) of the Securities Exchange Act and Rule 10b-5, issued materially false or misleading statements throughout the proposed class period concerning the Company and its internal controls, specifically regarding the financial performance of Grupo Finmart. The plaintiffs also allege that Mr. Kuchenrither, as a controlling person of the Company, violated Section 20(a) of the Securities Exchange Act. The Amended Complaint does not assert any claims against Mr. Grimshaw. On February 25, 2016, defendants filed a motion to dismiss the lawsuit. The plaintiff filed an opposition to the motion to dismiss on April 11, 2016, and the defendants filed their reply on May 11, 2016. The Court held a hearing on the motion to dismiss on June 22, 2016.
On October 18, 2016, the Court granted the defendants’ motion to dismiss and dismissed the Amended Complaint without prejudice. The Court gave the plaintiffs 20 days (until November 7, 2016) to file a further amended complaint. On November 4, 2016, the plaintiffs filed a Second Amended Consolidated Class Action Complaint (“Second Amended Complaint”). The Second Amended Complaint raises the same claims dismissed by the Court on October 18, 2016, except plaintiffs now seek to represent a class of purchasers of EZCORP’s Class A Common Stock between November 7, 2013 and October 20, 2015 (instead of between November 6, 2012 and October 20, 2015). On December 5, 2016, defendants filed a motion to dismiss the Second Amended Compliant. The plaintiffs filed their opposition to the motion to dismiss on January 6, 2017, and the defendants filed their reply brief on January 20, 2017. The motion to dismiss is currently pending before the Court.
We cannot predict the outcome of the litigation, but we intend to defend vigorously against all allegations and claims.
SEC Investigation — On October 23, 2014, we received a notice from the Fort Worth Regional Office of the SEC that it was conducting an investigation into certain matters involving EZCORP, Inc. The notice was accompanied by a subpoena, directing
16
us to produce a variety of documents, including all minutes and materials related to Board of Directors and Board committee meetings since January 1, 2009 and all documents and communications relating to our historical advisory services relationship with Madison Park (the business advisory firm owned by Mr. Cohen) and LPG Limited (a business advisory firm owned by Lachlan P. Given, our current Executive Chairman of the Board). The SEC has also issued subpoenas to current and former members of our Board of Directors requesting production of similar documents, as well as to certain third parties, and has conducted interviews with certain individuals. We continue to cooperate fully with the SEC in its investigation.
17
NOTE 8: SEGMENT INFORMATION
We currently report our segments as follows: U.S. Pawn — all pawn activities in the United States, Mexico Pawn — all pawn activities in Mexico and other parts of Latin America and Other International — primarily our equity interest in the net income of Cash Converters International and consumer finance activities in Canada. There are no inter-segment revenues, and the amounts below were determined in accordance with the same accounting principles used in our condensed consolidated financial statements.
Three Months Ended March 31, 2017 | |||||||||||||||||||||||
U.S. Pawn | Mexico Pawn | Other International | Total Segments | Corporate Items | Consolidated | ||||||||||||||||||
(in thousands) | |||||||||||||||||||||||
Revenues: | |||||||||||||||||||||||
Merchandise sales | $ | 95,550 | $ | 14,688 | $ | — | $ | 110,238 | $ | — | $ | 110,238 | |||||||||||
Jewelry scrapping sales | 9,056 | 1,163 | — | 10,219 | — | 10,219 | |||||||||||||||||
Pawn service charges | 59,661 | 7,431 | — | 67,092 | — | 67,092 | |||||||||||||||||
Other revenues | 56 | 147 | 1,876 | 2,079 | — | 2,079 | |||||||||||||||||
Total revenues | 164,323 | 23,429 | 1,876 | 189,628 | — | 189,628 | |||||||||||||||||
Merchandise cost of goods sold | 60,499 | 9,994 | — | 70,493 | — | 70,493 | |||||||||||||||||
Jewelry scrapping cost of goods sold | 7,890 | 951 | — | 8,841 | — | 8,841 | |||||||||||||||||
Other cost of revenues | — | — | 397 | 397 | — | 397 | |||||||||||||||||
Net revenues | 95,934 | 12,484 | 1,479 | 109,897 | — | 109,897 | |||||||||||||||||
Segment and corporate expenses (income): | |||||||||||||||||||||||
Operations | 63,556 | 8,901 | 2,003 | 74,460 | — | 74,460 | |||||||||||||||||
Administrative | — | — | — | — | 13,283 | 13,283 | |||||||||||||||||
Depreciation and amortization | 2,660 | 660 | 50 | 3,370 | 2,660 | 6,030 | |||||||||||||||||
Loss (gain) on sale or disposal of assets | (3 | ) | 74 | — | 71 | — | 71 | ||||||||||||||||
Interest expense | — | 3 | — | 3 | 5,625 | 5,628 | |||||||||||||||||
Interest income | — | (342 | ) | — | (342 | ) | (1,898 | ) | (2,240 | ) | |||||||||||||
Equity in net income of unconsolidated affiliate | — | — | (1,243 | ) | (1,243 | ) | — | (1,243 | ) | ||||||||||||||
Other expense (income) | (4 | ) | (48 | ) | 41 | (11 | ) | 239 | 228 | ||||||||||||||
Segment contribution | $ | 29,725 | $ | 3,236 | $ | 628 | $ | 33,589 | |||||||||||||||
Income from continuing operations before income taxes | $ | 33,589 | $ | (19,909 | ) | $ | 13,680 | ||||||||||||||||
18
Three Months Ended March 31, 2016 | |||||||||||||||||||||||
U.S. Pawn | Mexico Pawn | Other International | Total Segments | Corporate Items | Consolidated | ||||||||||||||||||
(in thousands) | |||||||||||||||||||||||
Revenues: | |||||||||||||||||||||||
Merchandise sales | $ | 94,740 | $ | 14,603 | $ | — | $ | 109,343 | $ | — | $ | 109,343 | |||||||||||
Jewelry scrapping sales | 11,599 | 1,181 | — | 12,780 | — | 12,780 | |||||||||||||||||
Pawn service charges | 56,614 | 7,516 | — | 64,130 | — | 64,130 | |||||||||||||||||
Other revenues | 49 | (117 | ) | 2,027 | 1,959 | — | 1,959 | ||||||||||||||||
Total revenues | 163,002 | 23,183 | 2,027 | 188,212 | — | 188,212 | |||||||||||||||||
Merchandise cost of goods sold | 58,241 | 10,090 | 1 | 68,332 | — | 68,332 | |||||||||||||||||
Jewelry scrapping cost of goods sold | 10,128 | 957 | — | 11,085 | — | 11,085 | |||||||||||||||||
Other cost of revenues | — | — | 431 | 431 | — | 431 | |||||||||||||||||
Net revenues | 94,633 | 12,136 | 1,595 | 108,364 | — | 108,364 | |||||||||||||||||
Segment and corporate expenses (income): | |||||||||||||||||||||||
Operations | 61,240 | 9,024 | 1,992 | 72,256 | — | 72,256 | |||||||||||||||||
Administrative | — | — | — | — | 15,621 | 15,621 | |||||||||||||||||
Depreciation and amortization | 3,042 | 764 | 56 | 3,862 | 2,744 | 6,606 | |||||||||||||||||
Loss on sale or disposal of assets | 546 | 103 | — | 649 | — | 649 | |||||||||||||||||
Restructuring | 91 | 215 | (2 | ) | 304 | (86 | ) | 218 | |||||||||||||||
Interest expense | 39 | 38 | — | 77 | 3,874 | 3,951 | |||||||||||||||||
Interest income | — | — | — | — | (7 | ) | (7 | ) | |||||||||||||||
Equity in net income of unconsolidated affiliate | — | — | (1,877 | ) | (1,877 | ) | — | (1,877 | ) | ||||||||||||||
Other expense (income) | — | (79 | ) | 6 | (73 | ) | 286 | 213 | |||||||||||||||
Segment contribution | $ | 29,675 | $ | 2,071 | $ | 1,420 | $ | 33,166 | |||||||||||||||
Income from continuing operations before income taxes | $ | 33,166 | $ | (22,432 | ) | $ | 10,734 | ||||||||||||||||
19
Six Months Ended March 31, 2017 | |||||||||||||||||||||||
U.S. Pawn | Mexico Pawn | Other International | Total Segments | Corporate Items | Consolidated | ||||||||||||||||||
(in thousands) | |||||||||||||||||||||||
Revenues: | |||||||||||||||||||||||
Merchandise sales | $ | 190,411 | $ | 31,340 | $ | — | $ | 221,751 | $ | — | $ | 221,751 | |||||||||||
Jewelry scrapping sales | 17,901 | 2,116 | — | 20,017 | — | 20,017 | |||||||||||||||||
Pawn service charges | 120,706 | 15,399 | — | 136,105 | — | 136,105 | |||||||||||||||||
Other revenues | 107 | 278 | 3,994 | 4,379 | — | 4,379 | |||||||||||||||||
Total revenues | 329,125 | 49,133 | 3,994 | 382,252 | — | 382,252 | |||||||||||||||||
Merchandise cost of goods sold | 120,747 | 21,478 | — | 142,225 | — | 142,225 | |||||||||||||||||
Jewelry scrapping cost of goods sold | 15,440 | 1,745 | — | 17,185 | — | 17,185 | |||||||||||||||||
Other cost of revenues | — | — | 980 | 980 | — | 980 | |||||||||||||||||
Net revenues | 192,938 | 25,910 | 3,014 | 221,862 | — | 221,862 | |||||||||||||||||
Segment and corporate expenses (income): | |||||||||||||||||||||||
Operations | 130,906 | 17,541 | 3,659 | 152,106 | — | 152,106 | |||||||||||||||||
Administrative | — | — | — | — | 27,210 | 27,210 | |||||||||||||||||
Depreciation and amortization | 5,277 | 1,291 | 100 | 6,668 | 5,735 | 12,403 | |||||||||||||||||
(Gain) loss on sale or disposal of assets | (74 | ) | 68 | — | (6 | ) | — | (6 | ) | ||||||||||||||
Interest expense | — | 5 | — | 5 | 11,188 | 11,193 | |||||||||||||||||
Interest income | — | (409 | ) | — | (409 | ) | (4,447 | ) | (4,856 | ) | |||||||||||||
Equity in net income of unconsolidated affiliate | — | — | (2,721 | ) | (2,721 | ) | — | (2,721 | ) | ||||||||||||||
Other (income) expense | (9 | ) | (37 | ) | 40 | (6 | ) | (189 | ) | (195 | ) | ||||||||||||
Segment contribution | $ | 56,838 | $ | 7,451 | $ | 1,936 | $ | 66,225 | |||||||||||||||
Income from continuing operations before income taxes | $ | 66,225 | $ | (39,497 | ) | $ | 26,728 | ||||||||||||||||
20
Six Months Ended March 31, 2016 | |||||||||||||||||||||||
U.S. Pawn | Mexico Pawn | Other International | Total Segments | Corporate Items | Consolidated | ||||||||||||||||||
(in thousands) | |||||||||||||||||||||||
Revenues: | |||||||||||||||||||||||
Merchandise sales | $ | 186,734 | $ | 31,189 | $ | 4 | $ | 217,927 | $ | — | $ | 217,927 | |||||||||||
Jewelry scrapping sales | 21,199 | 1,181 | 21 | 22,401 | — | 22,401 | |||||||||||||||||
Pawn service charges | 115,235 | 15,489 | — | 130,724 | — | 130,724 | |||||||||||||||||
Other revenues | 242 | 74 | 4,401 | 4,717 | — | 4,717 | |||||||||||||||||
Total revenues | 323,410 | 47,933 | 4,426 | 375,769 | — | 375,769 | |||||||||||||||||
Merchandise cost of goods sold | 113,702 | 20,888 | 1 | 134,591 | — | 134,591 | |||||||||||||||||
Jewelry scrapping cost of goods sold | 18,188 | 957 | 16 | 19,161 | — | 19,161 | |||||||||||||||||
Other cost of revenues | — | — | 1,043 | 1,043 | — | 1,043 | |||||||||||||||||
Net revenues | 191,520 | 26,088 | 3,366 | 220,974 | — | 220,974 | |||||||||||||||||
Segment and corporate expenses (income): | |||||||||||||||||||||||
Operations | 124,785 | 20,217 | 3,272 | 148,274 | — | 148,274 | |||||||||||||||||
Administrative | — | — | — | — | 35,604 | 35,604 | |||||||||||||||||
Depreciation and amortization | 6,602 | 1,565 | 107 | 8,274 | 5,874 | 14,148 | |||||||||||||||||
Loss on sale or disposal of assets | 553 | 129 | — | 682 | — | 682 | |||||||||||||||||
Restructuring | 982 | 543 | 202 | 1,727 | 183 | 1,910 | |||||||||||||||||
Interest expense | 125 | 78 | — | 203 | 7,875 | 8,078 | |||||||||||||||||
Interest income | (1 | ) | — | — | (1 | ) | (15 | ) | (16 | ) | |||||||||||||
Equity in net income of unconsolidated affiliate | — | — | (3,932 | ) | (3,932 | ) | — | (3,932 | ) | ||||||||||||||
Other expense | — | 49 | 3 | 52 | 263 | 315 | |||||||||||||||||
Segment contribution | $ | 58,474 | $ | 3,507 | $ | 3,714 | $ | 65,695 | |||||||||||||||
Income from continuing operations before income taxes | $ | 65,695 | $ | (49,784 | ) | $ | 15,911 | ||||||||||||||||
21
NOTE 9: SUPPLEMENTAL CONSOLIDATED FINANCIAL INFORMATION AND DISCONTINUED OPERATIONS
Supplemental Consolidated Financial Information
The following table provides supplemental information on net amounts included in our condensed consolidated balance sheets, with additional comparative information as of March 31, 2016:
March 31, 2017 | March 31, 2016 | September 30, 2016 | |||||||||
(in thousands) | |||||||||||
Pawn loans | $ | 143,267 | $ | 140,195 | $ | 167,329 | |||||
Gross pawn service charges receivable | $ | 35,177 | $ | 35,239 | $ | 41,458 | |||||
Allowance for uncollectible pawn service charges receivable | (8,149 | ) | (7,613 | ) | (10,396 | ) | |||||
Pawn service charges receivable, net | $ | 27,028 | $ | 27,626 | $ | 31,062 | |||||
Gross inventory | $ | 143,237 | $ | 132,334 | $ | 146,367 | |||||
Inventory reserves | (6,229 | ) | (5,888 | ) | (6,143 | ) | |||||
Inventory, net | $ | 137,008 | $ | 126,446 | $ | 140,224 | |||||
Property and equipment, gross | $ | 212,460 | $ | 208,694 | $ | 210,309 | |||||
Accumulated depreciation | (158,830 | ) | (145,119 | ) | (151,854 | ) | |||||
Property and equipment, net | $ | 53,630 | $ | 63,575 | $ | 58,455 | |||||
Discontinued Operations
In September 2016 we completed the previously announced sale of all of our interests in Grupo Finmart to AlphaCredit. The information presented below includes the assets, liabilities, revenues and expenses of variable interest entities which were deconsolidated as a result of the sale of Grupo Finmart.
The following table presents the reconciliation of the major line items constituting "Loss from discontinued operations, net of tax" of Grupo Finmart and other operations discontinued prior to the adoption of ASU 2014-08 that are presented in the condensed consolidated statements of operations:
Three Months Ended March 31, 2016 | Six Months Ended March 31, 2016 | ||||||
(in thousands) | |||||||
Revenues | $ | 13,687 | $ | 24,584 | |||
Consumer loan bad debt | (8,252 | ) | (20,243 | ) | |||
Operations expense | (81,270 | ) | (90,858 | ) | |||
Interest expense, net | (4,378 | ) | (9,312 | ) | |||
Depreciation, amortization and other expenses | (352 | ) | (1,637 | ) | |||
Loss from discontinued operations before income taxes of Grupo Finmart | (80,565 | ) | (97,466 | ) | |||
Income tax benefit | 3,409 | 8,863 | |||||
Loss from discontinued operations, net of tax of operations discontinued prior to the adoption of ASU 2014-08* | (1,094 | ) | (1,332 | ) | |||
Loss from discontinued operations, net of tax | $ | (78,250 | ) | $ | (89,935 | ) | |
Loss from discontinued operations, net of tax of Grupo Finmart | $ | (77,156 | ) | $ | (88,603 | ) | |
Loss from discontinued operations, net of tax of Grupo Finmart attributable to noncontrolling interest | 4,808 | 5,600 | |||||
Loss from discontinued operations, net of tax of Grupo Finmart attributable to EZCORP, Inc. | $ | (72,348 | ) | $ | (83,003 | ) | |
* | Includes revenues of $2.1 million for the three and six months ended March 31, 2016. |
Cash flows from Grupo Finmart operating and investing activities for the three months ended March 31, 2016 were $0.6 million and $5.9 million, respectively, and $7.1 million and $0.2 million, respectively for the six months ended March 31,
22
2016, with immaterial cash flows from Grupo Finmart operating and investing activities for the three and six months ended March 31, 2017.
ITEM 2. MANAGEMENT'S DISCUSSION AND ANALYSIS OF FINANCIAL CONDITION AND RESULTS OPERATIONS
The discussion in this section contains forward-looking statements that are based on our current expectations. Actual results could differ materially from those expressed or implied by the forward-looking statements due to a number of risks, uncertainties and other factors, including those identified in "Part I, Item 1A — Risk Factors" of our Annual Report on Form 10-K for the year ended September 30, 2016, as supplemented by the information set forth in “Part I, Item 3 — Quantitative and Qualitative Disclosures about Market Risk” and "Part II, Item 1 — Legal Proceedings" of this Quarterly Report.
Overview and Financial Highlights
EZCORP is a Delaware corporation headquartered in Austin, Texas. We are a leading provider of pawn loans in the United States and Mexico.
Our vision is to be the market leader in North America in responsibly and respectfully meeting our customers' desire for access to cash when they want it. That vision is supported by four key imperatives:
• | Market Leading Customer Satisfaction; |
• | Exceptional Staff Engagement; |
• | Attractive Shareholder Returns; and |
• | Most Efficient Provider of Cash. |
At our pawn stores, we offer pawn loans, which are non-recourse loans collateralized by tangible personal property, and sell merchandise to customers looking for good value. The merchandise we sell consists of second-hand collateral forfeited from our pawn lending activities or purchased from customers.
The following charts present sources of net revenues including merchandise sales and jewelry scrapping gross profit ("GP") and pawn service charges ("PSC"):

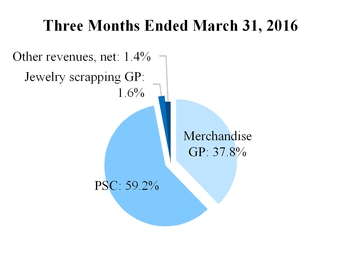
23
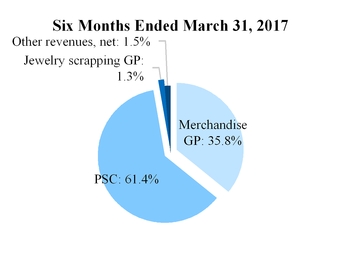
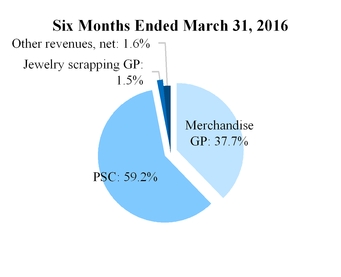
Pawn Activities
At our pawn stores, we offer secured loans, which are typically small, non-recourse loans collateralized by tangible personal property. We earn pawn service charge revenue on our pawn loans, which varies by state and loan size. Collateral for our pawn loans consists of tangible personal property, generally jewelry, consumer electronics, tools, sporting goods and musical instruments. Security for our pawn loans is provided via the estimated resale value of the collateral and the perceived probability of the loan’s redemption.
Our ability to offer quality second-hand goods at prices significantly lower than original retail prices attracts value-conscious customers. The gross profit on sales of inventory depends primarily on our assessment of the loan or purchase value at the time the property is either accepted as loan collateral or purchased. As a significant portion of our inventory and sales in the U.S. involve gold and jewelry, our results can be heavily influenced by the market price of gold.
Growth and Expansion
We plan to expand the number of locations we operate through opening new (“de novo”) locations and through acquisitions. We believe there are growth opportunities with de novo stores in Mexico and pawn store acquisitions in both Mexico and in the U.S. Our ability to add new stores is dependent on several variables, such as the availability of acceptable sites or acquisition candidates, the regulatory environment, local zoning ordinances, access to capital, availability of qualified personnel and the attainment of internal return on investment hurdles.
Seasonality and Quarterly Results
Historically, pawn service charges are highest in our fourth fiscal quarter (July through September) due to a higher average loan balance during the summer lending season in our third fiscal quarter, with balances peaking in our fourth and first fiscal quarters. Loan balances are generally lower in our second fiscal quarter. Merchandise sales are highest in the first and second fiscal quarters (October through March) due to the holiday season, jewelry sales surrounding Valentine’s Day and the availability of tax refunds in the United States.
Store Data by Segment
Three Months Ended March 31, 2017 | |||||||||||
Company-owned Stores | |||||||||||
U.S. Pawn | Mexico Pawn | Other International | Consolidated | ||||||||
As of December 31, 2016 | 517 | 239 | 27 | 783 | |||||||
New locations opened | — | 2 | — | 2 | |||||||
Locations sold, combined or closed | — | (1 | ) | — | (1 | ) | |||||
As of March 31, 2017 | 517 | 240 | 27 | 784 | |||||||
24
Three Months Ended March 31, 2016 | ||||||||||||||
Company-owned Stores | ||||||||||||||
U.S. Pawn | Mexico Pawn | Other International | Consolidated | Franchises | ||||||||||
As of December 31, 2015 | 516 | 237 | * | 27 | 780 | 1 | ||||||||
New locations opened | 6 | — | — | 6 | — | |||||||||
Locations sold, combined or closed | — | — | — | — | (1 | ) | ||||||||
As of March 31, 2016 | 522 | 237 | 27 | 786 | — | |||||||||
* Includes five buy/sell stores which were converted to Mexico Pawn stores during the three months ended March 31, 2016.
Six Months Ended March 31, 2017 | |||||||||||
Company-owned Stores | |||||||||||
U.S. Pawn | Mexico Pawn | Other International | Consolidated | ||||||||
As of September 30, 2016 | 520 | 239 | 27 | 786 | |||||||
New locations opened | — | 2 | — | 2 | |||||||
Locations sold, combined or closed | (3 | ) | (1 | ) | — | (4 | ) | ||||
As of March 31, 2017 | 517 | 240 | 27 | 784 | |||||||
Six Months Ended March 31, 2016 | ||||||||||||||
Company-owned Stores | ||||||||||||||
U.S. Pawn | Mexico Pawn | Other International | Consolidated | Franchises | ||||||||||
As of September 30, 2015 | 522 | 237 | * | 27 | 786 | 1 | ||||||||
New locations opened | 6 | 1 | — | 7 | — | |||||||||
Locations sold, combined or closed | (6 | ) | (1 | ) | — | (7 | ) | (1 | ) | |||||
As of March 31, 2016 | 522 | 237 | 27 | 786 | — | |||||||||
* | Includes five buy/sell stores which were converted to Mexico Pawn stores during the three months ended March 31, 2016. |
25
Results of Operations
Three Months Ended March 31, 2017 vs. Three Months Ended March 31, 2016
These tables, as well as the discussion that follows, should be read with the accompanying condensed consolidated financial statements and related notes. All comparisons, unless otherwise noted, are to the prior-year quarter.
U.S. Pawn
The following table presents selected summary financial data from continuing operations for the U.S. Pawn segment:
Three Months Ended March 31, | Change | ||||||||
2017 | 2016 | ||||||||
(in thousands) | |||||||||
Net revenues: | |||||||||
Pawn service charges | $ | 59,661 | $ | 56,614 | 5% | ||||
Merchandise sales | 95,550 | 94,740 | 1% | ||||||
Merchandise sales gross profit | 35,051 | 36,499 | (4)% | ||||||
Gross margin on merchandise sales | 37 | % | 39 | % | (200)bps | ||||
Jewelry scrapping sales | 9,056 | 11,599 | (22)% | ||||||
Jewelry scrapping sales gross profit | 1,166 | 1,471 | (21)% | ||||||
Gross margin on jewelry scrapping sales | 13 | % | 13 | % | — | ||||
Other revenues | 56 | 49 | 14% | ||||||
Net revenues | 95,934 | 94,633 | 1% | ||||||
Segment operating expenses: | |||||||||
Operations | 63,556 | 61,240 | 4% | ||||||
Depreciation and amortization | 2,660 | 3,042 | (13)% | ||||||
Segment operating contribution | 29,718 | 30,351 | (2)% | ||||||
Other segment (income) expenses | (7 | ) | 676 | * | |||||
Segment contribution | $ | 29,725 | $ | 29,675 | —% | ||||
Other data: | |||||||||
Net earning assets — continuing operations (a) | $ | 245,323 | $ | 231,956 | 6% | ||||
Inventory turnover — general merchandise (b) | 2.7 | 2.8 | (4)% | ||||||
Inventory turnover — jewelry (b) | 1.2 | 1.2 | —% | ||||||
Average monthly ending pawn loan balance per store (c) | $ | 264 | $ | 254 | 4% | ||||
Monthly average yield on pawn loans outstanding | 14 | % | 14 | % | — | ||||
Pawn loan redemption rate (d) | 85 | % | 85 | % | — | ||||
* | Represents an increase or decrease in excess of 100% or not meaningful. |
(a) | Balance includes pawn loans and inventory. |
(b) | Calculation of inventory turnover excludes the effects of scrapping. |
(c) | Balance is calculated based upon the average of the monthly ending balance averages during the applicable period. |
(d) | Our pawn loan redemption rate represents the percentage of loans made that are repaid, renewed or extended at a point in time as opposed to the life of the loan. |
26
Net revenue increased $1.3 million, or 1%. The increase in net revenue attributable to same stores and new stores added since the prior-year quarter is summarized as follows:
Change in Net Revenue | |||||||||||
Pawn Service Charges | Merchandise Sales Gross Profit | Total | |||||||||
(in millions) | |||||||||||
Same stores | $ | 3.0 | $ | (1.3 | ) | $ | 1.7 | ||||
New stores and other | — | (0.1 | ) | (0.1 | ) | ||||||
Total | $ | 3.0 | $ | (1.4 | ) | $ | 1.6 | ||||
Change in jewelery scrapping sales gross profit and other revenues | (0.3 | ) | |||||||||
Total change in net revenue | $ | 1.3 | |||||||||
Pawn service charges increased 5% primarily due to an increase in average pawn loan balances outstanding during the quarter, driven by continued intense focus on market leadership in meeting our customers' desire for cash.
Merchandise sales increased 1% with gross margin on merchandise sales of 37%, consistent with recent prior quarters and within our target range of 35-38%, but 200bps lower than the prior-year quarter. As a result, merchandise sales gross profit decreased 4% to $35.1 million.
Jewelry scrapping sales gross profit remained relatively flat at 1% of current quarter net revenues, in-line with our strategy to sell rather than scrap merchandise. Jewelry scrapping margins were stable.
We maintained a consistent level of total segment expenses at 40% of revenues.
Non-GAAP Financial Information
In addition to the financial information prepared in conformity with generally accepted accounting principles in the United States of America ("GAAP"), we provide certain other non-GAAP financial information on a constant currency basis ("constant currency"). We use constant currency and ongoing segment contribution results to evaluate results of our Mexico Pawn operations, which are denominated in Mexican pesos, and believe that presentation of constant currency results are meaningful and useful in understanding the activities and business metrics of our Mexico Pawn operations and reflect an additional way of viewing aspects of our business that, when viewed with GAAP results, provide a more complete understanding of factors and trends affecting our business. We provide non-GAAP financial information for informational purposes and to enhance understanding of our GAAP consolidated financial statements. We use this non-GAAP financial information to evaluate and compare operating results across accounting periods. Readers should consider the information in addition to, but not instead of or superior to, our financial statements prepared in accordance with GAAP. This non-GAAP financial information may be determined or calculated differently by other companies, limiting the usefulness of those measures for comparative purposes.
Constant currency results reported herein are calculated by translating consolidated balance sheet and consolidated statement of operations items denominated in Mexican pesos to U.S. dollars using the exchange rate from the prior-year comparable period, as opposed to the current period, in order to exclude the effects of foreign currency rate fluctuations. We used the end-of-period rate for balance sheet items and the average closing daily exchange rate on a monthly basis during the appropriate period for statement of operations items. The end-of-period exchange rate as of March 31, 2017 and 2016 was 18.7 to 1 and 17.3 to 1, respectively. The approximate average exchange rate for the three months ended March 31, 2017 and 2016 was 20.4 to 1 and 18.0 to 1. The approximate average exchange rate for the six months ended March 31, 2017 and 2016 was 20.1 to 1 and 17.4 to 1, respectively, however our statement of operations constant currency results reflect the impact of monthly effects of exchange rates and so are not directly calculable from the above rates. Constant currency results, where presented, also exclude the foreign currency gain or loss and the related foreign currency derivative gain or loss impact. We have experienced a prolonged weakening of the Mexican peso to the U.S. dollar and may continue to experience further weakening in future reporting periods, which may adversely impact our future operating results when stated on a GAAP basis.
27
Mexico Pawn
The following table presents selected summary financial data from continuing operations for the Mexico Pawn segment, including constant currency results, after translation to U.S. dollars from its functional currency of the Mexican peso. See “Results of Operations — Non-GAAP Financial Information” above.
Three Months Ended March 31, | |||||||||||||||
2017 (GAAP) | 2016 (GAAP) | Change (GAAP) | 2017 (Constant Currency) | Change (Constant Currency) | |||||||||||
(in USD thousands) | (in USD thousands) | ||||||||||||||
Net revenues: | |||||||||||||||
Pawn service charges | $ | 7,431 | $ | 7,516 | (1)% | $ | 8,377 | 11% | |||||||
Merchandise sales | 14,688 | 14,603 | 1% | 16,612 | 14% | ||||||||||
Merchandise sales gross profit | 4,694 | 4,513 | 4% | 5,299 | 17% | ||||||||||
Gross margin on merchandise sales | 32 | % | 31 | % | 100bps | 32 | % | 100bps | |||||||
Jewelry scrapping sales | 1,163 | 1,181 | (2)% | 1,300 | 10% | ||||||||||
Jewelry scrapping sales gross profit | 212 | 224 | (5)% | 236 | 5% | ||||||||||
Gross margin on jewelry scrapping sales | 18 | % | 19 | % | (100)bps | 18 | % | (100)bps | |||||||
Other revenues | 147 | (117 | ) | * | 169 | * | |||||||||
Net revenues | 12,484 | 12,136 | 3% | 14,081 | 16% | ||||||||||
Segment operating expenses: | |||||||||||||||
Operations | 8,901 | 9,024 | (1)% | 10,076 | 12% | ||||||||||
Depreciation and amortization | 660 | 764 | (14)% | 748 | (2)% | ||||||||||
Segment operating contribution | 2,923 | 2,348 | 24% | 3,257 | 39% | ||||||||||
Other segment (income) expenses (a) | (313 | ) | 277 | * | (292 | ) | * | ||||||||
Segment contribution | $ | 3,236 | $ | 2,071 | 56% | $ | 3,549 | 71% | |||||||
Other data: | |||||||||||||||
Net earning assets — continuing operations (b) | $ | 34,926 | $ | 34,655 | 1% | $ | 37,876 | 9% | |||||||
Inventory turnover (c) | 2.6 | 2.7 | (4)% | 2.6 | (4)% | ||||||||||
Average monthly ending pawn loan balance per store (d) | $ | 67 | $ | 66 | 2% | $ | 74 | 12% | |||||||
Monthly average yield on pawn loans outstanding | 16 | % | 16 | % | — | 16 | % | — | |||||||
Pawn loan redemption rate (e) | 79 | % | 78 | % | 100bps | 79 | % | 100bps | |||||||
* | Represents an increase or decrease in excess of 100% or not meaningful. |
(a) | The three months ended March 31, 2017 constant currency balance excludes nominal net foreign currency transaction gains resulting from movement in exchange rates. The three months ended March 31, 2016 includes net foreign currency transaction gains totaling $0.1 million that are not excluded from the above results. |
(b) | Balance includes pawn loans and inventory. |
(c) | Calculation of inventory turnover excludes the effects of scrapping. |
(d) | Balance is calculated based upon the average of the monthly ending balance averages during the applicable period. |
(e) | Our pawn loan redemption rate represents the percentage of loans made that are repaid, renewed or extended at a point in time as opposed to the life of the loan. |
28
The Mexico market continues to be fast-growing and we have plans to open an additional eight de novo stores during the remainder of fiscal 2017. Net revenue increased $0.3 million, or 3% (up $1.9 million, or 16%, on a constant currency basis). The increase in net revenue attributable to same stores and new stores added since the prior-year quarter is summarized as follows:
Change in Net Revenue | |||||||||||
Pawn Service Charges | Merchandise Sales Gross Profit | Total | |||||||||
(in millions) | |||||||||||
Same stores | $ | (0.2 | ) | $ | — | $ | (0.2 | ) | |||
New stores and other | 0.1 | 0.2 | 0.3 | ||||||||
Total | $ | (0.1 | ) | $ | 0.2 | $ | 0.1 | ||||
Change in jewelery scrapping sales gross profit and other revenues | 0.2 | ||||||||||
Total change in net revenue | $ | 0.3 | |||||||||
Change in Net Revenue (Constant Currency) | |||||||||||
Pawn Service Charges | Merchandise Sales Gross Profit | Total | |||||||||
(in millions) | |||||||||||
Same stores | $ | 0.7 | $ | 0.6 | $ | 1.3 | |||||
New stores and other | 0.2 | 0.2 | 0.4 | ||||||||
Total | $ | 0.9 | $ | 0.8 | $ | 1.7 | |||||
Change in jewelery scrapping sales gross profit and other revenues | 0.3 | ||||||||||
Total change in net revenue | $ | 2.0 | |||||||||
Pawn service charges were down 1% (up 11% on a constant currency basis) primarily as a result of same store growth, offset by foreign currency impacts. We experienced an increase in average pawn loan balances outstanding during the quarter, driven by continued intense focus on market leadership in meeting our customers' desire for cash, offset by foreign currency impacts.
Merchandise sales increased 1% (up 14% on a constant currency basis), with gross margin on merchandise sales of 32%, consistent with recent prior quarters, and 100bps higher than the prior-year quarter. Merchandise sales gross profit increased 4% to $4.7 million (up 17% to $5.3 million on a constant currency basis).
Segment operating expenses decreased to $9.2 million, or 39% of revenues ($10.5 million on a constant currency basis, or 40% of revenues), from $10.1 million or 43% of revenues, primarily due to $0.3 million in interest income on a GAAP basis recorded during the current quarter on outstanding notes receivable. Additionally, we incurred approximately $0.5 million in losses, net of insurance recoveries, on a GAAP basis associated with looting of 12 stores during the current quarter as well as nominal increased security costs (approximately $0.1 million increase on a constant currency basis).
29
Other International
The following table presents selected financial data from continuing operations for the Other International segment after translation to U.S. dollars from its reporting units' functional currency of primarily Canadian and Australian dollars:
Three Months Ended March 31, | Percentage Change | ||||||||
2017 | 2016 | ||||||||
(in thousands) | |||||||||
Net revenues: | |||||||||
Consumer loan fees and interest | $ | 1,876 | $ | 2,027 | (7)% | ||||
Consumer loan bad debt | (397 | ) | (431 | ) | (8)% | ||||
Other revenues, net | — | (1 | ) | (100)% | |||||
Net revenues | 1,479 | 1,595 | (7)% | ||||||
Segment operating expenses (income): | |||||||||
Operating expenses | 2,053 | 2,048 | —% | ||||||
Equity in net income of unconsolidated affiliate | (1,243 | ) | (1,877 | ) | (34)% | ||||
Segment operating contribution | 669 | 1,424 | (53)% | ||||||
Other segment expenses | 41 | 4 | * | ||||||
Segment contribution | $ | 628 | $ | 1,420 | (56)% | ||||
* | Represents an increase or decrease in excess of 100% or not meaningful. |
Segment contribution decreased $0.8 million, or 56%, primarily due to a decrease in earnings from Cash Converters International.
The fair value of our investment in Cash Converters International was $1.2 million below its carrying value as of March 31, 2017 and such fair value has continued to decline through the date of this filing. We have taken impairment charges on such investment in prior periods and continue to monitor the fair value of our investment for other-than-temporary impairments in future reporting periods. We may record an impairment charge should the fair value of our investment remain below its carrying value for an extended period of time.
30
Other Items
The following table reconciles our consolidated segment contribution discussed above to net income (loss) attributable to EZCORP, Inc., including items that affect our consolidated financial results but are not allocated among segments:
Three Months Ended March 31, | Percentage Change | ||||||||
2017 | 2016 | ||||||||
(in thousands) | |||||||||
Segment contribution | $ | 33,589 | $ | 33,166 | 1% | ||||
Corporate expenses (income): | |||||||||
Administrative | 13,283 | 15,621 | (15)% | ||||||
Depreciation and amortization | 2,660 | 2,744 | (3)% | ||||||
Restructuring | — | (86 | ) | (100)% | |||||
Interest expense | 5,625 | 3,874 | 45% | ||||||
Interest income | (1,898 | ) | (7 | ) | * | ||||
Other expense | 239 | 286 | * | ||||||
Income from continuing operations before income taxes | 13,680 | 10,734 | 27% | ||||||
Income tax expense | 5,449 | 8,427 | (35)% | ||||||
Income from continuing operations, net of tax | 8,231 | 2,307 | * | ||||||
Loss from discontinued operations, net of tax | (375 | ) | (78,250 | ) | (100)% | ||||
Net income (loss) | 7,856 | (75,943 | ) | * | |||||
Net loss attributable to noncontrolling interest | (167 | ) | (5,131 | ) | (97)% | ||||
Net income (loss) attributable to EZCORP, Inc. | $ | 8,023 | $ | (70,812 | ) | * | |||
* | Represents an increase or decrease in excess of 100% or not meaningful. |
Administrative expenses decreased $2.3 million, or 15%, due primarily to:
• | A $2.1 million decrease in business and professional fees due to completion of remediation efforts in the prior year; and |
• | A $0.4 million reduction in labors costs including the impact of corporate headcount reductions. |
Interest expense increased $1.8 million, or 45%, as a result of our Term Loan Facility obtained in September 2016, including accruals of interest in addition to amortization of associated discounts and deferred financings costs. Interest income increased $1.9 million as a result of our notes receivable from the sale of Grupo Finmart, including ordinary accruals of interest in addition to accretion of associated discounts.
Income tax expense decreased $3.0 million, from $8.4 million in the prior-year quarter to $5.4 million in the current quarter, due to discrete tax expense of $3.7 million recorded in the prior-year quarter related to a change in estimate of our fiscal 2015 tax provision, offset by the impacts of a $2.9 million increase in income from continuing operations before income taxes. Income tax expense includes other items that do not necessarily correspond to pre-tax earnings and create volatility in our effective tax rate, of which no items were material during the current quarter.
We have substantially eliminated activities associated with our discontinued operations.
31
Six Months Ended March 31, 2017 vs. Six Months Ended March 31, 2016
U.S. Pawn
The following table presents selected summary financial data from continuing operations for the U.S. Pawn segment:
Six Months Ended March 31, | Change | ||||||||
2017 | 2016 | ||||||||
(in thousands) | |||||||||
Net revenues: | |||||||||
Pawn service charges | $ | 120,706 | $ | 115,235 | 5% | ||||
Merchandise sales | 190,411 | 186,734 | 2% | ||||||
Merchandise sales gross profit | 69,664 | 73,032 | (5)% | ||||||
Gross margin on merchandise sales | 37 | % | 39 | % | (200)bps | ||||
Jewelry scrapping sales | 17,901 | 21,199 | (16)% | ||||||
Jewelry scrapping sales gross profit | 2,461 | 3,011 | (18)% | ||||||
Gross margin on jewelry scrapping sales | 14 | % | 14 | % | — | ||||
Other revenues | 107 | 242 | (56)% | ||||||
Net revenues | 192,938 | 191,520 | 1% | ||||||
Segment operating expenses: | |||||||||
Operations | 130,906 | 124,785 | 5% | ||||||
Depreciation and amortization | 5,277 | 6,602 | (20)% | ||||||
Segment operating contribution | 56,755 | 60,133 | (6)% | ||||||
Other segment (income) expenses | (83 | ) | 1,659 | * | |||||
Segment contribution | $ | 56,838 | $ | 58,474 | (3)% | ||||
Other data: | |||||||||
Average monthly ending pawn loan balance per store (a) | $ | 275 | $ | 265 | 4% | ||||
Monthly average yield on pawn loans outstanding | 14 | % | 14 | % | — | ||||
Pawn loan redemption rate (b) | 84 | % | 84 | % | — | ||||
* | Represents an increase or decrease in excess of 100% or not meaningful. |
(a) | Balance is calculated based upon the average of the monthly ending balance averages during the applicable period. |
(b) | Our pawn loan redemption rate represents the percentage of loans made that are repaid, renewed or extended at a point in time as opposed to the life of the loan. |
32
Net revenue increased $1.4 million, or 1%. The increase in net revenue attributable to same stores and new stores added since the prior-year six-months is summarized as follows:
Change in Net Revenue | |||||||||||
Pawn Service Charges | Merchandise Sales Gross Profit | Total | |||||||||
(in millions) | |||||||||||
Same stores | $ | 4.8 | $ | (3.4 | ) | $ | 1.4 | ||||
New stores and other | 0.7 | — | 0.7 | ||||||||
Total | $ | 5.5 | $ | (3.4 | ) | $ | 2.1 | ||||
Change in jewelery scrapping sales gross profit and other revenues | (0.7 | ) | |||||||||
Total change in net revenue | $ | 1.4 | |||||||||
Pawn service charges increased 5% primarily due to an increase in average pawn loan balances outstanding during the current six-months, driven by continued intense focus on market leadership in meeting our customers' desire for cash.
Merchandise sales increased 2% with gross margin on merchandise sales of 37%, consistent with recent prior periods and within our target range of 35-38%, but 200bps lower than the prior-year six-months. As a result, merchandise sales gross profit decreased 5% to $69.7 million.
Jewelry scrapping sales gross profit remained flat at 1% of current six-months net revenues, in-line with our strategy to sell rather than scrap merchandise. Jewelry margins were stable.
We maintained a consistent level of total segment expenses at 41% of revenues.
33
Mexico Pawn
The following table presents selected summary financial data from continuing operations for the Mexico Pawn segment, including constant currency results, after translation to U.S. dollars from its functional currency of the Mexican peso. See “Results of Operations — Non-GAAP Financial Information” above.
Six Months Ended March 31, | |||||||||||||||
2017 (GAAP) | 2016 (GAAP) | Change (GAAP) | 2017 (Constant Currency) | Change (Constant Currency) | |||||||||||
(in USD thousands) | (in USD thousands) | ||||||||||||||
Net revenues: | |||||||||||||||
Pawn service charges | $ | 15,399 | $ | 15,489 | (1)% | $ | 17,804 | 15% | |||||||
Merchandise sales | 31,340 | 31,189 | —% | 36,380 | 17% | ||||||||||
Merchandise sales gross profit | 9,862 | 10,301 | (4)% | 11,433 | 11% | ||||||||||
Gross margin on merchandise sales | 31 | % | 33 | % | (200)bps | 31 | % | (200)bps | |||||||
Jewelry scrapping sales | 2,116 | 1,181 | 79% | 2,428 | * | ||||||||||
Jewelry scrapping sales gross profit | 371 | 224 | 66% | 424 | 89% | ||||||||||
Gross margin on jewelry scrapping sales | 18 | % | 19 | % | (100)bps | 17 | % | (200)bps | |||||||
Other revenues | 278 | 74 | * | 323 | * | ||||||||||
Net revenues | 25,910 | 26,088 | (1)% | 29,984 | 15% | ||||||||||
Segment operating expenses: | |||||||||||||||
Operations | 17,541 | 20,217 | (13)% | 20,299 | —% | ||||||||||
Depreciation and amortization | 1,291 | 1,565 | (18)% | 1,493 | (5)% | ||||||||||
Segment operating contribution | 7,078 | 4,306 | 64% | 8,192 | 90% | ||||||||||
Other segment (income) expenses (a) | (373 | ) | 799 | * | (373 | ) | * | ||||||||
Segment contribution | $ | 7,451 | $ | 3,507 | * | $ | 8,565 | * | |||||||
Other data: | |||||||||||||||
Average monthly ending pawn loan balance per store (b) | $ | 67 | $ | 68 | (1)% | $ | 74 | 9% | |||||||
Monthly average yield on pawn loans outstanding | 16 | % | 16 | % | — | 16 | % | — | |||||||
Pawn loan redemption rate (c) | 79 | % | 78 | % | 100bps | 79 | % | 100bps | |||||||
* | Represents an increase or decrease in excess of 100% or not meaningful. |
(a) | The six months ended March 31, 2017 constant currency balance excludes nominal net foreign currency transaction gains resulting from movement in exchange rates. The six months ended March 31, 2016 includes nominal net foreign currency transaction losses that are not excluded from the above results. |
(b) | Balance is calculated based upon the average of the monthly ending balance averages during the applicable period. |
(c) | Our pawn loan redemption rate represents the percentage of loans made that are repaid, renewed or extended at a point in time as opposed to the life of the loan. |
34
Net revenue decreased $0.2 million, or 1% (up $3.9 million, or 15%, on a constant currency basis). The increase in net revenue attributable to same stores and new stores added since the prior-year six-months is summarized as follows:
Change in Net Revenue | |||||||||||
Pawn Service Charges | Merchandise Sales Gross Profit | Total | |||||||||
(in millions) | |||||||||||
Same stores | $ | (0.3 | ) | $ | (0.4 | ) | $ | (0.7 | ) | ||
New stores and other | 0.2 | — | 0.2 | ||||||||
Total | $ | (0.1 | ) | $ | (0.4 | ) | $ | (0.5 | ) | ||
Change in jewelery scrapping sales gross profit and other revenues | 0.3 | ||||||||||
Total change in net revenue | $ | (0.2 | ) | ||||||||
Change in Net Revenue (Constant Currency) | |||||||||||
Pawn Service Charges | Merchandise Sales Gross Profit | Total | |||||||||
(in millions) | |||||||||||
Same stores | $ | 2.0 | $ | 1.1 | $ | 3.1 | |||||
New stores and other | 0.3 | — | 0.3 | ||||||||
Total | $ | 2.3 | $ | 1.1 | $ | 3.4 | |||||
Change in jewelery scrapping sales gross profit and other revenues | 0.5 | ||||||||||
Total change in net revenue | $ | 3.9 | |||||||||
Pawn service charges were down 1% (up 15% on a constant currency basis) primarily as a result of same store growth, offset by foreign currency impacts. We experienced an increase in average pawn loan balances outstanding during the quarter, driven by continued intense focus on market leadership in meeting our customers' desire for cash, offset by foreign currency impacts.
Merchandise sales were flat (up 17% on a constant currency basis), with gross margin on merchandise sales of 31%, consistent with recent prior quarters, but 200bps lower than the prior-year six-months. As a result of the combination of these effects, offset by foreign currency impacts, merchandise sales gross profit decreased 4% to $9.9 million (up 11% to $11.4 million in constant currency).
Segment operating expenses decreased to $18.5 million, or 38% of revenues ($21.4 million, or 38% of revenues, on a constant currency basis) from $22.6 million (47% of revenues) primarily due to a $2.7 million, or 13%, decrease in operations expense ($0.1 million, or 0%, decrease on a constant currency basis), primarily as a result of foreign currency impacts and $$0.4 million in interest income on a GAAP basis recorded during the current six-months on outstanding notes receivable. Additionally, we incurred approximately $0.5 million in losses, net of insurance recoveries, on a GAAP basis associated with looting of 12 stores during the current quarter as well as nominal increased security costs (approximately $0.1 million increase on a constant currency basis).
35
Other International
The following table presents selected financial data from continuing operations for the Other International segment after translation to U.S. dollars from its reporting units' functional currency of primarily Canadian and Australian dollars:
Six Months Ended March 31, | Percentage Change | ||||||||
2017 | 2016 | ||||||||
(in thousands) | |||||||||
Net revenues: | |||||||||
Consumer loan fees and interest | $ | 3,994 | $ | 4,401 | (9)% | ||||
Consumer loan bad debt | (980 | ) | (1,043 | ) | (6)% | ||||
Other revenues, net | — | 8 | (100)% | ||||||
Net revenues | 3,014 | 3,366 | (10)% | ||||||
Segment operating expenses (income): | |||||||||
Operating expenses | 3,759 | 3,379 | 11% | ||||||
Equity in net income of unconsolidated affiliate | (2,721 | ) | (3,932 | ) | (31)% | ||||
Segment operating contribution | 1,976 | 3,919 | (50)% | ||||||
Other segment expenses | 40 | 205 | (80)% | ||||||
Segment contribution | $ | 1,936 | $ | 3,714 | (48)% | ||||
Segment contribution decreased $1.8 million or 48%, primarily due to a decrease in earnings from Cash Converters International.
The fair value of our investment in Cash Converters International was $1.2 million below its carrying value as of March 31, 2017 and such fair value has continued to decline through the date of this filing. We have taken impairment charges on such investment in prior periods and continue to monitor the fair value of our investment for other-than-temporary impairments in future reporting periods. We may record an impairment charge should the fair value of our investment remain below its carrying value for an extended period of time.
36
Other Items
The following table reconciles our consolidated segment contribution discussed above to net income (loss) attributable to EZCORP, Inc., including items that affect our consolidated financial results but are not allocated among segments:
Six Months Ended March 31, | Percentage Change | ||||||||
2017 | 2016 | ||||||||
(in thousands) | |||||||||
Segment contribution | $ | 66,225 | $ | 65,695 | 1% | ||||
Corporate expenses (income): | |||||||||
Administrative | 27,210 | 35,604 | (24)% | ||||||
Depreciation and amortization | 5,735 | 5,874 | (2)% | ||||||
Restructuring | — | 183 | (100)% | ||||||
Interest expense | 11,188 | 7,875 | 42% | ||||||
Interest income | (4,447 | ) | (15 | ) | * | ||||
Other (income) expense | (189 | ) | 263 | * | |||||
Income from continuing operations before income taxes | 26,728 | 15,911 | 68% | ||||||
Income tax expense | 10,231 | 10,185 | —% | ||||||
Income from continuing operations, net of tax | 16,497 | 5,726 | * | ||||||
Loss from discontinued operations, net of tax | (1,603 | ) | (89,935 | ) | (98)% | ||||
Net income (loss) | 14,894 | (84,209 | ) | * | |||||
Net loss attributable to noncontrolling interest | (294 | ) | (5,923 | ) | (95)% | ||||
Net income (loss) attributable to EZCORP, Inc. | $ | 15,188 | $ | (78,286 | ) | * | |||
* | Represents an increase or decrease in excess of 100% or not meaningful. |
Administrative expenses decreased $8.4 million, or 24%, due primarily to:
• | A $7.1 million decrease in business and professional fees due to completion of remediation efforts in the prior year; and |
• | A $2.6 million reduction in labors costs including the impact of corporate headcount reductions. |
Interest expense increased $3.3 million, or 42%, as a result of our Term Loan Facility obtained in September 2016, including accruals of interest in addition to amortization of associated discounts and deferred financings costs. Interest income increased $4.4 million as a result of our notes receivable from the sale of Grupo Finmart, including ordinary accruals of interest in addition to accretion of associated discounts.
Income tax expense was flat from the prior-year six-months, due to discrete tax expense of $3.7 million recorded in the prior-year six-months related to a change in estimate of our fiscal 2015 tax provision, offset by the impacts of a $10.8 million increase in income from continuing operations before income taxes. Income tax expense includes other items that do not necessarily correspond to pre-tax earnings and create volatility in our effective tax rate, of which no items were material during the current quarter.
We have substantially eliminated activities associated with our discontinued operations except for certain remaining immaterial charges associated primarily with ongoing employee service requirements which have not yet been recorded.
37
Liquidity and Capital Resources
Cash Flows
The table and discussion below presents a summary of the selected sources and uses of our cash:
Six Months Ended March 31, | Percentage Change | ||||||||
2017 | 2016 | ||||||||
(in thousands) | |||||||||
Cash flows from operating activities | $ | 17,965 | $ | 55,739 | (68)% | ||||
Cash flows from investing activities | 36,472 | 14,038 | * | ||||||
Cash flows from financing activities | (767 | ) | (49,945 | ) | 98% | ||||
Effect of exchange rate changes on cash and cash equivalents | 692 | (3,620 | ) | * | |||||
Net increase in cash and cash equivalents | $ | 54,362 | $ | 16,212 | * | ||||
* | Represents an increase or decrease in excess of 100% or not meaningful. |
Change in Cash and Cash Equivalents for the Six Months Ended March 31, 2017 vs. Six Months Ended March 31, 2016
The decrease in cash flows from operating activities year over year was due to a $56.1 million decrease from changes in operating assets and liabilities, offset by an $11.6 million increase in net income exclusive of non-cash items due to improved operational results and a $6.7 million decrease in restructuring payments as we have substantially completed all prior restructuring actions. The decrease from changes in operating assets and liabilities was primarily driven by a $34.2 million tax refund received in March 2016 as a result of the carryback of fiscal 2015 tax net operating losses and $15.6 million paid out during the three months ended December 31, 2016 for accrued fiscal 2016 incentive compensation.
The increase in cash flows from investing activities year over year was due to $15.1 million in principal collections on notes receivable, a $3.7 million net increase in proceeds related to loan activities (net loans repaid and recovery of pawn loan principal through sale of forfeited collateral) and a $6.0 million decrease in acquisition expenditures, offset by a $2.3 million increase in additions to property and equipment.
The increase in cash flows from financing activities year over year was primarily due to the elimination of Grupo Finmart activities and deferred expenditures on previous acquisitions.
The net effect of these and other smaller items was a $54.4 million increase in cash on hand during the six months ended March 31, 2017, resulting in a $120.1 million ending cash balance, $10.9 million of which was not available to fund domestic operations as we intend to permanently reinvest those earnings in our foreign operations.
Contractual Obligations
In "Part II, Item 7 — Management's Discussion and Analysis of Financial Condition and Results of Operations" of our Annual Report on Form 10-K for the year ended September 30, 2016, we reported that we had $592.8 million in total contractual obligations as of September 30, 2016. There have been no material changes to this total obligation during the current six-month period ended March 31, 2017, other than ordinary fulfillment of obligations.
We are responsible for the maintenance, property taxes and insurance at most of our locations. In the fiscal year ended September 30, 2016, these collectively amounted to $21.3 million.
Sources and Uses of Cash
We anticipate that cash flow from operations, cash on hand and available credit facilities will be adequate to fund our contractual obligations, planned store growth, capital expenditures and working capital requirements during fiscal 2017. Our ability to repay our longer-term debt obligations (including the Cash Convertible Notes) will likely require us to refinance those obligations through the issuance of new debt securities or through new credit facilities.
Notes Receivable from Grupo Finmart Divestiture
As of March 31, 2017, we had a total gross outstanding balance on our notes receivable of $75.1 million. We have collected $15.1 million in principal on these notes receivable during the six months ended March 31, 2017 and anticipate an additional principal collection of $30.8 million of these notes receivable during the remainder of fiscal 2017, based on the exchange rate
38
as of March 31, 2017, with the balance to be collected through fiscal 2019. Further, the notes receivable are subject to certain foreign currency impacts as a result of changes in the value of the Mexican dollar relative to the U.S. dollar.
Cash Convertible Notes and Term Loan Facility
For a description of the Cash Convertible Notes, the conversion terms thereof and the hedges and warrants transactions as well as our Term Loan Facility, see Note 5 of Notes to Interim Condensed Consolidated Financial Statements included in "Part I, Item 1 — Financial Statements."
Recently Adopted Accounting Policies and Recently Issued Accounting Pronouncements
See Note 1 of Notes to Interim Condensed Consolidated Financial Statements included in "Part I, Item 1 — Financial Statements."
Cautionary Statement Regarding Risks and Uncertainties that May Affect Future Results
This Quarterly Report on Form 10-Q, including Management’s Discussion and Analysis of Financial Condition and Results of Operations, includes "forward-looking statements" within the meaning of Section 27A of the Securities Act of 1933 and Section 21E of the Securities Exchange Act of 1934. We intend that all forward-looking statements be subject to the safe harbors created by these laws. All statements, other than statements of historical facts, regarding our strategy, future operations, financial position, future revenues, projected costs, prospects, plans and objectives are forward-looking statements. These statements are often, but not always, made with words or phrases like "may," "should," "could," "will," "predict," "anticipate," "believe," "estimate," "expect," "intend," "plan," "projection" and similar expressions. Such statements are only predictions of the outcome and timing of future events based on our current expectations and currently available information and, accordingly, are subject to substantial risks, uncertainties and assumptions. Actual results could differ materially from those expressed in the forward-looking statements due to a number of risks and uncertainties, many of which are beyond our control. In addition, we cannot predict all of the risks and uncertainties that could cause our actual results to differ from those expressed in the forward-looking statements. Accordingly, you should not regard any forward-looking statements as a representation that the expected results will be achieved. Important risk factors that could cause results or events to differ from current expectations are identified and described in "Part I, Item 1A — Risk Factors" of our Annual Report on Form 10-K for the year ended September 30, 2016, supplemented by those described in "Part II, Item 1A — Risk Factors" of this Quarterly Report.
We specifically disclaim any responsibility to publicly update any information contained in a forward-looking statement except as required by law. All forward-looking statements attributable to us are expressly qualified in their entirety by this cautionary statement.
ITEM 3. QUANTITATIVE AND QUALITATIVE DISCLOSURES ABOUT MARKET RISK
Market risks relating to our operations result primarily from changes in interest rates, gold values and foreign currency exchange rates, and are described in detail in "Part II, Item 7A — Quantitative and Qualitative Disclosures about Market Risk" of our Annual Report on Form 10-K for the year ended September 30, 2016. There have been no material changes to our exposure to market risks since September 30, 2016.
ITEM 4. CONTROLS AND PROCEDURES
This report includes the certifications of our Chief Executive Officer and Chief Financial Officer required by Rule 13a-14 of the Securities Exchange Act of 1934 (the "Exchange Act"). See Exhibits 31.1 and 31.2. This Item 4 includes information concerning the controls and control evaluations referred to in those certifications.
Evaluation of Disclosure Controls and Procedures
Disclosure controls and procedures (as defined in Rules 13a-15(e) and 15d-15(e) under the Securities Exchange Act of 1934) are designed to ensure that information required to be disclosed in the reports we file or submit under the Securities Exchange Act is recorded, processed, summarized and reported within the time periods specified in SEC rules and forms and that such information is accumulated and communicated to our management, including our Chief Executive Officer and Chief Financial Officer, to allow timely decisions regarding required disclosures. Under the supervision and with the participation of our Chief Executive Officer and Chief Financial Officer, our management evaluated the effectiveness of the design and operation of our disclosure controls and procedures as of March 31, 2017. Based on that evaluation, our Chief Executive Officer and Chief Financial Officer concluded that our disclosure controls and procedures were effective as of March 31, 2017.
39
Changes in Internal Control over Financial Reporting
There were no changes in our internal control over financial reporting during the quarter ended March 31, 2017 that have materially affected or are reasonably likely to materially affect our internal control over financial reporting.
Inherent Limitations on Internal Controls
Notwithstanding the foregoing, management does not expect that our disclosure controls and procedures or our internal control over financial reporting will prevent or detect all errors and all fraud. A control system, no matter how well designed and operated, can provide only reasonable, not absolute, assurance that the objectives of the control system will be met. Limitations inherent in any control system include the following:
• | Judgments in decision-making can be faulty, and control and process breakdowns can occur because of simple errors or mistakes. |
• | Controls can be circumvented by individuals, acting alone or in collusion with others, or by management override. |
• | The design of any system of controls is based in part on certain assumptions about the likelihood of future events, and there can be no assurance that any design will succeed in achieving its stated goals under all potential future conditions. |
• | Over time, controls may become inadequate because of changes in conditions or deterioration in the degree of compliance with associated policies or procedures. |
• | The design of a control system must reflect the fact that resources are constrained, and the benefits of controls must be considered relative to their costs. |
Because of the inherent limitations in all control systems, no evaluation of controls can provide absolute assurance that all control issues and instances of fraud, if any, have been detected.
PART II — OTHER INFORMATION
ITEM 1. LEGAL PROCEEDINGS
See Note 7 of Notes to Interim Condensed Consolidated Financial Statements included in "Part I, Item 1 — Financial Statements."
ITEM 1A. RISK FACTORS
Important risk factors that could affect our operations and financial performance, or that could cause results or events to differ from current expectations, are described in "Part I, Item 1A — Risk Factors" of our Annual Report on Form 10-K for the year ended September 30, 2016.
40
ITEM 6. EXHIBITS
The following exhibits are filed with, or incorporated by reference into, this report.
Exhibit No. | Description of Exhibit | |
101.INS††† | XBRL Instance Document | |
101.SCH††† | XBRL Taxonomy Extension Schema Document | |
101.CAL††† | XBRL Taxonomy Extension Calculation Linkbase Document | |
101.LAB††† | XBRL Taxonomy Label Linkbase Document | |
101.DEF††† | XBRL Taxonomy Extension Definition Linkbase Document | |
101.PRE††† | XBRL Taxonomy Extension Presentation Linkbase Document | |
† | Filed herewith. |
†† | Furnished herewith. |
††† | Filed herewith as Exhibit 101 to this report are the following formatted in XBRL (Extensible Business Reporting Language): (i) Condensed Consolidated Balance Sheets as of March 31, 2017 and September 30, 2016; (ii) Condensed Consolidated Statements of Operations for the three and six months ended March 31, 2017 and March 31, 2016; (iii) Condensed Consolidated Statements of Comprehensive Income (Loss) for the three and six months ended March 31, 2017 and March 31, 2016; (iv) Condensed Consolidated Statement of Stockholders' Equity for the six months ended March 31, 2017; (v) Condensed Consolidated Statements of Cash Flows for the six months ended March 31, 2017 and March 31, 2016; and (vi) Notes to Interim Condensed Consolidated Financial Statements. |
41
SIGNATURES
Pursuant to the requirements of the Securities Exchange Act of 1934, the registrant has duly caused this report to be signed on its behalf by the undersigned thereunto duly authorized.
EZCORP, INC. | |||
Date: | May 3, 2017 | /s/ David McGuire | |
David McGuire, Deputy Chief Financial Officer and Chief Accounting Officer (principal accounting officer) | |||
42