Attached files
| file | filename |
|---|---|
| EX-32.2 - EXHIBIT 32.2 - Tennessee Valley Authority | tve-033117xex3222ndquarter.htm |
| EX-32.1 - EXHIBIT 32.1 - Tennessee Valley Authority | tve-033117xex3212ndquarter.htm |
| EX-31.2 - EXHIBIT 31.2 - Tennessee Valley Authority | tve-033117xex3122ndquarter.htm |
| EX-31.1 - EXHIBIT 31.1 - Tennessee Valley Authority | tve-033117xex3112ndquarter.htm |
UNITED STATES
SECURITIES AND EXCHANGE COMMISSION
Washington, D.C. 20549
FORM 10-Q
(MARK ONE)
x QUARTERLY REPORT PURSUANT TO SECTION 13, 15(d), OR 37 OF THE
SECURITIES EXCHANGE ACT OF 1934
For the quarterly period ended March 31, 2017
OR
o TRANSITION REPORT PURSUANT TO SECTION 13 OR 15(d) OF
THE SECURITIES EXCHANGE ACT OF 1934
For the transition period from _____ to _____
Commission file number 000-52313

TENNESSEE VALLEY AUTHORITY
(Exact name of registrant as specified in its charter)
A corporate agency of the United States created by an act of Congress (State or other jurisdiction of incorporation or organization) | 62-0474417 (IRS Employer Identification No.) | ||
400 W. Summit Hill Drive Knoxville, Tennessee (Address of principal executive offices) | 37902 (Zip Code) | ||
(865) 632-2101
(Registrant’s telephone number, including area code)
None
(Former name, former address and former fiscal year, if changed since last report)
Indicate by check mark whether the registrant (1) has filed all reports required to be filed by Section 13, 15(d), or 37 of the Securities Exchange Act of 1934 during the preceding 12 months (or for such shorter period that the registrant was required to file such reports), and (2) has been subject to such filing requirements for the past 90 days.
Yes x No o
Indicate by check mark whether the registrant has submitted electronically and posted on its corporate Web site, if any, every Interactive Data File required to be submitted and posted pursuant to Rule 405 of Regulation S-T (§232.405 of this chapter) during the preceding 12 months (or for such shorter period that the registrant was required to submit and post such files).
Yes x No o
Indicate by check mark whether the registrant is a large accelerated filer, an accelerated filer, a non-accelerated filer, smaller reporting company, or an emerging growth company. See the definitions of “large accelerated filer,” “accelerated filer,” “smaller reporting company,” and "emerging growth company" in Rule 12b-2 of the Exchange Act.
Large accelerated filer o Accelerated filer o
Non-accelerated filer x (Do not check if a smaller reporting company) Smaller reporting company o Emerging growth company o
If an emerging growth company, indicate by check mark if the registrant has elected not to use the extended transition period for complying with any new or revised financial accounting standards provided pursuant to Section 13(a) of the Exchange Act. o
Indicate by check mark whether the registrant is a shell company (as defined in Rule 12b-2 of the Exchange Act).
Yes o No x
1
Table of Contents | |
GLOSSARY OF COMMON ACRONYMS...................................................................................................................................... | |
FORWARD-LOOKING INFORMATION......................................................................................................................................... | |
GENERAL INFORMATION............................................................................................................................................................ | |
ITEM 1. FINANCIAL STATEMENTS............................................................................................................................................. | |
Consolidated Statements of Operations (unaudited)............................................................................................................ | |
Consolidated Statements of Comprehensive Income (Loss) (unaudited)............................................................................. | |
Consolidated Balance Sheets (unaudited)............................................................................................................................ | |
Consolidated Statements of Cash Flows (unaudited)........................................................................................................... | |
Consolidated Statements of Changes in Proprietary Capital (unaudited)............................................................................. | |
Notes to Consolidated Financial Statements (unaudited)..................................................................................................... | |
Executive Overview............................................................................................................................................................... | |
Results of Operations............................................................................................................................................................ | |
Liquidity and Capital Resources............................................................................................................................................ | |
Key Initiatives and Challenges.............................................................................................................................................. | |
Environmental Matters.......................................................................................................................................................... | |
Legal Proceedings................................................................................................................................................................ | |
Off-Balance Sheet Arrangements......................................................................................................................................... | |
Critical Accounting Policies and Estimates........................................................................................................................... | |
New Accounting Standards and Interpretations.................................................................................................................... | |
Corporate Governance.......................................................................................................................................................... | |
Legislative and Regulatory Matters....................................................................................................................................... | |
ITEM 3. QUANTITATIVE AND QUALITATIVE DISCLOSURES ABOUT MARKET RISK.............................................................. | |
ITEM 4. CONTROLS AND PROCEDURES.................................................................................................................................. | |
Disclosure Controls and Procedures...................................................................................................................................... | |
Changes in Internal Control over Financial Reporting............................................................................................................ | |
ITEM 1. LEGAL PROCEEDINGS.................................................................................................................................................. | |
ITEM 1A. RISK FACTORS........................................................................................................................................................... | |
ITEM 6. EXHIBITS....................................................................................................................................................................... | |
SIGNATURES............................................................................................................................................................................... | |
EXHIBIT INDEX............................................................................................................................................................................ | |
2
GLOSSARY OF COMMON ACRONYMS | ||
Following are definitions of terms or acronyms that may be used in this Quarterly Report on Form 10-Q for the quarter ended March 31, 2017 (the “Quarterly Report”): | ||
Term or Acronym | Definition | |
AFUDC | Allowance for funds used during construction | |
AOCI | Accumulated other comprehensive income (loss) | |
ARO | Asset retirement obligation | |
ART | Asset Retirement Trust | |
ASLB | Atomic Safety and Licensing Board | |
BEST | Bellefonte Efficiency and Sustainability Team | |
BREDL | Blue Ridge Environmental Defense League | |
CAA | Clean Air Act | |
CAIR | Clean Air Interstate Rule | |
CCP | Coal combustion products | |
CCR | Coal combustion residuals | |
CME | Chicago Mercantile Exchange | |
CO2 | Carbon dioxide | |
COL | Combined construction and operating license | |
COLA | Cost-of-living adjustment | |
CSAPR | Cross-State Air Pollution Rule | |
CT | Combustion turbine unit | |
CVA | Credit valuation adjustment | |
CY | Calendar year | |
DCP | Deferred Compensation Plan | |
DOE | Department of Energy | |
EPA | Environmental Protection Agency | |
ESPA | Early Site Permit Application | |
FASB | Financial Accounting Standards Board | |
FCM | Futures Commission Merchant | |
FERC | Federal Energy Regulatory Commission | |
FTP | Financial Trading Program | |
GAAP | Accounting principles generally accepted in the United States of America | |
GAO | Government Accountability Office | |
GHG | Greenhouse gas | |
GWh | Gigawatt hour(s) | |
IRP | Integrated Resource Plan | |
JSCCG | John Sevier Combined Cycle Generation LLC | |
kWh | Kilowatt hour(s) | |
LIBOR | London Interbank Offered Rate | |
LPC | Local power company customer of TVA | |
LTDCP | Long-Term Deferred Compensation Plan | |
MATS | Mercury and Air Toxics Standards | |
MD&A | Management’s Discussion and Analysis of Financial Condition and Results of Operations | |
MISO | Midcontinent Independent System Operator, Inc. | |
mmBtu | Million British thermal unit(s) | |
MtM | Mark-to-market | |
MW | Megawatt | |
NAAQS | National Ambient Air Quality Standards | |
NAV | Net asset value | |
3
NDT | Nuclear Decommissioning Trust | |
NEPA | National Environmental Policy Act | |
NERC | North American Electric Reliability Corporation | |
NOx | Nitrogen oxide | |
NPDES | National Pollutant Discharge Elimination System | |
NRC | Nuclear Regulatory Commission | |
OCI | Other comprehensive income (loss) | |
PM | Particulate matter | |
QER | Quadrennial Energy Review | |
QTE | Qualified technological equipment and software | |
REIT | Real Estate Investment Trust | |
SACE | Southern Alliance for Clean Energy | |
SCCG | Southaven Combined Cycle Generation LLC | |
SCRs | Selective catalytic reduction systems | |
SEC | Securities and Exchange Commission | |
SERP | Supplemental Executive Retirement Plan | |
Seven States | Seven States Power Corporation | |
SHLLC | Southaven Holdco LLC | |
SMR | Small modular reactor(s) | |
SO2 | Sulfur dioxide | |
SSSL | Seven States Southaven, LLC | |
TCWN | Tennessee Clean Water Network | |
TDEC | Tennessee Department of Environment & Conservation | |
TOU | Time-of-use | |
TVARS | Tennessee Valley Authority Retirement System | |
U.S. Treasury | United States Department of the Treasury | |
VIE | Variable interest entity | |
XBRL | eXtensible Business Reporting Language | |
4
FORWARD-LOOKING INFORMATION
This Quarterly Report contains forward-looking statements relating to future events and future performance. All statements other than those that are purely historical may be forward-looking statements. In certain cases, forward-looking statements can be identified by the use of words such as "may," "will," "should," "expect," "anticipate," "believe," "intend," “project,” "plan," “predict," "assume," "forecast," "estimate," "objective,” "possible," "probably," "likely," "potential," "speculate," or other similar expressions.
Although the Tennessee Valley Authority ("TVA") believes that the assumptions underlying the forward-looking statements are reasonable, TVA does not guarantee the accuracy of these statements. Numerous factors could cause actual results to differ materially from those in the forward-looking statements. These factors include, among other things:
• | New, amended, or existing laws, regulations, or administrative orders, including those related to environmental matters, and the costs of complying with these laws, regulations, and administrative orders; |
• | The cost of complying with known, anticipated, and new emissions reduction requirements, some of which could render continued operation of many of TVA's aging coal-fired generation units not cost-effective and result in their removal from service, perhaps permanently; |
• | Actions taken, or inaction, by the U.S. government relating to the national debt ceiling or automatic spending cuts in government programs; |
• | Costs and liabilities that are not anticipated in TVA’s financial statements for third-party claims, natural resource damages, or fines or penalties associated with unexpected events such as failures of a facility or infrastructure as well as for environmental clean-up activities; |
• | Addition or loss of customers by TVA or the local power company customers of TVA ("LPCs"); |
• | Significant reductions in demand for electricity produced through non-renewable or centrally located generation sources which may result from, among other things, economic downturns, increased energy efficiency and conservation, increased utilization of distributed generation, and improvements in alternative generation and energy storage technologies; |
• | Changes in customer preferences for energy produced from cleaner generation sources; |
• | Significant delays, cost increases, or cost overruns associated with the construction and maintenance of generation or transmission assets; |
• | Changes in the timing or amount of pension and health care obligations and related funding; |
• | Increases in TVA's financial liabilities for decommissioning its nuclear facilities or retiring other assets; |
• | Physical or cyber attacks on TVA's assets; |
• | The outcome of legal or administrative proceedings; |
• | The failure of TVA's generation, transmission, flood control, and related assets, including coal combustion residuals ("CCR") facilities, to operate as anticipated, resulting in lost revenues, damages, and other costs that are not reflected in TVA’s financial statements or projections; |
• | Differences between estimates of revenues and expenses and actual revenues earned and expenses incurred; |
• | Weather conditions; |
• | Catastrophic events such as fires, earthquakes, explosions, solar events, electromagnetic pulses, geomagnetic disturbances, droughts, floods, hurricanes, tornadoes, pandemics, wars, national emergencies, terrorist activities, and other similar events, especially if these events occur in or near TVA's service area; |
• | Events at a TVA facility, which, among other things, could result in loss of life, damage to the environment, damage to or loss of the facility, and damage to the property of others; |
• | Events or changes involving transmission lines, dams, and other facilities not operated by TVA, including those that affect the reliability of the interstate transmission grid of which TVA's transmission system is a part and those that increase flows across TVA's transmission grid; |
• | Disruption of fuel supplies, which may result from, among other things, economic conditions, weather conditions, production or transportation difficulties, labor challenges, or environmental laws or regulations affecting TVA's fuel suppliers or transporters; |
• | Purchased power price volatility and disruption of purchased power supplies; |
• | Events which affect the supply of water for TVA's generation facilities; |
• | Changes in TVA's determinations of the appropriate mix of generation assets; |
• | Ineffectiveness of TVA's efforts at adapting its organization to an evolving marketplace and remaining cost competitive; |
• | Inability to obtain, or loss of, regulatory approval for the construction or operation of assets; |
• | The requirement or decision to make additional contributions to TVA's pension or other post-retirement benefit plans or to TVA's Nuclear Decommissioning Trust ("NDT") or Asset Retirement Trust ("ART"); |
• | Limitations on TVA's ability to borrow money which may result from, among other things, TVA's approaching or substantially reaching the limit on bonds, notes, and other evidences of indebtedness specified in the Tennessee Valley Authority Act of 1933, as amended, 16 U.S.C. §§ 831-831ee (the “TVA Act”); |
• | An increase in TVA's cost of capital which may result from, among other things, changes in the market for TVA's debt securities, changes in the credit rating of TVA or the U.S. government, or, potentially, an increased reliance by TVA on alternative financing should TVA approach its debt limit; |
• | Changes in the economy and volatility in financial markets; |
• | Changes in technology; |
5
• | Reliability and creditworthiness of counterparties; |
• | Changes in the market price of commodities such as coal, uranium, natural gas, fuel oil, crude oil, construction materials, reagents, electricity, and emission allowances; |
• | Changes in the market price of equity securities, debt securities, and other investments; |
• | Changes in interest rates, currency exchange rates, and inflation rates; |
• | Ineffectiveness of TVA's disclosure controls and procedures or its internal control over financial reporting; |
• | Inability to eliminate identified deficiencies in TVA's systems, standards, controls, or corporate culture; |
• | Inability to attract or retain a skilled workforce; |
• | Events at a nuclear facility, whether or not operated by or licensed to TVA, which, among other things, could lead to increased regulation or restriction on the construction, ownership, operation, and decommissioning of nuclear facilities or on the storage of spent fuel, obligate TVA to pay retrospective insurance premiums, reduce the availability and affordability of insurance, increase the costs of operating TVA's existing nuclear units, and cause TVA to forego future construction at these or other facilities; |
• | Loss of quorum of the TVA Board of Directors; and |
• | Other unforeseeable events. |
See also Item 1A, Risk Factors, and Item 7, Management’s Discussion and Analysis of Financial Condition and Results of Operations in TVA’s Annual Report on Form 10-K for the year ended September 30, 2016 (the “Annual Report”), and
Part I, Item 2, Management’s Discussion and Analysis of Financial Condition and Results of Operations in this Quarterly Report for a discussion of factors that could cause actual results to differ materially from those in a forward-looking statement. New factors emerge from time to time, and it is not possible for TVA to predict all such factors or to assess the extent to which any factor or combination of factors may impact TVA’s business or cause results to differ materially from those contained in any forward-looking statement. TVA undertakes no obligation to update any forward-looking statement to reflect developments that occur after the statement is made.
GENERAL INFORMATION
Fiscal Year
References to years (2017, 2016, etc.) in this Quarterly Report are to TVA’s fiscal years ending September 30. Years that are preceded by “CY” are references to calendar years.
Notes
References to “Notes” are to the Notes to Consolidated Financial Statements contained in Part I, Item 1, Financial Statements in this Quarterly Report.
Available Information
TVA's Annual Reports on Form 10-K, Quarterly Reports on Form 10-Q, and Current Reports on Form 8-K, as well as all amendments to those reports, are available on TVA's web site, free of charge, as soon as reasonably practicable after such reports are electronically filed with or furnished to the Securities and Exchange Commission ("SEC"). TVA's web site is www.tva.gov. Information contained on TVA’s web site shall not be deemed to be incorporated into, or to be a part of, this Quarterly Report. All TVA SEC reports are available to the public without charge from the web site maintained by the SEC at www.sec.gov.
6
PART I - FINANCIAL INFORMATION
ITEM 1. FINANCIAL STATEMENTS
TENNESSEE VALLEY AUTHORITY
CONSOLIDATED STATEMENTS OF OPERATIONS (Unaudited)
(in millions)
Three Months Ended March 31 | Six Months Ended March 31 | ||||||||||||||
2017 | 2016 | 2017 | 2016 | ||||||||||||
Operating revenues | |||||||||||||||
Revenue from sales of electricity | $ | 2,508 | $ | 2,529 | $ | 5,016 | $ | 4,775 | |||||||
Other revenue | 39 | 42 | 77 | 76 | |||||||||||
Total operating revenues | 2,547 | 2,571 | 5,093 | 4,851 | |||||||||||
Operating expenses | |||||||||||||||
Fuel | 503 | 484 | 1,071 | 964 | |||||||||||
Purchased power | 244 | 237 | 486 | 484 | |||||||||||
Operating and maintenance | 699 | 669 | 1,440 | 1,409 | |||||||||||
Depreciation and amortization | 438 | 465 | 875 | 926 | |||||||||||
Tax equivalents | 129 | 127 | 258 | 251 | |||||||||||
Total operating expenses | 2,013 | 1,982 | 4,130 | 4,034 | |||||||||||
Operating income | 534 | 589 | 963 | 817 | |||||||||||
Other income (expense), net | 15 | 8 | 27 | 20 | |||||||||||
Interest expense | |||||||||||||||
Interest expense | 338 | 337 | 677 | 672 | |||||||||||
Allowance for funds used during construction | — | (58 | ) | — | (116 | ) | |||||||||
Net interest expense | 338 | 279 | 677 | 556 | |||||||||||
Net income (loss) | $ | 211 | $ | 318 | $ | 313 | $ | 281 | |||||||
The accompanying notes are an integral part of these consolidated financial statements. | |||||||||||||||
TENNESSEE VALLEY AUTHORITY
CONSOLIDATED STATEMENTS OF COMPREHENSIVE INCOME (LOSS) (Unaudited)
(in millions)
Three Months Ended March 31 | Six Months Ended March 31 | ||||||||||||||
2017 | 2016 | 2017 | 2016 | ||||||||||||
Net income (loss) | $ | 211 | $ | 318 | $ | 313 | $ | 281 | |||||||
Other comprehensive income (loss) | |||||||||||||||
Net unrealized gain (loss) on cash flow hedges | 25 | (27 | ) | 17 | (54 | ) | |||||||||
Reclassification to earnings from cash flow hedges | (12 | ) | 22 | 26 | 46 | ||||||||||
Total other comprehensive income (loss) | $ | 13 | $ | (5 | ) | $ | 43 | $ | (8 | ) | |||||
Total comprehensive income (loss) | $ | 224 | $ | 313 | $ | 356 | $ | 273 | |||||||
The accompanying notes are an integral part of these consolidated financial statements. | |||||||||||||||
7
TENNESSEE VALLEY AUTHORITY
CONSOLIDATED BALANCE SHEETS (Unaudited)
(in millions)
ASSETS | |||||||
March 31, 2017 | September 30, 2016 | ||||||
Current assets | |||||||
Cash and cash equivalents | $ | 300 | $ | 300 | |||
Accounts receivable, net | 1,310 | 1,747 | |||||
Inventories, net | 1,148 | 993 | |||||
Regulatory assets | 408 | 536 | |||||
Other current assets | 113 | 68 | |||||
Total current assets | 3,279 | 3,644 | |||||
Property, plant, and equipment | |||||||
Completed plant | 57,019 | 51,564 | |||||
Less accumulated depreciation | (27,930 | ) | (27,592 | ) | |||
Net completed plant | 29,089 | 23,972 | |||||
Construction in progress | 3,583 | 8,458 | |||||
Nuclear fuel | 1,429 | 1,450 | |||||
Capital leases | 161 | 163 | |||||
Total property, plant, and equipment, net | 34,262 | 34,043 | |||||
Investment funds | 2,388 | 2,257 | |||||
Regulatory and other long-term assets | |||||||
Regulatory assets | 9,495 | 10,164 | |||||
Other long-term assets | 380 | 386 | |||||
Total regulatory and other long-term assets | 9,875 | 10,550 | |||||
Total assets | $ | 49,804 | $ | 50,494 | |||
The accompanying notes are an integral part of these consolidated financial statements. | |||||||
8
TENNESSEE VALLEY AUTHORITY
CONSOLIDATED BALANCE SHEETS (Unaudited)
(in millions)
LIABILITIES AND PROPRIETARY CAPITAL | |||||||
March 31, 2017 | September 30, 2016 | ||||||
Current liabilities | |||||||
Accounts payable and accrued liabilities | $ | 1,893 | $ | 2,163 | |||
Accrued interest | 374 | 363 | |||||
Current portion of leaseback obligations | 60 | 58 | |||||
Current portion of energy prepayment obligations | 100 | 100 | |||||
Regulatory liabilities | 183 | 154 | |||||
Short-term debt, net | 815 | 1,407 | |||||
Current maturities of power bonds | 1,681 | 1,555 | |||||
Current maturities of long-term debt of variable interest entities | 35 | 35 | |||||
Current maturities of notes payable | 28 | 27 | |||||
Total current liabilities | 5,169 | 5,862 | |||||
Other liabilities | |||||||
Post-retirement and post-employment benefit obligations | 6,770 | 6,929 | |||||
Asset retirement obligations | 3,915 | 3,840 | |||||
Other long-term liabilities | 2,318 | 2,776 | |||||
Leaseback obligations | 371 | 409 | |||||
Energy prepayment obligations | 60 | 110 | |||||
Total other liabilities | 13,434 | 14,064 | |||||
Long-term debt, net | |||||||
Long-term power bonds, net | 21,225 | 20,901 | |||||
Long-term debt of variable interest entities, net | 1,182 | 1,199 | |||||
Long-term notes payable | 21 | 48 | |||||
Total long-term debt, net | 22,428 | 22,148 | |||||
Total liabilities | 41,031 | 42,074 | |||||
Commitments and contingencies | |||||||
Proprietary capital | |||||||
Power program appropriation investment | 258 | 258 | |||||
Power program retained earnings | 7,908 | 7,594 | |||||
Total power program proprietary capital | 8,166 | 7,852 | |||||
Nonpower programs appropriation investment, net | 576 | 580 | |||||
Accumulated other comprehensive income (loss) | 31 | (12 | ) | ||||
Total proprietary capital | 8,773 | 8,420 | |||||
Total liabilities and proprietary capital | $ | 49,804 | $ | 50,494 | |||
The accompanying notes are an integral part of these consolidated financial statements. | |||||||
9
TENNESSEE VALLEY AUTHORITY
CONSOLIDATED STATEMENTS OF CASH FLOWS (Unaudited)
For the Six Months Ended March 31
(in millions)
2017 | 2016 | ||||||
Cash flows from operating activities | |||||||
Net income (loss) | $ | 313 | $ | 281 | |||
Adjustments to reconcile net income (loss) to net cash provided by operating activities | |||||||
Depreciation and amortization (including amortization of debt issuance costs and premiums/discounts) | 898 | 949 | |||||
Amortization of nuclear fuel cost | 172 | 126 | |||||
Noncash retirement benefit expense | 168 | 163 | |||||
Prepayment credits applied to revenue | (50 | ) | (50 | ) | |||
Fuel cost adjustment deferral | 106 | (16 | ) | ||||
Fuel cost tax equivalents | 2 | (15 | ) | ||||
Changes in current assets and liabilities | |||||||
Accounts receivable, net | 440 | 385 | |||||
Inventories and other current assets, net | (83 | ) | (62 | ) | |||
Accounts payable and accrued liabilities | (216 | ) | (203 | ) | |||
Accrued interest | 11 | 14 | |||||
Regulatory assets costs | (14 | ) | (17 | ) | |||
Pension contributions | (155 | ) | (143 | ) | |||
Other, net | (76 | ) | (82 | ) | |||
Net cash provided by operating activities | 1,516 | 1,330 | |||||
Cash flows from investing activities | |||||||
Construction expenditures | (1,119 | ) | (1,477 | ) | |||
Nuclear fuel expenditures | (195 | ) | (138 | ) | |||
Loans and other receivables | |||||||
Advances | (5 | ) | (4 | ) | |||
Repayments | 2 | 3 | |||||
Other, net | 15 | 3 | |||||
Net cash used in investing activities | (1,302 | ) | (1,613 | ) | |||
Cash flows from financing activities | |||||||
Long-term debt | |||||||
Issues of power bonds | 999 | — | |||||
Redemptions and repurchases of power bonds | (528 | ) | (6 | ) | |||
Redemptions of variable interest entities | (17 | ) | (16 | ) | |||
Redemptions of notes payable | (26 | ) | — | ||||
Short-term debt issues (redemptions), net | (595 | ) | 372 | ||||
Payments on leases and leasebacks | (38 | ) | (59 | ) | |||
Financing costs, net | (4 | ) | — | ||||
Payments to U.S. Treasury | (3 | ) | (3 | ) | |||
Other, net | (2 | ) | (4 | ) | |||
Net cash provided by (used in) financing activities | (214 | ) | 284 | ||||
Net change in cash and cash equivalents | — | 1 | |||||
Cash and cash equivalents at beginning of period | 300 | 300 | |||||
Cash and cash equivalents at end of period | $ | 300 | $ | 301 | |||
Supplemental disclosures | |||||||
Significant noncash transactions | |||||||
Accrued capital and nuclear fuel expenditures | $ | 395 | $ | 410 | |||
Capital lease obligations incurred | 3 | 9 | |||||
The accompanying notes are an integral part of these consolidated financial statements. | |||||||
10
TENNESSEE VALLEY AUTHORITY
CONSOLIDATED STATEMENTS OF CHANGES IN PROPRIETARY CAPITAL (Unaudited)
For the Three Months Ended March 31, 2017 and 2016
(in millions)
Power Program Appropriation Investment | Power Program Retained Earnings | Nonpower Programs Appropriation Investment, Net | Accumulated Other Comprehensive Income (Loss) from Net Gains (Losses) on Cash Flow Hedges | Total | |||||||||||||||
Balance at December 31, 2015 | $ | 258 | $ | 6,321 | $ | 587 | $ | (5 | ) | $ | 7,161 | ||||||||
Net income (loss) | — | 320 | (2 | ) | — | 318 | |||||||||||||
Total other comprehensive income (loss) | — | — | — | (5 | ) | (5 | ) | ||||||||||||
Return on power program appropriation investment | — | (1 | ) | — | — | (1 | ) | ||||||||||||
Balance at March 31, 2016 | $ | 258 | $ | 6,640 | $ | 585 | $ | (10 | ) | $ | 7,473 | ||||||||
Balance at December 31, 2016 | $ | 258 | $ | 7,697 | $ | 578 | $ | 18 | $ | 8,551 | |||||||||
Net income (loss) | — | 213 | (2 | ) | — | 211 | |||||||||||||
Total other comprehensive income (loss) | — | — | — | 13 | 13 | ||||||||||||||
Return on power program appropriation investment | — | (2 | ) | — | — | (2 | ) | ||||||||||||
Balance at March 31, 2017 | $ | 258 | $ | 7,908 | $ | 576 | $ | 31 | $ | 8,773 | |||||||||
The accompanying notes are an integral part of these consolidated financial statements. | |||||||||||||||||||
TENNESSEE VALLEY AUTHORITY
CONSOLIDATED STATEMENTS OF CHANGES IN PROPRIETARY CAPITAL (Unaudited)
For the Six Months Ended March 31, 2017 and 2016
(in millions)
Power Program Appropriation Investment | Power Program Retained Earnings | Nonpower Programs Appropriation Investment, Net | Accumulated Other Comprehensive Income (Loss) from Net Gains (Losses) on Cash Flow Hedges | Total | |||||||||||||||
Balance at September 30, 2015 | $ | 258 | $ | 6,357 | $ | 590 | $ | (2 | ) | $ | 7,203 | ||||||||
Net income (loss) | — | 286 | (5 | ) | — | 281 | |||||||||||||
Total other comprehensive income (loss) | — | — | — | (8 | ) | (8 | ) | ||||||||||||
Return on power program appropriation investment | — | (3 | ) | — | — | (3 | ) | ||||||||||||
Balance at March 31, 2016 | $ | 258 | $ | 6,640 | $ | 585 | $ | (10 | ) | $ | 7,473 | ||||||||
Balance at September 30, 2016 | $ | 258 | $ | 7,594 | $ | 580 | $ | (12 | ) | $ | 8,420 | ||||||||
Net income (loss) | — | 317 | (4 | ) | — | 313 | |||||||||||||
Total other comprehensive income (loss) | — | — | — | 43 | 43 | ||||||||||||||
Return on power program appropriation investment | — | (3 | ) | — | — | (3 | ) | ||||||||||||
Balance at March 31, 2017 | $ | 258 | $ | 7,908 | $ | 576 | $ | 31 | $ | 8,773 | |||||||||
The accompanying notes are an integral part of these consolidated financial statements. | |||||||||||||||||||
11
NOTES TO CONSOLIDATED FINANCIAL STATEMENTS (Unaudited)
(Dollars in millions except where noted)
Note No. | Page No. | ||
Nature of Operations and Summary of Significant Accounting Policies | |||
17 | |||
7 | Variable Interest Entities | ||
8 | |||
9 | |||
10 | Debt and Other Obligations | ||
11 | Accumulated Other Comprehensive Income (Loss) | ||
12 | |||
13 | |||
14 | |||
15 | |||
16 | Contingencies and Legal Proceedings | ||
1. Nature of Operations and Summary of Significant Accounting Policies
General
The Tennessee Valley Authority ("TVA") is a corporate agency and instrumentality of the United States ("U.S.") that was created in 1933 by legislation enacted by the U.S. Congress in response to a request by President Franklin D. Roosevelt. TVA was created to, among other things, improve navigation on the Tennessee River, reduce the damage from destructive flood waters within the Tennessee River system and downstream on the lower Ohio and Mississippi Rivers, further the economic development of TVA's service area in the southeastern United States, and sell the electricity generated at the facilities TVA operates.
Today, TVA operates the nation's largest public power system and supplies power in most of Tennessee, northern Alabama, northeastern Mississippi, and southwestern Kentucky and in portions of northern Georgia, western North Carolina, and southwestern Virginia to a population of over nine million people.
TVA also manages the Tennessee River, its tributaries, and certain shorelines to provide, among other things, year-round navigation, flood damage reduction, and affordable and reliable electricity. Consistent with these primary purposes, TVA also manages the river system and public lands to provide recreational opportunities, adequate water supply, improved water quality, cultural and natural resource protection, and economic development.
The power program has historically been separate and distinct from the stewardship programs. It is required to be self-supporting from power revenues and proceeds from power financings, such as proceeds from the issuance of bonds, notes, or other evidences of indebtedness ("Bonds"). Although TVA does not currently receive congressional appropriations, it is required to make annual payments to the United States Department of the Treasury ("U.S. Treasury") as a return on the government's appropriation investment in TVA's power facilities (the "Power Program Appropriation Investment"). In the 1998 Energy and Water Development Appropriations Act, Congress directed TVA to fund essential stewardship activities related to its management of the Tennessee River system and nonpower or stewardship properties with power revenues in the event that there were insufficient appropriations or other available funds to pay for such activities in any fiscal year. Congress has not provided any appropriations to TVA to fund such activities since 1999. Consequently, during 2000, TVA began paying for essential stewardship activities primarily with power revenues, with the remainder funded with user fees and other forms of revenues derived in connection with those activities. The activities related to stewardship properties do not meet the criteria of an operating segment under accounting principles generally accepted in the United States of America ("GAAP"). Accordingly, these assets and properties are included as part of the power program, TVA's only operating segment.
Power rates are established by the TVA Board of Directors (the "TVA Board") as authorized by the Tennessee Valley Authority Act of 1933, as amended, 16 U.S.C. §§ 831-831ee (the “TVA Act”). The TVA Act requires TVA to charge rates for power that will produce gross revenues sufficient to provide funds for operation, maintenance, and administration of its power system; payments to states and counties in lieu of taxes ("tax equivalents"); debt service on outstanding indebtedness;
12
payments to the U.S. Treasury in repayment of and as a return on the Power Program Appropriation Investment; and such additional margin as the TVA Board may consider desirable for investment in power system assets, retirement of outstanding Bonds in advance of maturity, additional reduction of the Power Program Appropriation Investment, and other purposes connected with TVA's power business. In setting TVA's rates, the TVA Board is charged by the TVA Act to have due regard for the primary objectives of the TVA Act, including the objective that power shall be sold at rates as low as are feasible. Rates set by the TVA Board are not subject to review or approval by any state or other federal regulatory body.
Fiscal Year
TVA's fiscal year ends September 30. Years (2017, 2016, etc.) refer to TVA's fiscal years unless they are preceded by “CY,” in which case the references are to calendar years.
Cost-Based Regulation
Since the TVA Board is authorized by the TVA Act to set rates for power sold to its customers, TVA is self-regulated. Additionally, TVA's regulated rates are designed to recover its costs. Based on current projections, TVA believes that rates, set at levels that will recover TVA's costs, can be charged and collected. As a result of these factors, TVA records certain assets and liabilities that result from the regulated ratemaking process that would not be recorded under GAAP for non-regulated entities. Regulatory assets generally represent incurred costs that have been deferred because such costs are probable of future recovery in customer rates. Regulatory liabilities generally represent obligations to make refunds to customers for previous collections for costs that are not likely to be incurred or deferral of gains that will be credited to customers in future periods. TVA assesses whether the regulatory assets are probable of future recovery by considering factors such as applicable regulatory changes, potential legislation, and changes in technology. Based on these assessments, TVA believes the existing regulatory assets are probable of future recovery. This determination reflects the current regulatory and political environment and is subject to change in the future. If future recovery of regulatory assets ceases to be probable, or any of the other factors described above cease to be applicable, TVA would no longer be considered to be a regulated entity and would be required to write off these costs. All regulatory asset write offs would be required to be recognized in earnings in the period in which future recovery ceases to be probable.
Basis of Presentation
TVA prepares its consolidated interim financial statements in conformity with GAAP for consolidated interim financial information. Accordingly, TVA's consolidated interim financial statements do not include all of the information and notes required by GAAP for annual financial statements. As such, they should be read in conjunction with the audited financial statements for the year ended September 30, 2016, and the notes thereto, which are contained in TVA's Annual Report on Form 10-K for the year ended September 30, 2016 (the “Annual Report”). In the opinion of management, all adjustments (consisting of items of a normal recurring nature) considered necessary for fair presentation are included in the consolidated interim financial statements.
The accompanying consolidated interim financial statements, which have been prepared in accordance with GAAP, include the accounts of TVA, two wholly-owned direct subsidiaries, and three variable interest entities ("VIE") of which TVA is the primary beneficiary. See Note 7. Intercompany balances and transactions have been eliminated in consolidation.
Use of Estimates
The preparation of financial statements requires TVA to estimate the effects of various matters that are inherently uncertain as of the date of the consolidated financial statements. Although the consolidated financial statements are prepared in conformity with GAAP, TVA is required to make estimates and assumptions that affect the reported amounts of assets and liabilities, the disclosure of contingent assets and liabilities, and the amounts of revenues and expenses reported during the reporting period. Each of these estimates varies in regard to the level of judgment involved and its potential impact on TVA's financial results. Estimates are considered critical either when a different estimate could have reasonably been used, or where changes in the estimate are reasonably likely to occur from period to period, and such use or change would materially impact TVA's financial condition, results of operations, or cash flows.
Reclassifications
Certain historical amounts have been reclassified in the Consolidated Statement of Cash Flows for the six months ended March 31, 2016. Amounts previously presented in Cash flows from operating activities as Insurance recoveries of $7 million for the six months ended March 31, 2016, are currently reported in Other, net.
13
Allowance for Uncollectible Accounts
The allowance for uncollectible accounts reflects TVA's estimate of probable losses inherent in its accounts and loans receivable balances. TVA determines the allowance based on known accounts, historical experience, and other currently available information including events such as customer bankruptcy and/or a customer failing to fulfill payment arrangements. It also reflects TVA's corporate credit department's assessment of the financial condition of customers and the credit quality of the receivables.
The allowance for uncollectible accounts was $1 million at both March 31, 2017, and September 30, 2016, for accounts receivable. Additionally, loans receivable of $161 million and $141 million at March 31, 2017, and September 30, 2016, respectively, are included in Accounts receivable, net and Other long-term assets, for the current and long-term portions, respectively, and reported net of allowances for uncollectible accounts of $8 million at both March 31, 2017, and September 30, 2016.
Pre-Commercial Plant Operations
As part of the process of completing the construction of a generating unit, the electricity produced is used to serve the
demands of the electric system. TVA estimates revenue from such pre-commercial generation based on the guidance provided by Federal Energy Regulatory Commission ("FERC") regulations. Watts Bar Nuclear Plant ("Watts Bar") Unit 2 commenced pre-commercial plant operations on June 3, 2016, and commercial operations began on October 19, 2016. TVA has also constructed a natural gas-fired generation facility at its Paradise Fossil Plant site which commenced pre-commercial plant operations on October 10, 2016, and commercial operations on April 7, 2017. Estimated revenue of $6 million and $20 million, related to these projects, was capitalized to offset project costs and is included in Revenue from sales of electricity as a contra-revenue amount on the consolidated statement of operations for the three and six months ended March 31, 2017, respectively. TVA also capitalized related fuel costs for these two construction projects of approximately $8 million and $13 million during the three and six months ended March 31, 2017, respectively.
Depreciation
Depreciation expense was $336 million and $369 million for the three months ended March 31, 2017 and 2016, respectively, and $672 million and $733 million for the six months ended March 31, 2017 and 2016, respectively. Depreciation rates are determined based on an external depreciation study. TVA concluded and implemented the results of a new study effective October 1, 2016. Implementation of the new depreciation rates resulted in an estimated decrease of approximately $56 million and $112 million in depreciation and amortization expense during the three and six months ended March 31, 2017, respectively, as compared to the same periods of the prior year. This estimate represents the impact of implementing the new depreciation rates only and does not include any potential impact of other possible changes, including additions to or retirements of net completed plant that occurred during the same period. The decrease in depreciation expense as a result of the new depreciation rates is primarily attributable to the use of TVA's current generation plans, which resulted in changes in retirement date assumptions for coal-fired plants, and changes in the estimated service lives for transmission assets.
Allowance for Funds Used During Construction
TVA may capitalize interest on eligible projects as allowance for funds used during construction ("AFUDC"), based on the average interest rate of TVA’s outstanding debt. The allowance is applicable to construction in progress related to eligible projects with (1) an expected total project cost of $1.0 billion or more, and (2) an estimated construction period of at least three years in duration. TVA capitalized $58 million and $116 million of AFUDC for the three and six months ended March 31, 2016, respectively, related to the Watts Bar Unit 2 project which went into service in October 2016. No AFUDC was recorded for comparable periods in the current year.
Blended Low-Enriched Uranium Program
Under the blended low-enriched uranium ("BLEU") program, TVA, the U.S. Department of Energy ("DOE"), and certain nuclear fuel contractors have entered into agreements providing for the DOE's surplus of enriched uranium to be blended with other uranium down to a level that allows the blended uranium to be fabricated into fuel that can be used in nuclear power plants. Under the terms of an interagency agreement between TVA and the DOE, in exchange for supplying highly enriched uranium materials to the appropriate third-party fuel processors for processing into usable BLEU fuel for TVA, the DOE participates to a degree in the savings generated by TVA’s use of this blended nuclear fuel. Over the life of the program, TVA projects that the DOE’s share of savings generated by TVA’s use of this blended nuclear fuel could result in payments to the DOE of as much as $160 million. TVA accrues an obligation with each BLEU reload batch related to the portion of the ultimate future payments estimated to be attributable to the BLEU fuel currently in use. At March 31, 2017, TVA had paid out approximately $151 million for this program, and the obligation recorded was $9 million.
14
2. Impact of New Accounting Standards and Interpretations
The following are accounting standard updates issued by the Financial Accounting Standards Board ("FASB") that TVA adopted during 2017.
Consolidation | |
Description | This guidance amends the consolidation analysis for VIEs as well as voting interest entities. The standard reduces the number of consolidation models through the elimination of the indefinite deferral for certain entities that was previously allowed and places more emphasis on risk of loss when determining a controlling financial interest. This guidance allows for either a full retrospective or a modified retrospective application. |
Effective Date for TVA | October 1, 2016 |
Effect on the Financial Statements or Other Significant Matters | The adoption of the standard did not materially impact TVA's financial condition, results of operations, or cash flows. |
The following accounting standards have been issued, but as of March 31, 2017, were not effective and had not been adopted by TVA.
Defined Benefit Costs | |
Description | This guidance changes how information about defined benefit costs for pension plans and other post-retirement benefit plans is presented in employer financial statements. The guidance requires employers that present a measure of operating income in their statement of income to include only the service cost component of net periodic pension cost and net periodic postretirement benefit cost in operating expenses (together with other employee compensation costs). The other components of net benefit cost, including amortization of prior service cost/credit, and settlement and curtailment effects, are to be included in nonoperating expenses. Additionally, the guidance stipulates that only the service cost component of net benefit cost is eligible for capitalization in assets. |
Effective Date for TVA | The new standard is effective for TVA’s interim and annual reporting periods beginning October 1, 2018. While early adoption is permitted, TVA does not currently plan to adopt the standard early. |
Effect on the Financial Statements or Other Significant Matters | TVA is currently evaluating the potential impact of these changes on its consolidated financial statements and related disclosures. |
Revenue Recognition | |
Description | In 2014, the FASB issued new guidance related to revenue from contracts with customers. The guidance, including subsequent amendments, replaces the existing accounting standard and industry specific guidance for revenue recognition with a five-step model for recognizing and measuring revenue from contracts with customers. The underlying principle of the guidance is to recognize revenue to depict the transfer of goods or services to customers at the amount expected to be collected. The objective of the new standard is to provide a single, comprehensive revenue recognition model for all contracts with customers to improve comparability within industries and across industries. The new standard also requires enhanced disclosures regarding the nature, amount, timing, and uncertainty of revenue and the related cash flows arising from contracts with customers. At adoption, companies must also select a transition method to be applied either retrospectively to each prior reporting period presented or retrospectively with a cumulative effect adjustment to retained earnings at the date of initial adoption. |
Effective Date for TVA | The new standard is effective for TVA’s interim and annual reporting periods beginning October 1, 2018. While early adoption is permitted, TVA does not currently plan to adopt the standard early. |
Effect on the Financial Statements or Other Significant Matters | While TVA expects most of its revenue to be included in the scope of the new guidance, it has not completed its evaluation of all such arrangements. TVA’s current efforts in evaluating the impact of the standard are focused on scoping of revenue streams and evaluating contracts with local power companies, which represent the majority of TVA's revenues. TVA is also conducting ongoing evaluations of how the new guidance impacts other transactions, including sales to directly served industrial customers, sales to federal agencies, purchase power agreements, contributions in aid of construction, fuel cost adjustments, and other revenue streams. In addition, the power and utilities industry is currently addressing certain industry-specific issues which have not yet been finalized. As the ultimate impact of the new standard has not yet been determined, TVA has not yet elected its transition method. |
Inventory Valuation | |
Description | This guidance changes the model used for the subsequent measurement of inventory from the previous lower of cost or market model to the lower of cost or net realizable value. The guidance applies only to inventory valued using methods other than last-in, first out or the retail inventory method (for example, first-in, first-out or average cost). This amendment is intended to simplify the subsequent measurement of inventory. When the standard becomes effective, it includes interim periods within the fiscal year that begins on that date, and is required to be applied prospectively. |
Effective Date for TVA | The new standard is effective for TVA’s interim and annual reporting periods beginning October 1, 2017. While early adoption is permitted, TVA does not currently plan to adopt the standard early. |
Effect on the Financial Statements or Other Significant Matters | TVA does not expect the adoption of this standard to have a material impact on TVA's financial condition, results of operations, or cash flows. |
15
Lease Accounting | |
Description | This guidance changes the provisions of recognition in both the lessee and lessor accounting models. The standard requires entities that lease assets — referred to as "lessees" — to recognize on the balance sheet the assets and liabilities for the rights and obligations created by leases with terms of more than 12 months. The recognition, measurement, and presentation of expenses and cash flows arising from a lease by a lessee primarily will depend on its classification as a finance (similar to current capital leases) or operating lease. However, unlike current lease accounting rules — which require only capital leases to be recognized on the balance sheet — the new standard will require both types of leases to be recognized on the balance sheet. Operating leases will result in straight-line expense, while finance leases will result in recognition of interest on the lease liability separate from amortization expense. The accounting for the owner of the assets leased by the lessee — also known as lessor accounting — will remain largely unchanged from current lease accounting rules. When the standard becomes effective, it will include interim periods within that fiscal year, and will be required to be applied using a modified retrospective transition. |
Effective Date for TVA | The new standard is effective for TVA’s interim and annual reporting periods beginning October 1, 2019. While early adoption is permitted, TVA does not currently plan to adopt the standard early. |
Effect on the Financial Statements or Other Significant Matters | TVA is currently evaluating the potential impact of these changes on its consolidated financial statements and related disclosures. |
Financial Instruments | |
Description | This guidance applies to the recognition and measurement of financial assets and liabilities. The standard requires all equity investments to be measured at fair value with changes in the fair value recognized through net income (other than those accounted for under the equity method of accounting or those that result in consolidation of the investee). The standard also amends presentation requirements related to certain changes in the fair value of a liability and eliminates certain disclosure requirements of significant assumptions for financial instruments measured at amortized cost on the balance sheet. Public entities must apply the amendments by means of a cumulative-effect adjustment to the balance sheet as of the beginning of the fiscal year of adoption. |
Effective Date for TVA | The new standard is effective for TVA’s interim and annual reporting periods beginning October 1, 2018. Early adoption is not permitted unless specific early adoption guidance is applied. TVA does not currently plan to adopt the standard early. |
Effect on the Financial Statements or Other Significant Matters | TVA currently measures all of its equity investments (other than those that result in the consolidation of the investee) at fair value, with changes in the fair value recognized through net income. If TVA’s Board has authorized the use of regulatory accounting, the changes in fair value are deferred as regulatory assets or liabilities. TVA currently discloses significant assumptions around its estimates of fair value for financial instruments carried at amortized cost on its consolidated balance sheet. TVA is currently evaluating the potential impact of the changes in this new guidance on its consolidated financial statements and related disclosures. |
Derivatives and Hedging | |
Description | This guidance clarifies the requirements for assessing whether contingent call or put options that can accelerate the payment of principal on debt instruments are clearly and closely related to their debt hosts. An entity performing the assessment under the amendments in this update is required to assess the embedded call or put options solely in accordance with a four-step decision sequence. When the standard becomes effective, it will include interim periods within that fiscal year, and will be required to be applied using a modified retrospective transition. |
Effective Date for TVA | The new standard is effective for TVA’s interim and annual reporting periods beginning October 1, 2017. While early adoption is permitted, TVA does not currently plan to adopt the standard early. |
Effect on the Financial Statements or Other Significant Matters | TVA has two issues of Putable Automatic Rate Reset Securities (“PARRS”) outstanding. After a fixed-rate period of five years, the coupon rate on the PAARS may automatically be reset downward under certain market conditions on an annual basis. The coupon rate reset on the PARRS is based on a calculation. If the coupon rate is going to be reset, holders may request, for a limited period of time, redemption of the Bonds at par value, with repayment of principal on the reset date. This put option is otherwise not available. For both series of PARRS, the coupon rate will reset downward on the reset date if the rate calculated is below the then-current coupon rate on the Bond. TVA plans to assess whether these contingent put options, that can accelerate the payment of principal on the PARRS, continue to be clearly and closely related to their debt hosts under the new guidance. TVA plans to assess the put options in accordance with the four-step decision sequence clarified in the guidance. While a preliminary assessment indicates that TVA does not believe the new guidance will impact its current assessment, TVA will continue to evaluate the potential impact of the new guidance on its consolidated balance sheet. |
16
3. Accounts Receivable, Net
Accounts receivable primarily consist of amounts due from customers for power sales. The table below summarizes the types and amounts of TVA’s accounts receivable:
Accounts Receivable, Net | |||||||
At March 31, 2017 | At September 30, 2016 | ||||||
Power receivables | $ | 1,233 | $ | 1,637 | |||
Other receivables | 78 | 111 | |||||
Allowance for uncollectible accounts | (1 | ) | (1 | ) | |||
Accounts receivable, net | $ | 1,310 | $ | 1,747 | |||
4. Inventories, Net
The table below summarizes the types and amounts of TVA’s inventories:
Inventories, Net | |||||||
At March 31, 2017 | At September 30, 2016 | ||||||
Materials and supplies inventory | $ | 745 | $ | 673 | |||
Fuel inventory | 418 | 345 | |||||
Emission allowance inventory, net | 16 | 14 | |||||
Allowance for inventory obsolescence | (31 | ) | (39 | ) | |||
Inventories, net | $ | 1,148 | $ | 993 | |||
5. Other Long-Term Assets
The table below summarizes the types and amounts of TVA’s other long-term assets:
Other Long-Term Assets | |||||||
At March 31, 2017 | At September 30, 2016 | ||||||
Loans and other long-term receivables, net | $ | 157 | $ | 136 | |||
EnergyRight® receivables | 108 | 112 | |||||
Prepaid capacity payments | 38 | 42 | |||||
Commodity contract derivative assets | — | 3 | |||||
Other | 77 | 93 | |||||
Other long-term assets | $ | 380 | $ | 386 | |||
In association with the EnergyRight® Solutions program, local power company customers of TVA ("LPCs") offer financing to end-use customers for the purchase of energy-efficient equipment. Depending on the nature of the energy-efficiency project, loans may have a maximum term of five years or ten years. TVA purchases the resulting loans receivable from its LPCs. The loans receivable are then transferred to a third-party bank with which TVA has agreed to repay in full any loan receivable that has been in default for 180 days or more or that TVA has determined is uncollectible. Given this continuing involvement, TVA accounts for the transfer of the loans receivable as secured borrowings. The current and long-term portions of the loans receivable are reported in Accounts receivable, net and Other long-term assets, respectively, on TVA’s consolidated balance sheets. As of March 31, 2017, and September 30, 2016, the carrying amount of the loans receivable, net of discount, reported in Accounts receivable, net was approximately $27 million and $29 million, respectively. See Note 8 for information regarding the associated financing obligation.
17
6. Regulatory Assets and Liabilities
Regulatory assets generally represent incurred costs that have been deferred because such costs are probable of future recovery in customer rates. Regulatory liabilities generally represent obligations to make refunds to customers for previous collections for costs that are not likely to be incurred or deferrals of gains that will be credited to customers in future periods. Components of regulatory assets and regulatory liabilities are summarized in the table below:
Regulatory Assets and Liabilities | |||||||
At March 31, 2017 | At September 30, 2016 | ||||||
Current regulatory assets | |||||||
Deferred nuclear generating units | $ | 237 | $ | 237 | |||
Unrealized losses on commodity derivatives | 109 | 122 | |||||
Fuel cost adjustment receivable | — | 98 | |||||
Environmental agreements | 17 | 34 | |||||
Environmental cleanup costs - Kingston ash spill | 43 | 42 | |||||
Other current regulatory assets | 2 | 3 | |||||
Total current regulatory assets | 408 | 536 | |||||
Non-current regulatory assets | |||||||
Deferred pension costs and other post-retirement benefits costs | 5,270 | 5,385 | |||||
Unrealized losses on interest rate derivatives | 1,088 | 1,547 | |||||
Nuclear decommissioning costs | 882 | 938 | |||||
Deferred nuclear generating units | 871 | 850 | |||||
Non-nuclear decommissioning costs | 822 | 819 | |||||
Environmental cleanup costs - Kingston ash spill | 283 | 299 | |||||
Unrealized losses on commodity derivatives | 33 | 56 | |||||
Environmental agreements | 14 | 18 | |||||
Other non-current regulatory assets | 232 | 252 | |||||
Total non-current regulatory assets | 9,495 | 10,164 | |||||
Total regulatory assets | $ | 9,903 | $ | 10,700 | |||
Current regulatory liabilities | |||||||
Fuel cost adjustment tax equivalents | $ | 150 | $ | 148 | |||
Fuel cost adjustment payable | 8 | — | |||||
Unrealized gains on commodity derivatives | 25 | 6 | |||||
Total current regulatory liabilities | 183 | 154 | |||||
Non-current regulatory liabilities | |||||||
Unrealized gains on commodity derivatives | — | 3 | |||||
Total regulatory liabilities | $ | 183 | $ | 157 | |||
Deferred Nuclear Generation Units. On November 14, 2016, following a public auction, TVA entered into a contract to sell substantially all of the Bellefonte Nuclear Plant ("Bellefonte") site for $111 million. The net book value of the Bellefonte assets to be sold and the related asset retirement costs are collectively $121 million and are included in Regulatory asset-Deferred nuclear generating units on TVA’s Consolidated Balance Sheet at March 31, 2017, as approved by the TVA Board. TVA received $22 million on November 14, 2016, which is recorded as a long-term liability on TVA’s Consolidated Balance Sheet at March 31, 2017, with the remaining $89 million due at closing. The buyer has up to two years to close on the property. The closing is subject to, among other conditions, a determination by TVA's Chief Executive Officer that potential environmental impacts have been appropriately addressed or are acceptable. Proceeds received from the sale will be recorded as a reduction to the regulatory asset upon closing and will reduce amounts collected in future rates. Any subsequent losses resulting from the disposition or impairment of Bellefonte will be recovered in future rates until fully recovered based upon the TVA Board-approved recovery of the Regulatory asset-Deferred nuclear generating units in future rates at an amount of $237 million per year until fully recovered.
18
7. Variable Interest Entities
A VIE is an entity that either (i) has insufficient equity to permit the entity to finance its activities without additional subordinated financial support or (ii) has equity investors who lack the characteristics of owning a controlling financial interest. When TVA determines that it has a variable interest in a variable interest entity, a qualitative evaluation is performed to assess which interest holders have the power to direct the activities that most significantly impact the economic performance of the entity and have the obligation to absorb losses or receive benefits that could be significant to the entity. The evaluation considers the purpose and design of the business, the risks that the business was designed to create and pass along to other entities, the activities of the business that can be directed and which party can direct them, and the expected relative impact of those activities on the economic performance of the business through its life. TVA has the power to direct the activities of an entity when it has the ability to make key operating and financing decisions, including, but not limited to, capital investment and the issuance of debt. Based on the evaluation of these criteria, TVA has determined it is the primary beneficiary of three entities and as such is required to account for the VIEs on a consolidated basis.
John Sevier VIEs
In 2012, TVA entered into a $1.0 billion construction management agreement and lease financing arrangement with John Sevier Combined Cycle Generation LLC ("JSCCG") for the completion and lease by TVA of the John Sevier Combined Cycle Facility ("John Sevier CCF"). JSCCG is a special single-purpose limited liability company formed in January 2012 to finance the John Sevier CCF through a $900 million secured note issuance (the “JSCCG notes”) and the issuance of $100 million of membership interests subject to mandatory redemption. The membership interests were purchased by John Sevier Holdco LLC ("Holdco"). Holdco is a special single-purpose entity, also formed in January 2012, established to acquire and hold the membership interests in JSCCG. A non-controlling interest in Holdco is held by a third party through nominal membership interests, to which none of the income, expenses, and cash flows is allocated.
The membership interests held by Holdco in JSCCG were purchased with proceeds from the issuance of $100 million of secured notes (the “Holdco notes") and are subject to mandatory redemption pursuant to scheduled amortizing, semi-annual payments due each January 15 and July 15, with a final payment due in January 2042. The payment dates for the mandatorily redeemable membership interests are the same as those of the Holdco notes. The sale of the JSCCG notes, the membership interests in JSCCG, and the Holdco notes closed in January 2012. The JSCCG notes are secured by TVA’s lease payments, and the Holdco notes are secured by Holdco's investment in, and amounts receivable from, JSCCG. TVA’s lease payments to JSCCG are equal to and payable on the same dates as JSCCG’s and Holdco’s semi-annual debt service payments. In addition to the lease payments, TVA pays administrative and miscellaneous expenses incurred by JSCCG and Holdco. Certain agreements related to this transaction contain default and acceleration provisions.
Southaven VIE
In 2013, TVA entered into a lease financing arrangement with Southaven Combined Cycle Generation LLC ("SCCG") for the lease by TVA of the Southaven Combined Cycle Facility ("Southaven CCF"). SCCG is a special single-purpose limited liability company formed in June 2013 to finance the Southaven CCF through a $360 million secured notes issuance (the “SCCG notes”) and the issuance of $40 million of membership interests subject to mandatory redemption. The membership interests were purchased by Southaven Holdco LLC ("SHLLC"). SHLLC is a special single-purpose entity, also formed in June 2013, established to acquire and hold the membership interests of SCCG. A non-controlling interest in SHLLC is held by a third party through nominal membership interests, to which none of the income, expenses, and cash flows of SHLLC are allocated.
The membership interests held by SHLLC were purchased with proceeds from the issuance of $40 million of secured notes (the "SHLLC notes"), and are subject to mandatory redemption pursuant to a schedule of amortizing, semi-annual payments due each February 15 and August 15, with a final payment due on August 15, 2033. The payment dates for the mandatorily redeemable membership interests are the same as those of the SHLLC notes and the payment amounts are sufficient to provide returns on, as well as returns of, capital until the investment has been repaid to SHLLC in full. The rate of return on investment to SHLLC is 7.0 percent, which is reflected as interest expense in the consolidated statements of operations. SHLLC is required to pay a pre-determined portion of the return on investment to Seven States Southaven, LLC ("SSSL") on each lease payment date as agreed in SHLLC's formation documents (the "Seven States Return"). The current and long-term portions of the Membership interests of VIE subject to mandatory redemption are included in Accounts payable and accrued liabilities and Other long-term liabilities, respectively.
The payment dates for the mandatorily redeemable membership interests are the same as those of the SHLLC notes. The SCCG notes are secured by TVA’s lease payments, and the SHLLC notes are secured by SHLLC’s investment in, and amounts receivable from, SCCG. TVA’s lease payments to SCCG are payable on the same dates as SCCG’s and SHLLC’s semi-annual debt service payments and are equal to the sum of (i) the amount of SCCG’s semi-annual debt service payments, (ii) the amount of SHLLC’s semi-annual debt service payments, and (iii) the amount of the Seven States Return. In addition to the lease payments, TVA pays administrative and miscellaneous expenses incurred by SCCG and SHLLC. Certain agreements related to this transaction contain default and acceleration provisions.
19
In the event that TVA were to choose to exercise an early buy out feature of the Southaven Facility Lease, in part or in whole, TVA must pay to SCCG amounts sufficient for SCCG to repay or partially repay on a pro rata basis the membership interests held by SHLLC, including any outstanding investment amount plus accrued but unpaid return. TVA also has the right, at any time and without any early redemption of the other portions of the Southaven Facility Lease payments due to SCCG, to fully repay SHLLC's investment, upon which repayment SHLLC will transfer the membership interests to a designee of TVA.
Impact on Consolidated Financial Statements
The financial statement items attributable to carrying amounts and classifications of JSCCG, Holdco, and SCCG as of March 31, 2017, and September 30, 2016, as reflected in the consolidated balance sheets are as follows:
Summary of Impact of VIEs on Consolidated Balance Sheets | |||||||
At March 31, 2017 | At September 30, 2016 | ||||||
Current liabilities | |||||||
Accrued interest | $ | 11 | $ | 11 | |||
Accounts payable and accrued liabilities | 2 | 2 | |||||
Current maturities of long-term debt of variable interest entities | 35 | 35 | |||||
Total current liabilities | 48 | 48 | |||||
Other liabilities | |||||||
Other long-term liabilities | 31 | 33 | |||||
Long-term debt, net | |||||||
Long-term debt of variable interest entities, net | 1,182 | 1,199 | |||||
Total liabilities | $ | 1,261 | $ | 1,280 | |||
Interest expense of $15 million for the three months ended March 31, 2017 and 2016 and $30 million and $31 million for the six months ended March 31, 2017 and 2016, respectively, is included in the Consolidated Statements of Operations related to debt of variable interest entities and membership interests of variable interest entities subject to mandatory redemption.
Creditors of the VIEs have no recourse to the general credit of TVA. TVA does not have any obligations to provide financial support to the VIEs other than as prescribed in the terms of the agreements related to these transactions.
8. Other Long-Term Liabilities
Other long-term liabilities consist primarily of liabilities related to certain derivative instruments as well as liabilities under agreements related to compliance with certain environmental regulations (see Note 16 — Legal Proceedings — Environmental Agreements). The table below summarizes the types and amounts of Other long-term liabilities:
Other Long-Term Liabilities | |||||||
At March 31, 2017 | At September 30, 2016 | ||||||
Interest rate swap liabilities | $ | 1,479 | $ | 1,938 | |||
Capital lease obligations | 179 | 177 | |||||
Currency swap liabilities | 145 | 162 | |||||
EnergyRight® financing obligation | 125 | 130 | |||||
Membership interests of VIE subject to mandatory redemption | 31 | 33 | |||||
Commodity contract derivative liabilities | 33 | 49 | |||||
Environmental agreements liability | 14 | 18 | |||||
Other | 312 | 269 | |||||
Total other long-term liabilities | $ | 2,318 | $ | 2,776 | |||
EnergyRight® Financing Obligation. TVA purchases certain loans receivable from its LPCs in association with the EnergyRight® Solutions program. The current and long-term portions of the resulting financing obligation are reported in Accounts payable and accrued liabilities and Other long-term liabilities, respectively, on TVA’s consolidated balance sheets. As of March 31, 2017, and September 30, 2016, the carrying amount of the financing obligation reported in Accounts payable and accrued liabilities was approximately $31 million and $33 million, respectively. See Note 5 for information regarding the associated loans receivable and for details regarding the EnergyRight® Solutions program.
20
9. Asset Retirement Obligations
During the six months ended March 31, 2017, TVA's total ARO liability increased $63 million as a result of revisions in estimates and periodic accretion, partially offset by settlement projects that were conducted during these periods. The nuclear and non-nuclear accretion expense was deferred as regulatory assets. During the six months ended March 31, 2017, $72 million of the related regulatory assets were amortized into expense as these amounts were collected in rates. See Note 6. TVA maintains investment trusts to help fund its decommissioning obligations. See Note 13 and Note 16 — Contingencies — Decommissioning Costs for a discussion of the trusts' objectives and the current balances of the trusts.
Asset Retirement Obligation Activity | |||||||||||||
Nuclear | Non-Nuclear | Total | |||||||||||
Balance at September 30, 2016 | $ | 2,492 | $ | 1,560 | $ | 4,052 | |||||||
Settlements | — | (58 | ) | (58 | ) | ||||||||
Revisions in estimate | — | 46 | 46 | ||||||||||
Additional obligations | — | 1 | 1 | ||||||||||
Accretion (recorded as regulatory asset) | 58 | 16 | 74 | ||||||||||
Balance at March 31, 2017 | $ | 2,550 | $ | 1,565 | $ | 4,115 | (1 | ) | |||||
Note
(1) The current portion of ARO in the amount of $200 million and $212 million is included in Accounts payable and accrued liabilities at March 31, 2017, and September 30, 2016, respectively.
10. Debt and Other Obligations
Debt Outstanding
Total debt outstanding at March 31, 2017, and September 30, 2016, consisted of the following:
Debt Outstanding | |||||||
At March 31, 2017 | At September 30, 2016 | ||||||
Short-term debt | |||||||
Short-term debt, net | $ | 815 | $ | 1,407 | |||
Current maturities of power bonds | 1,681 | 1,555 | |||||
Current maturities of long-term debt of variable interest entities | 35 | 35 | |||||
Current maturities of notes payable | 28 | 27 | |||||
Total current debt outstanding, net | 2,559 | 3,024 | |||||
Long-term debt | |||||||
Long-term power bonds(1) | 21,384 | 21,063 | |||||
Long-term debt of variable interest entities | 1,193 | 1,211 | |||||
Long-term notes payable | 21 | 48 | |||||
Unamortized discounts, premiums, issue costs, and other | (170 | ) | (174 | ) | |||
Total long-term debt, net | 22,428 | 22,148 | |||||
Total outstanding debt | $ | 24,987 | $ | 25,172 | |||
Note
(1) Includes net exchange gain from currency transactions of $176 million at March 31, 2017, and $150 million at September 30, 2016.
21
Debt Securities Activity
The table below summarizes the long-term debt securities activity for the period from October 1, 2016, to March 31, 2017:
Debt Securities Activity | |||||||||
Date | Amount(1) | Interest Rate | |||||||
Issues | |||||||||
2017 Series A (2) | February 2017 | $ | 1,000 | 2.88 | % | ||||
Discount on debt issues | (1 | ) | |||||||
Total long-term debt issuances | $ | 999 | |||||||
Redemptions/Maturities | |||||||||
electronotes® | First Quarter 2017 | $ | 1 | 2.65 | % | ||||
electronotes® | Second Quarter 2017 | 1 | 3.29 | % | |||||
2009 Series B | December 2016 | 1 | 3.77 | % | |||||
2001 Series D | December 2016 | 525 | 4.88 | % | |||||
Total redemptions/maturities of power bonds | 528 | ||||||||
Notes payable | 26 | 0.81 | % | ||||||
Debt of variable interest entities | 17 | 4.30 | % | ||||||
Total redemptions/maturities of debt | $ | 571 | |||||||
Note
(1) All redemptions were at 100 percent of par.
(2) The 2017 Series A bonds were issued at 99.9 percent of par.
Credit Facility Agreements
TVA and the U.S. Treasury, pursuant to the TVA Act, have entered into a memorandum of understanding under which the U.S. Treasury provides TVA with a $150 million credit facility. This credit facility was renewed for 2017 with a maturity date of September 30, 2017. Access to this credit facility or other similar financing arrangements with the U.S. Treasury has been available to TVA since the 1960s. TVA can borrow under the U.S. Treasury credit facility only if it cannot issue Bonds in the market on reasonable terms, and TVA considers the U.S. Treasury credit facility a secondary source of liquidity. The interest rate on any borrowing under this facility is based on the average rate on outstanding marketable obligations of the United States with maturities from date of issue of one year or less. There were no outstanding borrowings under the facility at March 31, 2017. The availability of this credit facility may be impacted by how the U.S. government addresses the situation of approaching its debt limit.
TVA also has funding available in the form of four long-term revolving credit facilities totaling $2.7 billion: a $150 million credit facility matures on December 12, 2019, a $500 million credit facility matures on February 1, 2021, a $1.0 billion credit facility matures on June 2, 2020, and another $1.0 billion credit facility matures on September 30, 2020. The interest rate on any borrowing under these facilities varies based on market factors and the rating of TVA's senior unsecured, long-term, non-credit-enhanced debt. TVA is required to pay an unused facility fee on the portion of the total $2.7 billion that TVA has not borrowed or committed under letters of credit. This fee, along with letter of credit fees, may fluctuate depending on the rating of TVA's senior unsecured, long-term, non-credit-enhanced debt. At March 31, 2017, and September 30, 2016, there were approximately $1.1 billion and $1.4 billion, respectively, of letters of credit outstanding under the facilities. See Note 12 — Other Derivative Instruments — Collateral.
22
The following table provides additional information regarding TVA's funding available under the four long-term credit facilities:
Summary of Long-Term Credit Facilities At March 31, 2017 | |||||||||||||||
Maturity Date | Facility Limit | Letters of Credit Outstanding | Cash Borrowings | Availability | |||||||||||
December 2019 | $ | 150 | $ | 38 | $ | — | $ | 112 | |||||||
February 2021 | 500 | 500 | — | — | |||||||||||
June 2020 | 1,000 | 278 | — | 722 | |||||||||||
September 2020 | 1,000 | 288 | — | 712 | |||||||||||
Total | $ | 2,650 | $ | 1,104 | $ | — | $ | 1,546 | |||||||
Lease/Leaseback Obligations
TVA previously entered into leasing transactions to obtain third-party financing for 24 peaking combustion turbine units (“CTs”) as well as certain qualified technological equipment and software (collectively, “QTE”). Due to TVA’s continuing involvement with the combustion turbine facilities and the QTE during the leaseback term, TVA accounted for the lease proceeds as financing obligations. In 2016, TVA acquired 100 percent of the equity interests in two special purpose entities ("SPEs") created for the purpose of facilitating a portion of the leaseback arrangements. As a result of the acquisition, TVA effectively settled its leaseback obligations related to eight CTs. At March 31, 2017, and September 30, 2016, the outstanding leaseback obligations related to CTs and QTE were $431 million and $467 million, respectively.
11. Accumulated Other Comprehensive Income (Loss)
Accumulated other comprehensive income (loss) ("AOCI") represents market valuation adjustments related to TVA’s currency swaps. The currency swaps are cash flow hedges and are the only derivatives in TVA’s portfolio that have been designated and qualify for hedge accounting treatment. TVA records exchange rate gains and losses on its foreign currency-denominated debt in net income and marks its currency swap assets and liabilities to market through other comprehensive income (loss) ("OCI"). TVA then reclassifies an amount out of AOCI into net income, offsetting the exchange gain/loss recorded on the debt. During the three months ended March 31, 2017 and 2016, TVA reclassified $12 million of gains and $22 million of losses, respectively, related to its cash flow hedges from AOCI to Interest expense. During the six months ended March 31, 2017 and 2016, TVA reclassified $26 million and $46 million of losses, respectively, related to its cash flow hedges from AOCI to Interest expense.
TVA records certain assets and liabilities that result from the regulated ratemaking process that would not be recorded under GAAP for non-regulated entities. As such, certain items that would generally be reported in AOCI or that would impact the statements of operations are recorded as regulatory assets or regulatory liabilities.
See Note 6 for a schedule of regulatory assets and liabilities. See Note 12 for a discussion of the recognition in AOCI of gains and losses associated with certain derivative contracts. See Note 13 for a discussion of the recognition of certain investment fund gains and losses as regulatory assets and liabilities. See Note 15 for a discussion of the regulatory accounting related to components of TVA’s benefit plans.
12. Risk Management Activities and Derivative Transactions
TVA is exposed to various risks. These include risks related to commodity prices, investment prices, interest rates, currency exchange rates, and inflation as well as counterparty credit and performance risks. To help manage certain of these risks, TVA has entered into various derivative transactions, principally commodity option contracts, forward contracts, swaps, swaptions, futures, and options on futures. Other than certain derivative instruments in its trust investment funds, it is TVA’s policy to enter into these derivative transactions solely for hedging purposes and not for speculative purposes. TVA has suspended its Financial Trading Program ("FTP") and no longer uses financial instruments to hedge risks related to commodity prices; however, TVA plans to continue to manage fuel price volatility through other methods and to periodically reevaluate its suspended FTP program for future use of financial instruments.
Overview of Accounting Treatment
TVA recognizes certain of its derivative instruments as either assets or liabilities on its consolidated balance sheets at fair value. The accounting for changes in the fair value of these instruments depends on (1) whether TVA uses regulatory accounting to defer the derivative gains and losses, (2) whether the derivative instrument has been designated and qualifies for hedge accounting treatment, and (3) if so, the type of hedge relationship (for example, cash flow hedge).
23
The following tables summarize the accounting treatment that certain of TVA's financial derivative transactions receive:
Summary of Derivative Instruments That Receive Hedge Accounting Treatment (part 1) Amount of Mark-to-Market Gain (Loss) Recognized in OCI | |||||||||||||||||||||
Three Months Ended March 31 | Six Months Ended March 31 | ||||||||||||||||||||
Derivatives in Cash Flow Hedging Relationship | Objective of Hedge Transaction | Accounting for Derivative Hedging Instrument | 2017 | 2016 | 2017 | 2016 | |||||||||||||||
Currency swaps | To protect against changes in cash flows caused by changes in foreign currency exchange rates (exchange rate risk) | Unrealized gains and losses are recorded in AOCI and reclassified to interest expense to the extent they are offset by gains and losses on the hedged transaction. | $ | 25 | $ | (27 | ) | $ | 17 | $ | (54 | ) | |||||||||
Summary of Derivative Instruments That Receive Hedge Accounting Treatment (part 2)(1) Amount of Gain (Loss) Reclassified from OCI to Interest Expense | |||||||||||||||||
Three Months Ended March 31 | Six Months Ended March 31 | ||||||||||||||||
Derivatives in Cash Flow Hedging Relationship | 2017 | 2016 | 2017 | 2016 | |||||||||||||
Currency swaps | $ | 12 | $ | (22 | ) | $ | (26 | ) | $ | (46 | ) | ||||||
Note
(1) There were no ineffective portions or amounts excluded from effectiveness testing for any of the periods presented. Based on forecasted foreign currency exchange rates, TVA expects to reclassify approximately $15 million of gains from AOCI to interest expense within the next twelve months to offset amounts anticipated to be recorded in interest expense related to net exchange gain on the debt.
Summary of Derivative Instruments That Do Not Receive Hedge Accounting Treatment Amount of Gain (Loss) Recognized in Income on Derivatives | |||||||||||||||||||||
Three Months Ended March 31(1) | Six Months Ended March 31(1) | ||||||||||||||||||||
Derivative Type | Objective of Derivative | Accounting for Derivative Instrument | 2017 | 2016 | 2017 | 2016 | |||||||||||||||
Interest rate swaps | To fix short-term debt variable rate to a fixed rate (interest rate risk) | Mark-to-market gains and losses are recorded as regulatory assets or liabilities. Realized gains and losses are recognized in interest expense when payments are made or received on the swap settlement dates. | $ | (26 | ) | $ | (27 | ) | $ | (52 | ) | $ | (55 | ) | |||||||
Commodity contract derivatives | To protect against fluctuations in market prices of purchased coal or natural gas (price risk) | Mark-to-market gains and losses are recorded as regulatory assets or liabilities. Realized gains and losses due to contract settlements are recognized in fuel expense as incurred. | 2 | — | — | — | |||||||||||||||
Commodity derivatives under FTP | To protect against fluctuations in market prices of purchased commodities (price risk) | Mark-to-market gains and losses are recorded as regulatory assets or liabilities. Realized gains and losses are recognized in fuel expense or purchased power expense when the related commodity is used in production. | (6 | ) | (21 | ) | (21 | ) | (56 | ) | |||||||||||
Note
(1) All of TVA's derivative instruments that do not receive hedge accounting treatment have unrealized gains (losses) that would otherwise be recognized in income
but instead are deferred as regulatory assets and liabilities. As such, there was no related gain (loss) recognized in income for these unrealized gains (losses) for the three months and six months ended March 31, 2017 and 2016.
24
Fair Values of TVA Derivatives | ||||||||||||
At March 31, 2017 | At September 30, 2016 | |||||||||||
Derivatives That Receive Hedge Accounting Treatment | Balance | Balance Sheet Presentation | Balance | Balance Sheet Presentation | ||||||||
Currency swaps | ||||||||||||
£200 million Sterling | $ | (84 | ) | Other long-term liabilities | $ | (82 | ) | Other long-term liabilities | ||||
£250 million Sterling | (34 | ) | Other long-term liabilities | (41 | ) | Other long-term liabilities | ||||||
£150 million Sterling | (27 | ) | Other long-term liabilities | (39 | ) | Other long-term liabilities | ||||||
At March 31, 2017 | At September 30, 2016 | |||||||||||
Derivatives That Do Not Receive Hedge Accounting Treatment | Balance | Balance Sheet Presentation | Balance | Balance Sheet Presentation | ||||||||
Interest rate swaps | ||||||||||||
$1.0 billion notional | (1,072 | ) | Other long-term liabilities | (1,387 | ) | Other long-term liabilities | ||||||
$476 million notional | (398 | ) | Other long-term liabilities | (539 | ) | Other long-term liabilities | ||||||
$42 million notional | (9 | ) | Other long-term liabilities | (12 | ) | Other long-term liabilities | ||||||
Commodity contract derivatives | (97 | ) | Other current assets $25; Other long-term liabilities $(33); Accounts payable and accrued liabilities $(89) | (125 | ) | Other current assets $6; Other long-term assets $3; Other long-term liabilities $(49); Accounts payable and accrued liabilities $(85) | ||||||
FTP | ||||||||||||
Derivatives under FTP(1) | (17 | ) | Other current assets $(13); Accounts payable and accrued liabilities $(4) | (39 | ) | Other current assets $(30); Other long-term liabilities $(2); Accounts payable and accrued liabilities $(7) | ||||||
Note
(1) Fair values of certain derivatives under the FTP that were in net liability positions totaling $13 million and $30 million at March 31, 2017, and September 30, 2016, respectively, are recorded in TVA's margin cash accounts in Other current assets. These derivatives are transacted with futures commission merchants, and cash deposits have been posted to the margin cash accounts held with each futures commission merchant to offset the net liability positions in full.
Cash Flow Hedging Strategy for Currency Swaps
To protect against exchange rate risk related to three British pound sterling denominated Bond transactions, TVA entered into foreign currency hedges at the time the Bond transactions occurred. TVA had three currency swaps outstanding as of March 31, 2017, with total currency exposure of £600 million and expiration dates ranging from 2021 to 2043.
When the dollar strengthens against the British pound sterling, the exchange gain on the Bond liability is offset by an exchange loss on the swap contract. Conversely, when the dollar weakens against the British pound sterling, the exchange loss on the Bond liability is offset by an exchange gain on the swap contract. All such exchange gains or losses on the Bond liability are included in Long-term debt, net. The offsetting exchange losses or gains on the swap contracts are recognized in AOCI. If any gain (loss) were to be incurred as a result of the early termination of the foreign currency swap contract, the resulting income (expense) would be amortized over the remaining life of the associated bond as a component of Interest expense.
Derivatives Not Receiving Hedge Accounting Treatment
Interest Rate Derivatives. Generally, TVA uses interest rate swaps to fix variable short-term debt to a fixed rate, and TVA uses regulatory accounting treatment to defer the mark-to-market ("MtM") gains and losses on its interest rate swaps. The net deferred unrealized gains and losses are classified as regulatory assets or liabilities on TVA's consolidated balance sheets and are included in the ratemaking formula when the transactions settle. The values of these derivatives are included in Other long-term assets or Other long-term liabilities on the consolidated balance sheets, and realized gains and losses, if any, are included in TVA's consolidated statements of operations. For the three months ended March 31, 2017 and 2016, the changes in fair market value of the interest rate swaps resulted in deferred unrealized gains of $18 million and deferred unrealized losses of $262 million, respectively. For the six months ended March 31, 2017 and 2016, the changes in fair market value of the interest rate swaps resulted in deferred unrealized gains of $459 million and deferred unrealized losses of $173 million, respectively.
Commodity Derivatives. TVA enters into certain derivative contracts for coal and natural gas that require physical delivery of the contracted quantity of the commodity. TVA marks to market all such contracts and defers the fair market values as regulatory assets or liabilities on a gross basis. At March 31, 2017, TVA's coal contract derivatives had terms of up to two years and natural gas contract derivatives had terms of up to four years.
25
Commodity Contract Derivatives | |||||||||||||||
At March 31, 2017 | At September 30, 2016 | ||||||||||||||
Number of Contracts | Notional Amount | Fair Value (MtM) | Number of Contracts | Notional Amount | Fair Value (MtM) | ||||||||||
Coal contract derivatives | 19 | 21 million tons | $ | (113 | ) | 20 | 20 million tons | $ | (127 | ) | |||||
Natural gas contract derivatives | 48 | 278 million mmBtu | $ | 16 | 39 | 148 million mmBtu | $ | 2 | |||||||
Derivatives Under FTP. While TVA has suspended its FTP and no longer uses financial instruments to hedge risks related to commodity prices, certain natural gas swaps with a maturity of one year or less remain as part of the suspended FTP.
Derivatives Under Financial Trading Program(1) | |||||||||||||
At March 31, 2017 | At September 30, 2016 | ||||||||||||
Notional Amount | Fair Value (MtM) (in millions) | Notional Amount | Fair Value (MtM) (in millions) | ||||||||||
Natural gas (in mmBtu) | |||||||||||||
Swap contracts | 11,200,000 | $ | (17 | ) | 21,052,500 | $ | (39 | ) | |||||
Note
(1) Fair value amounts presented are based on the net commodity position with the counterparty. Notional amounts disclosed represent the net value of contractual amounts.
TVA defers all FTP unrealized gains (losses) as regulatory liabilities (assets) and records only realized gains or losses to match the delivery period of the underlying commodity. In addition to the open commodity derivatives disclosed above, TVA had closed derivative contracts with market values of $(2) million at March 31, 2017, and $(5) million at September 30, 2016. TVA experienced the following unrealized and realized gains and losses related to the FTP at the dates and during the periods, as applicable, set forth in the tables below:
Financial Trading Program Unrealized Gains (Losses) | ||||||||
At March 31 2017 | At September 30 2016 | |||||||
FTP unrealized gains (losses) deferred as regulatory liabilities (assets) | ||||||||
Natural gas | $ | (17 | ) | $ | (39 | ) | ||
Financial Trading Program Realized Gains (Losses) | |||||||||||||||||
Three Months Ended March 31 | Six Months Ended March 31 | ||||||||||||||||
2017 | 2016 | 2017 | 2016 | ||||||||||||||
Decrease (increase) in fuel expense | |||||||||||||||||
Natural gas | $ | (5 | ) | $ | (17 | ) | $ | (17 | ) | $ | (45 | ) | |||||
Financial Trading Program Realized Gains (Losses) | |||||||||||||||||
Three Months Ended March 31 | Six Months Ended March 31 | ||||||||||||||||
2017 | 2016 | 2017 | 2016 | ||||||||||||||
Decrease (increase) in purchased power expense | |||||||||||||||||
Natural gas | $ | (1 | ) | $ | (4 | ) | $ | (4 | ) | $ | (11 | ) | |||||
26
Offsetting of Derivative Assets and Liabilities
The amounts of TVA's derivative instruments as reported in the consolidated balance sheets as of March 31, 2017, and September 30, 2016, are shown in the table below:
Derivative Assets and Liabilities | |||||||||||
As of March 31, 2017 | |||||||||||
Gross Amounts of Recognized Assets/Liabilities | Gross Amounts Offset in the Balance Sheet (1) | Net Amounts of Assets/Liabilities Presented in the Balance Sheet (2) | |||||||||
Assets | |||||||||||
Commodity derivatives not subject to master netting or similar arrangement | $ | 25 | $ | — | $ | 25 | |||||
Liabilities | |||||||||||
Currency swap(s) (3) | $ | 145 | $ | — | $ | 145 | |||||
Interest rate swaps (3) | 1,479 | — | 1,479 | ||||||||
Commodity derivatives under FTP | 17 | (13 | ) | 4 | |||||||
Total derivatives subject to master netting or similar arrangement | 1,641 | (13 | ) | 1,628 | |||||||
Commodity derivatives not subject to master netting or similar arrangement | 122 | — | 122 | ||||||||
Total liabilities | $ | 1,763 | $ | (13 | ) | $ | 1,750 | ||||
As of September 30, 2016 | |||||||||||
Gross Amounts of Recognized Assets/Liabilities | Gross Amounts Offset in the Balance Sheet (1) | Net Amounts of Assets/Liabilities Presented in the Balance Sheet (2) | |||||||||
Assets | |||||||||||
Commodity derivatives under FTP subject to master netting or similar arrangement | $ | 6 | $ | (6 | ) | $ | — | ||||
Commodity derivatives not subject to master netting or similar arrangement | 9 | — | 9 | ||||||||
Total | $ | 15 | $ | (6 | ) | $ | 9 | ||||
Liabilities | |||||||||||
Currency swap(s) (3) | $ | 162 | $ | — | $ | 162 | |||||
Interest rate swaps (3) | 1,938 | — | 1,938 | ||||||||
Commodity derivatives under FTP | 45 | (36 | ) | 9 | |||||||
Total derivatives subject to master netting or similar arrangement | 2,145 | (36 | ) | 2,109 | |||||||
Commodity derivatives not subject to master netting or similar arrangement | 134 | — | 134 | ||||||||
Total | $ | 2,279 | $ | (36 | ) | $ | 2,243 | ||||
Notes
(1) Amounts primarily include counterparty netting of derivative contracts, margin account deposits for futures commission merchants transactions, and cash collateral received or paid in accordance with the accounting guidance for derivatives and hedging transactions.
(2) There are no derivative contracts subject to a master netting arrangement or similar agreement that are not offset in the consolidated balance sheets.
(3) Letters of credit of approximately $1.1 billion and $1.4 billion were posted as collateral at March 31, 2017, and September 30, 2016, respectively, to partially secure the liability positions of one of the currency swaps and one of the interest rate swaps in accordance with the collateral requirements for these derivatives.
Other Derivative Instruments
Investment Fund Derivatives. Investment funds consist primarily of funds held in the Nuclear Decommissioning Trust ("NDT"), the Asset Retirement Trust ("ART"), the Supplemental Executive Retirement Plan ("SERP"), and the Long-Term Deferred Compensation Plan ("LTDCP"). All securities in the trusts are classified as trading. See Note 13 — Investment Funds for a discussion of the trusts' objectives and the types of investments included in the various trusts. These trusts may invest in derivative instruments which may include swaps, futures, options, forwards, and other instruments. The fair values of these derivatives were in net asset positions totaling $10 million and $15 million at March 31, 2017 and September 30, 2016, respectively.
Collateral. TVA's interest rate swaps and currency swaps contain contract provisions that require a party to post collateral (in a form such as cash or a letter of credit) when the party's liability balance under the agreement exceeds a certain
27
threshold. At March 31, 2017, the aggregate fair value of all derivative instruments with credit-risk related contingent features that were in a liability position was $1.6 billion. TVA's collateral obligations at March 31, 2017, under these arrangements were approximately $1.1 billion, for which TVA had posted approximately $1.1 billion in letters of credit. These letters of credit reduce the available balance under the related credit facilities. TVA's assessment of the risk of its nonperformance includes a reduction in its exposure under the contract as a result of this posted collateral.
For all of its derivative instruments with credit-risk related contingent features:
• | If TVA remains a majority-owned U.S. government entity but Standard & Poor's Financial Services, LLC ("S&P") or Moody's Investors Service, Inc. ("Moody's") downgrades TVA's credit rating to AA or Aa2, respectively, TVA's collateral obligations would likely increase by $22 million, and |
• | If TVA ceases to be majority-owned by the U.S. government, TVA's credit rating would likely be downgraded and TVA would be required to post additional collateral. |
Counterparty Risk
TVA may be exposed to certain risks when a counterparty has the potential to fail to meet its obligations in accordance with agreed terms. These risks may be related to credit, operational, or nonperformance matters. To mitigate certain counterparty risk, TVA analyzes the counterparty’s financial condition prior to entering into an agreement, establishes credit limits, monitors the appropriateness of those limits, as well as any changes in the creditworthiness of the counterparty, on an ongoing basis, and when required, employs credit mitigation measures, such as collateral or prepayment arrangements and master purchase and sale agreements, to mitigate credit risk. TVA believes its policies and procedures for counterparty performance risk reviews have generally protected TVA against significant exposure related to market and economic conditions.
Customers. TVA is exposed to counterparty credit risk associated with trade accounts receivable from delivered power sales to LPCs, and from industries and federal agencies directly served, all located in the Tennessee Valley region. TVA is also exposed to risk from exchange power arrangements with a small number of investor-owned regional utilities related to either delivered power or the replacement of open positions of longer-term purchased power or fuel agreements. See Note 1 — Allowance for Uncollectible Accounts and Note 3.
Suppliers. If one of TVA's fuel or purchased power suppliers fails to perform under the terms of its contract with TVA, TVA might lose the money that it paid to the supplier under the contract and have to purchase replacement fuel or power on the spot market, perhaps at a significantly higher price than TVA was entitled to pay under the contract. In addition, TVA might not be able to acquire replacement fuel or power in a timely manner and thus might be unable to satisfy its own obligations to deliver power. Nuclear fuel requirements, including uranium mining and milling, conversion services, enrichment services, and fabrication services, are met from various suppliers, depending on the type of service. TVA purchases the majority of its natural gas requirements from a variety of suppliers under short-term contracts.
To help ensure a reliable supply of coal, TVA had coal contracts with multiple suppliers at March 31, 2017. The contracted supply of coal is sourced from multiple geographic regions of the United States and is to be delivered via various transportation methods (i.e., barge, rail, and truck). Emerging technologies, environmental regulations, and low natural gas prices have contributed to weak demand for coal. As a result, coal suppliers are facing increased financial pressure, which has led to relatively poor credit ratings and bankruptcies. Continued difficulties by coal suppliers could result in consolidations, additional bankruptcies, restructurings, contract renegotiations, or other scenarios. Under these scenarios and TVA’s potential available responses, TVA does not anticipate a significant financial impact in obtaining continued fuel supply for its coal-fired generation.
On March 29, 2017, one of TVA’s suppliers filed for protection under Chapter 11 of the United States Bankruptcy Code. Subsequently, on April 11, 2017, the parent company of the supplier submitted an unaudited financial report for the period from April 2016 to December 2016 with an accompanying statement warning "there are events and circumstances that may bring about significant questions about the idea of carrying on as a going concern." The parent company is also a supplier of goods and services to TVA. TVA currently has several contracts with these companies, including contracts for the enrichment and fabrication of nuclear fuel and the manufacture of a steam generator, as well as several ongoing agreements for maintenance and outage support at its nuclear and coal-fired plants. TVA is assessing potential performance impacts, including procurement of parts and services as well as outage schedules. If either supplier is unable to perform under TVA’s existing contracts and TVA is unable to obtain similar services at similar terms from other vendors, TVA could experience delays, disruptions, additional costs, or other operational outcomes which TVA cannot predict at this time, but which could be material.
TVA has a power purchase agreement that expires on March 31, 2032, with a supplier of electricity for 440 megawatts ("MW") of summer net capability from a lignite-fired generating plant. TVA has determined that the supplier has the equivalent of a non-investment grade credit rating; therefore, the supplier has provided credit assurance to TVA under the terms of the agreement.
28
Derivative Counterparties. TVA has entered into physical and financial contracts that qualify as derivatives for hedging purposes, and TVA's NDT fund and qualified defined benefit pension plan have entered into derivative contracts for investment purposes. If a counterparty to one of TVA's hedging transactions defaults, TVA might incur substantial costs in connection with entering into a replacement hedging transaction. If a counterparty to the derivative contracts into which the NDT fund and the qualified pension plan have entered for investment purposes defaults, the value of the investment could decline significantly or perhaps become worthless. TVA has concentrations of credit risk from the banking and coal industries because multiple companies in these industries serve as counterparties to TVA in various derivative transactions. At March 31, 2017, all of TVA's commodity derivatives under the FTP, currency swaps, and interest rate swaps were with banking counterparties whose Moody's credit ratings were A3 or higher.
TVA classifies qualified forward coal and natural gas contracts as derivatives. See Derivatives Not Receiving Hedge Accounting Treatment above. At March 31, 2017, the coal contracts were with counterparties whose Moody's credit rating, or TVA’s internal analysis when such information was unavailable, ranged from Ca or D, respectively, to Ba3. At March 31, 2017, the natural gas contracts were with counterparties whose ratings ranged from B1 to A3. See Suppliers above for discussion of challenges facing the coal industry. TVA's total value for derivative contracts with coal counterparties in an asset position as of March 31, 2017, was approximately $3 million. TVA currently utilizes two futures commission merchants ("FCMs") to clear commodity contracts, including futures, options, and similar financial derivatives. These transactions are executed under the FTP by the FCMs on exchanges on behalf of TVA. TVA maintains margin cash accounts with the FCMs. TVA makes deposits to the margin cash accounts to adequately cover any net liability positions on its derivatives transacted with the FCMs. See the note to the Fair Values of TVA Derivatives table above.
13. Fair Value Measurements
Fair value is determined based on the exchange price that would be received for an asset or paid to transfer a liability (an exit price) in the asset or liability's principal market, or in the absence of a principal market, the most advantageous market for the asset or liability in an orderly transaction between market participants. TVA uses market or observable inputs as the preferred source of values, followed by assumptions based on hypothetical transactions in the absence of market inputs.
Valuation Techniques
The measurement of fair value results in classification into a hierarchy by the inputs used to determine the fair value as follows:
Level 1 | — | Unadjusted quoted prices in active markets accessible by the reporting entity for identical assets or liabilities. Active markets are those in which transactions for the asset or liability occur with sufficient frequency and volume to provide pricing. | |
Level 2 | — | Pricing inputs other than quoted market prices included in Level 1 that are based on observable market data and that are directly or indirectly observable for substantially the full term of the asset or liability. These include quoted market prices for similar assets or liabilities, quoted market prices for identical or similar assets in markets that are not active, adjusted quoted market prices, inputs from observable data such as interest rate and yield curves, volatilities and default rates observable at commonly quoted intervals, and inputs derived from observable market data by correlation or other means. | |
Level 3 | — | Pricing inputs that are unobservable, or less observable, from objective sources. Unobservable inputs are only to be used to the extent observable inputs are not available. These inputs maintain the concept of an exit price from the perspective of a market participant and should reflect assumptions of other market participants. An entity should consider all market participant assumptions that are available without unreasonable cost and effort. These are given the lowest priority and are generally used in internally developed methodologies to generate management's best estimate of the fair value when no observable market data is available. | |
A financial instrument's level within the fair value hierarchy (where Level 1 is the highest and Level 3 is the lowest) is based on the lowest level of input significant to the fair value measurement.
The following sections describe the valuation methodologies TVA uses to measure different financial instruments at fair value. Except for gains and losses on SERP and LTDCP assets, all changes in fair value of these assets and liabilities have been recorded as changes in regulatory assets, regulatory liabilities, or AOCI on TVA's consolidated balance sheets and consolidated statements of comprehensive income (loss). Except for gains and losses on SERP and LTDCP assets, there has been no impact to the consolidated statements of operations or the consolidated statements of cash flows related to these fair value measurements.
29
Investment Funds
At March 31, 2017, Investment funds were composed of $2.4 billion of securities classified as trading and measured at fair value. Trading securities are held in the NDT, ART, SERP, and LTDCP. The NDT holds funds for the ultimate decommissioning of TVA's nuclear power plants. The ART holds funds primarily for the costs related to the future closure and retirement of TVA's other long-lived assets. The balances in the NDT and ART were $1.8 billion and $545 million, respectively, at March 31, 2017.
TVA established a SERP for certain executives in critical positions to provide supplemental pension benefits tied to compensation that exceeds limits set by Internal Revenue Service rules applicable to the qualified defined benefit pension plan. The LTDCP is designed to provide long-term incentives to executives to encourage them to stay with TVA and to provide competitive levels of total compensation to such executives. NDT and SERP funds are invested in portfolios of securities generally designed to achieve a return in line with overall equity market performance, and ART and LTDCP funds are invested in portfolios of securities generally designed to achieve a return in line with overall debt and equity market performance.
The NDT, ART, SERP, and LTDCP are composed of multiple types of investments and are managed by external institutional managers. Most U.S. and international equities, U.S. Treasury inflation-protected securities, real estate investment trust securities, and cash securities and certain derivative instruments are measured based on quoted exchange prices in active markets and are classified as Level 1 valuations. Fixed-income investments, high-yield fixed-income investments, currencies, and most derivative instruments are non-exchange traded and are classified as Level 2 valuations. These measurements are based on market and income approaches with observable market inputs.
Private equity limited partnerships and private real estate investments may include holdings of investments in private real estate, venture capital, buyout, mezzanine or subordinated debt, restructuring or distressed debt, and special situations through funds managed by third-party investment managers. These investments generally involve a three-to-four-year period where the investor contributes capital, followed by a period of distribution, typically over several years. The investment period is generally, at a minimum, 10 years or longer. The NDT had unfunded commitments related to private equity limited partnerships of $59 million and unfunded commitments related to private real estate of $5 million at March 31, 2017. These investments have no redemption or limited redemption options and may also impose restrictions on the NDT’s ability to liquidate its investments. There are no readily available quoted exchange prices for these investments. The fair value of the investments is based on TVA’s ownership percentage of the fair value of the underlying investments as provided by the investment managers. These investments are typically valued on a quarterly basis. TVA’s private equity limited partnerships and private real estate investments are valued at net asset values ("NAV") as a practical expedient for fair value. TVA classifies its interest in these types of investments as investments measured at net asset value in the fair value hierarchy.
Commingled funds represent investment funds comprising multiple individual financial instruments. The commingled funds held by the NDT, ART, SERP, and LTDCP consist of either a single class of securities, such as equity, debt, or foreign currency securities, or multiple classes of securities. All underlying positions in these commingled funds are either exchange traded or measured using observable inputs for similar instruments. The fair value of commingled funds is based on NAV per fund share (the unit of account), derived from the prices of the underlying securities in the funds. These commingled funds can be redeemed at the measurement date NAV and are classified as Commingled funds measured at net asset value in the fair value hierarchy.
Realized and unrealized gains and losses on trading securities are recognized in current earnings and are based on average cost. The gains and losses of the NDT and ART are subsequently reclassified to a regulatory asset or liability account in accordance with TVA's regulatory accounting policy. See Note 1 — Cost-Based Regulation. TVA recorded unrealized gains and losses related to its trading securities held during each period as follows:
Unrealized Investment Gains (Losses) | |||||||||||||||||||
Three Months Ended March 31 | Six Months Ended March 31 | ||||||||||||||||||
Fund | Financial Statement Presentation | 2017 | 2016 | 2017 | 2016 | ||||||||||||||
SERP | Other income (expense) | $ | 2 | $ | — | $ | 1 | $ | — | ||||||||||
LTDCP | Other income (expense) | 1 | — | — | — | ||||||||||||||
NDT | Regulatory asset | 42 | 9 | 35 | 48 | ||||||||||||||
ART | Regulatory asset | 19 | (3 | ) | 22 | 9 | |||||||||||||
30
Currency and Interest Rate Derivatives
See Note 12 — Cash Flow Hedging Strategy for Currency Swaps and Derivatives Not Receiving Hedge Accounting Treatment for a discussion of the nature, purpose, and contingent features of TVA's currency swaps and interest rate swaps. These swaps are classified as Level 2 valuations and are valued based on income approaches using observable market inputs for similar instruments.
Commodity Contract Derivatives and Commodity Derivatives Under FTP
Commodity Contract Derivatives. Most of these contracts are valued based on market approaches which utilize short- and mid-term market-quoted prices from an external industry brokerage service. A small number of these contracts are valued based on a pricing model using long-term price estimates from TVA's coal price forecast. To value the volume option component of applicable coal contracts, TVA uses a Black-Scholes pricing model which includes inputs from the forecast, contract-specific terms, and other market inputs. These contracts are classified as Level 3 valuations.
Commodity Derivatives Under FTP. These contracts are valued based on market approaches which utilize Chicago Mercantile Exchange ("CME") quoted prices and other observable inputs. Swap contracts are valued using a pricing model based on CME inputs and are subject to nonperformance risk outside of the exit price. These contracts are classified as Level 2 valuations.
See Note 12 — Derivatives Not Receiving Hedge Accounting Treatment — Commodity Derivatives and — Derivatives Under FTP for a discussion of the nature and purpose of coal contracts and derivatives under TVA's FTP.
Nonperformance Risk
The assessment of nonperformance risk, which includes credit risk, considers changes in current market conditions, readily available information on nonperformance risk, letters of credit, collateral, other arrangements available, and the nature of master netting arrangements. TVA is a counterparty to currency swaps, interest rate swaps, commodity contracts, and other derivatives which subject TVA to nonperformance risk. Nonperformance risk on the majority of investments and certain exchange-traded instruments held by TVA is incorporated into the exit price that is derived from quoted market data that is used to mark the investment to market.
Nonperformance risk for most of TVA's derivative instruments is an adjustment to the initial asset/liability fair value. TVA adjusts for nonperformance risk, both of TVA (for liabilities) and the counterparty (for assets), by applying credit valuation adjustments ("CVAs"). TVA determines an appropriate CVA for each applicable financial instrument based on the term of the instrument and TVA's or the counterparty's credit rating as obtained from Moody's. For companies that do not have an observable credit rating, TVA uses internal analysis to assign a comparable rating to the counterparty. TVA discounts each financial instrument using the historical default rate (as reported by Moody's for CY 1983 to CY 2016) for companies with a similar credit rating over a time period consistent with the remaining term of the contract. The application of CVAs resulted in a $1 million decrease in the fair value of assets and a less than $1 million decrease in the fair value of liabilities at March 31, 2017.
31
Fair Value Measurements
The following tables set forth by level, within the fair value hierarchy, TVA's financial assets and liabilities that were measured at fair value on a recurring basis as of March 31, 2017, and September 30, 2016. Financial assets and liabilities have been classified in their entirety based on the lowest level of input that is significant to the fair value measurement. TVA's assessment of the significance of a particular input to the fair value measurement requires judgment and may affect the determination of the fair value of the assets and liabilities and their classification in the fair value hierarchy levels.
Fair Value Measurements At March 31, 2017 | |||||||||||||||
Quoted Prices in Active Markets for Identical Assets (Level 1) | Significant Other Observable Inputs (Level 2) | Significant Unobservable Inputs (Level 3) | Total | ||||||||||||
Assets | |||||||||||||||
Investments | |||||||||||||||
Equity securities | $ | 205 | $ | — | $ | — | $ | 205 | |||||||
Government debt securities | 76 | 58 | — | 134 | |||||||||||
Corporate debt securities | — | 408 | — | 408 | |||||||||||
Mortgage and asset-backed securities | — | 46 | — | 46 | |||||||||||
Institutional mutual funds | 83 | — | — | 83 | |||||||||||
Forward debt securities contracts | — | 10 | — | 10 | |||||||||||
Private equity funds measured at net asset value(1) | — | — | — | 139 | |||||||||||
Private real estate funds measured at net asset value(1) | — | — | — | 112 | |||||||||||
Commingled funds measured at net asset value(1) | — | — | — | 1,251 | |||||||||||
Total investments | 364 | 522 | — | 2,388 | |||||||||||
Commodity contract derivatives | — | 22 | 3 | 25 | |||||||||||
Total | $ | 364 | $ | 544 | $ | 3 | $ | 2,413 | |||||||
Quoted Prices in Active Markets for Identical Liabilities (Level 1) | Significant Other Observable Inputs (Level 2) | Significant Unobservable Inputs (Level 3) | Total | ||||||||||||
Liabilities | |||||||||||||||
Currency swap(s) (2) | $ | — | $ | 145 | $ | — | $ | 145 | |||||||
Interest rate swaps | — | 1,479 | — | 1,479 | |||||||||||
Commodity contract derivatives | — | 6 | 116 | 122 | |||||||||||
Commodity derivatives under FTP(2) | |||||||||||||||
Swap contracts | — | 4 | — | 4 | |||||||||||
Total | $ | — | $ | 1,634 | $ | 116 | $ | 1,750 | |||||||
Notes
(1) Certain investments that are measured at fair value using the net asset value per share (or its equivalent) practical expedient have not been categorized in the fair value hierarchy. The fair value amounts presented in this table are intended to permit reconciliation of the fair value hierarchy to the amounts presented in the consolidated balance sheets.
(2) Due to the right of setoff and method of settlement, TVA elects to record commodity derivatives under the FTP based on its net commodity position with the counterparty or FCM. Deposits are made to TVA's margin cash accounts held with each FCM to offset any net liability positions in full for derivatives that are transacted with FCMs. TVA records currency swaps net of cash collateral received from or paid to the counterparty, to the extent such amount is not recorded in Accounts payable and accrued liabilities. See Note 12 — Offsetting of Derivative Assets and Liabilities.
32
Fair Value Measurements At September 30, 2016 | |||||||||||||||
Quoted Prices in Active Markets for Identical Assets (Level 1) | Significant Other Observable Inputs (Level 2) | Significant Unobservable Inputs (Level 3) | Total | ||||||||||||
Assets | |||||||||||||||
Investments | |||||||||||||||
Equity securities | $ | 196 | $ | — | $ | — | $ | 196 | |||||||
Government debt securities | 88 | 36 | — | 124 | |||||||||||
Corporate debt securities | — | 393 | — | 393 | |||||||||||
Mortgage and asset-backed securities | — | 50 | — | 50 | |||||||||||
Institutional mutual funds | 92 | — | — | 92 | |||||||||||
Forward debt securities contracts | — | 15 | — | 15 | |||||||||||
Private equity funds measured at net asset value(1) | — | — | — | 132 | |||||||||||
Private real estate funds measured at net asset value(1) | — | — | — | 113 | |||||||||||
Commingled funds measured at net asset value(1) | — | — | — | 1,142 | |||||||||||
Total investments | 376 | 494 | — | 2,257 | |||||||||||
Commodity contract derivatives | — | 5 | 4 | 9 | |||||||||||
Total | $ | 376 | $ | 499 | $ | 4 | $ | 2,266 | |||||||
Quoted Prices in Active Markets for Identical Liabilities (Level 1) | Significant Other Observable Inputs (Level 2) | Significant Unobservable Inputs (Level 3) | Total | ||||||||||||
Liabilities | |||||||||||||||
Currency swap(s) (2) | $ | — | $ | 162 | $ | — | $ | 162 | |||||||
Interest rate swaps | — | 1,938 | — | 1,938 | |||||||||||
Commodity contract derivatives | — | 3 | 131 | 134 | |||||||||||
Commodity derivatives under FTP(2) | |||||||||||||||
Swap contracts | — | 9 | — | 9 | |||||||||||
Total | $ | — | $ | 2,112 | $ | 131 | $ | 2,243 | |||||||
Notes
(1) Certain investments that are measured at fair value using the net asset value per share (or its equivalent) practical expedient have not been categorized in the fair value hierarchy. The fair value amounts presented in this table are intended to permit reconciliation of the fair value hierarchy to the amounts presented in the consolidated balance sheets.
(2) Due to the right of setoff and method of settlement, TVA elects to record commodity derivatives under the FTP based on its net commodity position with the counterparty or FCM. Deposits are made to TVA's margin cash accounts held with each FCM to offset any net liability positions in full for derivatives that are transacted with FCMs. TVA records currency swaps net of cash collateral received from or paid to the counterparty, to the extent such amount is not recorded in Accounts payable and accrued liabilities. See Note 12 — Offsetting of Derivative Assets and Liabilities.
33
TVA uses internal valuation specialists for the calculation of its commodity contract derivatives fair value measurements classified as Level 3. Analytical testing is performed on the change in fair value measurements each period to ensure the valuation is reasonable based on changes in general market assumptions. Significant changes to the estimated data used for unobservable inputs, in isolation or combination, may result in significant variations to the fair value measurement reported.
The following table presents a reconciliation of all commodity contract derivatives measured at fair value on a recurring basis using significant unobservable inputs (Level 3):
Fair Value Measurements Using Significant Unobservable Inputs | ||||||||
Commodity Contract Derivatives | ||||||||
Three Months Ended March 31 | Six Months Ended March 31 | |||||||
Balance at beginning of period | $ | (123 | ) | $ | (98 | ) | ||
Net unrealized gains (losses) deferred as regulatory assets and liabilities | (64 | ) | (89 | ) | ||||
Balance at March 31, 2016 | $ | (187 | ) | $ | (187 | ) | ||
Balance at beginning of period | $ | (104 | ) | $ | (127 | ) | ||
Net unrealized gains (losses) deferred as regulatory assets and liabilities | (8 | ) | 15 | |||||
Balance at March 31, 2017 | $ | (112 | ) | $ | (112 | ) | ||
The following table presents quantitative information related to the significant unobservable inputs used in the measurement of fair value of TVA's assets and liabilities classified as Level 3 in the fair value hierarchy:
Quantitative Information about Level 3 Fair Value Measurements | ||||||||||
Fair Value at March 31 2017 | Valuation Technique(s) | Unobservable Inputs | Range | |||||||
Assets | ||||||||||
Commodity contract derivatives | $ | 3 | Pricing model | Coal supply and demand | 0.6 - 0.8 billion tons/year | |||||
Long-term market prices | $11.45 - $109.55/ton | |||||||||
Liabilities | ||||||||||
Commodity contract derivatives | $ | 116 | Pricing model | Coal supply and demand | 0.6 - 0.8 billion tons/year | |||||
Long-term market prices | $11.45 - $109.55/ton | |||||||||
Quantitative Information about Level 3 Fair Value Measurements | ||||||||||
Fair Value at September 30 2016 | Valuation Technique(s) | Unobservable Inputs | Range | |||||||
Assets | ||||||||||
Commodity contract derivatives | $ | 4 | Pricing model | Coal supply and demand | 0.7 - 0.8 billion tons/year | |||||
Long-term market prices | $11.80 - $85.02/ton | |||||||||
Liabilities | ||||||||||
Commodity contract derivatives | $ | 131 | Pricing model | Coal supply and demand | 0.7 - 0.8 billion tons/year | |||||
Long-term market prices | $11.80 - $85.02/ton | |||||||||
34
Other Financial Instruments Not Recorded at Fair Value
TVA uses the methods and assumptions described below to estimate the fair value of each significant class of financial instrument. The fair values of the financial instruments held at March 31, 2017, and September 30, 2016, may not be representative of the actual gains or losses that will be recorded when these instruments mature or are called or presented for early redemption. The estimated values of TVA's financial instruments not recorded at fair value at March 31, 2017, and September 30, 2016, were as follows:
Estimated Values of Financial Instruments Not Recorded at Fair Value | |||||||||||||||||
At March 31, 2017 | At September 30, 2016 | ||||||||||||||||
Valuation Classification | Carrying Amount | Fair Value | Carrying Amount | Fair Value | |||||||||||||
EnergyRight® receivables (including current portion) | Level 2 | $ | 135 | $ | 138 | $ | 141 | $ | 144 | ||||||||
Loans and other long-term receivables, net (including current portion) | Level 2 | $ | 161 | $ | 150 | $ | 141 | $ | 130 | ||||||||
EnergyRight® financing obligation (including current portion) | Level 2 | $ | 156 | $ | 175 | $ | 163 | $ | 183 | ||||||||
Unfunded loan commitments | Level 2 | $ | — | $ | 14 | $ | — | $ | 17 | ||||||||
Membership interest of variable interest entity subject to mandatory redemption (including current portion) | Level 2 | $ | 33 | $ | 42 | $ | 35 | $ | 46 | ||||||||
Long-term outstanding power bonds (including current maturities), net | Level 2 | $ | 22,906 | $ | 26,983 | $ | 22,456 | $ | 28,620 | ||||||||
Long-term debt of variable interest entities (including current maturities), net | Level 2 | $ | 1,217 | $ | 1,353 | $ | 1,234 | $ | 1,468 | ||||||||
Long-term notes payable (including current maturities) | Level 2 | $ | 49 | $ | 49 | $ | 75 | $ | 75 | ||||||||
Due to the short-term maturity of Cash and cash equivalents, Restricted cash and investments, and Short-term debt, net (each considered a Level 1 valuation classification), the carrying amounts of these instruments approximate their fair values.
The fair value for loans and other long-term receivables is estimated by determining the present value of future cash flows using a discount rate equal to lending rates for similar loans made to borrowers with similar credit ratings and for similar remaining maturities, where applicable.
The fair value of long-term debt traded in the public market is determined by multiplying the par value of the debt by the indicative market price at the balance sheet date. The fair value of other long-term debt and membership interests of variable interest entities subject to mandatory redemption is estimated by determining the present value of future cash flows using current market rates for similar obligations, giving effect to credit ratings and remaining maturities.
35
14. Other Income (Expense), Net
Income and expenses not related to TVA’s operating activities are summarized in the following table:
Other Income (Expense), Net | ||||||||||||||||
Three Months Ended March 31 | Six Months Ended March 31 | |||||||||||||||
2017 | 2016 | 2017 | 2016 | |||||||||||||
External services | $ | 5 | $ | 3 | $ | 8 | $ | 7 | ||||||||
Interest income | 6 | 6 | 11 | 12 | ||||||||||||
Gains (losses) on investments | 4 | — | 4 | 3 | ||||||||||||
Miscellaneous | — | (1 | ) | 4 | (2 | ) | ||||||||||
Total other income (expense), net | $ | 15 | $ | 8 | $ | 27 | $ | 20 | ||||||||
15. Benefit Plans
TVA sponsors a qualified defined benefit pension plan ("pension plan") that covers most of its full-time employees hired before July 1, 2014, a qualified defined contribution plan ("401(k) plan") that covers most of its full-time employees, two unfunded post-retirement health care plans that provide for non-vested contributions toward the cost of eligible retirees' medical coverage, other postemployment benefits, such as workers' compensation, and the SERP. The pension plan and the 401(k) plan are administered by a separate legal entity, the TVA Retirement System ("TVARS"), which is governed by its own board of directors (the "TVARS Board").
The components of net periodic benefit cost and other amounts recognized as changes in regulatory assets for the three and six months ended March 31, 2017 and 2016, were as follows:
Components of TVA’s Benefit Plans | ||||||||||||||||||||||||||||||||
For the Three Months Ended March 31 | For the Six Months Ended March 31 | |||||||||||||||||||||||||||||||
Pension Benefits | Other Post-Retirement Benefits | Pension Benefits | Other Post-Retirement Benefits | |||||||||||||||||||||||||||||
2017 | 2016 | 2017 | 2016 | 2017 | 2016 | 2017 | 2016 | |||||||||||||||||||||||||
Service cost | $ | 13 | $ | 34 | $ | 5 | $ | 4 | $ | 30 | $ | 66 | $ | 9 | $ | 8 | ||||||||||||||||
Interest cost | 116 | 142 | 4 | 8 | 232 | 282 | 11 | 15 | ||||||||||||||||||||||||
Expected return on plan assets | (114 | ) | (112 | ) | — | — | (228 | ) | (223 | ) | — | — | ||||||||||||||||||||
Amortization of prior service credit | (24 | ) | (5 | ) | (10 | ) | (2 | ) | (49 | ) | (11 | ) | (11 | ) | (3 | ) | ||||||||||||||||
Recognized net actuarial loss | 120 | 82 | 5 | 1 | 236 | 155 | 7 | 3 | ||||||||||||||||||||||||
Total net periodic benefit cost as actuarially determined | 111 | 141 | 4 | 11 | 221 | 269 | 16 | 23 | ||||||||||||||||||||||||
Amount capitalized due to actions of regulator | (34 | ) | (71 | ) | — | — | (68 | ) | (129 | ) | — | — | ||||||||||||||||||||
Total net periodic benefit cost | $ | 77 | $ | 70 | $ | 4 | $ | 11 | $ | 153 | $ | 140 | $ | 16 | $ | 23 | ||||||||||||||||
TVA contributes to the pension plan such amounts as are necessary on an actuarial basis to provide the pension plan with assets sufficient to meet TVA-funded benefit obligations to be paid to members. TVA contributed $275 million to TVARS in 2016 and expects to contribute $300 million in 2017. As of March 31, 2017, TVA had contributed $150 million to TVARS and expects to contribute the remaining $150 million by September 30, 2017. TVA also contributed $42 million and $20 million to the 401(k) plan during the six months ended March 31, 2017 and 2016, respectively. TVA does not separately set aside assets to fund its other post-retirement benefit plans, but rather funds such benefits on an as-paid basis. TVA provided approximately $17 million and $21 million, net of rebates and subsidies, to other post-retirement benefit plans for the six months ended March 31, 2017 and 2016, respectively. TVA includes its cash contributions to the pension plan in the rate-making formula; accordingly, TVA recognizes pension costs as regulatory assets to the extent that the amount calculated under GAAP as pension expense differs from the amount TVA contributes to the pension plan.
16. Contingencies and Legal Proceedings
Contingencies
Nuclear Insurance. The Price-Anderson Act provides a layered framework of protection to compensate for losses arising from a nuclear event in the United States. For the first layer, all of the NRC nuclear plant licensees, including TVA,
36
purchase $450 million of nuclear liability insurance from American Nuclear Insurers for each plant with an operating license. Funds for the second layer, the Secondary Financial Program, would come from an assessment of up to $127 million from the licensees of each of the 102 NRC licensed reactors in the United States. The assessment for any nuclear accident would be limited to $19 million per year per unit. American Nuclear Insurers, under a contract with the NRC, administers the Secondary Financial Program. With its seven licensed units, TVA could be required to pay a maximum of $891 million per nuclear incident, but it would have to pay no more than $133 million per incident in any one year. When the contributions of the nuclear plant licensees are added to the insurance proceeds of $450 million, over $13.0 billion, including a five percent surcharge for legal expenses, would be available. Under the Price-Anderson Act, if the first two layers are exhausted, the U.S. Congress is required to take action to provide additional funds to cover the additional losses.
TVA carries property, decommissioning, and decontamination insurance of $5.1 billion for its licensed nuclear plants, with up to $2.1 billion available for a loss at any one site, to cover the cost of stabilizing or shutting down a reactor after an accident. Some of this insurance, which is purchased from Nuclear Electric Insurance Limited ("NEIL"), may require the payment of retrospective premiums up to a maximum of approximately $132 million.
TVA purchases accidental outage (business interruption) insurance for TVA’s nuclear sites from NEIL. In the event that an accident covered by this policy takes a nuclear unit offline or keeps a nuclear unit offline, NEIL will pay TVA, after a waiting period, an indemnity (a set dollar amount per week) up to a maximum indemnity of $490 million per unit. This insurance policy may require the payment of retrospective premiums up to a maximum of approximately $37 million.
Decommissioning Costs. TVA recognizes legal obligations associated with the future retirement of certain tangible long-lived assets related primarily to coal-fired generating plants and nuclear generating plants, hydroelectric generating plants/dams, transmission structures, and other property-related assets. See Note 9.
Nuclear Decommissioning. Provision for decommissioning costs of nuclear generating units is based on options prescribed by the NRC procedures to dismantle and decontaminate the facilities to meet the NRC criteria for license termination. At March 31, 2017, the estimated future decommissioning cost of $2.6 billion was included in AROs. The actual decommissioning costs may vary from the derived estimates because of, among other things, changes in current assumptions, such as the assumed dates of decommissioning, changes in regulatory requirements, changes in technology, and changes in the cost of labor, materials, and equipment. Utilities that own and operate nuclear plants are required to use different procedures in calculating nuclear decommissioning costs under GAAP than those that are used in calculating nuclear decommissioning costs when reporting to the NRC. The two sets of procedures produce different estimates for the costs of decommissioning primarily because of differences in the underlying assumptions.
TVA maintains a NDT to provide funding for the ultimate decommissioning of its nuclear power plants. See Note 13. TVA monitors the value of its NDT and believes that, over the long term and before cessation of nuclear plant operations and commencement of decommissioning activities, adequate funds from investments and additional contributions, if necessary, will be available to support decommissioning. TVA’s operating nuclear power units are licensed through 2033 - 2055, depending on the unit. It may be possible to extend the operating life of some of the units with approval from the NRC.
Non-Nuclear Decommissioning. The estimated future non-nuclear decommissioning ARO was $1.6 billion at March 31, 2017. This decommissioning cost estimate involves estimating the amount and timing of future expenditures and making judgments concerning whether or not such costs are considered a legal obligation. Estimating the amount and timing of future expenditures includes, among other things, making projections of the timing and duration of the asset retirement process and how costs will escalate with inflation. The actual decommissioning costs may vary from the derived estimates because of changes in current assumptions, such as the assumed dates of decommissioning, changes in regulatory requirements, changes in technology, and changes in the cost of labor, materials, and equipment.
TVA maintains an ART to help fund the ultimate decommissioning of its power assets. See Note 13. Estimates involved in determining if additional funding will be made to the ART include inflation rate, rate of return projections on the fund investments, and the planned use of other sources to fund decommissioning costs.
Environmental Matters. TVA’s power generation activities, like those across the utility industry and in other industrial sectors, are subject to most federal, state, and local environmental laws and regulations. Major areas of regulation affecting TVA’s activities include air quality control, water quality control, and management and disposal of solid and hazardous wastes. In the future, regulations in all of these areas are expected to become more stringent. Regulations are also expected to apply to new emissions and sources, with a particular emphasis on climate change, renewable generation, and energy efficiency.
TVA has incurred, and expects to continue to incur, substantial capital and operating and maintenance costs to comply with evolving environmental requirements primarily associated with, but not limited to, the operation of TVA’s coal-fired generating units. Environmental requirements placed on the operation of TVA’s coal-fired and other generating units will likely continue to become more restrictive over time. Litigation over emissions or discharges from coal-fired generating units is also occurring, including litigation against TVA. Failure to comply with environmental and safety laws can result in TVA being subject
37
to enforcement actions, which can lead to the imposition of significant civil liability, including fines and penalties, criminal sanctions, and/or the shutting down of non-compliant facilities.
TVA estimates that compliance with existing and future Clean Air Act ("CAA") requirements (excluding greenhouse gas ("GHG") requirements) could lead to costs of approximately $300 million from 2017 to 2023, which include future clean air controls, existing controls capital projects, and air operations and maintenance projects. The majority of the $300 million is expected to be spent by 2018 on new controls at Gallatin and Shawnee. TVA also estimates additional expenditures of $1.1 billion from 2017 to 2022 relating to TVA’s coal combustion residuals ("CCR") conversion program as well as expenditures of approximately $500 million from 2017 to 2024 relating to compliance with Clean Water Act requirements. Future costs could differ from these estimates if new environmental laws or regulations become applicable to TVA or the facilities it operates, or if existing environmental laws or regulations are revised or reinterpreted. There could also be costs that cannot reasonably be predicted at this time, due to uncertainty of actions, that could increase these estimates.
Liability for releases and cleanup of hazardous substances is primarily regulated by the federal Comprehensive Environmental Response, Compensation, and Liability Act, and other federal and parallel state statutes. In a manner similar to many other industries and power systems, TVA has generated or used hazardous substances over the years.
On November 22, 2016, the United States District Court for the Eastern District of North Carolina entered a consent decree that resolved all issues associated with the Ward Transformer site. TVA settled all its remaining potential liability for $10 thousand.
TVA operations at some facilities have resulted in contamination that TVA is addressing. At March 31, 2017, and September 30, 2016, respectively, TVA’s estimated liability for cleanup and similar environmental work for those sites for which sufficient information is available to develop a cost estimate was approximately $27 million and $23 million on a non-discounted basis, and was included in Accounts payable and accrued liabilities and Other long-term liabilities on the Consolidated Balance Sheets.
Legal Proceedings
From time to time, TVA is party to or otherwise involved in lawsuits, claims, proceedings, investigations, and other legal matters ("Legal Proceedings") that have arisen in the ordinary course of conducting TVA's activities, as a result of a catastrophic event or otherwise.
General. At March 31, 2017, TVA had accrued $40 million of probable losses with respect to Legal Proceedings. Of the accrued amount, $16 million is included in Other long-term liabilities and $24 million is included in Accounts payable and accrued liabilities. TVA is currently unable to estimate any amount or any range of amounts of reasonably possible losses, and no assurance can be given that TVA will not be subject to significant additional claims and liabilities. If actual liabilities significantly exceed the estimates made, TVA's results of operations, liquidity, and financial condition could be materially adversely affected.
Environmental Agreements. In April 2011, TVA entered into two substantively similar agreements, one with the Environmental Protection Agency ("EPA") and the other with Alabama, Kentucky, North Carolina, Tennessee, and three environmental advocacy groups: the Sierra Club, the National Parks Conservation Association, and Our Children's Earth Foundation (collectively, the "Environmental Agreements”). They became effective in June 2011. Under the Environmental Agreements, TVA committed to (1) retire on a phased schedule 18 coal-fired units with a combined summer net dependable capability of 2,200 MW, (2) control, convert, or retire additional coal-fired units with a combined summer net dependable capability of 3,500 MW, (3) comply with annual, declining emission caps for SO2 and NOx, (4) invest $290 million in certain TVA environmental projects, (5) provide $60 million to Alabama, Kentucky, North Carolina, and Tennessee to fund environmental projects, and (6) pay civil penalties of $10 million. In exchange for these commitments, most past claims against TVA based on alleged New Source Review and associated violations were waived and cannot be brought against TVA. Future claims, including those for sulfuric acid mist and GHG emissions, can still be brought against TVA, and claims for increases in particulates can also be pursued at many of TVA’s coal-fired units. Additionally, the Environmental Agreements do not address compliance with new laws and regulations or the cost associated with such compliance.
Case Involving Tennessee Valley Authority Retirement System. In March 2010, eight current and former participants in and beneficiaries of TVARS filed suit in the United States District Court for the Middle District of Tennessee challenging the TVARS Board's 2009 decision to amend the TVARS Rules and Regulations (“Rules”) in exchange for a $1.0 billion contribution from TVA. The changes approved by the TVARS Board (1) suspended the TVA contribution requirements for 2010 through 2013, (2) reduced the calculation for cost-of-living adjustments ("COLAs") for CY 2010 through CY 2013, (3) reduced the interest crediting rate for the fixed fund accounts, and (4) increased the eligibility age to receive COLAs from age 55 to 60. The plaintiffs alleged that these changes violated their constitutional rights (due process, equal protection, and property rights), violated the Administrative Procedure Act, and violated the substantive and procedural components of an anti-cutback provision in the Rules. TVA and the plaintiffs filed cross motions for summary judgment. In August 2015, the court granted TVA’s motion for summary judgment and dismissed the case with prejudice. In September 2015, the plaintiffs appealed this decision to the United States Court of Appeals for the Sixth Circuit (the "Sixth Circuit"). On August 12, 2016, the Sixth Circuit held that the plaintiffs’ rights
38
were not violated because COLAs are not vested benefits. A few other issues were remanded to the district court for further proceedings. On March 2, 2017, the district court granted TVA's motion for a judgment on the administrative record and dismissed all the remaining claims in this case. On March 31, 2017, the plaintiffs appealed the district court's decision to the Sixth Circuit.
Cases Involving Gallatin Fossil Plant CCR Facilities. In January 2015, the State of Tennessee filed a lawsuit against TVA in the Chancery Court for Davidson County, Tennessee. The lawsuit alleges that waste materials have been released into waters of the state from CCR facilities at Gallatin Fossil Plant ("Gallatin") in violation of the Tennessee Water Quality Control Act and the Tennessee Solid Waste Disposal Act. TDEC is seeking injunctive relief, which could include an order requiring TVA to relocate the CCR facilities. TDEC is also requesting civil penalties of up to $17,000 per day for each day TVA is found to have violated the statutes. In February 2015, the court issued an order allowing the Tennessee Scenic Rivers Association ("TSRA") and the Tennessee Clean Water Network ("TCWN") to intervene in the case. In January 2016, the court issued an agreed temporary injunction proposed by the State of Tennessee and TVA requiring TVA to conduct further environmental studies at Gallatin to determine the extent of soil, surface water, and groundwater contamination by CCR material at the site and to support the development of any necessary corrective action plan in cooperation with the other parties. Pursuant to the injunction, TVA submitted an Environmental Investigation Plan ("EIP") to the State of Tennessee on March 18, 2016. Following State comments on the draft EIP, TVA submitted a revised EIP to the State on June 20, 2016. On June 30, 2016, the State provided conditional approval to proceed with a portion of the investigation. The State subsequently provided additional approvals to proceed with other portions of the investigation. Trial in this action is scheduled to begin in December 2017.
In April 2015, TSRA and TCWN filed a separate lawsuit against TVA in the United States District Court for the Middle District of Tennessee alleging that waste materials have been released into the Cumberland River from CCR facilities at Gallatin in violation of the Clean Water Act. The plaintiffs are seeking injunctive relief, which could include an order requiring TVA to relocate the CCR facilities. The plaintiffs are also requesting civil penalties of up to $37,500 per violation per day. In June 2015, TVA filed a motion to dismiss the majority of the claims in the federal case based on the State of Tennessee’s diligent prosecution of substantially overlapping claims in its state court action. Since then, TVA has filed several other motions seeking to dismiss all claims in the case on other bases as well. In September 2016, the court ruled on all pending motions. The court held, among other things, that (1) TVA could be liable for civil penalties under the Clean Water Act and (2) the lawsuit could proceed to trial but the court could consider issues only to the extent that they are not being considered in the state court action. In December 2016, the court denied TVA's motion to reconsider the court's decision that TVA could be liable for civil penalties. Trial in this action began on January 30, 2017, and concluded February 2, 2017. The parties made their post-trial filings on April 14, 2017, and the district court is expected to render its decision later this calendar year.
The costs associated with relocating the CCR facilities if required to do so by a court could be material, as could be any civil penalties TVA is ordered to pay.
Administrative Proceeding Regarding Browns Ferry Nuclear Plant Extended Power Uprate. In September 2016, the Bellefonte Efficiency and Sustainability Team and Mothers Against Tennessee River Radiation requested a hearing and sought to intervene in TVA’s license amendment request for extended power uprates at Browns Ferry Nuclear Plant. The petitioners contend that TVA's application did not correctly report the potential risk from operating at increased power levels. TVA and the NRC staff filed answers opposing the petition to intervene in October 2016. The ASLB rejected the petition to intervene in November 2016. The petitioners appealed the ASLB's decision to the NRC in November 2016. TVA and the NRC staff filed answers opposing the appeal in December 2016, and the petitioners have filed their response. On April 4, 2017, the NRC affirmed the decision of the ASLB, denying the petition to intervene. The petitioners have the right to appeal this decision to a federal district court.
Bull Run Fossil Plant Clean Air Act Permit. In September 2015, the Sierra Club and Environmental Integrity Project filed a petition with the EPA requesting that the EPA object to the CAA renewal permit issued by TDEC to TVA for operations at Bull Run. The petitioners alleged that the permit contained impermissibly lax monitoring requirements for opacity. In February 2016, the petitioners sued the EPA for not responding to the petition in a timely manner. In August 2016, the United States District Court for the District of Columbia entered a consent decree requiring the EPA to respond to the petition by November 10, 2016. On November 10, 2016, the EPA granted the petition and ordered TDEC to revise the permit to assure compliance with the opacity limits. TDEC has revised the permit in accordance with the EPA's order and released it for public comments on February 7, 2017. No comments were received and TDEC issued a final permit, which became effective on April 10, 2017. The final permit provides that compliance with the particulate matter ("PM") limit is deemed sufficient to demonstrate compliance with the opacity limit. TVA will continue to meet the PM limit in the permit.
Gallatin Fossil Plant Clean Air Act Permit. In August 2016, the Sierra Club filed a petition with the EPA requesting that the EPA object to the CAA renewal permit issued by TDEC to TVA for operations at Gallatin. The petition alleges that the permit (1) contains compliance evaluation requirements for opacity, particulate matter, and fugitive dust that are not as stringent as required, (2) includes allowances for startup, shutdown, and malfunctions that are inconsistent with the CAA, (3) fails to include reporting requirements to ensure compliance with the Environmental Agreements, and (4) contains impermissibly high SO2 emission limits. The EPA has not yet acted on the petition.
39
ITEM 2. MANAGEMENT’S DISCUSSION AND ANALYSIS OF FINANCIAL CONDITION AND RESULTS OF OPERATIONS
(Dollars in millions except where noted)
Management’s Discussion and Analysis of Financial Condition and Results of Operations ("MD&A") explains the results of operations and general financial condition of the Tennessee Valley Authority ("TVA"). The MD&A should be read in conjunction with the accompanying unaudited consolidated financial statements and TVA's Annual Report on Form 10-K for the fiscal year ended September 30, 2016 (the “Annual Report”).
Executive Overview
TVA’s net income for the three months and six months ended March 31, 2017, was $211 million and $313 million, respectively, as compared with net income of $318 million and $281 million for the same periods of 2016. As is typical for electric utilities, weather is a primary driver of TVA’s sales. TVA’s service territory experienced one of the warmest “cold seasons” particularly during the three months ended March 31, 2017, and to a lesser extent the six months ended March 31, 2017, compared to more normal weather during the same periods of 2016, resulting in lower energy sales. Sales to directly served customers were higher due to increased production at certain facilities, partially offsetting some of the decrease in electricity demand from local power company customers of TVA ("LPCs"). Although sales were lower for both the three months and the six months ended March 31, 2017, as compared to the same periods of the prior year, operating revenue decreased only slightly for the three months ended March 31, 2017, and increased five percent for the six months ended March 31, 2017, as compared to the same periods of the prior year due to increased fuel cost recovery and the base rate increase effective October 1, 2016.
Total operating expenses increased slightly during the three months and six months ended March 31, 2017, as compared to the same periods of the prior year primarily due to higher fuel and purchased power expense as a result of changes in generation mix, including significantly less hydroelectric generation, and higher natural gas prices. Operating and maintenance expense increased slightly during the three months and six months ended March 31, 2017, as compared to same periods of the prior year primarily due to the timing and duration of outages and increases in retirement benefit expenses. These increases were partially offset by decreases in inventory and project write-offs. For a more detailed discussion related to revenues and expenses, please see Results of Operations.
TVA’s power generating portfolio continues to become cleaner and more diverse with two new generating sources declared commercially operational during the fiscal year to date. On October 19, 2016, TVA’s Watts Bar Nuclear Plant ("Watts Bar") Unit 2 became the first new U.S. nuclear generating unit to be brought on line in the 21st century, and on April 7, 2017, the natural gas combined cycle facility at the Paradise Fossil Plant ("Paradise") site was completed. The combined cycle facility at the Allen Fossil Plant ("Allen") site is expected to be completed in 2018. With the completion of the new Paradise facility, the coal-fired Paradise Units 1 and 2 were retired on April 15, 2017. TVA also expanded its renewable energy supply when the River Bend Solar Energy Center located in northern Alabama was commissioned in November 2016.
Work on the Gallatin Fossil Plant ("Gallatin") selective catalytic reduction systems ("SCR") continues with the first two SCRs expected to be completed in the spring of 2017 and the second two SCRs expected to be completed in the fall of 2017. Work on the emissions reductions for Units 1 and 4 at the Shawnee Fossil Plant ("Shawnee") is underway, and scrubbers and SCRs are expected to be operational in the fall of 2017. Ongoing work around flood control preparedness and dam safety initiatives, including remediation efforts at Boone Dam, are continuing in accordance with TVA’s mission of environmental stewardship.
With the completion of Watts Bar Unit 2 and the two natural gas-fired generation facilities at the Paradise and Allen sites, TVA does not foresee needing additional large, baseload generation units for the next decade. TVA projects minimal, if any, sales growth based in part on market changes impacting electric utilities, including technological advances, evolving customer behaviors, increased individual, government, and business use of distributed generation, the entrance of non-traditional competitors into the power delivery system markets, and regulatory policies. It is not known at this time what effect the potential relaxation of certain energy efficiency standards by the new U.S. Presidential Administration may have on future demand. While overall demand for power is currently declining, TVA is experiencing some growth in demand from its commercial and industrial customers due in part to the improving economy and TVA’s economic development efforts to bring new business into the Tennessee Valley.
TVA’s power demand projections factored into the decision to sell the Bellefonte Nuclear Plant ("Bellefonte") site. TVA entered into a contract on November 14, 2016, to sell substantially all of its Bellefonte property. TVA is also exploring options for repurposing other property, including its Muscle Shoals, Alabama property. TVA continues to work to align its real estate portfolio with its strategic direction while contributing towards TVA’s mission of economic development in the Tennessee Valley.
TVA’s strong financial position in 2016 has continued into 2017. TVA has been able to fund capital projects primarily from operating funds rather than additional debt and anticipates continuing to generate sufficient operating funds to avoid additional debt or even reduce debt in coming periods, as fewer major projects are planned.
40
Results of Operations
Sales of Electricity
The following tables compare TVA’s energy sales for the three and six months ended March 31, 2017 and 2016:
Sales of Electricity | ||
Three Months Ended March 31 | ||
(millions of kWh) | ||
Sales of Electricity | ||
Six Months Ended March 31 | ||
(millions of kWh) | ||
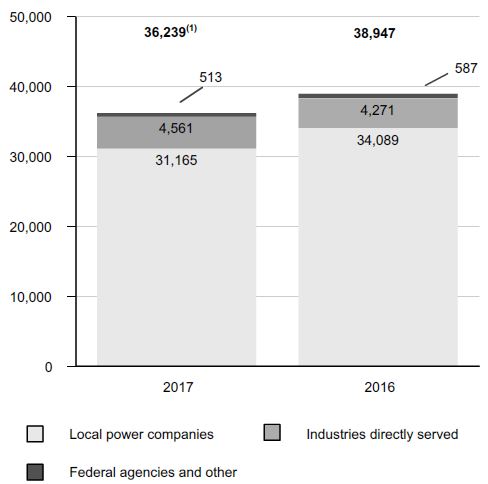
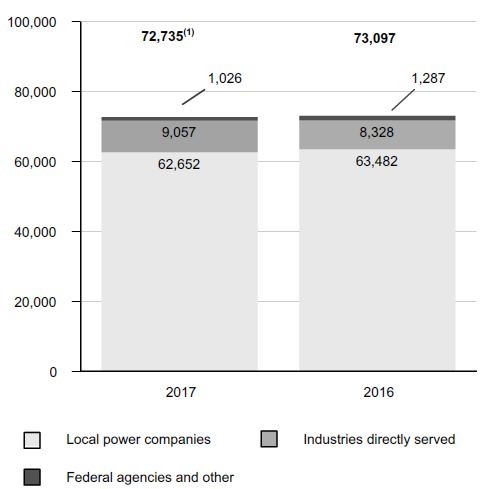
Note
(1) Includes approximately 262 million kWh and 799 million kWh, respectively, for the three and six months ended March 31, 2017, of pre-commercial generation at Watts Bar Unit 2 and Paradise Combined Cycle Plant. See Note 1 — Pre-Commercial Plant Operations.
TVA uses degree days to measure the impact of weather on its power operations since weather affects both demand and market prices for electricity. Degree days measure the extent to which average temperatures in the five largest cities in TVA's service area vary from 65 degrees Fahrenheit.
Degree Day Variation from Normal |
Three Months Ended March 31 |
çççç Below Normal Above Normal èèèè |
Degree Day Variation from Normal |
Six Months Ended March 31 |
çççç Below Normal Above Normal èèèè |
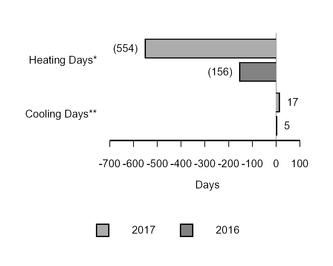
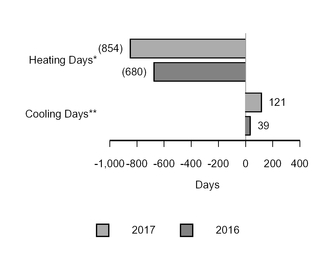
Notes
* Normal heating degree days for the three and six months ended March 31, 2017, were 1,813 and 3,115, respectively. Normal heating degree days for the three and six months ended March 31, 2016, were 1,834 and 3,136, respectively. This calculation is generally updated every five years in order to incorporate data for the then-most-recent 30 years. It was last updated in 2011. The 2016 Normal Heating Degree days differ from 2017 due to the occurrence of a leap year in 2016.
** Normal cooling degree days for the three and six months ended both March 31, 2017 and March 31, 2016, were 12 and 79, respectively. This calculation is generally updated every five years in order to incorporate data for the then-most-recent 30 years. It was last updated in 2011.
41
Sales of electricity decreased approximately seven percent for the three months ended March 31, 2017, as compared to same period in the prior year, primarily due to a decrease in sales volume for LPCs driven primarily by a 25 percent decrease in heating degree days. Additionally, a decrease in sales to federal agencies and other occurred primarily as a result of a decrease in volume from federal agencies, resulting from a decrease in the level of testing at a research facility. Partially offsetting these decreases was an increase in sales to industries directly served as a result of increased production in certain sectors to meet customer demands.
Sales of electricity decreased approximately one percent for the six months ended March 31, 2017, as compared to same period in the prior year, primarily due to decreased sales volume for LPCs driven primarily by an eight percent decrease in heating degree days. Additionally, a decrease in sales to federal agencies and other occurred primarily as a result of a decrease in off-system sales, as TVA had less excess generation available for sale to the market as compared to the prior year. Partially offsetting these decreases was an increase in sales to industries directly served as a result of increased production in certain sectors to meet customer demands.
Financial Results
The following table compares operating results for the three and six months ended March 31, 2017 and 2016:
Summary Consolidated Statements of Operations | ||||||||||||||||||||||
Three Months Ended March 31 | Six Months Ended March 31 | |||||||||||||||||||||
2017 | 2016 | Percent Change | 2017 | 2016 | Percent Change | |||||||||||||||||
Operating revenues | $ | 2,547 | $ | 2,571 | (0.9 | )% | $ | 5,093 | $ | 4,851 | 5.0 | % | ||||||||||
Operating expenses | 2,013 | 1,982 | 1.6 | % | 4,130 | 4,034 | 2.4 | % | ||||||||||||||
Operating income | 534 | 589 | (9.3 | )% | 963 | 817 | 17.9 | % | ||||||||||||||
Other income, net | 15 | 8 | 87.5 | % | 27 | 20 | 35.0 | % | ||||||||||||||
Interest expense, net | 338 | 279 | 21.1 | % | 677 | 556 | 21.8 | % | ||||||||||||||
Net income (loss) | $ | 211 | $ | 318 | (33.6 | )% | $ | 313 | $ | 281 | 11.4 | % | ||||||||||
Operating Revenues. Operating revenues for the three and six months ended March 31, 2017 and 2016, consisted of the following:
Operating Revenues | ||
Three Months Ended March 31 | ||
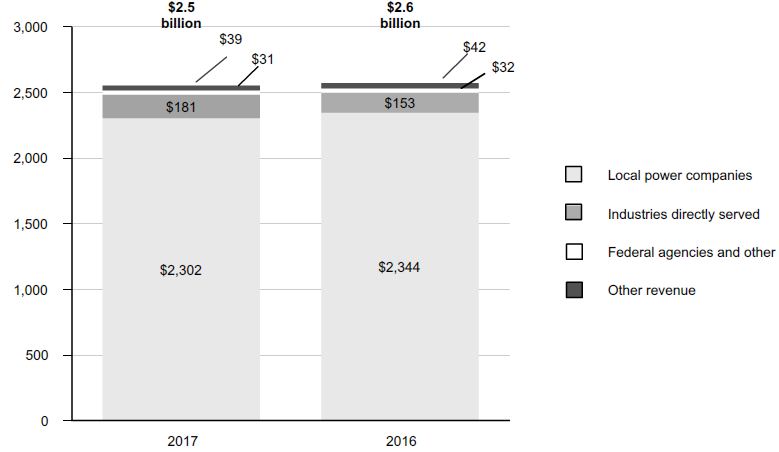
42
Operating Revenues | ||
Six Months Ended March 31 | ||
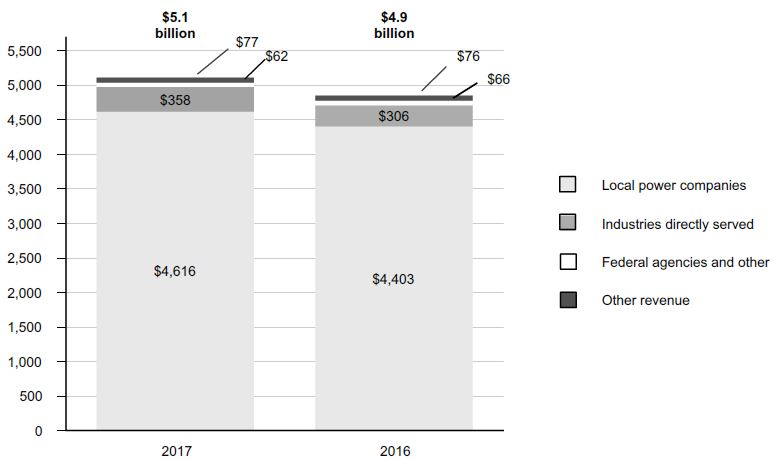
Note
The 2017 amounts in the charts above exclude contra-revenue amounts of approximately $6 million and $20 million, respectively, for the three months and six months ended March 31, 2017, representing revenue capitalized during pre-commercial operations at Watts Bar Unit 2 and Paradise Combined Cycle Plant. See Note 1 — Pre-Commercial Plant Operations.
TVA's rate structures provide price signals intended to reflect higher cost periods to serve LPCs and their end-use customers. Under these structures, weather can positively or negatively impact both volume and effective rates. This is because the wholesale structure includes two components: a demand charge and an energy charge. The demand charge is based on the customer's peak monthly usage and increases as the peak increases. The energy charge is based on the kWhs used by the customer. The rate structures also include a separate fuel rate that includes the costs of natural gas, fuel oil, purchased power, coal, emission allowances, nuclear fuel, and other fuel-related commodities; realized gains and losses on derivatives purchased to hedge the costs of such commodities; and tax equivalents associated with the fuel cost adjustments.
The changes in components of operating revenues for the three and six months ended March 31, 2017, compared to the three and six months ended March 31, 2016, are as follows:
Three Months Ended March 31 | Six Months Ended March 31 | ||||||||||||||||||||||
2017 | 2016 | Change | 2017 | 2016 | Change | ||||||||||||||||||
Base revenue | $ | 1,775 | (1) | $ | 1,844 | $ | (69 | ) | $ | 3,491 | (1) | $ | 3,405 | $ | 86 | ||||||||
Fuel cost recovery | 732 | 684 | 48 | 1,523 | 1,365 | 158 | |||||||||||||||||
Off-system sales | 1 | 1 | — | 2 | 5 | (3 | ) | ||||||||||||||||
Revenue from sales of electricity | 2,508 | 2,529 | (21 | ) | 5,016 | 4,775 | 241 | ||||||||||||||||
Other revenue | 39 | 42 | (3 | ) | 77 | 76 | 1 | ||||||||||||||||
Total operating revenues | $ | 2,547 | $ | 2,571 | $ | (24 | ) | $ | 5,093 | $ | 4,851 | $ | 242 | ||||||||||
Note
(1) Includes the impact of revenue being capitalized during precommercial operations of approximately $6 million and $20 million for the three months and six months ended March 31, 2017, respectively, at Watts Bar Unit 2 and Paradise Combined Cycle Plant. See Note 1 — Pre-Commercial Plant Operations.
Operating revenues decreased $24 million for the three months ended March 31, 2017, as compared to the same period of the prior year, primarily due to a $69 million decrease in base revenue. The $69 million decrease in base revenue was predominantly driven by a decrease of $168 million resulting from lower sales volume partially offset by an increase of $106 million attributable to higher effective rates during the three months ended March 31, 2017, as compared to the same period of the prior year, due to the base rate adjustment that became effective October 1, 2016. Partially offsetting this decrease in base revenue were a $48 million increase in fuel cost recovery revenues and the capitalization of approximately $6 million of revenue resulting from pre-commercial generation at Paradise Combined Cycle Plant. See Note 1 — Pre-Commercial Plant Operations. The $48 million increase in fuel cost recovery revenues reflects a $95 million increase attributable to higher fuel rates and a $47
43
million decrease attributable to lower energy sales. The higher fuel rates experienced were primarily driven by higher market prices for natural gas and a change in the mix of generation resources, including significantly less hydroelectric generation.
Operating revenues increased $242 million for the six months ended March 31, 2017, as compared to the same period of the prior year, primarily due to an $86 million increase in base revenue and a $158 million increase in fuel cost recovery revenues. The $86 million increase in base revenue was predominantly driven by an increase of $149 million resulting from higher effective rates during the six months ended March 31, 2017, as compared to the same period of the prior year, resulting from the base rate adjustment that became effective October 1, 2016, which was partially offset by a decrease of $41 million resulting from lower sales volume. Partially offsetting this increase in base revenue was the capitalization of approximately $20 million of revenue resulting from pre-commercial generation at Watts Bar Unit 2 and Paradise Combined Cycle Plant. See Note 1 — Pre-Commercial Plant Operations. The $158 million increase in fuel cost recovery revenues reflects a $162 million increase attributable to higher fuel rates and a $4 million decrease attributable to lower energy sales. The higher fuel rates experienced were primarily driven by higher market prices for natural gas and a change in the mix of generation resources, including significantly less hydroelectric generation.
Operating Expenses. Operating expenses for the three and six months ended March 31, 2017 and 2016, consisted of the following:
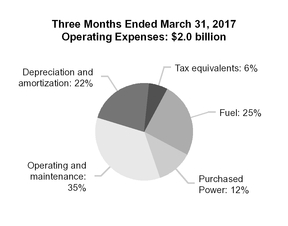
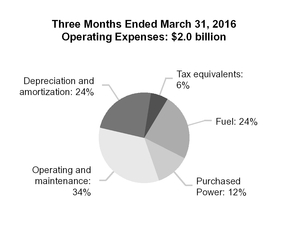
44
Three Months Ended March 31, 2017, Compared to Three Months Ended March 31, 2016
The following chart summarizes TVA's net generation and purchased power in millions of kWh by generating source for the periods indicated:
Power Supply from TVA-Operated Generation Facilities and Purchased Power | ||||||||||||||||||
Three Months Ended March 31 | ||||||||||||||||||
2017 | 2016 | |||||||||||||||||
kWh (millions) | Percent of Power Supply | kWh (millions) | Percent of Power Supply | Change | Percentage Change | |||||||||||||
Coal-fired | 8,073 | 22 | % | 11,153 | 28 | % | (3,080 | ) | (28 | )% | ||||||||
Nuclear | 14,931 | 41 | % | 11,785 | 30 | % | 3,146 | 27 | % | |||||||||
Hydroelectric | 3,088 | 8 | % | 4,898 | 12 | % | (1,810 | ) | (37 | )% | ||||||||
Natural gas and/or oil-fired(1) | 5,892 | 16 | % | 6,285 | 16 | % | (393 | ) | (6 | )% | ||||||||
Total TVA-operated generation facilities | 31,984 | 87 | % | 34,121 | 86 | % | (2,137 | ) | (6 | )% | ||||||||
Purchased power (non-renewable)(2) | 2,720 | 7 | % | 2,871 | 7 | % | (151 | ) | (5 | )% | ||||||||
Purchased power (renewable)(3) | 2,119 | 6 | % | 2,704 | 7 | % | (585 | ) | (22 | )% | ||||||||
Total purchased power | 4,839 | 13 | % | 5,575 | 14 | % | (736 | ) | (13 | )% | ||||||||
Total power supply | 36,823 | 100 | % | 39,696 | 100 | % | (2,873 | ) | (7 | )% | ||||||||
Notes
(1) The natural gas and/or oil-fired amount for the three months ended March 31, 2017, includes approximately 262 million kWh of pre-commercial generation at Paradise Combined Cycle Plant. See Note 1 — Pre-Commercial Plant Operations.
(2) Purchased power (non-renewable) includes generation from Caledonia Combined Cycle Plant, which is currently a leased facility operated by TVA. Generation from Caledonia Combined Cycle Plant was 923 million kWh and 1,013 million kWh for the three months ended March 31, 2017 and 2016, respectively.
(3) Purchased power (renewable) includes power purchased from the following renewable sources: hydroelectric, solar, wind, and cogeneration.
Fuel |
Fuel expense increased $19 million for the three months ended March 31, 2017, as compared to the same period of the prior year. The impact of higher effective fuel rates, driven by changes in the mix of generation resources, including significantly less hydroelectric generation, and higher market prices for natural gas, contributed approximately $53 million to the increase. As an indication of the general market direction, the average Henry Hub natural gas spot price for the three months ended March 31, 2017 was approximately 52 percent higher than the price for the same period of the prior year. Partially offsetting this increase was a $33 million decrease in fuel expense driven by a 6 percent decrease in generation from TVA-owned resources. |
Purchased Power |
Purchased power expense increased $7 million for the three months ended March 31, 2017, as compared to the same period of the prior year. The impact of higher effective fuel rates, driven by changes in the mix of generation resources and higher market prices for natural gas, contributed approximately $41 million to the increase. This increase was partially offset by a decrease of $33 million in purchased power expense primarily due to a 13 percent decrease in the volume of power purchased. |
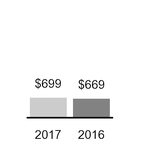
Operating and Maintenance |
Operating and maintenance expense increased $30 million for the three months ended March 31, 2017, as compared to the same period of the prior year. This was due primarily to an increase in planned nuclear refueling outage days which resulted in additional planned nuclear refueling outage expense of $23 million for the three months ended March 31, 2017, as compared to the same period of the prior year. Additionally, retirement benefit costs increased $17 million as a result of benefit plan amendments that became effective October 1, 2016. Partially offsetting these increases in operating and maintenance expense was a $8 million decrease in inventory and project write-offs. |
45
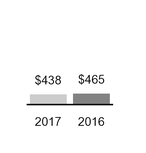
Depreciation and Amortization |
Depreciation and amortization expense decreased $27 million for the three months ended March 31, 2017, as compared to the same period of the prior year. Implementation of a new depreciation study during the first quarter of 2017 resulted in approximately $56 million less depreciation expense. The decrease in depreciation expense as a result of the new depreciation rates, is primarily attributable to the use of TVA's current generation plans, which resulted in changes in retirement date assumptions for coal-fired plants and changes in the estimated service lives for transmission assets. See Note 1 — Depreciation. In addition, the retirement of Colbert Fossil Plant ("Colbert") Units 1-4 in March 2016 contributed $17 million to the decrease. Partially offsetting these decreases was an increase of approximately $45 million primarily from net additions to Completed plant, including a $33 million increase as the result of placing Watts Bar Unit 2 into service during the first quarter. |
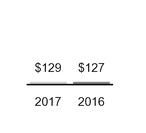
Tax Equivalents |
Tax equivalents expense increased $2 million for the three months ended March 31, 2017, as compared to the same period of the prior year. This change primarily reflects an increase in the accrued tax equivalent expense related to the fuel cost adjustment mechanism, which is equal to five percent of the fuel cost adjustment mechanism revenues and increased for the three months ended March 31, 2017, as compared to the same period of the prior year. |
Six Months Ended March 31, 2017, Compared to Six Months Ended March 31, 2016
The following chart summarizes TVA's net generation and purchased power in millions of kWh by generating source for the periods indicated:
Power Supply from TVA-Operated Generation Facilities and Purchased Power | ||||||||||||||||||
Six Months Ended March 31 | ||||||||||||||||||
2017 | 2016 | |||||||||||||||||
kWh (millions) | Percent of Power Supply | kWh (millions) | Percent of Power Supply | Change | Percentage Change | |||||||||||||
Coal-fired | 18,264 | 25 | % | 19,657 | 27 | % | (1,393 | ) | (7 | )% | ||||||||
Nuclear(1) | 30,185 | 41 | % | 24,144 | 32 | % | 6,041 | 25 | % | |||||||||
Hydroelectric | 4,780 | 6 | % | 9,429 | 13 | % | (4,649 | ) | (49 | )% | ||||||||
Natural gas and/or oil-fired(2) | 11,220 | 15 | % | 11,196 | 15 | % | 24 | — | % | |||||||||
Total TVA-operated generation facilities | 64,449 | 87 | % | 64,426 | 87 | % | 23 | — | % | |||||||||
Purchased power (non-renewable)(3) | 5,867 | 8 | % | 4,600 | 6 | % | 1,267 | 28 | % | |||||||||
Purchased power (renewable)(4) | 3,624 | 5 | % | 5,493 | 7 | % | (1,869 | ) | (34 | )% | ||||||||
Total purchased power | 9,491 | 13 | % | 10,093 | 13 | % | (602 | ) | (6 | )% | ||||||||
Total power supply | 73,940 | 100 | % | 74,519 | 100 | % | (579 | ) | (1 | )% | ||||||||
Notes
(1) The nuclear amount for the six months ended March 31, 2017, includes approximately 495 million kWh of pre-commercial generation at Watts Bar Unit 2. See Note 1 — Pre-Commercial Plant Operations.
(2) The natural gas and/or oil-fired amount for the six months ended March 31, 2017, includes approximately 304 million kWh of pre-commercial generation at Paradise Combined Cycle Plant. See Note 1 — Pre-Commercial Plant Operations.
(3) Purchased power (non-renewable) includes generation from Caledonia Combined Cycle Plant, which is currently a leased facility operated by TVA. Generation from Caledonia Combined Cycle Plant was 1,958 million kWh and 1,827 million kWh for the six months ended March 31, 2017 and 2016, respectively.
(4) Purchased power (renewable) includes power purchased from the following renewable sources: hydroelectric, solar, wind, and cogeneration.
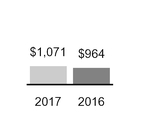
Fuel |
Fuel expense increased $107 million for the six months ended March 31, 2017, as compared to the same period of the prior year. This increase was primarily due to higher effective fuel rates driven by changes in the mix of generation resources, including significantly less hydroelectric generation, and higher market prices for natural gas. As an indication of the general market direction, the average Henry Hub natural gas spot price for the six months ended March 31, 2017, was approximately 47 percent higher than the price for the same period of the prior year. |
46
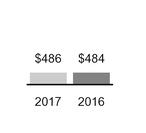
Purchased Power |
Purchased power expense was generally flat for the six months ended March 31, 2017, as compared to the same period of the prior year. The impact of higher effective fuel rates, driven by changes in the mix of generation resources and higher market prices for natural gas, was almost entirely offset by a decrease in purchased power expense primarily due to a 6 percent decrease in the volume of power purchased. |
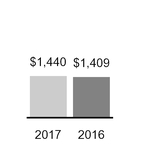
Operating and Maintenance |
Operating and maintenance expense increased $31 million for the six months ended March 31, 2017, as compared to the same period of the prior year. This was due primarily to an increase in planned nuclear refueling outage days which resulted in additional planned nuclear refueling outage expense of $40 million for the six months ended March 31, 2017, as compared to the same period of the prior year. Additionally, retirement benefit costs increased $35 million as a result of benefit plan amendments that became effective October 1, 2016. These increases in operating and maintenance expense were partially offset by a $20 million decrease in inventory and project write-offs and a $19 million decrease in planned outage expense due primarily to the timing of planned coal outages. |
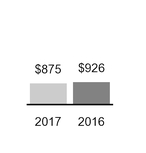
Depreciation and Amortization |
Depreciation and amortization expense decreased $51 million for the six months ended March 31, 2017, as compared to the same period of the prior year. Implementation of a new depreciation study during the first quarter of 2017 resulted in approximately $112 million less depreciation expense. The decrease in depreciation expense, as a result of the new depreciation rates, is primarily attributable to the use of TVA's current generation plans, which resulted in changes in retirement date assumptions for coal-fired plants and changes in the estimated service lives for transmission assets. See Note 1 — Depreciation. In addition, the retirement of Colbert Units 1-4 in March 2016 contributed $30 million to the decrease. Partially offsetting these decreases was an increase of approximately $91 million primarily from net additions to Completed plant, including a $66 million increase as the result of placing Watts Bar Unit 2 into service in October 2016. |
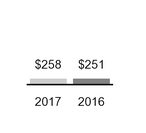
Tax Equivalents |
Tax equivalents expense increased $7 million for the six months ended March 31, 2017, as compared to the same period of the prior year. This change primarily reflects an increase in the accrued tax equivalent expense related to the fuel cost adjustment mechanism, which is equal to five percent of the fuel cost adjustment mechanism revenues and increased for the six months ended March 31, 2017, as compared to the same period of the prior year. |
47
Interest Expense. Interest expense and interest rates for the three and six months ended March 31, 2017 and 2016, were as follows:
Interest Expense | ||||||||||||||||||||||
Three Months Ended March 31 | Six Months Ended March 31 | |||||||||||||||||||||
2017 | 2016 | Percent Change | 2017 | 2016 | Percent Change | |||||||||||||||||
Interest Expense(1) | ||||||||||||||||||||||
Interest expense | $ | 338 | $ | 337 | 0.3 | % | $ | 677 | $ | 672 | 0.7 | % | ||||||||||
Allowance for funds used during construction | — | (58 | ) | (100.0 | )% | — | (116 | ) | (100.0 | )% | ||||||||||||
Net interest expense | $ | 338 | $ | 279 | 21.1 | % | $ | 677 | $ | 556 | 21.8 | % | ||||||||||
Average blended interest rate | 5.07 | % | 5.14 | % | (1.4 | )% | 5.11 | % | 5.15 | % | (0.8 | )% | ||||||||||
Note
(1) Interest expense includes amortization of debt discounts, issuance, and reacquisition costs, net.
Net interest expense increased $59 million and $121 million for the three and six months ended March 31, 2017, respectively, as compared to the same periods of the prior year. During the three and six months ended March 31, 2016, TVA capitalized $58 million and $116 million, respectively, in allowance for funds used during construction ("AFUDC") related to the Watts Bar Unit 2 construction project. TVA ended this capitalization on September 30, 2016.
Liquidity and Capital Resources
Sources of Liquidity
To meet cash needs and contingencies, TVA depends on various sources of liquidity. TVA’s primary sources of liquidity are cash from operations and proceeds from the issuance of short-term and long-term debt. Current liabilities may exceed current assets from time to time in part because TVA uses short-term debt to fund short-term cash needs, as well as to pay scheduled maturities and other redemptions of long-term debt. The daily balance of cash and cash equivalents maintained is based on near-term expectations for cash expenditures and funding needs.
In addition to cash from operations and proceeds from the issuance of short-term and long-term debt, TVA's sources of liquidity include a $150 million million credit facility with the United States Department of the Treasury ("U.S. Treasury"), four long-term revolving credit facilities totaling $2.7 billion, and proceeds from financings. See Note 10 — Credit Facility Agreements. Other financing arrangements may include lease financings and sales of loans, receivables, and other assets.
The TVA Act authorizes TVA to issue bonds, notes, or other evidences of indebtedness ("Bonds") in an amount not to exceed $30 billion outstanding at any time. During the three months ended March 31, 2017, TVA issued $1.0 billion of power bonds maturing in February 2027. See Note 10 — Debt Securities Activity. At March 31, 2017, TVA had $24.1 billion of Bonds outstanding (not including noncash items of foreign currency exchange gain of $176 million, unamortized debt issue costs of $62 million, and net discount on sale of Bonds of $97 million). The balance of Bonds outstanding directly affects TVA’s capacity to meet operational liquidity needs and to strategically use Bonds to fund certain capital investments as management and the TVA Board may deem desirable. Other options for financing not subject to the limit on Bonds, including lease financings (see Lease Financings below and Note 7), could provide supplementary funding if needed. Currently, TVA believes that it has adequate capability to fund its ongoing operational liquidity needs and make planned capital investments over the next decade through a combination of Bonds, additional power revenues through power rate increases, cost reductions, or other ways. See Lease Financings below, Note 7, and Note 10 — Credit Facility Agreements for additional information.
Debt Securities. TVA’s Bonds are not obligations of the United States, and the United States does not guarantee the payments of principal or interest on Bonds. TVA’s Bonds consist of power bonds and discount notes. Power bonds have maturities of between one and 50 years. Discount notes have maturities of less than one year. Power bonds and discount notes have a first priority and equal claim of payment out of net power proceeds. Net power proceeds are defined as the remainder of TVA's gross power revenues after deducting the costs of operating, maintaining, and administering its power properties and payments to states and counties in lieu of taxes, but before deducting depreciation accruals or other charges representing the amortization of capital expenditures, plus the net proceeds from the sale or other disposition of any power facility or interest therein. In addition to power bonds and discount notes, TVA had outstanding at March 31, 2017, the long-term debt of three variable interest entities. See Lease Financings below, Note 7, and Note 10 — Credit Facility Agreements for additional information.
48
The following table provides additional information regarding TVA's short-term borrowings.
Short-Term Borrowing Table | ||||||||||||||||||||||||
At March 31 2017 | Three Months Ended March 31 2017 | Six Months Ended March 31 2017 | At March 31 2016 | Three Months Ended March 31 2016 | Six Months Ended March 31 2016 | |||||||||||||||||||
Amount Outstanding (at End of Period) or Average Amount Outstanding (During Period) | ||||||||||||||||||||||||
Discount Notes | $ | 815 | $ | 1,346 | $ | 1,369 | $ | 1,407 | $ | 1,384 | $ | 1,273 | ||||||||||||
Weighted Average Interest Rate | ||||||||||||||||||||||||
Discount Notes | 0.735 | % | 0.518 | % | 0.422 | % | 0.282 | % | 0.280 | % | 0.190 | % | ||||||||||||
Maximum Month-End Amount Outstanding (During Period) | ||||||||||||||||||||||||
Discount Notes | N/A | $ | 2,062 | $ | 2,062 | N/A | $ | 1,635 | $ | 1,635 | ||||||||||||||
Lease Financings. TVA has entered into certain leasing transactions with special purpose entities to obtain third-party financing for its facilities. These special purpose entities are sometimes identified as variable interest entities ("VIEs") of which TVA is determined to be the primary beneficiary. TVA is required to account for these VIEs on a consolidated basis. See Note 7 and Note 10 for additional information about TVA’s lease financing activities. In 2016, TVA acquired 100 percent of the equity interests in certain special purpose entities created for the purpose of facilitating lease financing. TVA may seek to enter into similar arrangements in the future.
Summary Cash Flows
A major source of TVA's liquidity is operating cash flows resulting from the generation and sales of electricity. There was no net change in cash and cash equivalents for the six months ended March 31, 2017. The net increase in cash and cash equivalents for the six months ended March 31, 2016, was $1 million. A summary of cash flow components for the six months ended March 31, 2017, and March 31, 2016, follows:
Cash provided by (used in): 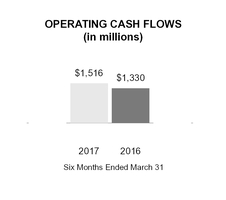
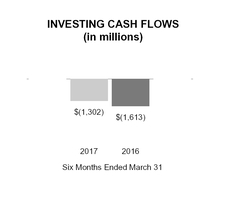
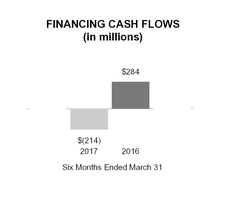
Operating Activities
TVA’s cash flows from operations are primarily driven by sales of electricity, fuel costs, and operating and maintenance costs. The timing and level of cash flows from operations can be affected by the weather, changes in working capital, commodity price fluctuations, outages, and other project expenses.
Net cash flows provided by operating activities increased by $186 million for the six months ended March 31, 2017, as compared to the same period of the prior year, primarily as a result of increases in revenue collections due to timing and the increase to the effective base rate, partially offset by increases in cash used for fuel purchases, outage costs, ARO settlements, and benefit plans contributions.
Investing Activities
The majority of TVA’s investing cash flows are due to investments to acquire, upgrade, or maintain generating and transmission assets, including environmental projects and the purchase of nuclear fuel.
49
Net cash flows used in investing activities decreased by $311 million for the six months ended March 31, 2017, as compared to the same period of the prior year, due to a decrease in spending on major projects, including the completion of Watts Bar Unit 2 in October 2016 and progress made on the Paradise Combined Cycle Plant construction project. These decreases were partially offset by increases in nuclear fuel expenditures due to timing of nuclear refueling outages.
Financing Activities
TVA’s cash flows provided by or used in financing activities are primarily driven by the timing and level of cash flows provided by operating activities, cash flows used in investing activities, and net issuance and redemption of debt instruments to maintain a strategic balance of cash on hand.
Net cash flows used in financing activities were $214 million for the six months ended March 31, 2017, as compared to $284 million of net cash provided by financing activities in the same period of the prior year. Increased cash flows from operations and decreased investing spend reduced TVA’s borrowing needs. TVA also realized proceeds from the issuance of a $1.0 billion power bond carrying an interest rate of 2.88 percent and a term of ten years. The proceeds from the bond were used in part to redeem $571 million of other long-term debt, primarily power bonds. As a result, TVA had $595 million of net redemptions of short-term debt for the six months ended March 31, 2017, as compared to $372 million of net issuance of short-term debt in the same period last year.
Due to the above activity, TVA’s balance of cash and cash equivalents as of March 31, 2017 was effectively unchanged versus the same date in the prior year.
Contractual Obligations
TVA has obligations and commitments to make future payments under contracts. During the three and six months ended March 31, 2017, there were no material changes in TVA’s contractual obligations outside of the ordinary course of business. TVA's contractual obligations are discussed in Item 7, Management's Discussion and Analysis of Financial Condition and Results of Operations — Liquidity and Capital Resources and Note 20 of the Notes to Consolidated Financial Statements in the Annual Report.
Key Initiatives and Challenges
Distributed Energy Resources
As technologies for producing energy using distributed solar, micro turbines, and other types of smaller scale distributed resources are evolving, they are becoming more cost-competitive. Previously, absorbing the impact of electricity from the small number of distributed generation sites was well within the capacity of a system the size of TVA’s. As the amount of distributed generation ("DER") grows on the TVA system, the need for TVA’s traditional generation resources may be reduced, and the ability of the system to reliably and economically operate in conjunction with these distributed generation sources may become more challenging. To meet this challenge, TVA is working with LPCs and others on long-term pricing and product development that includes DER products and addresses the implementation and support of those products.
While TVA owns and operates its high-voltage transmission grid, the distribution system is a network of grids belonging to LPCs, each with its own characteristics and operational strengths and challenges. The growth of renewable resources on the distribution grid (primarily rooftop photovoltaic solar) necessitates the involvement of entities in addition to TVA, especially the LPCs. TVA and LPCs will need to focus on the safety and reliability impact of these resources as they are interconnected to the grid, as well as ensuring the pricing of electricity remains as low as feasible. Due to uncertainties related to the technology choices and market penetration rates for DER options, TVA cannot currently predict the potential financial impacts from the future growth in DER, but it is anticipated that future growth will be a part of TVA’s overall strategy to meet customer demand in an evolving marketplace.
Energy efficiency was modeled as a selectable, supply-side equivalent resource in TVA’s Integrated Resource Plan ("IRP”). The IRP considered a broad range of feasible demand-side options and assessed them with respect to financial, economic, and environmental impacts. TVA is developing and managing demand-side energy resources in collaboration with the LPC community and electric customers, particularly around deployment of additional energy efficiency resources. Previously mandated energy efficiency standards have been having an effect of reducing the amount of electricity used by customers and have been factored into TVA’s long-range plans. Recent actions by the new Administration include the delay of previously issued energy standards covering such items as central air conditioners, heat pumps, and compressors, as well as other electrical equipment. It is not known what effect, if any, that the action will have on future demand.
50
Generation Resources
Nuclear Response Capability. Since the events that occurred in 2011 at the Fukushima Daiichi Nuclear Power Plant ("Fukushima Events"), the Nuclear Regulatory Commission ("NRC") has issued and adopted additional detailed guidance on the expected response capability to be developed by each nuclear plant site. TVA submitted integrated strategies to the NRC on February 28, 2013. TVA is currently implementing strategies and physical plant modifications to address the actions outlined in this guidance for all of its nuclear plants. As of March 31, 2017, TVA had spent $263 million on modifications related to these actions at all of its nuclear plants, including Watts Bar Unit 2, and expects to spend an additional $20 million to complete the remaining modifications intended to address this guidance.
Extreme Flooding Preparedness. Updates to the TVA analytical hydrology model completed in 2009 indicated that under “probable maximum flood” conditions, some of TVA’s dams might not have been capable of regulating the higher flood waters. A “probable maximum flood” is an extremely unlikely event; however, TVA is obligated to provide protection for its nuclear plants against such events. As a result, TVA installed a series of temporary barriers to raise the height of four TVA dams to manage the issue on an interim basis. Subsequent modifications have replaced the temporary barriers at three of the four dams, and work on the fourth, Fort Loudoun Dam, will continue after the completion of a Tennessee Department of Transportation project. During the third quarter of 2016, TVA was informed that work being done by the State of Tennessee to support the Fort Loudoun Dam modifications, originally scheduled to be completed in June 2016, is now estimated to be completed in September 2017. TVA Fort Loudoun Dam modifications are estimated to be completed mid-2018. TVA is taking steps to ensure that it complies with the NRC license requirements for Watts Bar related to the completion of the project.
Since 2009, TVA has performed further hydrology modeling of portions of the TVA watershed using updated modeling tools. TVA also substantially completed a series of permanent modifications to several other dams identified through the more recent analytical work. The modifications addressed and rectified the potential for certain dams to be overtopped during a “probable maximum flood” event as well as the potential for certain other dams to become unstable under “probable maximum flood” conditions. TVA has also made various improvements to plant protection features at Watts Bar and Sequoyah.
The revised hydrology models were reviewed and approved by the NRC for Watts Bar Units 1 and 2. However, TVA identified an error in the modeling that will require TVA to resubmit models for Watts Bar Units 1 and 2. TVA plans to seek NRC approval for similar modeling for Sequoyah Units 1 and 2 and will subsequently address conditions at Browns Ferry as needed. The updated models for Watts Bar and Sequoyah are expected to be submitted to the NRC in early CY 2018 for review and approval. TVA has deferred some modifications until these updated models are completed.
The hydrology analyses discussed above relate to the current operation and current requirements of TVA’s existing nuclear fleet. In addition, the NRC has required all utilities to reexamine flood hazards at nuclear plants in light of the lessons learned from the Fukushima Events. In March 2015, TVA sent its flood hazard analyses to the NRC for all three of its nuclear sites after considering the NRC’s Fukushima-related requirements. Minor modifications to some of TVA’s nuclear plants may result from these analyses, and further modifications to TVA’s dams based on this analysis are expected. Temporary protection measures are in place in the interim while the NRC review is underway. As of March 31, 2017, TVA had spent $149 million on the modifications and improvements related to extreme flooding preparedness and expects to spend up to an additional $29 million to complete the modifications.
NRC Seismic Assessments. On May 9, 2014, the NRC notified licensees of nuclear power reactors in the central and eastern United States of the results of seismic hazard screening and prioritization evaluations performed by unit owners and
reviewed by the NRC staff. Because the seismic hazards for Browns Ferry, Sequoyah, and Watts Bar had increases in seismic parameters beyond the technical information available when the plants were designed and licensed, TVA must conduct seismic risk evaluations for these plants. TVA must complete the evaluation for Watts Bar by June 30, 2017, and the evaluations for Browns Ferry and Sequoyah by December 31, 2019.
Mitigation of Beyond-Design-Basis Events. Supplementary NRC rulemaking is under development to mitigate beyond-design-basis flooding and seismic events. The NRC staff submitted the draft final rule — Mitigation of Beyond-Design-Basis Events — to the NRC on December 15, 2016, requesting approval to publish the final rule. The final rule is not expected to be issued until mid-2017, and could result in TVA having to make modifications to one or more of its nuclear plants. Cost estimates for any required modifications cannot be developed until after the rule is finalized, but costs for modifications could be substantial. See Extreme Flooding Preparedness and NRC Seismic Assessments above.
Baffle-Former Bolt Degradation. In July 2016, Westinghouse Electric Co., LLC ("Westinghouse") issued a Nuclear Safety Advisory Letter (“NSAL”) 16-01 that addresses recently identified degradation of baffle-former bolts in some U.S. pressurized water reactors (“PWRs”). Baffle-former bolts help hold together a structure inside certain reactor vessels. Sequoyah Units 1 and 2, both of which are powered by PWRs, are referenced in the NSAL. Visual inspections of baffle-former bolts in Sequoyah Unit 1 during the refueling outage in the first quarter of 2017 showed no degradation of baffle-former bolts. The refueling outage of Sequoyah Unit 2 is scheduled to take place later in 2017 at which time the unit will be visually inspected. TVA is planning to complete ultrasonic inspections during the subsequent refueling outages at both Unit 1 and Unit 2.
51
Potential Issues Involving Nuclear Components. On January 10, 2017, the NRC released a list of nuclear units that are potentially impacted by AREVA components forged by Le Creusot Forge in France. Sequoyah Unit 1 and Watts Bar Unit 1 are included in the list because they received steam generator components from Le Creusot Forge. Two separate issues relating to the AREVA components were identified. One issue involves the level of carbon in some forgings, which may compromise the components’ structural integrity over time. Neither the NRC nor AREVA has found any safety concerns with the steam generator components produced by Le Creusot Forge. Additionally, Westinghouse, which supplied the components to TVA, has notified TVA that there are no known issues with the components Westinghouse received from Le Creusot Forge, and TVA is not aware of any issues with the components. TVA will participate with industry working groups investigating the forging issue. The other issue involves apparent documentation discrepancies which do not appear to have affected TVA.
Work Environment at Nuclear Plants. In March 2016, the NRC issued a Chilling Effect Letter ("CEL") to TVA regarding work environment concerns identified at Watts Bar. In subsequent inspections, the NRC found that Watts Bar still faces challenges in maintaining a safety conscious work environment. On April 12, 2017, TVA provided the NRC with an updated letter outlining focus areas and metrics for monitoring performance at Watts Bar. Work environment matters at TVA’s other nuclear plants are also being addressed.
Watts Bar Unit 2. Watts Bar Unit 2 commenced commercial operations on October 19, 2016. Project costs were $4.7 billion and were within the limit approved by the TVA Board in January 2016.
TVA was a cooperating agency in the February 2016 Department of Energy ("DOE") Final Supplemental Environmental Impact Statement for the Production of Tritium in a Commercial Light Water Reactor. On April 5, 2017, due to an anticipated need for more tritium-producing burnable absorber rods ("TPBARs"), DOE announced its preferred alternative for irradiation services which included use of an additional reactor. As a result of TVA’s assessment and concurrence with DOE’s alternative, TVA is planning to submit a license amendment to the NRC in late 2017 to authorize the irradiation of TPBARs in Watts Bar Unit 2. Subject to approval of the license amendment, tritium production in Watts Bar Unit 2 is projected to start in the fall of 2020. DOE's decision also allows for irradiation of TPBARs at the Sequoyah site in the future; however, TVA does not have plans to employ Sequoyah units for tritium production in the near term.
Conditions Affecting Generating Plant Operations. Watts Bar Unit 2 was shut down March 23, 2017, following an issue with non-nuclear related equipment that supports the Unit 2 turbines. The Watts Bar team is evaluating a turbine system condenser to determine the cause of the shutdown and identify, assess, and develop a course of action to repair the unit. The unit is expected to return to service in the summer of 2017.
Performance of Suppliers. On March 29, 2017, Westinghouse, a subsidiary of Toshiba Corporation ("Toshiba"), filed for protection under Chapter 11 of the United States Bankruptcy Code. Subsequently, on April 11, 2017, Toshiba submitted an unaudited financial report for the period from April 2016 to December 2016 with an accompanying statement warning "there are events and circumstances that may bring about significant questions about the idea of carrying on as a going concern."
TVA currently has several contracts with Westinghouse and Toshiba, including contracts for the enrichment and fabrication of nuclear fuel and the manufacture of a steam generator, as well as several ongoing agreements for maintenance and outage support at its nuclear and coal-fired plants. TVA is assessing potential performance impacts, including procurement of parts and services as well as outage schedules. If either supplier is unable to perform under TVA's existing contracts and TVA is unable to obtain similar services at similar terms from other vendors, TVA could experience delays, disruptions, additional costs, or other operational outcomes which TVA cannot predict at this time, but which could be material.
Clean Air Projects. During 2011, the TVA Board approved the addition of emission control equipment at Gallatin. TVA completed the addition of scrubbers on the four Gallatin units during 2016 and is currently installing SCR systems on these units. It is currently anticipated that the first two SCRs will be operational in the spring of 2017 and the final two will be operational in the fall of 2017. In addition, at its December 30, 2014 meeting, the TVA Board authorized the installation of SCRs and scrubbers on Units 1 and 4 at Shawnee. It is anticipated that these systems will be operational in the fall of 2017.
Coal Combustion Residuals Facilities. TVA has committed to a programmatic approach to the elimination of wet storage of coal combustion residuals ("CCR") within the TVA service area. Under this program (the “CCR Conversion Program”), TVA has committed to (1) convert all operational coal-fired plants to dry CCR storage, (2) close all wet storage facilities, and (3) meet all applicable state and federal regulations. To carry out its CCR Conversion Program, TVA is undertaking the following actions:
Dry generation and dewatering projects. Conversion of coal plant CCR wet processes to dry generation or dewatering is complete at Bull Run, and construction is underway at Kingston and Shawnee. Planning and engineering phases are currently underway at Gallatin, Cumberland, and Paradise.
Landfills. Lined and permitted dry storage facilities have been constructed and are operational at the Bull Run, Kingston, and Gallatin Fossil Plants. Planning and engineering phases are currently underway at the Cumberland, Paradise, and Shawnee Fossil Plants.
52
Wet CCR impoundment closures. TVA is planning to close wet CCR impoundments in accordance with federal and state requirements when (1) coal-fired plants are converted to dry CCR processes and dry storage landfills become operational or (2) plant operations cease. Closure project schedules and costs are driven by the selected closure technology (such as cap and close in place or closure by removal). TVA issued an environmental impact statement ("EIS") that addresses the closure of CCR impoundments at TVA's coal-fired plants in June 2016. The EIS was finalized in July 2016. Although the EIS was designed to be programmatic in order to address the mode of impoundment closures, it specifically addressed closure methods at 10 impoundments. TVA subsequently decided to close those impoundments, although final closure plans are still subject to approval by appropriate state regulators. Additional National Environmental Policy Act ("NEPA") analyses will be conducted as other impoundments are designated for closure. As environmental studies are performed and closure methodologies are determined, detailed project schedules and estimates will be finalized.
Groundwater monitoring. Compliance with the Environmental Protection Agency's ("EPA") CCR rule as well as other requirements will require additional engineering and analysis as well as implementation of a comprehensive groundwater monitoring program.
The CCR Conversion Program is scheduled to be completed by 2022 with two exceptions. First, a new landfill at Shawnee will be required to accommodate the addition of air pollution controls, and the landfill is scheduled to be operational by 2020. Once the new landfill is in service, the existing bottom ash impoundment and dry stack will be closed in accordance with federal and state requirements. Second, the impoundments at Gallatin are pending additional studies to determine the final closure methodology and schedule. While plans are currently being formulated for the CCR closure methodology for Gallatin, TVA is involved in two lawsuits relating to alleged releases of waste materials from the CCR facilities at Gallatin. In both cases, the plaintiffs are seeking injunctive relief and civil penalties. The injunctive relief could include an order requiring TVA to relocate the CCR facilities, and the cost of doing so would be material. The civil penalties, if awarded, could also be material. See Note 16 — Legal Proceedings — Cases Involving Gallatin Fossil Plant CCR Facilities.
Through March 31, 2017, TVA had spent approximately $1.1 billion on its CCR Conversion Program. TVA expects to spend an additional $1.1 billion on the CCR Conversion Program through 2022. Once the CCR Conversion Program is completed, TVA will continue to undertake certain CCR projects, including building new landfill sections under existing permits and closing existing sections once they reach capacity.
Natural Gas-Fired Units. During 2014, the TVA Board approved the construction of two natural gas-fired generation facilities — Paradise Combined Cycle ("Paradise CC") and Allen Combined Cycle ("Allen CC"). The Paradise CC, with a cost of approximately $900 million and an expected generation capacity of approximately 1,000 MW, began commercial operations on April 7, 2017. Paradise Units 1 and 2, which are coal-fired with a combined summer dependable capability of 1,230 MW, were retired on April 15, 2017. These units were previously idled in February 2017 and December 2016, respectively, in anticipation of the natural gas-fired facility coming online. TVA will continue to operate coal-fired Paradise Unit 3 on the Paradise site.
The second natural gas-fired facility under construction, Allen CC, has an expected generation capacity of approximately 1,000 MW with a cost not to exceed $975 million and is expected to be operational in 2018. Upon completion of this facility, the existing coal-fired units at the site will be retired. TVA initially intended to use wastewater for the Allen CC facility’s cooling system but determined such a method would be cost prohibitive and less reliable from both a capital and long-term operations and maintenance perspective. Due to the industrial nature of the wastewater, it would have required significantly more water treatment than initially anticipated. TVA evaluated several wastewater treatment alternatives (and other water supply options) and concluded the current plan to install five wells to obtain cooling water from an aquifer is the preferred method. Three of the five wells were permitted in the summer of 2016 and were installed by September 2016. The remaining two wells were permitted in September 2016. An administrative appeal to the issuance of the final two well permits was denied by the Groundwater Quality Control Board of Shelby County ("Groundwater Board") in November 2016. On February 1, 2017, the Sierra Club and a local non-profit organization, Protect Our Aquifer, filed a petition with the Shelby County chancery court seeking judicial review of the Groundwater Board’s decision. TVA removed that action to federal court in Memphis, and has filed a motion to dismiss the petition.
Renewable Energy Resources. On November 10, 2016, the River Bend Solar Energy Center located in northern Alabama began commercial operation. TVA has a 20-year power purchase agreement signed on February 23, 2015, with NextEra Energy Resources for power generated from the facility. The River Bend Solar Energy Center has more than 300,000 solar panels with trackers that are designed to follow the sun from east to west each day to maximize energy production with a generating capacity of 75 megawatts. The power purchase agreement supports TVA’s renewable energy portfolio and is helping TVA meet its commitment to provide low-cost, carbon-free electricity.
River Management. The summer of 2016 was the hottest and driest in the Tennessee Valley since 2010 — a trend that continued into the first six months of 2017. During the first six months of 2017, the Tennessee Valley region experienced rainfall deficits of three inches on average across the entire basin. Various aspects of TVA's three-fold mission are being impacted by these weather patterns. These include maintaining minimum river flows for navigation, generating electricity, and maintaining water quality, water supply, and recreation for the Tennessee Valley; having cool water available to meet thermal compliance and enabling normal operation of TVA's nuclear and fossil-fueled plants; generating low-cost hydroelectric power; and oxygenating water to help fish species remain healthy. Rainfall of nearly six inches during December 2016 helped ease
53
drought conditions. In spite of this increased rainfall, runoff during the first six months of 2017 was 41 percent below normal resulting in conventional hydroelectric generation being 40 percent below normal and 47 percent lower during the first six months of 2017 as compared to the same period of the prior year.
Small Modular Reactors. TVA submitted an Early Site Permit Application ("ESPA") for review by the NRC in May 2016. As outlined in its letter to the NRC dated August 11, 2016, TVA provided multiple supplements to its ESPA through December 15, 2016. The NRC completed its acceptance review of the application on December 30, 2016, and began its detailed technical review of the application in January 2017. The ESPA is based on the potential future construction and operation of two or more small modular reactor ("SMR") units at TVA’s Clinch River site in Oak Ridge, Tennessee. TVA’s ESPA is based upon information regarding the various SMR designs under development in the United States. Because a design has not been selected, the ESPA seeks approval of a Plant Parameter Envelope that encompasses any of the designs. TVA and DOE are working under an interagency agreement to jointly fund licensing activities for the Clinch River site with DOE reimbursement of up to 50 percent of TVA's eligible costs through 2020.
TVA is developing the Clinch River site on a schedule that supports submittal of a combined construction and operating license ("COL") application in 2019, in conjunction with supporting the NRC’s review of the ESPA. Submittal of a COL is subject to sufficient progress being made by the SMR vendor(s) with their design certification(s) and a TVA decision to select a specific SMR technology and proceed with development of a COL application in 2017. The project has a great deal of flexibility at this early stage and by moving forward with an ESPA, TVA will be in a position to build a SMR if and when additional power sources are needed. Any decision to construct a SMR would require approval by the TVA Board.
Dam Safety and Remediation Initiatives
Assurance Initiatives. TVA has an established dam safety program, which includes procedures based on the Federal Guidelines for Dam Safety, with the objective of reducing the risk of a dam safety event. The program is comprised of various engineering activities for all of TVA’s dams including safety reassessments using modern industry criteria and the new probable maximum flood and site-specific seismic load cases.
One aspect of the guidelines is that dam structures will be periodically reassessed to assure that TVA's dams meet current design criteria. These reassessments include material sampling of the dam and foundational structures and detailed engineering analysis. TVA is currently performing reassessments on its 49 dam projects. Thirty-eight reassessments have been completed through March 31, 2017. The remaining 11 reassessments were initiated in 2016 and are scheduled to be completed by the end of 2017. Results of the completed reassessments identified areas for further studies at several TVA dams, including Boone and Pickwick (as discussed in more detail below). TVA has spent $68 million on dam safety assurance initiatives since 2012 and expects to spend an additional $209 million through 2021.
Boone Dam Remediation. In October 2014, a sinkhole was discovered near the base of the earthen embankment at Boone Dam, and a small amount of water and sediment was found seeping from the river bank below the dam. TVA identified underground pathways contributing to the seepage and prepared a plan to repair the dam, which consists of the construction of a composite seepage barrier in the dam’s earthen embankment. TVA completed the first part (low mobility grouting) of its test grouting program on the embankment in September 2016 and is currently evaluating the effectiveness of that grouting phase. The second phase of the grouting program (high mobility grouting) is on hold as TVA installs additional sensors and conducts exploratory drilling to provide more detailed data on the progress and impacts of the underground repair work completed to date and help refine the repair plan.
TVA continues to perform investigative drilling, testing, and other activities in support of the seepage barrier design. Based on preliminary findings, changes to the design and order of planned activities are being considered.
The overall remediation of Boone Dam is expected to be established during the summer of 2017 with construction plans being finalized thereafter. The cost and duration of additional work efforts are uncertain at this point and will be determined as design and construction plans are finalized. Because of the ongoing activities, it is not known whether the final plans will be comparable to the previously benchmarked durations and costs of similar activities at other facilities to complete composite walls where costs have ranged from $200 million to $300 million with duration ranging from five to seven years to complete. TVA will continue working with the community to help mitigate local impacts of the extended drawdown.
Pickwick Landing Dam South Embankment Remediation. Reassessments of Pickwick found low safety factors for post-earthquake stability indicating that the dam is at significant risk for slope stability failure following a seismic event in portions of the south embankment. Slope stability failure could lead to a breach of the south embankment and loss of the reservoir, resulting in loss of life and damage to property downstream, disruption to navigation, and loss of generation and recreation.
On September 30, 2016, TVA issued a final environmental assessment and finding of no significant impact for its proposed upgrades to the south embankment. Upon completion of the preliminary engineering study, TVA determined that remediation of the south embankment should be performed by constructing berms on the upstream and downstream slopes. The design phase of the project began during the first quarter of 2017 with the construction phase scheduled to begin in the fall
54
of 2017. The project is currently estimated to be completed in two years. However, the project could take longer than two years depending on the sequencing and loading of the dam. The total project cost is estimated to be approximately $100 million.
Major Capital Projects
The table below summarizes major projects of at least $1.0 billion, as approved by the TVA Board, which support TVA's strategic imperatives related to having a diversified, cleaner portfolio, providing electricity at the lowest feasible rate, responding to changing regulatory requirements including environmental regulations, and meeting operational challenges related to generation reliability. See Liquidity and Capital Resources and Key Initiatives and Challenges.
Summary Table of Major Projects | ||||||
Projects | Estimated Project Cost (in billions) | Estimated In-Service Year | ||||
Capacity Expansion Projects | ||||||
Paradise Combined Cycle Plant (1) | $ | 0.9 | 2017 | |||
Allen Combined Cycle Plant | 1.0 | 2018 | ||||
Environmental | ||||||
Gallatin clean air controls | 1.0 | 2018 | ||||
Note
(1) Paradise CC began commercial operations on April 7, 2017, at a cost of approximately $900 million. See Natural Gas-Fired Units.
Surplus Property
Bellefonte Nuclear Plant. On November 14, 2016, following a public auction, TVA entered into a contract to sell substantially all of its Bellefonte site to Nuclear Development, LLC for $111 million. Nuclear Development, LLC paid TVA $22 million on November 14, 2016, and the remaining $89 million is due at closing. Nuclear Development, LLC has up to two years to close on the property, and TVA will maintain the site until then. The closing is subject to, among other conditions, a determination by TVA's Chief Executive Officer that potential environmental impacts have been appropriately addressed or are acceptable. See Note 6 — Deferred Nuclear Generation Units.
Muscle Shoals Property. In alignment with its strategic direction of right-sizing its real estate portfolio, TVA has drafted a strategy to further reduce a significant number of buildings and property in Muscle Shoals, Alabama, including the disposition of 900 acres of the 1,000 acres approved by the TVA Board in 2012. The marketing efforts began in March 2017, and are expected to lead to an auction of the property by the end of 2017. Marketing is focused on purchasers who can promote local economic growth in the area.
Regulatory Compliance
Environmental Mitigation. Of the $290 million that TVA is required to spend on environmental mitigation projects under the Environmental Agreements, TVA has already spent approximately $258 million in implementing energy efficiency, electric vehicle, and renewable energy projects. These expenditures on environmental mitigation projects are in addition to the decisions TVA made under the Environmental Agreements to control, convert, or retire additional coal-fired units. See Part I, Business — Power Supply and Load Management Resources — Coal-Fired of the Annual Report.
Transmission Issues. TVA anticipates expenditures related to transmission facilities to increase as a result of both new and evolving regulatory requirements. The North American Electric Reliability Corporation ("NERC") approved revisions to the Transmission Planning ("TPL") Reliability Standards in 2013. TVA has spent $27 million since the approval of the standard through March 31, 2017, on existing transmission facilities and anticipates spending an additional $32 million through 2018 to ensure compliance with the 2013 revision of the TPL standards. Total costs of compliance with the standard, including those beyond 2018, are estimated to be approximately $650 million.
Steam-Electric Effluent Guidelines. On November 3, 2015, the EPA published a final rule revising the existing steam electric effluent limitation guidelines ("ELGs"). The ELGs update the existing technology-based water discharge limitations for power plants. Compliance with new requirements is required in the 2018-2023 timeframe and will necessitate major upgrades to wastewater treatment systems at all coal-fired plants. Dry fly ash handling is mandated by the rule. The rule also requires either dry bottom ash handling systems or “no discharge” recycle of bottom ash transport waters, and new technology-based limits on flue gas desulfurization (scrubber) wastewater require primary physical/chemical treatment and secondary biological treatment to meet extremely low limits for arsenic, mercury, and selenium.
On April 12, 2017, EPA Administrator Pruitt granted an industry group's Petition for Reconsideration of the revised steam electric ELGs. The Administrator also signed an administrative stay of the rule’s compliance deadlines during the reconsideration. As part of its reconsideration process, the EPA intends to conduct a rulemaking on the administrative stay of the deadlines and the amendment of those deadlines. A legal challenge of the rule is currently pending before the Fifth Circuit
55
Court of Appeals, and as part of its reconsideration process, the EPA plans to inform the court which the portions of the rule, if any, it seeks to have remanded to the agency for further rulemaking.
TVA currently has four plants with wet scrubbers that will have to comply with the scrubber-related limits, the largest being Cumberland Fossil Plant ("Cumberland"). TVA is working with the State of Tennessee and the EPA in an effort to address compliance with the ELGs at Cumberland given its unique “once-through” scrubber design. Compliance with the rule at Cumberland without modification to address the unique design could cause TVA to incur disproportionately high costs at Cumberland or experience other operational outcomes which TVA cannot predict at this time.
Ratemaking
At its August 25, 2016 meeting, the TVA Board approved a base rate adjustment which took effect on October 1, 2016. The base rate adjustment is expected to contribute approximately $200 million to fiscal year 2017 revenues.
Pension
During 2016, the Tennessee Valley Authority Retirement System (“TVARS”) Board of Directors and the TVA Board approved amendments to TVA’s pension plan and the 401(k) plan. These amendments, which became effective on October 1, 2016, changed the future retirement benefits for employees and retirees and also changed the annual minimum contribution required by TVA to the pension plan. The amendments adopted reduced the benefit obligation by $960 million and committed TVA to annual contributions of the greater of the minimum contribution calculated by TVARS's actuary according to the TVARS Rules and Regulations or $300 million for a period of 20 years or until the plan has reached a fully funded status if sooner than 20 years. See Note 15.
Safeguarding Assets
Physical Security — Non-Nuclear Asset Protection. TVA utilizes a variety of security technologies, security awareness activities, and security personnel to prevent sabotage, vandalism, and thefts. Any of these activities could negatively impact the ability of TVA to generate, transport, and deliver power to its customers. TVA's Police and Emergency Management are active participants with numerous professional and peer physical security organizations in both the electric industry and law enforcement communities.
Physical attacks on transmission facilities across the country have heightened awareness of the need to physically protect facilities. TVA is working with the Department of Homeland Security ("DHS"), the Federal Energy Regulatory Commission ("FERC"), NERC, the SERC Reliability Corporation, the North American Transmission Forum, and other utilities to implement industry approved recommendations and standards.
Nuclear Security. Nuclear security is carried out in accordance with federal regulations as set forth by the NRC. These regulations are designed for the protection of TVA's nuclear power plants, the public, and employees from the threat of radiological sabotage and other nuclear-related terrorist threats. TVA has security forces to guard against such threats.
Cybersecurity. TVA operates in a highly regulated environment. TVA's cybersecurity program aligns or complies with the Federal Information Security Management Act, the NERC Critical Infrastructure Protection requirements, and the NRC requirements for cybersecurity, as well as industry best practices. As part of the U.S. government, TVA coordinates with and works closely with the DHS and the United States Computer Emergency Readiness Team ("US-CERT"). US-CERT functions as a liaison between the DHS and the public and private sectors to coordinate responses to security threats from the Internet. TVA is also participating in studies funded through the DOE to identify, design, and test new solutions for protecting critical infrastructure from cyber attacks.
Although TVA has continued to experience increased cybersecurity threats, none of the attacks to date have impacted TVA's ability to operate as planned or compromised data which could involve TVA in legal proceedings. See Item 1A, Risk Factors — Operational Risks — TVA's facilities and information infrastructure may not operate as planned due to physical or cyber threats to TVA's security of the Annual Report.
Transmission Assets. In addition to physical and cybersecurity attacks, TVA’s transmission assets are vulnerable to various types of electrically charged energy disruptions such as those from geomagnetic disturbances ("GMD") and electromagnetic pulses ("EMP"). Although the effects of GMD and EMP are dissimilar, they are often considered together. On September 22, 2016, FERC approved the Phase 2 NERC Standard TPL-007 to address GMD events. TVA has already met many of the requirements of the new standard with completion of a model of the 500 kV grid and evaluation of the effects of solar storms ranging from NERC’s reference case to possible extreme levels. Only a few items of equipment would exceed threshold levels even for the extreme cases and no damage would be expected. The most serious threats from EMP are those caused by high-altitude nuclear explosions. Like others in the industry, TVA is coordinating with federal and state authorities, NERC, and other grid owners and operators to address this emerging concern.
56
Environmental Matters
TVA’s activities, particularly its power generation activities, are subject to comprehensive regulation under environmental laws and regulations relating to air pollution, water pollution, and management and disposal of solid and hazardous wastes, among other issues. Emissions from all TVA-owned and operated units (including small combustion turbine units of less than 25 MWs whose emissions are not required to be reported to the EPA) have been reduced from historic peaks. Emissions of nitrogen oxide ("NOx") have been reduced by 92 percent below peak 1995 levels and emissions of sulfur dioxide ("SO2") have been reduced by 97 percent below 1977 levels through CY 2016. For CY 2016, TVA’s emission of carbon dioxide ("CO2") from its sources was 69 million tons, a 34 percent reduction from 2005 levels. This includes 1,829 tons from units rated at less than 25 MWs whose emissions are not required to be reported to the EPA. To remain consistent and provide clear information and to align with the EPA’s reporting requirements, TVA intends to continue to report CO2 emissions on a calendar year basis.
Executive Order Related to Energy Resources
On March 28, 2017, President Trump issued Executive Order ("EO") 13783, “Promoting Energy Independence and Economic Growth.” The EO reversed or altered many actions taken by the federal government in the last four years to address climate change and mandates that federal agencies review existing regulations and actions that potentially burden energy development and use. Several EOs, policy statements, and reports that established climate change objectives were rescinded or revoked. The EPA is required to review and, if appropriate, suspend or revise specific rules including the Clean Power Plan. The EPA, through the Department of Justice, has already requested the U.S. Court of Appeals for the D.C. Circuit to hold all litigation relating to these rules in abeyance pending completion of the EPA’s review of the rules. The EO does not cover all relevant policies, orders, and regulations related to climate change and did not rescind EO 13693, “Planning for Federal Sustainability in the Next Decade,” which directed each federal agency to ensure that, starting in 2025 and continuing each year thereafter, no less than 30 percent of the total amount of building electric energy is renewable electric energy. EO 13783 also did not mandate that the EPA reconsider its finding under the CAA that greenhouse gas emissions cause climate change and therefore endanger public health and the environment.
While EO 13783 requires review of all agency actions that potentially burden the safe, efficient development of domestic energy resources, the final specific requirements and impacts from implementation of this EO are not possible to predict at this time. It is likely that there will be some delay in the development of future GHG reduction requirements. TVA’s historical and projected GHG reductions are expected to meet the requirements of the currently stayed Clean Power Plan, and TVA’s new generating units are designed to meet the applicable GHG requirements for new units.
Clean Air Act
National Ambient Air Quality Standards. On March 2, 2015, the U.S. District Court for the Northern District of California approved a consent decree between the EPA and certain environmental petitioners in Sierra Club v. McCarthy. The consent decree set a schedule for the EPA to complete nationwide area designations with respect to the 2010 1-Hour SO2 NAAQS based on monitored air quality levels and SO2 source emission rates and amounts. Air quality modeling was required in 2016 to determine designation of areas around five TVA coal-fired plants. No areas around any TVA generating units are expected to be designated non-attainment. Lower SO2 permit limits well within the capability of existing control equipment are in place for Gallatin and are expected to be in place for Paradise.
Petition to Expand the Ozone Transport Region. On December 9, 2013, eight of the twelve states that make up the Ozone Transport Region ("OTR") submitted a petition, pursuant to section 176A(a) of the Clean Air Act ("CAA"), requesting the EPA to add nine states, including Kentucky and Tennessee, to the OTR. The EPA failed to act on the petition within the 180-day period provided under the CAA. On October 6, 2016, six of the eight states filing the petition sued the EPA in the U.S. District Court for the Southern District of New York, asking the court to require the EPA to act on the petition by a date certain. In response to this lawsuit, the EPA published, on January 19, 2017, a notice in the Federal Register proposing to deny the petition on the basis that the CAA provides other options, such as the use of the “good neighbor provision” in Section 110, and Section 126, to address the impact of interstate air pollution. The EPA also states that its September 2016 updated Cross State Air Pollution Rule is a significant step to control states’ emission reduction obligations under Section 110 to meet the 2008 ozone NAAQS. The comment period on this proposal has now been extended to May 15, 2017. The EPA has also proposed to enter into a consent decree with the plaintiffs requiring the agency to finalize its action on the petition no later than October 27, 2017.
Cleanup of Solid and Hazardous Wastes
Coal Combustion Residuals. On December 16, 2016, President Obama signed into law the Water Infrastructure Improvements for the Nation Act ("WIIN Act"), which, among other elements, includes amendments to the Solid Waste Disposal Act to provide a path to CCR regulation implementation through state or federal-based permitting as an alternative to the current practice of self-implementation and enforcement through citizen suits in federal courts. These amendments allow states to adopt, with EPA approval, a permit program that requires CCR units to achieve compliance with either the criteria specified in the EPA’s CCR rule or other state criteria that are at least as protective as the EPA’s criteria. Pending adoption of state permitting
57
programs in states in TVA’s service area, these amendments do not impact the design or implementation timeframe for TVA’s ongoing CCR activities.
Estimated Required Environmental Expenditures
The following table contains information about TVA’s current estimates on projects related to environmental laws and regulations:
Air, Water, and Waste Quality Estimated Potential Environmental Expenditures(1) At March 31, 2017 (in millions) | |||||
Estimated Timetable | Total Estimated Expenditures | ||||
Coal combustion residual conversion program(2) | 2017-2022 | $ | 1,100 | ||
Clean air control projects(3) | 2017-2023 | $ | 300 | ||
Clean Water Act requirements(4) | 2017-2024 | $ | 500 | ||
Notes
(1) These estimates are subject to change as additional information becomes available and as regulations change.
(2) Includes costs associated with pond closures, conversion of wet to dry handling, and landfill activities. In April 2015, the EPA finalized rules related to CCRs. TVA is continuing to evaluate the rules and their impact on its operations, including the cost and timing estimates of related projects. See Key Initiatives and Challenges — Generation Resources — Coal Combustion Residual Facilities.
(3) Includes air quality projects that TVA is currently performing to comply with existing air quality regulations, but does not include any projects that may be required to comply with potential GHG regulations or transmission upgrades.
(4) Includes projects that TVA is currently planning to comply with revised rules under the Clean Water Act (i.e., Section 316(b) and effluent limitation guidelines for
steam electric power plants).
Legal Proceedings
From time to time, TVA is party to or otherwise involved in lawsuits, claims, proceedings, investigations, and other legal matters ("Legal Proceedings") that have arisen in the ordinary course of conducting its activities, as a result of catastrophic events or otherwise. TVA had accrued approximately $40 million with respect to Legal Proceedings as of March 31, 2017. No assurance can be given that TVA will not be subject to significant additional claims and liabilities. If actual liabilities significantly exceed the estimates made, TVA's results of operations, liquidity, and financial condition could be materially adversely affected.
For a discussion of certain current material Legal Proceedings, see Note 16 — Legal Proceedings, which discussion is incorporated into this Part I, Item 2, Management's Discussion and Analysis of Financial Condition and Results of Operations.
Off-Balance Sheet Arrangements
At March 31, 2017, TVA had no off-balance sheet arrangements.
Critical Accounting Policies and Estimates
The preparation of financial statements requires TVA to estimate the effects of various matters that are inherently uncertain as of the date of the financial statements. Although the financial statements are prepared in conformity with accounting principles generally accepted in the U.S., TVA is required to make estimates and assumptions that affect the reported amounts of assets and liabilities, the disclosure of contingent assets and liabilities, and the amounts of revenues and expenses reported during the reporting period. Each of these estimates varies in regard to the level of judgment involved and its potential impact on TVA's financial results. Estimates are deemed critical either when a different estimate could have reasonably been used, or where changes in the estimate are reasonably likely to occur from period to period, and such use or change would materially impact TVA's financial condition, results of operations, or cash flows. TVA's critical accounting policies are discussed in Item 7, Management's Discussion and Analysis of Financial Condition and Results of Operations — Critical Accounting Policies and Estimates and Note 1 of the Notes to Consolidated Financial Statements in the Annual Report.
New Accounting Standards and Interpretations
For a discussion of new accounting standards and interpretations, see Note 2, which discussion is incorporated into this Part I, Item 2, Management’s Discussion and Analysis of Financial Condition and Results of Operations.
Corporate Governance
At its February 16, 2017, meeting, the TVA Board elected Richard Howorth of Oxford, Mississippi, as chair-elect, and Mr. Howorth will assume the chair duties May 19, 2017, for the next two years. Director Lynn Evans will continue as chair until May 18, 2017.
58
Legislative and Regulatory Matters
The WIIN Act amended the TVA Act to prohibit the TVA Board from ordering the removal of existing floating homes located on waters within TVA’s jurisdiction if the homes meet certain criteria. The amendment does allow the TVA Board to bar future construction of floating homes and to enforce reasonable health, safety, and environmental standards.
TVA continues to monitor how regulatory agencies are interpreting and implementing the provisions of the Dodd-Frank Wall Street Reform and Consumer Protection Act, which was enacted in July 2010. As a result of this act and its implementing regulations, TVA has become subject to recordkeeping, reporting, and reconciliation requirements related to its derivative transactions. In addition, depending on how regulatory agencies interpret and implement the provisions of this act, TVA’s hedging costs may increase, and TVA may have to post additional collateral and margin in connection with its derivative transactions.
TVA does not engage, and does not control any entity that is engaged, in any activity listed under Section 13(r) of the Exchange Act, which requires certain issuers to disclose certain activities relating to Iran involving the issuer and its affiliates. Based on information supplied by each such person, none of TVA's directors and executive officers are involved in any such activities. While TVA is an agency and instrumentality of the United States of America, TVA does not believe its disclosure obligations, if any, under Section 13(r), extend to the activities of any other departments, divisions, or agencies of the United States.
ITEM 3. QUANTITATIVE AND QUALITATIVE DISCLOSURES ABOUT MARKET RISK
There are no material changes related to market risks disclosed under Item 7, Management's Discussion and Analysis of Financial Condition and Results of Operations — Risk Management Activities in the Annual Report. See Note 12 for additional information regarding TVA's derivative transactions and risk management activities.
59
ITEM 4. CONTROLS AND PROCEDURES
Disclosure Controls and Procedures
TVA’s management, including the President and Chief Executive Officer, the Executive Vice President and Chief Financial Officer, and members of the Disclosure Control Committee, including the Vice President and Controller (Principal Accounting Officer), evaluated the effectiveness of TVA’s disclosure controls and procedures (as defined in Rule 13a-15(e) under the Securities Exchange Act of 1934 (the "Exchange Act")) as of March 31, 2017. Based on this evaluation, TVA’s management, including the President and Chief Executive Officer, the Executive Vice President and Chief Financial Officer, and members of the Disclosure Control Committee, including the Vice President and Controller (Principal Accounting Officer), concluded that TVA’s disclosure controls and procedures were effective as of March 31, 2017, to ensure that information required to be disclosed by TVA in reports that it files or submits under the Exchange Act, is recorded, processed, summarized, and reported, within the time periods specified in the Securities and Exchange Commission’s rules and forms, and include controls and procedures designed to ensure that information required to be disclosed by TVA in such reports is accumulated and communicated to TVA’s management, including the President and Chief Executive Officer, the Executive Vice President and Chief Financial Officer, and members of the Disclosure Control Committee, including the Vice President and Controller (Principal Accounting Officer), as appropriate, to allow timely decisions regarding required disclosure.
Changes in Internal Control over Financial Reporting
During the quarter ended March 31, 2017, there were no changes in TVA's internal control over financial reporting that materially affected, or are reasonably likely to materially affect, TVA's internal control over financial reporting.
60
PART II - OTHER INFORMATION
ITEM 1. LEGAL PROCEEDINGS
From time to time, TVA is party to or otherwise involved in lawsuits, claims, proceedings, investigations, and other legal matters ("Legal Proceedings") that have arisen in the ordinary course of conducting its activities, as a result of catastrophic events or otherwise. While the outcome of the Legal Proceedings to which TVA is a party cannot be predicted with certainty, any adverse outcome to a Legal Proceeding involving TVA may have a material adverse effect on TVA’s financial condition, results of operations, and cash flows.
For a discussion of certain current material Legal Proceedings, see Note 16 — Legal Proceedings, which discussion is incorporated by reference into this Part II, Item 1, Legal Proceedings.
ITEM 1A. RISK FACTORS
There are no material changes related to risk factors from the risk factors disclosed in Item 1A, Risk Factors in the Annual Report.
61
ITEM 6. EXHIBITS
Exhibit No. | Description |
10.1 | First Amendment Dated as of February 28, 2017, to the $500,000,000 February 2020 Maturity Credit Agreement Dated as of August 7, 2015, among TVA, Bank of America, N.A., as Administrative Agent, Letter of Credit Issuer, and a Lender, and the Other Lenders Party Thereto (Incorporated by reference to Exhibit 10.1 to TVA's Current Report on Form 8-K filed on March 3, 2017, File No. 000-52313) |
31.1 | Rule 13a-14(a)/15d-14(a) Certification Executed by the Chief Executive Officer |
31.2 | Rule 13a-14(a)/15d-14(a) Certification Executed by the Chief Financial Officer |
32.1 | Section 1350 Certification Executed by the Chief Executive Officer |
32.2 | Section 1350 Certification Executed by the Chief Financial Officer |
101.INS | TVA XBRL Instance Document |
101.SCH | TVA XBRL Taxonomy Extension Schema |
101.CAL | TVA XBRL Taxonomy Extension Calculation Linkbase |
101.DEF | TVA XBRL Taxonomy Extension Definition Linkbase |
101.LAB | TVA XBRL Taxonomy Extension Label Linkbase |
101.PRE | TVA XBRL Taxonomy Extension Presentation Linkbase |
62
SIGNATURES
Pursuant to the requirements of Section 13, 15(d), or 37 of the Securities Exchange Act of 1934, the registrant has duly caused this report to be signed on its behalf by the undersigned, thereunto duly authorized.
Date: | May 1, 2017 | TENNESSEE VALLEY AUTHORITY | |
(Registrant) | |||
By: | _/s/ William D. Johnson_________ | ||
William D. Johnson | |||
President and Chief Executive Officer (Principal Executive Officer) | |||
By: | _/s/ John M. Thomas, III ________ | ||
John M. Thomas, III | |||
Executive Vice President and Chief Financial Officer (Principal Financial Officer) | |||
63
EXHIBIT INDEX
Exhibit No. | Description |
10.1 | First Amendment Dated as of February 28, 2017, to the $500,000,000 February 2020 Maturity Credit Agreement Dated as of August 7, 2015, among TVA, Bank of America, N.A., as Administrative Agent, Letter of Credit Issuer, and a Lender, and the Other Lenders Party Thereto (Incorporated by reference to Exhibit 10.1 to TVA's Current Report on Form 8-K filed on March 3, 2017, File No. 000-52313) |
31.1 | Rule 13a-14(a)/15d-14(a) Certification Executed by the Chief Executive Officer |
31.2 | Rule 13a-14(a)/15d-14(a) Certification Executed by the Chief Financial Officer |
32.1 | Section 1350 Certification Executed by the Chief Executive Officer |
32.2 | Section 1350 Certification Executed by the Chief Financial Officer |
101.INS | TVA XBRL Instance Document |
101.SCH | TVA XBRL Taxonomy Extension Schema |
101.CAL | TVA XBRL Taxonomy Extension Calculation Linkbase |
101.DEF | TVA XBRL Taxonomy Extension Definition Linkbase |
101.LAB | TVA XBRL Taxonomy Extension Label Linkbase |
101.PRE | TVA XBRL Taxonomy Extension Presentation Linkbase |
64