Attached files
| file | filename |
|---|---|
| EX-99.1 - EXHIBIT 99.1 - Great Ajax Corp. | t1701371_ex99-1.htm |
| 8-K - FORM 8-K - Great Ajax Corp. | t1701371_8k.htm |
Exhibit 99.2
First Quarter 2017 Investor Presentation May 2 , 2017
Safe Harbor Disclosure 2 □ We make forward - looking statements in this presentation that are subject to risks and uncertainties. These forward - looking statements include information about possible or assumed future results of our business, financial condition, liquidity, resu lts of operations, cash flow and plans and objectives. When we use the words “believe,” “expect,” “anticipate,” “estimate,” “plan,” “continue,” “intend,” “should,” “may” or similar expressions, we intend to identify forward - looking statements. □ Statements regarding the following subjects, among others, may be forward - looking: market trends in our industry, interest rates, real estate values, the debt financing markets or the general economy or the demand for residential and small balance commercial real estate loans; our business and investment strategy; our projected operating results; actions and initiatives of the U.S. government and changes to U.S. government policies and the execution and impact of these actions, initiatives and policies; the state of the U.S. economy generally or in specific geographic regions; economic trends and economic recoveries; our ability to obtain and maintain financing arrangements; changes in the value of our mortgage portfolio; changes to our portfolio of properties; impact of and changes in governmental regulations, tax law and rates, accounting guidance and simila r matters; our ability to satisfy the REIT qualification requirements for U.S. federal income tax purposes; availability of qua lif ied personnel; estimates relating to our ability to make distributions to our stockholders in the future; general volatility of t he capital markets and the market price of our shares of common stock; and degree and nature of our competition. □ The forward - looking statements are based on our beliefs, assumptions and expectations of our future performance, taking into account all information currently available to us. Forward - looking statements are not predictions of future events. These beliefs, assumptions and expectations can change as a result of many possible events or factors, not all of which are known t o us. If a change occurs, our business, financial condition, liquidity and results of operations may vary materially from those expressed in our forward - looking statements. Furthermore, forward - looking statements are subject to risks and uncertainties, including, among other things, those described under Item 1A of our Annual Report on Form 10 - K for the year ended December 31, 2016, which can be accessed through the link to our SEC filings on our website ( www.great - ajax.com ) or at the SEC's website ( www.sec.gov ). Other risks, uncertainties, and factors that could cause actual results to differ materially from those projected may be described from time to time in reports we file with the SEC, including reports on Forms 10 - Q, 10 - K and 8 - K. Any forward - looking statement speaks only as of the date on which it is made. New risks and uncertainties arise over time, and it is not possible for us to predict those events or how they may affect us. Except as required by law, we are not obligated to, and do not intend to, update or revise any forward - looking statements, whether as a result of new information, future events or otherwise. Unless stated otherwise, financial information included in this presentation is as of March 31, 2017.
Business Overview 3 □ Leverage long - standing relationships to acquire loans through privately negotiated transactions from a diverse group of customers – Over 90% of our acquisitions since inception have been privately negotiated – Acquisitions made in 187 transactions since inception. Six transactions in Q1 2017 □ Use our manager’s proprietary analytics to price each pool on an asset - by - asset basis □ Adjust individual loan bid price to accumulate clusters of loans in attractive demographic metropolitan areas – Typical acquisitions contain 25 – 100 loans with total market value between $5 – $20 million □ Our affiliated servicer services the loans asset - by - asset and borrower - by - borrower □ Objective is to maximize returns for each asset by utilizing full menu of loss mitigation and asset optimization techniques □ Use moderate non - mark - to - market leverage – Corporate leverage of 2.27 x – Eight securitizations since inception totaling $983.6 million of loan UPB. Approximate leverage of 3.2x from the sale of senior bonds
Highlights – Quarter Ended March 31, 2017 4 □ Purchased $3.1 million of re - performing mortgage loans (“RPL”) with an aggregate unpaid principal balance (“UPB”) of $3.4 million, and originated $ 2.5 million of small - balance commercial mortgage loans to end the quarter with $856.8 million of mortgage loans with an aggregate UPB of $ 1.043 billion □ Portfolio interest income of $20.8 million; net interest income of $13.2 million □ Net income attributable to common stockholders of $8.4 million □ Earnings per share (“EPS”) of $0.46 per diluted share □ Taxable income of $0.38 per diluted share □ Book value per share of $15.28 at March 31, 2017 □ $29.8 million of cash and cash equivalents at March 31, 2017
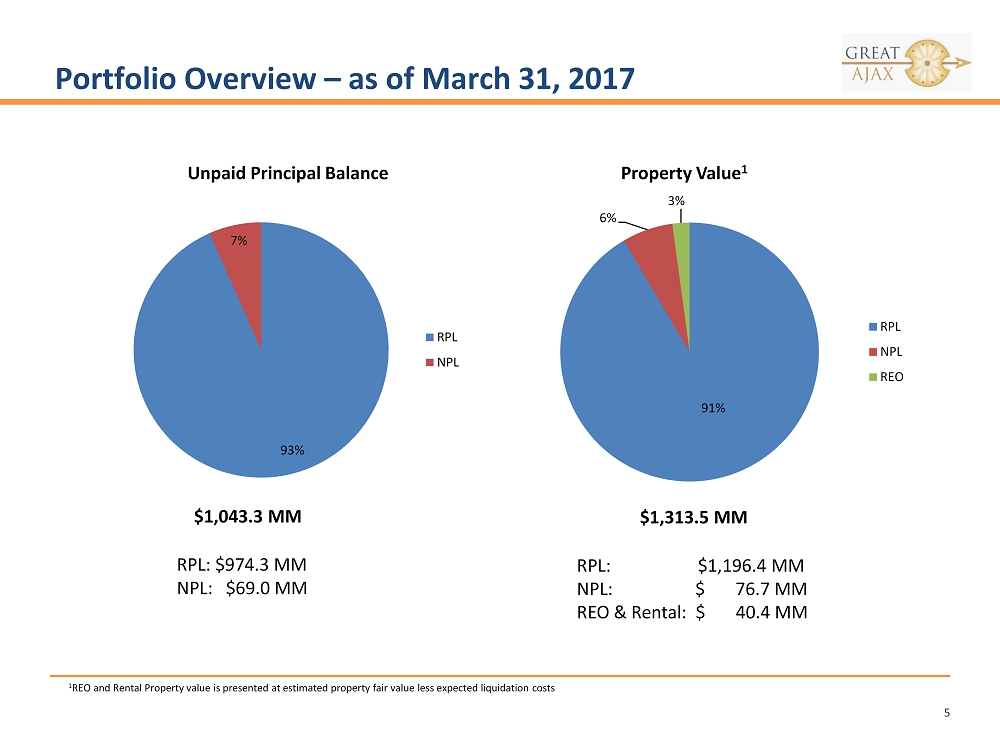
Portfolio Overview – as of March 31, 2017 5 $1,043.3 MM RPL: $974.3 MM NPL: $69.0 MM $1,313.5 MM RPL: $1,196.4 MM NPL: $ 76.7 MM REO & Rental: $ 40.4 MM 91% 6% 3% Property Value 1 RPL NPL REO 1 REO and Rental Property value is presented at estimated property fair value less expected liquidation costs 93% 7% Unpaid Principal Balance RPL NPL
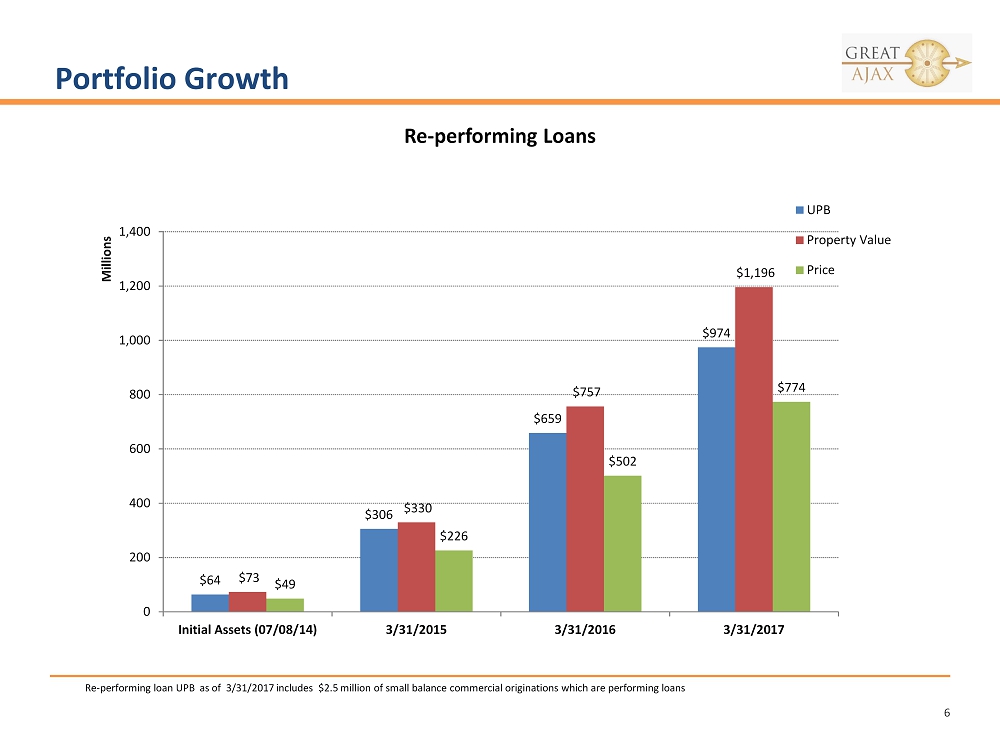
Portfolio Growth 6 Re - performing Loans $64 $306 $659 $974 $73 $330 $757 $1,196 $49 $226 $502 $774 0 200 400 600 800 1,000 1,200 1,400 Initial Assets (07/08/14) 3/31/2015 3/31/2016 3/31/2017 Millions UPB Property Value Price Re - performing loan UPB as of 3/31/2017 includes $2.5 million of small balance commercial originations which are performing lo ans

Portfolio Growth 7 $96 $100 $69 $103 $105 $77 $59 $61 $43 0 20 40 60 80 100 120 Initial Assets (07/08/14) 3/31/2015 3/31/2016 3/31/2017 Millions UPB Property Value Price Non - performing Loans
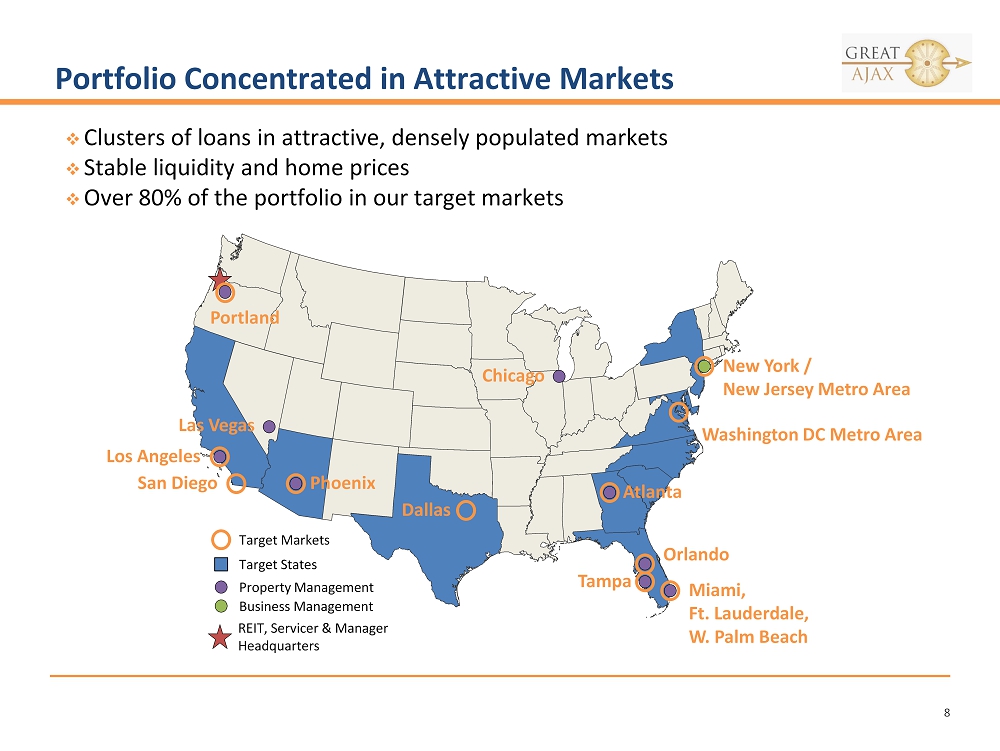
Portfolio Concentrated in Attractive Markets 8 □ Clusters of loans in attractive, densely populated markets □ Stable liquidity and home prices □ Over 80% of the portfolio in our target markets Target States Target Markets Los Angeles San Diego Dallas Portland Phoenix Washington DC Metro Area Chicago Atlanta Orlando Tampa Miami, Ft. Lauderdale, W. Palm Beach New York / New Jersey Metro Area Las Vegas REIT, Servicer & Manager Headquarters Property Management Business Management
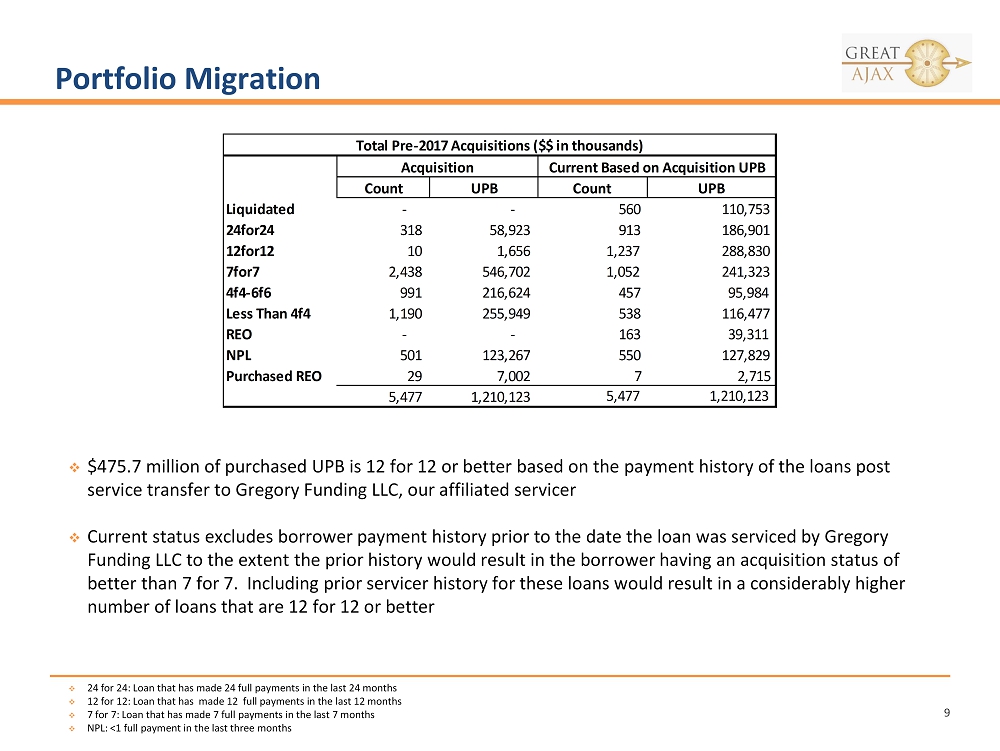
Portfolio Migration 9 □ 24 for 24: Loan that has made 24 full payments in the last 24 months □ 12 for 12: Loan that has made 12 full payments in the last 12 months □ 7 for 7 : Loan that has made 7 full payments in the last 7 months □ NPL: <1 full payment in the last three months □ $475.7 million of purchased UPB is 12 for 12 or better based on the payment history of the loans post service transfer to Gregory Funding LLC, our affiliated servicer □ Current status excludes borrower payment history prior to the date the loan was serviced by Gregory Funding LLC to the extent the prior history would result in the borrower having an acquisition status of better than 7 for 7. Including prior servicer history for these loans would result in a considerably higher number of loans that are 12 for 12 or better Count UPB Count UPB Liquidated - - 560 110,753 24for24 318 58,923 913 186,901 12for12 10 1,656 1,237 288,830 7for7 2,438 546,702 1,052 241,323 4f4-6f6 991 216,624 457 95,984 Less Than 4f4 1,190 255,949 538 116,477 REO - - 163 39,311 NPL 501 123,267 550 127,829 Purchased REO 29 7,002 7 2,715 5,477 1,210,123 5,477 1,210,123 Total Pre-2017 Acquisitions ($$ in thousands) Acquisition Current Based on Acquisition UPB
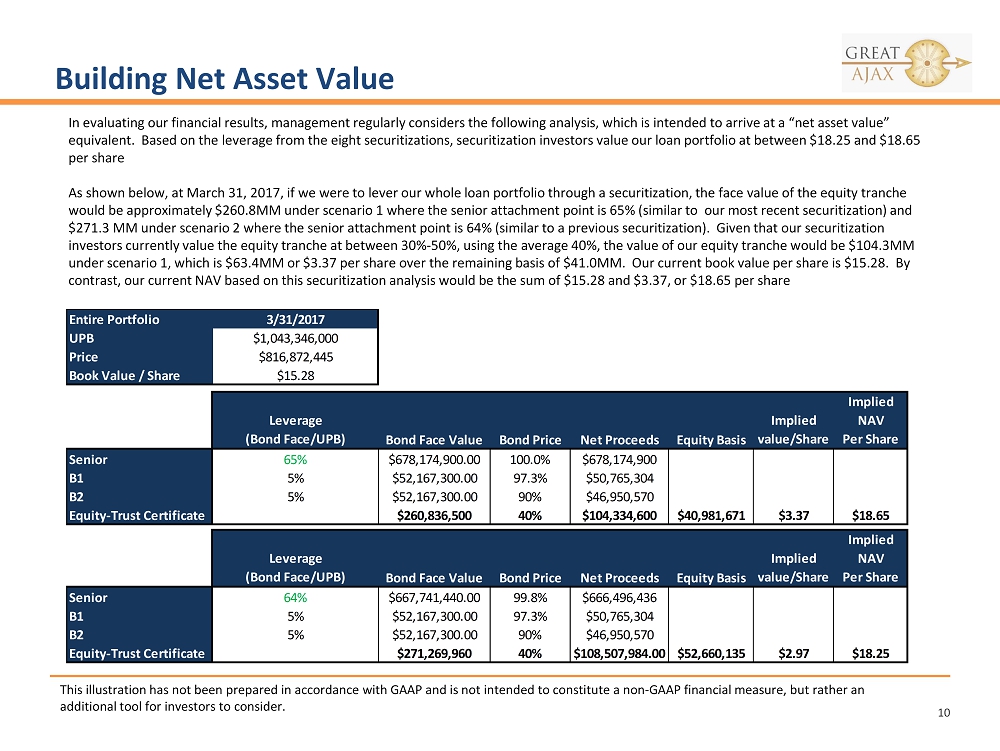
Building Net Asset Value 10 This illustration has not been prepared in accordance with GAAP and is not intended to constitute a non - GAAP financial measure, but rather an additional tool for investors to consider. In evaluating our financial results, management regularly considers the following analysis, which is intended to arrive at a “ne t asset value” equivalent. Based on the leverage from the eight securitizations, securitization investors value our loan portfolio at between $18.25 and $18.65 per share As shown below, at March 31, 2017, if we were to lever our whole loan portfolio through a securitization, the face value of t he equity tranche would be approximately $260.8MM under scenario 1 where the senior attachment point is 65% (similar to our most recent securi tiz ation) and $271.3 MM under scenario 2 where the senior attachment point is 64% (similar to a previous securitization). Given that our secu ritization investors currently value the equity tranche at between 30% - 50%, using the average 40%, the value of our equity tranche would be $104.3MM under scenario 1, which is $63.4MM or $3.37 per share over the remaining basis of $41.0MM. Our current book value per share is $15.28. By contrast, our current NAV based on this securitization analysis would be the sum of $15.28 and $3.37, or $18.65 per share Entire Portfolio 3/31/2017 UPB $1,043,346,000 Price $816,872,445 Book Value / Share $15.28 Leverage (Bond Face/UPB) Bond Face Value Bond Price Net Proceeds Equity Basis Implied value/Share Implied NAV Per Share Senior 65% $678,174,900.00 100.0% $678,174,900 B1 5% $52,167,300.00 97.3% $50,765,304 B2 5% $52,167,300.00 90% $46,950,570 Equity-Trust Certificate $260,836,500 40% $104,334,600 $40,981,671 $3.37 $18.65 Leverage (Bond Face/UPB) Bond Face Value Bond Price Net Proceeds Equity Basis Implied value/Share Implied NAV Per Share Senior 64% $667,741,440.00 99.8% $666,496,436 B1 5% $52,167,300.00 97.3% $50,765,304 B2 5% $52,167,300.00 90% $46,950,570 Equity-Trust Certificate $271,269,960 40% $108,507,984.00 $52,660,135 $2.97 $18.25

Subsequent Events 11 * While these acquisitions are expected to close , there can be no assurance that these acquisitions will close or that the terms thereof may not change. □ April Acquisitions □ RPL □ UPB: $ 98.8 MM □ Collateral Value: $ 148.6 MM □ Price/UPB: 84.4% □ Price/Collateral Value: 56.1% □ 513 loans in 5 transactions □ SBC Origination □ UPB: $0.6 MM □ Collateral Value: $0.8 MM □ Price/UPB: 97.2% □ Price/Collateral Value: 72.8% □ 1 loan □ Pending Acquisitions* □ RPL □ UPB: $ 164.4 MM □ Collateral Value: $ 240.2 MM □ Price/UPB: 87.7 % □ Price/Collateral Value: 60.0 % □ 808 loans in 12 transactions □ A dividend of $ 0.28 per share will be payable on May 30, 2017 to stockholders of record as of May 16, 2017 □ On April 25, 2017, the Company completed the public offer and sale of $87.5 million aggregate principal amount of its 7.25% Convertible Senior Notes due 2024. The notes bear interest at a rate of 7.25% per annum, payable quarterly. The notes will mature on April 30, 2024, unless earlier converted, redeemed or repurchased. The conversion rate will equal 1.6267 shares of common stock per $25.00 principal amount of notes (equivalent to a conversion price of approximately $15.37 per share of common stock), a 17.5% premium over the Company’s stock price on the issue date
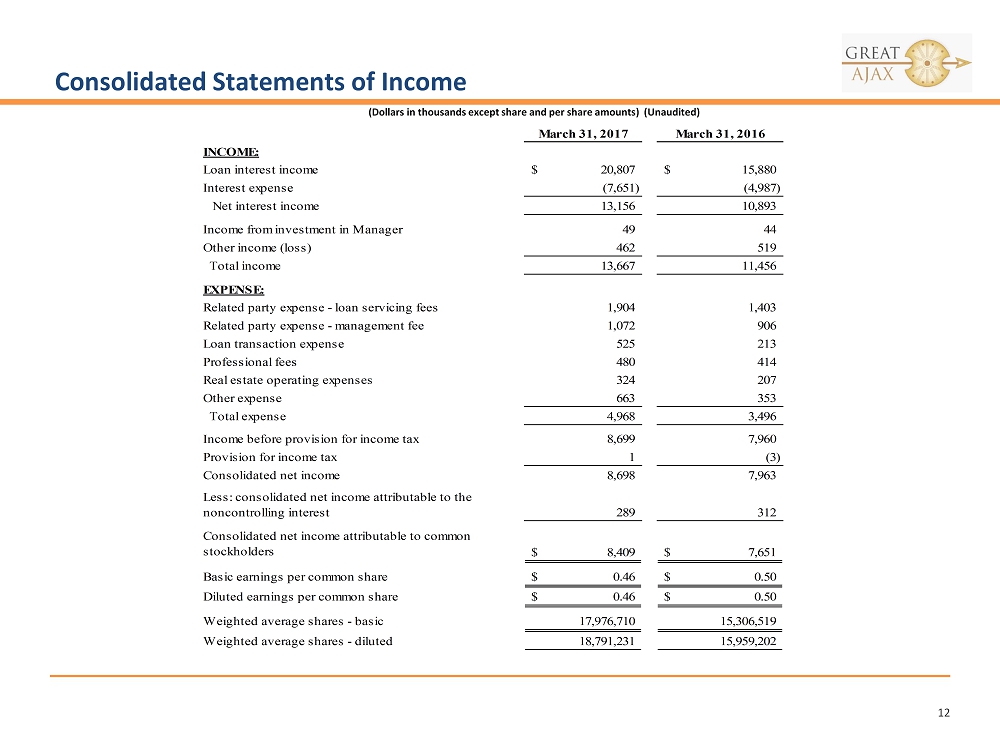
Consolidated Statements of Income 12 (Dollars in thousands except share and per share amounts) (Unaudited) March 31, 2017 March 31, 2016 INCOME: Loan interest income 20,807$ 15,880$ Interest expense (7,651) (4,987) Net interest income 13,156 10,893 Income from investment in Manager 49 44 Other income (loss) 462 519 Total income 13,667 11,456 EXPENSE: Related party expense - loan servicing fees 1,904 1,403 Related party expense - management fee 1,072 906 Loan transaction expense 525 213 Professional fees 480 414 Real estate operating expenses 324 207 Other expense 663 353 Total expense 4,968 3,496 Income before provision for income tax 8,699 7,960 Provision for income tax 1 (3) Consolidated net income 8,698 7,963 289 312 8,409$ 7,651$ Basic earnings per common share 0.46$ 0.50$ Diluted earnings per common share 0.46$ 0.50$ Weighted average shares - basic 17,976,710 15,306,519 Weighted average shares - diluted 18,791,231 15,959,202 Less: consolidated net income attributable to the noncontrolling interest Consolidated net income attributable to common stockholders
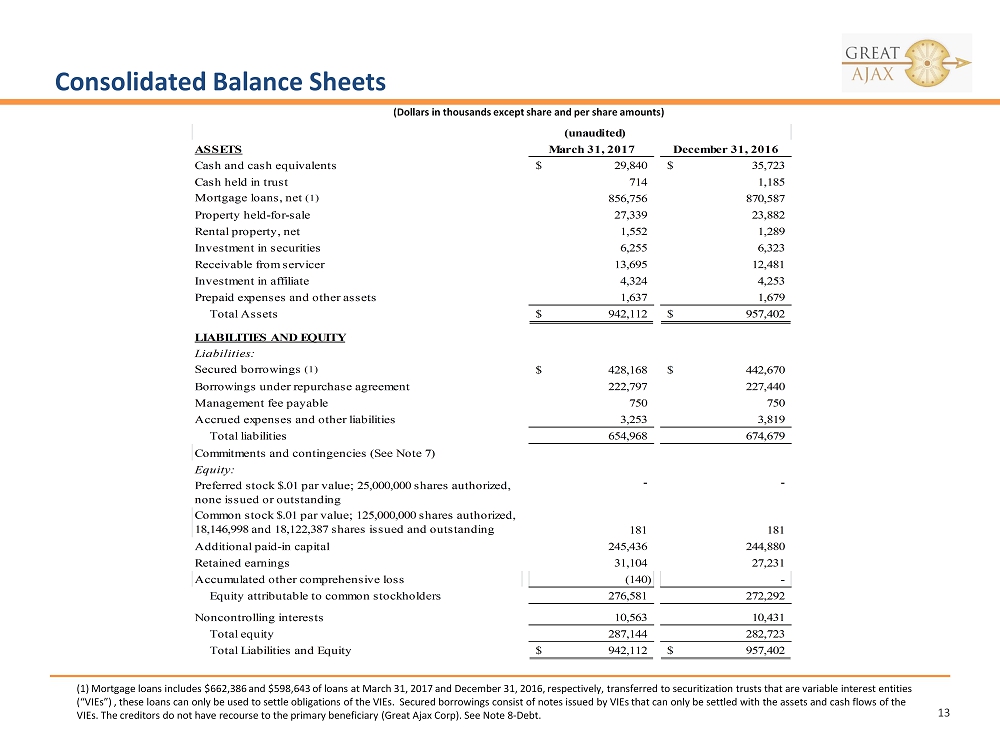
Consolidated Balance Sheets 13 (1) Mortgage loans includes $662,386 and $598,643 of loans at March 31, 2017 and December 31, 2016, respectively, transferred to sec uritization trusts that are variable interest entities (“VIEs”) , these loans can only be used to settle obligations of the VIEs. Secured borrowings consist of notes issued by VIEs that can only be sett led with the assets and cash flows of the VIEs. The creditors do not have recourse to the primary beneficiary (Great Ajax Corp ). See Note 8 - Debt. (Dollars in thousands except share and per share amounts) (unaudited) ASSETS March 31, 2017 December 31, 2016 Cash and cash equivalents 29,840$ 35,723$ Cash held in trust 714 1,185 Mortgage loans, net (1) 856,756 870,587 Property held-for-sale 27,339 23,882 Rental property, net 1,552 1,289 Investment in securities 6,255 6,323 Receivable from servicer 13,695 12,481 Investment in affiliate 4,324 4,253 Prepaid expenses and other assets 1,637 1,679 Total Assets 942,112$ 957,402$ LIABILITIES AND EQUITY Liabilities: Secured borrowings (1) 428,168$ 442,670$ Borrowings under repurchase agreement 222,797 227,440 Management fee payable 750 750 Accrued expenses and other liabilities 3,253 3,819 Total liabilities 654,968 674,679 Commitments and contingencies (See Note 7) Equity: - - Common stock $.01 par value; 125,000,000 shares authorized, 18,146,998 and 18,122,387 shares issued and outstanding 181 181 Additional paid-in capital 245,436 244,880 Retained earnings 31,104 27,231 Accumulated other comprehensive loss (140) - Equity attributable to common stockholders 276,581 272,292 Noncontrolling interests 10,563 10,431 Total equity 287,144 282,723 Total Liabilities and Equity 942,112$ 957,402$ Preferred stock $.01 par value; 25,000,000 shares authorized, none issued or outstanding