Attached files
| file | filename |
|---|---|
| EX-23.1 - EX-23.1 - Vistra Corp. | d312912dex231.htm |
| EX-21.1 - EX-21.1 - Vistra Corp. | d312912dex211.htm |
| EX-5.1 - EX-5.1 - Vistra Corp. | d312912dex51.htm |
Table of Contents
As filed with the Securities and Exchange Commission on May 1, 2017
Registration No. 333-215288
UNITED STATES
SECURITIES AND EXCHANGE COMMISSION
WASHINGTON, D.C. 20549
Amendment No. 3
to
Form S-1
REGISTRATION STATEMENT
UNDER
THE SECURITIES ACT OF 1933
VISTRA ENERGY CORP.
(Exact Name of Registrant as Specified in its Charter)
| Delaware | 4911 | 36-4833255 | ||
| (State or Other Jurisdiction of Incorporation or Organization) |
(Primary Standard Industrial Classification Code Number) |
(I.R.S. Employer Identification No.) |
1601 Bryan Street
Dallas, Texas 75201-3411
(214) 812-4600
(Address, Including Zip Code, and Telephone Number, Including Area Code, of Registrant’s Principal Executive Offices)
Stephanie Zapata Moore
Vistra Energy Corp.
Executive Vice President and General Counsel
1601 Bryan Street
Dallas, Texas 75201-3411
(214) 812-4600
(Name, Address, Including Zip Code, and Telephone Number, Including Area Code, of Agent of Service)
With a copy to:
| William D. Howell Dallas, Texas 75201 |
Edward F. Petrosky New York, New York 10019 |
Approximate date of commencement of proposed sale to the public: From time to time after the effective date of this registration statement.
If any of the securities being registered on this Form are to be offered on a delayed or continuous basis pursuant to Rule 415 under the Securities Act of 1933, check the following box. ☒
If this Form is filed to register additional securities for an offering pursuant to Rule 462(b) under the Securities Act, please check the following box and list the Securities Act registration statement number of the earlier effective registration statement for the same offering. ☐
If this Form is a post-effective amendment filed pursuant to Rule 462(c) under the Securities Act, check the following box and list the Securities Act registration statement number of the earlier effective registration statement for the same offering. ☐
If this Form is a post-effective amendment filed pursuant to Rule 462(d) under the Securities Act, check the following box and list the Securities Act registration statement number of the earlier effective registration statement for the same offering. ☐
Indicate by check mark whether the registrant is a large accelerated filer, an accelerated filer, a non-accelerated filer, smaller reporting company or an emerging growth company. See the definitions of “large accelerated filer,” “accelerated filer,” “smaller reporting company,” and “emerging growth company” in Rule 12b-2 of the Exchange Act.
| Large accelerated filer | ☐ | Accelerated filer | ☐ | |||
| Non-accelerated filer | ☒ (Do not check if a smaller reporting company) | Smaller reporting company | ☐ | |||
| Emerging growth company | ☐ | |||||
If an emerging growth company, indicate by check mark if the registrant has elected not to use the extended transition period for complying with any new or revised financial accounting standards provided pursuant to Section 7(a)(2)(B) of the Securities Act. ☐
CALCULATION OF REGISTRATION FEE
|
| ||||||||
| Title of Each Class of Securities to Be Registered |
Amount to Be Registered |
Proposed Maximum Offering Price per Unit (1) |
Proposed Maximum Aggregate Offering Price (1) |
Amount of Registration Fee | ||||
| Common stock, par value $0.01 per share |
168,779,076 | $15.14 | $2,555,315,210.64 |
$275,726.77 (2) | ||||
|
| ||||||||
|
| ||||||||
| (1) | Estimated solely for the purpose of calculating the registration fee pursuant to Rule 457(c) under the Securities Act of 1933, as amended, based on the average of the high and low sales prices for the registrant’s common stock on the OTCQX U.S. market on April 28, 2017. |
| (2) | Pursuant to Rule 457(a) under the Securities Act of 1933, as amended, a registration fee of $275,670.01 with respect to 168,748,919 shares (based on the average of the high and low price of the registrant’s common stock on December 19, 2016 ($14.095), as reported on the OTCQX U.S. market) was paid with the initial filing of this registration statement on December 23, 2016 and an additional registration fee of $56.76 with respect to an additional 30,157 shares (based on the average of the high and low price of the registrant’s common stock on March 31, 2017 ($16.240), as reported on the OTCQX U.S. market) was paid with the filing of Amendment No. 2 to this registration statement on April 5, 2017. |
The registrant hereby amends this registration statement on such date or dates as may be necessary to delay its effective date until the registrant shall file a further amendment which specifically states that this registration statement shall thereafter become effective in accordance with Section 8(a) of the Securities Act of 1933 or until the registration statement shall become effective on such date as the Securities and Exchange Commission, acting pursuant to said Section 8(a), may determine.
Table of Contents
The information in this prospectus is not complete and may be changed. None of the selling stockholders of our common stock may sell these securities until the registration statement filed with the Securities and Exchange Commission is effective. This prospectus is not an offer to sell these securities and it is not soliciting offers to buy these securities in any jurisdiction where such offer or sale is not permitted.
SUBJECT TO COMPLETION, DATED May 1, 2017
Vistra Energy Corp.
168,779,076 Shares of Common Stock
This prospectus relates to 168,779,076 shares of Vistra Energy Corp. common stock, par value $.01 per share, which we refer to as our common stock or the Vistra Energy common stock, which may be offered for resale from time to time by the stockholders named under the heading “Principal and Selling Stockholders,” whom we refer to as the selling stockholders. The shares of our common stock offered under this prospectus may be resold by the selling stockholders at fixed prices, prevailing market prices at the times of sale, prices related to such prevailing market prices, varying prices determined at the times of sale or negotiated prices and, accordingly, we cannot determine the price or prices at which shares of our common stock may be resold. The shares of our common stock offered by this prospectus and any prospectus supplement may be resold by the selling stockholders directly to investors or to or through underwriters, dealers or other agents, as described in more detail in this prospectus. For more information, see “Plan of Distribution.” We do not know if, when or in what amounts a selling stockholder may offer shares of our common stock for resale. The selling stockholders may resell all, some or none of the shares of our common stock offered by this prospectus in one or multiple transactions.
We will not receive any of the proceeds from the resale of the shares of our common stock by the selling stockholders, but we have agreed to pay certain registration expenses.
Our common stock is quoted on the OTCQX U.S. market under the symbol “VSTE.” On April 28, 2017, the closing sales price of our common stock as reported on the OTCQX market was $14.95 per share. We have applied to list our common stock for trading on the New York Stock Exchange, which we refer to as the NYSE, under the symbol “VST .”
Investing in our common stock involves risks. Before making a decision to invest in our common stock, you should carefully consider the information referred to under the heading “Risk Factors” beginning on page 21.
Neither the Securities and Exchange Commission nor any state or other securities commission has approved or disapproved of these securities or passed upon the adequacy or accuracy of this prospectus. Any representation to the contrary is a criminal offense.
The date of this prospectus is , .
Table of Contents
| Page | ||||
| iii | ||||
| 1 | ||||
| 21 | ||||
| 40 | ||||
| 43 | ||||
| 44 | ||||
| 45 | ||||
| 46 | ||||
| 47 | ||||
| 51 | ||||
| Unaudited Pro Forma Condensed Consolidated Financial Information |
53 | |||
| Management’s Discussion and Analysis of Financial Condition and Results of Operations |
57 | |||
| 90 | ||||
| 112 | ||||
| 117 | ||||
| 144 | ||||
| 148 | ||||
| 153 | ||||
| 156 | ||||
| Material U.S. Federal Income Tax Considerations for Non-U.S. Holders |
162 | |||
| 166 | ||||
| 168 | ||||
| 171 | ||||
| 171 | ||||
| 172 | ||||
| Index To Financial Statements and Financial Statement Schedules |
F-1 | |||
ii
Table of Contents
In this prospectus, except as otherwise indicated herein, or as the context may otherwise require, all references to “Vistra Energy,” “the Company,” “we,” “us” and “our” refer to (a) Vistra Energy Corp. and, unless the context otherwise requires, its direct and indirect subsidiaries and (b) prior to its emergence from bankruptcy (Emergence), Texas Competitive Electric Holdings Company LLC, a Delaware limited liability company, and, unless the context otherwise requires, its direct and indirect subsidiaries (our Predecessor).
This prospectus is part of a resale registration statement that we have filed with the Securities and Exchange Commission (the Commission), using a “shelf” registration process. Under this shelf registration process, the selling stockholders may offer and resell, from time to time, an aggregate of up to 168,779,076 shares of our common stock under this prospectus in one or more offerings. In some cases, the selling stockholders will also be required to provide a prospectus supplement containing specific information about them and the terms on which they are offering and reselling our common stock. We may also add, update or change in a prospectus supplement information contained in this prospectus. To the extent any statement made in a future prospectus supplement is inconsistent with statements made in this prospectus, the statements made in such prospectus supplement shall control and the statements made in this prospectus will be deemed modified or superseded by those made in such prospectus supplement. As a result, you should read this prospectus and any accompanying prospectus supplement, as well as any post-effective amendments to the registration statement of which this prospectus is a part, before you make any investment decision with respect to shares of our common stock.
The selling stockholders named herein acquired their shares of our common stock as part of the Third Amended Joint Plan of Reorganization (the Plan) under Chapter 11 of the United States Bankruptcy Code (the Bankruptcy Code) of Energy Future Holdings Corp. (EFH Corp.) and the substantial majority of its direct and indirect subsidiaries (collectively, the Debtors), including Energy Future Intermediate Holding Company LLC (EFIH), Energy Future Competitive Holdings Company LLC (EFCH) and our Predecessor, but excluding Oncor Electric Delivery Holdings Company LLC and its direct and indirect subsidiaries (collectively, Oncor). For more information see “Prospectus Summary — Reorganization and Emergence” and “The Reorganization and Emergence.”
The historical financial information and accompanying financial statements and corresponding notes contained in this prospectus for periods prior to October 3, 2016 (the Effective Date) reflect the actual historical consolidated results of operations, cash flows and financial condition of our Predecessor and do not give effect to the Plan, Emergence or the adoption of fresh-start reporting. Thus, such financial information is not representative of our results of operations, cash flows or financial condition subsequent to the Effective Date. Because our Predecessor ceased owning and operating its historical business upon Emergence and Vistra Energy continues to own and operate, directly and indirectly, substantially the same business that our Predecessor owned and operated prior to Emergence and, as of the Effective Date, Vistra Energy applied fresh-start reporting in its financial statements, references herein to “our” historical consolidated financial information (or data derived therefrom) should be read to refer to the historical consolidated financial information of our Predecessor for periods prior to Emergence and to Vistra Energy for periods subsequent to Emergence. See “Management’s Discussion and Analysis of Financial Condition and Results of Operation” for further information.
The selling stockholders may only offer to resell, and seek offers to buy, shares of our common stock in jurisdictions where offers and sales are permitted. You should rely only on the information contained in this prospectus and any accompanying prospectus supplement. Neither we, nor the selling stockholders, have authorized anyone to provide you with information other than that contained in this prospectus or any accompanying prospectus supplement and, if such information is provided to you, then you should not rely on it. Neither we, nor the selling stockholders, take any responsibility for, and can provide no assurance as to the accuracy or completeness of, any other information that others may give you. Neither we, nor the selling stockholders, have authorized any other person to provide you with different or additional information, and neither we nor the selling stockholders are making an offer to sell the shares in any jurisdiction where the offer or
iii
Table of Contents
sale is not permitted. The information contained in this prospectus speaks only as of the date of this prospectus, regardless of the time of delivery of this prospectus or any sale of shares of our common stock hereunder. Our business, financial condition, cash flows, results of operations and prospects may have changed since the date on the front cover of this prospectus.
iv
Table of Contents
GLOSSARY
When the following industry terms and abbreviations appear in this prospectus, they have the meanings indicated below (unless otherwise expressly set forth or as the context otherwise indicates).
| CCGT | Combined cycle gas turbine | |
| CFTC | United States Commodity Futures Trading Commission | |
| CO2 | Carbon dioxide | |
| CSAPR | Cross-State Air Pollution Rule issued by the EPA in July 2011 | |
| CTs | Combustion turbines | |
| DOE | United States Department of Energy | |
| EPA | United States Environmental Protection Agency | |
| ERCOT | Electric Reliability Council of Texas, Inc., the independent system operator and the regional coordinator of various electricity systems within Texas | |
| FERC | United States Federal Energy Regulatory Commission | |
| fossil fuel | A natural fuel, such as coal, oil or natural gas, formed in the geological past from the remains of living organisms | |
| GHG | Greenhouse gas | |
| GWh | Gigawatt-hours | |
| IPP | Independent power producer | |
| ISO | Independent system operator | |
| load | Demand for electricity | |
| market heat rate | The wholesale market price of electricity divided by the market price of natural gas | |
| MATS | Mercury and Air Toxics Standard established by the EPA | |
| MMBtu | Million British thermal units | |
| MW | Megawatts | |
| MWh | Megawatt-hours | |
| MSHA | United States Mine Safety and Health Administration | |
| NERC | North American Electric Reliability Corporation | |
| NOx | Nitrogen oxide | |
| NRC | United States Nuclear Regulatory Commission | |
| NYMEX | The New York Mercantile Exchange, a commodity derivatives exchange | |
| ORDC | Operating Reserve Demand Curve, pursuant to which wholesale electricity prices in the ERCOT real-time market increase automatically as available operating reserves decrease below defined threshold levels | |
| PPAs | Power purchase agreements | |
| PURA | Public Utility Regulatory Act | |
v
Table of Contents
| PUCT | Public Utility Commission of Texas | |
| RCT | Railroad Commission of Texas, which among other things, has oversight of lignite mining activity in Texas | |
| REP | Retail electric provider | |
| SO2 | Sulfur dioxide | |
| TCEQ | Texas Commission on Environmental Quality | |
| TRE | Texas Reliability Entity, Inc., an independent organization that develops reliability standards for the ERCOT region and monitors and enforces compliance with NERC standards and monitors compliance with ERCOT protocols | |
| TWh | Terawatt-hours | |
| VOLL | Value of lost load | |
vi
Table of Contents
This summary highlights the more detailed information contained elsewhere in this prospectus. This summary may not contain all the information that may be important to you. You should carefully read the entire prospectus before making an investment decision, especially the information presented under the heading “Risk Factors.” In this prospectus, except as otherwise indicated herein, or as the context may otherwise require, all references to “Vistra Energy,” “the Company,” “we,” “us” and “our” refer to (a) Vistra Energy Corp., a Delaware corporation, and, unless the context otherwise requires, its direct and indirect subsidiaries and (b) prior to its emergence from bankruptcy (Emergence), Texas Competitive Electric Holdings Company LLC, a Delaware limited liability company, and, unless the context otherwise requires, its direct and indirect subsidiaries (our Predecessor).
Our Company
Vistra Energy is a leading energy company operating an integrated power business in Texas, which includes TXU Energy and Luminant. Through TXU Energy and Luminant, our integrated business engages in retail sales of electricity and related services to end users, wholesale electricity sales and purchases, power generation, commodity risk management, fuel production and fuel logistics management. We are committed to providing superior customer service, maintaining operational excellence, applying an integrated approach to managing risk, applying a disciplined approach to managing costs, continuing our track record of superior corporate responsibility and citizenship and effectively managing through varying business cycles in the competitive power markets. Our goal is to deliver long-term value to our stockholders by maintaining a strong balance sheet and strong liquidity profile in order to provide us with the flexibility to pursue a range of capital deployment strategies, including investing in our current business, funding attractive organic and acquisition-driven growth opportunities and returning capital to our stockholders.
We operate as an integrated company that provides complete electricity solutions to our customers and to the broader ERCOT market. Our company is comprised of:
| • | our brand name retail electricity provider business, TXU Energy™, which is the largest retailer of electricity in Texas with approximately 1.7 million residential, commercial and industrial customers as of December 31, 2016; |
| • | our electricity generation business, Luminant, which is the largest generator of electricity in ERCOT, operating approximately 17,000 MW of fuel-diverse installed capacity in ERCOT as of December 31, 2016; |
| • | our wholesale commodity risk management operation, which dispatches our generation fleet in response to market conditions, markets the electricity generated by our facilities to our customers (including TXU Energy) and the broader ERCOT market, procures fuel from third parties for use at our electric generating facilities and performs the risk management services for Luminant and TXU Energy that enables the delivery of cost-effective electricity to the wholesale market and retail end-users; |
| • | our mining, fuel handling and logistics operations, which supply fuel to our diverse fleet of electric generating facilities; and |
| • | our efficient, low-cost support organizations, which provide the necessary services to meet our compliance obligations, support our integrated electricity solutions and assist in conducting our business in an environmentally responsible and regulatory-compliant manner. |
All of our operations teams (mining and fuel handling; wholesale commodity risk management, asset optimization and generation fleet dispatch; power generation; retail electricity marketing, sales and services; and
1
Table of Contents
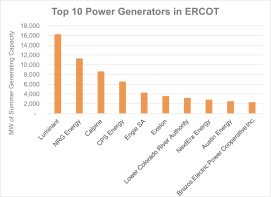
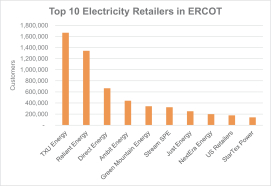
strategic sourcing, supply chain and procurement) are integrated. The integrated nature of these operations allows us, where appropriate, to manage these operations with close alignment, which we believe provides us better market insight and a reduction of the impact of commodity price volatility as compared to our non-integrated competitors. The charts below show our market-leading position among power generators and electricity retailers in Texas. We believe the combination of these charts illustrates the unique opportunity that is created from our integrated business model.
|
| |
| Date: 2015 Source: SNL, a subscription service of S&P Global Market Intelligence |
Date: 2015 Source: Energy Information Administration (EIA) Note: Rankings do not combine a company that may own multiple brands. | |
2
Table of Contents
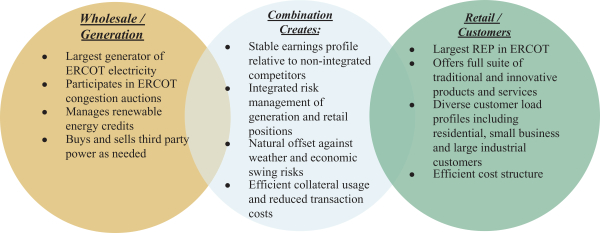
Our Integrated Business Model
We believe the key factor that distinguishes us from others in our industry is the integrated nature of our business (i.e., pairing Luminant’s reliable and efficient mining, generating and wholesale commodity risk management capabilities with TXU Energy’s retail platform) which, in our view, represents a unique company structure in the competitive ERCOT market and other competitive electricity markets across the country. We believe our integrated business model creates a unique opportunity because, relative to our non-integrated competitors, it reduces our exposure to commodity price movements and provides an opportunity for greater earnings stability. Consequently, our integrated business model will be at the core of our business strategy.
The chart below depicts the integrated nature of our business and summarizes the key advantages of our integrated business model.
3
Table of Contents
To further illustrate the benefits of our integrated business model, the chart below highlights the competitive advantages we believe our integrated business model offers as compared to our non-integrated competitors (i.e., pure-play IPPs and non-integrated REPs).
|
IPP Model – Competitive Pressures |
Retail Model – Competitive Pressures |
Vistra Energy – Integrated Advantage |
||||||||||||||
| Commodity Exposure Related |
|
◾ Low price environment puts pressure on “long” commodity IPP model ◾ Lack of depth of wholesale market makes meaningful long term hedging challenging |
◾ Lowprice environment encourages competitive entry ◾ Lackof market depth to hedge supply requirements presents risk management issue |
◾ Mitigatescash flow volatility from exposure to commodity prices ◾ Retailchannel provides an internal offset to generation (and vice versa) ◾ Lowerhedging transaction and collateral costs
|
||||||||||||
| Impact of Technology |
|
◾ Technology advancement in, and subsidization of, wind, solar, and storage ◾ Low load growth environment; trends toward distributed generation and efficiency |
◾ Trend towards energy efficiency and “green” products |
◾ Opportunity to use customer channels to expand integrated model to new technology ◾ Creates new ways to engage customers and promotes long term relationships
|
||||||||||||
| New Entrants |
|
◾ Continued new build at questionable economics leads to high reserve margins & volatility in capacity prices |
◾ Very aggressive / unsustainable pricing from new entrants / competitors |
◾ Retail and wholesale diversification provides earnings stability and capital efficiencies relative to pure-play new entrants
|
||||||||||||
|
Regulatory/ Political |
|
◾ Regulatoryand political focus on emissions ◾ Considerableoversight with numerous restrictions on market behavior ◾ Onerousrules regarding asset retirement |
◾ ERCOT is only fully competitive retail market in North America (price-to-beat expired in 2007) ◾ Non ERCOT retail market faces structural challenges - Default provider sets effective ceiling price - Utilities retain most customers and the customer interface, limiting opportunities to differentiate |
◾ As largest retail provider in ERCOT, the only fully deregulated retail market, TXU Energy lowers risk profile of overall portfolio compared to competitors in other markets |
||||||||||||
While we do not believe there are any material risks specifically related to our integrated business model, see “Risk Factors” for a description of the material risks our business faces.
4
Table of Contents
Our Operations
Our primary operations consist of electricity solutions, including retail sales of electricity and related products to end users, power generation (including operations and maintenance and outage and project management) and sales of electric generating unit output in the wholesale marketplace, asset optimization and commodity risk management performed on an integrated basis for our retail and wholesale positions, and fuel logistics and management. These operations work together on an integrated basis, which allows us to realize efficiencies and alignment in all aspects of the electricity generation and sales operation.
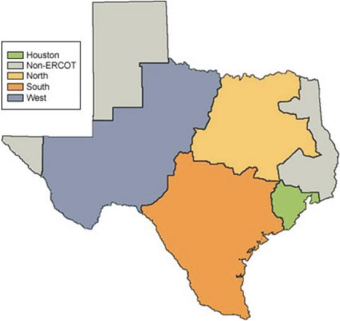
We operate solely in the growing ERCOT electricity market, which we view as one of the most attractive power markets in the United States. As described in more detail below, ERCOT is an ISO that manages the flow of electricity to approximately 24 million Texas customers, representing approximately 90% of the state’s load, and spanning approximately 75% of its geography, as of December 31, 2016.
Texas has one of the fastest growing populations of any state in the United States and has a diverse economy, which has resulted in a significant and growing competitive retail electricity market. We provided electricity to approximately 24% and 18% of the residential and commercial customers in ERCOT, respectively, as of December 31, 2016. We believe we have differentiated ourselves by providing a distinctive customer experience predicated on delivering reliable and innovative power products and solutions to our customers, such as Free Nights and Free Weekends residential plans, MyEnergy DashboardSM, TXU Energy’s iThermostat product and mobile solutions, the TXU Energy Rewards program, the TXU Energy Green UPSM renewable energy credit program and a diverse set of solar options, which give our customers choice, convenience and control over how and when they use electricity and related services. We competitively market our retail electricity and related services to acquire, serve and retain both retail and wholesale customers. Our wholesale customers represent a cross section of industrial users, other competitive retail electric providers, municipalities, cooperatives and other end-users of electricity. We are able to better serve our retail customers through our unique affiliation with our wholesale commodity risk management personnel who are able to structure products and contracts in a way that offers significant value compared to stand-alone retail electric providers. Additionally, our generation business protects our retail business from power price volatility, by allowing it to bypass bid-ask spread in the market (particularly for illiquid products and time periods), which results in significantly lower collateral costs for our retail business as compared to other, non-integrated retail electric providers. Moreover, our retail business reduces, to some extent, the exposure of our wholesale generation business to wholesale power price volatility. This is because the retail load requirements of our retail operations (primarily TXU Energy) provide a natural offset to the length of Luminant’s generation portfolio thereby reducing the exposure to wholesale power price volatility as compared to a non-integrated pure-play IPP.
Our power generation fleet is diverse and flexible in terms of dispatch characteristics as our fleet includes baseload, intermediate/load-following and peaking generation. Our wholesale commodity risk management business is responsible for dispatching our generation fleet in response to market needs after implementing portfolio optimization strategies, thus linking and integrating the generation fleet production with our retail customer and wholesale sales opportunities. Market demand, also known as load, faced by an electric power system such as ERCOT varies from moment to moment as a result of changes in business and residential demand, much of which is driven by weather. Unlike most other commodities, the production and consumption of electricity must remain balanced on an instantaneous basis. There is a certain baseline demand for electricity across an electric power system that occurs throughout the day, which is typically satisfied by baseload generating units with low variable operating costs. Baseload generating units can also increase output to satisfy certain incremental demand and reduce output when demand is unusually low. Intermediate/load-following generating units, which can more efficiently change their output to satisfy increases in demand, typically satisfy a large proportion of changes in intraday load as they respond to daily increases in demand or unexpected changes in supply created by reduced generation from renewable resources or other generator outages. Peak daily loads
5
Table of Contents
are typically satisfied by peaking units. Peaking units are typically the most expensive to operate, but they can quickly start up and shut down to meet brief peaks in demand. In general, baseload units, intermediate/load-following units and peaking units are dispatched into the ERCOT grid in order from lowest to highest variable cost. Price formation in ERCOT, as with other competitive power markets in the United States, is typically based on the highest variable cost unit that clears the market to satisfy system demand at a given point in time.
As of December 31, 2016, our generation fleet consisted of 50 electric generating units, all of which are wholly owned, with the fuel types, dispatch characteristics and total installed nameplate generating capacity as shown in the table below:
| Fuel Type |
Dispatch Type |
Installed Nameplate Generation Capacity (MW) |
Number of Plant Sites |
Number of Units | ||||||||||
| Nuclear |
Baseload | 2,300 | 1 | 2 | ||||||||||
| Lignite |
Baseload | 2,737 | 2 | 4 | ||||||||||
| Lignite/Coal |
Intermediate/Load-Following | 5,280 | 3 | 8 | ||||||||||
| Natural Gas (CCGT) |
Intermediate/Load-Following | 2,988 | 2 | 14 | ||||||||||
| Natural Gas (Steam and CTs) |
Peaking | 3,455 | 7 | 22 | ||||||||||
|
|
|
|
|
|
|
|||||||||
| Total |
16,760 | 15 | 50 | |||||||||||
|
|
|
|
|
|
|
|||||||||
Our wholesale commodity risk management business also procures renewable energy credits from wind generation to support our electricity sales to wholesale and retail customers to satisfy the increasing demand for renewable resources from such customers.
Our generation resources, which represented approximately 17% of the generation capacity in ERCOT as of December 31, 2016, allow us to annually generate, procure and sell approximately 75-85 TWh of electricity to wholesale and retail customers from nuclear, natural gas, lignite, coal and renewable generation resources.
6
Table of Contents
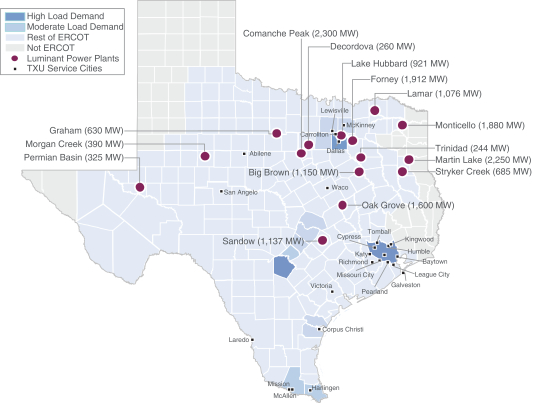
The map below shows our significant footprint in Texas and further demonstrates the integrated nature of our business.
Our Competitive Strengths
We believe we are well-positioned to execute our business strategy of delivering long-term value to our stakeholders based on, among others, the following competitive strengths:
Uniquely situated integrated energy infrastructure company. We believe the key factor that distinguishes us from others in our industry is the integrated nature of our business. We believe this is a unique company structure in the competitive ERCOT market and other competitive electricity markets across the country. It is our view that our integrated business model provides us a competitive advantage and results in more stable earnings under all market environments relative to our non-integrated competitors. In general, non-integrated electricity retailers are subject to wholesale power price and resulting cash flow volatility when demand increases or supply tightens, which can potentially result in significant losses if an electricity retailer is not appropriately hedged. However, because our integrated business model enables us to manage through various price environments, we believe our retail operations (primarily TXU Energy) are not as exposed to wholesale power price volatility as non-integrated retail power companies. Moreover, given the retail load requirements of our retail operations (primarily TXU Energy), the length of Luminant’s generation portfolio is not as exposed to wholesale power price volatility as compared to a non-integrated pure-play IPP. Additionally, our mining operations provide an alternative to other coal procurement sources and give us more flexibility in reaching the most cost-effective arrangements for our coal-fueled facilities. We believe these advantages make our business less subject to volatility risk than pure-play IPPs and non-integrated retail electric providers. Furthermore, we believe our integrated business model allows us to reduce sourcing and transaction costs and minimize credit and collateral requirements.
7
Table of Contents
Highly valued retail brand and customer-focused operations. Our retail business has been operating in the competitive retail electricity market in Texas under the TXU Energy™ brand since 2002. We believe this has created strong brand recognition throughout ERCOT, enabling us to effectively acquire, serve and retain a broad spectrum of retail electricity customers. Our TXU Energy™ brand is viewed by customers as a symbol of a trustworthy, customer-centric, innovative and dependable electricity service. By leveraging our retail marketing capabilities, commitment to product innovation and deep knowledge of the ERCOT market and its customer base, we believe that we can maintain and grow our position as the largest retailer of electricity in the highly competitive ERCOT retail market. We have an operating model that has delivered attractive margins and strong customer satisfaction that has been consistently ranked by the PUCT as having among the lowest customer complaint rates in the ERCOT market. We drive positive results in our retail electricity business by functioning as a technology driven, multi-channel marketer with advanced analytics and product development capabilities. We believe our strong customer service, innovative products and trusted brand recognition have resulted in us maintaining the highest residential customer retention rate of any Texas retail electric provider in its respective core market.
Diversified generation sources and critical energy infrastructure. We maintain operational flexibility to provide reliable and responsive power under a variety of market conditions by utilizing generation sources that are diverse and flexible in terms of fuel types (nuclear, lignite, coal, natural gas and renewables) and dispatch characteristics (baseload, intermediate/load-following, peaking and non-dispatchable). These generation sources feature the following characteristics:
| • | Except for periods of scheduled maintenance activities, our nuclear-fueled units are generally available to run at capacity. |
| • | Except for periods of scheduled maintenance activities, our lignite- and coal-fueled units are available to run at capacity or seasonally, depending on market conditions (i.e., during periods when wholesale electricity prices are greater than the unit’s variable production costs). Certain of these units run only during the summer peak period and at times go into seasonal layup during the months with lower seasonal demand. |
| • | Our CCGT units generally run during the intermediate/load-following periods of the daily supply curve. |
| • | Our natural gas-fueled generation peaking units supplement the aggregate nuclear-, lignite- and coal-fueled and CCGT generation capacity in meeting demand during peak load periods because production from certain of these units, particularly combustion-turbine units, can be more quickly adjusted up or down as demand warrants. With this quick-start capability, we are able to increase generation during periods of supply or demand volatility in ERCOT and capture scarcity pricing in the wholesale electricity market. These natural gas-fueled generation peaking units also help us mitigate unit-contingent outage risk by allowing us to meet demand even if one or more of our nuclear, lignite, coal or CCGT units is taken offline for maintenance. |
| • | The CCGT and natural gas-fueled generation peaking units also play a pivotal and increasing role in the ERCOT market by supplementing intermittent renewable generation through their versatile operations. We expect this versatility to increase in value over time as the ERCOT market continues to expand into renewable resources. |
| • | Our long-term PPAs with various renewable energy providers deliver electricity when natural conditions make renewable resources available. These resources position us to meet the market’s increasing demand for sustainable, low-carbon power solutions. |
In addition, the commodity risk management and asset optimization strategies executed by our commercial operation supplement the electricity generated by our fleet with electricity procured in market transactions to ensure that we are supplying our customers with the most cost-effective electricity options.
8
Table of Contents
Competitive scale and highly effective, low-cost support operations. As an integrated energy company with approximately 17,000 MW of generation capacity and approximately 1.7 million retail electricity customers, each as of December 31, 2016, we operate with significant scale. This scale enables us to conduct our business with certain operational synergies that are not available to smaller power generation or retail electricity businesses. The benefits of our significant scale include improved leverage of our low fixed costs, opportunities to share expertise across the portfolio of assets, enhanced procurement opportunities, development of, and the ability to offer, a wide array of products and services to our customers, diversity of cash flows and a breadth of positive relationships with regulatory and governmental authorities. We believe these advantages, combined with a strong balance sheet and strong liquidity profile, enable us to operate with more financial flexibility than our competitors, and will enable us to prudently grow our existing business and pursue attractive growth opportunities in the future.
Positioned to capture upside in the attractive ERCOT market. We believe that the location of our business, solely in ERCOT, offers attractive upside opportunities. ERCOT is the only fully deregulated electricity market in the United States in that both the wholesale and retail markets are truly competitive. In addition to having a robust wholesale market, the ERCOT residential retail market does not have regulated providers or a standard offer service, which is unique among competitive retail markets in the United States. We believe our integrated business model uniquely positions us to benefit from this attractive, robust marketplace. The ERCOT market represents approximately 90% of the load in Texas, a state that is the seventh-largest power market in the world, according to the United States Energy Information Administration (EIA), and had a population growth rate of 8.8% between July 2010 and July 2015, more than double the United States population growth rate of 3.9% during the same period, according to the U.S. Census Bureau. ERCOT has shown historically above-average load growth compared to other power markets in the United States, according to the EIA, and ERCOT can be viewed as a “power island” due to its limited import and export capacity, which we believe creates a favorable power supply and demand dynamic. Total ERCOT power demand has grown at a compounded annual growth rate of approximately 1.4% from 2005 through 2014, compared to a range of -0.6% to 0.8% in other United States markets, according to ERCOT and the EIA, respectively.
In addition, in general, Luminant’s generation portfolio (primarily the nuclear, lignite and coal generation facilities) is positioned to increase in value to the extent there is a rebound in forward natural gas prices. We cannot predict, however, whether or not forward natural gas prices will rebound or the timing of any such rebound if it were to occur in the future.
Strong balance sheet and strong liquidity profile. In connection with Emergence, a substantial amount of the debt of our Predecessor was eliminated. As a result, we believe our balance sheet is strong given our low leverage relative to the cash flows generated from our integrated business. Further, we believe our financial leverage is prudent and, together with our strong cash flow and strong liquidity profile, provides us with significant competitive advantages relative to, and sets us apart from, our competitors, especially those that have much more leverage than we do. We believe that our integrated business model further improves our liquidity profile relative to our non-integrated competitors because such integration reduces our retail operations’ exposure to wholesale electricity price volatility resulting in our retail operations having lower collateral requirements with counterparties and ERCOT. We also believe a strong balance sheet allows us to manage through periods of commodity price volatility that may require incremental liquidity and positions us well to pursue a range of capital deployment strategies, including investing in our current business, funding attractive organic and acquisition-driven growth opportunities and returning capital to our stockholders.
Proven, experienced management team. The members of our senior management team have significant industry experience, including experience operating in a competitive retail electricity environment, operating sophisticated power generation facilities, operating a safe and cost-efficient mining organization and managing
9
Table of Contents
the risks of competitive wholesale and retail electricity businesses. We believe that our management team’s history of safe and reliable operations in our industry, breadth of positive relationships with regulatory and legislative authorities and commitment to a disciplined and prudent operating cost structure and capital allocation will benefit our stakeholders. Moreover, between personal investments in our common stock and our incentive compensation arrangements, our management team has a meaningful stake in Vistra Energy, thereby closely aligning incentives between management and our stockholders.
Our Business Strategy
Our business strategy is to deliver long-term stakeholder value through a multi-faceted focus on the following areas:
Integrated business model. Our business strategy will be guided by our integrated business model because we believe it is our core competitive advantage and differentiates us from our non-integrated competitors. We believe our integrated business model creates a unique opportunity because, relative to our non-integrated competitors, it insulates us from commodity price movements and provides unique earnings stability. Consequently, our integrated business model will be at the core of our business strategy.
Superior customer service. Through TXU Energy, we serve the retail electricity needs of end-use residential, small business, commercial and industrial electricity customers through multiple sales and marketing channels. In addition to benefitting from our integrated business model, we leverage our strong brand, our commitment to a consistent and reliable product offering, the backstop of the electricity generated by our generation fleet, our industry-leading wholesale commodity risk management operations and exceptional, innovative and dependable customer service to differentiate our products and services from our competitors. We strive to be at the forefront of innovation with new offerings and customer experiences to reinforce our value proposition. We maintain a focus on solutions that give our customers choice, convenience and control over how and when they use electricity and related services. Our focus on superior customer service will guide our efforts to acquire new residential and commercial customers, serve and retain existing customers and maintain valuable sales channels for our electricity generation resources. We believe our strong customer service, innovative products and trusted brand have resulted in us maintaining the highest residential customer retention rate of any Texas retail electric provider in its respective core market.
Excellence in operations while maintaining an efficient cost structure. We believe that operating our facilities in a safe, reliable, environmentally-compliant, and cost-effective and efficient manner is a foundation for delivering long-term stakeholder value. We also believe value increases as a function of making disciplined investments that enable our generation facilities to operate not only effectively and efficiently, but also safely, reliably and in an environmentally-compliant manner. We believe that an ongoing focus on operational excellence and safety is a key component to success in a highly competitive environment and is part of the unique value proposition of our integrated model. Additionally, we are committed to optimizing our cost structure and implementing enterprise-wide process and operating improvements without compromising the safety of our communities, customers and employees. In connection with Emergence, in addition to significantly reducing our debt levels, we implemented certain cost-reduction actions in order to better align and right-size our cost structure. We believe we have a highly effective and efficient cost structure and that our cost structure supports excellence in our operations.
Integrated hedging and commercial management. Our commercial team is focused on managing risk, through opportunistic hedging, and optimizing our assets and business positions. We actively manage our exposure to wholesale electricity prices in ERCOT, on an integrated basis, through contracts for physical delivery of electricity, exchange-traded and over-the-counter financial contracts, ERCOT term, day-ahead and real-time market transactions and bilateral contracts with other wholesale market participants, including other power
10
Table of Contents
generators and end-user electricity customers. These hedging activities include short-term agreements, long-term electricity sales contracts and forward sales of natural gas through financial instruments. The historically positive correlation between natural gas prices and wholesale electricity prices in the ERCOT market has provided us an opportunity to manage our exposure to the variability of wholesale electricity prices through natural gas hedging activities. We seek to hedge near-term cash flow and optimize long-term value through hedging and forward sales contracts. We believe our integrated hedging and commercial management strategy, in combination with a strong balance sheet and strong liquidity profile, will provide a long-term advantage through cycles of higher and lower commodity prices.
Disciplined capital allocation. Like any energy-focused business, we are potentially subject to significant commodity price volatility and capital costs. Accordingly, our strategy is to maintain a balance sheet with prudent financial leverage supported by readily accessible, flexible and diverse sources of liquidity. Our ongoing capital allocation priorities primarily include making necessary capital investments to maintain the safety and reliability of our facilities. Because we believe cost discipline and strong management of our assets and commodity positions are necessary to deliver long-term value to our stakeholders, we generally make capital allocation decisions that we believe will lead to attractive cash returns on investment. We are focused on optimal deployment of capital and intend to evaluate a range of capital deployment strategies including return of capital to stockholders in the form of dividends and/or share repurchases, investments in our current business and acquisition-driven growth investments.
Growth and enhancement. Our growth strategy leverages our core capabilities of multi-channel retail marketing in a large and competitive market, operating large-scale, environmentally sensitive, and diverse assets across a variety of fuel technologies, fuel logistics and management, commodity risk management, cost control, and energy infrastructure investing. We intend to opportunistically evaluate acquisitions of high-quality energy infrastructure assets and businesses that complement these core capabilities and enable us to achieve operational or financial synergies. To that end, our primary focus will target growth opportunities that expand or enhance our business position within ERCOT and are consistent with our integrated business model (including our stable earnings profile as compared to our non-integrated competitors). While we solely operate within ERCOT currently, we intend to evaluate energy infrastructure growth opportunities outside ERCOT that offer compelling value creation opportunities, including cost and operational improvements, organic growth opportunities and attractive and stable earnings profiles featuring multiple revenue streams. We also believe that there will continue to be significant acquisition opportunities for competitive power generation assets and retail electricity businesses in power markets in the United States based on, among other things, the continuing trend of separating competitive power generation assets from regulated utility assets. While we are intent on growing our business and creating value for our stockholders, we are committed to making disciplined investments that are consistent with our focus on maintaining a strong balance sheet and strong liquidity profile. As a result, consistent with our disciplined capital allocation approval process, growth opportunities we pursue will need to have compelling economic value in addition to fitting with our business strategy.
Corporate responsibility and citizenship. We are committed to providing safe, reliable, cost-effective and environmentally-compliant electricity for the communities and customers we serve. We strive to improve the quality of life in the communities in which we operate. We are also committed to being a good corporate citizen in the communities in which we conduct our operations. Our company and our employees are actively engaged in programs intended to support and strengthen the communities in which we conduct our operations. Our foremost giving initiatives, the United Way and TXU Energy Aid campaigns, have raised more than $30 million in employee and corporate contributions since 2000. Additionally, for more than 30 years, TXU Energy Aid has served as an integral resource for social service agencies that assist families in need, having helped more than 500,000 customers across Texas pay their electricity bills.
11
Table of Contents
The ERCOT Market
ERCOT is an ISO that manages the flow of electricity from approximately 78,000 MW of installed capacity to approximately 24 million Texas customers, representing approximately 90% of the state’s electric load and spanning approximately 75% of its geography, as of December 31, 2016. ERCOT is a highly competitive wholesale electricity market with historically above-average demand growth, limited import and export capacity and increasing wholesale price caps, and is the seventh-largest power market in the world, according to the EIA. Population growth in Texas is currently expanding at well above the national average rate, with a growth rate of 8.8% between July 2010 and July 2015, more than double the United States population growth rate of 3.9% during the same period, according to the U.S. Census Bureau. ERCOT accounts for approximately 32% of the competitively served retail load in the United States and residential consumers in the ERCOT market consume approximately 32% more electricity than the average United States residential consumer according to the EIA. Total ERCOT power demand has grown at a compounded annual growth rate of approximately 1.4% from 2005 through 2014, compared to a range of -0.6% to 0.8% in other United States markets, according to ERCOT and the EIA, respectively. ERCOT was formed in 1970 and became the first ISO in the United States in September 1996. The following map illustrates ERCOT by regions:
Risk Factors
We face numerous risks related to, among other things, our business operations, our strategies, general economic conditions, competitive dynamics of the industry, commodity and fuel prices and the legal and regulatory environment in which we operate. These risks are set forth in detail under the heading “Risk Factors” and include:
| • | The impacts on our business of decreases in market prices for electricity; |
| • | Our ability to effectively hedge against changes in commodity prices and market heat rates; |
| • | Complex government regulations and legislation that impact our business and operations; |
| • | Significant competition in retail electricity markets; and |
| • | The impacts of extreme weather conditions and seasonality on our operations. |
12
Table of Contents
If any of these risks should materialize, they could have a material adverse effect on our business, financial condition, results of operations, liquidity and/or growth strategies. We encourage you to review these risk factors carefully. Furthermore, this prospectus contains forward-looking statements that involve risks, uncertainties and assumptions. Actual results may differ materially from those anticipated in these forward-looking statements as a result of many factors. For more information regarding these risks see “Risk Factors,” “Management’s Discussion and Analysis of Financial Condition and Results of Operations,” “Business” and “Special Note Regarding Forward-Looking Statements.”
Reorganization and Emergence
On April 29, 2014 (the Petition Date), Energy Future Holdings Corp. (EFH Corp.) and the substantial majority of its direct and indirect subsidiaries, including Energy Future Intermediate Holding Company LLC (EFIH), Energy Future Competitive Holdings Company LLC (EFCH) and our Predecessor, Texas Competitive Electric Holdings Company LLC, but excluding Oncor Electric Holdings Company LLC and its direct and indirect subsidiaries (Oncor), filed for bankruptcy protection (the Bankruptcy Filing or Petition) pursuant to Chapter 11 of the United States Bankruptcy Code (the Bankruptcy Code). We refer to EFH Corp. and the other entities that filed for bankruptcy collectively as the Debtors.
The Bankruptcy Filing resulted primarily from the Debtors’ (including our Predecessor’s) inability to support the significant interest payments and pending debt maturities related to the substantial debt EFH Corp. had previously incurred in connection with the leveraged buy-out of EFH Corp. in October 2007 as a result of, among other things, lower wholesale electricity prices in ERCOT driven by the sustained decline in natural gas prices since mid-2008.
On August 29, 2016, the United States Bankruptcy Court for the District of Delaware (the Bankruptcy Court) confirmed the Debtors’ Third Amended Joint Plan of Reorganization (the Plan) solely with respect to EFCH and its subsidiaries (including our Predecessor) and certain other subsidiaries of EFH Corp. described in the Plan. We refer to these Debtors collectively as the T-Side Debtors. All of the other Debtors, which include EFH Corp. and EFIH, remain in bankruptcy and are referred to collectively as the EFH Debtors.
On October 3, 2016 (the Effective Date), the Plan with respect to the T-Side Debtors, including our Predecessor, became effective and the T-Side Debtors consummated their reorganization under the Bankruptcy Code and emerged from bankruptcy. Pursuant to the Plan, in connection with Emergence, among other actions, Vistra Energy was formed and became the ultimate parent holding company for the subsidiaries of our Predecessor and certain other subsidiaries of EFH Corp. identified in the Plan. In exchange for the cancellation of their allowed claims against our Predecessor, first-lien creditors of our Predecessor, including the selling stockholders named in this prospectus, received, among other things, newly issued shares of Vistra Energy common stock as well as certain rights (the TRA Rights) to receive payments from Vistra Energy of certain tax benefits, including those it realized as a result of the transactions entered into at Emergence under the terms of a tax receivable agreement (the Tax Receivable Agreement). See “Certain Relationships and Related Party Transactions — Tax Receivable Agreement.”
On the Effective Date, we entered into a number of agreements, including a Registration Rights Agreement (the Registration Rights Agreement), pursuant to which we agreed, among other matters, to register for resale with the Securities and Exchange Commission (the Commission) the shares of our common stock issued to the selling stockholders in connection with Emergence transactions. See “Certain Relationships and Related Party Transactions — Registration Rights Agreement.”
13
Table of Contents
The following chart shows the ownership structure of Vistra Energy and certain of its key subsidiaries after giving effect to Emergence. Except for the preferred stock of Vistra Preferred Inc. (PrefCo), all subsidiaries of Vistra Energy Corp. reflected on this chart are 100% owned, directly or indirectly.
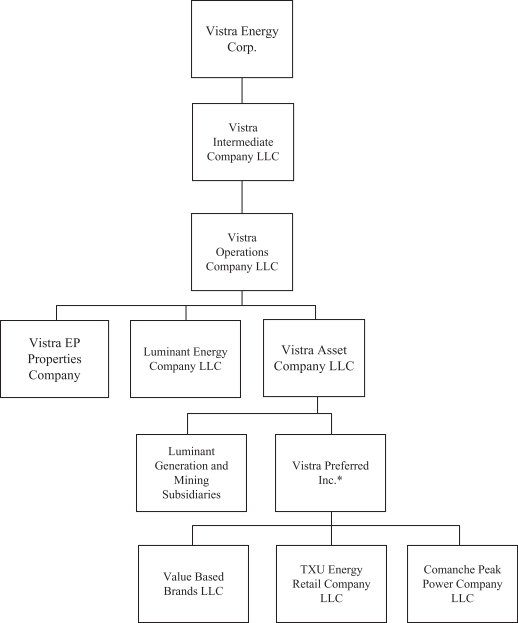
As of May 1, 2017
| * | 100% of the common stock (1,000,000 shares) is held by Vistra Asset Company LLC. 100% of the preferred stock (70,000 shares) is held by outside investors. The holders of the preferred stock have no voting or other control rights over PrefCo, except (a) as required by the Delaware General Corporation Law, (b) in the event PrefCo fails to pay dividends payable on the preferred stock in full for 12 consecutive dividend payment dates, |
14
Table of Contents
| (c) in connection with the authorization, creation or issuance of any securities of PrefCo senior to the preferred stock or (d) upon any attempt to amend, alter or repeal any provisions of PrefCo’s certificate of incorporation to materially and adversely affect the voting powers, rights or preferences of such holders. |
For a more detailed discussion of the Bankruptcy Filing and Emergence see “The Reorganization and Emergence.”
Recent Developments
On December 8, 2016, the board of directors of Vistra Energy (the Board) approved the payment of a special cash dividend in the aggregate amount of approximately $992 million (the 2016 Special Dividend) to holders of record of our common stock on December 19, 2016. On December 14, 2016, Vistra Operations Company LLC (Vistra Operations) obtained (i) $1 billion aggregate principal amount of incremental term loans (the 2016 Incremental Term Loans) and (ii) $110 million of incremental revolving credit commitments under the Vistra Operations Credit Facilities (as defined herein). See “Description of Indebtedness — Credit Facilities” for further information. On December 30, 2016, Vistra Energy paid the 2016 Special Dividend of approximately $992 million with the proceeds from the 2016 Incremental Term Loans.
Vistra Operations entered into an amendment to the Vistra Operations Credit Facilities, effective February 6, 2017, to reduce the interest rates on its Initial Term Loan B Facility, Term Loan C Facility and Revolving Credit Facility (each as defined herein). See “Description of Indebtedness—Credit Facilities—Interest Rate and Fees” for further information. No additional debt was incurred, nor any proceeds received, by Vistra Operations in connection with such amendment.
15
Table of Contents
The Offering
The selling stockholders may offer all, some or none of their shares of our common stock from time to time. Please see “Plan of Distribution.”
The following table provides information regarding our common stock. The outstanding share information shown below is based on shares of our common stock outstanding as of April 25, 2017.
| Issuer |
Vistra Energy Corp. |
| Outstanding common stock that may be offered by the selling stockholders |
Up to 168,779,076 shares |
| Common stock outstanding |
427,587,401 shares (1) |
| Use of proceeds |
We will not receive any of the proceeds from the resale of our common stock by the selling stockholders. See “Use of Proceeds” and “Principal and Selling Stockholders.” |
| Symbol for common stock |
“VST ” |
| Determination of offering price |
The selling stockholders may resell all or any part of the shares of our common stock offered hereby from time to time at fixed prices, prevailing market prices at the times of sale, prices related to such prevailing market prices, varying prices determined at the times of sale or negotiated prices. |
| Dividend policy |
We have no present intention to pay cash dividends on our common stock. However, we are focused on optimal deployment of capital and intend to evaluate a range of capital deployment strategies, including the return of capital to stockholders in the form of dividends and/or share repurchases. |
| Any determination to pay dividends to holders of our common stock or to repurchase our common stock in the future will be at the sole discretion of the Board and will depend upon many factors, including our historical and anticipated financial condition, cash flows, liquidity and results of operations, capital requirements, market conditions, our growth strategy and the availability of growth opportunities, contractual prohibitions (including, but not limited to, the Tax Matters Agreement (as defined herein)), our level of indebtedness and other restrictions with respect to the payment of dividends, applicable law and other factors that the Board deems relevant. See “Market Prices and Dividend Policy—Dividends and Dividend Policy.” |
| Risk factors |
Before making a decision to invest in our common stock, you should carefully consider the information referred to under the heading “Risk Factors” beginning on page 21. |
| (1) | Unless indicated otherwise in this prospectus, the number of shares outstanding does not include: |
| • | 7,210,234 shares of common stock issuable upon exercise of stock options issued pursuant to our 2016 Incentive Plan (as defined herein); |
16
Table of Contents
| • | 2,109,211 shares of common stock issuable following vesting in settlement of restricted stock units outstanding under our 2016 Incentive Plan; and |
| • | 13,173,386 shares of common stock reserved for future issuance under our 2016 Incentive Plan. |
17
Table of Contents
Summary Historical and Unaudited Pro Forma Condensed Consolidated Financial Information
Summary Historical Financial Information
The following tables set forth summary historical consolidated financial information for Vistra Energy (the Successor) for periods subsequent to the Effective Date and TCEH (our Predecessor) for periods prior to the Effective Date. The financial statements of the Successor are not comparable to the financial statements of our Predecessor as those periods prior to the Effective Date do not give effect to any adjustments to the carrying values of assets or amounts of liabilities that resulted from the Plan, and the related application of fresh start reporting, which includes accounting policies implemented by Vistra Energy that may differ from our Predecessor. The summary historical consolidated financial information of the Successor as of December 31, 2016 and for the period from October 3, 2016 through December 31, 2016 and of our Predecessor as of December 31, 2015 and for the period from January 1, 2016 through October 2, 2016 and the years ended December 31, 2015 and 2014 are derived from Vistra Energy’s audited consolidated financial statements included elsewhere in this prospectus. The summary historical consolidated financial information of our Predecessor as of December 31, 2014 and 2013 have been derived from our Predecessor’s historical audited consolidated balance sheet not included in this prospectus. These tables should be read in conjunction with “Selected Historical Consolidated Financial Information,” “Management’s Discussion and Analysis of Financial Condition and Results of Operations,” the consolidated financial statements as well as our unaudited pro forma condensed consolidated financial statements and, in each case, the related notes included elsewhere in this prospectus.
| Successor | Predecessor | |||||||||||||||||||
| Period from October 3, 2016 through December 31, 2016 |
Period from January 1, 2016 through October 2, 2016 |
Year Ended December 31, |
||||||||||||||||||
| 2015 | 2014 | 2013 | ||||||||||||||||||
| (in millions, except per share amounts) | ||||||||||||||||||||
| Operating revenues |
$ | 1,191 | $ | 3,973 | $ | 5,370 | $ | 5,978 | $ | 5,899 | ||||||||||
| Impairment of goodwill |
$ | — | $ | — | $ | (2,200 | ) | $ | (1,600 | ) | $ | (1,000 | ) | |||||||
| Impairment of long-lived assets |
$ | — | $ | — | $ | (2,541 | ) | $ | (4,670 | ) | $ | (140 | ) | |||||||
| Operating income (loss) |
$ | (161 | ) | $ | 568 | $ | (4,091 | ) | $ | (6,015 | ) | $ | (1,113 | ) | ||||||
| Net income (loss) (a) |
$ | (163 | ) | $ | 22,851 | $ | (4,677 | ) | $ | (6,229 | ) | $ | (2,197 | ) | ||||||
| Cash provided by (used in) operating activities |
$ | 81 | $ | (238 | ) | $ | 237 | $ | 444 | $ | (270 | ) | ||||||||
| Weighted average shares of common stock outstanding — basic and diluted |
428 | — | — | — | — | |||||||||||||||
| Net loss per weighted average share of common stock outstanding — basic and diluted |
$ | (0.38 | ) | — | — | — | — | |||||||||||||
| Dividends declared per share of common stock |
$ | 2.32 | — | — | — | — | ||||||||||||||
| Successor | Predecessor | |||||||||||||||
| At December 31, 2016 |
At December 31, | |||||||||||||||
| 2015 | 2014 | 2013 | ||||||||||||||
| (in millions) | ||||||||||||||||
| Total assets (b)(c) |
$ | 15,167 | $ | 15,658 | $ | 21,343 | $ | 28,822 | ||||||||
| Property, plant & equipment — net (b)(c) |
$ | 4,443 | $ | 9,349 | $ | 12,288 | $ | 17,649 | ||||||||
| Goodwill and intangible assets |
$ | 5,112 | $ | 1,331 | $ | 3,688 | $ | 5,669 | ||||||||
| Borrowings, debt and pre-petition loans and other debt |
||||||||||||||||
| Borrowings under debtor-in-possession credit facilities (d) |
$ | — | $ | 1,425 | $ | 1,425 | $ | — | ||||||||
| Debt (e) |
$ | 4,577 | $ | 3 | $ | 51 | $ | 26,146 | ||||||||
| Pre-Petition notes, loans and other debt reported as liabilities subject to compromise (f) |
$ | — | $ | 31,668 | $ | 31,856 | $ | — | ||||||||
| Borrowings under Predecessor’s credit facilities (g) |
$ | — | $ | — | $ | — | $ | 2,054 | ||||||||
| Total equity/membership interests |
6,597 | (22,884 | ) | (18,209 | ) | (11,982 | ) | |||||||||
18
Table of Contents
| (a) | Predecessor period from January 1, 2016 through October 2, 2016 includes net gains totaling $22.121 billion related to bankruptcy-related reorganization items including gains on extinguishing claims pursuant to the Plan. |
| (b) | As of December 31, 2016, amount includes the Lamar and Forney natural gas generation facilities purchased in April 2016. See Note 6 to the 2016 Annual Financial Statements for further discussion. |
| (c) | Reflects the impacts of impairment charges related to long-lived assets of $2.541 billion and $4.670 billion in the years ended December 31, 2015 and 2014, respectively (see Note 8 to the 2016 Annual Financial Statements). |
| (d) | Borrowings under debtor-in-possession credit facilities are classified as noncurrent as of December 31, 2014 and due currently as of December 31, 2015. |
| (e) | For all periods presented, excludes amounts with contractual maturity dates in the following twelve months. |
| (f) | As of December 31, 2015 and 2014, includes both unsecured and under secured obligations incurred prior to the Petition Date, but excludes pre-petition obligations that were fully secured and other obligations that were allowed to be paid as ordered by the Bankruptcy Court. As of December 31, 2014, also excludes $702 million of deferred debt issuance and extension costs. |
| (g) | Excludes borrowings under debtor-in-possession credit facilities. |
19
Table of Contents
Summary Unaudited Pro Forma Condensed Consolidated Financial Information
The following table sets forth summary unaudited pro forma condensed consolidated financial information, which combines the condensed consolidated financial information of our Predecessor for the period from January 1, 2016 through October 2, 2016 and our Successor for the period from October 3, 2016 through December 31, 2016. The pro forma adjustments give effect to (i) the implementation of all reorganization transactions contemplated by the Plan, (ii) the application of fresh-start reporting for the emerged entity, Vistra Energy, and (iii) the incurrence of the $1 billion 2016 Incremental Term Loans. The unaudited pro forma condensed consolidated statements of income (loss) for the year ended December 31, 2016 give effect to the pro forma adjustments as if each adjustment had occurred on January 1, 2016, the first day of the last fiscal year presented. The summary unaudited pro forma condensed consolidated financial information is provided for illustrative purposes only and does not purport to represent what our actual condensed consolidated results of operations would have been had the adjustments occurred on the dates assumed, nor is it necessarily indicative of future condensed consolidated results of operations.
This information is only a summary and should be read in conjunction with “Risk Factors,” “Selected Historical Consolidated Financial Information,” “Unaudited Pro Forma Condensed Consolidated Financial Information” and “Management’s Discussion and Analysis of Financial Condition and Results of Operations,” which are included elsewhere in this prospectus. Among other things, the pro forma financial statements included in “Unaudited Pro Forma Condensed Consolidated Financial Information” provide more detailed information regarding the basis of presentation for, and the adjustments and assumptions underlying, the information in the following tables.
| Historical | ||||||||||||||||||
| Predecessor | Successor | |||||||||||||||||
| Period from January 1, 2016 through October 2, 2016 |
Period from October 3, 2016 through December 31, 2016 |
Pro Forma Adjustments |
Vistra Energy Pro Forma As Adjusted |
|||||||||||||||
| Statement of Income (Loss) Information: |
||||||||||||||||||
| Operating revenues |
$ | 3,973 | $ | 1,191 | $ | 253 | $ | 5,417 | ||||||||||
| Interest expense and related charges |
$ | (1,049 | ) | $ | (60 | ) | $ | 882 | $ | (227 | ) | |||||||
| Net income (loss) (a) |
$ | 22,851 | $ | (163 | ) | $ | (22,698 | ) | $ | (10 | ) | |||||||
| (a) | Predecessor period from January 1, 2016 through October 2, 2016 includes net gains totaling $22.121 billion related to bankruptcy-related reorganization items including gains on extinguishing claims pursuant to the Plan. |
20
Table of Contents
Important factors, in addition to others specifically addressed in “Management’s Discussion and Analysis of Financial Condition and Results of Operations,” that could have a material adverse effect on our business, results of operations, liquidity, financial condition and prospects and the market prices of our common stock, which we refer to collectively as a material adverse effect on us (or comparable phrases), or could cause results or outcomes to differ materially from those contained in or implied by any forward-looking statement in this prospectus, are described below. There may be further risks and uncertainties that are not currently known or that are not currently believed to be material that may adversely affect our business, results of operations, liquidity, financial condition and prospects and the market price of our common stock in the future. The realization of any of these factors could cause investors in our common stock to lose all or a substantial portion of their investment.
Market, Financial and Economic Risks
Our revenues, results of operations and operating cash flows generally are negatively impacted by decreases in market prices for electricity.
We are not guaranteed any rate of return on capital investments in our businesses. We conduct integrated power generation and retail electricity activities, focusing on power generation, wholesale electricity sales and purchases, retail sales of electricity and services to end users and commodity risk management. Our wholesale and retail businesses are to some extent countercyclical in nature, particularly for the wholesale power and ancillary services supplied to the retail business. However, we do have a wholesale power position that exceeds the overall load requirements of our retail business and is subject to wholesale power price moves. As a result, our revenues, results of operations and operating cash flows depend in large part upon wholesale market prices for electricity, natural gas, uranium, lignite, coal, fuel and transportation in our regional market and other competitive markets and upon prevailing retail electricity rates, which may be impacted by, among other things, actions of regulatory authorities. Market prices may fluctuate substantially over relatively short periods of time. Demand for electricity can fluctuate dramatically, creating periods of substantial under- or over-supply. Over-supply can also occur as a result of the construction of new power plants, as we have observed in recent years. During periods of over-supply, electricity prices might be depressed. Also, at times there may be political pressure, or pressure from regulatory authorities with jurisdiction over wholesale and retail energy commodity and transportation rates, to impose price limitations, bidding rules and other mechanisms to address volatility and other issues in these markets.
Some of the fuel for our generation facilities is purchased under short-term contracts. Fuel costs (including diesel, natural gas, lignite, coal and nuclear fuel) may be volatile, and the wholesale price for electricity may not change at the same rate as changes in fuel costs. In addition, we purchase and sell natural gas and other energy related commodities, and volatility in these markets may affect costs incurred in meeting obligations.
Volatility in market prices for fuel and electricity may result from, among other factors:
| • | volatility in natural gas prices; |
| • | volatility in ERCOT market heat rates; |
| • | volatility in coal and rail transportation prices; |
| • | volatility in nuclear fuel and related enrichment and conversion services; |
| • | severe or unexpected weather conditions, including drought and limitations on access to water; |
| • | seasonality; |
| • | changes in electricity and fuel usage resulting from conservation efforts, changes in technology or other factors; |
| • | illiquidity in the wholesale electricity or other commodity markets; |
| • | transmission or transportation disruptions, constraints, inoperability or inefficiencies; |
21
Table of Contents
| • | availability of competitively-priced alternative energy sources or storage; |
| • | changes in market structure and liquidity; |
| • | changes in the manner in which we operate our facilities, including curtailed operation due to market pricing, environmental, safety or other factors; |
| • | changes in generation efficiency; |
| • | outages or otherwise reduced output from our generation facilities or those of our competitors; |
| • | the addition of new electric capacity, including the construction of new power plants; |
| • | our creditworthiness and liquidity and the willingness of fuel suppliers and transporters to do business with us; |
| • | changes in the credit risk or payment practices of market participants; |
| • | changes in production and storage levels of natural gas, lignite, coal, uranium, diesel and other refined products; |
| • | natural disasters, wars, sabotage, terrorist acts, embargoes and other catastrophic events; and |
| • | federal, state and local energy, environmental and other regulation and legislation. |
All of our generation facilities are located in the ERCOT market, a market with limited interconnections to other markets. The price of electricity in the ERCOT market is typically set by natural gas-fueled generation facilities, with wholesale electricity prices generally tracking increases or decreases in the price of natural gas. A substantial portion of our supply volumes in 2015 and 2016 were produced by our nuclear-, lignite- and coal-fueled generation assets. Natural gas prices have generally trended downward since mid-2008 (from $11.12 per MMBtu in mid-2008 to $2.46 per MMBtu for the average settled price for the year ended December 31, 2016). Furthermore, in recent years, natural gas supply has outpaced demand primarily as a result of development and expansion of hydraulic fracturing in natural gas extraction, and the supply/demand imbalance has resulted in historically low natural gas prices. Because our baseload generating units and a substantial portion of our load following generating units are nuclear-, lignite- and coal-fueled, our results of operations and operating cash flows have been negatively impacted by the effect of low natural gas prices on wholesale electricity prices without a significant decrease in our operating cost inputs. Various industry experts expect this supply/demand imbalance to persist for a number of years, thereby depressing natural gas prices for a long-term period. As a result, the financial results from, and the value of, our generation assets could remain depressed or could materially decrease in the future unless natural gas prices rebound materially.
Wholesale electricity prices also track ERCOT market heat rates, which can be affected by a number of factors, including generation availability and the efficiency of the marginal supplier (generally natural gas-fueled generation facilities) in generating electricity. Our market heat rate exposure is impacted by changes in the availability of generating resources, such as additions and retirements of generation facilities, and the mix of generation assets in ERCOT. For example, increasing renewable (wind and solar) generation capacity generally depresses market heat rates. Additionally, construction of more efficient generation capacity also depresses market heat rates. Decreases in market heat rates decrease the value of all of our generation assets because lower market heat rates generally result in lower wholesale electricity prices. Even though market heat rates have generally increased over the past several years, wholesale electricity prices have declined due to the greater effect of falling natural gas prices. As a result, the financial results from, and the value of, our nuclear-, lignite- and coal-fueled generation assets could significantly decrease in profitability and value and our financial condition and results of operations may be negatively impacted if ERCOT market heat rates decline.
A sustained decrease in the financial results from, or the value of, our generation units ultimately could result in the retirement or idling of certain generation units. In recent years, we have operated certain of our lignite- and coal-fueled generation assets only during parts of the year that have higher electricity demand and, therefore, higher related wholesale electricity prices.
22
Table of Contents
Our assets or positions cannot be fully hedged against changes in commodity prices and market heat rates, and hedging transactions may not work as planned or hedge counterparties may default on their obligations.
We cannot fully hedge the risks associated with changes in commodity prices, most notably electricity and natural gas prices, because of the expected useful life of our generation assets and the size of our position relative to the duration of available markets for various hedging activities. Generally, commodity markets that we participate in to hedge our exposure to ERCOT electricity prices and heat rates have limited liquidity after two to three years. Further, our ability to hedge our revenues by utilizing cross-commodity hedging strategies with natural gas hedging instruments is generally limited to a duration of four to five years. To the extent we have unhedged positions, fluctuating commodity prices and/or market heat rates can materially impact our results of operations, cash flows, liquidity and financial condition, either favorably or unfavorably.
To manage our financial exposure related to commodity price fluctuations, we routinely enter into contracts to hedge portions of purchase and sale commitments, fuel requirements and inventories of natural gas, lignite, coal, diesel fuel, uranium and refined products, and other commodities, within established risk management guidelines. As part of this strategy, we routinely utilize fixed-price forward physical purchase and sale contracts, futures, financial swaps and option contracts traded in over-the-counter markets or on exchanges. Although we devote a considerable amount of time and effort to the establishment of risk management procedures, as well as the ongoing review of the implementation of these procedures, the procedures in place may not always function as planned and cannot eliminate all the risks associated with these activities. For example, we hedge the expected needs of our wholesale and retail customers, but unexpected changes due to weather, natural disasters, consumer behavior, market constraints or other factors could cause us to purchase electricity to meet unexpected demand in periods of high wholesale market prices or resell excess electricity into the wholesale market in periods of low prices. As a result of these and other factors, risk management decisions may have a material adverse effect on us.
Based on economic and other considerations, we may not be able to, or we may decide not to, hedge the entire exposure of our operations from commodity price risk. To the extent we do not hedge against commodity price risk and applicable commodity prices change in ways adverse to us, we could be materially and adversely affected. To the extent we do hedge against commodity price risk, those hedges may ultimately prove to be ineffective.
With the tightening of credit markets that began in 2008 and the expansion of regulatory oversight through various financial reforms, there has been a decline in the number of market participants in the wholesale energy commodities markets, resulting in less liquidity, particularly in the ERCOT electricity market. Notably, participation by financial institutions and other intermediaries (including investment banks) in such markets has declined. Extended declines in market liquidity could adversely affect our ability to hedge our financial exposure to desired levels.
To the extent we engage in hedging and risk management activities, we are exposed to the credit risk that counterparties that owe us money, energy or other commodities as a result of these activities will not perform their obligations to us. Should the counterparties to these arrangements fail to perform, we could be forced to enter into alternative hedging arrangements or honor the underlying commitment at then-current market prices. In such event, we could incur losses or forgo expected gains in addition to amounts, if any, already paid to the counterparties. ERCOT market participants are also exposed to risks that another ERCOT market participant may default on its obligations to pay ERCOT for electricity or services taken, in which case such costs, to the extent not offset by posted security and other protections available to ERCOT, may be allocated to various non-defaulting ERCOT market participants, including us.
23
Table of Contents
Our results of operations and financial condition could be materially and adversely affected if energy market participants continue to construct additional generation facilities (i.e., new-build) in ERCOT despite relatively low power prices in ERCOT and such additional generation capacity results in a reduction in wholesale power prices.
Given the overall attractiveness of ERCOT and certain tax benefits associated with renewable energy, among other matters, energy market participants have continued to construct new generation facilities (i.e., new-build) in ERCOT despite relatively low wholesale power prices. If this market dynamic continues, our results of operations and financial condition could be materially and adversely affected if such additional generation capacity results in an over-supply of electricity in ERCOT that causes a reduction in wholesale power prices in ERCOT.
Our liquidity needs could be difficult to satisfy, particularly during times of uncertainty in the financial markets or during times of significant fluctuation in commodity prices, and we may be unable to access capital on favorable terms or at all in the future, which could have a material adverse effect on us. We currently maintain non-investment grade credit ratings which could negatively affect our ability to access capital on favorable terms or result in higher collateral requirements, particularly if our credit ratings were to be downgraded in the future.
Our businesses are capital intensive. In general, we rely on access to financial markets and credit facilities as a significant source of liquidity for our capital requirements and other obligations not satisfied by cash-on-hand or operating cash flows. The inability to raise capital or to access credit facilities, particularly on favorable terms, could adversely impact our liquidity and our ability to meet our obligations or sustain and grow our businesses and could increase capital costs and collateral requirements, any of which could have a material adverse effect on us.
Our access to capital and the cost and other terms of acquiring capital are dependent upon, and could be adversely impacted by, various factors, including:
| • | general economic and capital markets conditions, including changes in financial markets that reduce available liquidity or the ability to obtain or renew credit facilities on favorable terms or at all; |
| • | conditions and economic weakness in the ERCOT or general United States power markets; |
| • | regulatory developments; |
| • | changes in interest rates; |
| • | a deterioration, or perceived deterioration, of our creditworthiness, enterprise value or financial or operating results; |
| • | a reduction in Vistra Energy Corp.’s or its applicable subsidiaries’ credit ratings; |
| • | our level of indebtedness and compliance with covenants in our debt agreements; |
| • | a deterioration of the creditworthiness or bankruptcy of one or more lenders or counterparties under our credit facilities that affects the ability of such lender(s) to make loans to us; |
| • | security or collateral requirements; |
| • | general credit availability from banks or other lenders for us and our industry peers; |
| • | investor confidence in the industry and in us and the ERCOT wholesale electricity market; |
| • | volatility in commodity prices that increases credit requirements; |
| • | a material breakdown in our risk management procedures; |
| • | the occurrence of changes in our businesses; |
| • | disruptions, constraints, or inefficiencies in the continued reliable operation of our generation facilities; and |
| • | changes in or the operation of provisions of tax and regulatory laws. |
24
Table of Contents
In addition, we currently maintain non-investment grade credit ratings. As a result, we may not be able to access capital on terms (financial or otherwise) as favorable as companies that maintain investment grade credit ratings or we may be unable to access capital at all at times when the credit markets tighten. In addition, our non-investment grade credit ratings may result in counterparties requesting collateral support (including cash or letters of credit) in order to enter into transactions with us.
A downgrade in long-term debt ratings generally causes borrowing costs to increase and the potential pool of investors to shrink, and could trigger liquidity demands pursuant to contractual arrangements. Future transactions by Vistra Energy Corp. or any of its subsidiaries, including the issuance of additional debt, could result in a temporary or permanent downgrade in our credit ratings.
The Vistra Operations Credit Facilities impose restrictions on us and any failure to comply with these restrictions could have a material adverse effect on us.
The Vistra Operations Credit Facilities contain restrictions that could adversely affect us by limiting our ability to meet our capital needs. The Vistra Operations Credit Facilities contain events of default customary for financings of this type. If we fail to comply with the covenants in the Vistra Operations Credit Facilities and are unable to obtain a waiver or amendment, or a default exists and is continuing, the lenders under such agreements could give notice and declare outstanding borrowings thereunder immediately due and payable. Any such acceleration of outstanding borrowings could have a material adverse effect on us.
Certain of our obligations are required to be secured by letters of credit or cash, which increase our costs. If we are unable to provide such security, it may restrict our ability to conduct our business, which could have a material adverse effect on us.
We undertake certain hedging and commodity activities and enter into certain financing arrangements with various counterparties that require cash collateral or the posting of letters of credit which are at risk of being drawn down in the event we default on our obligations. We currently use margin deposits, prepayments and letters of credit as credit support for commodity procurement and risk management activities. Future cash collateral requirements may increase based on the extent of our involvement in standard contracts and movements in commodity prices, and also based on our credit ratings and the general perception of creditworthiness in the markets in which we operate. In the case of commodity arrangements, the amount of such credit support that must be provided typically is based on the difference between the price of the commodity in a given contract and the market price of the commodity. Significant movements in market prices can result in our being required to provide cash collateral and letters of credit in very large amounts. The effectiveness of our strategy may be dependent on the amount of collateral available to enter into or maintain these contracts, and liquidity requirements may be greater than we anticipate or will be able to meet. Without a sufficient amount of working capital to post as collateral, we may not be able to manage price volatility effectively or to implement our strategy. An increase in the amount of letters of credit or cash collateral required to be provided to our counterparties may have a material adverse effect on us.
We may not be able to complete future acquisitions or successfully integrate future acquisitions into our business, which could result in unanticipated expenses and losses.
As part of our growth strategy, we have pursued acquisitions and may continue to do so. Our ability to continue to implement this component of our growth strategy will be limited by our ability to identify appropriate acquisition or joint venture candidates and our financial resources, including available cash and access to capital. Any expense incurred in completing acquisitions or entering into joint ventures, the time it takes to integrate an acquisition or our failure to integrate acquired businesses successfully could result in unanticipated expenses and losses. Furthermore, we may not be able to fully realize the anticipated benefits from any future acquisitions or joint ventures we may pursue. In addition, the process of integrating acquired operations into our existing
25
Table of Contents
operations may result in unforeseen operating difficulties and expenses and may require significant financial resources that would otherwise be available for the execution of our business strategy.
We may be responsible for United States federal and state income tax liabilities that relate to the PrefCo Preferred Stock Sale and Spin-Off.
Pursuant to the Tax Matters Agreement, the parties thereto have agreed to take certain actions and refrain from taking certain actions in order to preserve the intended tax treatment of the Spin-Off (as defined below in “The Reorganization and Emergence”) and to indemnify the other parties to the extent a breach of such covenant results in additional taxes to the other parties. If we breach such a covenant (or, in certain circumstances, if our stockholders or creditors of our Predecessor take or took certain actions that result in the intended tax treatment of the Spin-Off not to be preserved), we may be required to make substantial indemnification payments to the other parties to the Tax Matters Agreement.
The Tax Matters Agreement also allocates the responsibility for taxes for periods prior to the Spin-Off between EFH Corp. and us. For periods prior to the Spin-Off, (i) Vistra Energy is generally required to reimburse EFH Corp. with respect to any taxes paid by EFH Corp. that are attributable to us and (ii) EFH Corp. is generally required to reimburse us with respect to any taxes paid by us that are attributable to EFH Corp.
We are also required to indemnify EFH Corp. against certain taxes in the event the IRS or another taxing authority successfully challenges the amount of gain relating to the PrefCo Preferred Stock Sale (as defined in “The Reorganization and Emergence”) or the amount or allowance of EFH Corp.’s net operating loss deductions.
Our indemnification obligations to EFH Corp. are not limited by any maximum amount. If we are required to indemnify EFH Corp. or such other persons under the circumstances set forth in the Tax Matters Agreement, we may be subject to substantial liabilities.
We are required to pay the holders of TRA Rights for certain tax benefits, which amounts are expected to be substantial.
On the Effective Date, we entered into a tax receivable agreement (the Tax Receivable Agreement) with American Stock Transfer & Trust Company, LLC, as the transfer agent. Pursuant to the Tax Receivable Agreement, we issued beneficial interests in the rights to receive payments under the Tax Receivable Agreement (the TRA Rights) to the first lien creditors of our Predecessor to be held in escrow for the benefit of the first lien creditors of our Predecessor entitled to receive such TRA Rights under the Plan. Our financial statements included elsewhere in this prospectus reflect a liability of $596 million as of December 31, 2016 related to these future payment obligations. This amount is based on certain assumptions as described more fully in the notes to the financial statements, including assumptions on the current corporate tax rates remaining unchanged, and the actual payments made under the Tax Receivable Agreement could materially exceed this estimate.
The Tax Receivable Agreement provides for the payment by us to the holders of TRA Rights of 85% of the amount of cash savings, if any, in United States federal, state and local income tax that we and our subsidiaries actually realize as a result of our use of (a) the tax basis step up attributable to the PrefCo Preferred Stock Sale, (b) the entire tax basis of the assets acquired as a result of the purchase and sale agreement, dated as of November 25, 2015 by and between La Frontera Ventures, LLC and Luminant Holding Company LLC (Luminant), and (c) tax benefits related to imputed interest deemed to be paid by us as a result of payments under the Tax Receivable Agreement. The amount and timing of any payments under the Tax Receivable Agreement will vary depending upon a number of factors, including the amount and timing of the taxable income we generate in the future and the tax rate then applicable, our use of loss carryovers and the portion of our payments under the Tax Receivable Agreement constituting imputed interest.
26
Table of Contents
Although we are not aware of any issue that would cause the IRS to challenge the tax benefits that are the subject of the Tax Receivable Agreement, recipients of the payments under the Tax Receivable Agreement will not be required to reimburse us for any payments previously made if such tax benefits are subsequently disallowed. As a result, in such circumstances, Vistra Energy Corp. could make payments under the Tax Receivable Agreement that are greater than its actual cash tax savings and may not be able to recoup those payments, which could adversely affect our liquidity.
Because Vistra Energy Corp. is a holding company with no operations of its own, its ability to make payments under the Tax Receivable Agreement is dependent on the ability of its subsidiaries to make distributions to it. To the extent that Vistra Energy Corp. is unable to make payments under the Tax Receivable Agreement because of the inability of its subsidiaries to make distributions to us for any reason, such payments will be deferred and will accrue interest until paid, which could adversely affect our results of operations and could also affect our liquidity in periods in which such payments are made.
The payments we will be required to make under the Tax Receivable Agreement could be substantial.
We may be required to make an early termination payment to the holders of TRA Rights under the Tax Receivable Agreement.
The Tax Receivable Agreement provides that, in the event that Vistra Energy Corp. breaches any of its material obligations under the Tax Receivable Agreement, or upon certain mergers, asset sales, or other forms of business combination or certain other changes of control, the transfer agent under the Tax Receivable Agreement may treat such event as an early termination of the Tax Receivable Agreement, in which case Vistra Energy Corp. would be required to make an immediate payment to the holders of the TRA Rights equal to the present value (at a discount rate equal to LIBOR plus 100 basis points) of the anticipated future tax benefits based on certain valuation assumptions.
As a result, upon any such breach or change of control, we could be required to make a lump sum payment under the Tax Receivable Agreement before we realize any actual cash tax savings and such lump sum payment could be greater than our future actual cash tax savings.
The aggregate amount of these accelerated payments could be materially more than our estimated liability for payments made under the Tax Receivable Agreement set forth in our financial statements. Based on this estimation, our obligations under the Tax Receivable Agreement could have a substantial negative impact on our liquidity.
We are potentially liable for United States income taxes of the entire EFH Corp. consolidated group for all taxable years in which we were a member of such group.
Prior to the Spin-Off, EFH Corporate Services Company, EFH Properties Company and certain other subsidiary corporations were included in the consolidated United States federal income tax group of which EFH Corp. was the common parent (the EFH Corp. Consolidated Group). In addition, pursuant to the private letter ruling from the IRS we received in connection with the Spin-Off, Vistra Energy will be considered a member of the EFH Corp. Consolidated Group prior to the Spin-Off. Under United States federal income tax laws, any corporation that is a member of a consolidated group at any time during a taxable year is jointly and severally liable for the group’s entire federal income tax liability for the entire taxable year. In addition, entities that are disregarded for federal income tax purposes may be liable as successors under common law theories or under certain regulations to the extent corporations transferred assets to such entities or merged or otherwise consolidated into such entities, whether under state law or purely as a matter of federal income tax law. Thus, notwithstanding any contractual rights to be reimbursed or indemnified by EFH Corp. pursuant to the Tax Matters Agreement, to the extent EFH Corp. or other members of the EFH Corp. Consolidated Group fail to make any federal income tax payments required of them by law in respect of taxable years for which we were a
27
Table of Contents
member of the EFH Corp. Consolidated Group, we may be liable for the shortfall. At such time, we may not have sufficient cash on hand to satisfy such payment obligation.
Our ability to claim a portion of depreciation deductions may be limited for a period of time.
Under the Internal Revenue Code, a corporation’s ability to utilize certain tax attributes, including depreciation, may be limited following an ownership change if the corporation’s overall asset tax basis exceeds the overall fair market value of its assets (after making certain adjustments). The Spin-Off resulted in an ownership change and it is expected that the overall tax basis of our assets may have exceeded the overall fair market value of our assets at such time. As a result, there may be a limitation on our ability to claim a portion of our depreciation deductions for a five-year period. This limitation could have a material impact on our tax liabilities and on our obligations under the TRA Rights. In addition, any future ownership change of Vistra Energy following Emergence could likewise result in additional limitations on our ability to use certain tax attributes existing at the time of any such ownership change and have an impact on our tax liabilities and on our obligations with respect to the TRA Rights under the Tax Receivable Agreement.
The costs of providing postretirement benefits and related funding requirements are subject to changes in value of fund assets, benefit costs, demographics and actuarial assumptions and may have a material adverse effect on us.
To a limited extent, we provide pension benefits and certain health care and life insurance benefits to certain of our eligible employees and their eligible dependents upon the retirement of such employees. Our costs of providing such benefits and related funding requirements are dependent upon numerous factors, assumptions and estimates and are subject to changes in these factors, assumptions and estimates, including the market value of the assets funding the pension and Other Post-Employment Benefits (OPEB) plans.
The values of the investments that fund the pension and OPEB plans are subject to changes in financial market conditions. Significant decreases in the values of these investments could increase the expenses of the pension plans and the costs of the OPEB plans and related funding requirements in the future. Our costs of providing such benefits and related funding requirements are also subject to changing employee demographics (including, but not limited to age, compensation levels and years of accredited service), the level of contributions made to retiree plans, expected and actual earnings on plan assets and the discount rates used in determining the projected benefit obligation. Changes made to the provisions of the plans may also impact current and future benefit costs. Fluctuations in financial market returns as well as changes in general interest rates may result in increased or decreased benefit costs in future periods.
Regulatory and Legislative Risks
Our businesses are subject to ongoing complex governmental regulations and legislation that have impacted, and may in the future impact, our businesses, results of operations, liquidity and financial condition.
Our businesses operate in changing market environments influenced by various state and federal legislative and regulatory initiatives regarding the restructuring of the energy industry, including competition in power generation and sale of electricity. Although we attempt to comply with changing legislative and regulatory requirements, there is a risk that we will fail to adapt to any such changes successfully or on a timely basis.
Our businesses are subject to numerous state and federal laws (including PURA, the Federal Power Act, the Atomic Energy Act, the Public Utility Regulatory Policies Act of 1978, the Clean Air Act (the CAA), the Energy Policy Act of 2005 and the Dodd-Frank Wall Street Reform and Consumer Protection Act), changing governmental policy and regulatory actions (including those of the PUCT, the NERC, the TRE, the RCT, the TCEQ, the FERC, the MSHA, the EPA, the NRC and the CFTC) and the rules, guidelines and protocols of ERCOT with respect to various matters, including, but not limited to, market structure and design, operation of nuclear generation facilities, construction and operation of other generation facilities, development, operation and
28
Table of Contents
reclamation of lignite mines, recovery of costs and investments, decommissioning costs, market behavior rules, present or prospective wholesale and retail competition and environmental matters. We, along with other market participants, are subject to electricity pricing constraints and market behavior and other competition-related rules and regulations under PURA that are administered by the PUCT and ERCOT. Changes in, revisions to, or reinterpretations of, existing laws and regulations may have a material adverse effect on us. Further, in the future we could expand our business, through acquisitions or otherwise, to geographic areas outside of Texas and the ERCOT market. Such expansion would subject us to additional state regulatory requirements that could have material adverse effect on us.
We are required to obtain, and to comply with, government permits and approvals.
We are required to obtain, and to comply with, numerous permits and licenses from federal, state and local governmental agencies. The process of obtaining and renewing necessary permits and licenses can be lengthy and complex and can sometimes result in the establishment of conditions that make the project or activity for which the permit or license was sought unprofitable or otherwise unattractive. In addition, such permits or licenses may be subject to denial, revocation or modification under various circumstances. Failure to obtain or comply with the conditions of permits or licenses, or failure to comply with applicable laws or regulations, may result in the delay or temporary suspension of our operations and electricity sales or the curtailment of our delivery of electricity to our customers and may subject us to penalties and other sanctions. Although various regulators routinely renew existing permits and licenses, renewal of our existing permits or licenses could be denied or jeopardized by various factors, including (a) failure to provide adequate financial assurance for closure, (b) failure to comply with environmental, health and safety laws and regulations or permit conditions, (c) local community, political or other opposition and (d) executive, legislative or regulatory action.
Our inability to procure and comply with the permits and licenses required for our operations, or the cost to us of such procurement or compliance, could have a material adverse effect on us. In addition, new environmental legislation or regulations, if enacted, or changed interpretations of existing laws, may cause routine maintenance activities at our facilities to need to be changed in order to avoid violating applicable laws and regulations or elicit claims that historical routine maintenance activities at our facilities violated applicable laws and regulations. In addition to the possible imposition of fines in the case of any such violations, we may be required to undertake significant capital investments in emissions control technology and obtain additional operating permits or licenses, which could have a material adverse effect on us.
Our cost of compliance with existing and new environmental laws could have a material adverse effect on us.
We are subject to extensive environmental regulation by governmental authorities, including the EPA and the TCEQ. We may incur significant additional costs beyond those currently contemplated to comply with these regulatory requirements. If we fail to comply with these regulatory requirements, we could be subject to civil or criminal liabilities and fines. Existing environmental regulations could be revised or reinterpreted, new laws and regulations could be adopted or become applicable to us or our facilities, and future changes in environmental laws and regulations could occur, including potential regulatory and enforcement developments related to air emissions, all of which could result in significant additional costs beyond those currently contemplated to comply with existing requirements. Any of the foregoing could have a material adverse effect on us.
The EPA has recently finalized or proposed several regulatory actions establishing new requirements for control of certain emissions from sources, including electricity generation facilities. In the future, the EPA may also propose and finalize additional regulatory actions that may adversely affect our existing generation facilities or our ability to cost-effectively develop new generation facilities. There is no assurance that the currently-installed emissions control equipment at our lignite, coal and/or natural gas-fueled generation facilities will satisfy the requirements under any future EPA or TCEQ regulations. Some of the recent regulatory actions and proposed actions, such as the EPA’s Regional Haze Federal Implementation Plans (FIP) for reasonable progress and best available retrofit technology (BART), could require us to install significant additional control
29
Table of Contents
equipment, resulting in potentially material costs of compliance for our generation units, including capital expenditures, higher operating and fuel costs and potential production curtailments if the rules take effect as proposed or finalized. These costs could have a material adverse effect on us.
We may not be able to obtain or maintain all required environmental regulatory approvals. If there is a delay in obtaining any required environmental regulatory approvals, if we fail to obtain, maintain or comply with any such approval or if an approval is retroactively disallowed or adversely modified, the operation of our generation facilities could be stopped, disrupted, curtailed or modified or become subject to additional costs. Any such stoppage, disruption, curtailment, modification or additional costs could have a material adverse effect on us.
In addition, we may be responsible for any on-site liabilities associated with the environmental condition of facilities that we have acquired, leased or developed, regardless of when the liabilities arose and whether they are now known or unknown. In connection with certain acquisitions and sales of assets, we may obtain, or be required to provide, indemnification against certain environmental liabilities. Another party could, depending on the circumstances, assert an environmental claim against us or fail to meet its indemnification obligations to us.
We could be materially and adversely affected if current regulations are implemented or if new federal or state legislation or regulations are adopted to address global climate change, or if we are subject to lawsuits for alleged damage to persons or property resulting from greenhouse gas emissions.
There is a concern nationally and internationally about global climate change and how GHG emissions, such as CO2, contribute to global climate change. Over the last several years, the United States Congress has considered and debated, and President Obama’s administration has discussed, several proposals intended to address climate change using different approaches, including a cap on carbon emissions with emitters allowed to trade unused emission allowances (cap-and-trade), a tax on carbon or GHG emissions, incentives for the development of low-carbon technology and federal renewable portfolio standards. The EPA has also finalized regulations under the Clean Air Act to limit CO2 emissions from existing generating units, referred to as the Clean Power Plan. While currently the subject of a legal challenge and a recent executive order directing the EPA to reconsider the rule, if implemented as finalized, the Clean Power Plan would require the closure of a significant number of coal-fueled electric generating units nationwide and in Texas. In addition, a number of federal court cases have been filed in recent years asserting damage claims related to GHG emissions, and the results in those proceedings could establish adverse precedent that might apply to companies (including us) that produce GHG emissions. For more detailed discussion of recent global climate change legislation and regulation, see “Business — Legal Proceedings and Regulatory Matters.” We could be materially and adversely affected if new federal and/or state legislation or regulations are adopted to address global climate change, if the Clean Power Plan is implemented as finalized or if we are subject to lawsuits for alleged damage to persons or property resulting from GHG emissions.
The availability and cost of emission allowances could adversely impact our costs of operations.
We are required to maintain, through either allocations or purchases, sufficient emission allowances for SO2 and NOx to support our operations in the ordinary course of operating our power generation facilities. These allowances are used to meet the obligations imposed on us by various applicable environmental laws. If our operational needs require more than our allocated allowances, we may be forced to purchase such allowances on the open market, which could be costly. If we are unable to maintain sufficient emission allowances to match our operational needs, we may have to curtail our operations so as not to exceed our available emission allowances, or install costly new emission controls. As we use the emission allowances that we have purchased on the open market, costs associated with such purchases will be recognized as operating expense. If such allowances are available for purchase, but only at significantly higher prices, the purchase of such allowances could materially increase our costs of operations in the affected markets.
30
Table of Contents
Luminant’s mining operations are subject to RCT oversight.
We currently own and operate through Luminant 11 surface lignite coal mines in Texas to provide fuel for our electricity generation facilities. The RCT, which exercises broad authority to regulate reclamation activity, reviews on an ongoing basis whether Luminant is compliant with RCT rules and regulations and whether it has met all of the requirements of its mining permits. Any new rules and regulations adopted by the RCT or the Department of Interior Office of Surface Mining, which also regulates mining activity nationwide, or any changes in the interpretation of existing rules and regulations, could result in higher compliance costs or otherwise adversely affect our financial condition or cause a revocation of a mining permit. Any revocation of a mining permit would mean that Luminant would no longer be allowed to mine lignite at the applicable mine to serve its generation facilities. In addition, Luminant’s mining reclamation obligations are secured by a first lien on its assets which is pari passu with the Vistra Operations Credit Facilities (but which would be paid first (up to $975 million) upon any liquidation of Vistra Operations Company LLC’s (Vistra Operations) assets). The RCT could, at any time, require that Luminant’s mining reclamation obligations be secured by cash or letters of credit in lieu of such first lien. Any failure to provide any such cash or letter of credit collateral could result in Luminant no longer being able to mine lignite. Any such event could have a material adverse effect on us.
Litigation, legal proceedings, regulatory investigations or other administrative proceedings could expose us to significant liabilities and reputation damage that could have a material adverse effect on us.
We are involved in the ordinary course of business in a number of lawsuits involving, among other matters, employment, commercial and environmental issues, and other claims for injuries and damages. We evaluate litigation claims and legal proceedings to assess the likelihood of unfavorable outcomes and to estimate, if possible, the amount of potential losses. Based on these evaluations and estimates, when required by applicable accounting rules, we establish reserves and disclose the relevant litigation claims or legal proceedings, as appropriate. These evaluations and estimates are based on the information available to management at the time and involve a significant amount of judgment. Actual outcomes or losses may differ materially from current evaluations and estimates. The settlement or resolution of such claims or proceedings may have a material adverse effect on us. We use appropriate means to contest litigation threatened or filed against us, but the litigation environment poses a significant business risk.
We are also involved in the ordinary course of business in regulatory investigations and other administrative proceedings, and we are exposed to the risk that we may become the subject of additional regulatory investigations or administrative proceedings. While we cannot predict the outcome of any regulatory investigation or administrative proceeding, any such regulatory investigation or administrative proceeding could result in us incurring material penalties and/or other costs and have a materially adverse effect on us.
The REP certification of our retail operation is subject to PUCT review.
The PUCT may at any time initiate an investigation into whether our retail operation complies with certain PUCT rules and whether we have met all of the requirements for REP certification, including financial requirements. Any removal or revocation of an REP certification would mean that we would no longer be allowed to provide electricity service to retail customers. Such decertification could have a material adverse effect on us. Moreover, any capital or other expenditures that we are required by the PUCT to undertake in order to achieve or maintain any such compliance could also have a material adverse effect on us.
Operational Risks
Our retail operations are subject to significant competition from other REPs, which could result in a loss of existing customers and the inability to attract new customers.
We operate in a very competitive retail market and, as a result, our retail operation faces significant competition for customers. We believe our TXU EnergyTM brand is viewed favorably in the retail electricity markets in which we operate, but despite our commitment to providing superior customer service and innovative products, customer sentiment toward our brand, including by comparison to our competitors’ brands, depends on
31
Table of Contents
certain factors beyond our control. For example, competitor REPs may offer lower electricity prices and other incentives, which, despite our long-standing relationship with many customers, may attract customers away from us. This and other competitive retail activity has resulted in retail customer churn and our total retail customer counts have declined approximately 1% during the year ended December 31, 2016. See “Management’s Discussion and Analysis of Financial Condition and Results of Operations — Key Risks and Challenges — Competitive Retail Markets and Customer Retention.” If we are unable to successfully compete with competitors in the retail market it is possible our retail customer counts could continue to decline, which could have a material adverse effect on us.
As we try to grow our retail business and operate our business strategy, we compete with various other REPs that may have certain advantages over us. For example, in new markets, our principal competitor for new customers may be the incumbent REP, which has the advantage of long-standing relationships with its customers, including well-known brand recognition. In addition to competition from the incumbent REP, we may face competition from a number of other energy service providers, other energy industry participants, or nationally branded providers of consumer products and services who may develop businesses that will compete with us. Some of these competitors or potential competitors may be larger than we are or have greater resources or access to capital than we have. If there is inadequate potential margin in retail electricity markets with substantial competition to overcome the adverse effect of relatively high customer acquisition costs in such markets, it may not be profitable for us to compete in these markets.
Our retail operations rely on the infrastructure of local utilities or independent transmission system operators to provide electricity to, and to obtain information about, our customers. Any infrastructure failure could negatively impact customer satisfaction and could have a material adverse effect on us.
Our retail operations depend on transmission and distribution facilities owned and operated by unaffiliated utilities to deliver the electricity that we sell to our customers. If transmission capacity is inadequate, our ability to sell and deliver electricity may be hindered and we may have to forgo sales or buy more expensive wholesale electricity than is available in the capacity-constrained area. For example, during some periods, transmission access is constrained in some areas of the Dallas-Fort Worth metroplex, where we have a significant number of customers. The cost to provide service to these customers may exceed the cost to provide service to other customers, resulting in lower operating margins. In addition, any infrastructure failure that interrupts or impairs delivery of electricity to our customers could negatively impact customer satisfaction with our service. Any of the foregoing could have a material adverse effect on us.
We may suffer material losses, costs and liabilities due to ownership and operation of the Comanche Peak nuclear generation facility.
We own and operate a nuclear generation facility in Glen Rose, Texas (the Comanche Peak Facility). The ownership and operation of a nuclear generation facility involves certain risks. These risks include:
| • | unscheduled outages or unexpected costs due to equipment, mechanical, structural, cyber security or other problems; |
| • | inadequacy or lapses in maintenance protocols; |
| • | the impairment of reactor operation and safety systems due to human error or force majeure; |
| • | the costs of, and liabilities relating to, storage, handling, treatment, transport, release, use and disposal of radioactive materials; |
| • | the costs of procuring nuclear fuel; |
| • | the costs of storing and maintaining spent nuclear fuel at our on-site dry cask storage facility; |
| • | terrorist or cyber security attacks and the cost to protect against any such attack; |
| • | the impact of a natural disaster; |
32
Table of Contents
| • | limitations on the amounts and types of insurance coverage commercially available; and |
| • | uncertainties with respect to the technological and financial aspects of modifying or decommissioning nuclear facilities at the end of their useful lives. |
The prolonged unavailability of the Comanche Peak Facility could have a material adverse effect on our results of operation, cash flows, financial position and reputation. The following are among the more significant related risks:
| • | Operational Risk — Operations at any generation facility could degrade to the point where the facility would have to be shut down. If such degradations were to occur at the Comanche Peak Facility, the process of identifying and correcting the causes of the operational downgrade to return the facility to operation could require significant time and expense, resulting in both lost revenue and increased fuel and purchased power expense to meet supply commitments. Furthermore, a shut-down or failure at any other nuclear generation facility could cause regulators to require a shut-down or reduced availability at the Comanche Peak Facility. |
| • | Regulatory Risk — The NRC may modify, suspend or revoke licenses and impose civil penalties for failure to comply with the Atomic Energy Act, the regulations under it or the terms of the licenses of nuclear generation facilities. Unless extended, as to which no assurance can be given, the NRC operating licenses for the two licensed operating units at the Comanche Peak Facility will expire in 2030 and 2033, respectively. Changes in regulations by the NRC, including potential regulation as a result of the NRC’s ongoing analysis and response to the effects of the natural disaster on nuclear generation facilities in Japan in 2010, as well as any extension of our operating licenses, could require a substantial increase in capital expenditures or result in increased operating or decommissioning costs. |
| • | Nuclear Accident Risk — Although the safety record of the Comanche Peak Facility and other nuclear generation facilities generally has been very good, accidents and other unforeseen problems have occurred both in the United States and elsewhere. The consequences of an accident can be severe and include loss of life, injury, lasting negative health impacts and property damage. Any accident, or perceived accident, could result in significant liabilities and damage our reputation. Any such resulting liability from a nuclear accident could exceed our resources, including insurance coverage, and could ultimately result in the suspension or termination of power generation from the Comanche Peak Facility. |
The operation and maintenance of power generation facilities and related mining operations involve significant risks that could adversely affect our results of operations, liquidity and financial condition.
The operation and maintenance of power generation facilities and related mining operations involve many risks, including, as applicable, start-up risks, breakdown or failure of facilities, operator error, lack of sufficient capital to maintain the facilities, the dependence on a specific fuel source or the impact of unusual or adverse weather conditions or other natural events, or terrorist attacks, as well as the risk of performance below expected levels of output, efficiency or reliability, the occurrence of any of which could result in substantial lost revenues and/or increased expenses. A significant number of our facilities were constructed many years ago. In particular, older generating equipment, even if maintained in accordance with good engineering practices, may require significant capital expenditures to operate at peak efficiency or reliability. The risk of increased maintenance and capital expenditures arises from (a) increased starting and stopping of generation equipment due to the volatility of the competitive generation market and the prospect of continuing low wholesale electricity prices that may not justify sustained or year-round operation of all our generation facilities, (b) any unexpected failure to generate power, including failure caused by equipment breakdown or unplanned outage (whether by order of applicable governmental regulatory authorities, the impact of weather events or natural disasters or otherwise), (c) damage to facilities due to storms, natural disasters, wars, terrorist or cyber security acts and other catastrophic events and (d) the passage of time and normal wear and tear. Further, our ability to successfully and timely complete routine maintenance or other capital projects at our existing facilities is contingent upon many variables and subject to
33
Table of Contents
substantial risks. Should any such efforts be unsuccessful, we could be subject to additional costs or losses and write downs of our investment in the project.
We cannot be certain of the level of capital expenditures that will be required due to changing environmental and safety laws and regulations (including changes in the interpretation or enforcement thereof), needed facility repairs and unexpected events (such as natural disasters or terrorist or cyber security attacks). The unexpected requirement of large capital expenditures could have a material adverse effect on us.
In addition, if any of our generation facilities experiences unplanned outages, whether because of equipment breakdown or otherwise, we may be required to procure replacement power at spot market prices in order to fulfill contractual commitments. If we do not have adequate liquidity to meet margin and collateral requirements, we may be exposed to significant losses, may miss significant opportunities and may have increased exposure to the volatility of spot markets, which could have a material adverse effect on us.
Our employees, contractors, customers and the general public may be exposed to a risk of injury due to the nature of our operations.
Our employees and contractors work in, and customers and the general public may be exposed to, potentially dangerous environments at or near our operations. As a result, employees, contractors, customers and the general public are at risk for serious injury, including loss of life. Significant examples of such risks include nuclear accidents, dam failure, gas explosions, mine area collapses and other dangerous incidents.
The occurrence of any one of these events may result in us being named as a defendant in lawsuits asserting claims for substantial damages, including for environmental cleanup costs, personal injury and property damage and fines and/or penalties. We maintain an amount of insurance protection that we consider adequate, but we cannot provide any assurance that our insurance will be sufficient or effective under all circumstances and against all hazards or liabilities to which we may be subject and, even if we do have insurance coverage for a particular circumstance, we may be subject to a large deductible and maximum cap. Further, due to rising insurance costs and changes in the insurance markets, we cannot provide any assurance that our insurance coverage will continue to be available at all or at rates or on terms similar to those presently available. Any losses not covered by insurance could have a material adverse effect on us.
We may be materially and adversely affected by the effects of extreme weather conditions and seasonality.
We may be materially affected by weather conditions and our businesses may fluctuate substantially on a seasonal basis as the weather changes. In addition, we could be subject to the effects of extreme weather conditions, including sustained cold or hot temperatures, hurricanes, storms or other natural disasters, which could stress our generation facilities and result in outages, destroy our assets and result in casualty losses that are not ultimately offset by insurance proceeds, and could require increased capital expenditures or maintenance costs, including supply chain costs.
Moreover, an extreme weather event could cause disruption in service to customers due to downed wires and poles or damage to other operating equipment, which could result in us foregoing sales of electricity and lost revenue. Similarly, an extreme weather event might affect the availability of generation and transmission capacity, limiting our ability to source or deliver power where it is needed or limit our ability to source fuel for our plants (including due to damage to rail or natural gas pipeline infrastructure). Additionally, extreme weather may result in unexpected increases in customer load, requiring our retail operation to procure additional electricity supplies at wholesale prices in excess of customer sales prices for electricity. These conditions, which cannot be reliably predicted, could have adverse consequences by requiring us to seek additional sources of electricity when wholesale market prices are high or to sell excess electricity when market prices are low, which could have a material adverse effect on us.
34
Table of Contents
We may be materially and adversely affected by insufficient water supplies.
Supplies of water are important for our generation facilities. Water in Texas is limited and various parties have made conflicting claims regarding the right to access and use such limited supplies of water. In addition, in the recent past Texas has experienced sustained drought conditions that illustrate the effect such conditions may have on the water supply for certain of our generation facilities if adequate rain does not fall in the watersheds that supply our electric generating units. If we are unable to access sufficient supplies of water, it could prevent, restrict or increase the cost of operations at certain of our generation facilities, which could have a material adverse effect on us.
Changes in technology or increased electricity conservation efforts may reduce the value of our generation facilities and may otherwise have a material adverse effect on us.
Technological advances have improved, and are likely to continue to improve, for existing and alternative methods to produce and store power, including gas turbines, wind turbines, fuel cells, micro turbines, photovoltaic (solar) cells, batteries and concentrated solar thermal devices, along with improvements in traditional technologies. Such technological advances have reduced, and are expected to continue to reduce, the costs of power production or storage to a level that will enable these technologies to compete effectively with traditional generation facilities. Consequently, the value of our more traditional generation assets could be significantly reduced as a result of these competitive advances, which could have a material adverse effect on us. In addition, changes in technology have altered, and are expected to continue to alter, the channels through which retail customers buy electricity (i.e., self-generation or distributed-generation facilities). To the extent self-generation facilities become a more cost-effective option for ERCOT customers, our financial condition, operating cash flows and results of operations could be materially and adversely affected.
Technological advances in demand-side management and increased conservation efforts have resulted, and are expected to continue to result, in a decrease in electricity demand. A significant decrease in electricity demand in ERCOT as a result of such efforts would significantly reduce the value of our generation assets. Certain regulatory and legislative bodies have introduced or are considering requirements and/or incentives to reduce power consumption. Effective power conservation by our customers could result in reduced electricity demand or significantly slow the growth in such demand. Any such reduction in demand could have a material adverse effect on us. Furthermore, we may incur increased capital expenditures if we are required to increase investment in conservation measures.
Attacks on our infrastructure that breach cyber/data security measures could expose us to significant liabilities and reputation damage and disrupt business operations, which could have a material adverse effect on us.
Much of our information technology infrastructure is connected (directly or indirectly) to the internet. There have been numerous attacks on government and industry information technology systems through the internet that have resulted in material operational, reputation and/or financial costs. While we have controls in place designed to protect our infrastructure and we are not aware of any significant breaches in the past, a breach of cyber/data security measures that impairs our information technology infrastructure could disrupt normal business operations and affect our ability to control our generation assets, access retail customer information and limit communication with third parties. Any loss of confidential or proprietary data through a breach could adversely affect our reputation, expose us to material legal or regulatory claims and impair our ability to execute our business strategy, which could have a material adverse effect on us.
As part of the continuing development of new and modified reliability standards, the FERC has approved changes to its Critical Infrastructure Protection reliability standards and has established standards for assets identified as “critical cyber assets.” Under the Energy Policy Act of 2005, the FERC can impose penalties (up to $1 million per day, per violation) for failure to comply with mandatory electric reliability standards, including standards to protect the power system against potential disruptions from cyber and physical security breaches.
35
Table of Contents
Further, our retail business requires access to sensitive customer data in the ordinary course of business. Examples of sensitive customer data are names, addresses, account information, historical electricity usage, expected patterns of use, payment history, credit bureau data, credit and debit card account numbers, drivers’ license numbers, social security numbers and bank account information. Our retail business may need to provide sensitive customer data to vendors and service providers who require access to this information in order to provide services, such as call center operations, to the retail business. If a significant breach were to occur, the reputation of our retail business may be adversely affected, customer confidence may be diminished and our retail business may be subject to substantial legal or regulatory claims, any of which may contribute to the loss of customers and have a material adverse effect on us.
The loss of the services of our key management and personnel could adversely affect our ability to successfully operate our businesses.
Our future success will depend on our ability to continue to attract and retain highly qualified personnel. We compete for such personnel with many other companies, in and outside of our industry, government entities and other organizations. We may not be successful in retaining current personnel or in hiring or retaining qualified personnel in the future. Our failure to attract highly qualified new personnel or retain highly qualified existing personnel could have an adverse effect on our ability to successfully operate our businesses.
We could be materially and adversely impacted by strikes or work stoppages by our unionized employees.
As of December 31, 2016, we had 1,786 employees covered by collective bargaining agreements, all of which expired on March 31, 2017 and are currently in the process of being renegotiated. In the event that our union employees strike, participate in a work stoppage or slowdown or engage in other forms of labor strife or disruption, we would be responsible for procuring replacement labor or we could experience reduced power generation or outages. Our ability to procure such labor is uncertain. Strikes, work stoppages or the inability to negotiate current or future collective bargaining agreements on favorable terms or at all could have a material adverse effect on us.
Risks Related to Our Structure and Ownership of our Common Stock
Vistra Energy Corp. is a holding company and its ability to obtain funds from its subsidiaries is structurally subordinated to existing and future liabilities and preferred equity of its subsidiaries.
Vistra Energy Corp. is a holding company that does not conduct any business operations of its own. As a result, Vistra Energy Corp.’s cash flows and ability to meet its obligations are largely dependent upon the operating cash flows of Vistra Energy Corp.’s subsidiaries and the payment of such operating cash flows to Vistra Energy Corp. in the form of dividends, distributions, loans or otherwise. These subsidiaries are separate and distinct legal entities from Vistra Energy Corp. and have no obligation (other than any existing contractual obligations) to provide Vistra Energy Corp. with funds to satisfy its obligations. Any decision by a subsidiary to provide Vistra Energy Corp. with funds to satisfy its obligations, including those under the Tax Receivable Agreement, whether by dividends, distributions, loans or otherwise, will depend on, among other things, such subsidiary’s results of operations, financial condition, cash flows, cash requirements, contractual prohibitions and other restrictions, applicable law and other factors. The deterioration of income from, or other available assets of, any such subsidiary for any reason could limit or impair its ability to pay dividends or make other distributions to Vistra Energy Corp.
No prior public trading market existed for our common stock prior to October 4, 2016, and an active trading market may not develop or be sustained following the registration of our common stock on the NYSE, which may cause the market price of our common stock to decline significantly and make it difficult for investors to sell their shares in the future.
There was no public market for our common stock prior to commencing trading on the OTCQX market on October 4, 2016, and we have applied to list our common stock for trading on the NYSE under the symbol
36
Table of Contents
“VST.” However, listing on the NYSE does not ensure that an active trading market for our common shares will develop or be sustained. Accordingly, no assurance can be given as to:
| • | the likelihood that an active trading market for our shares of common stock will develop or be sustained; |
| • | the liquidity of any such market; |
| • | the ability of our stockholders to sell their shares of common stock when desired; or |
| • | the price that our stockholders may obtain for their shares of common stock. |
The stock markets, including the NYSE, have from time to time experienced significant price and volume fluctuations. As a result, the market price of our common stock may be similarly volatile, and investors in shares of our common stock may from time to time experience a decrease in the market price of their shares, including decreases unrelated to our financial performance or prospects. The market price of shares of our common stock could be subject to wide fluctuations in response to a number of factors, including those listed in this “Risk Factors” section of this prospectus and others such as:
| • | our historical and anticipated operating performance and the performance of other similar companies; |
| • | actual or anticipated differences in our quarterly or annual operating results than expected; |
| • | actual or anticipated changes in our, our customers’ or our competitors’ businesses or prospects; |
| • | changes in our revenues or earnings estimates or recommendations by securities analysts; |
| • | publication of research reports about us or the power generation or electricity sales industries; |
| • | the current state of the credit and capital markets, and our ability to obtain financing on favorable terms; |
| • | increased competition in power generation and electricity sales in our markets; |
| • | strategic decisions by us or our competitors, such as acquisitions, divestments, spin-offs, joint ventures, strategic investments or changes in business growth strategy; |
| • | the passage of legislation or other regulatory developments that adversely affect us or our industry; |
| • | adverse speculation in the press or investment community; |
| • | actions by institutional stockholders; |
| • | adverse market reaction to any indebtedness we may incur or equity or equity-related securities we may issue in the future; |
| • | additions of departures of key personnel; |
| • | actual, potential or perceived accounting problems; |
| • | changes in accounting principles; |
| • | failure to comply with the rules of the Commission or the NYSE or to maintain the listing of our common stock on the NYSE; |
| • | terrorist acts, natural or man-made disasters or threatened or actual armed conflicts; and |
| • | general market and local, regional and national economic conditions, including factors unrelated to our operating performance and prospects. |
No assurance can be given that the market price of our common stock will not fluctuate or decline significantly in the future or that holders of shares of our common stock will be able to sell their shares when desired on favorable terms, or at all. From time to time in the past, securities class action litigation has been instituted against companies following periods of extreme volatility in their stock price. This type of litigation could result in substantial costs and divert our management’s attention and resources.
37
Table of Contents
We may not pay any dividends on our common stock in the future.
We have no present intention to pay cash dividends on our common stock. Any determination to pay dividends to holders of our common stock in the future will be at the sole discretion of the Board and will depend upon many factors, including our historical and anticipated financial condition, cash flows, liquidity and results of operations, capital requirements, market conditions, our growth strategy and the availability of growth opportunities, contractual prohibitions (including, but not limited to, the Tax Matters Agreement), our level of indebtedness and other restrictions with respect to the payment of dividends, applicable law and other factors that the Board deems relevant.
A small number of stockholders could be able to significantly influence our business and affairs.
The three largest groups of stockholders of Vistra Energy Corp., affiliates of Apollo Management Holdings L.P. (collectively, the Apollo Entities), affiliates of Brookfield Asset Management Private Institutional Capital Adviser (Canada), L.P. (collectively, the Brookfield Entities), and affiliates of Oaktree Capital Management, L.P. (collectively, the Oaktree Entities, and together with the Apollo Entities and the Brookfield Entities, the Principal Stockholders), all of which were first lien creditors of our Predecessor prior to Emergence, collectively own approximately 39% of our common stock outstanding. Large holders such as the Principal Stockholders may be able to affect matters requiring approval by Vistra Energy Corp. stockholders, including the election of directors and the approval of mergers or other business combination transactions. Furthermore, pursuant to the terms of stockholders’ agreements entered into with each of the Principal Stockholders (each, a Stockholder’s Agreement), each Principal Stockholder is entitled to designate one director to serve on the Board as a Class III director for so long as it beneficially owns, in the aggregate, at least 22,500,000 shares of our common stock. See “Certain Relationships and Related Party Transactions — Stockholder’s Agreements.”
Conflicts of interest may arise because some members of the Board are representatives of the Principal Stockholders.
The Principal Stockholders could invest in entities that directly or indirectly compete with us. As a result of these relationships, when conflicts arise between the interests of the Principal Stockholders or their affiliates and the interests of other stockholders, members of the Board that are representatives of the Principal Stockholders may not be disinterested. Neither the Principal Stockholders nor the representatives of the Principal Stockholders on the Board, by the terms of the Vistra Energy Corp. certificate of incorporation (the Charter), are required to offer us any transaction opportunity of which they become aware and could take any such opportunity for themselves or offer it their other affiliates, unless such opportunity is expressly offered to them solely in their capacity as members of the Board.
We are unable to take certain actions because such actions could jeopardize the intended tax treatment of the Spin-Off, and such restrictions could be significant.
The Tax Matters Agreement prohibits us from taking certain actions that could reasonably be expected to undermine the intended tax treatment the Spin-Off or to jeopardize the conclusions of the private letter ruling from the IRS we received in connection with the Spin-Off or opinions of counsel received by us or EFH Corp. In particular, for two years after the Spin-Off, we may not:
| • | cease the active conduct of our business; |
| • | cease to hold certain assets; |
| • | voluntarily dissolve or liquidate; |
| • | merge or consolidate with any other person in a transaction that does not qualify as a reorganization under Section 368(a) of the Code; |
38
Table of Contents
| • | redeem or otherwise repurchase (directly or indirectly) any of our equity interests other than pursuant to an open market stock repurchase program that satisfies the requirements in the Tax Matters Agreement; or |
| • | directly or indirectly acquire any of the PrefCo Preferred Stock. |
Nevertheless, we are permitted to take any of the actions described above if (a) we obtain written consent from EFH Corp., (b) such action or transaction is described in or otherwise consistent with the facts in the private letter ruling we obtained from the IRS in connection with the Spin-Off, (c) we obtain a supplemental private letter ruling from the IRS or (d) we obtain an unqualified opinion of a nationally recognized law or accounting firm that is reasonably acceptable to EFH Corp. that the action will not affect the intended tax treatment of the Spin-Off.
The covenants and other limitations with respect to the Tax Matters Agreement may limit our ability to undertake certain transactions that would otherwise be value-maximizing.
Provisions in the Charter and bylaws and the Tax Receivable Agreement might discourage, delay or prevent a change in control of Vistra Energy Corp. or changes in our management and therefore depress the market price of our common stock.
The Charter and bylaws of Vistra Energy Corp. (the Bylaws), and the Tax Receivable Agreement contain provisions that could depress the market price of our common stock by acting to discourage, delay or prevent a change in control of Vistra Energy Corp. or changes in our management that stockholders may deem advantageous. These provisions in our Charter and Bylaws:
| • | authorize the issuance of “blank check” preferred stock that the Board could issue to increase the number of outstanding shares to discourage a takeover attempt; |
| • | create a classified board of directors; |
| • | prohibit stockholder action by written consent, and require that all stockholder actions be taken at a meeting of stockholders; |
| • | provide that the Board is expressly authorized to make, amend or repeal our Bylaws; and |
| • | establish advance notice requirements for nominations for elections to the Board or for proposing matters that can be acted upon by stockholders at stockholder meetings. |
In addition, the Tax Receivable Agreement provides that upon certain mergers, asset sales or other forms of business combination or certain other changes of control, the transfer agent under the Tax Receivable Agreement may treat such event as an early termination of the Tax Receivable Agreement, in which case we would be required to make a lump-sum payment under the Tax Receivable Agreement, which could be significant. This payment obligation may discourage potential buyers from acquiring Vistra Energy Corp.
39
Table of Contents
Special Note Regarding Forward-Looking Statements
This prospectus and other presentations made by us contain “forward-looking statements.” All statements, other than statements of historical facts, that are included in this prospectus, or made in presentations, in response to questions or otherwise, that address activities, events or developments that may occur in the future, including such matters as activities related to our financial or operational projections, capital allocation, capital expenditures, liquidity, dividend policy, business strategy, competitive strengths, goals, future acquisitions or dispositions, development or operation of power generation assets, market and industry developments and the growth of our businesses and operations (often, but not always, through the use of words or phrases such as “intends,” “plans,” “will likely,” “unlikely,” “expected,” “anticipated,” “estimated,” “should,” “may,” “projection,” “target,” “goal,” “objective” and “outlook”), are forward-looking statements. Although we believe that in making any such forward-looking statement our expectations are based on reasonable assumptions, any such forward-looking statement involves uncertainties and risks and is qualified in its entirety by reference to the discussion of risk factors under “Risk Factors” and the discussion under “Management’s Discussion and Analysis of Financial Condition and Results of Operations” in this prospectus and the following important factors, among others, that could cause results to differ materially from those projected in or implied by such forward-looking statements:
| • | the actions and decisions of regulatory authorities; |
| • | prohibitions and other restrictions on our activities due to the terms of our agreements; |
| • | prevailing governmental policies and regulatory actions, including those of the Texas Legislature, the Governor of Texas, the United States Congress, the FERC, the NERC, the TRE, the PUCT, the RCT, the NRC, the EPA, the TCEQ, the United States Mine Safety and Health Administration and the CFTC, with respect to, among other things: |
| • | allowed prices; |
| • | industry, market and rate structure; |
| • | purchased power and recovery of investments; |
| • | operations of nuclear generation facilities; |
| • | operations of fossil fueled generation facilities; |
| • | operations of mines; |
| • | acquisition and disposal of assets and facilities; |
| • | development, construction and operation of facilities; |
| • | decommissioning costs; |
| • | present or prospective wholesale and retail competition; |
| • | changes in tax laws and policies; |
| • | changes in and compliance with environmental and safety laws and policies, including the CSAPR, MATS, regional haze program implementation and GHG and other climate change initiatives; and |
| • | clearing over-the-counter derivatives through exchanges and posting of cash collateral therewith; |
| • | legal and administrative proceedings and settlements; |
| • | general industry trends; |
| • | economic conditions, including the impact of an economic downturn; |
| • | weather conditions, including drought and limitations on access to water, and other natural phenomena, and acts of sabotage, wars or terrorist or cyber security threats or activities; |
40
Table of Contents
| • | our ability to collect trade receivables from our customers; |
| • | our ability to attract and retain profitable customers; |
| • | our ability to profitably serve our customers; |
| • | restrictions on competitive retail pricing; |
| • | changes in wholesale electricity prices or energy commodity prices, including the price of natural gas; |
| • | the construction of additional generation facilities in ERCOT that results in an over-supply of electricity in ERCOT causing a reduction in wholesale power prices; |
| • | changes in prices of transportation of natural gas, coal, fuel and other refined products; |
| • | changes in the ability of vendors to provide or deliver commodities as needed; |
| • | changes in market heat rates in the ERCOT electricity market; |
| • | our ability to effectively hedge against unfavorable commodity prices, including the price of natural gas, market heat rates and interest rates; |
| • | population growth or decline, or changes in market supply or demand and demographic patterns, particularly in ERCOT; |
| • | access to adequate transmission facilities to meet changing demands; |
| • | changes in interest rates, commodity prices, rates of inflation or foreign exchange rates; |
| • | changes in operating expenses, liquidity needs and capital expenditures; |
| • | commercial bank market and capital market conditions and the potential impact of disruptions in United States and international credit markets; |
| • | access to capital, the attractiveness of the cost and other terms of such capital and the success of financing and refinancing efforts, including availability of funds in the capital markets; |
| • | our ability to maintain prudent financial leverage; |
| • | our ability to generate sufficient cash flow to make principal and interest payments in respect of, or refinance, our debt obligations; |
| • | competition for new energy development and other business opportunities; |
| • | the ability of various counterparties to meet their obligations with respect to our financial instruments; |
| • | changes in technology (including large scale electricity storage) used by and services offered by us; |
| • | changes in electricity transmission that allow additional power generation to compete with our generation assets; |
| • | our ability to attract and retain qualified employees; |
| • | significant changes in our relationship with our employees, including the availability of qualified personnel, and the potential adverse effects if labor disputes or grievances were to occur; |
| • | changes in assumptions used to estimate costs of providing employee benefits, including medical and dental benefits, pension and postretirement employee benefits other than pensions (OPEB), and future funding requirements related thereto, including joint and several liability exposure under the Employee Retirement Income Security Act of 1974, as amended (ERISA); |
| • | hazards customary to the industry and the possibility that we may not have adequate insurance to cover losses resulting from such hazards; |
| • | the impact of our obligations under the Tax Receivable Agreement; and |
| • | actions by credit rating agencies. |
41
Table of Contents
Any forward-looking statement speaks only as of the date on which it is made, and except as may be required by applicable law, we undertake no obligation to update any forward-looking statement to reflect events or circumstances after the date on which it is made or to reflect the occurrence of unanticipated events or circumstances. New events and conditions emerge from time to time, and it is not possible for us to predict them. In addition, we may be unable to assess the impact of any such event or condition or the extent to which any such event or condition, or combination of events and conditions, may cause results to differ materially from those contained in or implied by any forward-looking statement. As such, you should not unduly rely on such forward-looking statements.
42
Table of Contents
Industry and Market Information
Certain industry and market data and other statistical information used throughout this prospectus are based on independent industry publications, government publications, reports by market research firms or other published independent sources, including certain data published by ERCOT, the PUCT and NYMEX. We did not commission any of these publications, reports or other sources. Some data is also based on good faith estimates, which are derived from our review of internal surveys, as well as the independent sources listed above. Industry publications, reports and other sources generally state that they have obtained information from sources believed to be reliable, but do not guarantee the accuracy and completeness of such information. While we believe that each of these publications, reports and other sources is reliable, we have not independently investigated or verified the information contained or referred to therein and make no representation as to the accuracy or completeness of such information. Forecasts are particularly likely to be inaccurate, especially over long periods of time, and we often do not know what assumptions were used in preparing such forecasts. Statements regarding industry and market data and other statistical information used throughout this prospectus involve risks and uncertainties and are subject to change based on various factors, including those discussed under the headings “Special Note Regarding Forward-Looking Statements” and “Risk Factors.”
43
Table of Contents
This prospectus relates to shares of our common stock that may be offered for resale by the selling stockholders. We will not receive any proceeds from any resale of the shares of our common stock offered by this prospectus. The net proceeds from any resale of such shares will be received by the applicable selling stockholders.
44
Table of Contents
Market Prices and Dividend Policy
Our common stock is quoted on the OTCQX U.S. market under the symbol “VSTE” and has been trading since October 4, 2016. No established trading market existed for our common stock prior to this date. The following table sets forth the per share high and low closing prices for our common stock as reported on the OTCQX U.S. market for the periods presented.
| High | Low | |||||||
| Fourth Quarter 2016 (beginning October 4, 2016) |
$ | 25.24 | $ | 13.50 | ||||
| First Quarter 2017 |
$ | 17.95 | $ | 15.36 | ||||
| Second Quarter 2017 (through April 28, 2017) |
$ | 16.49 | $ | 14.95 | ||||
On April 28, 2017, the closing price of our common stock as reported on the OTCQX U.S. market was $14.95 per share. As of April 25, 2017, there were 184 stockholders of record of our common stock, not including beneficial owners of shares registered in nominee or street name.
We have applied to list our common stock for trading on the New York Stock Exchange, which we refer to as the NYSE, under the symbol “VST.”
Dividends and Dividend Policy
We have not paid any dividends since our formation in October 2016 other than the 2016 Special Dividend. On December 8, 2016, the Board approved the payment of the 2016 Special Dividend in the aggregate amount of approximately $992 million to holders of record of our common stock on December 19, 2016. Proceeds from the $1 billion aggregate principal amount of incremental term loans obtained by Vistra Operations on December 14, 2016 (the 2016 Incremental Term Loans) were used to make the 2016 Special Dividend on December 30, 2016.
We have no present intention to pay cash dividends on our common stock. We are focused, however, on optimal deployment of capital and intend to evaluate a range of capital deployment strategies, including the return of capital to stockholders in the form of dividends and/or share repurchases.
Any determination to pay dividends to holders of our common stock or to repurchase shares of our common stock in the future will be at the sole discretion of the Board and will depend upon many factors and then-existing conditions, including our historical and anticipated financial condition, cash flows, liquidity and results of operations, capital requirements, market conditions, our growth strategy and the availability of growth opportunities, contractual prohibitions (including, but not limited to, the Tax Matters Agreement), our level of indebtedness, restrictions imposed by applicable law, general business conditions and other factors that the Board deems relevant. There can be no assurance we will pay any dividends to holders of our common stock in the future, or if declared, the amount of such dividends.
45
Table of Contents
The following table sets forth our cash and cash equivalents and capitalization as of December 31, 2016. You should read the information set forth below together with our consolidated financial statements and the related notes contained elsewhere in this prospectus.
| As of December 31, 2016 |
||||
| (in millions) | ||||
| Cash and Cash Equivalents |
$ | 843 | ||
| Deposit Letter of Credit Collateral Account |
$ | 650 | ||
| Revolving Credit Facility (a) |
— | |||
| Term Loan C Facility (a) |
$ | 650 | ||
| Term Loan B Facility (a) |
$ | 2,850 | ||
| 2016 Incremental Term Loans |
$ | 1,000 | ||
| Capital Leases or Other (b) |
$ | 2 | ||
|
|
|
|||
| Total Debt (c) |
$ | 4,502 | ||
| Preferred Equity (d) |
$ | 70 | ||
| Equity |
$ | 6,597 | ||
|
|
|
|||
| Total Capitalization |
$ | 11,169 | ||
|
|
|
|||
| (a) | As defined in “Management’s Discussion and Analysis of Financial Condition and Results of Operations — Liquidity and Capital Resources — Debt Activity.” |
| (b) | Excludes debt related to office space ($36 million) as the amounts due under this lease were prepaid into an escrow account. |
| (c) | Amount does not reflect debt issuance costs of $8 million, debt discounts of $2 million and debt premiums of $25 million. |
| (d) | Included in Long-term Debt on our consolidated balance sheet. See our consolidated financial statements and the related notes contained elsewhere in this prospectus for further discussion. |
46
Table of Contents
The Reorganization and Emergence
This section provides a description of the bankruptcy filing made by the Debtors (the Bankruptcy Filing), the reorganization of the Debtors pursuant to a Joint Plan of Reorganization, and Emergence.
Bankruptcy Filing
On April 29, 2014 (the Petition Date), EFH Corp. and the other Debtors, including our Predecessor, filed the Bankruptcy Filing in the United States Bankruptcy Court for the District of Delaware (the Bankruptcy Court). While in bankruptcy, the Debtors operated their businesses as “debtors-in-possession” under the jurisdiction of the Bankruptcy Court and in accordance with the applicable provisions of the Bankruptcy Code.
The Bankruptcy Filing resulted primarily from the Debtors’ (including our Predecessor’s) inability to support the significant interest payments and pending debt maturities related to the substantial debt EFH Corp. had previously incurred in connection with the leveraged buy-out of EFH Corp. in October 2007 as a result of, among other things, lower wholesale electricity prices in ERCOT driven by the sustained decline in natural gas prices since mid-2008.
The Plan
On April 14, 2015, the Debtors, including our Predecessor and its subsidiaries, filed a proposed Joint Plan of Reorganization with the Bankruptcy Court. The Plan was subsequently amended and supplemented multiple times based upon discussions with the Debtors’ creditors and other interested parties and in response to creditor claims and objections and the requirements of the Bankruptcy Code and the Bankruptcy Court. On August 29, 2016, the Bankruptcy Court entered an order confirming the Plan solely as it pertains to EFCH, our Predecessor and the subsidiaries of our Predecessor that were Debtors, and certain other subsidiaries of EFH Corp. identified in the Plan (collectively, the T-Side Debtors). The Plan provided that the confirmation and effective date of the plan of reorganization with respect to the T-Side Debtors was to occur separate from, and independent of, the confirmation and effective date of the plan of reorganization with respect to EFH Corp., EFIH and their subsidiaries that are Debtors, excluding the T-Side Debtors.
On October 3, 2016, which we refer to as the Effective Date, the Plan with respect to the T-Side Debtors became effective and the T-Side Debtors, including our Predecessor, consummated their reorganization under the Bankruptcy Code and emerged from the Chapter 11 Cases.
Transactions in Connection with Emergence
On the Effective Date and pursuant to the Plan, the T-Side Debtors, including our Predecessor, executed the following transactions as part of a tax-free spin-off from EFH Corp. (the Spin-Off):
| • | Pursuant to the Plan and the Separation Agreement (the Separation Agreement), (a) our Predecessor contributed all of its interests in its subsidiaries, (b) each of our Predecessor, EFH Corp. and Energy Future Competitive Holdings LLC contributed certain assets and liabilities related to the operations of our Predecessor and its subsidiaries and (c) EFH Corp. transferred sponsorship of certain employee benefit plans (including related assets), programs and policies, to a recently formed limited liability company named TEX Energy LLC, in exchange for which our Predecessor received 100% of the equity interests in TEX Energy LLC; |
| • | A subsidiary of TEX Energy LLC contributed certain of the assets of our Predecessor and its subsidiaries to Vistra Preferred Inc. (PrefCo) in exchange for all of PrefCo’s authorized (a) preferred stock (the PrefCo Preferred Stock Sale), consisting of 70,000 shares, par value $0.01 per share (the PrefCo Preferred Stock), and (b) common stock, consisting of 10,000,000 shares, par value $0.01 per share, and immediately thereafter the subsidiary sold all of the PrefCo Preferred Stock to certain investors in exchange for cash and distributed the cash proceeds from such sale to our Predecessor to fund recoveries under the Plan; |
47
Table of Contents
| • | TEX Energy LLC converted from a Delaware limited liability company into a Delaware corporation and ultimately changed its name to Vistra Energy Corp.; and |
| • | Our Predecessor (a) distributed (i) (1) 427,500,000 shares of common stock of Vistra Energy Corp. and (2) approximately $370,000,000 of cash to the former first lien creditors of our Predecessor in exchange for the cancellation of their allowed claims against our Predecessor, and (ii) the right to receive recoveries under the unsecured claim of our Predecessor against EFH Corp. allowed in the amount of $700 million (the TCEH Settlement Claim), provided, that from and after the Effective Date, Vistra Energy Corp. nominally holds the right to receive recoveries under the TCEH Settlement Claim but the former first lien creditors of our Predecessor (and their assigns) hold all legal and equitable entitlement to receive recoveries under the TCEH Settlement Claim, and (b) deposited the TRA Rights described in more detail under “Certain Relationships and Related Party Transactions — Tax Receivable Agreement” into an escrow account for subsequent distribution to eligible first lien creditors of our Predecessor. |
Also on the Effective Date, the debtor-in-possession credit facilities of our Predecessor converted into the Vistra Operations Credit Facilities and Vistra Operations assumed all of the rights and obligations of our Predecessor thereunder. For additional information about the Vistra Operations Credit Facilities, see “Description of Indebtedness.”
48
Table of Contents
As a result of the Spin-Off, with effect as of Emergence, the competitive businesses previously owned by our Predecessor are no longer indirect wholly owned subsidiaries of EFH Corp., and while EFH Corp. is the parent holding company of the regulated business of Oncor, it is no longer the parent holding company of the competitive businesses of TXU Energy and Luminant. Set forth below is a diagram setting forth the structure of Vistra Energy Corp. and certain of its key subsidiaries following Emergence. Except for the preferred stock of Vistra Preferred Inc., all subsidiaries of Vistra Energy Corp. reflected on this chart are 100% owned, directly or indirectly.
As of May 1, 2017
| * | 100% of the common stock (1,000,000 shares) is held by Vistra Asset Company LLC. 100% of the preferred stock (70,000 shares) is held by outside investors. The holders of the preferred stock have no voting or other |
49
Table of Contents
| control rights over PrefCo, except (a) as required by the Delaware General Corporation Law, (b) in the event PrefCo fails to pay dividends payable on the preferred stock in full for 12 consecutive dividend payment dates, (c) in connection with the authorization, creation or issuance of any securities of PrefCo senior to the preferred stock or (d) upon any attempt to amend, alter or repeal any provisions of PrefCo’s certificate of incorporation to materially and adversely affect the voting powers, rights or preferences of such holders. |
50
Table of Contents
Selected Historical Consolidated Financial Information
The following tables set forth the selected historical consolidated financial information for Vistra Energy (the Successor) for periods subsequent to the Effective Date and TCEH (our Predecessor) for periods prior to the Effective Date. The financial statements of the Successor are not comparable to the financial statements of our Predecessor as those periods prior to the Effective Date do not give effect to any adjustments to the carrying values of assets or amounts of liabilities that resulted from the Plan, and the related application of fresh start reporting, which includes accounting policies implemented by Vistra Energy that may differ from our Predecessor. The selected historical consolidated financial information of the Successor as of December 31, 2016 and for the period from October 3, 2016 through December 31, 2016 and of our Predecessor as of December 31, 2015 and for the period from January 1, 2016 through October 2, 2016 and the years ended December 31, 2015 and 2014 have been derived from the audited historical consolidated financial statements and related notes included elsewhere in this prospectus. The selected historical consolidated financial information of our Predecessor as of December 31, 2014, 2013, 2012 and 2011 and for the years ended December 31, 2013, 2012 and 2011 has been derived from our Predecessor’s historical audited consolidated financial statements and related notes that are not included in this prospectus. The selected historical consolidated financial information should be read in conjunction with “Management’s Discussion and Analysis of Financial Condition and Results of Operations” and our audited and unaudited condensed consolidated financial statements, as well as our unaudited pro forma condensed consolidated financial statements, and, in each case, related notes included elsewhere in this prospectus.
| Successor | Predecessor | |||||||||||||||||||||||||||
| Period from October 3, 2016 through December 31, 2016 |
Period from January 1, 2016 through October 2, 2016 |
Year Ended December 31, |
||||||||||||||||||||||||||
| 2015 | 2014 | 2013 | 2012 | 2011 | ||||||||||||||||||||||||
| (in millions, except per share amounts) | ||||||||||||||||||||||||||||
| Operating revenues |
$ | 1,191 | $ | 3,973 | $ | 5,370 | $ | 5,978 | $ | 5,899 | $ | 5,636 | $ | 7,040 | ||||||||||||||
| Impairment of goodwill |
$ | — | $ | — | $ | (2,200 | ) | $ | (1,600 | ) | $ | (1,000 | ) | $ | (1,200 | ) | $ | — | ||||||||||
| Impairment of long-lived assets |
$ | — | $ | — | $ | (2,541 | ) | $ | (4,670 | ) | $ | (140 | ) | $ | — | $ | (9 | ) | ||||||||||
| Operating income (loss) |
$ | (161 | ) | $ | 568 | $ | (4,091 | ) | $ | (6,015 | ) | $ | (1,113 | ) | $ | (961 | ) | $ | 1,437 | |||||||||
| Net income (loss) (a) |
$ | (163 | ) | $ | 22,851 | $ | (4,677 | ) | $ | (6,229 | ) | $ | (2,197 | ) | $ | (2,948 | ) | $ | (1,740 | ) | ||||||||
| Cash provided by (used in) operating activities |
$ | 81 | $ | (238 | ) | $ | 237 | $ | 444 | $ | (270 | ) | $ | (237 | ) | $ | 1,240 | |||||||||||
| Weighted average shares of common stock outstanding — basic and diluted |
428 | — | — | — | — | — | — | |||||||||||||||||||||
| Net loss per weighted average share of common stock outstanding — basic and diluted |
$ | (0.38 | ) | — | — | — | — | — | — | |||||||||||||||||||
| Dividends declared per share of common stock |
$ | 2.32 | — | — | — | — | — | — | ||||||||||||||||||||
51
Table of Contents
| Successor | Predecessor | |||||||||||||||||||||||
| At December 31, 2016 |
At December 31, | |||||||||||||||||||||||
| 2015 | 2014 | 2013 | 2012 | 2011 | ||||||||||||||||||||
| (in millions) | ||||||||||||||||||||||||
| Balance Sheet Information: |
||||||||||||||||||||||||
| Total assets (b)(c) |
$ | 15,167 | $ | 15,658 | $ | 21,343 | $ | 28,822 | $ | 32,969 | $ | 37,335 | ||||||||||||
| Property, plant & equipment — net (b)(c) |
$ | 4,443 | $ | 9,349 | $ | 12,288 | $ | 17,649 | $ | 18,556 | $ | 19,218 | ||||||||||||
| Goodwill and intangible assets |
$ | 5,112 | $ | 1,331 | $ | 3,688 | $ | 5,669 | $ | 6,733 | $ | 7,978 | ||||||||||||
| Borrowings, debt and pre-Petition notes, loans and other debt |
||||||||||||||||||||||||
| Borrowings under debtor-in-possession credit facilities (d) |
$ | — | $ | 1,425 | $ | 1,425 | $ | — | $ | — | $ | — | ||||||||||||
| Debt (e) |
$ | 4,557 | $ | 3 | $ | 51 | $ | 26,146 | $ | 29,795 | $ | 29,677 | ||||||||||||
| Pre-Petition notes, loans and other debt reported as liabilities subject to compromise (f) |
$ | — | $ | 31,668 | $ | 31,856 | $ | — | $ | — | $ | — | ||||||||||||
| Borrowings under Predecessor’s credit facilities (g) |
$ | — | $ | — | $ | — | $ | 2,054 | $ | 2,136 | $ | 774 | ||||||||||||
| Total equity/membership interests |
6,597 | (22,884 | ) | (18,209 | ) | (11,982 | ) | (9,683 | ) | (6,758 | ) | |||||||||||||
| (a) | Predecessor period from January 1, 2016 through October 2, 2016 includes net gains totaling $22.121 billion related to bankruptcy-related reorganization items including gains on extinguishing claims pursuant to the Plan. |
| (b) | As of December 31, 2016, amount includes the Lamar and Forney natural gas generation facilities purchased in April 2016. See Note 6 to the 2016 Annual Financial Statements for further discussion. |
| (c) | Reflects impact of impairment charges for long-lived assets of $2.541 billion and $4.670 billion in the years ended December 31, 2015 and 2014, respectively (see Note 8 to the 2016 Annual Financial Statements). |
| (d) | Borrowings under debtor-in-possession credit facilities are classified as noncurrent as of December 31, 2014 and due currently as of December 31, 2015. |
| (e) | For all periods presented, excludes amounts with contractual maturity dates in the following twelve months. |
| (f) | As of December 31, 2015 and 2014, includes both unsecured and under secured obligations incurred prior to the Petition Date, but excludes pre-petition obligations that were fully secured and other obligations that were allowed to be paid as ordered by the Bankruptcy Court. As of December 31, 2014, also excludes $702 million of deferred debt issuance and extension costs. |
| (g) | Excludes borrowings under debtor-in-possession credit facilities. |
52
Table of Contents
Unaudited Pro Forma Condensed Consolidated Financial Information
We prepared the following unaudited pro forma condensed consolidated statement of income (loss) by applying certain pro forma adjustments to the combined condensed consolidated financial statements of our Predecessor for the period of January 1, 2016 to October 2, 2016 and our Successor for the period of October 3, 2016 to December 31, 2016. The pro forma adjustments give effect to (i) the implementation of all reorganization transactions contemplated by the Plan, (ii) the application of fresh-start reporting for the emerged entity, Vistra Energy, and (iii) the incurrence of the $1 billion 2016 Incremental Term Loans.
The unaudited pro forma condensed consolidated statements of income (loss) for the year ended December 31, 2016 gives effect to the pro forma adjustments as if each adjustment had occurred on January 1, 2016, the first day of the last fiscal year presented.
The pro forma adjustments include the following Plan, Emergence-related and fresh-start adjustments:
| • | the conversion of the TCEH DIP Roll Facilities into the Vistra Operations Credit Facilities on the Effective Date and the related interest rates applicable under those facilities, which includes the following: |
| • | $2.85 billion senior secured term loan (the Initial Term Loan B Facility); |
| • | $650 million fully-funded senior secured term loan letter of credit facility (the Term Loan C Facility); and |
| • | $750 million senior secured revolving credit facility (the Initial Revolving Credit Facility), which remained undrawn as of the date of Emergence, increased to $860 million (the 2016 Incremental Revolving Credit Commitments, and together with the Initial Revolving Credit Facility, the Revolving Credit Facility) in connection with the 2016 Incremental Term Loans borrowings in December 2016 described below and remaining undrawn; |
| • | the cancelation or repayment of the indebtedness of TCEH and its subsidiaries and removal of the related interest expense under those facilities; |
| • | the inclusion of accretion expense related to the obligations under the Tax Receivable Agreement described in “Certain Relationships and Related Party Transactions — Tax Receivable Agreement” that are reflected as a liability; |
| • | the inclusion of interest expense related to the $70 million of mandatorily redeemable preferred stock of PrefCo as part of the Spin-Off on the Effective Date; |
| • | the impacts of related depreciation and amortization associated with the change in value for our property, plant and equipment and intangible assets under fresh-start reporting; and |
| • | the removal of the prior impacts of reorganization items related to the Predecessor’s bankruptcy proceedings. |
The transactions reflected in the pro forma adjustments pursuant to the Plan and Emergence are described elsewhere in this prospectus under the heading “The Reorganization and Emergence.”
The pro forma adjustments also reflect the impacts of fair value adjustments arising from the application of fresh-start reporting in accordance with Financial Accounting Standards Board Accounting Standards Codification (ASC) 852, Reorganizations (ASC 852).
For purposes of determining pro forma interest expense from our Vistra Operations Credit Facilities (including the 2016 Incremental Term Loans), we have assumed an interest rate of 5.0% and 4.0%, respectively (each such rate consisting of LIBOR (subject to a floor) plus an applicable margin), per annum on borrowings thereunder. This assumed rate is based on the terms of our debt and market conditions when the debt was incurred.
53
Table of Contents
Additional Information
We have based the pro forma adjustments upon available information and certain assumptions that we believe are reasonable under the circumstances. We describe in greater detail the assumptions underlying the pro forma adjustments in the accompanying footnotes, which should be read in conjunction with these unaudited pro forma condensed consolidated financial statements. In many cases, we based these assumptions on estimates. Accordingly, the actual adjustments that will appear in our condensed consolidated financial statements will differ from these pro forma adjustments, and those differences may be material.
In addition, we recognized certain nonrecurring expenses subsequent to Emergence that were directly related to our Chapter 11 reorganization. The pro forma statement of income does not include any adjustments to remove these expenses.
We provide the unaudited pro forma condensed statement of income for informational purposes only. This unaudited pro forma condensed statement of income does not purport to represent what our results of operations would have been had the assumed transactions actually occurred on the assumed date, nor does it purport to project our results of operations for any future period or future date. Our unaudited pro forma condensed statement of income should be read in conjunction with “Capitalization”, “Selected Historical Consolidated Financial Information”, “Management’s Discussion and Analysis of Financial Condition and Results of Operations”, and the historical audited and unaudited financial statements of our Predecessor, including the related notes thereto, appearing elsewhere in this prospectus.
54
Table of Contents
Unaudited Pro Forma Condensed Consolidated Statement of Income (Loss) of Vistra Energy
(In Millions, Except Per Share Amounts)
| Historical (a) | ||||||||||||||||||||
| Predecessor | Successor | |||||||||||||||||||
| January 1, 2016 to October 2, 2016 |
October 3, 2016 to December 31, 2016 |
Pro Forma Adjustments |
Vistra Energy Pro Forma As Adjusted |
|||||||||||||||||
| Operating revenues |
3,973 | 1,191 | 253 | (b | ) | 5,417 | ||||||||||||||
| Fuel, purchased power costs and delivery fees |
(2,082 | ) | (720 | ) | (12 | ) | (c | ) | (2,814 | ) | ||||||||||
| Net gain from commodity hedging and trading activities |
282 | — | (282 | ) | (d | ) | — | |||||||||||||
| Operating costs |
(664 | ) | (208 | ) | (4 | ) | (876 | ) | ||||||||||||
| Depreciation and amortization |
(459 | ) | (216 | ) | 1 | (e | ) | (674 | ) | |||||||||||
| Selling, general and administrative expenses |
(482 | ) | (208 | ) | 13 | (677 | ) | |||||||||||||
| Other income |
16 | 9 | 7 | 32 | ||||||||||||||||
| Other deductions |
(75 | ) | — | (6 | ) | (81 | ) | |||||||||||||
| Interest income |
3 | 1 | — | 4 | ||||||||||||||||
| Interest expense and related charges |
(1,049 | ) | (60 | ) | 882 | (f | ) | (227 | ) | |||||||||||
| Tax Receivable Agreement obligation |
— | (22 | ) | (65 | ) | (g | ) | (87 | ) | |||||||||||
| Reorganization items |
22,121 | — | (22,121 | ) | (h | ) | — | |||||||||||||
|
|
|
|
|
|
|
|
|
|||||||||||||
| Income (loss) before income taxes |
21,584 | (233 | ) | (21,334 | ) | 17 | ||||||||||||||
| Income tax benefit (expense) |
1,267 | 70 | (1,364 | ) | (i | ) | (27 | ) | ||||||||||||
|
|
|
|
|
|
|
|
|
|||||||||||||
| Net income (loss) income |
22,851 | (163 | ) | (22,698 | ) | (10 | ) | |||||||||||||
|
|
|
|
|
|
|
|
|
|||||||||||||
| Basic income per share available to common shareholders |
$ | (0.38 | ) | $ | (0.02 | ) | ||||||||||||||
| Basic and diluted shares outstanding |
427,560,620 | 427,560,620 | ||||||||||||||||||
Notes to Unaudited Pro Forma Condensed Consolidated Statement of Income (Loss) of Vistra Energy.
Our Predecessor As Reported
| (a) | The Unaudited Pro Forma Condensed Consolidated Statement of Income (Loss) is derived from the consolidated statement of income (loss) of our Predecessor for the period of January 1, 2016 to October 2, 2016 and the consolidated statement of income (loss) of our Successor for the period of October 3, 2016 to December 31, 2016. |
Plan Effects and Fresh Start Adjustments
| (b) | Reflects the following: |
| • | $54 million decrease in operating revenues as a result of amortization expense related to the fair value adjustment to intangible assets and liabilities related to electric supply agreements and retail contracts. |
| • | $307 million increase in operating revenues as a result of reclassifying realized and unrealized derivative activity pertaining to hedging activity related to generation revenues. |
| (c) | Reflects the following: |
| • | $9 million decrease in amortization expense as a result of the fair value adjustment to property, plant, and equipment related to nuclear fuel. |
| • | $1 million decrease in fuel expense amortization as a result of the fair value adjustment to intangible assets related to emissions credits, wholesale power purchase agreements and transportation contracts. |
55
Table of Contents
| • | $2 million decrease in accretion expense as a result of the fair value adjustment to lignite mine asset retirement obligations. |
| • | $24 million increase in fuel and purchased power costs as a result of reclassifying realized and unrealized derivative activity pertaining to fuel and purchased power hedges. |
| (d) | Reflects the reclassification of Predecessor realized and unrealized commodity hedging activity pertaining to power sales, power purchases, and fuel purchases. |
| (e) | Reflects the following: |
| • | $312 million decrease in depreciation expense as a result of the fair value adjustment to property, plant, and equipment. |
| • | $308 million increase in amortization expense as a result of the fair value adjustment to intangible assets related to retail customer relationships. |
| • | $3 million increase in depreciation expense related to capital lease asset transferred from the EFH Shared Services Debtors as part of the Plan. |
| (f) | Reflects the following: |
| • | Elimination of $1.064 billion of interest expense related to interest expense and adequate protection expense on Predecessor debt with third-parties and notes with affiliates. |
| • | Addition of $168 million of interest expense related to our Vistra Operations Credit Facilities. |
For purposes of estimating the pro forma interest expense, we used an interest rate of 5.0% per annum for our variable interest rate, Vistra Operations Credit Facilities, which is based on the following information when the debt was incurred: (1) LIBOR (subject to a floor of 1.0%) plus a 400 basis point fixed margin; and (2) a 5.00% rate for our variable interest rate senior secured debt facilities, which is based on the following estimated terms: (a) an annualized floating interest rate of LIBOR plus a 400 basis point fixed margin, and (b) a minimum LIBOR rate floor of 1.00%. We used an annualized floating interest rate of 4.00% for our additional borrowing subsequent to Emergence, which is based on available information when the debt was incurred: (a) an annualized floating interest rate of LIBOR plus a 325 basis point fixed margin, and (b) a minimum LIBOR rate floor of 0.75%.
| • | Addition of $9 million of interest expense related to debt balances transferred from contributed entities as part of the Plan. |
| • | Addition of $5 million of interest expense related to the $70 million of mandatorily redeemable preferred stock of PrefCo, recorded as a debt instrument with a fixed 10% coupon rate. |
| (g) | Reflects the accretion expense related to the discounted tax receivable agreement obligation. The obligation was valued using a present value utilizing a risk-adjusted discount rate which yields the estimated accretion of the obligation. |
| (h) | Reflects the elimination of our Predecessor’s bankruptcy-related reorganization items. |
| (i) | Reflects the tax impact of the pro forma adjustments. Pro forma adjustments to tax expense result in an effective tax rate that is higher than the U.S. federal statutory tax rate of 35% due primarily to nondeductible Tax Receivable Agreement accretion. |
56
Table of Contents
Management’s Discussion and Analysis of
Financial Condition and Results of Operations
This section provides a discussion of our historical financial condition, cash flows and results of operations for the periods indicated as required by the registration statement of which this prospectus is a part. Except as otherwise indicated herein, or as the context may otherwise require, all references to “Vistra Energy,” “the Company,” “we,” “us” and “our” refer to (i) Vistra Energy Corp. and, unless the context otherwise requires, its direct and indirect subsidiaries and (ii) prior to its emergence from bankruptcy (Emergence) on October 3, 2016 (the Effective Date), Texas Competitive Electric Holdings Company LLC, a Delaware limited liability company, and, unless the context otherwise requires, its direct and indirect subsidiaries (TCEH or our Predecessor). Unless otherwise noted, any discussion in this section relating to the Predecessor or the Predecessor period does not reflect, among other things, any effects of the transactions described in “The Reorganization and Emergence,” including entry into the Tax Receivable Agreement described in more detail in “Certain Relationships and Related Party Transactions — Tax Receivable Agreement,” or fresh-start reporting, and thus, is not reflective of, or comparable to, Vistra Energy’s financial condition, cash flows or results of operations as of and subsequent to the Effective Date. In addition, comparisons of year-over-year results are impacted by the effects of the Bankruptcy Filing (defined under “—Significant Activities and Events and Items Influencing Future Performance” below) and the application of Financial Accounting Standards Board Accounting Standards Codification (ASC) 852, Reorganizations. The following discussion and analysis of our financial condition, cash flows and results of operations should be read in conjunction with “Selected Historical Consolidated Financial Information” and our audited and unaudited condensed consolidated financial statements, included herein, and, in each case, the notes to those statements included elsewhere in this prospectus, as well as the discussion in the section of this prospectus entitled “Business.” This discussion contains forward-looking statements that involve numerous risks and uncertainties. The forward-looking statements are subject to a number of important factors, including those factors discussed under “Risk Factors” and “Special Note Regarding Forward-Looking Statements,” that could cause actual results to differ materially from the results described or implied by such forward-looking statements. All dollar amounts in the tables in the following discussion and analysis are stated in millions of United States dollars unless otherwise indicated.
Basis of Presentation and Fresh-Start Reporting
As of the Effective Date, Vistra Energy applied fresh-start reporting under the applicable provisions of Financial Accounting Standards Board (FASB) Accounting Standards Codification (ASC) 852, Reorganizations (ASC 852). Fresh-start reporting includes (1) distinguishing the consolidated financial statements of the entity that was previously in restructuring (TCEH or our Predecessor) from the financial statements of the entity that emerges from restructuring (Vistra Energy or the Successor), (2) assigning the reorganized value of the Successor entity by measuring all assets and liabilities of the Successor entity at fair value and (3) selecting accounting policies for the Successor entity. The financial statements of Vistra Energy for periods subsequent to the Effective Date are not comparable to the financial statements of TCEH for periods prior to the Effective Date, as those previous periods do not give effect to any adjustments to the carrying values of assets or amounts of liabilities that resulted from the Plan and the related application of fresh-start reporting. The reorganization value of Vistra Energy was assigned to its assets and liabilities in conformity with the procedures specified by FASB ASC 805, Business Combinations, and the portion of the reorganization value that was not attributable to identifiable tangible or intangible assets was recognized as goodwill. See Note 3 to our annual financial statements dated December 31, 2016 (the 2016 Annual Financial Statements) for further discussion regarding fresh-start reporting.
The consolidated financial statements of our Predecessor reflect the application of ASC 852 as it applies to entities that have filed a petition for bankruptcy under Chapter 11 of the Bankruptcy Code. As a result, the consolidated financial statements of our Predecessor have been prepared as if TCEH was a going concern and contemplated the realization of assets and liabilities in the normal course of business. During the Chapter 11 Cases, the Debtors operated their businesses as debtors-in-possession under the jurisdiction of the Bankruptcy Court and in accordance with the applicable provisions of the Bankruptcy Code. The guidance requires that transactions and events directly associated with the reorganization be distinguished from the ongoing operations
57
Table of Contents
of the business. In addition, the guidance provides for changes in the accounting and presentation of liabilities. Prior to the Effective Date, our Predecessor recorded the effects of the Plan (as defined herein) in accordance with ASC 852. See Notes 4 and 5 to the 2016 Annual Financial Statements for further discussion of these accounting and reporting changes.
The consolidated financial statements have been prepared in accordance with generally accepted accounting principles in the Unites States from time to time (U.S. GAAP). All intercompany transactions and balances have been eliminated in consolidation. Subsequent events have been evaluated through March 30, 2017, the date these consolidated financial statements were issued.
Operating Segments
Subsequent to the Effective Date, Vistra Energy has two reportable segments: the Wholesale Generation segment, consisting largely of Luminant, and the Retail Electricity segment, consisting largely of TXU Energy. Prior to the Effective Date, there were no reportable business segments for TCEH. See Note 21 to the 2016 Annual Financial Statements for further information concerning reportable business segments.
Items Affecting Comparability
Our Predecessor’s historical results of operations, including the impacts of long-lived asset impairment charges, goodwill impairment charges and bankruptcy and restructuring activities, are provided in detail below. These items are related primarily to the bankruptcy process and activities necessitated by the Plan and our Emergence and are not the result of our current operations. Management does not believe these items are applicable subsequent to the Effective Date.
Some of the significant expenses/(gains) impacting the historical comparability of reported income from operations are noted in the table below:
| Predecessor | ||||||||||||
| Period from January 1, 2016 Through October 2, 2016 |
Year Ended December 31, |
|||||||||||
| 2015 | 2014 | |||||||||||
| (in millions) | ||||||||||||
| Bankruptcy-related reorganization items |
$ | (22,121 | ) | $ | 101 | $ | 520 | |||||
| Impairment of goodwill |
$ | — | $ | 2,200 | $ | 1,600 | ||||||
| Impairment of long-lived assets |
$ | — | $ | 2,541 | $ | 4,670 | ||||||
Significant Activities and Events and Items Influencing Future Performance
Chapter 11 Cases and Emergence — As more fully described in the section entitled “The Reorganization and Emergence,” on April 29, 2014 (the Petition Date), Energy Future Holdings Corp. (EFH Corp.) and the substantial majority of its direct and indirect subsidiaries (collectively, the Debtors), including Energy Future Intermediate Holding Company LLC (EFIH), Energy Future Competitive Holdings Company LLC (EFCH) and our Predecessor, but excluding Oncor Electric Delivery Holdings Company LLC and its direct and indirect subsidiaries (collectively, Oncor), filed voluntary petitions for relief (the Bankruptcy Filing) under Chapter 11 of the United States Bankruptcy Code (the Bankruptcy Code) in the United States Bankruptcy Court for the District of Delaware (the Bankruptcy Court). The cases in the Bankruptcy Court concerning the Bankruptcy Filing are collectively referred to herein as the Chapter 11 Cases.
On August 29, 2016, the Bankruptcy Court entered an order confirming the Third Amended Joint Plan of Reorganization of the Debtors, including TCEH and its subsidiaries (the Plan), solely as it pertains to EFCH, TCEH and the subsidiaries of TCEH that were Debtors (the TCEH Debtors) and the EFH Shared Services Debtors (as defined in the Plan and, together with the TCEH Debtors, the T-Side Debtors). The Plan allowed the confirmation and effective date of the plan of reorganization with respect to the T-Side Debtors to occur separate
58
Table of Contents
from, and independent of, the confirmation and effective date of the plan of reorganization with respect to EFH Corp., EFIH and their subsidiaries that are Debtors, excluding the T-Side Debtors (the EFH Debtors). On the Effective Date of October 3, 2016, the Plan with respect to the T-Side Debtors became effective and the T-Side Debtors completed their reorganization under the Bankruptcy Code and emerged from the Chapter 11 Cases as subsidiaries of a newly-formed company, Vistra Energy. On the Effective Date, EFH Corp. distributed the common stock of Vistra Energy as part of a tax-free spin-off from EFH Corp. (Spin-Off). As a result, as of the Effective Date, Vistra Energy is a holding company for subsidiaries principally engaged in competitive electricity market activities including power generation, wholesale energy sales and purchases, commodity risk management and retail sales of electricity and related services to end users. See Note 2 to the 2016 Annual Financial Statements for further discussion regarding the Chapter 11 Cases and Emergence.
For more detail, see “The Reorganization and Emergence” above.
Support Cost Reductions — In October 2016, we began executing a plan to reduce support costs across our business by focusing on organizational structures of support functions and reducing costs associated with third party service providers. As part of that plan, we reduced our workforce by approximately 500 people to better align our cost structure to current market conditions. These market conditions include persistently low wholesale power prices, environmental regulatory pressure and a highly competitive retail market. As part of these reductions, we incurred severance costs of approximately $43 million, which were primarily recorded to selling, general and administrative expenses and operating costs during the period. Additionally, in October 2016, we began renegotiating and amending certain service contracts with providers to further reduce our support costs.
Lamar and Forney Acquisition — In April 2016, our subsidiaries that engaged in competitive market activities consisting of power generation and wholesale electricity sales and purchases as well as commodity risk management (collectively, Luminant) purchased all of the membership equity interests in La Frontera Holdings, LLC, the indirect owner of two natural gas-fueled generation facilities representing nearly 3,000 megawatts (MW) of capacity located in ERCOT, from La Frontera Ventures, LLC, a subsidiary of NextEra Energy, Inc. (the Lamar and Forney Acquisition). The facility in Forney, Texas has a capacity of 1,912 MW and the facility in Paris, Texas has a capacity of 1,076 MW. The aggregate purchase price was approximately $1.313 billion, which included the repayment of approximately $950 million of existing project financing indebtedness, plus approximately $236 million for cash and net working capital subject to final settlement. The purchase price was funded by cash-on-hand and additional borrowings under our Predecessor’s $3.375 billion debtor-in-possession financing facility at the time (the TCEH DIP Facility), totaling $1.1 billion. After completing the acquisition, our Predecessor repaid approximately $230 million of borrowings under the TCEH DIP Facility, primarily utilizing cash acquired in the transaction. See Note 6 to the 2016 Annual Financial Statements for further discussion of the acquisition.
Conversion of TCEH DIP Roll Facilities to Vistra Operations Credit Facilities — In August 2016, our Predecessor entered into certain $4.250 billion debtor-in-possession and exit financing facilities (the TCEH DIP Roll Facilities). Prior to the Effective Date, the TCEH DIP Roll Facilities provided for up to $4.250 billion in senior secured, super-priority financing consisting of a revolving credit facility of up to $750 million (the TCEH DIP Roll Revolving Credit Facility), a term loan letter of credit facility of up to $650 million (the TCEH DIP Roll Term Loan Letter of Credit Facility) and a term loan facility of up to $2.850 billion (the TCEH DIP Roll Term Loan Facility). Prior to the Effective Date, approximately $3.5 billion was outstanding under the TCEH DIP Roll Facilities, approximately $2.65 billion of which was used to repay all amounts outstanding under the TCEH DIP Facility, and the balance of which was used for general business purposes. Upon the Effective Date, the TCEH DIP Roll Facilities were converted into senior secured exit facilities (the Vistra Operations Credit Facilities) of Vistra Operations Company LLC (Vistra Operations) with maturity dates of August 2021 for the revolving credit facility and August 2023 for the term loan facilities. See “Description of Indebtedness.” The Vistra Operations Credit Facilities initially consisted of up to $4.250 billion in senior secured, first lien financing consisting of a revolving credit facility of up to $750 million (the Revolving Credit Facility), a term loan facility of up to $2.850 billion (the Initial Term Loan B Facility) and a term loan letter of credit facility of up to $650 million (the Term Loan C Facility).
59
Table of Contents
In December 2016, we incurred approximately $1 billion of incremental term loans with a maturity date of December 2023 and $110 million of incremental revolving credit commitments under the Vistra Operations Credit Facility. Proceeds from the incremental term loan facility were used to fund the 2016 Special Dividend in the aggregate amount of approximately $992 million that was approved by Vistra Energy’s board of directors and paid in December 2016. As of December 31, 2016, approximately $4.5 billion was outstanding under the Vistra Operations Credit Facilities.
In February 2017, certain pricing terms for the Vistra Operations Credit Facility were amended. Any amounts borrowed under the Revolving Credit Facility will bear interest based on applicable LIBOR rates plus 2.75%. Amounts borrowed under the Initial Term Loan B Facility and the Term Loan C Facility will bear interest based on applicable LIBOR rates, subject to a 0.75% floor, plus 2.75%.
See “— Liquidity and Capital Resources — Debt Activity” and Note 13 to the 2016 Annual Financial Statements for details of the Vistra Operations Credit Facilities, the DIP Roll Facilities and the DIP Facility.
Environmental Matters — See “Business — Legal Proceedings and Regulatory Matters — Environmental Matters” for a discussion of greenhouse gas emissions, the CSAPR, regional haze, state implementation plan and other recent EPA actions as well as related litigation.
60
Table of Contents
Key Risks and Challenges
Following is a discussion of key risks and challenges facing management and the initiatives currently underway to manage such challenges. These matters involve risks that could have a material effect on our results of operations, liquidity or financial condition.
Natural Gas Price and Market Heat Rate Exposure — The price of power in the ERCOT market is typically set by natural gas-fueled generation facilities, with wholesale electricity prices generally tracking increases or decreases in the price of natural gas. In recent years, natural gas supply has outpaced demand primarily as a result of development and expansion of hydraulic fracturing in natural gas extraction; the supply/demand imbalance has resulted in historically low natural gas prices, and such prices have historically been volatile. The table below shows the general decline in forward natural gas prices over the last several years (amounts are prices per MMBtu).
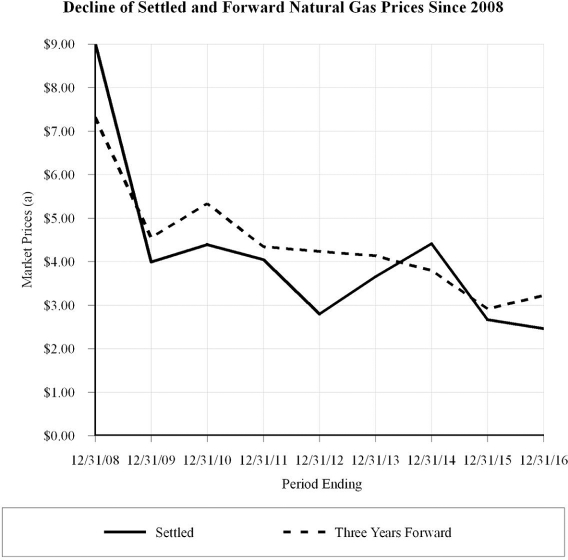
| (a) | Settled prices represent the average of NYMEX Henry Hub monthly settled prices of financial contracts for the year ending on the date presented. Forward prices represent the three-year average of NYMEX Henry Hub monthly forward prices at the date presented. Three year forward prices are presented as we believe such period is generally deemed to be a liquid period. |
61
Table of Contents
In contrast to our natural gas-fueled generation facilities, changes in natural gas prices have no significant effect on the cost of generating power at our nuclear-, lignite- and coal-fueled facilities, which represent the substantial majority of our generation capacity. Consequently, all other factors being equal, these nuclear-, lignite- and coal-fueled generation assets increase or decrease in value as natural gas prices and market heat rates rise or fall, respectively, because of the effect on our operating margins from changes in wholesale electricity prices in ERCOT. A persistent decline in the price of natural gas, and the corresponding decline in the price of power in the ERCOT market, would likely have a material adverse effect on our results of operations, liquidity and financial condition, predominantly related to the production of power generation volumes in excess of the volumes utilized to service our retail customer load requirements.
The wholesale market price of electricity divided by the market price of natural gas represents the market heat rate. Market heat rate can be affected by a number of factors, including generation availability, mix of assets and the efficiency of the marginal supplier (generally, natural gas-fueled generation facilities) in generating electricity. Our market heat rate exposure is impacted by changes in the availability of generation resources, such as additions and retirements of generation facilities, and the mix of generation assets in ERCOT. For example, increasing renewable (wind and solar) generation capacity generally depresses market heat rates. Our market heat rate exposure is also impacted by the potential economic backdown of our generation assets. Decreases in market heat rates generally decrease the value of our generation assets because lower market heat rates generally result in lower wholesale electricity prices, and vice versa. However, even though market heat rates have generally increased over the past several years, wholesale electricity prices have declined due to the greater effect of falling natural gas prices.
As a result of our exposure to the variability of natural gas prices and market heat rates in ERCOT, retail sales and hedging activities are critical to our operating results and maintaining consistent cash flow levels.
Our integrated power generation and retail electricity business provides us opportunities to hedge our generation position utilizing retail electricity markets sales channels. In addition, our approach to managing electricity price risk focuses on the following:
| • | employing disciplined and liquidity-efficient hedging and risk management strategies through physical and financial energy-related contracts intended to partially hedge gross margins; |
| • | continuing focus on cost management to better withstand gross margin volatility; |
| • | following a retail pricing strategy that appropriately reflects the value of our product offering to customers, the magnitude and costs of commodity price, liquidity risk and retail demand variability; and |
| • | improving retail customer service to attract and retain high-value customers. |
We have engaged in natural gas hedging activities to mitigate the risk of lower wholesale electricity prices that have corresponded to declines in natural gas prices. While current and forward natural gas prices are currently depressed, we continue to seek opportunities to manage our wholesale electricity price exposure through hedging activities, including forward wholesale and retail power sales.
We mitigate market heat rate risk through retail and wholesale electricity sales contracts and shorter-term heat rate hedging transactions. We evaluate opportunities to mitigate heat rate risk over extended periods through longer-term electricity sales contracts where practical, considering pricing, credit, liquidity and related factors.
On an ongoing basis, we will continue monitoring our overall commodity risks and seek to balance our portfolio based on our desired level of exposure to natural gas prices and market heat rates and potential changes to our operational forecasts of overall generation and consumption in our businesses (which are also subject to volatility resulting from customer churn, weather, economic and other factors). Portfolio balancing may include the execution of incremental transactions, including heat rate hedges, the unwinding of existing transactions and
62
Table of Contents
the substitution of natural gas hedges with commitments for the sale of electricity at fixed prices. As a result, commodity price exposures and their effect on our results of operations, liquidity and financial condition could materially change from time to time.
Taking together forward wholesale, retail electricity sales and other retail customer considerations and all other hedging positions, at March 1, 2017, we had effectively hedged an estimated 92% and 52% of the natural gas price exposure related to our overall business for 2017 and 2018, respectively. Additionally, taking into consideration our overall heat rate exposure and related hedging positions at March 1, 2017, we had effectively hedged 85% and 35% of the heat rate exposure to our overall business for 2017 and 2018, respectively.
The following sensitivity table provides approximate estimates of the potential impact of movements in natural gas prices and market heat rates on realized pretax earnings (in millions) on the hedge positions noted in the paragraph above for the periods presented. The estimates related to price sensitivity are based on our expected generation and retail positions, related hedges and forward prices as of March 1, 2017.
| Balance 2017 (a) | 2018 | |||||||
| $0.50/MMBtu increase in natural gas price (b)(c) |
$ | ~40 | $ | ~190 | ||||
| $0.50/MMBtu decrease in natural gas price (b)(c) |
$ | ~(5 | ) | $ | ~(160 | ) | ||
| 1.0/MMBtu/MWh increase in market heat rate (d) |
$ | ~40 | $ | ~190 | ||||
| 1.0/MMBtu/MWh decrease in market heat rate (d) |
$ | ~(15 | ) | $ | ~(150 | ) | ||
| (a) | Balance of 2017 is from March 1, 2017 through December 31, 2017. |
| (b) | Assumes conversion of generation positions based on market heat rates and an estimate of natural gas generally being on the margin 70% to 90% of the time in the ERCOT market. |
| (c) | Based on Houston Ship Channel natural gas prices at March 1, 2017. |
| (d) | Based on ERCOT North Hub around-the-clock heat rates at March 1, 2017. |
Competitive Retail Markets and Customer Retention
Competitive retail activity in ERCOT has resulted in retail customer churn as customers switch electricity retail providers for various reasons. Based on number of meters, our total retail customer counts declined approximately 1% in 2016, less than 1% in 2015 and 1% in 2014. Based upon 2016 results discussed below in “—Results of Operations,” a 1% decline in residential customers would result in a decline in annual revenues of approximately $27 million. In responding to the competitive landscape in the ERCOT market, we have attempted to reduce overall customer losses by focusing on the following key initiatives:
| • | Maintaining competitive pricing initiatives on residential service plans; |
| • | Actively competing for new customers in areas open to competition within ERCOT, while continuing to strive to enhance the experience of our existing customers; we are focused on continuing to implement initiatives that deliver world-class customer service and improve the overall customer experience; |
| • | Establishing and leveraging our TXU EnergyTM brand in the sale of electricity to residential and commercial customers, as the most innovative retailer in the ERCOT market by continuing to develop tailored product offerings to meet customer needs; and |
| • | Focusing market initiatives largely on programs targeted at retaining the existing highest-value customers and recapturing customers who have switched REPs, including maintaining and continuously refining a disciplined contracting and pricing approach and economic segmentation of the business market to enhance targeted sales and marketing efforts and to more effectively deploy our direct-sales force; tactical programs we have initiated include improved customer service, aided by an enhanced customer management system, new product price/service offerings and a multichannel approach for the small business market. |
63
Table of Contents
Exposures Related to Nuclear Asset Outages
Our nuclear assets are comprised of two generation units at the Comanche Peak facility, each with an installed nameplate generation capacity of 1,150 MW. As of December 31, 2016, these units represented approximately 14% of our total generation capacity. The nuclear generation units represent our lowest marginal cost source of electricity. Assuming both nuclear generation units experienced an outage at the same time, the unfavorable impact to pretax earnings is estimated (based upon forward electricity market prices for 2017 at December 31, 2016) to be approximately $1 million per day before consideration of any costs to repair the cause of such outages or receipt of any insurance proceeds. See “Business — Nuclear Insurance” for additional information.
The inherent complexities and related regulations associated with operating nuclear generation facilities result in environmental, regulatory and financial risks. The operation of nuclear generation facilities is subject to continuing review and regulation by the Nuclear Regulatory Commission (NRC), including potential regulation as a result of the NRC’s ongoing analysis and response to the effects of the natural disaster on nuclear generation facilities in Fukushima, Japan in 2010, covering, among other things, operations, maintenance, emergency planning, security, and environmental and safety protection. The NRC may implement changes in regulations that result in increased capital or operating costs and may require extended outages, modify, suspend or revoke operating licenses and impose fines for failure to comply with its existing regulations and the provisions of the Atomic Energy Act. In addition, an unplanned outage at another nuclear generation facility could result in the NRC taking action to shut down our Comanche Peak units as a precautionary measure.
We participate in industry groups and with regulators to keep current on the latest developments in nuclear safety, operation and maintenance and on emerging threats and mitigation techniques. These groups include, but are not limited to, the NRC, the Institute of Nuclear Power Operations (INPO) and the Nuclear Energy Institute (NEI). We also apply the knowledge gained through our continuing investment in technology, processes and services to improve our operations and to detect, mitigate and protect our nuclear generation assets. The Comanche Peak plant has not experienced an extended unplanned outage, and management continues to focus on safe, reliable and efficient operations at the facility.
Cyber Security and Infrastructure Protection Risk
A breach of cyber/data security measures that impairs our information technology infrastructure could disrupt normal business operations and affect our ability to control our generation assets, access retail customer information and limit communication with third parties. Any loss of confidential or proprietary data through a breach could materially affect our reputation, including our TXU EnergyTM brand, expose the company to legal claims or impair our ability to execute our business strategies.
We participate in industry groups and engage with regulators to remain current on emerging threats and mitigating techniques. These groups include, but are not limited to, the United States Cyber Emergency Response Team, the National Electric Sector Cyber Security Organization, the NRC and NERC.
While the company has not experienced a cyber event causing any material operational, reputational or financial impact, we recognize the growing threat within the general market place and our industry, and are proactively making strategic investments in our perimeter and internal defenses, cyber security operations center and regulatory compliance activities. We also apply the knowledge gained through industry and government organizations to continuously improve our technology, processes and services to detect, mitigate and protect our cyber assets.
Application of Critical Accounting Policies
We follow U.S. GAAP. Application of these accounting policies in the preparation of our consolidated financial statements requires management to make estimates and assumptions about future events that affect the reporting of assets and liabilities at the balance sheet dates and revenues and expenses during the periods
64
Table of Contents
covered. The following is a summary of certain critical accounting policies that are impacted by judgments and uncertainties and under which different amounts might be reported using different assumptions or estimation methodologies.
Accounting in Reorganization and Fresh-Start Reporting
The consolidated financial statements of our Predecessor reflect the application of ASC 852. During the Chapter 11 Cases, the Debtors, including our Predecessor and its subsidiaries, operated their businesses as debtors-in-possession under the jurisdiction of the Bankruptcy Court and in accordance with the applicable provisions of the Bankruptcy Code. ASC 852 applies to entities that have filed a petition for bankruptcy under Chapter 11 of the Bankruptcy Code. The guidance requires that transactions and events directly associated with the reorganization be distinguished from the ongoing operations of the business. In addition, the guidance provides for changes in the accounting and presentation of liabilities. Expenses and income directly associated with the Chapter 11 Cases are reported separately in the statements of consolidated income (loss) as reorganization items. Reorganization items also include adjustments to reflect the carrying value of liabilities subject to compromise (LSTC) at their estimated allowed claim amounts, as such adjustments are determined. See Notes 4 and 5 to the 2016 Annual Financial Statements.
As of the Effective Date, Vistra Energy applied fresh-start reporting under the applicable provisions of ASC 852. Fresh-start reporting includes (1) distinguishing the consolidated financial statements of the entity that was previously in restructuring from the consolidated financial statements of the entity that emerges from restructuring, (2) assigning the reorganized value of the successor entity by measuring all assets and liabilities of the successor entity at fair value, and (3) selecting accounting policies for the successor entity. The effects from emerging from bankruptcy, including the extinguishment of liabilities, as well as the fresh-start reporting adjustments are reported in the Predecessor’s statement of consolidated income (loss). The consolidated financial statements of Vistra Energy for periods subsequent to the Effective Date are not comparable to the financial statements of our Predecessor for periods prior to the Effective Date, as those previous periods do not give effect to any adjustments to the carrying values of assets or amounts of liabilities, nor any differences in accounting policies that were a consequence of the Plan or the related application of fresh-start reporting. See Note 3 to the 2016 Annual Financial Statements.
Derivative Instruments and Mark-to-Market Accounting
We enter into contracts for the purchase and sale of energy-related commodities, and also enter into other derivative instruments such as options, swaps, futures and forwards primarily to manage commodity price and interest rate risks. Under accounting standards related to derivative instruments and hedging activities, these instruments are subject to mark-to-market accounting, and the determination of market values for these instruments is based on numerous assumptions and estimation techniques.
Mark-to-market accounting recognizes changes in the fair value of derivative instruments in the financial statements as market prices change. Such changes in fair value are accounted for as unrealized mark-to-market gains and losses in net income with an offset to derivative assets and liabilities. The availability of quoted market prices in energy markets is dependent on the type of commodity (e.g., natural gas, electricity, etc.), time period specified and delivery point. In computing fair value for derivatives, each forward pricing curve is separated into liquid and illiquid periods. The liquid period varies by delivery point and commodity. Generally, the liquid period is supported by exchange markets, broker quotes and frequent trading activity. For illiquid periods, fair value is estimated based on forward price curves developed using modeling techniques that take into account available market information and other inputs that might not be readily observable in the market. We estimate fair value as described in Note 16 to the 2016 Annual Financial Statements.
65
Table of Contents
Accounting standards related to derivative instruments and hedging activities allow for normal purchase or sale elections and hedge accounting designations, which generally eliminate or defer the requirement for mark-to-market recognition in net income and thus reduce the volatility of net income that can result from fluctuations in fair values. Normal purchases and sales are contracts that provide for physical delivery of quantities expected to be used or sold over a reasonable period in the normal course of business and are not subject to mark-to-market accounting if the election as normal is made.
We report derivative assets and liabilities in the consolidated balance sheets without taking into consideration netting arrangements that we have with counterparties. Margin deposits that contractually offset these assets and liabilities are reported separately in our consolidated balance sheets.
See Note 17 to the 2016 Annual Financial Statements for further discussion regarding derivative instruments.
Accounting for Income Taxes
EFH Corp. files a United States federal income tax return that includes the results of EFCH, EFIH, Oncor Holdings and, prior to the Effective Date, TCEH. EFH Corp. is the corporate parent of the EFH Corp. consolidated group, while each of EFIH, Oncor Holdings, EFCH and, prior to the Effective Date, TCEH were classified as a disregarded entity for United States federal income tax purposes. Pursuant to applicable United States Treasury regulations and published guidance of the Internal Revenue Service (IRS), corporations that are members of a consolidated group have joint and several liability for the taxes of such group. Subsequent to the Effective Date, the T-Side Debtors (and the EFH Contributed Debtors) are no longer included in the EFH Corp. consolidated group and are included in a consolidated group of which Vistra Energy is the corporate parent.
Prior to the Effective Date, EFH Corp. and certain of its subsidiaries (including EFCH, EFIH, and TCEH, but not including Oncor Holdings and Oncor) were parties to a Federal and State Income Tax Allocation Agreement, which provided, among other things, that any corporate member or disregarded entity in the EFH Corp. group is required to make payments to EFH Corp. in an amount calculated to approximate the amount of tax liability such entity would have owed if it filed a separate corporate tax return. Pursuant to the Plan, the T-Side Debtors rejected this agreement on the Effective Date. See Notes 2 and 10 to the 2016 Annual Financial Statements for a discussion of the Tax Matters Agreement that was entered on the Effective Date between EFH Corp. and Vistra Energy. Additionally, since the date of the Amended and Restated Settlement Agreement among the Debtors, certain investment funds that own Texas Holdings (the Sponsor Group), and certain settling creditors of TCEH, approved by the Bankruptcy Court in December 2015 (the Settlement Agreement), no further cash payments among the Debtors were made in respect of federal income taxes. EFH Corp. has elected to continue to allocate federal income taxes among the entities that are parties to the Federal and State Income Tax Allocation Agreement. The Settlement Agreement did not alter the allocation and payment for state income taxes, which continued to be settled prior to the Effective Date.
Our income tax expense and related consolidated balance sheet amounts involve significant management estimates and judgments. Amounts of deferred income tax assets and liabilities, as well as current and noncurrent accruals, involve estimates and judgments of the timing and probability of recognition of income and deductions by taxing authorities. In assessing the likelihood of realization of deferred tax assets, management considers estimates of the amount and character of future taxable income. Actual income taxes could vary from estimated amounts due to the future impacts of various items, including changes in income tax laws, our forecasted financial condition and results of operations in future periods, as well as final review of filed tax returns by taxing authorities. Income tax returns are regularly subject to examination by applicable tax authorities. In management’s judgment, the liability recorded pursuant to income tax accounting guidance related to uncertain tax positions reflects future taxes that may be owed as a result of any examination. See Notes 1 and 9 to the 2016 Annual Financial Statements for discussion of income tax matters.
66
Table of Contents
Accounting for Tax Receivable Agreement
On the Effective Date, we entered into a tax receivable agreement (the Tax Receivable Agreement) with American Stock Transfer & Trust Company, LLC, as the transfer agent. Pursuant to the Tax Receivable Agreement, we issued beneficial interests in the rights to receive payments under the Tax Receivable Agreement (the TRA Rights) to the first lien creditors of our Predecessor to be held in escrow for the benefit of the first lien creditors of our Predecessor entitled to receive such TRA Rights under the Plan. As part of Emergence, Vistra Energy reflected the obligation associated with TRA Rights at fair value in the amount of $574 million related to these future payment obligations. This estimate of fair value is the discounted amount of estimated payments to be made each year under the Tax Receivable Agreement, based on certain assumptions, including but not limited to:
| • | the amount of tax basis step-up resulting from the PrefCo Preferred Stock Sale (which is estimated to be approximately $5.5 billion) and the allocation of such tax basis step-up among the assets subject thereto; |
| • | the depreciable lives of the assets subject to such tax basis step-up, which generally is expected to be 15 years for most of such assets; |
| • | a federal corporate income tax rate in all future years of 35%; |
| • | the Company generally expects to generate sufficient taxable income to be able to utilize the deductions arising out of (i) the tax basis step up attributable to the PrefCo Preferred Stock Sale, (ii) the entire tax basis of the assets acquired as a result of the Lamar and Forney Acquisition, and (iii) tax benefits related to imputed interest deemed to be paid by us as a result of payments under the Tax Receivable Agreement in the tax year in which such deductions arise; and |
| • | a discount rate of 15%, which represents our view of the rate that a market participant would use based on the risk associated with the uncertainty in the amount and timing of the cash flows. The aggregate amount of undiscounted payments under the Tax Receivable Agreement is estimated to be approximately $2.1 billion, with more than 90% of such amount expected to be attributable to the first 15 tax years following Emergence, and the final payment expected to be made approximately 40 years following Emergence (assuming the Tax Receivable Agreement is not terminated earlier pursuant to its terms). |
We expect to recognize accretion expense over the life of the TRA Rights liability as the present value of the initially established liability is accreted up over the life of the liability. This noncash accretion expense is reported in the statements of consolidated income (loss) as Impacts of Tax Receivable Agreement. Further, there may be significant changes, which may be material, to the estimate of the related liability due to various reasons including changes in corporate tax law, changes in estimates of future taxable income of Vistra Energy and its subsidiaries and other items. We expect that changes in those estimates will be recognized as adjustments to the related TRA Rights liability, with offsetting impacts recorded in the statements of consolidated income (loss) as Impacts of Tax Receivable Agreement.
Impairment of Goodwill and Other Long-Lived Assets
We evaluate long-lived assets (including intangible assets with finite lives) for impairment, in accordance with accounting standards related to impairment or disposal of long-lived assets, whenever events or changes in circumstances indicate that their carrying amount may not be recoverable. For our generation assets, possible indications include an expectation of continuing long-term declines in natural gas prices and/or market heat rates or an expectation that “more likely than not” a generation asset will be sold or otherwise disposed of significantly before the end of its estimated useful life. The determination of the existence of these and other indications of impairment involves judgments that are subjective in nature and may require the use of estimates in forecasting future results and cash flows related to an asset or group of assets. Further, the unique nature of our property, plant and equipment, which includes a fleet of generation assets with a diverse fuel mix and individual generation units that have varying production or output rates, requires the use of significant judgments in determining the
67
Table of Contents
existence of impairment indications and the grouping of assets for impairment testing. We generally utilize an income approach measurement to derive fair values for our long-lived generation assets. The income approach involves estimates of future performance that reflect assumptions regarding, among other things, forward natural gas and electricity prices, market heat rates, the effects of environmental rules, generation plant performance, forecasted capital expenditures and forecasted fuel prices. Any significant change to one or more of these factors can have a material impact on the fair value measurement of our long-lived assets. As a result of the decrease in forecasted wholesale electricity prices and changes to our Predecessor’s operating plans in 2015 and 2014, our Predecessor evaluated the recoverability of its generation assets and potential effects from environmental regulations. See Note 8 to the 2016 Annual Financial Statements for a discussion of the impairment charges related to certain of those assets. Additional material impairments related to these or other of our generation facilities may occur in the future if forward wholesale electricity prices in ERCOT continue to decline or if additional environmental regulations increase the cost of producing electricity at our generation facilities.
Goodwill and intangible assets with indefinite useful lives, such as the intangible asset related to the TXU Energy™ brand, are required to be tested for impairment at least annually (as of the Effective Date, we have selected October 1 as our annual test date) or whenever events or changes in circumstances indicate an impairment may exist, such as the indicators used to evaluate impairments to long-lived assets discussed above or declines in values of comparable public companies in our industry. Accounting guidance requires goodwill to be allocated to our reporting units, and at December 31, 2016 all goodwill was allocated to our Retail Electricity segment. Goodwill impairment testing is performed at the reporting unit level. Under this goodwill impairment analysis, if at the assessment date, a reporting unit’s carrying value exceeds its estimated fair value (enterprise value), the estimated enterprise value of the reporting unit is compared to the estimated fair values of the reporting unit’s assets (including identifiable intangible assets) and liabilities at the assessment date, and the resultant implied goodwill amount is then compared to the recorded goodwill amount. Any excess of the recorded goodwill amount over the implied goodwill amount is written off as an impairment charge.
The determination of enterprise value involves a number of assumptions and estimates. We use a combination of fair value measurements to estimate enterprise values of our reporting units, including: internal discounted cash flow analyses (income approach) and comparable publicly traded company values (market approach). The income approach involves estimates of future performance that reflect assumptions regarding, among other things, forward natural gas and electricity prices, market heat rates, the effects of environmental regulations, generation plant performance, forecasted capital expenditures and retail sales volume trends, as well as determination of a terminal value. Another key variable in the income approach is the discount rate, or weighted average cost of capital, applied to the forecasted cash flows. The determination of the discount rate takes into consideration the capital structure, credit ratings and current debt yields of comparable publicly traded companies as well as an estimate of return on equity that reflects historical market returns and current market volatility for the industry. The market approach involves using trading multiples of earnings (net income) before interest expense, income taxes, depreciation and amortization (EBITDA) of those selected publicly traded companies to derive appropriate multiples to apply to the EBITDA of our reporting units. Critical judgments include the selection of publicly traded comparable companies and the weighting of the value metrics in developing the best estimate of enterprise value.
See Note 7 to the 2016 Annual Financial Statements for additional discussion of our Predecessor’s goodwill impairment charges.
68
Table of Contents
Results of Operations
Vistra Energy Consolidated Financial Results — Period from October 3, 2016 through December 31, 2016
| Successor | ||||||||||||||||
| Period from October 3, 2016 through December 31, 2016 | ||||||||||||||||
| Wholesale Generation |
Retail Electricity |
Eliminations / Corporate and Other |
Vistra Energy Consolidated |
|||||||||||||
| Operating revenues |
$ | 450 | $ | 912 | $ | (171 | ) | $ | 1,191 | |||||||
| Fuel, purchased power costs and delivery fees |
(376 | ) | (515 | ) | 171 | (720 | ) | |||||||||
| Operating costs |
(205 | ) | (3 | ) | — | (208 | ) | |||||||||
| Depreciation and amortization |
(53 | ) | (153 | ) | (10 | ) | (216 | ) | ||||||||
| Selling, general and administrative expenses |
(71 | ) | (130 | ) | (7 | ) | (208 | ) | ||||||||
|
|
|
|
|
|
|
|
|
|||||||||
| Operating income (loss) |
(255 | ) | 111 | (17 | ) | (161 | ) | |||||||||
| Other income |
3 | 3 | 4 | 10 | ||||||||||||
| Interest expense and related charges |
1 | — | (61 | ) | (60 | ) | ||||||||||
| Impacts of Tax Receivables Agreement |
— | — | (22 | ) | (22 | ) | ||||||||||
|
|
|
|
|
|
|
|
|
|||||||||
| Income (loss) before income taxes |
(251 | ) | 114 | (96 | ) | (233 | ) | |||||||||
| Income tax benefit (expense) |
70 | 70 | ||||||||||||||
|
|
|
|
|
|||||||||||||
| Net income (loss) |
$ | (26 | ) | $ | (163 | ) | ||||||||||
|
|
|
|
|
|||||||||||||
Consolidated operating loss totaled $161 million for the period from October 3, 2016 through December 31, 2016. Results were driven by:
| • | Our Wholesale Generation segment had an operating loss of approximately $255 million for the period which was primarily driven by unrealized mark-to-market losses totaling approximately $273 million for the period (including $113 million of unrealized losses on positions with the Retail Electricity segment). The unrealized losses were driven by increases in forward natural gas prices during the period. Please see the discussion of Wholesale Generation below for further details. |
| • | Our Retail Electricity segment had operating income of $111 million for the period which was the result of favorable profit margins, including $113 million of unrealized gains in purchased power costs on positions with the Wholesale Generation segment. Please see the discussion of Retail Electricity below for further details. |
| • | Net operating expense related to Eliminations and Corporate and Other activities totaled $17 million and primarily reflected $4 million in amortization of intangible assets and $7 million in post-Emergence restructuring fees. |
Interest expense and related charges totaled $60 million and reflected $47 million of interest expense incurred on the Vistra Operations Credit Facilities and $11 million of unrealized mark-to-market net losses on interest rate swaps. See Note 11 to the 2016 Annual Financial Statements.
See Note 10 to the 2016 Annual Financial Statements for discussion of the impacts of the Tax Receivable Agreement Obligation.
Income tax expense totaled $70 million. The effective tax rate was 30.0%. See Note 9 to the 2016 Annual Financial Statements for reconciliation of this effective rate to the U.S. federal statutory rate.
Operating Income
We evaluate our segment performance using operating income as an earnings metric. We believe operating income is useful in evaluating our core business activities and is one of the metrics used by our chief operating decision maker and leadership to evaluate segment results. Operating income excludes interest income, interest expense and related charges, impacts of the Tax Receivable Agreement and income tax expense as these activities are managed at the corporate level.
69
Table of Contents
Operating Statistics — Period from October 3, 2016 through December 31, 2016
| Successor | ||||
| Period from October 3, 2016 through December 31, 2016 |
||||
| Sales volumes: |
||||
| Retail electricity sales volumes (GWh): |
||||
| Residential |
4,485 | |||
| Business markets |
4,430 | |||
|
|
|
|||
| Total retail electricity sales volumes |
8,915 | |||
| Wholesale electricity sales volumes (a)(b) |
13,806 | |||
| Production volumes (GWh): |
||||
| Nuclear facilities |
5,373 | |||
| Lignite and coal facilities |
13,654 | |||
| Natural gas facilities |
3,138 | |||
| Capacity factors: |
||||
| Nuclear facilities |
105.7 | % | ||
| Lignite and coal facilities |
77.1 | % | ||
| CCGT facilities |
47.0 | % | ||
| Market pricing: |
||||
| Average ERCOT North power price ($/MWh) |
$ | 26.52 | ||
| (a) | Upon settlement, physical derivative commodity contracts that we mark-to-market in net income, such as certain electricity sales and purchase agreements and coal purchase contracts, wholesale electricity revenues and fuel and purchased power costs are reported at approximated market prices, as required by accounting rules, rather than contract price. |
| (b) | Includes net amounts related to sales and purchases of balancing energy in the ERCOT real-time market. |
Wholesale Generation Segment Financial Results — Period from October 3, 2016 through December 31, 2016
Wholesale electricity revenues totaled $450 million and reflected:
| • | $274 million in third-party wholesale electricity revenues, which included $456 million in electricity sales to third parties, partially offset by $182 million in unrealized losses from hedging activities reflecting an increase in forward natural gas prices and a reversal of previously recorded unrealized gains on settled positions, and |
| • | $171 million in affiliated sales to the Retail Electricity segment, which included $284 million in sales for the period, partially offset by $113 million in unrealized losses on affiliate positions due to increases in forward commodity prices. |
| Successor | ||||
| Period from October 3, 2016 through December 31, 2016 |
||||
| Wholesale electricity sales |
$ | 456 | ||
| Unrealized net losses on hedging activities |
(182 | ) | ||
| Sales to affiliates |
284 | |||
| Unrealized net losses with affiliates |
(113 | ) | ||
| Other revenues |
5 | |||
|
|
|
|||
| Total wholesale electricity revenues |
$ | 450 | ||
|
|
|
|||
70
Table of Contents
Fuel, purchased power costs and delivery fees totaled $376 million and reflected $398 million in fuel and purchased power costs, ancillary and other costs, including $7 million of severance expense associated with the October 2016 workforce reduction. Results also included $22 million in unrealized gains from hedging activities reflecting gains on coal and diesel hedges due to increases in forward prices.
| Successor | ||||
| Period from October 3, 2016 through December 31, 2016 |
||||
| Fuel for nuclear facilities |
$ | 31 | ||
| Fuel for lignite and coal facilities |
229 | |||
| Fuel for natural gas facilities and purchased power costs |
97 | |||
| Unrealized gains from hedging activities |
(22 | ) | ||
| Ancillary and other costs |
41 | |||
|
|
|
|||
| Total fuel and purchased power costs |
$ | 376 | ||
|
|
|
|||
Operating costs totaled $205 million and reflected operations and maintenance expenses for power generation facilities and salaries and benefits for facilities personnel. Costs included $10 million of severance expense associated with the October 2016 workforce reduction.
Depreciation and amortization expenses totaled $53 million and reflected $51 million of depreciation on power generation and mining property, plant and equipment and $2 million of amortization expense related to finite-lived identifiable intangible assets. Depreciation and amortization expense for the period reflects fresh-start reporting adjustments to fair value of property, plant and equipment and identifiable intangible assets (see Note 3 to the 2016 Annual Financial Statements).
Selling, general and administrative expenses totaled $71 million and reflected $52 million of functional group service costs allocated from Corporate and Other activities, $8 million of severance expense associated with the October 2016 workforce reduction, $7 million of employee compensation and benefit costs and $4 million of legal and other professional services costs.
Retail Electricity Segment Financial Results — Period from October 3, 2016 through December 31, 2016
Retail electricity revenues totaled $912 million and included $907 million related to 8,915 GWh in sales volumes. Sales volumes for the period were evenly split between residential and business market customers. Revenues for the period included $36 million in amortization expense of identifiable intangible assets related to retail contracts (see Note 7 to the 2016 Annual Financial Statements).
Purchased power costs, delivery fees and other costs totaled $515 million and reflected the following:
| Successor | ||||
| Period from October 3, 2016 through December 31, 2016 |
||||
| Purchases from affiliates |
$ | 284 | ||
| Unrealized net gains with affiliates |
(113 | ) | ||
| Delivery fees |
320 | |||
| Other costs |
24 | |||
|
|
|
|||
| Purchased power costs and delivery fees |
$ | 515 | ||
|
|
|
|||
71
Table of Contents
Depreciation and amortization expenses totaled $153 million and primarily reflected amortization expense related to the retail customer relationship intangible asset (see Note 7 to the 2016 Annual Financial Statements).
Selling, general and administrative expenses totaled $130 million and reflected $33 million of functional group service costs allocated from Corporate and Other activities, $28 million of employee compensation and benefit costs, $23 million of marketing-related expenses, $22 million of revenue based taxes and $18 million of legal and professional services costs, franchise taxes and bad debt. Selling, general and administrative expenses for the Retail Electricity segment also included $5 million of severance expense associated with the October 2016 workforce reduction.
Predecessor — Net Income (Loss)
| Predecessor | ||||||||||||
| Period from January 1, 2016 through October 2, 2016 |
Year Ended December 31, |
|||||||||||
| 2015 | 2014 | |||||||||||
| Operating revenues |
$ | 3,973 | $ | 5,370 | $ | 5,978 | ||||||
| Fuel, purchased power costs and delivery fees |
(2,082 | ) | (2,692 | ) | (2,842 | ) | ||||||
| Net gain from commodity hedging and trading activities |
282 | 334 | 11 | |||||||||
| Operating costs |
(664 | ) | (834 | ) | (914 | ) | ||||||
| Depreciation and amortization |
(459 | ) | (852 | ) | (1,270 | ) | ||||||
| Selling, general and administrative expenses |
(482 | ) | (676 | ) | (708 | ) | ||||||
| Impairment of goodwill |
— | (2,200 | ) | (1,600 | ) | |||||||
| Impairment of long-lived assets |
— | (2,541 | ) | (4,670 | ) | |||||||
|
|
|
|
|
|
|
|||||||
| Operating income (loss) |
568 | (4,091 | ) | (6,015 | ) | |||||||
|
|
|
|
|
|
|
|||||||
| Other income |
16 | 17 | 16 | |||||||||
| Other deductions |
(75 | ) | (93 | ) | (281 | ) | ||||||
| Interest income |
3 | 1 | — | |||||||||
| Interest expense and related charges |
(1,049 | ) | (1,289 | ) | (1,749 | ) | ||||||
| Reorganization items |
22,121 | (101 | ) | (520 | ) | |||||||
|
|
|
|
|
|
|
|||||||
| Loss before income taxes |
21,584 | (5,556 | ) | (8,549 | ) | |||||||
| Income tax benefit (expense) |
1,267 | 879 | 2,320 | |||||||||
|
|
|
|
|
|
|
|||||||
| Net income (loss) |
$ | 22,851 | $ | (4,677 | ) | $ | (6,229 | ) | ||||
|
|
|
|
|
|
|
|||||||
72
Table of Contents
Predecessor — Operating Statistics
| Predecessor | % Change | |||||||||||||||
| Period from January 1, 2016 through October 2, 2016 |
Year Ended December 31, |
2015 versus 2014 |
||||||||||||||
| 2015 | 2014 | |||||||||||||||
| Operating revenues: |
||||||||||||||||
| Retail electricity revenues |
3,154 | 4,449 | 4,413 | 0.8 | % | |||||||||||
| Wholesale electricity revenues and other operating revenues (a)(b) |
819 | 921 | 1,565 | (41.2 | )% | |||||||||||
|
|
|
|
|
|
|
|||||||||||
| Total operating revenues |
$ | 3,973 | $ | 5,370 | $ | 5,978 | (10.2 | )% | ||||||||
|
|
|
|
|
|
|
|||||||||||
| Fuel, purchased power costs and delivery fees: |
||||||||||||||||
| Fuel for nuclear facilities |
$ | 92 | $ | 146 | $ | 147 | (0.7 | )% | ||||||||
| Fuel for lignite and coal facilities |
548 | 736 | 784 | (6.1 | )% | |||||||||||
| Fuel for natural gas facilities and purchased power costs (a) |
310 | 252 | 316 | (20.3 | )% | |||||||||||
| Other costs |
108 | 166 | 267 | (37.8 | )% | |||||||||||
| Delivery fees |
1,024 | 1,392 | 1,328 | 4.8 | % | |||||||||||
|
|
|
|
|
|
|
|||||||||||
| Total |
$ | 2,082 | $ | 2,692 | $ | 2,842 | (5.3 | )% | ||||||||
|
|
|
|
|
|
|
|||||||||||
| Sales volumes: |
||||||||||||||||
| Retail electricity sales volumes (GWh): |
||||||||||||||||
| Residential |
16,619 | 21,923 | 21,910 | 0.1 | % | |||||||||||
| Business markets |
14,354 | 19,289 | 16,601 | 16.2 | % | |||||||||||
|
|
|
|
|
|
|
|||||||||||
| Total retail electricity |
30,973 | 41,212 | 38,511 | 7.0 | % | |||||||||||
| Wholesale electricity sales volumes (b) |
25,563 | 23,533 | 32,965 | (28.6 | )% | |||||||||||
|
|
|
|
|
|
|
|||||||||||
| Total sales volumes |
56,536 | 64,745 | 71,476 | (9.4 | )% | |||||||||||
| Production volumes (GWh): |
||||||||||||||||
| Nuclear facilities |
15,005 | 19,954 | 18,636 | 7.1 | % | |||||||||||
| Lignite and coal facilities (c) |
31,865 | 41,817 | 48,878 | (14.4 | )% | |||||||||||
| Natural gas facilities |
8,539 | 709 | 816 | (13.1 | )% | |||||||||||
| Capacity factors: |
||||||||||||||||
| Nuclear facilities |
99.2 | % | 99.0 | % | 92.5 | % | 7.0 | % | ||||||||
| Lignite and coal facilities (c) |
60.5 | % | 59.5 | % | 69.6 | % | (14.5 | )% | ||||||||
| CCGT facilities |
65.2 | % | — | % | — | % | — | % | ||||||||
| Market pricing: |
— | % | ||||||||||||||
| Average ERCOT North power price ($/MWh) |
$ | 20.78 | $ | 23.78 | $ | 36.44 | (34.7 | )% | ||||||||
| (a) | Upon settlement, physical derivative commodity contracts that we mark-to-market in net income, such as certain electricity sales and purchase agreements and coal purchase contracts, wholesale electricity revenues and fuel and purchased power costs are reported at approximated market prices, as required by accounting rules, rather than contract price. The offsetting differences between contract and market prices are reported in net gain from commodity hedging and trading activities. |
| (b) | Includes net amounts related to sales and purchases of balancing energy in the ERCOT real-time market. |
| (c) | Includes the estimated effects of economic backdown (including seasonal operations) of lignite/coal fueled units totaling 14,420 GWh, 19,900 GWh and 15,770 GWh for the Predecessor period from January 1, 2016 through October 2, 2016 and the years ended December 31, 2015 and 2014, respectively. |
73
Table of Contents
Predecessor Financial Results — Predecessor Period from January 1, 2016 through October 2, 2016
Income before income taxes totaled $21.584 billion and included a $24.252 billion gain on reorganization adjustments and a $2.013 billion loss for the net impacts from the adoption of fresh-start reporting (see Notes 3 and 4 to the 2016 Annual Financial Statements). Results also reflected the effect of declining average electricity prices on operating revenues, $977 million in adequate protection interest expense paid/accrued on pre-petition debt and $116 million in reorganization items associated with the Chapter 11 Cases.
Operating revenues totaled $3.973 billion. Retail electricity revenues totaling $3.154 billion were negatively impacted by declining average prices and reduced electricity usage reflecting milder than normal weather in 2016. Wholesale revenues totaling $649 million were positively impacted by increases in generation volumes (approximately 8,048 GWh) driven by the Lamar and Forney Acquisition in April 2016 (see Note 6 to the 2016 Annual Financial Statements), partially offset by lower average wholesale electricity prices.
Following is an analysis of amounts reported as net gain from commodity hedging and trading activities. Results are primarily related to natural gas and power hedging activity.
| Predecessor | ||||
| Period From January 1, 2016 through October 2, 2016 |
||||
| Realized net gains |
$ | 320 | ||
| Unrealized net gains (losses) |
(38 | ) | ||
|
|
|
|||
| Total |
$ | 282 | ||
|
|
|
|||
The negative impacts of declining average prices on operating revenues were partially offset by realized net gains reflecting settled gains on derivatives due to declining market prices. These gains were primarily related to natural gas positions.
Net unrealized gains (losses) were primarily impacted by reversals of previously recorded unrealized net gains on settled positions.
Fuel, purchased power costs and delivery fees totaled $2.082 billion and reflected the impact of declining electricity prices on purchased power costs, partially offset by incremental natural gas fuel costs associated with the Lamar and Forney Acquisition (see Note 6 to the 2016 Annual Financial Statements).
Operating costs totaled $664 million and primarily reflect maintenance expense for our generation assets, including nuclear maintenance costs due to a spring nuclear refueling outage and incremental operation and maintenance costs associated with the Lamar and Forney Acquisition.
Depreciation and amortization expenses totaled $459 million and reflected the effect of noncash impairments of certain long-lived assets recorded in 2015, partially offset by incremental depreciation expense associated with the Lamar and Forney Acquisition.
Selling, general and administrative expenses totaled $482 million and reflected administrative and general salaries, employee benefits, marketing costs related to retail electricity activity and other administrative costs.
Results for the period also include $32 million of severance expense, primarily reported in fuel, purchased power and delivery fees and operating costs, associated with certain actions taken to reduce costs related to mining and lignite/coal generation operations.
74
Table of Contents
Interest expense and related charges totaled $1.049 billion and reflected $977 million in adequate protection payments approved by the Bankruptcy Court for the benefit of TCEH secured creditors and $76 million in interest expense on debtor-in-possession financing.
Income tax benefit totaled $1.267 billion. See Note 9 to the 2016 Annual Financial Statements for reconciliation of this effective rate to the U.S. federal statutory rate.
Predecessor Financial Results — Year Ended December 31, 2015 Compared to Year Ended December 31, 2014
Loss before income taxes decreased $2.993 billion in 2015 from 2014 to a loss of $5.556 billion. The decrease primarily reflected the larger noncash impairment charges of certain long-lived assets in 2014 and the decrease in interest expense, the decrease in depreciation and amortization expense and a decrease in reorganization items expense in 2015.
Operating revenues decreased $608 million in 2015 from 2014, as a result of a decrease in wholesale electricity revenues, partially offset by an increase in retail electricity revenues. Wholesale electricity revenues decreased $587 million in 2015 from 2014 reflecting a $362 million decrease in sales volumes and a $225 million decrease due to lower average wholesale electricity prices. The decrease in wholesale electricity sales volumes was driven by lower generation volumes from increased economic backdown (including seasonal operations) at our lignite and coal generation facilities, which was driven by a 35% decline in average wholesale electricity prices, driven by lower natural gas prices. Retail electricity revenues increased $36 million in 2015 from 2014 primarily reflecting a $310 million increase due to sales volumes driven by an increase in business sales volumes, partially offset by a $274 million decrease due to lower average prices primarily for business markets customers.
Fuel, purchased power costs and delivery fees decreased $150 million in 2015 from 2014. Fuel for lignite and coal facilities decreased $48 million in 2015 from 2014 due to a 14% decrease in generation volumes, partially offset by higher lignite mining costs and more western coal in the fuel blend. Fuel for natural gas facilities and purchased power costs decreased $64 million in 2015 from 2014 driven by a 28% decrease in purchased power volumes, lower natural gas prices and a 13% decrease in generation volumes from natural gas generation units. Other costs decreased $101 million in 2015 from 2014, reflecting a $49 million decrease in natural gas purchases for resale and $34 million decrease in amortization of favorable purchase contracts due to impairments recorded at the end of 2014. Delivery fees increased $64 million in 2015 from 2014, primarily reflecting higher retail volumes.
Following is an analysis of amounts reported as net gain from commodity hedging and trading activities. The results are primarily related to natural gas and power hedging activity.
| Year Ended December 31, | ||||||||||||
| 2015 | 2014 | Change | ||||||||||
| (in millions) | ||||||||||||
| Realized net gains |
$ | 217 | $ | 387 | $ | (170 | ) | |||||
| Unrealized net gains (losses) |
117 | (376 | ) | 493 | ||||||||
|
|
|
|
|
|
|
|||||||
| Total |
$ | 334 | $ | 11 | $ | 323 | ||||||
|
|
|
|
|
|
|
|||||||
Realized net gains on hedging and trading positions decreased $170 million, or 43.9%, in 2015 from 2014, reflecting lower gains due to the 2014 termination of our favorable long-term natural gas hedging program, partially offset by other realized gains from declining market prices in 2015.
75
Table of Contents
The $493 million favorable change in unrealized net gains in 2015 from 2014 primarily reflected the 2014 reversal of previously recorded unrealized gains related to the favorable pricing of our long-term natural gas hedging program that terminated in 2014 along with favorable unrealized gains in 2015 due to the impact of declining natural gas prices on our hedging positions.
Operating costs decreased $80 million in 2015 from 2014, driven by $55 million in lower nuclear maintenance costs, reflecting a spring refueling in 2014 that was absent in 2015, as well as lower lignite and coal facilities operating costs reflecting lower generation.
Depreciation and amortization expenses decreased $418 million in 2015 from 2014, primarily reflecting reduced depreciation expense resulting from the effect of noncash impairments of certain long-lived assets recorded at the end of 2014 and during 2015.
Interest expense and related charges decreased $460 million in 2015 from 2014. The decrease reflected:
| • | $874 million in lower interest expense on pre-petition debt due to the discontinuance of interest due to the Chapter 11 Cases, and |
| • | $86 million in lower amortization of pre-petition debt issuances, amendment and extension costs and discounts due to reclassification of such amounts to liabilities subject to compromise in 2014, |
partially offset by
| • | $405 million in higher expense related to adequate protection payments approved by the Bankruptcy Court for the benefit of TCEH secured creditors in the year ended December 31, 2015 as compared to the post-petition period ended December 31, 2014; |
| • | $65 million in mark-to-market net gains on interest rate swaps in 2014, and |
| • | $26 million in higher interest expense on debtor-in-possession financing in the year ended December 31, 2015 as compared to the post-petition period ended December 31, 2014. |
Income tax benefit totaled $879 million and $2.320 billion on pretax losses in 2015 and 2014, respectively. The effective tax rate was 15.8% and 27.1% in 2015 and 2014, respectively. Income tax benefit in 2015 differed from the U.S. federal statutory rate of 35% largely due to nondeductible goodwill impairment charges of $2.2 billion and a valuation allowance of $210 million. Income tax benefit in 2014 differed from the U.S. federal statutory rate primarily due to nondeductible goodwill impairment charges of $1.6 billion and IRS audit and appeals settlements of $53 million. See Note 9 to the 2016 Annual Financial Statements.
See Note 7 to the 2016 Annual Financial Statements for details of noncash impairments of goodwill. See Note 22 to the 2016 Annual Financial Statements for details of other income and deductions. See Note 8 to the 2016 Annual Financial Statements for details of noncash impairments of certain long lived assets. See Note 4 to the 2016 Annual Financial Statements for details of reorganization items.
76
Table of Contents
Energy-Related Commodity Contracts and Mark-to-Market Activities
The table below summarizes the changes in commodity contract assets and liabilities for the periods presented. The net change in these assets and liabilities, excluding “other activity” as described below, reflects $166 million in unrealized net losses, $38 million in unrealized net losses, $117 million in unrealized net gains and $368 million in unrealized net losses for the Successor period from October 3, 2016 through December 31, 2016, the Predecessor period from January 1, 2016 through October 2, 2016 and the years ended December 31, 2015 and 2014, respectively, arising from mark-to-market accounting for positions in the commodity contract portfolio.
| Successor | Predecessor | |||||||||||||||
| Period from October 3, 2016 through December 31, 2016 |
Period from January 1, 2016 through October 2, 2016 |
Year Ended December 31, | ||||||||||||||
| 2015 | 2014 | |||||||||||||||
| Commodity contract net asset at beginning of period |
$ | 181 | $ | 271 | $ | 180 | $ | 525 | ||||||||
| Settlements/termination of positions (a) |
(95 | ) | (232 | ) | (263 | ) | (385 | ) | ||||||||
| Changes in fair value of positions in the portfolio (b) |
(71 | ) | 194 | 380 | 17 | |||||||||||
| Other activity (c) |
49 | (35 | ) | (26 | ) | 23 | ||||||||||
|
|
|
|
|
|
|
|
|
|||||||||
| Commodity contract net asset at end of period |
$ | 64 | $ | 198 | $ | 271 | $ | 180 | ||||||||
|
|
|
|
|
|
|
|
|
|||||||||
| (a) | Represents reversals of previously recognized unrealized gains and losses upon settlement/termination (offsets realized gains and losses recognized in the settlement period). Includes reversal of $90 million in previously recorded unrealized gains related to Vista Energy beginning balances. Excludes changes in fair value in the month the position settled as well as amounts related to positions entered into and settled in the same month. |
| (b) | Represents unrealized net gains (losses) recognized, reflecting the effect of changes in fair value. Excludes changes in fair value in the month the position settled as well as amounts related to positions entered into and settled in the same month. |
| (c) | These amounts do not represent unrealized gains or losses. Includes initial values of positions involving the receipt or payment of cash or other consideration, generally related to options purchased/sold. The Predecessor period from January 1, 2016 through October 2, 2016 includes fair value of acquired commodity contracts as of the date of the Lamar and Forney Acquisition. |
Maturity Table — The following presents the commodity contract net asset arising from recognition of fair values at December 31, 2016, scheduled by the source of fair value and contractual settlement dates of the underlying positions.
| Successor | ||||||||||||||||||||
| Maturity dates of unrealized commodity contract net asset at December, 2016 |
||||||||||||||||||||
| Source of fair value |
Less than 1 year |
1-3 years |
4-5 years |
Excess of 5 years |
Total | |||||||||||||||
| Prices actively quoted |
$ | (134 | ) | $ | 1 | $ | (2 | ) | $ | — | $ | (135 | ) | |||||||
| Prices provided by other external sources |
108 | 8 | — | — | 116 | |||||||||||||||
| Prices based on models |
48 | 35 | — | — | 83 | |||||||||||||||
|
|
|
|
|
|
|
|
|
|
|
|||||||||||
| Total |
$ | 22 | $ | 44 | $ | (2 | ) | $ | — | $ | 64 | |||||||||
|
|
|
|
|
|
|
|
|
|
|
|||||||||||
77
Table of Contents
Liquidity and Capital Resources
Operating Cash Flows
Successor Period from October 3, 2016 through December 31, 2016 — Cash provided by operating activities totaled $81 million and was primarily driven by cash earnings from our business of approximately $251 million after taking into consideration depreciation and amortization and unrealized mark-to-market losses on derivatives, offset by a net use of cash of approximately $170 million in working capital primarily driven by cash utilized in margin postings related to derivative contracts.
Predecessor Period from January 1, 2016 through October 2, 2016 — Cash used in operating activities totaled $238 million and was primarily driven by cash used by for margin deposit postings and other working capital utilization.
Predecessor Year Ended December 31, 2015 Compared to Year Ended December 31, 2014. Cash provided by operating activities totaled $237 million in 2015 compared to cash provided by operating activities of $444 million in 2014. The decrease of $207 million was driven by higher cash used to pay for reorganization costs and higher cash interest payments.
Financing Cash Flows
Successor Period from October 3, 2016 through December 31, 2016 — Cash provided by financing activities totaled $6 million and related to the net impacts of the Incremental Term Loan B borrowings and the 2016 Special Dividend paid to shareholders.
Predecessor Period from January 1, 2016 through October 2, 2016 — Cash provided by financing activities totaled $1.059 billion and primarily reflected $2.040 billion in net borrowings under the DIP Roll Facilities and the DIP Facility, including $870 million in net borrowings to fund the Lamar and Forney Acquisition (see Note 6 to the 2016 Annual Financial Statements), and $69 million from the issuance of preferred stock, partially offset by $915 million in payments to extinguish claims under the Plan and $112 million in fees related to the issuance of the DIP Roll Facilities.
Predecessor Year Ended December 31, 2015 Compared to Year Ended December 31, 2014. Cash used in financing activities totaled $30 million in 2015 compared to cash provided by financing activities of $1.111 billion in 2014. Activity in 2015 reflected the repayments of certain debt principal and fees. Activity in 2014 reflected $1.425 billion in borrowings from the TCEH DIP Facility, partially offset by $223 million in principal payments for pollution control revenue bonds and $92 million in fees associated with establishment of the TCEH DIP Facility.
See Note 13 to the 2016 Annual Financial Statements for further details of the TCEH DIP Facility and pre-Petition debt.
Investing Cash Flows
Successor Period from October 3, 2016 through December 31, 2016 — Cash used in investing activities totaled $45 million and was primarily driven by capital expenditures of $48 million and purchases of nuclear fuel of $41 million, partially offset by a reduction in restricted cash balances of $48 million.
Capital expenditures, including nuclear fuel, in the period from October 3, 2016 through December 31, 2016 totaled $89 million and consisted of:
| • | $18 million primarily for our generation operations; |
| • | $22 million for environmental expenditures related to generation units; |
| • | $41 million for nuclear fuel purchases; and |
| • | $8 million for information technology and other corporate investments. |
78
Table of Contents
Predecessor Period from January 1, 2016 through October 2, 2016 — Cash used in investing activities totaled $1.420 billion. Cash used reflected payments of $1.343 billion related to the Lamar and Forney Acquisition net of cash acquired (see Note 6 to the 2016 Annual Financial Statements) and capital expenditures (including nuclear fuel purchases) totaling $263 million, partially offset by a $233 million decrease in restricted cash used to backstop letters of credit.
Capital expenditures, including nuclear fuel, in the period from January 1, 2016 through October 2, 2016 totaled $263 million and consisted of:
| • | $171 million primarily for our generation operations; |
| • | $40 million for environmental expenditures related to generation units; |
| • | $33 million for nuclear fuel purchases; and |
| • | $19 million for information technology and other corporate investments. |
Predecessor Year Ended December 31, 2015 Compared to Year Ended December 31, 2014. Cash used in investing activities totaled $650 million and $458 million in 2015 and 2014, respectively. Cash used in 2015 reflected capital expenditures (including nuclear fuel purchases) totaling $460 million and a $123 million increase in restricted cash largely for supporting letters of credit issued under the TCEH DIP Facility. Cash used in 2014 reflected capital expenditures (including nuclear fuel purchases) totaling $413 million and a $350 million increase in restricted cash supporting letters of credit issued under the TCEH DIP Facility, partially offset by $392 million in restricted cash released from an escrow account when certain letters of credit were drawn.
Capital expenditures, including nuclear fuel, in 2015 totaled $460 million and consisted of:
| • | $230 million, primarily for our generation operations; |
| • | $82 million for environmental expenditures related to generation units; |
| • | $123 million for nuclear fuel purchases, and |
| • | $25 million for information technology and other corporate investments. |
Debt Activity
In August 2016, our Predecessor entered into a $4.25 billion senior secured super-priority TCEH DIP Roll Facility consisting of (1) the TCEH DIP Roll Revolving Credit Facility with borrowing capacity of $750 million, none of which was outstanding as of the Effective Date, (2) the TCEH DIP Roll Term Loan Letter of Credit Facility with borrowing capacity of $650 million, which was fully funded as of the Effective Date and (3) the TCEH DIP Roll Term Loan Facility with a borrowing capacity of $2.85 billion, which was fully funded as of the Effective Date. The maturity date of the TCEH DIP Roll Facilities was the earlier of (a) October 31, 2017 or (b) the Effective Date. Net proceeds from the TCEH DIP Roll Facilities totaled $3.465 billion and were used to repay $2.65 billion outstanding under the TCEH DIP Facility, fund a $650 million collateral account used to backstop the issuances of letters of credit and pay $107 million of issuance costs. The remaining balance was used for general business purposes.
On the Effective Date, the TCEH DIP Roll Facilities were converted into the Vistra Operations Credit Facilities of Vistra Operations Company LLC. As of the Effective Date, the Vistra Operations Credit Facilities consisted of (i) a senior secured first lien revolving credit facility in an aggregate principal amount of $750 million, with a 5-year maturity, including both a letter of credit sub-facility and a swingline loan facility, which we refer to as the Initial Revolving Credit Facility, (ii) a senior secured term loan B facility in an aggregate principal amount of $2.85 billion, with a 7-year maturity, which we refer to as the Initial Term Loan B Facility, and (iii) a senior secured term loan C facility in an aggregate principal amount of $650 million, with a 7-year
79
Table of Contents
maturity, which we refer to as the Term Loan C Facility. On December 14, 2016, Vistra Operations obtained (i) $1 billion aggregate principal amount of incremental term loans, which we refer to as the 2016 Incremental Term Loans, and together with the Initial Term Loan B Facility, the Term Loan B Facility, and (ii) $110 million of incremental revolving credit commitments, which we refer to as the 2016 Incremental Revolving Credit Commitments, and together with the Initial Revolving Credit Facility, the Revolving Credit Facility. In addition, Vistra Operations increased the aggregate amount of letters of credit available under the Revolving Credit Facility from $500 million to $600 million. We refer to the Term Loan B Facility and the Term Loan C Facility as the Term Loan Facilities and to the Revolving Credit Facility and the Term Loan Facilities as the Vistra Operations Credit Facilities.
As of December 31, 2016, $0, $3.85 billion and $650 million of loans were outstanding under the Revolving Credit Facility, the Term Loan B Facility and the Term Loan C Facility, respectively. Additionally, the size of the Revolving Credit Facility, the Term Loan B Facility and the Term Loan C Facility can each be increased, subject to a limit set forth in the credit agreement, pursuant to an uncommitted incremental facility.
In February 2017, Vistra Operations entered into an amendment to the credit agreement to reduce the interest rates on the Initial Term Loan B Facility, Term Loan C Facility and Revolving Credit Facility. As of February 6, 2017 borrowings under the Revolving Credit Facility bear interest at a rate equal to, at our option, either a LIBOR plus an applicable margin of 2.75% or a base rate plus an applicable margin of 1.75%, and borrowings under the Initial Term Loan B Facility and the Term Loan C Facility bear interest at a rate equal to, at our option, either a LIBOR (subject to a LIBOR floor of .75%) plus an applicable margin of 2.75% or a base rate plus an applicable margin of 1.75%. The 2016 Incremental Term Loans bear interest at a rate equal to, at our option, either a LIBOR (subject to a LIBOR floor of .75%) plus an applicable margin of 3.25% or a base rate plus an applicable margin of 2.25%.
In December 2016, Vistra Operations executed $3 billion aggregate notional amount of pay fixed, receive floating interest rate swaps to hedge a portion of its LIBOR interest rate exposure on its outstanding term loans.
We are required to make scheduled quarterly payments on the Term Loan B Facility in annual amounts equal to 1.0% of the original principal amount of the Term Loan B Facility for six years and three quarters, with the balance paid at maturity.
In addition, we are required to prepay outstanding loans under the Term Loan Facilities, subject to certain exceptions, with:
| • | 100% of the net cash proceeds of any issuance or incurrence of debt, other than proceeds from debt permitted under the Vistra Operations Credit Facilities; and |
| • | 100% of the net cash proceeds of all non-ordinary course asset sales, other dispositions of property or certain casualty events, in each case subject to certain exceptions and provided that we may reinvest those proceeds in assets to be used in its business or in certain other permitted investments. |
We may make voluntary prepayments of outstanding loans under the Term Loan B Facilities and the Revolving Credit Facility and voluntary reductions of the unutilized portion of the commitments under the Revolving Credit Facility without penalty, subject to customary “breakage” costs with respect to LIBOR loans.
Term loans under the Term Loan B Facility and the Term Loan C Facility are prepayable at any time without premium or penalty; provided that there will be a 1.00% prepayment premium in connection with any repricing of such term loans that reduces the interest rate prior to (i) August 6, 2017, with respect to any term loans under the Initial Term Loan B Facility or Term Loan C Facility or (ii) June 14, 2017, with respect to any 2016 Incremental Term Loans.
80
Table of Contents
The Revolving Credit Facility requires that we, subject to a testing threshold, comply on a quarterly basis with a maximum consolidated first lien net leverage ratio (calculated under the credit agreement as total first lien debt divided by Consolidated EBITDA (as defined in the credit agreement)) of 4.25 to 1.00. The testing threshold will be satisfied at any time at which the sum of outstanding revolving credit facility loans and revolving letters of credit (excluding up to $100 million of undrawn revolving letters of credit and cash collateralized or backstopped letters of credit) exceeds 30% of the outstanding commitments under the Revolving Credit Facility at such time.
The Vistra Operations Credit Facilities contain restrictive covenants that limit Vistra Operations’ ability and the ability of its restricted subsidiaries to, among other things, (i) incur additional indebtedness or issue certain preferred shares, (ii) make certain investments, loans, and advances (including acquisitions), (iii) consolidate, merge, sell or otherwise dispose of all or any part of its assets, (iv) pay dividends or make distributions or other restricted payments, (v) create liens on certain assets, (vi) sell assets, (vii) enter into certain transactions with affiliates, (viii) enter into sale-leaseback transactions, (ix) restrict dividends from our subsidiaries or restrict liens and (x) modify the terms of certain debt agreements. Each of these covenants is subject to customary or agreed-upon exceptions, baskets and thresholds.
The Vistra Operations Credit Facilities also contain certain other customary affirmative covenants, including requirements to provide financial and other information to agents, to not change our lines of business and events of default, including events of default resulting from non-payment of any principal, interest or fees, material breaches of representations and warranties, failure to comply with the consolidated first lien net leverage rates covenant with respect to the Revolving Credit Facility, defaults under other agreements and instruments and the entry of a final judgment exceeding $300 million against Vistra Operations and its restricted subsidiaries, each subject to customary or agreed-upon exceptions, baskets and thresholds (including equity cure provisions).
We believe that we are in compliance with all of our restrictive and affirmative covenants.
Available Liquidity
The following table summarizes changes in available liquidity for the years ended December 31, 2016 and 2015:
| Successor | Predecessor | |||||||||||
| December 31, 2016 |
October 2, 2016 |
December 31, 2015 |
||||||||||
| Cash and cash equivalents (a) |
$ | 843 | $ | 1,829 | $ | 1,400 | ||||||
| Vistra Operations Credit Facilities — Revolving Credit Facility |
860 | — | — | |||||||||
| Vistra Operations Credit Facilities — Term Loan C Facility (b) |
131 | — | — | |||||||||
| DIP Roll Revolving Credit Facility |
— | 750 | — | |||||||||
| DIP Revolving Credit Facility |
— | — | 1,950 | |||||||||
|
|
|
|
|
|
|
|||||||
| Total liquidity |
$ | 1,834 | $ | 2,579 | $ | 3,350 | ||||||
|
|
|
|
|
|
|
|||||||
| (a) | Cash and cash equivalents at December 31, 2016, October 3, 2016 and December 31, 2015 exclude $650 million, $650 million and $1.026 billion, respectively, of restricted cash held for letter of credit support (see Note 22 to the 2016 Annual Financial Statements). |
| (b) | The Term Loan C Facility is used for issuing letters of credit for general corporate purposes. Borrowings totaling $650 million under this facility were funded to collateral accounts that are reported as restricted cash in the consolidated balance sheet. At December 31, 2016, the restricted cash supported $519 million in letters of credit outstanding, leaving $131 million in available letter of credit capacity (see Note 13 to the 2016 Annual Financial Statements). |
Available liquidity totaled $1.834 billion at December 31, 2016 and reflects cash on hand, the undrawn balance of the Revolving Credit Facility, along with $110 million of incremental revolving credit commitments under the Vistra Operations Credit Facilities entered into during December 2016.
81
Table of Contents
The decrease in available liquidity of $771 million in the Predecessor period from January 1, 2016 through October 3, 2016 was primarily driven by $2.040 billion in net borrowings under the TCEH DIP Roll Facilities and the TCEH DIP Facility, including $870 million in net borrowings to fund the Lamar and Forney Acquisition, $1.064 billion in cash interest payments (including adequate protection payments), $263 million in capital expenditures (including nuclear fuel purchases) and $104 million of cash used to pay for reorganization expenses.
Based upon our current internal financial forecasts, we believe that we will have sufficient amounts available under the Vistra Operations Credit Facilities, plus cash generated from operations, to fund our anticipated cash requirements through at least the next 12 months.
Capital Expenditures
Estimated capital expenditures and nuclear fuel purchases for 2017 are expected to total approximately $307 million and include:
| • | $192 million for investments in generation and mining facilities, including approximately: |
| • | $161 million primarily for our generation operations and |
| • | $31 million for environmental expenditures; |
| • | $65 million for nuclear fuel purchases; and |
| • | $50 million for information technology and other corporate investments. |
Pension and OPEB Plan Funding
See Note 18 to the 2016 Annual Financial Statements.
Liquidity Effects of Commodity Hedging and Trading Activities
We have entered into commodity hedging and trading transactions that require us to post collateral if the forward price of the underlying commodity moves such that the hedging or trading instrument we hold has declined in value. We use cash, letters of credit and other forms of credit support to satisfy such collateral posting obligations. See “— Debt Activity” above for discussion of the Vistra Operations Credit Facilities.
Exchange cleared transactions typically require initial margin (i.e., the upfront cash and/or letter of credit posted to take into account the size and maturity of the positions and credit quality) in addition to variation margin (i.e., the daily cash margin posted to take into account changes in the value of the underlying commodity). The amount of initial margin required is generally defined by exchange rules. Clearing agents, however, typically have the right to request additional initial margin based on various factors, including market depth, volatility and credit quality, which may be in the form of cash, letters of credit, a guaranty or other forms as negotiated with the clearing agent. Cash collateral received from counterparties is either used for working capital and other business purposes, including reducing borrowings under credit facilities, or is required to be deposited in a separate account and restricted from being used for working capital and other corporate purposes. With respect to over-the-counter transactions, counterparties generally have the right to substitute letters of credit for such cash collateral. In such event, the cash collateral previously posted would be returned to such counterparties, which would reduce liquidity in the event the cash was not restricted.
At December 31, 2016, we received or posted cash and letters of credit for commodity hedging and trading activities as follows:
| • | $213 million in cash has been posted with counterparties as compared to $6 million posted at December 31, 2015; |
| • | $41 million in cash has been received from counterparties as compared to $152 million received at December 31, 2015; |
82
Table of Contents
| • | $363 million in letters of credit have been posted with counterparties as compared to $230 million posted at December 31, 2015; and |
| • | $10 million in letters of credit have been received from counterparties as compared to $3 million received at December 31, 2015. |
Income Tax Matters
See “— Application of Critical Accounting Policies — Accounting for Income Taxes” above.
EFH Corp files a U.S. federal income tax return that, prior to the Effective Date, included the results of our Predecessor, which was classified as a disregarded entity for U.S. federal income tax purposes. Subsequent to the Effective Date, the TCEH Debtors and the EFH Shared Services Debtors are no longer included in the EFH Corp. consolidated group and will be included in a consolidated group of which Vistra Energy is the corporate parent. Prior to the Effective Date, EFH Corp. and certain of its subsidiaries (including EFCH and TCEH) were parties to a Federal and State Income Tax Allocation Agreement, which provided, among other things, that any corporate member or disregarded entity in the EFH Corp. group was required to make payments to EFH Corp. in an amount calculated to approximate the amount of tax liability such entity would have owed if it filed a separate corporate tax return. Pursuant to the Plan, the TCEH Debtors and the EFH Shared Services Debtors rejected this agreement on the Effective Date. Additionally, since the date of the Settlement Agreement, no further cash payments among the Debtors were made in respect of federal income taxes. EFH Corp. has elected to continue to allocate federal income taxes among the entities that are parties to the Federal and State Income Tax Allocation Agreement. The Settlement Agreement did not alter the allocation and payment for state income taxes, which continued to be settled prior to the Effective Date. See Notes 2 and 9 to the 2016 Annual Financial Statements for further discussion of Income Tax Matters.
The TCEH Debtors and the EFH Shared Services Debtors emerged from the Chapter 11 Cases on the Effective Date in a tax-free spin-off from EFH Corp that was part of a series of transactions that included a taxable component, which generated a taxable gain for EFH Corp. that will be offset with available net operating losses (NOLs) of EFH Corp., substantially reducing the NOLs available to EFH Corp. in the future. As a result of the use of the NOLs, the taxable portion of the transaction resulted in no regular tax liability due and approximately $14 million of alternative minimum tax, payable to the IRS by EFH Corp. Vistra Energy has an obligation to reimburse EFH Corp. 50% of the alternative minimum tax, approximately $7 million, generated from this transaction pursuant to the Tax Matters Agreement.
We believe that neither Vistra Energy nor any corporate subsidiary of Vistra Energy is a U.S. real property holding corporation (USRPHC) or has been a USRPHC during the applicable period specified. We do not anticipate that either Vistra Energy or any corporate subsidiary of Vistra Energy will become a USRPHC in the foreseeable future. Generally, a corporation is a USRPHC only if the fair market value of its U.S. real property interests equals or exceeds 50% of the sum of the fair market value of its worldwide real property interests plus its other assets used or held for use in a trade or business. There can be no assurance regarding the USRPHC status of Vistra Energy or the corporate subsidiaries of Vistra Energy for the current year or future years, however, because USRPHC status is based on the composition of our assets at the time and on certain rules whose application is uncertain.
Income Tax Payments — In the next twelve months, income tax payments related to Texas margin tax are expected to total approximately $19 million, and $7 million in payment of federal income taxes is expected. We received an income tax refund totaling $2 million in the Successor period from October 3, 2016 through December 31, 2016, and made income tax payments totaling $22 million, $29 million and $31 million in the Predecessor period from January 1, 2016 through October 2, 2016 and the years ended December 31, 2015 and 2014, respectively.
83
Table of Contents
Capitalization
At December 31, 2016, our capitalization ratios consisted of 41% debt comprised of borrowings under the Vistra Operations Credit Facilities and other long-term debt (less amounts due currently) and 59% stockholders’ equity.
Financial Covenants
The agreement governing the Vistra Operation Credit Facilities includes a covenant, solely with respect to the Revolving Credit Facility and solely during a compliance period (which, in general, is applicable when the aggregate revolving borrowings and issued revolving letters of credit (in excess of $100 million) exceed 30% of the revolving commitments), that requires the consolidated first lien net leverage ratio (calculated under the credit agreement as total first lien debt divided by Consolidated EBITDA (as defined in the credit agreement)) not exceed 4.25 to 1.00. Although we had no borrowings under the Revolving Credit Facility as of December 31, 2016, we would have been in compliance with this financial covenant if it was required to be tested at such date.
See “Description of Indebtedness” and Note 13 to the 2016 Annual Financial Statements for discussion of other covenants related to the Vistra Operations Credit Facilities.
Collateral Support Obligations
The Railroad Commission of Texas (RCT) has rules in place to assure that parties can meet their mining reclamation obligations. In September 2016, the RCT agreed to a collateral bond of up to $975 million to support Luminant’s reclamation obligations. The collateral bond is effectively a first lien on all of Vistra Operations’ assets (which ranks pari passu with the Vistra Operations Credit Facilities) that contractually enables the RCT to be paid (up to $975 million) before the other first lien lenders in the event of a liquidation of our assets. Collateral support relates to land mined or being mined and not yet reclaimed as well as land for which permits have been obtained but mining activities have not yet begun and land already reclaimed but not released from regulatory obligations by the RCT, and includes cost contingency amounts.
The PUCT has rules in place to assure adequate creditworthiness of each REP, including the ability to return customer deposits, if necessary. Under these rules, at December 31, 2016, Vistra Energy has posted letters of credit in the amount of $55 million with the PUCT, which is subject to adjustments.
ERCOT has rules in place to assure adequate creditworthiness of parties that participate in the day-ahead, real-time and congestion revenue rights markets operated by ERCOT. Under these rules, Vistra Energy has posted collateral support, in the form of letters of credit, totaling $110 million at December 31, 2016 (which is subject to daily adjustments based on settlement activity with ERCOT).
Off-Balance Sheet Arrangements
We do not have any off-balance sheet arrangements.
Material Cross Default/Acceleration Provisions
Certain of our contractual arrangements contain provisions that could result in an event of default if there were a failure under financing arrangements to meet payment terms or to observe covenants that could or does result in an acceleration of payments due. Such provisions are referred to as “cross default” or “cross acceleration” provisions.
84
Table of Contents
A default by Vistra Operations or any of its restricted subsidiaries in respect of certain specified indebtedness in an aggregate amount in excess of $300 million may result in a cross default under the Vistra Operations Credit Facilities. Such a default would allow the lenders to accelerate the maturity of outstanding balances ($4.5 billion at December 31, 2016) under such facilities.
Each of Vistra Operations’ commodity hedging agreements and interest rate swap agreements that are secured with a lien on its assets on a pari passu basis with the Vistra Operations Credit Facilities lenders contains a cross default provision. An event of a default by Vistra Energy or any of its subsidiaries relating to indebtedness in excess of $300 million that results in the acceleration of such debt, would give each counterparty under these hedging agreements the right to terminate its hedge or interest rate swap agreement with Vistra Energy and require all outstanding obligations under such agreement to be settled.
Additionally, we enter into energy-related physical and financial contracts, the master forms of which contain provisions whereby an event of default or acceleration of settlement would occur if we were to default under an obligation in respect of borrowings in excess of thresholds, which may vary by contract.
Contractual Obligations and Commitments
The following table summarizes the amounts and related maturities of our contractual cash obligations at December 31, 2016 (see Notes 13 and 14 to the 2016 Annual Financial Statements for additional disclosures regarding these debts and noncancellable purchase obligations).
| Contractual Cash Obligations: | Less Than One Year |
One to Three Years |
Three to Five Years |
More Than Five Years |
Total | |||||||||||||||
| Debt — principal, including capital leases (a) |
$ | 46 | $ | 88 | $ | 89 | $ | 4,380 | $ | 4,603 | ||||||||||
| Debt — interest |
223 | 442 | 433 | 374 | 1,472 | |||||||||||||||
| Operating leases |
25 | 31 | 21 | 153 | 230 | |||||||||||||||
| Obligations under commodity purchase and services agreements (b) |
637 | 341 | 248 | 733 | 1,959 | |||||||||||||||
|
|
|
|
|
|
|
|
|
|
|
|||||||||||
| Total contractual cash obligations |
$ | 931 | $ | 902 | $ | 791 | $ | 5,640 | $ | 8,264 | ||||||||||
|
|
|
|
|
|
|
|
|
|
|
|||||||||||
| (a) | Includes $4.5 billion of borrowings under the Vistra Operations Credit Facility and $103 million principal amount of long-term debt, including mandatorily redeemable preferred stock and capital leases. Excludes unamortized premiums, discounts and debt costs. |
| (b) | Includes a long-term service and maintenance contract related to our generation assets, capacity payments, nuclear fuel and natural gas take-or-pay contracts, coal contracts, business services and nuclear related outsourcing and other purchase commitments. Amounts presented for variable priced contracts reflect the year-end 2016 price for all periods except where contractual price adjustment or index-based prices are specified. |
The following are not included in the table above:
| • | the Tax Receivable Agreement obligation (see Note 10 to the 2016 Annual Financial Statements); |
| • | arrangements between affiliated entities and intercompany debt (see Note 20 to the 2016 Annual Financial Statements); |
| • | individual contracts that have an annual cash requirement of less than $1 million (however, multiple contracts with one counterparty that are more than $1 million on an aggregated basis have been included); |
| • | contracts that are cancellable without payment of a substantial cancellation penalty; and |
| • | employment contracts with management. |
Guarantees — See Note 14 to the 2016 Annual Financial Statements for discussion of guarantees.
85
Table of Contents
Commitments and Contingencies
See Note 14 to the 2016 Annual Financial Statements for discussion of commitments and contingencies and legal proceedings.
Changes in Accounting Standards
See “—Basis of Presentation and Fresh-Start Reporting” and Note 1 to the 2016 Annual Financial Statements for discussion of changes in accounting standards.
Quantitative and Qualitative Disclosures about Market Risk
Market risk is the risk that in the normal course of business we may experience a loss in value as a result of changes in market conditions that affect economic factors such as commodity prices, interest rates and counterparty credit. Our exposure to market risk is affected by a number of factors, including the size, duration and composition of our energy and financial portfolio, as well as the volatility and liquidity of markets. Instruments used to manage this exposure include interest rate swaps to hedge debt costs, as well as exchange-traded, over-the-counter contracts and other contractual arrangements to hedge commodity prices.
Risk Oversight
We manage the commodity price, counterparty credit and commodity-related operational risk related to the competitive energy business within limitations established by senior management and in accordance with overall risk management policies. Interest rate risk is managed centrally by our treasury function. Market risks are monitored by risk management groups that operate independently of the wholesale commercial operations, utilizing defined practices and analytical methodologies. These techniques measure the risk of change in value of the portfolio of contracts and the hypothetical effect on this value from changes in market conditions and include, but are not limited to, position reporting and review, Value at Risk (VaR) methodologies and stress test scenarios. Key risk control activities include, but are not limited to, transaction review and approval (including credit review), operational and market risk measurement, transaction authority oversight, validation of transaction capture, market price validation and reporting, and portfolio valuation and reporting, including mark-to-market valuation, VaR and other risk measurement metrics.
Vistra Energy has a risk management organization that enforces applicable risk limits, including respective policies and procedures to ensure compliance with such limits, and evaluates the risks inherent in our businesses.
Commodity Price Risk
Our business is subject to the inherent risks of market fluctuations in the price of electricity, natural gas and other energy-related products we market or purchase. We actively manage the portfolio of generation assets, fuel supply and retail sales load to mitigate the near-term impacts of these risks on results of operations. Similar to other participants in the market, we cannot fully manage the long-term value impact of structural declines or increases in natural gas and power prices.
In managing energy price risk, we enter into a variety of market transactions, including, but not limited to, short- and long-term contracts for physical delivery, exchange-traded and over-the-counter financial contracts and bilateral contracts with customers. Activities include hedging, the structuring of long-term contractual arrangements and proprietary trading. We continuously monitor the valuation of identified risks and adjust positions based on current market conditions. We strive to use consistent assumptions regarding forward market price curves in evaluating and recording the effects of commodity price risk.
VaR Methodology — A VaR methodology is used to measure the amount of market risk that exists within the portfolio under a variety of market conditions. The resultant VaR produces an estimate of a portfolio’s potential for loss given a specified confidence level and considers, among other things, market movements utilizing standard statistical techniques given historical and projected market prices and volatilities.
86
Table of Contents
A Monte Carlo simulation methodology is used to calculate VaR and is considered by management to be the most effective way to estimate changes in a portfolio’s value based on assumed market conditions for liquid markets. The use of this method requires a number of key assumptions, such as use of: (i) an assumed confidence level; (ii) an assumed holding period (i.e., the time necessary for management action, such as to liquidate positions); and (iii) historical estimates of volatility and correlation data. The tables below detail certain VaR measures related to various portfolios of contracts.
VaR for Energy-Related Contracts Subject to Mark-to-Market (MtM) Accounting — This measurement estimates the potential loss in fair value, due to changes in market conditions, of all contracts marked-to-market in net income, based on a 95% confidence level and an assumed holding period of 60 days.
| Successor | Predecessor | |||||||
| December 31, 2016 |
December 31, 2015 |
|||||||
| Month-end average MtM VaR: |
$ | 65 | $ | 68 | ||||
| Month-end high MtM VaR: |
$ | 119 | $ | 97 | ||||
| Month-end low MtM VaR: |
$ | 30 | $ | 49 | ||||
The increase in the month-end high MtM VaR risk measure reflected increased price volatility.
Interest Rate Risk
The following table provides information concerning our and our Predecessor’s financial instruments at December 31, 2016 and 2015, respectively, that are sensitive to changes in interest rates. Debt amounts of the Successor consist of the Vistra Operations Credit Facilities. Debt amounts of the Predecessor consist of debtor-in-possession financing and pre-petition obligations that were fully secured and other obligations that were allowed to be paid as ordered by the Bankruptcy Court. Other pre-petition obligations (i.e., obligations incurred or accrued prior to the Bankruptcy Filing) were administered by the Bankruptcy Court and are excluded from the Predecessor debt amounts presented below due to the uncertainty related to when those obligations would mature. See Note 13 to the 2016 Annual Financial Statements for further discussion of these financial instruments.
| Successor | Predecessor | |||||||||||||||||||||||||||||||||||||||
| Expected Maturity Date | 2016 Total Carrying Amount |
2016 Total Fair Value |
2015 Total Carrying Amount |
2015 Total Fair Value |
||||||||||||||||||||||||||||||||||||
| (millions of dollars, except percentages) | ||||||||||||||||||||||||||||||||||||||||
| 2017 | 2018 | 2019 | 2020 | 2021 | There- after |
|||||||||||||||||||||||||||||||||||
| Long-term debt, including current maturities (a): |
||||||||||||||||||||||||||||||||||||||||
| Variable rate debt amount |
$ | 39 | $ | 39 | $ | 39 | $ | 39 | $ | 39 | $ | 4,305 | $ | 4,500 | $ | 4,552 | $ | 1,425 | $ | 1,411 | ||||||||||||||||||||
| Average interest rate (b) |
4.75 | % | 4.75 | % | 4.75 | % | 4.75 | % | 4.75 | % | 4.78 | % | 4.78 | % | 3.75 | % | ||||||||||||||||||||||||
| Debt swapped to fixed (c): |
||||||||||||||||||||||||||||||||||||||||
| Notional amount |
$ | — | $ | — | $ | — | $ | — | $ | — | $ | 3,000 | $ | 3,000 | ||||||||||||||||||||||||||
| Average pay rate |
5.82 | % | 5.82 | % | 5.82 | % | 5.82 | % | 5.82 | % | 5.82 | % | 5.82 | % | ||||||||||||||||||||||||||
| Average receive rate |
4.52 | % | 4.52 | % | 4.52 | % | 4.52 | % | 4.52 | % | 4.52 | % | 4.52 | % | ||||||||||||||||||||||||||
| (a) | Capital leases, mandatorily redeemable preferred stock and the effects of unamortized premiums and discounts are excluded from the table. |
| (b) | The weighted average interest rate presented is based on the rates in effect at December 31, 2016. |
| (c) | Successor period includes interest rate swaps that become effective in January 2017 and have maturity dates through July 2023. |
87
Table of Contents
Credit Risk
Credit risk relates to the risk of loss associated with nonperformance by counterparties. We maintain credit risk policies with regard to our counterparties to minimize overall credit risk. These policies prescribe practices for evaluating a potential counterparty’s financial condition, credit rating and other quantitative and qualitative credit criteria and authorize specific risk mitigation tools, including, but not limited to, use of standardized master agreements that allow for netting of positive and negative exposures associated with a single counterparty. We have processes for monitoring and managing credit exposure of our businesses, including methodologies to analyze counterparties’ financial strength, measurement of current and potential future exposures and contract language that provides rights for netting and setoff. Credit enhancements such as parental guarantees, letters of credit, surety bonds, margin deposits and customer deposits are also utilized. Additionally, individual counterparties and credit portfolios are managed to assess overall credit exposure.
Credit Exposure — Our gross exposure to credit risk associated with trade accounts receivable (retail and wholesale) and net asset positions (before collateral) arising from commodity contracts and hedging and trading activities totaled $798 million at December 31, 2016. The components of this exposure are discussed in more detail below.
Assets subject to credit risk at December 31, 2016 include $439 million in retail trade accounts receivable before taking into account cash deposits held as collateral for these receivables totaling $48 million. We believe the risk of material loss (after consideration of bad debt allowances) from nonperformance by these customers is unlikely based upon historical experience. Allowances for uncollectible accounts receivable are established for the potential loss from nonpayment by these customers based on historical experience, market or operational conditions and changes in the financial condition of large business customers.
The remaining credit exposure arises from wholesale trade receivables and amounts associated with derivative instruments related to hedging and trading activities. Counterparties to these transactions include energy companies, financial institutions, electric utilities, independent power producers, oil and gas producers, local distribution companies and energy marketing companies. At December 31, 2016, the exposure to credit risk from these counterparties totaled $359 million consisting of accounts receivable of $153 million and net asset positions related to commodity contracts of $206 million, after taking into account the netting provisions of the master agreements described above but before taking into account $50 million in collateral (cash, letters of credit and other credit support). The net exposure (after collateral) of $309 million increased $95 million in the year ended December 31, 2016.
Of this $309 million net exposure, 95% is with investment grade customers and counterparties, as determined by our internal credit evaluation process, which is based on publicly available information such as major rating agencies’ published ratings as well as internal credit methodologies and credit scoring models. We routinely monitor and manage credit exposure to these customers and counterparties based on, but not limited to, our assigned credit rating, margining and collateral management.
88
Table of Contents
The following table presents the distribution of credit exposure at December 31, 2016. This credit exposure largely represents wholesale trade accounts receivable and net asset positions related to commodity contracts and hedging and trading activities recognized as derivative assets in the condensed consolidated balance sheet, after taking into consideration netting provisions within each contract, setoff provisions in the event of default and any master netting contracts with counterparties. Credit collateral includes cash and letters of credit, but excludes other credit enhancements such as liens on assets. See Note 17 to the 2016 Annual Financial Statements for further discussion of portions of this exposure related to activities marked-to-market in the financial statements.
| Exposure Before Credit Collateral |
Credit Collateral |
Net Exposure |
||||||||||
| Investment grade |
$ | 331 | $ | 38 | $ | 293 | ||||||
| Below investment grade or no rating |
28 | 12 | 16 | |||||||||
|
|
|
|
|
|
|
|||||||
| Totals |
$ | 359 | $ | 50 | $ | 309 | ||||||
|
|
|
|
|
|
|
|||||||
| Investment grade |
92.2 | % | 94.8 | % | ||||||||
| Below investment grade or no rating |
7.8 | % | 5.2 | % | ||||||||
In addition to the exposures in the table above, contracts classified as “normal” purchase or sale and non-derivative contractual commitments are not marked-to-market in the financial statements. Such contractual commitments may contain pricing that is favorable considering current market conditions and therefore represent economic risk if the counterparties do not perform. Nonperformance could have a material impact on future results of operations, liquidity and financial condition.
Significant (10% or greater) concentration of credit exposure exists with three counterparties, which represented 26%, 18% and 15% of the $309 million net exposure. We view exposure to these counterparties to be within an acceptable level of risk tolerance due to the counterparties’ credit ratings, each of which is rated as investment grade, the counterparties’ market role and deemed creditworthiness and the importance of our business relationship with the counterparties. An event of default by one or more counterparties could subsequently result in termination-related settlement payments that reduce available liquidity if amounts such as margin deposits are owed to the counterparties or delays in receipts of expected settlements owed to us. While the potential concentration of risk with these counterparties is viewed to be within an acceptable risk tolerance, the exposure to hedge counterparties is managed through the various ongoing risk management measures described above.
89
Table of Contents
Our Company
Vistra Energy is a leading energy company operating an integrated power business in Texas, which includes TXU Energy and Luminant. Through TXU Energy and Luminant, our integrated business engages in retail sales of electricity and related services to end users, wholesale electricity sales and purchases, power generation, commodity risk management, fuel production and fuel logistics management. We are committed to providing superior customer service, maintaining operational excellence, applying an integrated approach to managing risk, applying a disciplined approach to managing costs, continuing our track record of superior corporate responsibility and citizenship and effectively managing through varying business cycles in the competitive power markets. Our goal is to deliver long-term value to our stockholders by maintaining a strong balance sheet and strong liquidity profile in order to provide us with the flexibility to pursue a range of capital deployment strategies, including investing in our current business, funding attractive organic and acquisition-driven growth opportunities and returning capital to our stockholders.
We operate as an integrated company that provides complete electricity solutions to our customers and to the broader ERCOT market. Our company is comprised of:
| • | our brand name retail electricity provider business, TXU Energy™, which is the largest retailer of electricity in Texas with approximately 1.7 million residential, commercial and industrial customers as of December 31, 2016, and maintains the highest residential customer retention rate of any Texas retail provider in its respective core market; |
| • | our electricity generation business, Luminant, which is the largest generator of electricity in ERCOT, operating approximately 17,000 MW of fuel-diverse installed capacity in ERCOT as of December 31, 2016; |
| • | our wholesale commodity risk management operation, which dispatches our generation fleet in response to market conditions, markets the electricity generated by our facilities to our customers (including TXU Energy) and the broader ERCOT market, procures fuel from third parties for use at our electric generating facilities and performs the risk management services for Luminant and TXU Energy that enables the delivery of cost-effective electricity to the wholesale market and retail end-users; |
| • | our mining, fuel handling and logistics operations, which supply fuel to our diverse fleet of electric generating facilities and manage our real property holdings throughout the enterprise; and |
| • | our efficient, low-cost support organizations, which provide the necessary services to meet our compliance obligations, support our integrated electricity solutions and assist in conducting our business in an environmentally responsible and regulatory-compliant manner. |
All of our operations teams (mining and fuel handling; wholesale commodity risk management, asset optimization and generation fleet dispatch; power generation; retail electricity marketing, sales and services; and strategic sourcing, supply chain and procurement) are integrated. The integrated nature of these operations allows us, where appropriate, to manage these operations with close alignment, which we believe provides us better market insight and a reduction of the impact of commodity price volatility as compared to our non-integrated competitors. The balance between our retail and wholesale operations creates a uniquely integrated company that is the largest power generator and retail provider of electricity in Texas. We sell retail electricity and value-added services, primarily through TXU Energy, to approximately 1.7 million residential, commercial and industrial customers in Texas as of December 31, 2016. See “Management’s Discussion and Analysis of Financial Condition and Results of Operations — Results of Operations — Operating Statistics” for more detail. Additionally, we sell electricity and related products generated by our fleet of electric generating units, which had an aggregate of approximately 17,000 MW of generating capacity as of December 31, 2016. We also procure wholesale electricity and related commodities to fuel our generation facilities and supply our retail business. We also manage a well-established mining operation that has over 40 years of experience in supplying fuel to our
90
Table of Contents
fleet in a safe and environmentally responsible manner. Our generation portfolio is diverse and flexible in terms of fuel types and dispatch characteristics, which enables us to respond to changing market conditions and regulatory developments. The charts below show our market-leading position among power generators and electricity retailers in Texas. We believe the combination of these charts illustrates the unique opportunity that is created from our integrated business model.
|
|
| |
| Date: 2015 Source: SNL, a subscription service of S&P Global Market Intelligence |
Date: 2015 Source: EIA Note: Rankings do not combine a company that may own multiple brands. |
91
Table of Contents
Our Integrated Business Model
We believe the key factor that distinguishes us from others in our industry is the integrated nature of our business (i.e., pairing Luminant’s reliable and efficient mining, generating and wholesale commodity risk management capabilities with TXU Energy’s retail platform) which, in our view, represents a unique company structure in the competitive ERCOT market and other competitive electricity markets across the country. We believe our integrated business model creates a unique opportunity because, relative to our non-integrated competitors, it reduces our exposure to commodity price movements and provides an opportunity for greater earnings stability. Consequently, our integrated business model will be at the core of our business strategy.
The chart below depicts the integrated nature of our business and summarizes the key advantages of our integrated business model.
92
Table of Contents
To further illustrate the benefits of our integrated business model, the chart below highlights the competitive advantages we believe our integrated business model offers as compared to our non-integrated competitors (i.e., pure-play IPPs and non-integrated REPs).
|
IPP Model – Competitive Pressures |
Retail Model – Competitive Pressures |
Vistra Energy – Integrated Advantage |
||||||||||||||
| Commodity Exposure Related |
|
◾ Low price environment puts pressure on “long” commodity IPP model ◾ Lack of depth of wholesale market makes meaningful long term hedging challenging |
◾ Lowprice environment encourages competitive entry ◾ Lackof market depth to hedge supply requirements presents risk management issue |
◾ Mitigatescash flow volatility from exposure to commodity prices ◾ Retailchannel provides an internal offset to generation (and vice versa) ◾ Lowerhedging transaction and collateral costs
|
||||||||||||
| Impact of Technology |
|
◾ Technology advancement in, and subsidization of, wind, solar, and storage ◾ Low load growth environment; trends toward distributed generation and efficiency |
◾ Trend towards energy efficiency and “green” products |
◾ Opportunity to use customer channels to expand integrated model to new technology ◾ Creates new ways to engage customers and promotes long term relationships
|
||||||||||||
| New Entrants |
|
◾ Continued new build at questionable economics leads to high reserve margins & volatility in capacity prices |
◾ Very aggressive / unsustainable pricing from new entrants / competitors |
◾ Retail and wholesale diversification provides earnings stability and capital efficiencies relative to pure-play new entrants
|
||||||||||||
|
Regulatory/ Political |

|
◾ Regulatoryand political focus on emissions ◾ Considerableoversight with numerous restrictions on market behavior ◾ Onerousrules regarding asset retirement |
◾ ERCOT is only fully competitive retail market in North America (price-to-beat expired in 2007) ◾ Non ERCOT retail market faces structural challenges - Default provider sets effective ceiling price - Utilities retain most customers and the customer interface, limiting opportunities to differentiate |
◾ As largest retail provider in ERCOT, the only fully deregulated retail market, TXU Energy lowers risk profile of overall portfolio compared to competitors in other markets |
||||||||||||
While we do not believe there are any material risks specifically related to our integrated business model, see “Risk Factors” for a description of the material risks our business faces.
Our Operations
Our primary operations consist of electricity solutions, including retail sales of electricity and related products to end users, power generation (including operations and maintenance and outage and project management) and sales of electric generating unit output in the wholesale marketplace, asset optimization and commodity risk management performed on an integrated basis for our retail and wholesale positions, and fuel logistics and management. These operations work together on an integrated basis, which allows us to realize efficiencies and alignment in all aspects of the electricity generation and sales operation.
We operate solely in the growing ERCOT electricity market, which we view as one of the most attractive power markets in the United States. As described in more detail below, ERCOT is an ISO that manages the flow of electricity to approximately 24 million Texas customers, representing approximately 90% of the state’s load, and spanning approximately 75% of its geography, as of December 31, 2016.
93
Table of Contents
Retail
Texas has one of the fastest growing populations of any state in the United States and has a diverse economy, which has resulted in a significant and growing competitive retail electricity market. We are an active participant in the competitive ERCOT market and continue to be a market leader, which we believe is driven by, among other things, having one of the lowest customer complaint rates, according to the PUCT, having an integrated power generation operation that allows us to efficiently obtain the electricity needed to serve our customers at the lowest cost, and leveraging the experience of our wholesale commodity risk management operations to optimize our cost to procure electricity and other products on behalf of our customers. We provided electricity to approximately 24% and 18% of the residential and commercial customers in ERCOT, respectively, as of December 31, 2016. We believe we have differentiated ourselves by providing a distinctive customer experience predicated on delivering reliable and innovative power products and solutions to our customers, such as Free Nights and Free Weekends residential plans, MyEnergy DashboardSM, TXU Energy’s iThermostat product and mobile solutions, the TXU Energy Rewards program, the TXU Energy Green UPSM renewable energy credit program and a diverse set of solar options, which give our customers choice, convenience and control over how and when they use electricity and related services. We competitively market our retail electricity and related services to acquire, serve and retain both retail and wholesale customers. Our wholesale customers represent a cross section of industrial users, other competitive retail electric providers, municipalities, cooperatives and other end-users of electricity. We believe we are able to better serve our retail customers through our unique affiliation with our wholesale commodity risk management personnel who are able to structure products and contracts in a way that offers significant value compared to stand-alone retail electric providers. Additionally, our generation business protects our retail business from power price volatility, by allowing it to bypass bid-ask spread in the market (particularly for illiquid products and time periods), which results in significantly lower collateral costs for our retail business as compared to other, non-integrated retail electric providers. Moreover, our retail business reduces, to some extent, the exposure of our wholesale generation business to wholesale power price volatility. This is because the retail load requirements of our retail operations (primarily TXU Energy) provide a natural offset to the length of Luminant’s generation portfolio thereby reducing the exposure to wholesale power price volatility as compared to a non-integrated pure-play IPP.
Generation
Our power generation fleet is diverse and flexible in terms of dispatch characteristics as our fleet includes baseload, intermediate/load-following and peaking generation. Our wholesale commodity risk management business is responsible for dispatching our generation fleet in response to market needs after implementing portfolio optimization strategies, thus linking and integrating the generation fleet production with our retail customer and wholesale sales opportunities. Market demand, also known as load, faced by an electric power system such as ERCOT varies from moment to moment as a result of changes in business and residential demand, much of which is driven by weather. Unlike most other commodities, the production and consumption of electricity must remain balanced on an instantaneous basis. There is a certain baseline demand for electricity across an electric power system that occurs throughout the day, which is typically satisfied by baseload generating units with low variable operating costs. Baseload generating units can also increase output to satisfy certain incremental demand and reduce output when demand is unusually low. Intermediate/load-following generating units, which can more efficiently change their output to satisfy increases in demand, typically satisfy a large proportion of changes in intraday load as they respond to daily increases in demand or unexpected changes in supply created by reduced generation from renewable resources or other generator outages. Peak daily loads are typically satisfied by peaking units. Peaking units are typically the most expensive to operate, but they can quickly start up and shut down to meet brief peaks in demand. In general, baseload units, intermediate/load-following units and peaking units are dispatched into the ERCOT grid in order from lowest to highest variable cost. Price formation in ERCOT, as with other competitive power markets in the United States, is typically based on the highest variable cost unit that clears the market to satisfy system demand at a given point in time.
94
Table of Contents
Our Fleet
Luminant’s generation fleet consists of 50 power generation units, all of which are wholly-owned and operate within the ERCOT electricity market, with the location, fuel types, dispatch characteristics and total installed nameplate generation capacity for each generation facility shown in the table below:
| Name |
Location (all in the |
Fuel Type |
Dispatch Type |
Installed Nameplate Capacity Generation |
Number of Units | |||||||
| Comanche Peak |
Somervell County | Nuclear | Baseload | 2,300 | 2 | |||||||
| Oak Grove |
Robertson County | Lignite | Baseload | 1,600 | 2 | |||||||
| Sandow |
Milam County | Lignite | Baseload | 1,137 | 2 | |||||||
| Big Brown |
Freestone County | Lignite/Coal | Intermediate/Load Following | 1,150 | 2 | |||||||
| Martin Lake |
Rusk County | Lignite/Coal | Intermediate/Load Following | 2,250 | 3 | |||||||
| Monticello |
Titus County | Lignite/Coal | Intermediate/Load Following | 1,880 | 3 | |||||||
| Forney |
Kaufman County | Natural Gas (CCGT) | Intermediate/Load Following | 1,912 | 8 | |||||||
| Lamar |
Lamar County | Natural Gas (CCGT) | Intermediate/Load Following | 1,076 | 6 | |||||||
| Morgan Creek |
Mitchell County | Natural Gas (CT) | Peaking | 390 | 6 | |||||||
| Permian Basin |
Ward County | Natural Gas (CT) | Peaking | 325 | 5 | |||||||
| DeCordova |
Hood County | Natural Gas (CT) | Peaking | 260 | 4 | |||||||
| Lake Hubbard |
Dallas County | Natural Gas (Steam) | Peaking | 921 | 2 | |||||||
| Stryker Creek |
Cherokee County | Natural Gas (Steam) | Peaking | 685 | 2 | |||||||
| Graham |
Young County | Natural Gas (Steam) | Peaking | 630 | 2 | |||||||
| Trinidad |
Henderson County | Natural Gas (Steam) | Peaking | 244 | 1 | |||||||
|
|
|
| ||||||||||
| Total |
16,760 | 50 | ||||||||||
|
|
|
| ||||||||||
Our wholesale commodity risk management business also procures renewable energy credits from wind generation to support our electricity sales to wholesale and retail customers to satisfy the increasing demand for renewable resources from such customers. As of December 31, 2016, we had long-term PPAs to annually procure 390 MW of renewable energy. These renewable generation sources deliver electricity when conditions make them available, and, when on-line, they generally compete with baseload units. Because they cannot be relied upon to meet demand continuously due to their dependence on weather and time of day, these generation sources are categorized as non-dispatchable and create the need for intermediate/load-following resources to respond to changes in their output.
Our generation resources, which represented approximately 17% of the generation capacity in ERCOT as of December 31, 2016, allow us to annually generate, procure and sell approximately 75-85 TWh of electricity to wholesale and retail customers from nuclear, natural gas, lignite, coal and renewable generation resources. The chart below shows the diversification of our generation fleet in terms of fuel types and dispatch characteristics as of December 31, 2016.
95
Table of Contents
Generation
2016; % MWs
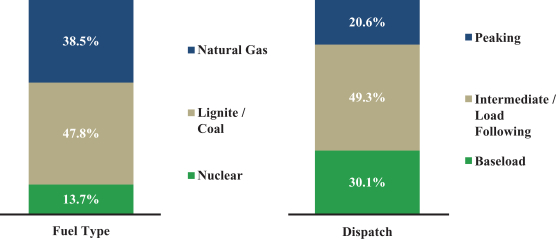
The map below shows our significant footprint in Texas and further demonstrates the integrated nature of our business.
96
Table of Contents
Fuel Supply
Nuclear
We operate two nuclear generation units at the Comanche Peak plant site, each of which is designed for a capacity of 1,150 MW. Comanche Peak Unit 1 and Unit 2 went into commercial operation in 1990 and 1993, respectively, and are generally operated at full capacity. Refueling (nuclear fuel assembly replacement) outages for each unit are scheduled to occur every eighteen months during the spring or fall off-peak demand periods. Every three years, the refueling cycle results in the refueling of both units during the same year, the latest of which occurred in 2014. We also expect to refuel both units during 2017. While one unit is undergoing a refueling outage, the remaining unit is intended to operate at full capacity. During a refueling outage, other maintenance, modification and testing activities are completed that cannot be accomplished when the unit is in operation. Over the last three years the refueling outage period per unit has ranged from 29 to 54 days. The Comanche Peak facility operated at a capacity factor of 105.7%, 99.0% and 92.5% in 2016, 2015 and 2014, respectively.
We have contracts in place for all our nuclear fuel requirements for 2017. We have contracts in place for the majority of our nuclear fuel requirements through 2018. As part of the Chapter 11 Cases, we terminated or renegotiated certain nuclear fuel contracts to provide for better economic or operational terms and conditions. We do not anticipate any significant difficulties in acquiring uranium and contracting for associated conversion, enrichment and fabrication services in the foreseeable future.
The nuclear industry has developed ways to store used nuclear fuel on site at nuclear generation facilities, primarily through the use of dry cask storage, since there are no facilities for reprocessing or disposal of used nuclear fuel currently in operation in the United States. Luminant stores its used nuclear fuel on-site in storage pools or dry cask storage facilities and believes its on-site used nuclear fuel storage capability is sufficient for the foreseeable future.
Lignite/Coal
Our lignite/coal-fueled generation fleet capacity totals 8,017 MW. Maintenance outages at these units are scheduled during the spring or fall off-peak demand periods. Over the last three years, the total annual scheduled and unscheduled outages per unit averaged approximately 33 days in duration. Our lignite/coal-fueled generation fleet operated at a capacity factor of 77.1%, 59.5% and 69.6% in 2016, 2015 and 2014 respectively. This performance reflects increased economic backdown of the units and the seasonal suspension of certain units due to the persistent low wholesale power price environment in ERCOT.
We satisfy all of our fuel requirements at the Oak Grove and Sandow generation facilities with lignite that we mine. We meet our fuel requirements for the Big Brown and Martin Lake generation units by blending lignite we mine with coal purchased from multiple suppliers under contracts of various lengths and transported from the Powder River Basin to our generation plants by railcar. All fuel requirements for our Monticello generation units are met with coal supplied from the Powder River Basin. In 2016, approximately 39% of the fuel used at the Big Brown, Monticello and Martin Lake generation facilities and 65% of the fuel used at all of our lignite/coal-fueled generation facilities was supplied from surface minable lignite reserves dedicated to our generation plants, which are located adjacent to the reserves.
As a result of projected mining development costs, current economic forecasts and regulatory uncertainty, in 2014, Luminant decided to transition the fuel plans at its Big Brown and Monticello generation facilities to be fully fueled with coal from the Powder River Basin. As a result, it plans to discontinue lignite mining operations at these sites once mining and reclamation of current mine sites is complete. The majority of reclamation activities at these facilities is expected to be completed by the end of 2020 unless economic forecasts and increased regulatory certainty justify additional mine development.
97
Table of Contents
Natural Gas
Our natural gas-fueled generation fleet capacity totals 6,443 MW. In April 2016, we acquired La Frontera Holdings, LLC the indirect owner of two combined-cycle gas turbine (CCGT) natural gas fueled generation facilities located in ERCOT. The facility in Forney, Texas (8 units) has a capacity of 1,912 MW and the facility in Paris, Texas (6 units) has a capacity of 1,076 MW. The acquisition diversified our fuel mix and increased the dispatch flexibility in our fleet.
We also operate combustion turbine (CT) facilities at Morgan Creek (6 units), Permian Basin (5 units), DeCordova (4 units), plant sites and steam facilities at Lake Hubbard (2 units), Stryker Creek (2 units), Graham (2 units) and Trinidad (1 unit) plant sites. The CT and steam plants are peaking units which provide us the ability to meet increased demand from our retail customers during high market price intervals with available generation capacity and provide other wholesale opportunities.
We satisfy our fuel requirements at these facilities through a combination of spot market and near-term purchase contracts. Additionally, we have near-term natural gas transportation agreements in place for all of our sites to ensure reliable fuel supply.
Our Competitive Strengths
We believe we are well-positioned to execute our business strategy of delivering long-term value to our stakeholders based on, among others, the following competitive strengths:
Uniquely situated integrated energy company.
We believe the key factor that distinguishes us from others in our industry is the integrated nature of our business (i.e., pairing Luminant’s reliable and efficient mining, generating and wholesale commodity risk management capabilities with TXU Energy’s retail platform). We believe this is a unique company structure in the competitive ERCOT market and other competitive electricity markets across the country. It is our view that our integrated business model provides us a competitive advantage and results in more stable earnings under all market environments relative to our non-integrated competitors. In general, non-integrated electricity retailers are subject to wholesale power price and resulting cash flow volatility when demand increases or supply tightens, which can potentially result in significant losses if an electricity retailer is not appropriately hedged. However, because our integrated business model enables us to manage through various price environments, we believe our retail operations (primarily TXU Energy) are not as exposed to wholesale power price volatility as non-integrated retail power companies. Moreover, given the retail load requirements of our retail operations (primarily TXU Energy), the length of Luminant’s generation portfolio is not as exposed to wholesale power price volatility as compared to a non-integrated pure-play IPP. Additionally, our mining operations provide an alternative to other coal procurement sources and give us more flexibility in reaching the most cost-effective arrangements for our coal-fueled facilities. We believe these advantages make our business less subject to volatility risk than pure-play IPPs and non-integrated retail electric providers. Furthermore, we believe our integrated business model allows us to reduce sourcing and transaction costs and minimize credit and collateral requirements.
Highly valued retail brand and customer-focused operations.
Our retail business has been operating in the competitive retail electricity market in Texas under the TXU EnergyTM brand since 2002. We believe this has created strong brand recognition throughout ERCOT, enabling us to effectively acquire, serve and retain a broad spectrum of retail electricity customers. Our TXU Energy™ brand is viewed by customers as a symbol of a trustworthy, customer-centric, innovative and dependable electricity service. By leveraging our retail marketing capabilities, commitment to product innovation and deep knowledge of the ERCOT market and its customer base, we believe that we can maintain and grow our position as the largest retailer of electricity in the highly competitive ERCOT retail market. We have an operating model that has delivered attractive margins and strong customer satisfaction that has been consistently ranked by the PUCT as having among the lowest customer complaint rates in the ERCOT market. We drive positive results in our retail electricity
98
Table of Contents
business by functioning as a technology driven, multi-channel marketer with advanced analytics and product development capabilities. We have leveraged these capabilities and the TXU Energy™ brand to deliver a wide range of innovative power products and services to our customers, including Free Nights and Weekends residential plans, MyEnergy DashboardSM, TXU Energy’s iThermostat product and mobile solutions, the TXU Energy Rewards program, the TXU Energy Green UpSM renewable energy credit program and a diverse set of solar options, which give our customers choice, convenience and control over how and when they use electricity and related services. We believe our strong customer service, innovative products and trusted brand recognition have resulted in us maintaining the highest residential customer retention rate of any Texas retail electric provider in its respective core market.
Diversified generation sources and critical energy infrastructure.
We maintain operational flexibility to provide reliable and responsive power under a variety of market conditions by utilizing generation sources that are diverse and flexible in terms of fuel types (nuclear, lignite, coal, natural gas and renewables) and dispatch characteristics (baseload, intermediate/load-following, peaking and non-dispatchable). These generation sources feature the following characteristics:
| • | Except for periods of scheduled maintenance activities, our nuclear-fueled units are generally available to run at capacity. |
| • | Except for periods of scheduled maintenance activities, our lignite- and coal-fueled units are available to run at capacity or seasonally, depending on market conditions (i.e., during periods when wholesale electricity prices are greater than the unit’s variable production costs). Certain of these units run only during the summer peak period and at times go into seasonal layup during the months with lower seasonal demand. |
| • | Our CCGT units generally run during the intermediate/load-following periods of the daily supply curve. |
| • | Our natural gas-fueled generation peaking units supplement the aggregate nuclear-, lignite- and coal-fueled and CCGT generation capacity in meeting demand during peak load periods because production from certain of these units, particularly combustion-turbine units, can be more quickly adjusted up or down as demand warrants. With this quick-start capability, we are able to increase generation during periods of supply or demand volatility in ERCOT and capture scarcity pricing in the wholesale electricity market. These natural gas-fueled generation peaking units also help us mitigate unit-contingent outage risk by allowing us to meet demand even if one or more of our nuclear, lignite, coal or CCGT units is taken offline for maintenance. |
| • | The CCGT and natural gas-fueled generation peaking units also play a pivotal and increasing role in the ERCOT market by supplementing intermittent renewable generation through their versatile operations. We expect this versatility to increase in value over time as the ERCOT market continues to expand into renewable resources. |
| • | Our long-term PPAs with various renewable energy providers deliver electricity when natural conditions make renewable resources available. These resources position us to meet the market’s increasing demand for sustainable, low-carbon power solutions. |
In addition, the commodity risk management and asset optimization strategies executed by our commercial operation supplement the electricity generated by our fleet with electricity procured in market transactions to ensure that we are supplying our customers with the most cost-effective electricity options.
Competitive scale and highly effective, low-cost support operations.
As an integrated energy company with approximately 17,000 MW of generation capacity and approximately 1.7 million retail electricity customers, each as of December 31, 2016, we operate with significant scale. This scale enables us to conduct our business with certain operational synergies that are not available to smaller power generation or retail electricity businesses. The benefits of our significant scale include improved leverage of our
99
Table of Contents
low fixed costs, opportunities to share expertise across the portfolio of assets, enhanced procurement opportunities, development of, and the ability to offer, a wide array of products and services to our customers, diversity of cash flows and a breadth of positive relationships with regulatory and governmental authorities. We believe these advantages, combined with a strong balance sheet and strong liquidity profile, enable us to operate with more financial flexibility than our competitors, and will enable us to prudently grow our existing business and pursue attractive growth opportunities in the future.
Positioned to capture upside in the attractive ERCOT market.
We believe that the location of our business, solely in ERCOT, offers attractive upside opportunities. ERCOT is the only fully deregulated electricity market in the United States in that both the wholesale and retail markets are truly competitive. In addition to having a robust wholesale market, the ERCOT residential retail market does not have regulated providers or a standard offer service, which is unique among competitive retail markets in the United States. We believe our integrated business model uniquely positions us to benefit from this attractive, robust marketplace. The ERCOT market represents approximately 90% of the load in Texas, a state that is the seventh-largest power market in the world, according to the United States Energy Information Administration (EIA), and had a population growth rate of 8.8% between July 2010 and July 2015, more than double the United States population growth rate of 3.9% during the same period, according to the U.S. Census Bureau. ERCOT has shown historically above-average load growth compared to other power markets in the United States, according to the EIA, and ERCOT can be viewed as a “power island” due to its limited import and export capacity, which we believe creates a favorable power supply and demand dynamic. Total ERCOT power demand has grown at a compounded annual growth rate of approximately 1.4% from 2005 through 2014, compared to a range of -0.6% to 0.8% in other United States markets, according to ERCOT and the EIA, respectively.
We consider ERCOT to be one of the most well-developed power markets in the United States, providing a stable regulatory environment and significant price transparency, market liquidity and support to competitive generators and retail electric providers like us. The energy-only wholesale market structure in ERCOT offers a variety of potential revenue streams in addition to energy revenues such as ancillary services and the ORDC, which ERCOT implemented on June 1, 2014. A unique feature of the ERCOT energy market is the system-wide offer cap of $9,000/MWh, which is substantially higher than other markets with capacity markets. While the ERCOT market is currently oversupplied, we expect reserve margins to be forecasted to continue to compress over time due to growing demand, potential generation retirements and limited announced new-build projects, particularly of non-intermittent projects, further tightening the supply and demand balance and creating conditions that may generate increased price volatility and higher wholesale electricity prices. We believe that our existing asset base and integrated business model (including our integrated approach to risk management) will enable us to take advantage of these opportunities in a disciplined manner. See “— The ERCOT Market” below for more information about ERCOT and the ORDC.
In addition, in general, Luminant’s generation portfolio (primarily the nuclear, lignite and coal generation facilities) is positioned to increase in value to the extent there is a rebound in forward natural gas prices. We cannot predict, however, whether or not forward natural gas prices will rebound or the timing of any such rebound if it were to occur in the future.
Strong balance sheet and strong liquidity profile.
In connection with Emergence, a substantial amount of the debt of our Predecessor was eliminated. As a result, we believe our balance sheet is strong given our low leverage relative to the cash flows generated from our integrated business. Further, we believe that our financial leverage is prudent and, together with our strong cash flow and strong liquidity profile, provides us with significant competitive advantages relative to, and sets us apart from, our competitors, especially those that have much more leverage than we do. We believe that our integrated business model further improves our liquidity profile relative to our non-integrated competitors because such integration reduces our retail operations’ exposure to wholesale electricity price volatility resulting in our retail
100
Table of Contents
operations having lower collateral requirements with counterparties and ERCOT. We also believe a strong balance sheet allows us to manage through periods of commodity price volatility that may require incremental liquidity and positions us well to pursue a range of capital deployment strategies, including investing in our current business, funding attractive organic and acquisition-driven growth opportunities and returning capital to our stockholders. Consistent with our disciplined capital allocation approval process, we intend to pursue growth opportunities that have compelling economic value in addition to fitting with our business strategy.
Proven, experienced management team.
The members of our senior management team have significant industry experience, including experience operating in a competitive retail electricity environment, operating sophisticated power generation facilities, operating a safe and cost-efficient mining organization and managing the risks of competitive wholesale and retail electricity businesses. We believe that our management team’s history of safe and reliable operations in our industry, breadth of positive relationships with regulatory and legislative authorities and commitment to a disciplined and prudent operating cost structure and capital allocation will benefit our stakeholders. Moreover, between personal investments in our common stock and our incentive compensation arrangements, our management team has a meaningful stake in Vistra Energy, thereby closely aligning incentives between management and our stockholders.
Our Business Strategy
Our business strategy is to deliver long-term stakeholder value through a multi-faceted focus on the following areas:
Integrated business model.
Our business strategy will be guided by our integrated business model because we believe it is our core competitive advantage and differentiates us from our non-integrated competitors. We believe our integrated business model creates a unique opportunity because, relative to our non-integrated competitors, it insulates us from commodity price movements and provides unique earnings stability. Consequently, our integrated business model will be at the core of our business strategy.
Superior customer service.
Through TXU Energy, we serve the retail electricity needs of end-use residential, small business, commercial and industrial electricity customers through multiple sales and marketing channels. In addition to benefitting from our integrated business model, we leverage our strong brand, our commitment to a consistent and reliable product offering, the backstop of the electricity generated by our generation fleet, our industry-leading wholesale commodity risk management operations and exceptional, innovative and dependable customer service to differentiate our products and services from our competitors. We strive to be at the forefront of innovation with new offerings and customer experiences to reinforce our value proposition. We maintain a focus on solutions that give our customers choice, convenience and control over how and when they use electricity and related services, including Free Nights and Weekends residential plans, MyEnergy DashboardSM, TXU Energy’s iThermostat product and mobile solutions, the TXU Energy Rewards program, the TXU Energy Green UpSM renewable energy credit program and a diverse set of solar options. Our focus on superior customer service will guide our efforts to acquire new residential and commercial customers, serve and retain existing customers and maintain valuable sales channels for our electricity generation resources. We believe our strong customer service, innovative products and trusted brand have resulted in us maintaining the highest residential customer retention rate of any Texas retail electric provider in its respective core market.
Excellence in operations while maintaining an efficient cost structure.
We believe that operating our facilities in a safe, reliable, environmentally-compliant, and cost-effective and efficient manner is a foundation for delivering long-term stakeholder value. We also believe value increases as a function of making disciplined investments that enable our generation facilities to operate not only effectively
101
Table of Contents
and efficiently, but also safely, reliably and in an environmentally-compliant manner. We believe that an ongoing focus on operational excellence and safety is a key component to success in a highly competitive environment and is part of the unique value proposition of our integrated model. Additionally, we are committed to optimizing our cost structure and implementing enterprise-wide process and operating improvements without compromising the safety of our communities, customers and employees. In connection with Emergence, in addition to significantly reducing our debt levels, we implemented certain cost-reduction actions in order to better align and right-size our cost structure. We believe we have a highly effective and efficient cost structure and that our cost structure supports excellence in our operations.
Integrated hedging and commercial management.
Our commercial team is focused on managing risk, through opportunistic hedging, and optimizing our assets and business positions. We actively manage our exposure to wholesale electricity prices in ERCOT, on an integrated basis, through contracts for physical delivery of electricity, exchange-traded and over-the-counter financial contracts, ERCOT term, day-ahead and real-time market transactions and bilateral contracts with other wholesale market participants, including other power generators and end-user electricity customers. These hedging activities include short-term agreements, long-term electricity sales contracts and forward sales of natural gas through financial instruments. The historically positive correlation between natural gas prices and wholesale electricity prices in ERCOT has provided us an opportunity to manage our exposure to the variability of wholesale electricity prices through natural gas hedging activities. We seek to hedge near-term cash flow and optimize long-term value through hedging and forward sales contracts. We believe our integrated hedging and commercial management strategy, in combination with a strong balance sheet and strong liquidity profile, will provide a long-term advantage through cycles of higher and lower commodity prices.
Disciplined capital allocation.
Like any energy-focused business, we are potentially subject to significant commodity price volatility and capital costs. Accordingly, our strategy is to maintain a balance sheet with prudent financial leverage supported by readily accessible, flexible and diverse sources of liquidity. Our ongoing capital allocation priorities primarily include making necessary capital investments to maintain the safety and reliability of our facilities. Because we believe cost discipline and strong management of our assets and commodity positions are necessary to deliver long-term value to our stakeholders, we generally make capital allocation decisions that we believe will lead to attractive cash returns on investment. We are focused on optimal deployment of capital and intend to evaluate a range of capital deployment strategies including return of capital to stockholders in the form of dividends and/or share repurchases, investments in our current business and acquisition-driven growth investments.
Growth and enhancement.
Our growth strategy leverages our core capabilities of multi-channel retail marketing in a large and competitive market, operating large-scale, environmentally sensitive, and diverse assets across a variety of fuel technologies, fuel logistics and management, commodity risk management, cost control, and energy infrastructure investing. We intend to opportunistically evaluate acquisitions of high-quality energy infrastructure assets and businesses that complement these core capabilities and enable us to achieve operational or financial synergies. To that end, our primary focus will target growth opportunities that expand or enhance our business position within ERCOT and are consistent with our integrated business model (including our stable earnings profile as compared to our non-integrated competitors). While we solely operate within ERCOT currently, we intend to evaluate energy infrastructure growth opportunities outside ERCOT that offer compelling value creation opportunities, including cost and operational improvements, organic growth opportunities and attractive and stable earnings profiles featuring multiple revenue streams. We also believe that there will continue to be significant acquisition opportunities for competitive power generation assets and retail electricity businesses in power markets in the United States based on, among other things, the continuing trend of separating competitive power generation assets from regulated utility assets. While we are intent on growing our business and creating value for our stockholders, we are committed to making disciplined investments that are consistent with our
102
Table of Contents
focus on maintaining a strong balance sheet and strong liquidity profile. As a result, consistent with our disciplined capital allocation approval process, growth opportunities we pursue will need to have compelling economic value in addition to fitting with our business strategy.
Corporate responsibility and citizenship.
We are committed to providing safe, reliable, cost-effective and environmentally-compliant electricity for the communities and customers we serve. We strive to improve the quality of life in the communities in which we operate. We are also committed to being a good corporate citizen in the communities in which we conduct our operations. Our company and our employees are actively engaged in programs intended to support and strengthen the communities in which we conduct our operations. Our foremost giving initiatives, the United Way and TXU Energy Aid campaigns, have raised more than $30 million in employee and corporate contributions since 2000. Additionally, for more than 30 years, TXU Energy Aid has served as an integral resource for social service agencies that assist families in need, having helped more than 500,000 customers across Texas pay their electricity bills.
The ERCOT Market
ERCOT is an ISO that manages the flow of electricity from approximately 78,000 MW of installed capacity to approximately 24 million Texas customers, representing approximately 90% of the state’s electric load and spanning approximately 75% of its geography, as of December 31, 2016. ERCOT is a highly competitive wholesale electricity market with historically above-average demand growth, limited import and export capacity and increasing wholesale price caps, and is the seventh-largest power market in the world, according to the EIA. Population growth in Texas is currently expanding at well above the national average rate, with a growth rate of 8.8% between July 2010 and July 2015, more than double the United States population growth rate of 3.9% during the same period, according to the U.S. Census Bureau. ERCOT accounts for approximately 32% of the competitively served retail load in the United States and residential consumers in the ERCOT market consume approximately 32% more electricity than the average United States residential consumer according to the EIA. Total ERCOT power demand has grown at a compounded annual growth rate of approximately 1.4% from 2005 through 2014, compared to a range of -0.6% to 0.8% in other United States markets, according to ERCOT and the EIA, respectively. ERCOT was formed in 1970 and became the first ISO in the United States in September 1996. The following map illustrates ERCOT by regions:
103
Table of Contents
As an energy-only market, ERCOT’s market design is distinct from other competitive electricity markets in the United States. Other markets maintain a minimum reserve margin through regulated planning, resource adequacy requirements and/or capacity markets. In contrast, ERCOT’s resource adequacy is predominately dependent on free-market processes and energy-market price signals. On June 1, 2014, ERCOT implemented the ORDC, pursuant to which wholesale electricity prices in the real-time electricity market increase automatically as available operating reserves decrease below defined threshold levels, creating a price adder. When operating reserves drop to 2,000 MW or less, the ORDC automatically adjusts power prices to the established VOLL, which is set at $9,000/MWh. Because ERCOT has limited excess generation capacity to meet high demand days due to its minimal import capacity, and peaking facilities have high operating costs, the marginal price of supply rapidly increases during periods of high demand. Historically, elevated temperatures in the summer months have driven high electricity demand in ERCOT. Many generators benefit from these sporadic periods of “scarcity pricing” in which power prices may increase significantly, up to the current $9,000/MWh price cap.
Transactions in ERCOT take place in two key markets: the day-ahead market and the real-time market. The day-ahead market is a voluntary, forward electricity market conducted the day before each operating day in which generators and purchasers of electricity may bid for one or more hours of electricity supply or consumption. The real-time market is a spot market in which electricity may be sold in five-minute intervals. The day-ahead market provides market participants with visibility into where prices are expected to clear, and the prices are not impacted by subsequent events. Conversely, the real-time market exposes purchasers to the risk of transient operational events and price spikes. These two markets allow market participants to manage their risk profile by adjusting their participation in each market. In addition, ERCOT uses ancillary services to maintain system reliability, including regulation service — up, regulation service — down, responsive reserve service and non-spinning reserve service. Regulation service up and down are used to balance the grid in a near-instantaneous fashion when supply and demand fluctuate due to a variety of factors, such as weather, generation outages, renewable production intermittency and transmission outages. Responsive reserves and non-spinning reserves are used by ERCOT when the grid is at, near or recovering from a state of emergency due to inadequate generation. Because ERCOT has one of the highest concentrations of wind capacity generation among United States markets, the ERCOT market is more susceptible to fluctuations in wholesale electricity supply due to intermittent wind production, making ERCOT more vulnerable to periods of generation scarcity.
Seasonality
The demand for and market prices of electricity and natural gas are affected by weather. As a result, our operating results may fluctuate on a seasonal basis, and more severe weather conditions such as heat waves or extreme winter weather may make such fluctuations more pronounced. The pattern of this fluctuation may change depending on, among other things, the retail load served and the terms of contracts to purchase or sell electricity.
Competition
Competition in ERCOT, as in other electricity markets, is impacted by electricity and fuel prices, congestion along the power grid, subsidies provided by state and federal governments for new generation facilities, new market entrants, construction of new generating assets, technological advances in power generation, the actions of environmental and other regulatory authorities and other factors. We primarily compete with other electricity generators and retailers based on our ability to generate electric supply, and market and sell electricity, at competitive prices and to efficiently utilize transportation from third-party pipelines and transmission from electric utilities and ISOs to deliver electricity to end-users. Competitors in the generation and retail power markets in which we participate include regulated utilities, industrial companies, non-utility generators, competitive subsidiaries of regulated utilities, IPPs, REPs and other energy marketers. See “Risk Factors —Market, Financial and Economic Risks,” “Risk Factors — Operational Risks” and “Management’s Discussion and Analysis of Financial Condition and Results of Operations” for additional information concerning the risks faced with respect to the competitive energy markets in which we operate.
104
Table of Contents
Brand Value
Our TXU EnergyTM brand, which has been used to sell electricity to customers in the competitive retail electricity market in Texas for approximately 15 years, is registered and protected by trademark law and is the only material intellectual property asset that the Company owns. We value the TXU EnergyTM brand at approximately $1.2 billion.
Legal Proceedings and Regulatory Matters
Proceedings against the Debtors
Substantially all liabilities of the Debtors were resolved under the Plan. Please see “The Reorganization and Emergence” for more detailed information regarding the Plan and the treatment of claims under the Plan.
Environmental Matters
Litigation Related to EPA Reviews
In June 2008, the Environmental Protection Agency (EPA) issued an initial request for information to Luminant under the EPA’s authority under Section 114 of the Clean Air Act (CAA). The stated purpose of the request is to obtain information necessary to determine compliance with the CAA, including New Source Review standards and air permits issued by the TCEQ for the Big Brown, Monticello and Martin Lake generation facilities. In April 2013, Luminant received an additional information request from the EPA under Section 114 related to our Big Brown, Martin Lake and Monticello facilities as well as an initial information request related to our Sandow 4 generation facility.
In July 2012, the EPA sent Luminant a notice of violation alleging noncompliance with the CAA’s New Source Review standards and the air permits at our Martin Lake and Big Brown generation facilities. In August 2013, the US Department of Justice, acting as the attorneys for the EPA, filed a civil enforcement lawsuit against Luminant in federal district court in Dallas, alleging violations of the CAA, including its New Source Review standards, at our Big Brown and Martin Lake generation facilities. In August 2015, the district court granted Luminant’s motion to dismiss seven of the nine claims asserted by the EPA in the lawsuit. In August 2016, the EPA filed an amended complaint, eliminating one of the two remaining claims and withdrawing with prejudice a request for civil penalties in the other remaining claim. The EPA also filed a motion for entry of final judgment so that it could seek to appeal the district court’s dismissal decision. In September 2016, Luminant filed a response opposing the EPA’s motion for entry of final judgment. In October 2016, the district court denied the EPA’s motion for entry of final judgment and agreed that the remaining claim must be fully adjudicated at the district court or withdrawn with prejudice before the EPA may appeal the dismissal decision. In January 2017, the EPA dismissed its two remaining claims with prejudice and the district court entered final judgment in our favor. In March 2017, the EPA appealed the final judgment to the Fifth Circuit Court and Luminant filed a motion in the district court to recover its attorney fees and costs. In April 2017, the district court stayed its consideration of Luminant’s motion for attorney fees. We believe that we and Luminant have complied with all requirements of the CAA and intend to vigorously defend against the remaining allegations. The lawsuit requests the maximum civil penalties available under the CAA to the government of up to $32,500 to $37,500 per day for each alleged violation, depending on the date of the alleged violation, and injunctive relief, including an order requiring the installation of best available control technology at the affected units. An adverse outcome could require substantial capital expenditures that cannot be determined at this time or retirement of the plants at issue and could possibly require the payment of substantial penalties. We cannot predict the outcome of these proceedings, including the financial effects, if any.
Greenhouse Gas Emissions
In August 2015, the EPA finalized rules to address GHG emissions from new, modified and reconstructed and existing electricity generation units, referred to as the Clean Power Plan. The rule for existing facilities would establish state-specific emissions rate goals to reduce nationwide CO2 emissions related to affected units
105
Table of Contents
by over 30% from 2012 emission levels by 2030. A number of parties, including Luminant, filed petitions for review in the United States Court of Appeals for the District of Columbia Circuit (D.C. Circuit Court) for the rule for new, modified and reconstructed plants. In addition, a number of petitions for review of the rule for existing plants were filed in the D.C. Circuit Court by various parties and groups, including challenges from twenty-seven different states opposed to the rule as well as petitions from, among others, certain power generating companies, various business groups and some labor unions. Luminant also filed its own petition for review. In January 2016, a coalition of states, industry (including Luminant) and other parties filed applications with the United States Supreme Court (Supreme Court) asking that the Supreme Court stay the rule while the D.C. Circuit Court reviews the legality of the rule for existing plants. In February 2016, the Supreme Court stayed the rule pending the conclusion of legal challenges on the rule before the D.C. Circuit Court and until the Supreme Court disposes of any subsequent petition for review. Oral argument on the merits of the legal challenges to the rule was heard in September 2016 before the entire D.C. Circuit Court. In March 2017, President Trump issued an Executive Order entitled Promoting Energy Independence and Economic Growth (Order). The Order covers a number of matters, including the Clean Power Plan. Among other provisions, the Order directs the EPA to review the Clean Power Plan and, if appropriate, suspend, revise or rescind the rules on existing and new, modified and reconstructed generating units. In addition, the Department of Justice has filed motions seeking to abate those cases until the EPA concludes its review of the rules, including any new rulemaking that results from that review. In April 2017, the D.C. Circuit Court issued orders holding the cases in abeyance for 60 days and that the EPA must provide status reports to the court at 30-day intervals. The D.C. Circuit Court further ordered that all parties file supplemental briefs by May 15, 2017 on whether the cases should be remanded back to the EPA rather than held in abeyance. While we cannot predict the outcome of these rulemakings and related legal proceedings, or estimate a range of reasonably probable costs, if the rules are ultimately implemented or upheld as they were issued, they could have a material impact on our results of operations, liquidity or financial condition.
In August 2015, the EPA proposed model rules and federal plan requirements for states to consider as they develop state plans to comply with the rules for GHG emissions. A federal plan would then be finalized for a state if a state fails to submit a state plan by the deadlines established in the Clean Power Plan for existing plants or if the EPA disapproves a submitted state plan. Luminant filed comments on the federal plan proposal and model rules in January 2016. The Order directed the EPA to review this proposed rule for consistency with the policies in the Order and, if appropriate, to revise or withdraw the proposed rule. In April 2017, the EPA published the withdrawal of the proposed rule and plan requirements. While we cannot predict the timing or outcome of this rulemaking and related legal proceedings, or estimate a range of reasonably possible costs, they could have a material impact on our results of operations, liquidity or financial condition.
Cross-State Air Pollution Rule (CSAPR)
In July 2011, the EPA issued the CSAPR, compliance with which would have required significant additional reductions of SO2 and NOx emissions from our fossil fueled generation units. In February 2012, the EPA released a final rule (Final Revisions) and a proposed rule revising certain aspects of the CSAPR, including increases in the emissions budgets for Texas and our generation assets as compared to the July 2011 version of the rule. In June 2012, the EPA finalized the proposed rule (Second Revised Rule).
The CSAPR became effective January 1, 2015. In July 2015, following a remand of the case from the Supreme Court to consider further legal challenges, the D.C. Circuit Court unanimously ruled in favor of Luminant and other petitioners, holding that the CSAPR emissions budgets over-controlled Texas and other states. The D.C. Circuit Court remanded those states’ budgets to the EPA for prompt reconsideration. While Luminant planned to participate in the EPA’s reconsideration process to develop increased budgets for the 1997 ozone standard that do not over-control Texas, the EPA instead responded to the remand by proposing a new rulemaking that created new NOX ozone season budgets for the 2008 ozone standard without addressing the over-controlling budgets for the 1997 standard. Comments on the EPA’s proposal were submitted by Luminant in February 2016. In August 2016, the EPA disapproved Texas’s 2008 ozone State Implementation Plan (SIP) submittal and imposed a Federal Implementation Plan (FIP) in its place in October 2016. Texas filed a petition in the Fifth Circuit Court challenging the SIP disapproval and Luminant has intervened in support of Texas’s challenge. The State of Texas and Luminant
106
Table of Contents
have also both filed challenges in the D.C. Circuit Court challenging the EPA’s FIP and those cases are currently pending before that court. With respect to Texas’s SO2 emission budgets, in June 2016, the EPA issued a memorandum describing the EPA’s proposed approach for responding to the D.C. Circuit Court’s remand for reconsideration of the CSAPR SO2 emission budgets for Texas and three other states that had been remanded to the EPA by the D.C. Circuit Court. In the memorandum, the EPA stated that those four states could either voluntarily participate in the CSAPR by submitting a SIP revision adopting the SO2 budgets that had been previously held invalid by the D.C. Circuit Court and the current annual NOx budgets or, if the state chooses not to participate in the CSAPR, the EPA could withdraw the CSAPR FIP by the fall of 2016 for those states and address any interstate transport and regional haze obligations on a state-by-state basis. Texas has not indicated that it intends to adopt the over-controlling budgets and in November 2016 the EPA proposed to withdraw the CSAPR FIP for Texas. Because the EPA has not finalized its proposal to remove Texas from the annual CSAPR programs, these programs will continue to apply to Texas and Texas sources. However, at this time, the EPA has not populated the allowance accounts for Texas sources with 2017 annual CSAPR program allowances. While we cannot predict the outcome of future proceedings related to the CSAPR, including the EPA’s recent actions concerning the CSAPR annual emissions budgets for affected states and participating in the CSAPR program, based upon our current operating plans we do not believe that the CSAPR itself will cause any material operational, financial or compliance issues to our business or require us to incur any material compliance costs.
Regional Haze — Reasonable Progress and Long-Term Strategies
The Regional Haze Program of the CAA establishes “as a national goal the prevention of any future, and the remedying of any existing, impairment of visibility in mandatory Class I federal areas, like national parks, which impairment results from man-made pollution.” There are two components to the Regional Haze Program. First, states must establish goals for reasonable progress for Class I federal areas within the state and establish long-term strategies to reach those goals and to assist Class I federal areas in neighboring states to achieve reasonable progress set by those states towards a goal of natural visibility by 2064. In February 2009, the TCEQ submitted a SIP concerning regional haze (Regional Haze SIP) to the EPA. In December 2011, the EPA proposed a limited disapproval of the Regional Haze SIP due to its reliance on the Clean Air Interstate Rule (CAIR) instead of the EPA’s replacement CSAPR program that the EPA proposed in July 2011. In August 2012, Luminant filed a petition for review in the Fifth Circuit Court challenging the EPA’s limited disapproval of the Regional Haze SIP on the grounds that the CAIR continued in effect pending the D.C. Circuit Court’s decision in the CSAPR litigation. In September 2012, Luminant filed a petition to intervene in a case filed by industry groups and other states and private parties in the D.C. Circuit Court challenging the EPA’s limited disapproval and issuance of a FIP regarding the regional haze best available retrofit technology (BART) program. The Fifth Circuit Court case has since been transferred to the D.C. Circuit Court and consolidated with other pending BART program regional haze appeals. Briefing in the D.C. Circuit Court was completed in March 2017.
In June 2014, the EPA issued requests for information under Section 114 of the CAA to Luminant and other generators in Texas related to the reasonable progress program. After releasing a proposed rule in November 2014 and receiving comments from a number of parties, including Luminant and the State of Texas, in April 2015, the EPA released a final rule in January 2016 approving in part and disapproving in part Texas’ SIP for Regional Haze and issuing a FIP for Regional Haze. In the rule, the EPA asserts that the Texas SIP does not show reasonable progress in improving visibility for two areas in Texas and that its long-term strategy fails to make emission reductions needed to achieve reasonable progress in improving visibility in the Wichita Mountains of Oklahoma. The EPA’s proposed emission limits in the FIP assume additional control equipment for specific lignite/coal-fueled generation units across Texas, including new flue gas desulfurization systems (scrubbers) at seven electricity generating units and upgrades to existing scrubbers at seven electricity generating units. Specifically for Luminant, the EPA’s FIP is based on new scrubbers at Big Brown Units 1 and 2 and Monticello Units 1 and 2 and scrubber upgrades at Martin Lake Units 1, 2 and 3, Monticello Unit 3 and Sandow Unit 4. Luminant is continuing to evaluate the requirements and potential financial and operational impacts of the rule, but new scrubbers at the Big Brown and Monticello units necessary to achieve the emission limits required by the FIP (if those limits are possible to attain), along with the existence of low wholesale electricity prices in
107
Table of Contents
ERCOT, would likely challenge the long-term economic viability of those units. Under the terms of the rule, the scrubber upgrades will be required by February 2019, and the new scrubbers will be required by February 2021. In March 2016, Luminant and a number of other parties, including the State of Texas, filed petitions for review in the Fifth Circuit Court challenging the FIP’s Texas requirements. Luminant and other parties also filed motions to stay the FIP while the court reviews the legality of the EPA’s action. In July 2016, the Fifth Circuit Court denied the EPA’s motion to dismiss Luminant’s challenge to the FIP and denied the EPA’s motion to transfer the challenges Luminant, the other industry petitioners and the State of Texas filed to the D.C. Circuit Court. In addition, the Fifth Circuit Court granted the motions to stay filed by Luminant, the other industry petitioners and the State of Texas pending final review of the petitions for review. The case was abated until the end of November 2016 in order to allow the parties to pursue settlement discussions. Settlement discussions were unsuccessful and in December 2016 the EPA filed a motion seeking a voluntary remand of the rule back to EPA for further consideration of Luminant’s pending request for administrative reconsideration. Luminant and some of the other petitioners filed a response opposing the EPA’s motion to remand and filed a cross motion for vacatur of the rule in December 2016. In March 2017, the Fifth Circuit Court remanded the rule back to the EPA for reconsideration in light of the Court’s prior determination that we and the other petitioners demonstrated a substantial likelihood that the EPA exceeded its statutory authority and acted arbitrarily and capriciously, but the Court denied all of the other pending motions. The stay of the rule (and the emission control requirements) remains in effect. In addition, the Fifth Circuit Court denied the EPA’s motion to lift the stay as to parts of the rule implicated in the EPA’s subsequent BART proposal and the Court is retaining jurisdiction of the case and requiring the EPA to file status reports on its reconsideration every 60 days. While we cannot predict the outcome of the rulemaking and legal proceedings, or estimate a range of reasonably possible costs, the result may have a material impact on our results of operations, liquidity or financial condition.
Regional Haze — Best Available Retrofit Technology
The second part of the Regional Haze Program subjects electricity generation units built between 1962 and 1977 to BART standards designed to improve visibility if such units cause or contribute to impairment of visibility in a federal class I area. BART reductions of SO2 and NOX are required either on a unit-by-unit basis or are deemed satisfied by state participation in an EPA-approved regional trading program such as the CSAPR. In response to a lawsuit by environmental groups, the D.C. Circuit Court issued a consent decree in March 2012 that required the EPA to propose a decision on the Regional Haze SIP by May 2012 and finalize that decision by November 2012. The consent decree requires a FIP for any provisions that the EPA disapproves. The D.C. Circuit Court has amended the consent decree several times to extend the dates for the EPA to propose and finalize a decision on the Regional Haze SIP. The consent decree was modified in December 2015 to extend the deadline for the EPA to finalize action on the determination and adoption of requirements for BART for electricity generation. Under the amended consent decree, the EPA had until December 2016 to propose, and has until September 2017 to finalize, a FIP for BART for Texas electricity generation services if the EPA determines that BART requirements have not been met. The EPA issued its proposed BART FIP for Texas in December 2016. The EPA’s proposed emission limits assume additional control equipment for specific coal-fueled generation units across Texas, including new flue gas desulfurization systems (scrubbers) at 12 electric generation units and upgrades to existing scrubbers at four electric generation units. Specifically for Luminant, the EPA’s emission limitations are based on new scrubbers at Big Brown Units 1 and 2 and Monticello Units 1 and 2 and scrubber upgrades at Martin Lake Units 1, 2 and 3 and Monticello Unit 3. Luminant is continuing to evaluate the requirements and potential financial and operational impacts of the proposed rule, but new scrubbers at the Big Brown and Monticello units necessary to achieve the emission limits required by the FIP (if those limits are possible to attain), along with the existence of low wholesale power prices in ERCOT, would likely challenge the long-term economic viability of those units. Under the terms of the rule, the scrubber upgrades will be required within three years of the effective date of the final rule and the new scrubbers will be required within five years of the effective date of the final rule. We anticipate submitting comments on the proposed FIP when those are due in May 2017. While we cannot predict the outcome of the rulemaking and potential legal proceedings, or estimate a range of reasonably possible costs, the result may have a material impact on our results of operations, liquidity or financial condition.
108
Table of Contents
Intersection of the CSAPR and Regional Haze Programs
Historically, the EPA has considered compliance with a regional trading program, such as the CSAPR, as satisfying a state’s obligations under the BART portion of the Regional Haze Program. However, in the reasonable progress FIP, the EPA diverged from this approach and did not treat Texas’ compliance with the CSAPR as satisfying its obligations under the BART portion of the Regional Haze Program. The EPA concluded that it would not be appropriate to finalize that determination given the remand of the CSAPR budgets. As described above, the EPA has now proposed to remove Texas from the annual CSAPR trading programs. If Texas were in the CSAPR annual trading programs the EPA would have no basis for its BART FIP because it has made a determination for Texas and all other states that participate in the CSAPR annual trading programs that such participation satisfies their BART obligations. We do not believe that the EPA’s proposal to remove Texas from the CSAPR annual trading programs satisfies the D.C. Circuit Court’s mandate to the EPA to develop non-over-controlling budgets for Texas and we submitted comments on the EPA’s proposed rule to remove Texas from the CSAPR annual trading programs. While we cannot predict the outcome of these matters, or estimate a range of reasonably possible costs, the result may have a material impact on our results of operations, liquidity or financial condition.
Affirmative Defenses During Malfunctions
In February 2013, in response to a petition for rulemaking filed by the Sierra Club, the EPA proposed a rule requiring certain states to replace SIP exemptions for excess emissions during malfunctions with an affirmative defense. Texas was not included in that original proposal since it already had an EPA-approved affirmative defense provision in its SIP that was found to be lawful by the Fifth Circuit Court in 2013. In 2014, as a result of a D.C. Circuit Court decision striking down an affirmative defense provision in another EPA rule, the EPA revised its 2013 proposal to extend the EPA’s proposed findings of inadequacy to states that have affirmative defense provisions, including Texas. The EPA’s revised proposal would require Texas to remove or replace its EPA-approved affirmative defense provisions for excess emissions during startup, shutdown and maintenance events. In May 2015, the EPA finalized the proposal. In June 2015, Luminant filed a petition for review in the Fifth Circuit Court challenging certain aspects of the EPA’s final rule as they apply to the Texas SIP. The State of Texas and other parties have also filed similar petitions in the Fifth Circuit Court. In August 2015, the Fifth Circuit Court transferred the petitions that Luminant and other parties filed to the D.C. Circuit Court, and in October 2015 the petitions were consolidated with the pending petitions challenging the EPA’s action in the D.C. Circuit Court. Briefing in the D.C. Circuit Court on the challenges was completed in October 2016 and oral argument was originally set for May 2017. However, in April 2017, the court granted the EPA’s motion to continue oral argument and ordered that the case be held in abeyance with the EPA to provide status reports to the court on the EPA’s review of the action at 90-day intervals. We cannot predict the timing or outcome of this proceeding, or estimate a range of reasonably possible costs, but implementation of the rule as finalized may have a material impact on our results of operations, liquidity or financial condition.
SO2 Designations for Texas
In February 2016, the EPA notified Texas of the EPA’s preliminary intention to designate nonattainment areas for counties surrounding our Big Brown, Monticello and Martin Lake generation plants based on modeling data submitted to the EPA by the Sierra Club. Such designation would potentially require the implementation of various controls or other requirements to demonstrate attainment. Luminant submitted comments challenging the use of modeling data rather than data from actual air quality monitoring equipment. In November 2016, the EPA finalized its proposed designations for Texas including finalizing the nonattainment designations for the areas referenced above. In doing so, the EPA ignored contradictory modeling that we submitted with our comments. The final designation mandates would be for Texas to begin the multi-year process to evaluate what potential emission controls or operational changes, if any, may be necessary to demonstrate attainment. In February 2017, the state of Texas and Luminant filed challenges to the nonassignment designations in the Fifth Circuit Court and protective petitions in the D.C. Circuit Court. In March 2017, the EPA filed a motion to transfer or dismiss our Fifth Circuit petition and Texas and Luminant have filed an opposition to that motion. In addition, Luminant has
109
Table of Contents
filed a request with the EPA to reconsider the rule and immediately stay its effective date. While we cannot predict the outcome of this matter, or estimate a range of reasonably possible costs, the result may have a material impact on our results of operations, liquidity or financial condition.
Stream Protection Rule
In July 2015, the Office of Surface Mining (OSM) proposed a Stream Protection Rule that represents significant changes to surface mining regulations under the Surface Mining Control and Reclamation Act (SMCRA) program. The rule proposes to prevent or minimize impacts to surface water and groundwater from coal mining. In October 2015, we filed comments on the proposed rule. In December 2016, the OSM issued a final Stream Protection Rule that became effective in January 2017. Thereafter, the US Congress enacted a resolution under the Congressional Review Act that repealed the Stream Protection Rule and President Trump signed that resolution in February 2017.
Other Matters
We are involved in various legal and administrative proceedings in the normal course of business, the ultimate resolutions of which, in the opinion of management, are not anticipated to have a material effect on our results of operations, liquidity or financial condition.
Environmental Contingencies
In connection with our normal operations, we must comply with various environmental laws and regulations. We believe that we are in compliance with current environmental laws and regulations; however, the impact, if any, of changes to existing laws or regulations or the implementation of new laws or regulations is not determinable and could materially affect our financial condition, results of operations and liquidity.
In particular, our costs to comply with environmental regulations could be significantly affected by the following external events or conditions that are outside of our control:
| • | enactment and final implementation of state or federal statutes or regulations regarding CO2 and other greenhouse gas emissions; |
| • | other changes to existing state or federal regulation regarding air quality, water quality, control of toxic substances and hazardous and solid wastes, and other environmental matters, including final implementation of the rules and programs discussed under “— Legal Proceedings and Regulatory Matters” above; and |
| • | the identification by applicable authorities of sites requiring clean-up or the filing of complaints naming us as a potential responsible party under applicable environmental laws or regulations. |
Labor Contracts
We employ certain personnel who are represented by labor unions, the terms of whose employment are governed by collective bargaining agreements. During 2015, all collective bargaining agreements covering bargaining unit personnel engaged in lignite mining operations, lignite-, coal- and nuclear-fueled generation operations and some of our natural gas powered generation operations were extended to March 2017. While we are currently in the process of renegotiating these agreements and cannot predict the outcome of these or any future labor contract negotiations, we do not expect any changes in collective bargaining agreements to have a material adverse effect on our results of operations, liquidity or financial condition.
Nuclear Insurance
Nuclear insurance includes nuclear liability coverage, property damage, decontamination and accidental premature decommissioning coverage and accidental outage and/or extra expense coverage. We maintain nuclear
110
Table of Contents
insurance that meets or exceeds requirements promulgated by Section 170 (Price-Anderson) of the Atomic Energy Act and Title 10 of the Code of Federal Regulations, and we intend to maintain insurance against nuclear risks as long as such insurance is available. We are self-insured to the extent that losses (i) are within the policy deductibles, (ii) are not covered per policy exclusions, terms and limitations, (iii) exceed the amount of insurance maintained, or (iv) are not covered due to lack of insurance availability. Any such self-insured losses could have a material adverse effect on our results of operations, liquidity or financial condition.
The Atomic Energy Act provides for financial protection for the public in the event of a significant nuclear generation plant incident. It sets the statutory limit of public liability for a single nuclear incident at $13.4 billion and requires nuclear generation plant operators to provide financial protection for this amount. However, the United States Congress could impose revenue-raising measures on the nuclear industry to pay any claims that exceed this $13.4 billion statutory limit for a single incident. As required, we insure against a possible nuclear incident at our Comanche Peak facility resulting in public nuclear related bodily injury and property damage through a combination of private insurance and an industry-wide retrospective payment plan known as the Secondary Financial Protection (SFP).
Under the SFP, in the event of any single nuclear liability loss in excess of $375 million at any nuclear generation facility in the United States, each operating licensed reactor in the United States is subject to an assessment of up to approximately $127.3 million, payable in capped annual installments. This approximately $127.3 million maximum assessment is subject to increases for inflation every five years, with the next expected adjustment scheduled to occur in September 2018. Assessments are currently limited to approximately $19 million per operating licensed reactor per year per incident. As of the date of this prospectus, our maximum potential assessment under the SFP for each incident, based on the fact that we operate two licensed reactors, would be approximately $254.6 million, payable in installments of no more than approximately $38 million in any one year. For losses after January 1, 2017, the potential assessment applies in excess of $450 million.
The United States Nuclear Regulatory Commission (NRC) requires that nuclear generation plant license-holders maintain at least $1.06 billion of nuclear decontamination and property damage insurance, and requires the proceeds thereof be used to place a plant in a safe and stable condition, to decontaminate a plant pursuant to a plan submitted to, and approved by, the NRC prior to using the proceeds for plant repair or restoration, or to provide for premature decommissioning. We maintain nuclear decontamination and property damage insurance for our Comanche Peak facility in the amount of $2.25 billion (subject to a $10 million deductible per accident), and are self-insured against any amounts exceeding such $2.25 billion coverage.
We also maintain Accidental Outage insurance to cover the additional costs of obtaining replacement electricity from another source if one or both of the units at our Comanche Peak facility are out of service for more than twenty weeks as a result of covered direct physical damage. Such coverage provides for weekly payments of up to $4.5 million for the first 52 weeks and $3.6 million for the subsequent 110 weeks for each outage, respectively, after an initial 20-week waiting period. The total maximum coverage is $328 million for non-nuclear accidents and $490 million per unit for nuclear accidents, however, the coverage amounts applicable to each unit will be reduced to 80% if both units are out of service at the same time as a result of the same accident.
111
Table of Contents
The following table sets forth information regarding our executive officers and directors as of the date hereof. Ages are as of May 1, 2017.
| Name |
Age | Position | ||||
| Curtis A. Morgan |
56 | President, Chief Executive Officer and Director | ||||
| James A. Burke |
48 | Executive Vice President and Chief Operating Officer | ||||
| J. William Holden |
56 | Executive Vice President and Chief Financial Officer | ||||
| Stephanie Zapata Moore |
43 | Executive Vice President and General Counsel | ||||
| Carrie Lee Kirby |
49 | Executive Vice President and Chief Administrative Officer | ||||
| Sara Graziano |
34 | Senior Vice President of Corporate Development and Strategy | ||||
| Gavin R. Baiera |
41 | Director | ||||
| Jennifer Box |
35 | Director | ||||
| Jeff Hunter |
51 | Director | ||||
| Cyrus Madon |
52 | Director | ||||
| Geoff Strong |
42 | Director | ||||
Executive Officers
The executive officers of Vistra Energy Corp. consist of the following executives.
Curtis A. Morgan, President, Chief Executive Officer and Director, has served as the President, Chief Executive Officer and Director of Vistra Energy Corp. since the Effective Date. Prior to joining Vistra Energy Corp., he served as an Operating Partner with Energy Capital Partners, and prior to this position Mr. Morgan served as the Chief Executive Officer and President of EquiPower Resources Corp., a power generation company, since May 2010. Prior to joining EquiPower Resources Corp., he served as an Operating Partner of Energy Capital Partners from May 2009 to May 2010. Prior to joining Energy Capital partners, he served as President and Chief Executive Officer of FirstLight Power Enterprises from November 2006 to April 2009. Mr. Morgan has also held various leadership roles at NRG Energy, Mirant Corporation, Reliant Energy and Amoco Corporation.
James A. Burke, Executive Vice President and Chief Operating Officer, has served as the Executive Vice President and Chief Operating Officer of Vistra Energy Corp. since the Effective Date. Prior to joining Vistra Energy Corp., he served as Executive Vice President of EFH Corp. since February 2013 and President and Chief Executive of TXU Energy, a subsidiary of Vistra Energy Corp., since August 2005. Previously, Mr. Burke was Senior Vice President Consumer Markets of TXU Energy. Mr. Burke started his career with Deloitte Consulting, and held a variety of roles with The Coca-Cola Company, Reliant Energy and Gexa Energy prior to TXU Energy. Mr. Burke also serves on the board of directors of Marucci Sports.
J. William Holden, Executive Vice President and Chief Financial Officer, has served as the Executive Vice President and Chief Financial Officer of Vistra Energy Corp. since December 5, 2016. Prior to joining the Company, Mr. Holden served as an Executive Vice President and Senior Advisor at The Taffrail Group, LLC, an international strategic-advisory firm, from February 2013 until December 2016, where he advised a range of domestic and overseas clients on mergers, acquisitions and post-merger integration. From December 2010 until January 2013, Mr. Holden served as the Executive Vice President and Chief Financial Officer of GenOn Energy, Inc., where he was responsible for overseeing the accounting, finance, tax, risk control, human resources and information technology groups. Prior to serving in that role, he held various treasury, risk, operational, business development and international positions during his tenure at GenOn Energy, Inc./Mirant Corporation. Mr. Holden started his career with Southern Company and held various corporate finance roles over almost a decade at Southern.
112
Table of Contents
Stephanie Zapata Moore, Executive Vice President and General Counsel, has served as Executive Vice President and General Counsel of Vistra Energy Corp. since the Effective Date. Prior to joining Vistra Energy Corp., she served as Vice President and General Counsel of Luminant, since April 2012. Previously, Ms. Moore was Senior Counsel of Luminant from March 2007 to April 2012 and Counsel of a predecessor to Luminant from November 2005 to March 2007. Prior to joining Luminant, she was an attorney at Gardere Wynne Sewell where she engaged in a corporate practice.
Carrie Lee Kirby, Executive Vice President and Chief Administrative Officer, has served as the Executive Vice President and Chief Administrative Officer of Vistra Energy Corp. since the Effective Date. Prior to joining Vistra Energy Corp., she served as Executive Vice President of Human Resources of EFH Corp. since February 2013. Previously, Ms. Kirby was Senior Vice President of Human Resources from April 2012 to February 2013 and Vice President of Human Resources of TXU Energy, a subsidiary of Vistra Energy Corp., from October 2008 to April 2012.
Sara Graziano, Senior Vice President of Corporate Development and Strategy, has served as the Senior Vice President of Corporate Development and Strategy of Vistra Energy Corp. since the Effective Date. Prior to joining Vistra Energy Corp., she served as a Principal at Energy Capital Partners, a private equity firm focused on investing in North American energy infrastructure, where she worked since September 2011. Her experience prior to Energy Capital Partners includes leading the Strategies & Analysis group at FirstLight Power Enterprises and working as a consultant in the Energy & Environment practice at Charles River Associates.
Directors
Listed below is biographical information for each person who is currently a member of the Board, except for Mr. Morgan, whose information is listed above.
Gavin R. Baiera has served as a director since the Effective Date. Mr. Baiera is a managing director at Angelo, Gordon & Co. (Angelo) where he is the global head of the firm’s corporate credit activities and portfolio manager for its distressed funds. Mr. Baiera is also a managing director and member of the firm’s executive committee. Prior to joining Angelo in 2008, Mr. Baiera was the co-head of the strategic finance group at Morgan Stanley, which was responsible for all origination, underwriting, and distribution of restructuring transactions. Prior to that, Mr. Baiera worked at General Electric Capital Corporation concentrating on underwriting and investing in restructuring transactions. Mr. Baiera began his career at GE Capital in its financial management program. Mr. Baiera has served on numerous boards of directors including, most recently, MACH Gen, Orbitz Worldwide, and Travelport Worldwide.
Jennifer Box has served as a director since the Effective Date. Ms. Box is a managing director at Oaktree Capital Management where she is focused on investments in the shipping, power, energy, media and technology sectors. Prior to joining Oaktree in 2009, Ms. Box spent three and a half years as an investment analyst in the distressed debt group at The Blackstone Group. Prior to Blackstone, she was an associate consultant at the Boston Consulting Group. Ms. Box is a CFA charterholder. She serves on the board of Star Bulk Carriers.
Jeff Hunter has served as a director since the Effective Date. Mr. Hunter is currently Managing Director of Quinbrook Infrastructure Partners (Quinbrook) and a member of the Quinbrook Investment Committee, where he is responsible for deal origination and asset management in North America. Between 2013 and 2016, he was a managing partner of Power Capital Partners, an energy focused investment firm. Prior to this, he was executive vice president and chief financial officer of US Power Generating Company (USPowerGen). Mr. Hunter has also held leadership positions at PA Consulting Group and El Paso Merchant Energy and was a consultant for MRP Generating Company, LLC. Mr. Hunter currently serves as the non-executive director on the board of directors of Texas Transmission Holdings.
113
Table of Contents
Cyrus Madon has served as a director since the Effective Date. Mr. Madon is a senior managing partner and head of Brookfield’s private equity group and chief executive officer of Brookfield Business Partners. Mr. Madon joined Brookfield in 1998 as chief financial officer of Brookfield’s real estate brokerage business. During his tenure he has held a number of senior roles across the organization, including head of Brookfield’s corporate lending business. Mr. Madon began his career at PricewaterhouseCoopers where he worked in corporate finance and recovery, both in Canada and the United Kingdom. Mr. Madon is on the board of the Junior Achievement of Canada Foundation.
Geoffrey Strong has served as a director since the Effective Date. Mr. Strong is a Senior Partner of Apollo Management, where he focuses on investments in the energy sector for the firm’s private equity funds. Prior to Apollo, Mr. Strong was an investor in the private equity group at Blackstone, where he also focused primarily on the energy sector. Before joining Blackstone, Mr. Strong was a vice president of Morgan Stanley Capital Partners, the private equity business within Morgan Stanley. In addition to Vistra Energy, Mr. Strong serves on the boards of directors of Apex Energy, Caelus Energy, Chisolm Oil and Gas, Double Eagle Energy I and Double Eagle Energy II.
Board Composition and Director Independence
Our certificate of incorporation (Charter) provides for three classes of directors, each of which is to be elected on a staggered basis for a term of three years. Our bylaws (Bylaws) provide that the Board shall consist of such number of directors as is determined from time to time by the vote of a majority of the total number of directors then authorized. Please see “Description of Capital Stock — Anti-takeover Effects of Provisions In Our Charter and Bylaws” for a more detailed description of our Charter and Bylaws.
Pursuant to the Plan, on the Effective Date, we entered into the Stockholder’s Agreements with affiliates of each of the Principal Stockholders. Pursuant to each Stockholder’s Agreement, subject to the proper exercise of fiduciary duties of the Board, each Principal Stockholder is entitled to designate one director for nomination for election to the Board as a Class III director for so long as it beneficially owns, in the aggregate, at least 22,500,000 shares of our common stock that it owned on the date of its respective Stockholder’s Agreement. See “Certain Relationships and Related Party Transactions — Stockholder’s Agreements.” The initial designees of each of the Apollo Entities, Brookfield Entities and Oaktree Entities are Geoffrey Strong, Cyrus Madon and Jennifer Box, respectively.
The Board consists of a majority of directors who are not employees or officers of Vistra Energy and satisfy the independence requirements of the Commission and the NYSE. The following are the independent directors of the Board: Gavin R. Baiera, Jennifer Box, Jeff Hunter, Cyrus Madon and Geoff Strong.
Committees of the Board of Directors
The standing committees of the Board consist of an audit committee, a compensation committee and a nominating and corporate governance committee.
Audit Committee
The duties and responsibilities of the audit committee (the Audit Committee) include selecting the independent auditors to be nominated for ratification by the stockholders and reviewing the independence of such auditors, approving the scope and costs of the annual audit activities of the independent auditors, reviewing the audit results with the independent auditors and reviewing and monitoring our financial reporting and accounting practices and internal controls.
The members of the Audit Committee are Jeff Hunter, who is chair of the Audit Committee, and Jennifer Box. Jeff Hunter is independent, as defined under and required by the rules and regulations of the Commission
114
Table of Contents
and the NYSE, including Rule 10A-3(b)(i) under the Exchange Act. In accordance with Rule 10A-3 under the Exchange Act and Sections 303A.00, 303A.02, 303A.06 and 303A.07 of the NYSE’s listed company manual; the Board will remove Jennifer Box from the Audit Committee and appoint a second and third member of the Audit Committee within 90 days and one year, respectively, of the date on which this registration statement becomes effective, each of whom will be “independent” as defined under and required by such rules and regulations and will designate at least one member of the Audit Committee to be an “audit committee financial expert” as defined in Item 407(d)(5) of Regulation S-K, promulgated under the Securities Act.
The Board has adopted a written charter for the Audit Committee that is available on our website.
Nominating and Governance Committee
The duties and responsibilities of the nominating and governance committee include identifying and recommending potential candidates qualified to become members of the Board, recommending directors for appointment to Board committees and developing and recommending corporate governance guidelines and principles to apply to the Board.
The members of the Board’s nominating and governance committee are Cyrus Madon and Geoff Strong, each of whom is independent in accordance with the rules and regulations of the NYSE and the Commission.
The Board has adopted a written charter for the nominating and governance committee that is available on our website.
Compensation Committee
The duties and responsibilities of the compensation committee (the Compensation Committee) include reviewing the performance and compensation of our chief executive officer, consulting with the chief executive officer with respect to the compensation of other of our executives and key employees and administering our incentive compensation and other employee benefit plans. The Compensation Committee will also make recommendations to the Board with respect to the compensation of non-employee directors.
The member of the Compensation Committee is Gavin Baiera, who is independent in accordance with the rules and regulations of the NYSE and the Commission.
The Board has adopted a written charter for the Compensation Committee that is available on our website.
Compensation Committee Interlocks and Insider Participation
None of our directors who currently serve as members of the Compensation Committee is, or has at any time during the past year been, one of our officers or employees. None of our executive officers will serve as a member of the board of directors or Compensation Committee of any entity that has one or more executive officers serving as a member of the Board or the Compensation Committee. Additional information concerning transactions between us and entities affiliated with members of the Compensation Committee is included in this prospectus under the heading “Certain Relationships and Related Party Transactions.”
Code of Conduct
The Board has adopted a code of conduct applicable to our directors, officers and employees, including our Chief Executive Officer, Chief Financial Officer, Chief Accounting Officer and other senior officers, in accordance with applicable rules and regulations of the Commission and the NYSE. Our code of conduct is available on our website as of the time of our listing on the NYSE.
115
Table of Contents
Policy and Procedures Governing Related Party Transactions
The Board has adopted a written policy regarding transactions with related parties. See “Certain Relationships and Related Party Transactions — Review and Approval of Related Party Transactions.”
116
Table of Contents
Vistra Energy Corp. is a newly formed entity created in connection with Emergence, and the executive officers of Vistra Energy Corp. were appointed to such positions with effect as of the Effective Date. As a result, there is no relevant 2015 compensation disclosure relating to the executive officers of Vistra Energy Corp. Certain information relating to the compensation of the executive officers of Vistra Energy Corp. since the Effective Date is described below.
Compensation Discussion and Analysis
Executive Summary
Compensation Philosophy
We have a pay-for-performance compensation philosophy, which places an emphasis on pay-at-risk; a significant portion of an executive officer’s compensation is comprised of variable compensation. Our compensation program is intended to attract and motivate top-talent executive officers as leaders and compensate executive officers appropriately for their contribution to the attainment of our financial, operational and strategic objectives. In addition, we believe it is important to retain our top tier talent and strongly align their interests with our stakeholders by emphasizing incentive based compensation. To achieve the goals of our compensation philosophy, we believe that:
| • | the overall compensation program should emphasize variable compensation elements that have a direct link to overall corporate performance and stockholder value; |
| • | the overall compensation program should place an increased emphasis on pay-at-risk with increased responsibility; |
| • | the overall compensation program should attract, motivate and engage top-talent executive officers to serve in key roles; and |
| • | an executive officer’s individual compensation level should be based upon an evaluation of the financial and operational performance of that executive officer’s business unit or area of responsibility as well as the executive officer’s individual performance. |
Foundations of Key Components of our Compensation Programs
As a newly emerged standalone company, we implemented the following elements to our compensation programs intended to facilitate transition of our compensation practices towards those of a public company and further strengthen the alignment between our executives’ interests and those of our stakeholders in accordance with our compensation philosophy.
| Activity |
Foundational Element | |
| New Compensation Peer Group |
• Introduction of a compensation peer group comprised of nine energy industry competitors that are most comparable to Vistra Energy as a standalone company no longer in bankruptcy | |
| Adoption of 2016 Executive Annual Incentive Plan | • Adopted the EAIP on a post-emergence basis based on annual performance goals that are critical and relevant to achieving our strategic plan and create value for our stockholders | |
| Non-Recurring Emergence Equity Grants | • We awarded non-recurring emergence equity grants to our Named Executive Officers and other employees, comprised of a combination of stock options and RSUs to reinforce ownership in the new company, support retention of newly-appointed senior executives and align rewards with stockholders | |
117
Table of Contents
Performance Overview
In this section, we provide highlights of Vistra Energy’s performance in 2016, reflecting factors considered by the Compensation Committee in assessing variable pay outcomes for the Named Executive Officers.
Pay for Performance
The Compensation Committee designed the majority of our Named Executive Officers’ compensation to be linked directly to corporate, business unit (or area of responsibility) and company stock price performance. For example, each Named Executive Officer’s annual performance-based cash bonus is primarily based on the achievement of certain corporate and business unit financial and operational targets, and each Named Executive Officer’s non-recurring grants made in connection with the Emergence were awarded in the form of stock options and RSUs.
| CEO – Annualized 2016 Targeted Pay Mix |
Average Other Named Executive Officers – Annualized 2016 Targeted Pay Mix | |

|

| |
Performance Highlights
Highlights of our 2016 performance are summarized below. These, along with other factors discussed below, resulted in the annual bonus outcomes set forth below.
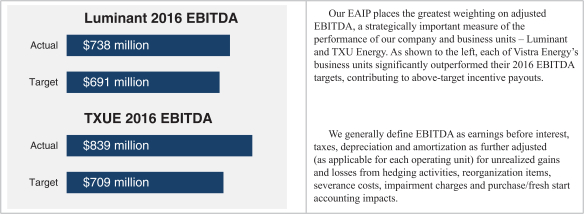
118
Table of Contents
Corporate Governance Practices
In this section, we provide details of the Corporate Governance framework, procedures and practices at Vistra Energy as they relate to Named Executive Officer compensation.
| Compensation Committee |
Governance Structure | |
| Our Compensation Committee consisted of two independent directors until the resignation of Michael Liebelson effective February 1, and is currently comprised of one independent director (Gavin R. Baiera), whose primary responsibility is to:
• Determine and oversee the compensation program of Vistra Energy, including making recommendations to the Board with respect to the adoption, amendment or termination of compensation and benefits plans, arrangements, policies and practices;
• Evaluate the performance of Vistra Energy’s executive officers;
• Approve compensation of the executive officers (other than the CEO) based on those evaluations, together with CEO recommendations; and
• Recommend CEO compensation to the full Board for approval. |
The Compensation Committee’s charter can be found on our website. |

Advisors to the Compensation Committee
During the 2016 Stub Period, Willis Towers Watson, who advised our Predecessor’s compensation committee as well, provided ongoing advisory services to Vistra Energy and its Compensation Committee on various aspects of its overall compensation and benefits practices, including, but not limited to, the development of the going forward compensation structure and the emergence equity program.
In accordance with the Compensation Committee’s charter, the Compensation Committee determined that Willis Towers Watson is sufficiently independent to appropriately advise the Compensation Committee on compensation matters and that its relationship with Willis Towers Watson does not give rise to any conflict of interest. Going forward, the Compensation Committee expects that it will continue to engage compensation consultants when and as appropriate, and will conduct an assessment of consultants’ independence prior to any such engagement.
119
Table of Contents
Compensation Philosophy
In this section, we provide details of the Named Executive Officer compensation framework, practices and outcomes for the 2016 Stub Period
Compensation Philosophy
Our compensation program is intended to attract and motivate top-talent executive officers as leaders and compensate executive officers appropriately for their contribution to the attainment of our financial, operational and strategic objectives. In addition, we believe it is important to retain our top tier talent and strongly align their interests with our stakeholders by emphasizing incentive based compensation. We utilize the following elements of compensation to achieve these objectives:
| Compensation Element |
Summary and Linkage to Philosophy | |
| Base Salary |
✓ A fixed element of compensation to provide a stable source of income
✓ Provides market competitive compensation to attract and retain talent | |
| Annual Incentive |
✓ A cash-based award that encourages executives to focus on specific corporate, business unit and individual performance goals
✓ Is earned only if threshold financial, operational and/or strategic objectives are met | |
| Stock Options |
✓ Rewards long-term stockholder value creation as options only provide value when the stock price appreciates
✓ Provides wealth-building opportunity and aligns executives with stockholder interests | |
| Restricted Stock Units |
✓ Rewards long-term stockholder value creation
✓ Enhances executive stock ownership and promotes retention | |
| Benefits |
✓ Keeps program competitive and provides protection for executives | |
| Perquisites |
✓ Perquisites are limited in amount and use | |
Compensation Determination Process
Use of Market Data
Vistra Energy establishes target compensation levels that are consistent with market practice and internal equity considerations (including position, responsibility and contribution) relative to base salaries, annual incentives and long-term incentives, as well as with the Compensation Committee’s assessment of the appropriate pay mix for a particular position. In order to gauge the competitiveness of its compensation programs, the Company reviews compensation practices and pay opportunities from energy industry survey data, as well as from a selection of publicly-traded peer companies. The Company attempts to position itself to attract and retain qualified senior executives in the face of competitive pressures in its relevant labor markets.
Specifically during the 2016 Stub Period, the Company used information regarding the pay practices of energy industry companies provided by our compensation consultant, regressed to Vistra Energy’s revenue size.
120
Table of Contents
We believe that revenue is an appropriate indicator of the size and complexity of an organization, which should be considered in determining compensation levels. The compensation data resulting from this analysis was a significant factor considered by the Compensation Committee with respect to its executive compensation decisions for our Named Executive Officers.
During the 2016 Stub Period, we also utilized a new compensation peer group as an additional reference point when determining executive compensation. This peer group consisted of a select group of companies that our Compensation Committee believes are representative of the talent market in which we compete. Our compensation peer group consisted of the following companies for the 2016 Stub Period:
| The AES Corporation | Calpine Corporation | Dynegy Inc. | ||
| Entergy Corporation | FirstEnergy Corp. | NRG Energy, Inc. | ||
| PG&E Corporation | Public Service Enterprise Group Incorporated | Talen Energy Corporation |
The Compensation Committee does not target any particular level of total compensation or individual component of compensation against the peer group; rather the Compensation Committee considers the range of total compensation provided by our peers, together with information from published surveys, in determining the appropriate mix and level of total compensation for our executives.
Compensation of the Chief Executive Officer
In determining the compensation of the Chief Executive Officer (CEO), the Compensation Committee annually follows a thorough and detailed process. At the end of each year, the Compensation Committee reviews a self-assessment prepared by the CEO regarding his performance and the performance of our businesses and meets (with and without the CEO) to evaluate and discuss his performance and the performance of our businesses.
While the Compensation Committee tries to ensure that a substantial portion of the CEO’s compensation is directly linked to his performance and the performance of our businesses, the Compensation Committee also seeks to set his compensation in a manner that is competitive with compensation for similarly performing executive officers with similar responsibilities in companies we consider our peers.
As discussed under “—Employment Agreements” below, we have entered into an employment agreement with our current CEO, Curtis A. Morgan, which addresses certain elements of his compensation and benefit package.
Compensation of Other Named Executive Officers
In determining the compensation of each of our Named Executive Officers (other than the CEO), the Compensation Committee seeks the input of the CEO. At the end of each year, the CEO reviews a self-assessment prepared by each Named Executive Officer and assesses the Named Executive Officer’s performance against business unit (or area of responsibility) and individual goals and objectives. The Compensation Committee and the CEO then review the CEO’s assessments and, in that context, the Compensation Committee approves the compensation for each Named Executive Officer.
Role of the Compensation Consultant
To add rigor in the review process and to inform the Compensation Committee of market trends, the Compensation Committee engages the services of Willis Towers Watson, an independent executive compensation consultant, to analyze our executive compensation structure and plan designs, and to assess whether the compensation program is competitive and supports the Compensation Committee’s goal to align the
121
Table of Contents
interests of executive officers with those of stockholders. Willis Towers Watson may also directly provide the Compensation Committee with market data, which the Compensation Committee references when determining compensation for executive officers. The Compensation Committee has authorized Willis Towers Watson to interact with the Company’s management, as needed, on behalf of the Compensation Committee.
The Compensation Committee has the sole authority to approve the independent compensation consultant’s fees and terms of the engagement. Thus, the Compensation Committee annually reviews its relationship with, and assesses the independence of, Willis Towers Watson to ensure executive compensation consulting independence.
Base Salary
We believe base salary should consider the scope and complexity of an executive officer’s position and the level of responsibility required to perform his or her job. We also believe that a competitive level of base salary is required to attract, motivate and retain qualified talent. We want to ensure our cash compensation is competitive and sufficient to incent executive officers to remain with us, recognizing our high performance expectations across a broad set of operational, financial, customer service and community-oriented goals and objectives.
The Compensation Committee regularly reviews base salaries and periodically uses independent compensation consultants to ensure the base salaries are market-competitive. The Compensation Committee may also review an executive officer’s base salary from time to time during a year, including if the executive officer is given a promotion or if his or her responsibilities are significantly modified.
Annual Incentive Plan
Summary
The EAIP provides an annual performance-based cash bonus for the successful attainment of certain financial and operational performance targets that are established annually by the Compensation Committee. Under the terms of the EAIP, performance against these targets, which are set at challenging levels to incentivize exceptional performance (while at the same time balancing the needs for safety and investment in our business), drives bonus funding.
Performance Framework
As a general matter, target level performance is based on Vistra Energy’s board-approved financial and operational plan (the Financial Plan) for each upcoming year. The Compensation Committee sets high expectations for our executive officers and therefore annually selects a target performance level that constitutes above average performance for the business, which the Compensation Committee expects the business to achieve during the upcoming year. Threshold and superior levels are for performance levels that are below or above Financial Plan-based expectations, respectively. Based on the level of attainment of these performance targets, an aggregate EAIP funding percentage amount for all participants is determined. The aggregate award to any participant in any given year is subject to a cap equal to 200% of such participant’s target bonus for the corresponding year.
Target Opportunity (as a % of Salary)
Performance payouts on financial metrics are equal to 100% if the target amount is achieved for a particular metric, 50% if the threshold amount is achieved and 200% if the superior amount is achieved.
122
Table of Contents
Actual performance payouts are interpolated on a linear basis, as applicable. These results are then adjusted by an individual performance modifier as described below.
| 2016 Annual Incentive Plan Target Opportunities |
Target %(1) |
|||
| Curtis A. Morgan – Chief Executive Officer |
100% | |||
| James A. Burke – EVP & Chief Operating Officer |
90% | |||
| J. William Holden – EVP & Chief Financial Officer |
90% | |||
| Carrie Lee Kirby – EVP & Chief Administrative Officer |
70% | |||
| Sara Graziano – SVP Corporate Development & Strategy |
70% | |||
| (1) Described as a percentage of base salary |
||||
Financial and Operational Performance Targets for 2016
The following table provides a summary of the weight given to the various business unit scorecards, which constitute the performance targets under the EAIP, for each of our Named Executive Officers.
| Weight | ||||||||||||||||||||
| Name |
Business Services Scorecard Multiplier(1) |
Luminant Scorecard Multiplier |
TXU Energy Scorecard Multiplier |
Total | Performance(2) | |||||||||||||||
| Curtis A. Morgan |
100 | % | — | — | 100 | % | 174 | % | ||||||||||||
| James A. Burke |
25 | % | — | 75 | % | 100 | % | 183 | % | |||||||||||
| J. William Holden(3) |
N/A | — | — | N/A | N/A | |||||||||||||||
| Carrie Lee Kirby |
100 | % | — | — | 100 | % | 174 | % | ||||||||||||
| Sara Graziano |
100 | % | — | — | 100 | % | 174 | % | ||||||||||||
| (1) | Business Services represents an equal weighting of the Luminant and TXU Energy Scorecards. |
| (2) | Performance for the 2016 Stub Period was based upon the combined performance of our Predecessor pre-Emergence and Vistra Energy post-Emergence. |
| (3) | Mr. Holden was not eligible for a bonus under the EAIP plan in 2016. He did, however, receive a discretionary bonus in accordance with his employment agreement. See “Summary Compensation Table – 2016” and “—Employment Agreements—Mr. Holden’s Employment Agreement” below. |
The following table provides a summary of the performance targets included in the Luminant Scorecard Multiplier for our Named Executive Officers:
| Named Executive Officer Luminant Scorecard Metrics |
Weight | Performance | Payout | |||||||||
| Luminant Adjusted EBITDA |
50.0 | % | 150 | % | 75 | % | ||||||
| Nuclear Available Generation (GWh) |
7.5 | % | 146 | % | 11 | % | ||||||
| Coal Available Generation (GWh) |
12.5 | % | 200 | % | 25 | % | ||||||
| Total Cost (O&M/SG&A/Capex) ($mm) |
30.0 | % | 166 | % | 50 | % | ||||||
|
|
|
|
|
|||||||||
| Total |
100.0 | % | 161 | % | ||||||||
|
|
|
|
|
|||||||||
123
Table of Contents
The following table provides a summary of the performance targets included in the TXU Energy Scorecard Multiplier for our Named Executive Officers:
| Named Executive Officer TXU Energy Scorecard Metrics |
Weight | Performance | Payout | |||||||||
| TXU Energy Adjusted EBITDA ($ mm) |
40.0 | % | 200 | % | 80 | % | ||||||
| TXU Energy Total Costs ($ mm) |
20.0 | % | 200 | % | 40 | % | ||||||
| Contribution Margin ($/MWh) |
15.0 | % | 200 | % | 30 | % | ||||||
| Residential Ending Customer Count (000’s) |
10.0 | % | 130 | % | 13 | % | ||||||
| TXU Energy Customer Experience |
15.0 | % | 160 | % | 24 | % | ||||||
|
|
|
|
|
|||||||||
| Total |
100.0 | % | 187 | % | ||||||||
|
|
|
|
|
|||||||||
When establishing the foregoing performance targets, the Compensation Committee set targets that it believed (a) were challenging to achieve and reasonable and (b) fairly incentivized EAIP participants. By setting the foregoing targets, the Compensation Committee established what it believed were stretch goals that would incentivize and reward exceptional employee performance without any guarantee that the Company would meet or exceed any such metrics in the prevailing business environment. In addition, certain of the performance metrics chosen by the Compensation Committee, most notably adjusted EBITDA (the most heavily weighted metric), are subject to numerous risks, including, but not limited to, market and commodity price volatility, weather, retail competition and regulatory oversight, making attainment of such metrics difficult and unpredictable and that require management to perform consistently strong in a complex and volatile power market.
Individual Performance Modifier
After approving the actual performance against the applicable targets under the EAIP, and on a basis independent of such target performance calculations, the Compensation Committee and the CEO review the performance of each of our executive officers on an individual and comparative basis. Based on this review, which includes an analysis of both objective and subjective criteria, as determined by the Compensation Committee in its sole discretion, including the CEO’s recommendations (with respect to all executive officers other than himself), the Compensation Committee approves an individual performance modifier for each executive officer.
Under the terms of the EAIP, the individual performance modifier can range from an outstanding rating (150%) to an unacceptable rating (0%). To calculate an executive officer’s final annual cash incentive bonus, the executive officer’s corporate/business unit payout percentages are multiplied by the executive officer’s target incentive level, which is computed as a percentage of annualized base salary, and then by the executive officer’s individual performance modifier, subject to the aggregate cap of 200% of such executive officer’s annual target bonus.
Actual Awards
The following table provides a summary of the 2016 performance-based cash bonus for each Named Executive Officer under the EAIP, and the discussion below highlights the key factors used in determining the final awards, including with respect to each Named Executive Officer’s individual performance modifier.
Mr. Morgan officially took the role of CEO on October 3, 2016. Mr. Morgan was able to quickly impact the business, with an assessment of the leadership team and key business processes. Within the first 90 days of his tenure, Mr. Morgan established his team, primarily from existing talent, developed a go to market strategy, led the team to implement effective cost reductions and reorganization around the Emergence strategy and restructure the Company’s support cost functions, conducted a debt offering, produced and gained approval of the 2017 budget, put governance processes in place and began to develop a strong culture. In addition, he filled two key executive team positions, CFO and SVP of Corporate Development, both key to the future success of Vistra Energy. Given these and other significant achievements, the Compensation Committee approved an individual performance modifier that increased Mr. Morgan’s incentive award.
124
Table of Contents
Mr. Burke took on a new role at Emergence, EVP and COO, leading not only the retail business, but also the wholesale generation business. Mr. Burke was able to utilize his strong credibility across the company to bring the team together to retain key employees and focus the Company on the day to day business following exit from bankruptcy and the support cost restructuring and add value. With his leadership, the team was able to focus on creating value, leading to a strong finish to 2016. Given these and other significant achievements, the Compensation Committee approved an individual performance modifier that increased Mr. Burke’s incentive award.
Ms. Kirby took a new role at Vistra Energy that includes the Human Resources, communications, community affairs, facilities and corporate security organizations. Ms. Kirby played a key role in the design and implementation of the cost initiatives and restructuring that occurred quickly after Emergence. Ms. Kirby also assisted Mr. Morgan in staffing key leadership roles on his team. Given these and other significant achievements, the Compensation Committee approved an individual performance modifier that increased Ms. Kirby’s incentive award.
Ms. Graziano joined the team immediately at Emergence. She quickly created a new high performing development organization. Ms. Graziano plays a critical role on the management team by leading analysis of a variety of business opportunities across Vistra. Given these and other significant achievements, the Compensation Committee approved an individual performance modifier that increased Ms. Graziano’s incentive award.
| Name |
Target (% of salary) |
Target Award ($ Value) |
Actual Award ($) |
|||||||||
| Curtis A. Morgan |
100 | % | 950,000 | 1,900,000 | ||||||||
| James A. Burke |
90 | % | 675,000 | 1,228,907 | ||||||||
| J. William Holden |
90 | % | 531,000 | N/A | ||||||||
| Carrie Lee Kirby |
70 | % | 301,000 | 539,939 | ||||||||
| Sara Graziano |
70 | % | 280,000 | 530,315 | ||||||||
Awards under the 2016 Omnibus Incentive Plan
Overview of Non-Recurring Emergence Equity Grants
During the 2016 Stub Period, in connection with Emergence, the Board awarded non-recurring equity grants to our Named Executive Officers with 50% of the target value of each named executive officer’s long-term incentive award in the form of stock options and 50% in the form of RSUs.
These awards were intended to serve as a retention and motivational tool and align our executive officers with the interests of our stockholders. Award sizes were determined based on an evaluation of internal pay equity, and compensation levels for comparable positions among peer companies, and the energy utility industry. Importantly, we and the Board, considered the size of the emergence equity grants, annualized over the vesting period, and in the context of total direct compensation, compared to market practice in assessing their reasonableness as well. We also reviewed and considered market data for equity practices at other emerged companies from both inside and outside the energy sector with respect to the design of the program and the grant values. In doing so, we found these type of equity programs are common practice for recently emerged companies.
| Non-Recurring Emergence Equity Grants |
Total Grant Value |
|||
| Curtis A. Morgan – Chief Executive Officer |
$ | 5,000,000 | ||
| James A. Burke – EVP & Chief Operating Officer |
$ | 4,000,000 | ||
| J. William Holden – EVP & Chief Financial Officer |
$ | 2,500,000 | ||
| Carrie Lee Kirby – EVP & Chief Administrative Officer |
$ | 1,600,000 | ||
| Sara Graziano – SVP Corporate Development & Strategy |
$ | 1,200,000 | ||
125
Table of Contents
Awards Granted in the 2016 Stub Period
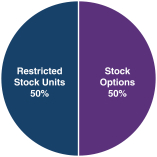
Stock Options (50% of Emergence Equity Grants)
50% of the targeted non-recurring emergence equity value was granted in the form of non-qualified stock options that vest ratably over a four-year period and expire after 10 years. The exercise price of each option was the closing price of our common stock on the date of grant as reported on the OTCQX U.S. market. The number of options granted was determined by dividing the targeted stock option value for each executive by the value of each option, which was computed using the Black-Scholes option-pricing model using the same assumptions that we use in calculating the compensation expense attributable to such grants under Financial Accounting Standards Board Accounting Standards Codification Topic 718 (ASC 718).
Restricted Stock Units (50% of Emergence Equity Grants)
50% of the targeted non-recurring emergence equity value was granted in the form of RSUs that vest ratably over a four year period. The number of shares of RSUs awarded to each executive was determined by dividing the targeted RSU value for each executive by the closing price of our common stock on the grant date as reported on the OTCQX U.S. market in accordance with ASC 718.
Non-Recurring Emergence Equity Awards
| Name |
# of Stock Options |
Stock Option $ Value |
# of Restricted Stock Units |
Restricted Stock Unit Value |
Total Value $ |
|||||||||||||||
| Curtis A. Morgan |
526,316 | $ | 2,500,000 | 152,905 | $ | 2,500,000 | $ | 5,000,000 | ||||||||||||
| James A. Burke |
421,053 | $ | 2,000,000 | 122,324 | $ | 2,000,000 | $ | 4,000,000 | ||||||||||||
| J. William Holden |
281,532 | $ | 1,250,000 | 86,505 | $ | 1,250,000 | $ | 2,500,000 | ||||||||||||
| Carrie Lee Kirby |
168,421 | $ | 800,000 | 48,930 | $ | 800,000 | $ | 1,600,000 | ||||||||||||
| Sara Graziano |
126,316 | $ | 600,000 | 36,697 | $ | 600,000 | $ | 1,200,000 | ||||||||||||
Future Equity Awards
In the future, the Compensation Committee may provide additional grants and forms of equity to drive certain aspects of our operating and financial performance as the Compensation Committee sees fit, and as supported by market data and the executive’s performance. The Compensation Committee believes that long-term incentive compensation is an important component of our compensation program because it has the potential for retaining and motivating executives, aligning executives’ financial interests with the interests of stockholders, and rewarding the achievement of our long-term strategic and financial goals.
Benefits and Perquisites
Benefits
Our executive officers generally have the opportunity to participate in certain of our broad-based employee compensation plans, including our Thrift (401(k)) Plan (the Thrift Plan), and health and welfare plans. Please refer to the footnotes to the Summary Compensation Table below.
126
Table of Contents
Perquisites
We provided our executives with certain perquisites, including financial planning services, during the 2016 Stub Period.
Employment Arrangements and Termination Provisions
We have entered into employment agreements with each of our Named Executive Officers. Each of the employment agreements provides that certain payments and benefits will be paid upon the expiration or termination of the agreement under various circumstances, including termination without cause, resignation for good reason and termination of employment within a fixed period of time following a change in control of Vistra Energy.
We believe these provisions are important in order to attract, motivate and retain the caliber of executive officers that our business requires and provide incentive for our executive officers to fully consider potential changes that are in our and our stockholders’ best interest, even if such changes could result in the executive officers’ termination of employment.
For a description of the applicable provisions in the employment agreements of our Named Executive Officers and a summary of certain potential termination or change in control payments, see “—Employment Agreements” and “—Potential Payments upon Termination or Change in Control” below.
Other Compensation Policies
Insider Trading Policy
Under our insider trading policy, members of the Board and all of our officers and employees shall not engage in any direct or derivative transactions involving any securities of Vistra Energy, including, hedging transactions, pledges of Vistra securities as collateral or short sales thereof.
Accounting, Tax and Other Considerations
Accounting Considerations
We follow ASC 718 for our stock-based compensation awards, and the compensation that we pay to our executives is expensed in our financial statements as required by U.S. GAAP.
As one of many factors, our compensation committee considers the financial statement impact in determining the amount of, and allocation among the elements of, executive compensation.
Income Tax Considerations
Section 162(m) of the Code limits the tax deductibility by a publicly-held company of compensation in excess of $1 million paid to the CEO or any other of its three most highly compensated executive officers other than the principal financial officer. Because Vistra Energy was not subject to Section 162(m) of the Code in 2016, it was not a factor in the Company’s 2016 compensation decisions.
Risk Assessment
Our management team annually initiates Vistra Energy’s internal risk review and assessment process for our compensation policies and practices by assessing, among other things: (1) the mix of cash and equity payouts at various compensation levels; (2) the performance time horizons used by our plans; (3) the use of multiple financial and operational performance metrics that are readily monitored and reviewed; (4) the incorporation of
127
Table of Contents
both operational and financial goals and individual performance modifiers; (5) the inclusion of maximum caps and other plan-based mitigants on the amount of our awards; and (6) multiple levels of review and approval of awards (including approval of our Compensation Committee with respect to awards to executive officers and awards to other employees that exceed monetary thresholds). Following their assessment, our management team prepares a report, which is provided to Vistra Energy’s Compensation Committee for review. The Vistra Energy Compensation Committee reviews the report and provides it to the Audit Committee. Vistra Energy’s management and Compensation Committee have determined that the risks arising from Vistra Energy’s compensation policies and practices are not reasonably likely to have a material adverse effect on Vistra Energy.
Say on Pay Vote
Because Vistra Energy has not yet held an annual stockholders meeting, we are not yet required to hold say-on-pay votes concerning the compensation of our Named Executive Officers.
Summary Compensation Table – 2016
The following table provides information for the 2016 Stub Period regarding the aggregate compensation paid to our Named Executive Officers.
| Name and Position |
Year | Salary ($) |
Bonus ($)(1) |
Stock Awards ($)(2) |
Option Awards ($)(3) |
Non-Equity Incentive Plan Compensation ($)(4) |
Change in Pension Value and Non-qualified Deferred Compensation ($) |
All Other Compensation ($)(5) |
Total ($) |
|||||||||||||||||||||||||||
| Curtis A. Morgan President & CEO of Vistra Energy |
2016 | 233,846 | — | 2,500,000 | 2,500,000 | 1,900,000 | — | 17,056 | 7,150,902 | |||||||||||||||||||||||||||
| James A. Burke EVP and Chief Operating Officer of Vistra Energy |
2016 | 184,615 | 1,000,000 | 2,000,000 | 2,000,000 | 1,228,907 | — | 2,529 | 6,416,051 | |||||||||||||||||||||||||||
| J. William Holden EVP and Chief Financial Officer of Vistra Energy |
2016 | 45,385 | 150,000 | 1,250,000 | 1,250,000 | — | — | 3,166 | 2,698,551 | |||||||||||||||||||||||||||
| Carrie Lee Kirby EVP and Chief Administrative Officer of Vistra Energy |
2016 | 105,846 | 200,000 | 800,000 | 800,000 | 539,939 | — | 2,529 | 2,448,314 | |||||||||||||||||||||||||||
| Sara Graziano SVP, Corporate Development and Strategy of Vistra Energy |
2016 | 98,462 | — | 600,000 | 600,000 | 530,315 | — | 13,454 | 1,842,230 | |||||||||||||||||||||||||||
| (1) | The amounts reported in this column for Mr. Burke and Ms. Kirby represent discretionary cash bonuses that the relevant executive officer earned in 2016. The amount reported in this column for Mr. Holden is an agreed upon amount pursuant to his employment agreement that was paid in lieu of EAIP for 2016. |
| (2) | The amounts reported as “Stock Awards” represent the grant date fair value (as computed in accordance with ASC 718) of certain RSUs that were granted to our executive officers. |
| (3) | The amounts reported as “Option Awards” represent the grant date fair value (as computed in accordance with ASC 718) of certain stock options that were granted to our executive officers. |
| (4) | The amounts to be reported as “Non-Equity Incentive Plan Compensation” were earned by the respective executive officers in 2016 under the EAIP. |
128
Table of Contents
| (5) | The amounts for the 2016 Stub Period reported as “All Other Compensation” are attributable to the Named Executive Officer’s receipt of compensation as described in the following table: |
| Name(a) |
Matching Contribution to Thrift Plan(b) |
Financial Planning(c) |
Relocation Expenses |
Total | ||||||||||||
| Curtis A. Morgan |
6,577 | — | 10,479 | 17,056 | ||||||||||||
| James A. Burke |
— | 2,529 | — | 2,529 | ||||||||||||
| J. William Holden |
— | — | 3,166 | 3,166 | ||||||||||||
| Carrie Lee Kirby |
— | 2,529 | — | 2,529 | ||||||||||||
| Sara Graziano |
308 | — | 13,146 | 13,454 | ||||||||||||
| (a) | For purposes of preparing this table, all perquisites are valued on the basis of the actual cost to Vistra Energy. |
| (b) | Our Thrift Plan allows participating employees to contribute a portion of their regular salary or wages to the plan. Under the Thrift Plan, Vistra Energy matches a portion of an employee’s contributions. This matching contribution is 100% of each Named Executive Officer’s contribution up to 6% of the Named Executive Officer’s salary up to the annual IRS compensation limit. All matching contributions are invested in Thrift Plan investments as directed by the participant. |
| (c) | We offer to pay for our executive officers to receive financial planning services. This service is intended to support them in managing their financial affairs, which we consider especially important given the high level of time commitment and performance expectation required of our executive officers. Furthermore, we believe that such service helps ensure greater accuracy and compliance with individual tax regulations by our executive officers. |
Grants of Plan-Based Awards – 2016
The following table sets forth information regarding grants of compensatory awards to our Named Executive Officers for the 2016 Stub Period.
| Estimated Future Payouts Under Non-Equity Incentive Plan Awards (1) |
All other Stock Awards: Numbers of Shares of Stock or Units (#) |
All other Option Awards: Number of Securities Underlying Options (#) |
Exercise or Base Price of Option Awards ($/Sh) |
Grant Date Fair Value of Stock and Option Awards |
||||||||||||||||||||||||||||
| Name |
Approval/ Grant Date |
Threshold ($) |
Target ($) |
Maximum ($) |
||||||||||||||||||||||||||||
| Curtis A. Morgan |
10/03/16 | — | 950,000 | 1,900,000 | — | — | — | — | ||||||||||||||||||||||||
| 10/11/16 | — | — | — | 152,905 | — | — | 2,500,000 | |||||||||||||||||||||||||
| 10/11/16 | — | — | — | — | 526,316 | 14.03 | 2,500,000 | |||||||||||||||||||||||||
| James A. Burke |
10/03/16 | — | 675,000 | 1,228,907 | — | — | — | — | ||||||||||||||||||||||||
| 10/11/16 | — | — | — | 122,324 | — | — | 2,000,000 | |||||||||||||||||||||||||
| 10/11/16 | — | — | — | — | 421,053 | 14.03 | 2,000,000 | |||||||||||||||||||||||||
| J. William Holden |
10/03/16 | — | — | — | — | — | — | — | ||||||||||||||||||||||||
| 12/05/16 | — | — | — | 86,505 | — | — | 1,250,000 | |||||||||||||||||||||||||
| 12/05/16 | — | — | — | — | 281,532 | 12.13 | 1,250,000 | |||||||||||||||||||||||||
| Carrie Lee Kirby |
10/03/16 | — | 301,000 | 539,939 | — | — | — | — | ||||||||||||||||||||||||
| 10/11/16 | — | — | — | 48,930 | — | — | 800,000 | |||||||||||||||||||||||||
| 10/11/16 | — | — | — | — | 168,421 | 14.03 | 800,000 | |||||||||||||||||||||||||
| Sara Graziano |
10/03/16 | — | 280,000 | 560,000 | — | — | — | — | ||||||||||||||||||||||||
| 10/11/16 | — | — | — | 36,697 | — | — | 600,000 | |||||||||||||||||||||||||
| 10/11/16 | — | — | — | — | 126,316 | 14.03 | 600,000 | |||||||||||||||||||||||||
| (1) | Represents the target and maximum amounts available under the EAIP for 2016 for each Named Executive Officer. Each payment is reported in the Summary Compensation Table in the year earned under the heading “Non-Equity Incentive Plan Compensation,” and is described above under the section entitled “Annual Incentive Plan”. |
For a discussion of certain material terms of the employment agreements with the Named Executive Officers, please see “—Employment Agreements” below.
129
Table of Contents
Outstanding Equity Awards at Fiscal Year-End – 2016
The following table sets forth information regarding outstanding equity awards to our Named Executive Officers at fiscal year-end for the 2016 Stub Period.
| Option Awards | Stock Awards | |||||||||||||||||||||||||||||||||||
| Name |
Number of Securities Underlying Unexercised Options (#) Exercisable |
Number of Securities Underlying Unexercised Options (#) Unexercisable |
Equity Incentive Plan Awards: Number of Securities Underlying Unexercised Unearned Options (#) |
Option Exercise Price ($)(4) |
Option Expiration Date |
Number of Shares or Units of Stock that have not Vested (#) |
Market Value of Shares or Units of Stock that have not Vested ($)(1) |
Equity Incentive Plan Awards: Number of Unearned Shares, Units or other Rights that have not Vested (#) |
Equity Incentive Plan Awards: Market or Payout Value of Unearned Shares, Units or other Rights that have not Vested ($) |
|||||||||||||||||||||||||||
| Curtis A. Morgan |
— | 526,316 | (2) | — | 14.03 | 10/11/26 | 152,905 | (2) | 2,370,028 | — | — | |||||||||||||||||||||||||
| James A. Burke |
— | 421,053 | (2) | — | 14.03 | 10/11/26 | 122,324 | (2) | 1,896,022 | — | — | |||||||||||||||||||||||||
| J. William Holden |
— | 281,532 | (3) | — | 12.13 | 12/05/26 | 86,505 | (3) | 1,340,828 | — | — | |||||||||||||||||||||||||
| Carrie Lee Kirby |
— | 168,421 | (2) | — | 14.03 | 10/11/26 | 48,930 | (2) | 758,415 | — | — | |||||||||||||||||||||||||
| Sara Graziano |
— | 126,316 | (2) | — | 14.03 | 10/11/26 | 36,697 | (2) | 568,804 | — | — | |||||||||||||||||||||||||
| (1) | The amount listed in this column represents the product of the closing market price of the Company’s stock on December 30, 2016 ($15.50) as reported on the OTCQX U.S. market, multiplied by the number of shares of stock subject to the award. |
| (2) | Granted on October 11, 2016 and vests ratably on the first four anniversaries of October 3, 2016. |
| (3) | Granted on December 5, 2016 and vests ratably on the first four anniversaries of October 3, 2016. |
| (4) | In March 2017, the Compensation Committee approved adjusting the strike price of all options by the amount of the 2016 Special Dividend pursuant to the anti-dilutive provisions in the 2016 Incentive Plan (as defined in “Executive Compensation — 2016 Omnibus Incentive Plan”). The numbers in the table above include the downward adjustment. |
Potential Payments upon Termination or Change in Control
The following tables and narrative below describe payments to each of the Named Executive Officers (or, as applicable, enhancements to payments or benefits) in the event of his or her termination, including if such termination is voluntary, for cause, as a result of death, as a result of disability, without cause or for good reason or in connection with a change in control. Additional narrative descriptions of such employment agreements and such termination payments are included under “—Employment Agreements” below.
Contingent Payments upon Termination
As of December 31, 2016, each of Messrs. Morgan, Burke and Holden and Mses. Kirby and Graziano had employment agreements with change in control and severance provisions.
With respect to each Named Executive Officer’s employment agreement, a change in control is generally defined as (i) a transaction that results in the acquisition of 30% or more of our common stock, (ii) a change in the composition of the Board such that members of the Board during any consecutive 12-month period cease to constitute a majority of the Board, (iii) the approval by the stockholders of the Company of a plan of complete dissolution or liquidation of the Company, or (iv) a transaction that results in a merger or sale of substantially all of our assets or capital stock to another person who is not an affiliate of the Company.
The following tables describe payments to which each Named Executive Officer is entitled under his or her employment agreement assuming termination of employment as of December 31, 2016. Additional narrative descriptions of such employment agreements and such termination payments is included under “—Employment Agreements” below.
130
Table of Contents
Potential Payments to Mr. Morgan upon Termination as of December 31, 2016 (see “—Employment Agreements—Mr. Morgan’s Employment Agreement” below)
| Benefit |
Voluntary ($) |
For Cause ($) |
Death ($) | Disability ($) |
Without Cause Or For Good Reason ($) |
Without Cause Or For Good Reason In Connection With Change in Control ($) |
||||||||||||||||||
| Cash Severance |
— | — | — | — | 3,800,000 | 6,631,000 | ||||||||||||||||||
| EAIP(1) |
— | — | 1,650,720 | 1,650,720 | 1,650,720 | — | ||||||||||||||||||
| Unvested RSU Awards(2) |
— | — | 681,193 | 681,193 | 681,193 | 2,724,771 | ||||||||||||||||||
| Unvested Stock Options(3) |
— | — | 193,421 | 193,421 | 193,421 | 773,685 | ||||||||||||||||||
| Health & Welfare: |
— | — | — | — | — | — | ||||||||||||||||||
| - Medical/COBRA |
— | — | — | — | 3,317 | 3,317 | ||||||||||||||||||
| - Dental/COBRA |
— | — | — | — | 1,061 | 1,061 | ||||||||||||||||||
| - Vision/COBRA |
— | — | — | — | 492 | 492 | ||||||||||||||||||
| Totals |
0 | 0 | 2,525,334 | 2,525,334 | 6,330,205 | 10,134,327 | ||||||||||||||||||
| (1) | Calculated as target award multiplied by company performance. |
| (2) | The value of unvested RSU awards represents the sum of (i) the closing price of our common stock on December 30, 2016 ($15.50), as reported by the OTCQX U.S. market of all shares of stock subject to RSUs that would vest upon the triggering event, and (ii) the value of the 2016 Special Dividend ($2.32 per share) attributable to all shares of stock subject to RSUs that would vest upon the triggering event. |
| (3) | The value of unvested stock options represents the difference in the exercise price and the closing price of our stock on December 30, 2016 ($15.50) of all stock options that would vest upon the triggering event. |
Potential Payments to Mr. Burke upon Termination as of December 31, 2016 (see “—Employment Agreements—Mr. Burke’s Employment Agreement” below)
| Benefit |
Voluntary ($) | For Cause ($) | Death ($) | Disability ($) | Without Cause Or For Good Reason ($) |
Without Cause Or For Good Reason In Connection With Change in Control ($) |
||||||||||||||||||
| Cash Severance |
— | — | — | — | 2,850,000 | 4,935,750 | ||||||||||||||||||
| EAIP(1) |
— | — | 1,238,355 | 1,238,355 | 1,238,355 | — | ||||||||||||||||||
| Unvested RSU Awards(2) |
— | — | 544,954 | 544,954 | 544,954 | 2,179,816 | ||||||||||||||||||
| Unvested Stock Options(3) |
— | — | 154,737 | 154,737 | 154,737 | 618,948 | ||||||||||||||||||
| Health & Welfare: |
— | — | — | — | — | — | ||||||||||||||||||
| - Medical/COBRA |
— | — | — | — | 3,317 | 3,317 | ||||||||||||||||||
| - Dental/COBRA |
— | — | — | — | 1,061 | 1,061 | ||||||||||||||||||
| - Vision/COBRA |
— | — | — | — | 492 | 492 | ||||||||||||||||||
| Totals |
0 | 0 | 1,938,046 | 1,938,046 | 4,792,917 | 7,739,385 | ||||||||||||||||||
| (1) | Calculated as target award multiplied by company performance. |
| (2) | The value of unvested RSU awards represents the sum of (i) the closing price of our common stock on December 30, 2016 ($15.50), as reported by the OTCQX U.S. market of all shares of stock subject to RSUs that would vest upon the triggering event, and (ii) the value of the 2016 Special Dividend ($2.32 per share) attributable to all shares of stock subject to RSUs that would vest upon the triggering event. |
| (3) | The value of unvested stock options represents the difference in the exercise price and the closing price of our stock on December 30, 2016 ($15.50) of all stock options that would vest upon the triggering event. |
131
Table of Contents
Potential Payments to Mr. Holden upon Termination as of December 31, 2016 (see “—Employment Agreements—Mr. Holden’s Employment Agreement” below)
| Benefit |
Voluntary ($) | For Cause ($) | Death ($) | Disability ($) | Without Cause Or For Good Reason ($) |
Without Cause Or For Good Reason In Connection With Change in Control ($) |
||||||||||||||||||
| Cash Severance |
— | — | — | — | 2,242,000 | 3,882,790 | ||||||||||||||||||
| EAIP(1) |
— | — | 922,666 | 922,666 | 922,666 | — | ||||||||||||||||||
| Unvested RSU Awards(2) |
— | — | 385,381 | 385,381 | 385,381 | 1,541,522 | ||||||||||||||||||
| Unvested Stock Options(3) |
— | — | 237,191 | 237,191 | 237,191 | 948,761 | ||||||||||||||||||
| Health & Welfare: |
— | — | — | — | — | — | ||||||||||||||||||
| - Medical/COBRA |
— | — | — | — | 3,317 | 3,317 | ||||||||||||||||||
| - Dental/COBRA |
— | — | — | — | 1,061 | 1,061 | ||||||||||||||||||
| - Vision/COBRA |
— | — | — | — | 492 | 492 | ||||||||||||||||||
| Totals |
0 | 0 | 1,545,238 | 1,545,238 | `3,792,109 | 6,377,943 | ||||||||||||||||||
| (1) | Calculated as target award multiplied by company performance. |
| (2) | The value of unvested RSU awards represents the sum of (i) the closing price of our common stock on December 30, 2016 ($15.50), as reported by the OTCQX U.S. market of all shares of stock subject to RSUs that would vest upon the triggering event, and (ii) the value of the 2016 Special Dividend ($2.32 per share) attributable to all shares of stock subject to RSUs that would vest upon the triggering event. |
| (3) | The value of unvested stock options represents the difference in the exercise price and the closing price of our stock on December 30, 2016 ($15.50) of all stock options that would vest upon the triggering event. |
Potential Payments to Ms. Kirby upon Termination as of December 31, 2016 (see “—Employment Agreements—Ms. Kirby’s Employment Agreement” below)
| Benefit |
Voluntary ($) | For Cause ($) | Death ($) | Disability ($) | Without Cause Or For Good Reason ($) |
Without Cause Or For Good Reason In Connection With Change in Control ($) |
||||||||||||||||||
| Cash Severance |
— | — | — | — | 1,462,000 | 2,486,690 | ||||||||||||||||||
| EAIP(1) |
— | — | 523,018 | 523,018 | 523,018 | — | ||||||||||||||||||
| Unvested RSU Awards(2) |
— | — | 217,981 | 217,981 | 217,981 | 871,927 | ||||||||||||||||||
| Unvested Stock Options(3) |
— | — | 61,895 | 61,895 | 61,895 | 247,579 | ||||||||||||||||||
| Health & Welfare: |
— | — | — | — | — | — | ||||||||||||||||||
| - Medical/COBRA |
— | — | — | — | 3,317 | 3,317 | ||||||||||||||||||
| - Dental/COBRA |
— | — | — | — | 1,061 | 1,061 | ||||||||||||||||||
| - Vision/COBRA |
— | — | — | — | 492 | 492 | ||||||||||||||||||
| Totals |
0 | 0 | 802,894 | 802,894 | 2,269,765 | 3,611,066 | ||||||||||||||||||
| (1) | Calculated as target award multiplied by company performance. |
| (2) | The value of unvested RSU awards represents the sum of (i) the closing price of our common stock on December 30, 2016 ($15.50), as reported by the OTCQX U.S. market of all shares of stock subject to RSUs that would vest upon the triggering event, and (ii) the value of the 2016 Special Dividend ($2.32 per share) attributable to all shares of stock subject to RSUs that would vest upon the triggering event. |
| (3) | The value of unvested stock options represents the difference in the exercise price and the closing price of our stock on December 30, 2016 ($15.50) of all stock options that would vest upon the triggering event. |
132
Table of Contents
Potential Payments to Ms. Graziano upon Termination as of December 31, 2016 (see “—Employment Agreements—Ms. Graziano’s Employment Agreement” below)
| Benefit |
Voluntary ($) | For Cause ($) | Death ($) | Disability ($) | Without Cause Or For Good Reason ($) |
Without Cause Or For Good Reason In Connection With Change in Control ($) |
||||||||||||||||||
| Cash Severance |
— | — | — | — | 1,360,000 | 2,313,200 | ||||||||||||||||||
| EAIP(1) |
— | — | 486,528 | 486,528 | 486,528 | — | ||||||||||||||||||
| Unvested RSU Awards(2) |
— | — | 163,486 | 163,486 | 163,486 | 653,945 | ||||||||||||||||||
| Unvested Stock Options(3) |
— | — | 46,421 | 46,421 | 46,421 | 185,685 | ||||||||||||||||||
| Health & Welfare: |
— | — | — | — | — | — | ||||||||||||||||||
| - Medical/COBRA |
— | — | — | — | 3,317 | 3,317 | ||||||||||||||||||
| - Dental/COBRA |
— | — | — | — | 1,061 | 1,061 | ||||||||||||||||||
| - Vision/COBRA |
— | — | — | — | 492 | 492 | ||||||||||||||||||
| Totals |
0 | 0 | 696,435 | 696,435 | 2,061,306 | 3,157,700 | ||||||||||||||||||
| (1) | Calculated as target award multiplied by company performance. |
| (2) | The value of unvested RSU awards represents the sum of (i) the closing price of our common stock on December 30, 2016 ($15.50), as reported by the OTCQX U.S. market of all shares of stock subject to RSUs that would vest upon the triggering event, and (ii) the value of the 2016 Special Dividend ($2.32 per share) attributable to all shares of stock subject to RSUs that would vest upon the triggering event. |
| (3) | The value of unvested stock options represents the difference in the exercise price and the closing price of our stock on December 30, 2016 ($15.50) of all stock options that would vest upon the triggering event. |
Director Compensation
Vistra Energy Corp. is a newly created entity created in connection with Emergence, and the directors of Vistra Energy Corp. were appointed to such positions with effect as of the Effective Date. As a result, there is no relevant 2015 compensation disclosure relating to the directors of Vistra Energy Corp.
The table below sets forth information regarding the aggregate compensation earned by or paid to the members of the Board during the year ended December 31, 2016. Vistra Energy reimburses directors for reasonable expenses incurred in connection with their services as directors.
| Name |
Fees Earned or Paid in Cash |
RSU Awards ($) |
Total ($) | |||||||||
| Gavin R. Baiera (1)(2)(4) |
48,750 | — | 48,750 | |||||||||
| Jennifer Box (1)(2)(4) |
48,750 | — | 48,750 | |||||||||
| Jeff D. Hunter (2)(3) |
28,750 | 100,000 | (6) | 128,750 | ||||||||
| Michael S. Liebelson (1)(2)(5) |
23,750 | 100,000 | (6) | 123,750 | ||||||||
| Cyrus Madon (1)(2)(4) |
48,750 | — | 48,750 | |||||||||
| Curtis A. Morgan |
— | — | — | |||||||||
| Geoffrey D. Strong (1)(2)(4) |
48,750 | — | 48,750 | |||||||||
| (1) | Members of the Board who are not officers of Vistra Energy and not Chair of the Audit Committee receive an annual board retainer of $80,000 and an annual committee retainer of $15,000. |
| (2) | Members of the Board who are not officers of Vistra Energy receive an annual equity award in the amount of $100,000. Certain members of the Board elected to be paid in cash in lieu of their equity award. |
| (3) | The Chair of the Audit Committee receives an annual board retainer of $90,000 and an annual committee retainer of $25,000. |
| (4) | Fees were directly paid to entities affiliated with the employer of such director for firm use and not redirected to individual directors. |
| (5) | Michael S. Liebelson resigned from the Board effective February 1, 2017, and in consideration of a General Release Agreement between the Company and Mr. Liebelson, he is entitled to a lump sum payment of |
133
Table of Contents
| $266,250 to be paid in February 2017. In addition, the RSUs held by Mr. Liebelson were fully vested in connection with his resignation. |
| (6) | 7,169 restricted stock units, based on a grant date fair value computed in accordance with ASC 718. All such units remained outstanding as of December 31, 2016. |
Employment Agreements
In addition to the right to participate in the 2016 Incentive Plan described below under “— 2016 Omnibus Incentive Plan” at the discretion of the Committee, each of Mr. Morgan, Mr. Burke Ms. Kirby, Ms. Graziano and Ms. Moore entered into an employment agreement with Vistra Energy Corp., effective as of October 4, 2016 and Mr. Holden entered into an employment agreement with Vistra Energy Corp., effective as of December 5, 2016. The following is a summary of the material terms of each such employment agreement, along with certain related compensation arrangements for each such executive officer.
Each Named Executive Officer’s employment agreement includes customary non-compete and non-solicitation provisions that generally restrict the Named Executive Officer’s ability to compete with us or solicit our customers or employees for his or her own personal benefit during the term of the employment agreement and 24 months after the employment agreement expires or is terminated.
Mr. Morgan’s Employment Agreement
Mr. Morgan’s employment agreement with Vistra Energy Corp. (the Morgan Agreement) has an initial term that ends on October 4, 2019, and thereafter, the Morgan Agreement provides for automatic one-year extensions, unless either Vistra Energy Corp. or Mr. Morgan gives 60 days’ prior written notice electing not to extend the Morgan Agreement. Pursuant to the Morgan Agreement, Mr. Morgan will receive a base salary of no less than $950,000 per year, which may be increased (but not decreased) at the sole discretion of the Board. Mr. Morgan also will have the opportunity to earn an annual cash bonus (Annual Bonus) based upon the achievement of performance metrics approved by the Board and subject to the Board’s full discretion. Mr. Morgan’s target Annual Bonus opportunity is 100% of his base salary (Target Bonus), and his maximum Annual Bonus opportunity is 200% of the Target Bonus.
The Morgan Agreement also provides Mr. Morgan with equity compensation. On the Effective Date, the Board approved the grant of stock options and RSUs under the 2016 Incentive Plan to Mr. Morgan, which grant had an aggregate grant date fair value of $5,000,000. The grant consisted of 526,316 stock options and 152,905 RSUs which, on a grant date fair value basis, represented a grant of approximately 50% stock options and 50% RSUs. The exercise price for the stock options was determined by the Board in a manner compliant with Section 409A of the Internal Revenue Code.
Following October 4, 2017, the Morgan Agreement provides for annual equity awards, with the amount and form of each such equity award to be determined by the Board. All of the equity awards will be subject to the terms of the 2016 Incentive Plan. In addition to providing Mr. Morgan with equity compensation, the Morgan Agreement required Mr. Morgan to make a cash equity investment in Vistra Energy Corp. common stock equal to $1,250,000, with the timing to be determined in good faith by the Board and Mr. Morgan, and such obligation has been fulfilled.
The Morgan Agreement also entitles Mr. Morgan to participate in the benefit plans and programs, and receive such perquisites, in each case, as are provided by Vistra Energy Corp. from time to time to its senior executives generally, subject to the terms of such plans and programs and commensurate with Mr. Morgan’s position. Additionally, Mr. Morgan is entitled to receive up to $15,000 per year towards his tax and financial planning.
Upon any termination of employment with Vistra Energy Corp., Mr. Morgan will be entitled to (a) his accrued but unpaid base salary and any accrued but unused vacation as of the termination date, (b) any unreimbursed business expenses incurred through the termination date, and (c) any payments and benefits to which he may be entitled under any benefit plans, programs, or arrangements (collectively, Accrued Obligations).
134
Table of Contents
If Mr. Morgan’s employment with Vistra Energy Corp. is terminated by Vistra Energy Corp. without Cause (as defined in the Morgan Agreement) (and other than due to his death or disability), by Mr. Morgan for Good Reason (as defined in the Morgan Agreement) or due to Vistra Energy Corp.’s non-renewal of the employment term, then in addition to the Accrued Obligations and subject to Mr. Morgan’s execution and non-revocation of a general release of claims within the 60 days following his employment termination date, Mr. Morgan will be entitled to (a) an aggregate amount equal to two times the sum of (i) his base salary plus (ii) (x) the Target Bonus, if such termination occurs prior to October 4, 2018, or (y) the prior year’s Annual Bonus, if such termination occurs on or after October 4, 2018, with such amount payable in 24 equal installments following the termination in accordance with Vistra Energy Corp.’s normal payroll practices; (b) a pro-rated Annual Bonus in respect of the fiscal year of termination equal to the product of (i) the amount of the Annual Bonus that would have been payable to him had his employment not so terminated, based on actual performance measured through the fiscal year of termination, and (ii) a fraction, the numerator of which is the number of days elapsed in Vistra Energy Corp.’s fiscal year in which the termination occurs through such termination and the denominator of which is the number of days in such fiscal year (Pro-Rated Bonus); (c) any accrued but unpaid Annual Bonus in respect of the fiscal year prior to the fiscal year of termination (Unpaid Annual Bonus); (d) up to 24 months of continued health insurance benefits under the terms of the applicable Vistra Energy Corp. benefit plans, subject to his payment of the employee-portion of the benefit premiums and terminable upon his eligibility for comparable coverage under another employer’s benefit plans (with Vistra Energy Corp. having the alternative to pay the employer-portion of the COBRA continuation coverage premiums instead of providing coverage under its plans under certain circumstances) (Health Benefits); and (e) accelerated vesting of the portion of Mr. Morgan’s outstanding equity awards that would have vested in the 12 months following termination had he remained employed (with fully vested options to remain exercisable for 90 days following termination or, if Mr. Morgan is subject to Section 16 of the Exchange Act as of the date of his termination, 180 days following termination (or until the option’s regular expiration date, if shorter)).
If Mr. Morgan’s employment is terminated within the 18-month period following a change of control of Vistra Energy Corp., then in addition to the Accrued Obligations and subject to his execution and non-revocation of a general release of claims within the 60 days following his employment termination date, Mr. Morgan will be entitled to (a) an aggregate amount equal to 2.99 times the sum of (i) his base salary plus (ii) the Target Bonus, with such amount payable in a lump sum; (b) a pro-rated Annual Bonus in respect of the fiscal year of termination equal to the product of (i) the Target Bonus and (ii) a fraction, the numerator of which is the number of days elapsed in Vistra Energy Corp.’s fiscal year in which the termination occurs through such termination and the denominator of which is the number of days in such fiscal year; (c) any Unpaid Annual Bonus; (d) up to 24 months of the Health Benefits; and (e) accelerated vesting of all of Mr. Morgan’s equity awards that were outstanding as of the change of control.
If Mr. Morgan’s employment with Vistra Energy Corp. is terminated due to his death or disability, then in addition to the Accrued Obligations, Mr. Morgan will be entitled to (a) the Pro-Rated Bonus; (b) any Unpaid Annual Bonus; and (c) accelerated vesting of the portion of Mr. Morgan’s outstanding equity awards that would have vested in the 12 months following termination had he remained employed (with fully vested options to remain exercisable for one year following termination (or until the option’s regular expiration date, if shorter)).
The Morgan Agreement subjects Mr. Morgan to perpetual confidentiality, assignment of inventions and non-disparagement provisions, as well as non-competition and non-solicitation provisions that apply during his employment and for the 24-month period thereafter.
Mr. Burke’s Employment Agreement
Mr. Burke’s employment agreement with Vistra Energy Corp. (the Burke Agreement) has an initial term that ends on October 4, 2019, and thereafter, the Burke Agreement provides for automatic one-year extensions, unless either Vistra Energy Corp. or Mr. Burke gives 60 days’ prior written notice electing not to extend the Burke Agreement. Pursuant to the Burke Agreement, Mr. Burke will receive a base salary of no less than
135
Table of Contents
$750,000 per year, which may be increased (but not decreased) at the sole discretion of the Board. Mr. Burke also will have the opportunity to earn an Annual Bonus based upon the achievement of performance metrics approved by the Board and subject to the Board’s full discretion. Mr. Burke’s target Annual Bonus opportunity is 90% of his base salary (the Burke Target Bonus), and his maximum Annual Bonus opportunity is 200% of the Burke Target Bonus.
The Burke Agreement also provides Mr. Burke with equity compensation. On the Effective Date, the Board approved the grant of stock options and RSUs under the 2016 Incentive Plan to Mr. Burke, which grant had an aggregate grant date fair value of $4,000,000. The grant consisted of 421,053 stock options and 122,324 RSUs which, on a grant date fair value basis, represented a grant of approximately 50% stock options and 50% RSUs. The exercise price for the stock options was determined by Mr. Morgan in a manner compliant with Section 409A of the Internal Revenue Code.
Following October 4, 2017 , the Burke Agreement provides for annual equity awards, with the amount and form of each such equity award to be determined by the Board. All of the equity awards will be subject to the terms of the 2016 Incentive Plan.
The Burke Agreement also entitles Mr. Burke to participate in the benefit plans and programs, and receive such perquisites, in each case, as are provided by Vistra Energy Corp. from time to time to its senior executives generally, subject to the terms of such plans and programs and commensurate with Mr. Burke’s position. Additionally, Mr. Burke is entitled to receive up to $15,000 per year towards his tax and financial planning.
Upon any termination of employment with Vistra Energy Corp., Mr. Burke will be entitled to the Accrued Obligations.
If Mr. Burke’s employment with Vistra Energy Corp. is terminated by Vistra Energy Corp. without Cause (as defined in the Burke Agreement) (and other than due to his death or disability), by Mr. Burke for Good Reason (as defined in the Burke Agreement) or due to Vistra Energy Corp.’s non-renewal of the employment term, then in addition to the Accrued Obligations and subject to Mr. Burke’s execution and non-revocation of a general release of claims within the 60 days following his employment termination date, Mr. Burke will be entitled to (a) an aggregate amount equal to two times the sum of (i) his base salary plus (ii) (x) the Burke Target Bonus, if such termination occurs prior to October 4, 2018, or (y) the prior year’s Annual Bonus, if such termination occurs on or after October 4, 2018, with such amount payable in 24 equal installments following the termination in accordance with Vistra Energy Corp.’s normal payroll practices; (b) a pro-rated Annual Bonus in respect of the fiscal year of termination equal to the product of (i) the amount of the Annual Bonus that would have been payable to him had his employment not so terminated, based on actual performance measured through the fiscal year of termination, and (ii) the Pro-Rated Bonus; (c) any Unpaid Annual Bonus; (d) up to 24 months of continued the Health Benefits; and (e) accelerated vesting of the portion of Mr. Burke’s outstanding equity awards that would have vested in the 12 months following termination had he remained employed (with fully vested options to remain exercisable for 90 days following termination or, if Mr. Burke is subject to Section 16 of the Exchange Act as of the date of his termination, 180 days following termination (or until the option’s regular expiration date, if shorter)).
If Mr. Burke’s employment is terminated within the 18-month period following a change of control of Vistra Energy Corp., then in addition to the Accrued Obligations and subject to his execution and non-revocation of a general release of claims within the 60 days following his employment termination date, Mr. Burke will be entitled to (a) an aggregate amount equal to 2.99 times the sum of (i) his base salary plus (ii) the Burke Target Bonus, with such amount payable in a lump sum; (b) a pro-rated Annual Bonus in respect of the fiscal year of termination equal to the product of (i) the Burke Target Bonus and (ii) a fraction, the numerator of which is the number of days elapsed in Vistra Energy Corp.’s fiscal year in which the termination occurs through such termination and the denominator of which is the number of days in such fiscal year; (c) any Unpaid Annual Bonus; (d) up to 24 months of the Health Benefits; and (e) accelerated vesting of all of Mr. Burke’s equity awards that were outstanding as of the change of control.
136
Table of Contents
If Mr. Burke’s employment with Vistra Energy Corp. is terminated due to his death or disability, then in addition to the Accrued Obligations, Mr. Burke will be entitled to (a) the Pro-Rated Bonus; (b) any Unpaid Annual Bonus; and (c) accelerated vesting of the portion of Mr. Burke’s outstanding equity awards that would have vested in the 12 months following termination had he remained employed (with fully vested options to remain exercisable for one year following termination (or until the option’s regular expiration date, if shorter)).
The Burke Agreement subjects Mr. Burke to perpetual confidentiality, assignment of inventions and non-disparagement provisions, as well as non-competition and non-solicitation provisions that apply during his employment and for the 24-month period thereafter.
Mr. Holden’s Employment Agreement
Mr. Holden’s employment agreement with Vistra Energy Corp. (the Holden Agreement) has an initial term that ends on December 5, 2019, and thereafter, the Holden Agreement provides for automatic one-year extensions, unless either Vistra Energy Corp. or Mr. Holden gives 60 days’ prior written notice electing not to extend the Holden Agreement. Pursuant to the Holden Agreement, Mr. Holden will receive a base salary of no less than $590,000 per year, which may be increased (but not decreased) at the sole discretion of the Board. Mr. Holden also will have the opportunity to earn an Annual Bonus based upon the achievement of performance metrics approved by the Board and subject to the Board’s full discretion. Mr. Holden’s target Annual Bonus opportunity is 90% of his base salary (the Holden Target Bonus), and his maximum Annual Bonus opportunity is 200% of the Holden Target Bonus.
The Holden Agreement also provides Mr. Holden with equity compensation. On December 5, 2016, the Board approved the grant of stock options and RSUs under the 2016 Incentive Plan to Mr. Holden, which grant had an aggregate grant date fair value of $2,500,000. The grant consisted of 281,532 stock options and 86,505 RSUs which, on a grant date fair value basis, represented a grant of approximately 50% stock options and 50% RSUs. The exercise price for the stock options was determined by Mr. Morgan in a manner compliant with Section 409A of the Internal Revenue Code.
Following December 5, 2017, the Holden Agreement provides for annual equity awards, with the amount and form of each such equity award to be determined by the Board. All of the equity awards will be subject to the terms of the 2016 Incentive Plan.
The Holden Agreement also entitles Mr. Holden to participate in the benefit plans and programs, and receive such perquisites, in each case, as are provided by Vistra Energy Corp. from time to time to its senior executives generally, subject to the terms of such plans and programs and commensurate with Mr. Holden’s position. Additionally, Mr. Holden is entitled to receive up to $15,000 per year towards his tax and financial planning.
Upon any termination of employment with Vistra Energy Corp., Mr. Holden will be entitled to the Accrued Obligations.
If Mr. Holden’s employment with Vistra Energy Corp. is terminated by Vistra Energy Corp. without Cause (as defined in the Holden Agreement) (and other than due to his death or disability), by Mr. Holden for Good Reason (as defined in the Holden Agreement) or due to Vistra Energy Corp.’s non-renewal of the employment term, then in addition to the Accrued Obligations and subject to Mr. Holden’s execution and non-revocation of a general release of claims within the 60 days following his employment termination date, Mr. Holden will be entitled to (a) an aggregate amount equal to two times the sum of (i) his base salary plus (ii) (x) the Holden Target Bonus, if such termination occurs prior to December 5, 2018, or (y) the prior year’s Annual Bonus, if such termination occurs on or after December 5, 2018, with such amount payable in 24 equal installments following the termination in accordance with Vistra Energy Corp.’s normal payroll practices; (b) a pro-rated Annual Bonus in respect of the fiscal year of termination equal to the product of (i) the amount of the Annual Bonus that would
137
Table of Contents
have been payable to him had his employment not so terminated, based on actual performance measured through the fiscal year of termination, and (ii) the Pro-Rated Bonus; (c) any Unpaid Annual Bonus; (d) up to 24 months of the Health Benefits; and (e) accelerated vesting of the portion of Mr. Holden’s outstanding equity awards that would have vested in the 12 months following termination had he remained employed (with fully vested options to remain exercisable for 90 days following termination or, if Mr. Holden is subject to Section 16 of the Exchange Act as of the date of his termination, 180 days following termination (or until the option’s regular expiration date, if shorter)).
If Mr. Holden’s employment is terminated within the 18-month period following a change of control of Vistra Energy Corp., then in addition to the Accrued Obligations and subject to his execution and non-revocation of a general release of claims within the 60 days following his employment termination date, Mr. Holden will be entitled to (a) an aggregate amount equal to 2.99 times the sum of (i) his base salary plus (ii) the Holden Target Bonus, with such amount payable in a lump sum; (b) a pro-rated Annual Bonus in respect of the fiscal year of termination equal to the product of (i) the Holden Target Bonus and (ii) a fraction, the numerator of which is the number of days elapsed in Vistra Energy Corp.’s fiscal year in which the termination occurs through such termination and the denominator of which is the number of days in such fiscal year; (c) any Unpaid Annual Bonus; (d) up to 24 months of the Health Benefits; and (e) accelerated vesting of all of Mr. Holden’s equity awards that were outstanding as of the change of control.
If Mr. Holden’s employment with Vistra Energy Corp. is terminated due to his death or disability, then in addition to the Accrued Obligations, Mr. Holden will be entitled to (a) the Pro-Rated Bonus; (b) any Unpaid Annual Bonus; and (c) accelerated vesting of the portion of Mr. Holden’s outstanding equity awards that would have vested in the 12 months following termination had he remained employed (with fully vested options to remain exercisable for one year following termination (or until the option’s regular expiration date, if shorter)).
The Holden Agreement subjects Mr. Holden to perpetual confidentiality, assignment of inventions and non-disparagement provisions, as well as non-competition and non-solicitation provisions that apply during his employment and for the 24-month period thereafter.
Ms. Kirby’s Employment Agreement
Ms. Kirby’s employment agreement with Vistra Energy Corp. (the Kirby Agreement) has an initial term that ends on October 4, 2019, and thereafter, the Kirby Agreement provides for automatic one-year extensions, unless either Vistra Energy Corp. or Ms. Kirby gives 60 days’ prior written notice electing not to extend the Kirby Agreement. Pursuant to the Kirby Agreement, Ms. Kirby will receive a base salary of no less than $430,000 per year, which may be increased (but not decreased) at the sole discretion of the Board. Ms. Kirby also will have the opportunity to earn an Annual Bonus based upon the achievement of performance metrics approved by the Board and subject to the Board’s full discretion. Ms. Kirby’s target Annual Bonus opportunity is 70% of her base salary (the Kirby Target Bonus), and her maximum Annual Bonus opportunity is 200% of the Kirby Target Bonus.
The Kirby Agreement also provides Ms. Kirby with equity compensation. On the Effective Date, the Board approved the grant of stock options and RSUs under the 2016 Incentive Plan to Ms. Kirby, which grant had an aggregate grant date fair value of $1,600,000. The grant consisted of 168,421 stock options and 48,930 RSUs which, on a grant date fair value basis, represented a grant of approximately 50% stock options and 50% RSUs. The exercise price for the stock options was determined by Mr. Morgan in a manner compliant with Section 409A of the Internal Revenue Code.
Following October 4, 2017, the Kirby Agreement provides for annual equity awards, with the amount and form of each such equity award to be determined by the Board. All of the equity awards will be subject to the terms of the 2016 Incentive Plan.
The Kirby Agreement also entitles Ms. Kirby to participate in the benefit plans and programs, and receive such perquisites, in each case, as are provided by Vistra Energy Corp. from time to time to its senior executives
138
Table of Contents
generally, subject to the terms of such plans and programs and commensurate with Ms. Kirby’s position. Additionally, Ms. Kirby is entitled to receive up to $15,000 per year towards her tax and financial planning.
Upon any termination of employment with Vistra Energy Corp., Ms. Kirby will be entitled to the Accrued Obligations.
If Ms. Kirby’s employment with Vistra Energy Corp. is terminated by Vistra Energy Corp. without Cause (as defined in the Kirby Agreement) (and other than due to her death or disability), by Ms. Kirby for Good Reason (as defined in the Kirby Agreement) or due to Vistra Energy Corp.’s non-renewal of the employment term, then in addition to the Accrued Obligations and subject to Ms. Kirby’s execution and non-revocation of a general release of claims within the 60 days following her employment termination date, Ms. Kirby will be entitled to (a) an aggregate amount equal to two times the sum of (i) her base salary plus (ii) (x) the Kirby Target Bonus, if such termination occurs prior to October 4, 2018, or (y) the prior year’s Annual Bonus, if such termination occurs on or after October 4, 2018, with such amount payable in 24 equal installments following the termination in accordance with Vistra Energy Corp.’s normal payroll practices; (b) a pro-rated Annual Bonus in respect of the fiscal year of termination equal to the product of (i) the amount of the Annual Bonus that would have been payable to her had her employment not so terminated, based on actual performance measured through the fiscal year of termination, and (ii) the Pro-Rated Bonus; (c) any Unpaid Annual Bonus; (d) up to 24 months of continued the Health Benefits; and (e) accelerated vesting of the portion of Ms. Kirby’s outstanding equity awards that would have vested in the 12 months following termination had she remained employed (with fully vested options to remain exercisable for 90 days following termination or, if Ms. Kirby is subject to Section 16 of the Exchange Act as of the date of her termination, 180 days following termination (or until the option’s regular expiration date, if shorter)).
If Ms. Kirby’s employment is terminated within the 18-month period following a change of control of Vistra Energy Corp., then in addition to the Accrued Obligations and subject to her execution and non-revocation of a general release of claims within the 60 days following her employment termination date, Ms. Kirby will be entitled to (a) an aggregate amount equal to 2.99 times the sum of (i) her base salary plus (ii) the Kirby Target Bonus, with such amount payable in a lump sum; (b) a pro-rated Annual Bonus in respect of the fiscal year of termination equal to the product of (i) the Kirby Target Bonus and (ii) a fraction, the numerator of which is the number of days elapsed in Vistra Energy Corp.’s fiscal year in which the termination occurs through such termination and the denominator of which is the number of days in such fiscal year; (c) any Unpaid Annual Bonus; (d) up to 24 months of the Health Benefits; and (e) accelerated vesting of all of Ms. Kirby’s equity awards that were outstanding as of the change of control.
If Ms. Kirby’s employment with Vistra Energy Corp. is terminated due to her death or disability, then in addition to the Accrued Obligations, Ms. Kirby will be entitled to (a) the Pro-Rated Bonus; (b) any Unpaid Annual Bonus; and (c) accelerated vesting of the portion of Ms. Kirby’s outstanding equity awards that would have vested in the 12 months following termination had she remained employed (with fully vested options to remain exercisable for one year following termination (or until the option’s regular expiration date, if shorter)).
The Kirby Agreement subjects Ms. Kirby to perpetual confidentiality, assignment of inventions and non-disparagement provisions, as well as non-competition and non-solicitation provisions that apply during her employment and for the 24-month period thereafter.
Ms. Graziano’s Employment Agreement
Ms. Graziano’s employment agreement with Vistra Energy Corp. (the Graziano Agreement) has an initial term that ends on October 4, 2019, and thereafter, the Graziano Agreement provides for automatic one-year extensions, unless either Vistra Energy Corp. or Ms. Graziano gives 60 days’ prior written notice electing not to extend the Graziano Agreement. Pursuant to the Graziano Agreement, Ms. Graziano will receive a base salary of no less than $400,000 per year, which may be increased (but not decreased) at the sole discretion of the Board.
139
Table of Contents
Ms. Graziano also will have the opportunity to earn an Annual Bonus based upon the achievement of performance metrics approved by the Board and subject to the Board’s full discretion. Ms. Graziano’s target Annual Bonus opportunity is 70% of her base salary (the Graziano Target Bonus), and her maximum Annual Bonus opportunity is 200% of the Graziano Target Bonus.
The Graziano Agreement also provides Ms. Graziano with equity compensation. On the Effective Date, the Board approved the grant of stock options and RSUs under the 2016 Incentive Plan to Ms. Graziano, which grant had an aggregate grant date fair value of $1,200,000. The grant consisted of 126,316 stock options and 36,697 RSUs which, on a grant date fair value basis, represented a grant of approximately 50% stock options and 50% RSUs. The exercise price for the stock options was determined by Mr. Morgan in a manner compliant with Section 409A of the Internal Revenue Code.
Following October 4, 2017, the Graziano Agreement provides for annual equity awards, with the amount and form of each such equity award to be determined by the Board. All of the equity awards will be subject to the terms of the 2016 Incentive Plan.
The Graziano Agreement also entitles Ms. Graziano to participate in the benefit plans and programs, and receive such perquisites, in each case, as are provided by Vistra Energy Corp. from time to time to its senior executives generally, subject to the terms of such plans and programs and commensurate with Ms. Graziano’s position. Additionally, Ms. Graziano is entitled to receive up to $15,000 per year towards her tax and financial planning.
Upon any termination of employment with Vistra Energy Corp., Ms. Graziano will be entitled to the Accrued Obligations.
If Ms. Graziano’s employment with Vistra Energy Corp. is terminated by Vistra Energy Corp. without Cause (as defined in the Graziano Agreement) (and other than due to her death or disability), by Ms. Graziano for Good Reason (as defined in the Graziano Agreement) or due to Vistra Energy Corp.’s non-renewal of the employment term, then in addition to the Accrued Obligations and subject to Ms. Graziano’s execution and non-revocation of a general release of claims within the 60 days following her employment termination date, Ms. Graziano will be entitled to (a) an aggregate amount equal to two times the sum of (i) her base salary plus (ii) (x) the Graziano Target Bonus, if such termination occurs prior to October 4, 2018, or (y) the prior year’s Annual Bonus, if such termination occurs on or after October 4, 2018, with such amount payable in 24 equal installments following the termination in accordance with Vistra Energy Corp.’s normal payroll practices; (b) a pro-rated Annual Bonus in respect of the fiscal year of termination equal to the product of (i) the amount of the Annual Bonus that would have been payable to her had her employment not so terminated, based on actual performance measured through the fiscal year of termination, and (ii) the Pro-Rated Bonus; (c) any Unpaid Annual Bonus; (d) up to 24 months of the Health Benefits; and (e) accelerated vesting of the portion of Ms. Graziano’s outstanding equity awards that would have vested in the 12 months following termination had he remained employed (with fully vested options to remain exercisable for 90 days following termination or, if Ms. Graziano is subject to Section 16 of the Exchange Act as of the date of her termination, 180 days following termination (or until the option’s regular expiration date, if shorter)).
If Ms. Graziano’s employment is terminated within the 18-month period following a change of control of Vistra Energy Corp., then in addition to the Accrued Obligations and subject to her execution and non-revocation of a general release of claims within the 60 days following her employment termination date, Ms. Graziano will be entitled to (a) an aggregate amount equal to 2.99 times the sum of (i) her base salary plus (ii) the Graziano Target Bonus, with such amount payable in a lump sum; (b) a pro-rated Annual Bonus in respect of the fiscal year of termination equal to the product of (i) the Graziano Target Bonus and (ii) a fraction, the numerator of which is the number of days elapsed in Vistra Energy Corp.’s fiscal year in which the termination occurs through such termination and the denominator of which is the number of days in such fiscal year; (c) any Unpaid Annual Bonus; (d) up to 24 months of the Health Benefits; and (e) accelerated vesting of all of Ms. Graziano’s equity awards that were outstanding as of the change of control.
140
Table of Contents
If Ms. Graziano’s employment with Vistra Energy Corp. is terminated due to her death or disability, then in addition to the Accrued Obligations, Ms. Graziano will be entitled to (a) the Pro-Rated Bonus; (b) any Unpaid Annual Bonus; and (c) accelerated vesting of the portion of Ms. Graziano’s outstanding equity awards that would have vested in the 12 months following termination had she remained employed (with fully vested options to remain exercisable for one year following termination (or until the option’s regular expiration date, if shorter)).
The Graziano Agreement subjects Ms. Graziano to perpetual confidentiality, assignment of inventions and non-disparagement provisions, as well as non-competition and non-solicitation provisions that apply during her employment and for the 24-month period thereafter.
Ms. Moore’s Employment Agreement
Ms. Moore’s employment agreement with Vistra Energy Corp. (the Moore Agreement) has an initial term that ends on October 4, 2019, and thereafter, the Moore Agreement provides for automatic one-year extensions, unless either Vistra Energy Corp. or Ms. Moore gives 60 days’ prior written notice electing not to extend the Moore Agreement. Pursuant to the Moore Agreement, Ms. Moore will receive a base salary of no less than $415,000 per year, which may be increased (but not decreased) at the sole discretion of the Board. Ms. Moore also will have the opportunity to earn an Annual Bonus based upon the achievement of performance metrics approved by the Board and subject to the Board’s full discretion. Ms. Moore’s target Annual Bonus opportunity is 70% of her base salary (the Moore Target Bonus), and her maximum Annual Bonus opportunity is 200% of the Moore Target Bonus.
The Moore Agreement also provides Ms. Moore with equity compensation. On the Effective Date, the Board approved the grant of stock options and RSUs under the 2016 Incentive Plan to Ms. Moore, which grant had an aggregate grant date fair value of $1,200,000. The grant consisted of 126,316 stock options and 36,697 RSUs which, on a grant date fair value basis, represented a grant of approximately 50% stock options and 50% RSUs. The exercise price for the stock options was determined by Mr. Morgan in a manner compliant with Section 409A of the Internal Revenue Code.
Following October 4, 2017, the Moore Agreement provides for annual equity awards, with the amount and form of each such equity award to be determined by the Board. All of the equity awards will be subject to the terms of the 2016 Incentive Plan.
The Moore Agreement also entitles Ms. Moore to participate in the benefit plans and programs, and receive such perquisites, in each case, as are provided by Vistra Energy Corp. from time to time to its senior executives generally, subject to the terms of such plans and programs and commensurate with Ms. Moore’s position. Additionally, Ms. Moore is entitled to receive up to $15,000 per year towards her tax and financial planning.
Upon any termination of employment with Vistra Energy Corp., Ms. Moore will be entitled to the Accrued Obligations.
If Ms. Moore’s employment with Vistra Energy Corp. is terminated by Vistra Energy Corp. without Cause (as defined in the Moore Agreement) (and other than due to her death or disability), by Ms. Moore for Good Reason (as defined in the Moore Agreement) or due to Vistra Energy Corp.’s non-renewal of the employment term, then in addition to the Accrued Obligations and subject to Ms. Moore’s execution and non-revocation of a general release of claims within the 60 days following her employment termination date, Ms. Moore will be entitled to (a) an aggregate amount equal to two times the sum of (i) her base salary plus (ii) (x) the Moore Target Bonus, if such termination occurs prior to October 4, 2018, or (y) the prior year’s Annual Bonus, if such termination occurs on or after October 4, 2018, with such amount payable in 24 equal installments following the termination in accordance with Vistra Energy Corp.’s normal payroll practices; (b) a pro-rated Annual Bonus in respect of the fiscal year of termination equal to the product of (i) the amount of the Annual Bonus that would have been payable to her had her employment not so terminated, based on actual performance measured through
141
Table of Contents
the fiscal year of termination, and (ii) the Pro-Rated Bonus; (c) any Unpaid Annual Bonus; (d) up to 24 months of the Health Benefits; and (e) accelerated vesting of the portion of Ms. Moore’s outstanding equity awards that would have vested in the 12 months following termination had she remained employed (with fully vested options to remain exercisable for 90 days following termination or, if Ms. Moore is subject to Section 16 of the Exchange Act as of the date of her termination, 180 days following termination (or until the option’s regular expiration date, if shorter)).
If Ms. Moore’s employment is terminated within the 18-month period following a change of control of Vistra Energy Corp., then in addition to the Accrued Obligations and subject to her execution and non-revocation of a general release of claims within the 60 days following her employment termination date, Ms. Moore will be entitled to (a) an aggregate amount equal to 2.99 times the sum of (i) her base salary plus (ii) the Moore Target Bonus, with such amount payable in a lump sum; (b) a pro-rated Annual Bonus in respect of the fiscal year of termination equal to the product of (i) the Moore Target Bonus and (ii) a fraction, the numerator of which is the number of days elapsed in Vistra Energy Corp.’s fiscal year in which the termination occurs through such termination and the denominator of which is the number of days in such fiscal year; (c) any Unpaid Annual Bonus; (d) up to 24 months of the Health Benefits; and (e) accelerated vesting of all of Ms. Moore’s equity awards that were outstanding as of the change of control.
If Ms. Moore’s employment with Vistra Energy Corp. is terminated due to her death or disability, then in addition to the Accrued Obligations, Ms. Moore will be entitled to (a) the Pro-Rated Bonus; (b) any Unpaid Annual Bonus; and (c) accelerated vesting of the portion of Ms. Moore’s outstanding equity awards that would have vested in the 12 months following termination had she remained employed (with fully vested options to remain exercisable for one year following termination (or until the option’s regular expiration date, if shorter)).
The Moore Agreement subjects Ms. Moore to perpetual confidentiality, assignment of inventions and non-disparagement provisions, as well as non-competition and non-solicitation provisions that apply during her employment and for the 24-month period thereafter.
The foregoing descriptions of the employment agreements of Messrs. Morgan, Burke and Holden and Ms. Kirby, Graziano and Moore do not purport to be complete and are qualified in their entirety by reference to the full text of such agreements, which have been filed as exhibits to the registration statement of which this prospectus is a part.
2016 Omnibus Incentive Plan
The Board adopted the 2016 Omnibus Incentive Plan (the 2016 Incentive Plan), effective as of the Effective Date, under which an aggregate of 22,500,000 shares of our common stock were reserved for issuance as equity-based awards to our non-employee directors, employees, and certain other persons. The Board or any committee duly authorized by the Board (the Committee) will administer the 2016 Incentive Plan and has broad authority under the 2016 Incentive Plan to, among other things: (a) select participants, (b) determine the types of awards that participants are to receive and the number of shares that are to be subject to such awards and (c) establish the terms and conditions of awards, including the price (if any) to be paid for the shares of the award. The types of awards that may be granted under the 2016 Incentive Plan include stock options, RSUs, restricted stock, performance awards and other forms of awards granted or denominated in shares of Vistra Energy Corp. common stock, as well as certain cash-based awards.
If any stock option or other stock-based award granted under the 2016 Incentive Plan expires, terminates or is canceled for any reason without having been exercised in full, the number of shares of Vistra Energy Corp. common stock underlying any unexercised award shall again be available for the purpose of awards under the 2016 Incentive Plan. If any shares of restricted stock, performance awards or other stock-based awards denominated in shares of Vistra Energy Corp. common stock awarded under the 2016 Incentive Plan are forfeited
142
Table of Contents
for any reason, the number of forfeited shares shall again be available for purposes of awards under the 2016 Incentive Plan. Any award under the 2016 Incentive Plan settled in cash shall not be counted against the maximum share limitation.
As is customary in incentive plans of this nature, each share limit and the number and kind of shares available under the 2016 Incentive Plan and any outstanding awards, as well as the exercise or purchase price of awards, and performance targets under certain types of performance-based awards, are subject to adjustment in the event of certain reorganizations, mergers, combinations, recapitalizations, stock splits, stock dividends or other similar events that change the number or kind of shares outstanding, and extraordinary dividends or distributions of property to the Vistra Energy Corp. stockholders.
143
Table of Contents
Principal and Selling Stockholders
The following table contains information about the estimated beneficial ownership of our common stock for:
| • | each stockholder known by us to own beneficially 5% or more of our common stock; |
| • | each of our directors; |
| • | each of the Named Executive Officers set forth above; |
| • | all directors and executive officers as a group; and |
| • | each of the selling stockholders. |
The number of shares and percentage of ownership indicated in the following table is based on the 427,587,401 shares of Vistra Energy Corp. common stock outstanding as of April 25, 2017. Unless set forth in this section or under “Certain Relationships and Related Party Transactions,” to our knowledge, none of the selling stockholders have, or within the past three years have had, any material relationship with us or with any of our predecessors or affiliates.
Information with respect to beneficial ownership has been furnished by each director, officer, beneficial owner of more than 5% of our common stock and selling stockholder. Beneficial ownership is determined in accordance with the rules of the Commission. Except as indicated by footnote and subject to community property laws where applicable, to our knowledge, the persons named in the table below will have sole voting and investment power with respect to all shares of common stock shown as beneficially owned by them.
| Name and Address |
Number of Shares of Common Stock Beneficially Owned |
Maximum Number of Shares of Common Stock That May Be Offered for Resale by this Prospectus |
Percentage of Shares of Common Stock Beneficially Owned |
|||||||||||||
| Before Any Offering |
If Maximum Number of Shares Offered are Sold |
|||||||||||||||
| 5% Stockholders |
||||||||||||||||
| Selling Stockholders |
||||||||||||||||
| Apollo Funds(1) |
52,922,793 | 52,922,793 | 12.38 | % | 0 | % | ||||||||||
| Brookfield Asset Management Inc. Managed Entities(2) |
66,370,568 | 66,370,568 | 15.52 | % | 0 | % | ||||||||||
| Opps VIIb TCEH Holdings, LLC(3) |
49,485,715 | 49,485,715 | 11.57 | % | 0 | % | ||||||||||
| Seismic Holding LLC(4) |
22,880,381 | 22,880,381 | 5.35 | % | 0 | % | ||||||||||
| Non-Selling 5% Stockholders |
||||||||||||||||
| HBK Master Fund L.P.(5) |
26,387,615 | 0 | 6.17 | % | 6.17 | % | ||||||||||
| Directors and Executive Officers |
||||||||||||||||
| Gavin R. Baiera(6) |
18,320,311 | 0 | 4.28 | % | 4.28 | % | ||||||||||
| Jennifer Box(7) |
0 | 0 | 0 | % | 0 | % | ||||||||||
| Jeff Hunter(8) |
10,000 | 0 | * | * | ||||||||||||
| Cyrus Madon(9) |
66,370,568 | 66,370,568 | 15.52 | % | 15.52 | % | ||||||||||
| Curtis A. Morgan(10) |
80,231 | 0 | * | * | ||||||||||||
| Geoffrey Strong(11) |
0 | 0 | 0 | % | 0 | % | ||||||||||
| James A. Burke |
0 | 0 | 0 | % | 0 | % | ||||||||||
| Sara Graziano |
0 | 0 | 0 | % | 0 | % | ||||||||||
| J. William Holden |
0 | 0 | 0 | % | 0 | % | ||||||||||
| Carrie Lee Kirby |
0 | 0 | 0 | % | 0 | % | ||||||||||
| Stephanie Zapata Moore |
0 | 0 | 0 | % | 0 | % | ||||||||||
| All directors and current executive officers as a group (11 persons) |
84,781,110 | 66,370,568 | 19.83 | % | 4.31 | % | ||||||||||
| * | Represents less than 1% |
| (1) | Represents shares of our common stock held of record by various entities (collectively, the Apollo Funds) for which affiliates of Apollo Principal Holdings III, L.P. (Principal Holdings III), APH Holdings, L.P. |
144
Table of Contents
| (APH Holdings) and APH Holdings (DC), L.P. (APH Holdings (DC)), respectively, serve as investment advisors or portfolio managers, and in some cases as general partners, of certain of the Apollo Funds. Apollo Principal Holdings III GP, Ltd. (Principal Holdings III GP) is the general partner of Principal Holdings III and APH Holdings, and Apollo Principal Holdings IV GP, Ltd. (Principal Holdings IV GP) is the general partner of APH Holdings (DC). Also includes shares of our common stock held of record by certain of the Apollo Funds for which affiliates of Apollo Management Holdings, L.P. (Management Holdings) serve as investment managers or portfolio managers. The general partner of Management Holdings is Apollo Management Holdings GP, LLC (Management Holdings GP). Leon Black, Joshua Harris and Marc Rowan are the directors of Principal Holdings III GP and Principal Holdings IV GP, and the managers, as well as executive officers, of Management Holdings GP, and as such may be deemed to have voting and dispositive control over the shares of common stock held by the Apollo Funds. The address of each of APH Holdings, APH Holdings (DC) and Principal Holdings IV GP is One Manhattanville Road, Suite 201, Purchase, New York 10577. The address of each of Principal Holdings III and Principal Holdings III GP is c/o Intertrust Corporate Services (Cayman) Limited, 190 Elgin Street, George Town, KY1-9005 Grand Cayman, Cayman Islands. The address of each of Management Holdings and Management Holdings GP, and Messrs. Black, Harris and Rowan, is 9 West 57th Street, 43rd Floor, New York, New York 10019. |
| (2) | Reflects shares of common stock held by entities affiliated with and/or with accounts managed by affiliates of Brookfield Asset Management Inc. The registered holders of shares include BCP Titan Aggregator, L.P., BCP Titan Sub Aggregator, L.P., Brookfield Titan Holdings LP, 11 co-investment limited partnership vehicles of which Titan Co-Investment GP, LLC is the general partner, Longhorn Capital GS LP and Seismic Holding LLC (collectively, the investment vehicles). |
The following Brookfield entities, which do not themselves hold any shares of common stock but which are controlling entities of certain of the investment vehicles, may be deemed to constitute a “group” with the investment vehicles within the meaning of Section 13(d)(3) under the Exchange Act and Rule 13d-5(b)(1) thereunder and each member of the “group” may be deemed to beneficially own all shares of common stock held by all members of the “group” set forth in the table above: Brookfield Asset Management Inc., Partners Limited, Brookfield Private Equity Inc., Brookfield US Corporation, Brookfield Private Equity Holdings LLC, Brookfield Private Equity Direct Investments Holdings LP, Titan Co-Investment GP, LLC, Brookfield Private Equity Group Holdings LP, Brookfield Capital Partners Ltd., Brookfield Holdings Canada Inc., Brookfield Private Funds Holdings Inc., Brookfield Canada Adviser and Brookfield Asset Management Private Institutional Capital Adviser (Canada), L.P. (BAMPIC).
The total number of reported shares includes the shares beneficially owned by Seismic Holding LLC. By virtue of various agreements and arrangements with Seismic Holding LLC, Brookfield Asset Management Inc. and certain of the investment vehicles share beneficial ownership of shares beneficially owned by Seismic Holding LLC. See footnote (4) to this table.
Each of the investment vehicles expressly disclaims, to the extent permitted by applicable law, beneficial ownership of any shares of common stock held by each of the other investment vehicles and the existence of a “group” involving the other investment vehicles or other Brookfield affiliates set forth in this footnote.
The numbers above include certain shares held in reserve by the Company’s transfer agent upon Emergence, pending release following the resolution of intercreditor arrangements in connection with the Plan.
The address of each Brookfield-managed entity (other than Seismic Holding LLC) is c/o BAMPIC, 250 Vesey Street, 15th Floor, New York, New York 10281.
| (3) | The managing member of Opps VIIb TCEH Holdings, LLC is OCM Opportunities Fund VIIb Delaware, L.P. The general partner of OCM Opportunities Fund VIIb Delaware, L.P. is Oaktree Fund GP, LLC. The managing member of Oaktree Fund GP, LLC is Oaktree Fund GP I, L.P. The general partner of Oaktree |
145
Table of Contents
| Fund GP I, L.P. is Oaktree Capital I, L.P. The general partner of Oaktree Capital I, L.P. is OCM Holdings I, LLC. The managing member of OCM Holdings I, LLC is Oaktree Holdings, LLC. |
Includes 34,719,812 common shares of the Issuer directly held by certain funds, accounts and special purpose entities managed by Oaktree Capital Management, L.P. or its affiliates. The general partner of Oaktree Capital Management, L.P. is Oaktree Holdings, Inc. The sole shareholder of Oaktree Holdings, Inc. and the managing member of Oaktree Holdings, LLC is Oaktree Capital Group, LLC. The duly elected manager of Oaktree Capital Group, LLC is Oaktree Capital Group Holdings GP, LLC (OCGH GP). OCGH GP is managed by an executive committee consisting of Howard S. Marks, Bruce A. Karsh, Jay S. Wintrob, John B. Frank, David M. Kirchheimer and Sheldon M. Stone. The address for all of the entities and individuals identified above is 333 S. Grand Avenue, 28th Floor, Los Angeles, CA 90071.
| (4) | Seismic Holding LLC holds 15,900,080 shares (including 107,025 shares held in reserve by the Company’s transfer agent upon Emergence, pending release following the resolution of intercreditor arrangements in connection with the Plan). |
In addition, Seismic Holding may be deemed to have beneficial ownership of all the shares held by entities affiliated with Brookfield Asset Management Inc. set forth in footnote (2) to this table, by virtue of various agreements and arrangements that may be deemed to grant Seismic Holding LLC voting power and/or investment power with respect to the shares held by such entities, including the shares held by Longhorn Capital GS LP, of which Seismic Holding LLC is a limited partner with powers that may be deemed to constitute voting power and/or investment power with respect to the shares held by the limited partnership.
The total number of reported shares is included in the total described in footnote (2) to this table.
Each of Seismic Holding LLC and its controlling persons expressly disclaims, to the extent permitted by applicable law, the existence of a “group” (within the meaning of Section 13(d)(3) under the Exchange Act and Rule 13d-5(b)(1) thereunder) involving such Brookfield entities and beneficial ownership of any shares of common stock held by any of the Brookfield entities (including Longhorn Capital GS LP), with the exception of the 6,980,301 shares held by Longhorn Capital GS LP in which Seismic Holding LLC has an interest. Seismic Holding LLC is 100% indirectly owned by Qatar Investment Authority. The address of Seismic Holding LLC is Q-Tel Tower, 8th Floor, Diplomatic Area Street, West Bay, P.O. Box 23224, Doha, State of Qatar.
| (5) | HBK Master Fund L.P., HBK Master SOF II L.P., and HBK Loan I LLC are subject to the investment discretion of HBK Investments L.P. (and its affiliated subadvisors, including HBK Services LLC, to which it has delegated discretion to vote and dispose of investments), all of whose address is 2101 Cedar Springs Road, Suite 700, Dallas, Texas 75201. The registered address for each of HBK Master Fund L.P. and HBK Master SOF II L.P. is c/o CO Services Cayman Limited, P.O. Box 10008, Willow House, Cricket Square, Grand Cayman, KY1-1001, Cayman Islands. The registered address for HBK Loan I LLC is c/o National Corporate Research, Ltd., 850 New Burton Road, Suite 201, Dover, DE 19904. |
The number above includes certain shares held in reserve by the Company’s transfer agent upon Emergence, pending release following the resolution of intercreditor arrangements in connection with the Plan.
| (6) | All of the shares reported are owned by Angelo, Gordon & Co. and may be deemed to be beneficially owned by Mr. Baiera as the managing director thereof. |
| (7) | Excludes 49,485,715 shares held directly by Opps VIIb TCEH Holdings, LLC, an affiliate of Oaktree Capital Management, L.P. |
| (8) | All of the shares reported are common shares owned directly by Mr. Hunter and all of these shares have been pledged as security. |
| (9) | All of the shares reported are beneficially owned by the Brookfield Asset Management Inc. Managed Entities as disclosed in footnote (2) to this table and may be deemed to be beneficially owned by Mr. Madon as the senior managing partner of Brookfield Asset Management Inc. To the extent Mr. Madon is deemed to be the beneficial owner of any such shares beneficially owned by the Brookfield Asset Management Inc. Managed Entities, Mr. Madon expressly disclaims beneficial ownership thereof. |
146
Table of Contents
| (10) | All of the shares reported are common shares owned directly by Mr. Morgan. |
| (11) | Geoffrey Strong is associated with Apollo Management, L.P. (Apollo Management) and its affiliate, Apollo Management Holdings, L.P. (Management Holdings). Affiliates of Apollo Management and Management Holdings directly or indirectly serve as investment managers, portfolio managers, investment advisors, and in some cases serve as general partners of, the Apollo Funds. As such, Management Holdings, Apollo Management and its affiliated investment managers or investment advisors may be deemed to beneficially own the shares of our common stock held by Apollo Funds. Mr. Strong disclaims beneficial ownership of all of the shares of our common stock that may be deemed to be beneficially owned by the Apollo Funds, Apollo Management, Management Holdings or any of their affiliated investment managers or advisors. The address of Mr. Strong is c/o Apollo Management, L.P., 9 West 57th Street, 43rd Floor, New York, New York 10019. |
147
Table of Contents
Certain Relationships and Related Party Transactions
In connection with Emergence, we entered into agreements with certain of our affiliates and with parties who received shares of our common stock and TRA Rights in exchange for their claims. We have filed copies of the agreements described in this section as exhibits to the registration statement of which this prospectus is a part. The actual terms of the agreements summarized below are more detailed than the general summary information provided below. Therefore, please carefully consider the actual provisions of these agreements in connection with your decision to invest in our common stock.
Registration Rights Agreement
Pursuant to the Plan, on the Effective Date, we entered into a Registration Rights Agreement (the Registration Rights Agreement) with the selling stockholders named herein providing for registration of the resale of the Vistra Energy Corp. common stock held by such selling stockholders.
The registration statement of which this prospectus forms a part was filed pursuant to the Registration Rights Agreement. Among other things, under the terms of the Registration Rights Agreement:
| • | we will be required to use reasonable best efforts to convert the registration statement of which this prospectus forms a part into a registration statement on Form S-3 as soon as reasonably practicable after we become eligible to do so and to have such Form S-3 declared effective as promptly as practicable (but in no event more than 30 days after it is filed with the Commission); |
| • | if we propose to file certain types of registration statements under the Securities Act with respect to an offering of equity securities, we will be required to use our reasonable best efforts to offer the other parties to the Registration Rights Agreement the opportunity to register all or part of their shares on the terms and conditions set forth in the Registration Rights Agreement; and |
| • | the selling stockholders received the right, subject to certain conditions and exceptions, to request that we file registration statements or amend or supplement this prospectus (in each case subject to certain limitations on the number of registration statements and the minimum number of shares covered thereby), with the Commission for an underwritten offering of all or part of their respective shares of Vistra Energy Corp. common stock (a Demand Registration), and the Company is required to cause any such registration statement or amendment or supplement hereof (a) to be filed with the Commission promptly and, in any event, on or before the date that is 45 days, in the case of a registration statement on Form S-1, or 30 days, in the case of a registration statement on Form S-3, after we receive the written request from the relevant selling stockholders to effectuate the Demand Registration and (b) to become effective as promptly as reasonably practicable and in any event no later than 120 days after it is initially filed. |
All expenses of registration under the Registration Rights Agreement, including the legal fees of one counsel retained by or on behalf of the selling stockholders, will be paid by us.
In addition to the foregoing rights regarding the registration of Vistra Energy Corp. common stock, the Registration Rights Agreement provides certain rights to the holders of the TRA Rights under the Tax Receivable Agreement described below regarding the registration of such TRA Rights. The TRA Rights are not being registered by the registration statement of which this prospectus forms a part, but the TRA Rights may be registered at the option of certain holders.
The registration rights granted in the Registration Rights Agreement are subject to customary restrictions such as minimums, blackout periods and, if a registration is underwritten, any limitations on the number of shares to be included in the underwritten offering imposed by the managing underwriter. The Registration Rights Agreement also contains customary indemnification and contribution provisions. The Registration Rights Agreement is governed by New York law.
148
Table of Contents
Further details concerning the terms of the Registration Rights Agreement may be obtained by reviewing the Registration Rights Agreement, which is filed as an exhibit to the registration statement of which this prospectus is a part.
Stockholder’s Agreements
Pursuant to the Plan, on the Effective Date, we entered into three separate Stockholder’s Agreements with affiliates of each of Apollo Management Holdings L.P., Brookfield Asset Management Private Institutional Capital Adviser (Canada), L.P. and Oaktree Capital Management, L.P. Pursuant to each Stockholder’s Agreement, subject to the proper exercise of fiduciary duties of the Board, the applicable stockholder will, until the occurrence of a Termination Event (as defined below), be entitled to designate one person for nomination for election to the Board as a Class III director at (a) any meeting of our stockholders at which Class III directors are elected or (b) if our Charter no longer provides for the division of directors into three classes, any meeting of our stockholders at which directors are to be elected. Prior to the occurrence of a Termination Event, if a vacancy occurs because of the death, disability, disqualification, resignation or removal of the director nominee of an applicable stockholder, subject to the proper exercise of the fiduciary duties of the Board, the applicable stockholder will be entitled to designate such person’s successor.
For purposes of this section, a Termination Event means that such stockholder, together with its affiliates and investment funds, funds or accounts that are advised, managed or controlled by such stockholder or its affiliates (other than the Company or any entity that is controlled by the Company), ceases to beneficially own, in the aggregate, for a period of 20 consecutive trading days, at least 22,500,000 shares of common stock of Vistra Energy Corp. that were owned by such stockholder on the date of the applicable Stockholder’s Agreement. The rights of each stockholder under its applicable Stockholder’s Agreement will terminate automatically upon a Termination Event.
Further details concerning the terms of the Stockholder’s Agreements may be obtained by reviewing the Stockholder’s Agreements, each of which is filed as an exhibit to the registration statement of which this prospectus is a part.
Tax Receivable Agreement
On the Effective Date, we entered into a tax receivable agreement (the Tax Receivable Agreement) with a transfer agent on behalf of certain former first lien creditors of TCEH. The Tax Receivable Agreement generally provides for the payment by us to holders of TRA Rights of 85% of the amount of cash savings, if any, in United States federal, state and local income tax that we realize in periods after Emergence as a result of (a) certain transactions consummated pursuant to the Plan (including any step-up in tax basis in our assets resulting from the PrefCo Preferred Stock Sale), (b) the tax basis of all assets acquired in connection with the Lamar and Forney Acquisition in April 2016 and (c) tax benefits related to imputed interest deemed to be paid by us as a result of payments under the Tax Receivable Agreement, plus interest accruing from the due date of the applicable tax return.
Pursuant to the Tax Receivable Agreement, we issued the TRA Rights to our Predecessor to be held in escrow for the benefit of the first lien secured creditors of our Predecessor entitled to receive such TRA Rights under the Plan. Such TRA Rights are subject to various transfer restrictions described in the Tax Receivable Agreement and are entitled to certain registration rights more fully described in the Registration Rights Agreement. The TRA Rights are not being registered by the registration statement of which this prospectus forms a part.
Further details concerning the terms of the Tax Receivable Agreement may be obtained by reviewing the Tax Receivable Agreement, which is filed as an exhibit to the registration statement of which this prospectus is a part.
The amount and timing of any payments under the Tax Receivable Agreement will vary depending upon a number of factors, including the amount and timing of the taxable income we generate in the future and the tax rate then applicable, our use of loss carryovers and the portion of our payments under the Tax Receivable Agreement constituting imputed interest.
149
Table of Contents
The payments we will be required to make under the Tax Receivable Agreement could be substantial. Future transactions or events could change the timing and/or amount of the actual tax benefits realized and the corresponding Tax Receivable Agreement payments from these tax attributes.
In addition, although we are not aware of any issue that would cause the IRS to challenge the tax benefits that are the subject of the Tax Receivable Agreement, recipients of the payments under the Tax Receivable Agreement will not be required to reimburse us for any payments previously made if such tax benefits are subsequently disallowed. As a result, in such circumstances, Vistra Energy Corp. could make payments under the Tax Receivable Agreement that are greater than its actual cash tax savings and may not be able to recoup those payments, which could adversely affect our liquidity.
In addition, because Vistra Energy Corp. is a holding company with no operations of its own, its ability to make payments under the Tax Receivable Agreement is dependent on the ability of its subsidiaries to make distributions to it. Vistra Energy’s future debt agreements may restrict the ability of its subsidiaries to make distributions to it, which could affect its ability to make payments under the Tax Receivable Agreement. To the extent that Vistra Energy Corp. is unable to make payments under the Tax Receivable Agreement because of restriction under its debt agreements, such payments will be deferred and will accrue interest until paid, which could adversely affect our results of operations and could also affect our liquidity in periods in which such payments are made.
Finally, the Tax Receivable Agreement provides that, in the event that Vistra Energy Corp. breaches any of its material obligations under the Tax Receivable Agreement, or upon certain mergers, asset sales, or other forms of business combination or certain other changes of control, the transfer agent under the Tax Receivable Agreement may treat such event as an early termination of the Tax Receivable Agreement, in which case Vistra Energy Corp. would be required to make an immediate payment to the holder of the TRA Rights equal to the present value (at a discount rate equal to LIBOR plus 100 basis points) of the anticipated future tax benefits based on certain assumptions. As a result, upon such a breach or change of control, Vistra Energy Corp. could be required to make a lump-sum payment under the Tax Receivable Agreement that is greater than the specified percentage of its actual cash tax savings and could have a substantial negative impact on our liquidity.
Tax Matters Agreement
On the Effective Date, we entered into a Tax Matters Agreement (the Tax Matters Agreement), with EFH Corp., EFIH, EFIH Finance Inc. and EFH Merger Co. LLC, whereby the parties have agreed to take certain actions and refrain from taking certain actions in order to preserve the intended tax treatment of the Spin-Off and to indemnify the other parties to the extent a breach of such agreement results in additional taxes to the other parties.
Among other things, the Tax Matters Agreement allocates the responsibility for taxes for periods prior to the Spin-Off between EFH Corp. and us. For periods prior to the Spin-Off, (a) Vistra Energy is generally required to reimburse EFH Corp. with respect to any taxes paid by EFH Corp. that are attributable to us and (b) EFH Corp. is generally required to reimburse us with respect to any taxes paid by us that are attributable to EFH Corp.
We are also required to indemnify EFH Corp. against taxes, under certain circumstance, if the IRS or another taxing authority successfully challenges the amount of gain relating to the PrefCo Preferred Stock Sale or the amount or allowance of EFH Corp.’s net operating loss deductions.
Subject to certain exceptions, the Tax Matters Agreement prohibits us from taking certain actions that could reasonably be expected to undermine the intended tax treatment of the Spin-Off or to jeopardize the conclusions of the private letter ruling we obtained from the IRS or opinions of counsel received by us or EFH Corp., in each case, in connection with the Spin-Off. Certain of these restrictions apply for two years after the Spin-Off and are described above under “Risk Factors — Risks Related to Our Structure and Ownership of Our Common Stock.”
150
Table of Contents
Under the Tax Matters Agreement, we may engage in an otherwise restricted action if (a) we obtain written consent from EFH Corp., (b) such action or transaction is described in or otherwise consistent with the facts in the private letter ruling we obtained from the IRS in connection with the Spin-Off, (c) we obtain a supplemental private letter ruling from the IRS, or (d) we obtain an unqualified opinion of a nationally recognized law or accounting firm that is reasonably acceptable to EFH Corp. that the action will not affect the intended tax treatment of the Spin-Off.
Further details concerning the terms of the Tax Matters Agreement may be obtained by reviewing the Tax Matters Agreement, which is filed as an exhibit to the registration statement of which this prospectus is a part.
Separation Agreement
Pursuant to the Plan, on the Effective Date, EFH Corp., Vistra Energy Corp. and Vistra Operations entered into a Separation Agreement (the Separation Agreement). Under the key terms of the Separation Agreement, on the Effective Date, EFH Corp. and certain other Debtors (including EFCH and TCEH) transferred to Vistra Energy Corp. certain assets and liabilities related to the TCEH Debtors’ operations, including certain employee benefit plans specifically identified in the Separation Agreement, which Vistra Energy Corp., in turn, transferred to Vistra Operations. Pursuant to the Separation Agreement, Vistra Operations accepted, assumed and agreed to faithfully perform, discharge and fulfill certain assumed liabilities. The Contribution was effected pursuant to the side-by-side operation of the Separation Agreement and the Plan. For additional information regarding the Contribution, see “The Reorganization and Emergence.”
Further details concerning the terms of the Separation Agreement may be obtained by reviewing the Separation Agreement, which is filed as an exhibit to the registration statement of which this prospectus is a part.
Transition Services Agreement
On the Effective Date and pursuant to the Plan, EFH Corp. and Vistra Operations entered into a Transition Services Agreement (the Transition Services Agreement). Pursuant to the Transition Services Agreement, among other things:
| • | Vistra Operations will provide certain services to EFH Corp., including business service administration, accounting, corporate secretary, tax, human resources, information technology, internal audit and Sarbanes-Oxley Act compliance, physical facilities and corporate security, treasury and legal services, (collectively, the Transition Services) until the earlier of (a) 12 months from the effective date for tax services and 6 months from the Effective Date for all other Transition Services and (b) the termination of all Transition Services, whether by EFH Corp. upon at least 30 days’ prior written notice to Vistra Operations, mutual written consent of EFH Corp. and Vistra Operations or any other termination action permitted by the Transition Services Agreement; and |
| • | EFH Corp. will pay Vistra Operations all reasonable and documented fees, costs and expenses (including employee-related, overhead and general and administrative expenses) incurred by Vistra Operations related directly to the Transition Services. |
Further details concerning the terms of the Transition Services Agreement may be obtained by reviewing the Transition Services Agreement, which is filed as an exhibit to the registration statement of which this prospectus is a part.
Split Participant Agreement
On the Effective Date, pursuant to the Plan, and following the effectiveness of the Separation Agreement, Vistra Operations and Oncor entered into an Amended and Restated Split Participant Agreement (the Split Participant Agreement). Pursuant to the Split Participant Agreement, among other things, Oncor agreed to
151
Table of Contents
provide certain post-retirement welfare and life insurance benefits, and Vistra Operations agreed to provide certain pension benefits (as identified on Schedules I, II and III, as applicable, to the Split Participant Agreement) to certain current and future retirees of EFH Corp., Vistra Operations and Oncor (or one of their direct or indirect subsidiaries) whose employment included service that has been allocated to both (a) Oncor (or one of its predecessor regulated electric transmission and distribution utility businesses) and (b) EFH Corp. (or one of its direct or indirect subsidiaries that is not a regulated electric transmission and distribution utility).
Further details concerning the terms of the Split Participant Agreement may be obtained by reviewing the Split Participant Agreement, which is filed as an exhibit to the registration statement of which this prospectus is a part.
Review and Approval of Related Party Transactions
The Audit Committee will review and approve transactions with our directors, officers, holders of more than 5% of our voting securities or affiliates of any of the foregoing. Prior to approving any transaction with any such related party, the Audit Committee will consider the material facts as to the related party’s relationship with us and interest in the transaction. Related party transactions will not be approved unless the Audit Committee has approved the transaction. We did not have a formal review and approval policy for related party transactions at the time of any transaction described above.
152
Table of Contents
Credit Facilities
General
As of the Effective Date, the Vistra Operations Credit Facilities initially consisted of (i) a senior secured first lien revolving credit facility in an aggregate principal amount of $750 million, with a maturity date of August 4, 2021, including a $500 million letter of credit sub-facility, which we refer to as the Initial Revolving Credit Facility, (ii) a senior secured term loan B facility in an aggregate principal amount of $2.85 billion, with a maturity date of August 4, 2023, which we refer to as the Initial Term Loan B Facility, and (iii) a senior secured term loan C facility in an aggregate principal amount of $650 million, with a maturity date of August 4, 2023, which we refer to as the Term Loan C Facility.
On December 14, 2016, Vistra Operations obtained (i) $1 billion aggregate principal amount of incremental term loans, which we refer to as the 2016 Incremental Term Loans, and together with the Initial Term Loan B Facility, the Term Loan B Facility, and (ii) $110 million of incremental revolving credit commitments, which we refer to as the 2016 Incremental Revolving Credit Commitments, and together with the Initial Revolving Credit Facility, the Revolving Credit Facility. In addition, Vistra Operations increased the aggregate amount of letters of credit available under the Revolving Credit Facility from $500 million to $600 million. We refer to the Term Loan B Facility and the Term Loan C Facility as the Term Loan Facilities and to the Revolving Credit Facility and the Term Loan Facilities as the Vistra Operations Credit Facilities.
The 2016 Incremental Revolving Credit Commitments are part of the same class as the $750 million Initial Revolving Credit Facility and are subject to the same terms, including the maturity date. The 2016 Incremental Term Loans, which are part of a separate class from the $2.85 billion Initial Term Loan B Facility, have a maturity date of December 14, 2023 and are subject to the same terms as the Initial Term Loan B Facility, other than the interest rates and prepayment premium described below.
Proceeds from borrowings of $2.85 billion under the Initial Term Loan B Facility were used to refinance the TCEH DIP Roll Facilities and to pay certain claims and administrative expenses in connection with Emergence. Proceeds from borrowings of $650 million under the Term Loan C Facility were used to secure funded letters of credit. Proceeds from the 2016 Incremental Term Loans were used to make the 2016 Special Dividend on December 30, 2016. Borrowings under the Revolving Credit Facility are available for, without limitation, working capital, capital expenditures and general business purposes. All borrowings under the Revolving Credit Facility are subject to the satisfaction of customary conditions, including the absence of a default and the accuracy of representations and warranties.
As of December 31, 2016, after giving effect to the borrowing of the 2016 Incremental Term Loans, $0, $3.85 billion and $650 million of loans were outstanding under the Revolving Credit Facility, the Term Loan B Facility and the Term Loan C Facility, respectively. In addition, Vistra Operations may request one or more incremental term loan and/or increase commitments under the Revolving Credit Facility in an aggregate amount of up to the sum of (1) the greater of (x) $1.0 billion and (y) an amount equal to 60.0% of Consolidated EBITDA (as defined in the credit agreement), plus (2) certain voluntary prepayments of term loans and commitment reductions of the revolving credit facility commitments, plus (3) an unlimited amount so long as, (x) in the case of indebtedness under additional credit facilities that rank pari passu with the liens on the collateral securing the Vistra Operations Credit Facilities, the pro forma consolidated first lien net leverage ratio would be no greater than 3.00 to 1.00, (y) in the case of indebtedness under additional credit facilities that rank junior to the liens on the collateral securing the Vistra Operations Credit Facilities, the pro forma consolidated secured net leverage ratio would be no greater than 4.00 to 1.00, and (z) in the case of unsecured indebtedness or indebtedness secured only by liens on assets that do not constitute collateral, the pro forma consolidated total net leverage ratio would be no greater than 4.50 to 1.00, subject to certain conditions and receipt of commitments by existing or additional lenders.
153
Table of Contents
Interest Rate and Fees
On February 1, 2017, Vistra Operations entered into an amendment to the credit agreement, effective February 6, 2017, to reduce the interest rates on the Initial Term Loan B Facility, Term Loan C Facility and Revolving Credit Facility.
Borrowings under the Revolving Credit Facility bear interest at a rate equal to, at our option, either LIBOR plus an applicable margin of 2.75% or a base rate plus an applicable margin of 1.75%.
Borrowings under the Initial Term Loan B Facility and the Term Loan C Facility bear interest at a rate equal to, at our option, either LIBOR (subject to a LIBOR floor of .75%) plus an applicable margin of 2.75% or a base rate plus an applicable margin of 1.75%.
The 2016 Incremental Term Loans bear interest at a rate equal to, at our option, either LIBOR (subject to a LIBOR floor of .75%) plus an applicable margin of 3.25% or a base rate plus an applicable margin of 2.25%.
In addition to paying interest on outstanding loans under the Vistra Operations Credit Facilities, we are required to pay a commitment fee to the lenders under the Revolving Credit Facility in respect of the unutilized commitments thereunder. The applicable commitment fee under the Revolving Credit Facility is subject to a step-down based on meeting a leverage ratio. We also pay customary agency fees as well as letter of credit participation fees computed at a rate per annum equal to the applicable margin for LIBOR borrowings on the dollar equivalent of the daily stated amount of outstanding letters of credit plus such letter of credit issuer’s customary documentary and processing fees and charges and a fronting fee on the daily stated amount of each letter of credit.
Amortization and Prepayments
We are required to make scheduled quarterly payments on the Term Loan B Facility in annual amounts equal to 1.0% of the original principal amount of the Term Loan B Facility for six years and three quarters, with the balance paid at maturity.
In addition, we are required to prepay outstanding loans under the Term Loan Facilities, subject to certain exceptions, with:
| • | 100% of the net cash proceeds of any issuance or incurrence of debt, other than proceeds from debt permitted under the Vistra Operations Credit Facilities; and |
| • | 100% of the net cash proceeds of all non-ordinary course asset sales, other dispositions of property or certain casualty events, in each case subject to certain exceptions and provided that we may reinvest those proceeds in assets to be used in its business or in certain other permitted investments. |
We may make voluntary prepayments of outstanding loans under the Term Loan Facilities and the Revolving Credit Facility and voluntary reductions of the unutilized portion of the commitments under the Revolving Credit Facility without penalty, subject to customary “breakage” costs with respect to LIBOR loans.
Term loans under the Initial Term Loan B Facility and the Term Loan C Facility are prepayable at any time without premium or penalty; provided that there will be a 1.00% prepayment premium in connection with any repricing of such term loans that reduces the interest rate prior to August 6, 2017. The 2016 Incremental Term Loans are prepayable at any time without premium or penalty, provided that there will be a 1.00% prepayment premium in connection with any repricing of such term loans that reduces the interest rate prior to June 14, 2017.
Collateral and Guarantees
Vistra Operations’ obligations under the Vistra Operations Credit Facilities are unconditionally and irrevocably guaranteed by Vistra Intermediate Company LLC and each of Vistra Operations’ existing and future
154
Table of Contents
direct and indirect material wholly-owned domestic subsidiaries. Additionally, Vistra Operations’ obligations under the Vistra Operations Credit Facilities are secured by a first-priority lien on substantially all tangible and intangible assets of Vistra Operations and each subsidiary guarantor and all of Vistra Operations’ capital stock and the capital stock of each subsidiary guarantor and 65% of the capital stock of the first-tier foreign subsidiaries that are not subsidiary guarantors (in each case subject to certain exceptions), pursuant to a collateral trust agreement, by and among Vistra Operations, the other grantors party thereto, the Railroad Commission of Texas, Deutsche Bank AG New York Branch and Delaware Trust Company, as collateral trustee.
Restrictive Covenants and Other Matters
The Revolving Credit Facility requires that we, subject to a testing threshold, comply on a quarterly basis with a maximum consolidated first lien net leverage ratio of 4.25 to 1.00. The testing threshold will be satisfied at any time at which the sum of outstanding revolving credit facility loans and revolving letters of credit (excluding up to $100 million of undrawn revolving letters of credit and cash collateralized or backstopped letters of credit) exceeds 30% of the outstanding commitments under the Revolving Credit Facility at such time.
The Vistra Operations Credit Facilities contain restrictive covenants that limit Vistra Operations’ ability and the ability of its restricted subsidiaries to, among other things, (i) incur additional indebtedness or issue certain preferred shares, (ii) make certain investments, loans, and advances (including acquisitions), (iii) consolidate, merge, sell or otherwise dispose of all or any part of its assets, (iv) pay dividends or make distributions or other restricted payments, (v) create liens on certain assets, (vi) sell assets, (vii) enter into certain transactions with affiliates, (viii) enter into sale-leaseback transactions, (ix) restrict dividends from our subsidiaries or restrict liens, and (x) modify the terms of certain debt agreements. Each of these covenants is subject to customary or agreed-upon exceptions, baskets and thresholds.
The Vistra Operations Credit Facilities also contain certain other customary affirmative covenants, including requirements to provide financial and other information to agents and to not change our lines of business, and events of default, including events of default resulting from non-payment of any principal, interest or fees, material breaches of representations and warranties, failure to comply with the consolidated first lien net leverage ratio covenant solely with respect to the Revolving Credit Facility, defaults under other agreements and instruments and the entry of a final judgment exceeding $300 million against Vistra Operations and its restricted subsidiaries, each subject to customary exceptions, baskets and thresholds (including equity cure provisions) set forth in the agreement.
155
Table of Contents
The following description of the material terms of the capital stock of Vistra Energy Corp. includes a summary of specified provisions included in Vistra Energy Corp.’s certificate of incorporation (Charter) and bylaws (Bylaws). This description also summarizes relevant provisions of the Delaware General Corporation Law (DGCL). The terms of our Charter and Bylaws will be, and the terms of the DGCL are, more detailed than the general information provided below. Accordingly, the more general information provided below is subject to, and qualified in its entirety by reference to, the actual provisions of these documents and the DGCL.
Authorized Capital Stock
We have the authority to issue a total of 1,900,000,000 shares of capital stock, consisting of:
| • | 1,800,000,000 shares of our common stock, par value $.01 per share; and |
| • | 100,000,000 shares of our preferred stock, par value $.01 per share. |
Outstanding Capital Stock
As of April 25, 2017, 427,587,401 shares of our common stock were issued and outstanding and owned by 184 holders of record, and no shares of our preferred stock were issued and outstanding.
Options
The Board adopted the 2016 Incentive Plan, effective as of the Effective Date, under which an aggregate of 22,500,000 shares of our common stock were reserved for issuance as equity based awards to our non-employee directors, employees and certain other persons. The types of awards that may be granted under the 2016 Incentive Plan include stock options, restricted stock units (RSUs), restricted stock, performance awards and other forms of awards granted or denominated in shares of our common stock, among others. For additional information regarding the 2016 Incentive Plan, see “Executive Compensation — 2016 Omnibus Incentive Plan.”
Pursuant to the 2016 Incentive Plan, in accordance with the Morgan Agreement, the Burke Agreement, the Moore Agreement, the Holden Agreement, the Kirby Agreement and the Graziano Agreement, we have issued to six of our executive officers equity awards with an aggregate grant date fair value of $15,500,000, consisting of an aggregate of 484,058 RSUs and 1,649,954 employee stock options at a weighted average exercise price of $13.70 per share after adjusting the exercise price downward to account for the 2016 Special Dividend. These options may be exercised after a four year graded vesting period and will expire on the tenth anniversary of the grant date thereof. For additional information regarding these outstanding equity grants, see “Executive Compensation — Employment Agreements.”
Rights and Preferences of Vistra Energy Corp. Capital Stock
Common Stock
Voting Rights
All shares of our common stock have identical rights and privileges. The holders of shares of our common stock are entitled to vote on all matters submitted to a vote of our stockholders, including the election of directors. On all matters to be voted on by holders of shares of our common stock, the holders will be entitled to one vote for each share of our common stock held of record, and will have no cumulative voting rights.
Dividend Rights
Subject to limitations under applicable Delaware law, preferences that may apply to any outstanding shares of our preferred stock and contractual restrictions, holders of our common stock are entitled to receive dividends
156
Table of Contents
or other distributions ratably, when, as and if declared by the Board. The ability of the Board to declare dividends with respect to our common stock, however, will be subject such limitations, preferences and restrictions and the availability of sufficient funds under the DGCL to pay such dividends.
Rights upon Liquidation
In the event of a liquidation, dissolution or winding up of Vistra Energy Corp., after the payment in full of all amounts owed to our creditors and holders of any outstanding shares of our preferred stock, the remaining assets of Vistra Energy Corp. will be distributed ratably to the holders of shares of our common stock. The rights, preferences and privileges of holders of shares of our common stock are subject to, and may be adversely affected by, the rights of the holders of shares of any class or series of preferred stock which the Board may designate and issue in the future without stockholder approval.
Other Rights
Holders of shares of our common stock do not have pre-emptive, subscription, redemption or conversion rights.
Blank Check Preferred Stock
Subject to limitations under applicable Delaware law, the Board is authorized to issue, from time to time and without stockholder approval, up to an aggregate of 100,000,000 shares of preferred stock in one or more classes or series and to fix the designations, powers, preferences, and relative, participating, optional or other rights, if any, and the qualifications, limitations or restrictions, if any, of the shares of each such class or series, including the dividend rights, conversion rights, voting rights, redemption rights (including sinking fund provisions), liquidation preferences and the number of shares constituting any class or series. The issuance of preferred stock with voting and conversion rights would also adversely affect the voting power of the holders of shares of our common stock, including the potential loss of voting control to others.
Stockholder Meetings
Our Charter and Bylaws provide that annual stockholder meetings will be held at a date, time and place, if any, as exclusively selected by the Board. Our Charter and Bylaws provide that, except as otherwise required by applicable law or the terms of any class or series of preferred stock issued in the future, special meetings of the stockholders may be called by (a) the Board at any time or (b) by the Chairman of the Board or the Secretary of Vistra Energy Corp. upon the written request or requests of one or more stockholders of record holding a majority of the voting power of the then-outstanding shares of our capital stock entitled to vote on the matter or matters to be brought before the proposed special meeting and complying with the notice procedures set forth in our Bylaws. Unless otherwise provided by the terms of any class or series of preferred stock issued in the future, our stockholders have no authority to act by written consent. To the extent permitted under the DGCL, we may conduct stockholder meetings by remote communications.
Stockholder Right to Designate Directors
Pursuant to each Stockholder’s Agreement, subject to the proper exercise of fiduciary duties of the Board, the applicable stockholder will, until the occurrence of a Termination Event (as defined in “Certain Relationships and Related Party Transactions”), be entitled to designate one person for nomination for election to the Board as a Class III director at (i) any meeting of our stockholders at which Class III directors are elected or (ii) if our Charter no longer provides for the division of directors into three classes, any meeting of our stockholders at which directors are to be elected. Prior to the occurrence of a Termination Event, if a vacancy occurs because of the death, disability, disqualification, resignation or removal of the director nominee of an applicable stockholder, subject to the proper exercise of the fiduciary duties of the Board, the applicable stockholder will be entitled to designate such person’s successor.
157
Table of Contents
Anti-takeover Effects of Provisions In Our Charter and Bylaws
Our Charter and Bylaws contain a number of provisions which may have the effect of discouraging transactions that involve an actual or threatened change of control of Vistra Energy Corp. In addition, provisions of our Charter and Bylaws may be deemed to have anti-takeover effects and may delay, defer or prevent a tender offer or takeover attempt that a stockholder might consider in his, her or its best interest, including those attempts that might result in a premium over the market price of the shares of our common stock held by our stockholders.
Staggered Board
Our Charter provides for three classes of directors, each of which is to be elected on a staggered basis for a term of three years. Our Charter and Bylaws provide that the Board consists of such number of directors as is determined from time to time by the vote of a majority of the total number of directors then authorized. Please see “Management — Directors” for a more detailed description of the composition of our initial Board.
No Written Consent of Stockholders
Any action to be taken by our stockholders must be effected at a duly called annual or special meeting and may not be effected by written consent.
Special Meetings of Stockholders
Except as required by the DGCL or the terms of any class or series of preferred stock issued in the future, special meetings of our stockholders may be called only by (a) the Board at any time or (b) the Chairman of the Board or the Secretary of Vistra Energy Corp. upon written request of one or more stockholders of record holding a majority of the voting power of the then-outstanding shares of our capital stock entitled to vote on the matter or matters to be brought before the proposed special meeting and complying with the notice procedures set forth in our Bylaws.
Advance Notice Requirement
Stockholders must provide timely notice when seeking to:
| • | bring business before an annual meeting of stockholders; |
| • | bring business before a special meeting of stockholders (if contemplated and permitted by the notice of a special meeting); or |
| • | nominate candidates for election to the Board at an annual meeting of stockholders or at a special meeting of stockholders called for the purpose of electing one or more directors to the Board. |
To be timely, a stockholders notice generally must be received by the Secretary of Vistra Energy Corp. at our principal executive offices:
| • | in the case of an annual meeting: |
| • | not later than the close of business on the 90th day nor earlier than the close of business on the 120th day prior to the first anniversary of the date of the immediately preceding year’s annual meeting, or |
| • | if the annual meeting is called for a date that is more than 30 days before or more than 60 days after the first anniversary of the date of the preceding year’s annual meeting, or if no annual meeting was held in the preceding year, not earlier than the close of business on the 120th day prior to such annual meeting and not later than the close of business on the later of the 90th day prior to the annual meeting and the 10th day following the day on which the first public announcement of the date of the annual meeting is made by Vistra Energy Corp; or |
158
Table of Contents
| • | in the case of a special meeting, not earlier than the close of business on the 120th day and not later than the close of business on the later of the 90th day prior to the special meeting and the 10th day following the day on which public announcement is first made of the date of the special meeting and the nominees proposed by the Board. |
Our Charter and Bylaws also specify requirements as to the form and content of the stockholder’s notice. These provisions may preclude stockholders from bringing matters before or proposing director nominees to an annual meeting or a special meeting of stockholders.
Issuance of Blank Check preferred stock
The Board is authorized to issue, without further action by the stockholders, up to 100,000,000 shares of preferred stock with rights and preferences designated from time to time by the Board as described above under “—Rights and Preferences of Vistra Energy Corp. Capital Stock — Blank Check Preferred Stock.” The existence of authorized but unissued shares of preferred stock may enable the Board to render more difficult or discourage an attempt to obtain control of Vistra Energy Corp. by means of a merger, tender offer, proxy contest or otherwise.
Removal of Directors
Our Charter and Bylaws provide that directors may only be removed for cause and only upon the affirmative vote of a majority of the voting power of the capital stock outstanding and entitled to vote thereon.
Section 203 of the DGCL
In our Charter, we have elected not to be governed by Section 203 of the DGCL, as permitted under and pursuant to subsection (b)(3) of Section 203. Section 203 prohibits a publicly held Delaware corporation from engaging in a business combination, such as a merger, with a person or group owning 15% or more of the corporation’s outstanding voting stock for a period of three years following the date the person became an interested stockholder, unless (with certain exceptions) the business combination or the transaction in which the person became an interested stockholder is approved in a prescribed manner. Accordingly, we are currently not subject to any anti-takeover effects of Section 203, although no assurance can be given that we will not elect to be governed by Section 203 of the DGCL in the future.
Amendment of Bylaws and Charter
The approval of a 66 2/3% super-majority of the voting power of the then outstanding shares of our capital stock entitled to vote will be required to amend certain provisions of our Bylaws or to amend certain provisions of our Charter, including provisions relating to indemnification and exculpation of directors and officers and provisions relating to amendment of our Bylaws and Charter by the Board. In addition, the Charter provides certain rights to the Principal Stockholders, relating to business opportunities, which are more fully described under “— Business Opportunities” below. Until the last to occur of (a) each Principal Stockholder and its respective Affiliates ceases to own at least 5% of our outstanding common stock or (b) no director is serving on the Board pursuant to the rights of the Principal Stockholders to nominate such directors in accordance with the Bylaws and each such Principal Stockholder’s Stockholder Agreement, the approval of an 80% super-majority of the voting power of the then outstanding shares of our capital stock entitled to vote will be required to amend the Charter in any manner inconsistent with these rights.
Business Opportunities
Our Charter provides that Apollo Management Holdings L.P., Brookfield Asset Management Private Institutional Capital Adviser (Canada), L.P. and Oaktree Capital Management, L.P. and their respective affiliates, to the fullest extend permitted by law, have no duty to refrain from engaging in the same or similar business
159
Table of Contents
activities or lines of business in which Vistra Energy Corp. or any of our affiliates now engage or propose to engage or otherwise competing with Vistra Energy Corp. or any of our affiliates. To the fullest extent permitted by applicable law, we have renounced any interest or expectancy in, or the right to be offered an opportunity to participate in, any business opportunity which may be a business opportunity of one of such stockholders. We have not, however, renounced any interest in any business opportunity offered to any director or officer of Vistra Energy Corp. if such opportunity is expressly offered to such person solely in his or her capacity as a director or officer of Vistra Energy Corp.
Authorized but Unissued Shares
Delaware law does not require stockholder approval for any issuance of authorized shares. However, the listing requirements of the NYSE, which will apply so long as our common stock remains listed on the NYSE, require stockholder approval of certain issuances equal to or exceeding 20% of the then outstanding voting power or then outstanding number of shares of common stock. These additional shares may be utilized for a variety of corporate purposes, including future public or private offerings to raise additional capital and for corporate acquisitions.
Dissenters’ Rights of Appraisal and Payment
Under the DGCL, with certain exceptions, our stockholders have appraisal rights in connection with a merger or consolidation of Vistra Energy Corp. Pursuant to the DGCL, stockholders who properly request and perfect appraisal rights in connection with such merger or consolidation have the right to receive payment of the fair value of their shares as determined by the Delaware Court of Chancery.
Stockholders’ Derivative Actions
Under the DGCL, any of our stockholders may bring an action in our name to procure a judgment in our favor, also known as a derivative action, provided that the stockholder bringing the action is a holder of shares of our capital stock at the time of the transaction to which the action relates or such stockholder’s stock thereafter devolved by operation of law.
Exclusive Forum
Our Charter provides that unless Vistra Energy Corp. consents in writing to the selection of an alternative forum, to the fullest extent permitted by law, and subject to applicable jurisdictional requirements, any state court located in the State of Delaware (or, if no state court located within the State of Delaware has jurisdiction, the federal district court for the District of Delaware) is the sole and exclusive forum for any stockholder (including any beneficial owner) to bring any claim (a) based upon a violation of a duty by a current or former director, officer, employee or stockholder in such capacity or (b) as to which the DGCL confers jurisdiction on the Court of Chancery. Any person or entity purchasing or otherwise acquiring or holding any interest in shares of our capital stock shall be deemed to have notice of, and consented to the forum provisions in, our Charter. The enforceability of similar forum provisions in other companies’ certificates of incorporation, however, has been challenged in legal proceedings, and it is possible that a court could find these types of provisions to be inapplicable or unenforceable.
Limitations on Liability and Indemnification of Directors and Officers
The DGCL authorizes corporations to limit or eliminate the personal liability of our directors to corporations and their stockholders for monetary damages for breaches of directors’ fiduciary duties, subject to certain exceptions and conditions. Our Charter limits the liability of directors to the fullest extent permitted by the DGCL. Such section eliminates the personal liability of a director to Vistra Energy for monetary damages for breach of fiduciary duty as a director, except for liability (i) for any breach of the director’s duty of loyalty to
160
Table of Contents
Vistra energy or our stockholders, (ii) for acts or omission not in good faith or which involve intentional misconduct or a knowing violation of law, (iii) under Section 174 of the DGCL, or (iv) for any transaction from which the director derived an improper personal benefit. In addition, our Bylaws and separate indemnification agreements provide that we must indemnify our directors and officers to the fullest extent permitted by the DGCL. Under our Bylaws, Vistra Energy Corp. agrees that it is the indemnitor of first resort to provide advancement of expenses or indemnification to directors and officers.
The limitation of liability and indemnification provisions included in our Charter and Bylaws and separate indemnification agreements may discourage stockholders from bringing a lawsuit against directors for breach of their fiduciary duty. These provisions may also have the effect of reducing the likelihood of derivative litigation against directors and officers, even though such an action, if successful, might otherwise benefit us and our stockholders. In addition, your investment may be adversely affected to the extent we pay the costs of settlement and damage awards against directors and officers pursuant to these indemnification provisions.
Transfer Agent and Registrar
The transfer agent and registrar for our common stock is American Stock Transfer & Trust Company.
Listing
We have applied to list the shares of our common stock on the NYSE under the symbol “VST.”
161
Table of Contents
Material U.S. Federal Income Tax Considerations for Non-U.S. Holders
The following is a general discussion of the material U.S. federal income tax consequences of the acquisition, ownership and disposition of our common stock purchased pursuant to this offering by a non-U.S. holder. For the purpose of this discussion, a non-U.S. holder is any beneficial owner of our common stock that is an individual, corporation, estate or trust and that is not for U.S. federal income tax purposes any of the following:
| • | an individual citizen or resident of the U.S.; |
| • | a corporation (or other entity treated as a corporation for U.S. federal income tax purposes) created or organized in the U.S. or under the laws of the United States or any state or the District of Columbia; |
| • | a partnership (or other entity or arrangement treated as a partnership or other pass-through entity for U.S. federal income tax purposes); |
| • | an estate whose income is subject to U.S. federal income tax regardless of its source; or |
| • | a trust (x) whose administration is subject to the primary supervision of a court within the United States and which has one or more U.S. persons (as defined for U.S. federal income tax purposes) who have the authority to control all substantial decisions of the trust or (y) which has made a valid election under applicable U.S. Treasury Regulations to be treated as a U.S. person. |
An individual who is not a citizen of the United States may, subject to certain restrictions and limitations contained in any applicable income tax treaties, be deemed to be a resident of the United States by reason of being present in the United States for at least 31 days in the calendar year and an aggregate of at least 183 days during a three year period ending in the current calendar year (counting for such purposes all of the days present in the current year, one-third of the days present in the immediate preceding calendar year and one sixth of the days present in the second preceding calendar year). U.S. residents are generally taxed for U.S. federal income tax purposes in the same manner as U.S. citizens.
If a partnership (or an entity treated as a partnership for U.S. federal income tax purposes) holds our common stock, the tax treatment of a partner in the partnership will generally depend on the status of the partner and upon the activities of the partnership. Accordingly, if you are treated as a partner of a partnership that holds our common stock you should consult your own tax advisor as to the particular U.S. federal income tax consequences applicable to you.
This discussion assumes that a non-U.S. holder will hold our common stock that may be resold pursuant to this prospectus as a capital asset (generally, property held for investment) within the meaning of Section 1221 of the Code. This discussion does not address all aspects of U.S. federal taxation (including alternative minimum, gift and estate tax) or any other U.S. federal tax laws, including Medicare taxes imposed on net investment income or any aspects of state, local or non-U.S. taxation. It does not consider any U.S. federal income tax considerations that may be relevant to non-U.S. holders that may be subject to special treatment under U.S. federal income tax laws, including, without limitation, U.S. expatriates, life insurance companies, tax-exempt or governmental organizations, dealers in securities or currency, banks or other financial institutions, investors whose functional currency is other than the U.S. dollar, “passive foreign investment companies,” “controlled foreign corporations,” except as otherwise provided below, persons who at any time hold more than 5% of the fair market value of any class of our stock and investors that hold our common stock as part of a hedge, straddle or conversion transaction. Furthermore, the following discussion is based on current provisions of the Code, Treasury Regulations and administrative and judicial interpretations thereof, all as in effect on the date hereof, and all of which are subject to change, possibly with retroactive effect. We have not sought, and will not seek, any ruling from the IRS or any opinion of counsel with respect to the tax consequences discussed herein, and there can be no assurance that the IRS will not take a position contrary to the tax consequences discussed below or that any position taken by the IRS would not be sustained.
162
Table of Contents
We urge each prospective investor to consult a tax advisor regarding the U.S. federal, state, local and non-U.S. income and other tax consequences of acquiring, holding and disposing of shares of our common stock.
Distributions
We do not plan to make any distributions for the foreseeable future. However, if we do make distributions on our common stock, those payments will constitute dividends to the extent paid from our current or accumulated earnings and profits, as determined under U.S. federal income tax principles. To the extent those distributions exceed our current and accumulated earnings and profits, the distributions will first reduce a non-U.S. holder’s adjusted tax basis in the common stock (determined on a share by share basis), but not below zero, and then will be treated as gain from the sale of the common stock (subject to the rules discussed below under “— Gain on Disposition of Common Stock”). Any such distributions will also be subject to the discussion below under the section entitled “—Additional Withholding Tax Relating to Foreign Accounts.” We expect to have significant amounts of earnings and profits as of the date of this prospectus.
Any dividends (out of earnings and profits) paid to a non-U.S. holder of our common stock that are not effectively connected with a U.S. trade or business conducted by the non-U.S. holder generally will be subject to U.S. withholding tax either at a rate of 30% of the gross amount of the dividend or such lower rate as may be specified by an applicable tax treaty. Non-U.S. holders should consult their tax advisors regarding their entitlement to benefits under an applicable income tax treaty and the requirements for and manner of claiming the benefits of such treaty (including, without limitation, the need to obtain a U.S. taxpayer identification number). To receive the benefit of a reduced treaty rate, a non-U.S. holder must generally provide us or our paying agent with a valid IRS Form W-8BEN-E, W-8BEN or other appropriate version of IRS Form W-8 certifying qualification for the reduced rate and otherwise comply with all other applicable legal requirements (including periodically updating such forms).
Dividends received by a non-U.S. holder that are effectively connected with a U.S. trade or business conducted by the non-U.S. holder (and, if provided by an applicable treaty, that are attributable to a U.S. permanent establishment of such non-U.S. holder) are exempt from such U.S. withholding tax (provided that the non-U.S. holder complies with certain certification and disclosure requirements). Non-U.S. holders should consult their tax advisors regarding their entitlement to the exemption from withholding on dividends effectively connected with such holder’s U.S. trade or business and the requirements for and manner of claiming the benefits of such exemption. To obtain this exemption, the non-U.S. holder must generally provide us or our paying agent with a valid IRS Form W-8ECI properly certifying such exemption and otherwise comply with all other applicable legal requirements (including, without limitation, periodically updating such form). Such effectively connected dividends, although not subject to withholding tax, will be subject to U.S. federal income tax on a net income basis at the same graduated rates generally applicable to U.S. persons, subject to any applicable tax treaty providing otherwise. In addition to the income tax described above, dividends received by corporate non-U.S. holders that are effectively connected with a U.S. trade or business of the corporate non-U.S. holder may be subject to a branch profits tax at a rate of 30% (or such lower rate as may be specified by an applicable tax treaty).
A non-U.S. holder of our common stock may obtain a refund of any excess amounts withheld if the non-U.S. holder is eligible for a reduced rate of U.S. withholding tax and an appropriate claim for refund is timely filed with the IRS.
A non-U.S. holder that is a foreign trust is urged to consult its own tax advisor regarding its status under U.S. tax law and the certification requirements applicable to it.
163
Table of Contents
Gain on Disposition of Common Stock
Subject to the discussion of backup withholding and of FATCA, below, a non-U.S. holder generally will not be subject to U.S. federal income tax on any gain realized upon the sale or other disposition of our common stock unless:
| • | the gain is effectively connected with a U.S. trade or business of the non-U.S. holder and, if required by an applicable tax treaty, is attributable to a U.S. permanent establishment maintained by such non-U.S. holder; |
| • | the non-U.S. holder is an individual who is present in the United States for a period or periods aggregating 183 days or more during the calendar year in which the sale or disposition occurs and certain other conditions are met; or |
| • | our common stock constitutes a “U.S. real property interest” by reason of our status as a U.S. real property holding corporation (a USRPHC) within the meaning of Section 897(c)(2) of the Code at any time within the shorter of the five-year period preceding the disposition or the non-U.S. holder’s holding period for our common stock. |
Unless an applicable tax treaty provides otherwise, gain described in the first bullet point above will be recognized in an amount equal to the excess of the amount of cash and the fair market value of any other property received for the common stock over the non-U.S. holder’s basis in the common stock. Such gain or loss will be generally subject to U.S. federal income tax on a net income basis at the same graduated rates generally applicable to U.S. persons. In the case of a non-U.S. holder that is a foreign corporation, such gain may also be subject to a branch profits tax at a rate of 30% (or such lower rate as may be specified by an applicable tax treaty).
Gain described in the second bullet point above (which may be offset by U.S. source capital losses, provided that the non-U.S. holder has timely filed U.S. federal income tax returns with respect to such losses) will be subject to a flat 30% U.S. federal income tax (or such lower rate as may be specified by an applicable tax treaty).
With respect to the third bullet point above, we believe we are not, and will not become for the foreseeable future, a USRPHC. If we are so classified, gain arising from the sale or other taxable disposition by a non-U.S. holder of our common stock will not be subject to tax if such class of stock is regularly traded on an established securities market, as defined by applicable Treasury Regulations, and such non-U.S. holder does not own, actually or constructively, more than 5% of such class of our stock at any time during the shorter of the five-year period ending on the date of the sale or exchange or the non-U.S. holder’s holding period for our common stock. We expect our common stock to be regularly traded on an established securities market. If gain on the sale or other taxable disposition of our stock were subject to taxation under the third bullet point above, the non-U.S. holder would be subject to regular U.S. federal income tax with respect to such gain in generally the same manner as a U.S. person and would have to file a U.S. income tax return reporting such gain or loss (and a purchaser of such non-U.S. holder’s stock may be required to withhold from the proceeds payable to a non-U.S. holder from a sale or other taxable disposition of our stock).
Non-U.S. holders should consult a tax advisor regarding potentially applicable income tax treaties that may provide for different rules.
Backup Withholding and Information Reporting
Generally, we must report annually to the IRS the amount of dividends paid to each non-U.S. holder, the name and address of the recipient, and the amount, if any, of tax withheld with respect to those dividends. These information reporting requirements apply even if withholding was not required or was otherwise reduced or eliminated. This information also may be made available under a specific treaty or agreement with the tax authorities of the country in which the non-U.S. holder resides or is established. Payment of the proceeds of a sale of our common stock within the United States or through certain U.S. financial intermediaries is also subject
164
Table of Contents
to information reporting, and depending on the circumstances may be subject to backup withholding unless the non-U.S. holder, certifies that it is a non-U.S. holder or furnishes an IRS Form W-8.
Payments of dividends to a non-U.S. holder may be subject to backup withholding (at the applicable rate) unless the non-U.S. holder establishes an exemption, for example, by properly certifying its non-U.S. status on an IRS Form W-8BEN-E or another appropriate version of IRS Form W-8. Notwithstanding the foregoing, backup withholding may apply if either we or our paying agent has actual knowledge, or reason to know, that the beneficial owner is a U.S. person that is not an exempt recipient.
U.S. information reporting and backup withholding generally will not apply to a payment of proceeds from a disposition of common stock where the transaction is effected outside the United States through a non-U.S. office of a non-U.S. broker. However, information reporting requirements, but generally not backup withholding, generally will apply to such a payment if the broker is (i) a U.S. person; (ii) a foreign person that derives 50% or more of its gross income for certain periods from the conduct of a trade or business in the United States; (iii) a controlled foreign corporation as defined in the Code; (iv) a foreign partnership with certain U.S. connections; or (v) a U.S. branch of a foreign bank or foreign insurance company or a “territory financial institution” (as specially defined) in each case meeting certain requirements, unless the broker has documentary evidence in its records that the holder is a non-U.S. holder and certain conditions are met or the holder otherwise establishes an exemption.
Backup withholding is not an additional tax. Any amounts withheld under the backup withholding rules may be claimed as a refund or a credit against a non-U.S. holder’s U.S. federal income tax liability, provided that the required information is timely furnished to the IRS. Non-U.S. holders should consult their own tax advisors regarding the application of backup withholding in their particular circumstances and the availability of, and procedures for, obtaining an exemption from backup withholding.
Additional Withholding Tax Relating to Foreign Accounts
Withholding taxes may be imposed under Sections 1471 to 1474 of the Code, the Treasury Regulations promulgated thereunder and other official guidance (commonly referred to as FATCA) on certain types of payments made to non-U.S. financial institutions and certain other non-U.S. entities. Specifically, a 30% withholding tax may be imposed on dividends on, or gross proceeds from the sale or other disposition of, our common stock paid to a “foreign financial institution” or a “non-financial foreign entity” (each as defined in the Code), unless those entities comply with certain requirements under the Code and applicable U.S. Treasury regulations, which requirements may be modified by an “intergovernmental agreement” entered into between the United States and an applicable foreign country. Future Treasury Regulations or other official guidance may modify these requirements.
Under the applicable Treasury Regulations, withholding under FATCA generally applies to payments of dividends on our common stock and the IRS has announced that withholding will apply to payments of gross proceeds from the sale or other disposition of such stock on or after January 1, 2019. The FATCA withholding tax will apply to all withholdable payments without regard to whether the beneficial owner of the payment would otherwise be entitled to an exemption from imposition of withholding tax pursuant to an applicable tax treaty with the United States or U.S. domestic law.
Prospective investors should consult their tax advisors regarding the potential application of withholding under FATCA to their investment in our common stock.
The foregoing discussion is only a summary of certain material U.S. federal income tax consequences of the acquisition, ownership and disposition of our common stock by non-U.S. holders. You are urged to consult your own tax advisor with respect to the particular tax consequences to you of the acquisition, ownership and disposition of our common stock, including the effect of any U.S., state, local, non-U.S. or other tax laws and any applicable income tax treaty.
165
Table of Contents
Shares Eligible for Future Sales
Future issuances or sales of substantial amounts of our common stock in the public market, or the perception that such issuances or resales may occur, could adversely affect the prevailing market price of our common stock. No prediction can be made as to the effect, if any, future issuances or resales of shares, or the availability of shares for future sales, will have on the market price of our common stock prevailing from time to time. See “Risk Factors — Risks Related to Our Structure and Ownership of Our Common Stock — No prior public trading market existed for our common stock prior to October 4, 2016, and an active trading market may not develop or be sustained following the registration of our common stock on the NYSE, which may cause the market price of our common stock to decline significantly and make it difficult for investors to sell their shares in the future.”
As of April 25, 2017, we have a total of 427,587,401 shares of common stock issued and outstanding. The shares that may be resold pursuant to this prospectus will be freely tradable without restriction or further registration under the Securities Act, except that any shares held by our affiliates, as that term is defined under Rule 144 of the Securities Act, may be sold only in compliance with the limitations described below. The remaining outstanding shares from time to time will be deemed restricted securities under the meaning of Rule 144. Restricted securities may be sold in the public market only if registered or if they qualify for an exemption from registration, including the exemptions pursuant to Rule 144, which is summarized below.
We plan to file a registration statement on Form S-8 under the Securities Act to register shares of our common stock or securities convertible into or exchangeable for shares of common stock issued pursuant to our 2016 Incentive Plan. Any such Form S-8 registration statement will automatically become effective upon filing. Accordingly, subject to applicable vesting restrictions or lock-up restrictions and except for shares held by affiliates, shares to be registered under any such registration statement will be available for sale in the open market.
Issuance and Resales of Securities
We relied on Section 1145(a)(1) and (2) to exempt from the registration requirements of the Securities Act any future offer and resale of our common stock issued pursuant to the Plan. Section 1145(a)(1) exempts the offer and sale of securities under the Plan from registration under Section 5 of the Securities Act and state laws if certain requirements are satisfied. The shares of our common stock issued pursuant to the Plan may be resold without registration unless the seller is an “underwriter” with respect to those shares. Section 1145(b)(1) defines an “underwriter” as any person who: purchases a claim against, an interest in, or a claim for an administrative expense against the debtor, if that purchase is with a view to distributing any security received in exchange for such a claim or interest; offers to sell securities offered under the Plan for the holders of those securities; offers to buy those securities from the holders of the securities, if the offer to buy is (i) with a view to distributing those securities; and (ii) under an agreement made in connection with the Plan, the completion of the Plan, or with the offer or sale of securities under the Plan; or is an “affiliate” of the issuer. To the extent a person is deemed to be an “underwriter,” resales by such person would not be exempted by Section 1145 from registration under the Securities Act or other applicable law. Those persons would, however, be permitted to resell shares of our common stock without registration if they are able to comply with the provisions of Rule 144, as described further below.
Rule 144
In general, under Rule 144, as currently in effect, a person who is not deemed to be our affiliate for purposes of Rule 144 or to have been one of our affiliates at any time during the three months preceding a resale and who has beneficially owned the shares of common stock proposed to be resold for at least six months, including the holding period of any prior owner other than our affiliates, is entitled to resell those shares of common stock without complying with the manner of sale, volume limitation or notice provisions of Rule 144, subject to compliance with the current public information requirements of Rule 144. If such a person has beneficially
166
Table of Contents
owned the shares of common stock proposed to be resold for at least one year, including the holding period of any prior owner other than our affiliates, then that person is entitled to resell those shares of common stock without complying with any of the requirements of Rule 144. In general, after acquiring beneficial ownership, under Rule 144, as currently in effect, our affiliates or persons reselling shares of our common stock on behalf of our affiliates are entitled to sell, within any three-month period, a number of shares of our common stock that does not exceed the greater of (a) 1% of the number of shares of our common stock then outstanding and (b) the average weekly trading volume of the shares of common stock during the four calendar weeks preceding the filing of a notice on Form 144 with respect to that resale. Resales under Rule 144 by our affiliates or persons reselling shares of our common stock on behalf of our affiliates are also subject to certain manner of sale provisions and notice requirements and to the availability of current public information about us.
167
Table of Contents
We are registering the resale of shares of our common stock covered by this prospectus by the selling stockholders from time to time after the date of this prospectus. We will not receive any of the proceeds of any such resale of shares of our common stock. The aggregate proceeds to the selling stockholders from the resales of shares or our common stock will be the purchase price of the shares less any discounts and commissions.
The selling stockholders or their pledgees, donees, transferees, or any of their successors in interest selling shares received from a named selling stockholder as a gift, partnership distribution or other non-sale-related transfer after the date of this prospectus (some or all of whom may be selling stockholders), may sell some or all of the shares of common stock covered by this prospectus from time to time on any stock exchange or automated interdealer quotation system on which the securities are listed or quoted, in the over-the-counter market, in privately negotiated transactions or otherwise, at fixed prices that may be changed, at market prices prevailing at the time of sale, at prices related to prevailing market prices, at prices determined at the time of sale, or at prices otherwise negotiated. The selling stockholders may sell the shares by one or more of the following methods, without limitation:
| • | one or more underwritten offerings on a firm commitment or best efforts basis; |
| • | block trades in which the broker or dealer so engaged will attempt to sell the shares as agent but may position and resell a portion of the block as principal to facilitate the transaction; |
| • | crosses in which the same broker or dealer acts as an agent on both sides of the trades; |
| • | purchases by a broker or dealer as principal and resale by the broker or dealer for its own account pursuant to this prospectus; |
| • | an exchange distribution in accordance with the rules of any stock exchange on which the shares are listed; |
| • | ordinary brokerage transactions and transactions in which the broker solicits purchases; |
| • | privately negotiated transactions; |
| • | short sales, either directly or with a broker-dealer or affiliate thereof; |
| • | through the writing of options on the shares (including the issuance by the selling stockholder of derivative securities), whether or not the options are listed on an options exchange or otherwise; |
| • | through loans or pledges of the shares to a broker-dealer or an affiliate thereof; |
| • | by entering into transactions with third parties who may (or may cause others to) issue securities convertible or exchangeable into, or the return of which is derived in whole or in part from the value of, our common stock; |
| • | through the distribution of the shares by any selling stockholder to its partners, members or stockholders; |
| • | “at the market” to or through market makers or into an existing market for the securities; |
| • | by pledge to secure debts and other obligations (including obligations associated with derivatives transactions); |
| • | in other ways not involving market makers or established trading markets, including direct sales to purchasers or sales effected through agents; |
| • | any combination of any of these methods of sale; and |
| • | any other method permitted pursuant to applicable law. |
168
Table of Contents
We do not know of any arrangements by the selling stockholders for the sale of any of these shares. Upon our notification by a selling stockholder that any material arrangement has been entered into with an underwriter or broker-dealer for the sale of shares through a block trade, special offering, exchange distribution, secondary distribution or a purchase by an underwriter, dealer or agent, we will file a supplement to this prospectus, if required, pursuant to Rule 424(b) under the Securities Act, disclosing certain material information, including the number of shares being offered, the name or names of any underwriters, dealers or agents, any public offering price, any underwriting discounts and other items constituting compensation to underwriters, dealers or agents.
For example, the selling stockholders may engage brokers and dealers, and any brokers or dealers may arrange for other brokers or dealers to participate in effecting sales of the shares. These brokers, dealers or underwriters may act as principals or as agents of a selling stockholder. Broker-dealers may agree with a selling stockholder to sell a specified number of the shares at a stipulated price per security. If the broker-dealer is unable to sell shares acting as agent for a selling stockholder, it may purchase as principal any unsold shares at the stipulated price. Broker-dealers who acquire shares as principals may thereafter resell the shares from time to time in transactions on any stock exchange or automated interdealer quotation system on which the shares are then listed, at prices and on terms then prevailing at the time of sale, at prices related to the then-current market price, at prices determined at the time of sale, or at prices otherwise negotiated. Broker-dealers may use block transactions and sales to and through broker-dealers, including crosses and other transactions of the nature described above.
From time to time, one or more of the selling stockholders may pledge, hypothecate or grant a security interest in some or all of the shares owned by them. The pledgees, secured parties or persons to whom the shares have been hypothecated will, upon foreclosure in the event of default, be deemed to be selling stockholders. As and when a selling stockholder takes such actions, the number of shares offered under this prospectus on behalf of such selling stockholder will decrease. The plan of distribution for such selling stockholder’s shares will otherwise remain unchanged.
A selling stockholder may, from time to time, sell the shares short, and, in those instances, this prospectus may be delivered in connection with the short sales and the shares offered under this prospectus may be used to cover short sales. A selling stockholder may enter into hedging transactions with broker-dealers and the broker-dealers may engage in short sales of the shares in the course of hedging the positions they assume with that selling stockholder, including, without limitation, in connection with distributions of the shares by those broker-dealers. A selling stockholder may enter into options or other transactions with broker-dealers that involve the delivery of the shares offered hereby to the broker-dealers, who may then resell or otherwise transfer those shares. A selling stockholder may also loan the shares offered hereby to a broker-dealer and the broker-dealer may sell the loaned shares pursuant to this prospectus.
A selling stockholder may enter into derivative transactions with third parties, or sell shares not covered by this prospectus to third parties in privately negotiated transactions. If the applicable prospectus supplement indicates, in connection with those derivatives, the third parties may sell shares covered by this prospectus and the applicable prospectus supplement, including in short sale transactions. If so, the third-party may use shares pledged by the selling stockholder or borrowed from the selling stockholder or others to settle those sales or to close out any related open borrowings of stock, and may use shares received from the selling stockholder in settlement of those derivatives to close out any related open borrowings of stock. The third-party in such sale transactions will be an underwriter and, if not identified in this prospectus, will be identified in the applicable prospectus supplement (or a post-effective amendment to the registration statement of which this prospectus forms a part).
To the extent required under the Securities Act of 1933, as amended (the Securities Act), the names of the selling stockholders, aggregate amount of selling stockholders’ shares being offered and the terms of the offering, the names of any agents, dealers or underwriters and any applicable compensation with respect to a particular offer will be set forth in an accompanying prospectus supplement. Any underwriters, dealers or agents
169
Table of Contents
participating in the distribution of the shares may receive compensation in the form of underwriting discounts, concessions, commissions or fees from a selling stockholder and/or purchasers of selling stockholders’ shares for whom they may act (which compensation as to a particular broker-dealer might be in excess of customary commissions). Pursuant to a FINRA requirement, the maximum commission or discount to be received by any FINRA member or independent broker-dealer may not be greater than 8% of the gross proceeds received by the selling stockholders for the sale of any shares of common stock being offered by this prospectus and any applicable prospectus supplement.
The selling stockholders and any underwriters, dealers or agents that participate in the distribution of the shares may be deemed to be “underwriters” within the meaning of the Securities Act, and any discounts, concessions, commissions or fees received by them and any profit on the resale of the shares sold by them may be deemed to be underwriting discounts and commissions.
The selling stockholders and other persons participating in the sale or distribution of the shares will be subject to applicable provisions of the Exchange Act of 1934, as amended (the Exchange Act) and the rules and regulations thereunder, including Regulation M. This regulation may limit the timing of purchases and sales of any of the shares by the selling stockholders any other person. The anti-manipulation rules under the Exchange Act may apply to sales of shares in the market and to the activities of the selling stockholders and their respective affiliates. Furthermore, Regulation M may restrict the ability of any person engaged in the distribution of the shares to engage in market-making activities with respect to the particular shares being distributed for a period of up to five business days before the distribution. These restrictions may affect the marketability of the shares and the ability of any person or entity to engage in market-making activities with respect to the shares.
The shares offered hereby were originally issued to the selling stockholders pursuant to an exemption from the registration requirements of the Securities Act. We agreed to register resales of such shares under the Securities Act and to keep the registration statement of which this prospectus is a part effective for a specified period of time. We have agreed to pay certain expenses in connection with certain resales of the shares registered pursuant to the registration statement of which this prospectus is a part, including the fees and expenses of one counsel retained by the selling stockholders. In addition, we have agreed to indemnify in certain circumstances certain of the selling stockholders against certain liabilities, including liabilities under the Securities Act. Certain of the selling stockholders have agreed to indemnify us in certain circumstances against certain liabilities, including liabilities under the Securities Act. We have also agreed to pay substantially all of the expenses incidental to the registration of resales of shares of our common stock, including the payment of federal securities law and state “blue sky” registration fees but excluding underwriting discounts and commissions relating to the sale of common stock. See “Certain Relationships and Related Party Transactions — Registration Rights Agreement.”
We will not receive any proceeds from resales of any shares of our common stock under this prospectus by the selling stockholders.
We cannot assure you that the selling stockholders will sell all or any portion of the shares offered hereby. Further, we cannot assure you that any such selling stockholder will not transfer, devise or gift the common stock by other means not described in this prospectus. In addition, any common stock covered by this prospectus that qualifies for sale under Rule 144 or Regulation D of the Securities Act may be sold under Rule 144 or Regulation D, as applicable, rather than under this prospectus. The common stock covered by this prospectus may also be sold to non-U.S. persons outside the United States in accordance with Regulation S under the Securities Act rather than under this prospectus. The common stock may be resold in some states only through registered or licensed brokers or dealers. In addition, in some states the common stock may not be resold unless it has been registered or qualified for resale or an exemption from registration or qualification is available and complied with.
170
Table of Contents
The validity of the shares of common stock offered by this prospectus will be passed upon for us by Sidley Austin LLP, Dallas, Texas.
The consolidated financial statements of (a) Vistra Energy Corp. as of December 31, 2016 and for the period October 3, 2016 through December 31, 2016, and (b) Texas Competitive Electric Holdings Company LLC, our Predecessor, as of December 31, 2015 and for the period January 1, 2016 through October 2, 2016 and each of the two years in the period ended December 31, 2015 and the related Vistra Energy Corp. financial statement schedule included in this prospectus have been audited by Deloitte & Touche LLP, an independent registered public accounting firm, as stated in their reports appearing herein (which report on the consolidated financial statements expresses an unqualified opinion on those consolidated financial statements and includes an explanatory paragraph regarding emerging from bankruptcy and the non-comparability to prior periods). Such consolidated financial statements and financial statement schedule have been so included in reliance upon the report of such firm given upon their authority as experts in accounting and auditing.
171
Table of Contents
Where You Can Find More Information
We have filed with the Commission a registration statement on Form S-1 under the Securities Act with respect to resales of the shares of our common stock offered by this prospectus. This prospectus, which is a part of the registration statement, does not contain all of the information set forth in the registration statement or the exhibits and schedules filed therewith. For further information with respect to us and the common stock that may be offered under this prospectus, please see the registration statement and the exhibits and schedules filed with the registration statement. Statements contained in this prospectus regarding the contents of any contract or any other document that is filed as an exhibit to the registration statement are not necessarily complete, and each such statement is subject to, and qualified in all respects by reference to, the full text of such contract or other document filed as an exhibit to the registration statement. A copy of the registration statement and the exhibits and schedules filed with the registration statement may be inspected without charge at the public reference room maintained by the Commission, located at 100 F Street, N.E., Washington, D.C. 20549, and copies of all or any part of the registration statement may be obtained upon the payment of the fees prescribed by the Commission. Please call the Commission at 1-800-SEC-0330 for further information about the public reference room. The Commission also maintains an Internet website that contains reports, proxy and information statements and other information regarding registrants that file electronically with the Commission. The address of the website is www.sec.gov.
Upon the effectiveness of the registration statement of which this prospectus is a part, we will be subject to the information and periodic reporting requirements of the Exchange Act and, in accordance therewith, will file periodic reports, proxy statements and other information with the Commission.
We maintain a website at www.vistraenergy.com. You may access our annual reports on Form 10-K, quarterly reports on Form 10-Q, current reports on Form 8-K, and amendments to those reports filed or furnished pursuant to Section 13(a) or 15(d) of the Exchange Act with the Commission free of charge at our website as soon as reasonably practicable after such material is electronically filed with, or furnished to, the Commission. However, the reference to our web address does not constitute incorporation by reference of the information contained at such site.
172
Table of Contents
Index To Financial Statements and
F-1
Table of Contents
2016 ANNUAL FINANCIAL STATEMENTS
F-2
Table of Contents
GLOSSARY
When the following terms and abbreviations appear in the text of the 2016 Annual Financial Statements, they have the meanings indicated below.
| CCGT | combined cycle gas turbine | |
| CFTC | US Commodity Futures Trading Commission | |
| Chapter 11 Cases | Cases being heard in the US Bankruptcy Court for the District of Delaware (Bankruptcy Court) concerning voluntary petitions for relief under Chapter 11 of the US Bankruptcy Code (Bankruptcy Code) filed on April 29, 2014 by the Debtors. On the Effective Date, the TCEH Debtors (together with the Contributed EFH Debtors) emerged from the Chapter 11 Cases. | |
| CO2 | carbon dioxide | |
| Contributed EFH Debtors | certain EFH Debtors that became subsidiaries of Vistra Energy on the Effective Date | |
| CSAPR | the final Cross-State Air Pollution Rule issued by the EPA in July 2011 | |
| CTs | Combustion turbines | |
| DIP Facility | TCEH’s $3.375 billion debtor-in-possession financing facility, which was repaid in August 2016. See Note 13 to the Financial Statements. | |
| DIP Roll Facilities | TCEH’s $4.250 billion debtor-in-possession and exit financing facilities, which was converted to the Vistra Operations Credit Facilities on the Effective Date. See Note 13 to the Financial Statements. | |
| Debtors | EFH Corp. and the majority of its direct and indirect subsidiaries, including EFIH, EFCH and TCEH, but excluding the Oncor Ring-Fenced Entities. Prior to the Effective Date, also included the TCEH Debtors and the Contributed EFH Debtors. | |
| D.C. Circuit Court | US Court of Appeals for the District of Columbia Circuit | |
| EBITDA | earnings (net income) before interest expense, income taxes, depreciation and amortization | |
| Effective Date | October 3, 2016, the date the TCEH Debtors and the Contributed EFH Debtors completed their reorganization under the Bankruptcy Code and emerged from the Chapter 11 Cases | |
| EFCH | Energy Future Competitive Holdings Company LLC, a direct, wholly owned subsidiary of EFH Corp. and, prior to the Effective Date, the indirect parent of the TCEH Debtors, depending on context | |
| EFH Corp. | Energy Future Holdings Corp. and/or its subsidiaries, depending on context, whose major subsidiaries include Oncor and, prior to the Effective Date, included the TCEH Debtors and the Contributed EFH Debtors | |
| EFH Debtors | EFH Corp. and its subsidiaries that are Debtors in the Chapter 11 Cases, including EFIH and EFIH Finance Inc., but excluding the TCEH Debtors and the Contributed EFH Debtors | |
| EFIH | Energy Future Intermediate Holding Company LLC, a direct, wholly owned subsidiary of EFH Corp. and the direct parent of Oncor Holdings | |
F-3
Table of Contents
| Emergence | emergence of the TCEH Debtors and the Contributed EFH Debtors from the Chapter 11 Cases as subsidiaries of a newly-formed company, Vistra Energy, on the Effective Date | |
| EPA | US Environmental Protection Agency | |
| ERCOT | Electric Reliability Council of Texas, Inc., the independent system operator and the regional coordinator of various electricity systems within Texas | |
| Federal and State Income Tax Allocation Agreement | Prior to the Effective Date, EFH Corp. and certain of its subsidiaries (including EFCH, EFIH and TCEH, but not including Oncor Holdings and Oncor) were parties to a Federal and State Income Tax Allocation Agreement, executed in May 2012 but effective as of January 2010. The Agreement was rejected by the TCEH Debtors and the Contributed EFH Debtors on the Effective Date. See Note 9 to the Financial Statements. | |
| FERC | US Federal Energy Regulatory Commission | |
| Fifth Circuit Court | US Court of Appeals for the Fifth Circuit | |
| GAAP | generally accepted accounting principles | |
| GHG | greenhouse gas | |
| GWh | gigawatt-hours | |
| IRS | US Internal Revenue Service | |
| IPP | independent power producer | |
| ISO | independent system operator | |
| kWh | kilowatt-hours | |
| LIBOR | London Interbank Offered Rate, an interest rate at which banks can borrow funds, in marketable size, from other banks in the London interbank market | |
| LSTC | liabilities subject to compromise | |
| Luminant | subsidiaries of Vistra Energy engaged in competitive market activities consisting of electricity generation and wholesale energy sales and purchases as well as commodity risk management, all largely in Texas | |
| market heat rate | Heat rate is a measure of the efficiency of converting a fuel source to electricity. Market heat rate is the implied relationship between wholesale electricity prices and natural gas prices and is calculated by dividing the wholesale market price of electricity, which is based on the price offer of the marginal supplier in ERCOT (generally natural gas plants), by the market price of natural gas. | |
| MATS | the Mercury and Air Toxics Standard established by the EPA | |
| Merger | the transaction referred to in the Agreement and Plan of Merger under which Texas Holdings agreed to acquire EFH Corp., which was completed on October 10, 2007 | |
| MMBtu | million British thermal units | |
| MSHA | US Mine Safety and Health Administration | |
F-4
Table of Contents
| MW | megawatts | |
| MWh | megawatt-hours | |
| NERC | North American Electric Reliability Corporation | |
| NOX | nitrogen oxide | |
| NRC | US Nuclear Regulatory Commission | |
| NYMEX | the New York Mercantile Exchange, a commodity derivatives exchange | |
| Oncor | Oncor Electric Delivery Company LLC, a direct, majority-owned subsidiary of Oncor Holdings and an indirect subsidiary of EFH Corp., that is engaged in regulated electricity transmission and distribution activities | |
| Oncor Holdings | Oncor Electric Delivery Holdings Company LLC, a direct, wholly owned subsidiary of EFIH and the direct majority owner of Oncor, and/or its subsidiaries, depending on context | |
| Oncor Ring-Fenced Entities | Oncor Holdings and its direct and indirect subsidiaries, including Oncor | |
| Petition Date | April 29, 2014, the date the Debtors filed voluntary petitions for relief under Chapter 11 of the United States Bankruptcy Code | |
| Plan of Reorganization | Third Amended Joint Plan of Reorganization filed by the Debtors in August 2016 and confirmed by the Bankruptcy Court in August 2016 solely with respect to the TCEH Debtors | |
| PrefCo | Vistra Preferred Inc. | |
| PURA | Texas Public Utility Regulatory Act | |
| PUCT | Public Utility Commission of Texas | |
| purchase accounting | The purchase method of accounting for a business combination as prescribed by US GAAP, whereby the cost or “purchase price” of a business combination, including the amount paid for the equity and direct transaction costs are allocated to identifiable assets and liabilities (including intangible assets) based upon their fair values. The excess of the purchase price over the fair values of assets and liabilities is recorded as goodwill. | |
| REP | retail electric provider | |
| RCT | Railroad Commission of Texas, which among other things, has oversight of lignite mining activity in Texas | |
| SEC | US Securities and Exchange Commission | |
| SG&A | selling, general and administrative | |
| Securities Act | Securities Act of 1933, as amended | |
| Settlement Agreement | Amended and Restated Settlement Agreement among the Debtors, the Sponsor Group, settling TCEH first lien creditors, settling TCEH second lien creditors, settling TCEH unsecured creditors and the official committee of unsecured creditors of TCEH (collectively, the Settling Parties), approved by the Bankruptcy Court in December 2015. See Note 2 to the Financial Statements. | |
| SO2 | sulfur dioxide | |
F-5
Table of Contents
| Sponsor Group | Refers, collectively, to certain investment funds affiliated with Kohlberg Kravis Roberts & Co. L.P., TPG Global, LLC (together with its affiliates, TPG) and GS Capital Partners, an affiliate of Goldman, Sachs & Co., that have an ownership interest in Texas Holdings | |
| TRA | Tax Receivables Agreement, containing certain rights (TRA Rights) to receive payments from Vistra Energy related to certain tax benefits, including those it realized as a result of the transactions entered into at Emergence under the terms of a tax receivable agreement (see Note 10) | |
| TCEH or Predecessor | Texas Competitive Electric Holdings Company LLC, a direct, wholly owned subsidiary of EFCH and, prior to the Effective Date, the parent company of the TCEH Debtors, depending on context, that were engaged in electricity generation and wholesale and retail energy market activities, and whose major subsidiaries included Luminant and TXU Energy. | |
| TCEH Debtors | the subsidiaries of TCEH that were Debtors in the Chapter 11 Cases | |
| TCEH Finance | TCEH Finance, Inc., a direct, wholly owned subsidiary of TCEH, formed for the sole purpose of serving as co-issuer with TCEH of certain debt securities. TCEH Finance, Inc. was dissolved on the Effective Date. | |
| TCEH Senior Secured Facilities | Refers, collectively, to the TCEH First Lien Term Loan Facilities, TCEH First Lien Revolving Credit Facility and TCEH First Lien Letter of Credit Facility with a total principal amount of $22.616 billion. The claims arising under these facilities were discharged in the Chapter 11 Cases on the Effective Date pursuant to the Plan of Reorganization. | |
| TCEH Senior Secured Notes | TCEH’s and TCEH Finance’s $1.750 billion principal amount of 11.5% First Lien Senior Secured Notes. The claims arising under these notes were discharged in the Chapter 11 Cases on the Effective Date pursuant to the Plan of Reorganization. | |
| TCEQ | Texas Commission on Environmental Quality | |
| Texas Holdings | Texas Energy Future Holdings Limited Partnership, a limited partnership controlled by the Sponsor Group, that owns substantially all of the common stock of EFH Corp. | |
| TRE | Texas Reliability Entity, Inc., an independent organization that develops reliability standards for the ERCOT region and monitors and enforces compliance with NERC standards and monitors compliance with ERCOT protocols | |
| TWh | terawatt-hours | |
| TXU Energy | TXU Energy Retail Company LLC, a direct, wholly owned subsidiary of Vistra Energy that is a REP in competitive areas of ERCOT and is engaged in the retail sale of electricity to residential and business customers | |
| US | United States of America | |
| Vistra Energy or Successor | Vistra Energy Corp., formerly known as TCEH Corp., and/or its subsidiaries, depending on context. On the Effective Date, the TCEH Debtors and the Contributed EFH Debtors emerged from Chapter 11 and became subsidiaries of Vistra Energy Corp. | |
| Vistra Operations Credit Facilities | Vistra Energy’s $5.360 billion senior secured financing facilities. See Note 13 to the Financial Statements. | |
F-6
Table of Contents
REPORT OF INDEPENDENT REGISTERED PUBLIC ACCOUNTING FIRM
To the Board of Directors and Stockholders of Vistra Energy Corp.
Dallas, TX
We have audited the accompanying consolidated balance sheet of Vistra Energy Corp. (the “Company”) as of December 31, 2016 (Successor Company balance sheet) and 2015 (Predecessor Company balance sheet), and the related statements of consolidated income (loss), consolidated comprehensive income (loss), consolidated cash flows, and consolidated equity, for the period October 3, 2016 through December 31, 2016 (Successor Company operations), the period January 1, 2016 through October 2, 2016, and for each of the two years in the period ended December 31, 2015 (Predecessor Company operations). These financial statements are the responsibility of the Company’s management. Our responsibility is to express an opinion on these financial statements based on our audits.
We conducted our audits in accordance with the standards of the Public Company Accounting Oversight Board (United States). Those standards require that we plan and perform the audit to obtain reasonable assurance about whether the financial statements are free of material misstatement. The Company is not required to have, nor were we engaged to perform, an audit of its internal control over financial reporting. Our audits included consideration of internal control over financial reporting as a basis for designing audit procedures that are appropriate in the circumstances, but not for the purpose of expressing an opinion on the effectiveness of the Company’s internal control over financial reporting. Accordingly, we express no such opinion. An audit also includes examining, on a test basis, evidence supporting the amounts and disclosures in the financial statements, assessing the accounting principles used and significant estimates made by management, as well as evaluating the overall financial statement presentation. We believe that our audits provide a reasonable basis for our opinion.
As discussed in Note 2 to the financial statements, on August 29, 2016 the Bankruptcy Court entered an order confirming the plan of reorganization which became effective on October 3, 2016. Accordingly, the accompanying financial statements have been prepared in conformity with Accounting Standards Codification (ASC) Topic 852, Reorganizations, for the Successor Company as a new entity with assets, liabilities, and a capital structure having carrying values not comparable with prior periods as described in Note 1 to the financial statements.
In our opinion, the Successor Company financial statements present fairly, in all material respects, the financial position of Vistra Energy Corp. as of December 31, 2016, and the results of their operations and their cash flows for the period October 3, 2016 through December 31, 2016, in conformity with accounting principles generally accepted in the United States of America. Further, in our opinion, the Predecessor Company financial statements referred to above present fairly, in all material respects, the financial position of the Predecessor Company as of December 31, 2015, and the results of their operations and their cash flows for the period January 1, 2016 through October 2, 2016, and for each of the two years in the period ended December 31, 2015, in conformity with accounting principles generally accepted in the United States of America.
/s/ DELOITTE & TOUCHE LLP
Dallas, TX
March 30, 2017
F-7
Table of Contents
STATEMENTS OF CONSOLIDATED INCOME (LOSS)
(Millions of Dollars, Except Per Share Amounts)
| Successor | Predecessor | |||||||||||||||
| Period from October 3, 2016 through December 31, 2016 |
Period from January 1, 2016 through October 2, 2016 |
Year Ended December 31, |
||||||||||||||
| 2015 | 2014 | |||||||||||||||
| Operating revenues |
$ | 1,191 | $ | 3,973 | $ | 5,370 | $ | 5,978 | ||||||||
| Fuel, purchased power costs and delivery fees |
(720 | ) | (2,082 | ) | (2,692 | ) | (2,842 | ) | ||||||||
| Net gain from commodity hedging and trading activities |
— | 282 | 334 | 11 | ||||||||||||
| Operating costs |
(208 | ) | (664 | ) | (834 | ) | (914 | ) | ||||||||
| Depreciation and amortization |
(216 | ) | (459 | ) | (852 | ) | (1,270 | ) | ||||||||
| Selling, general and administrative expenses |
(208 | ) | (482 | ) | (676 | ) | (708 | ) | ||||||||
| Impairment of goodwill (Note 7) |
— | — | (2,200 | ) | (1,600 | ) | ||||||||||
| Impairment of long-lived assets (Note 8) |
— | — | (2,541 | ) | (4,670 | ) | ||||||||||
|
|
|
|
|
|
|
|
|
|||||||||
| Operating income (loss) |
(161 | ) | 568 | (4,091 | ) | (6,015 | ) | |||||||||
|
|
|
|
|
|
|
|
|
|||||||||
| Other income (Note 22) |
9 | 16 | 17 | 16 | ||||||||||||
| Other deductions (Note 22) |
— | (75 | ) | (93 | ) | (281 | ) | |||||||||
| Interest income |
1 | 3 | 1 | — | ||||||||||||
| Interest expense and related charges (Note 11) |
(60 | ) | (1,049 | ) | (1,289 | ) | (1,749 | ) | ||||||||
| Impacts of Tax Receivable Agreement (Note 10) |
(22 | ) | — | — | — | |||||||||||
| Reorganization items (Note 4) |
— | 22,121 | (101 | ) | (520 | ) | ||||||||||
|
|
|
|
|
|
|
|
|
|||||||||
| Income (loss) before income taxes |
(233 | ) | 21,584 | (5,556 | ) | (8,549 | ) | |||||||||
| Income tax benefit (expense) (Note 9) |
70 | 1,267 | 879 | 2,320 | ||||||||||||
|
|
|
|
|
|
|
|
|
|||||||||
| Net income (loss) |
$ | (163 | ) | $ | 22,851 | $ | (4,677 | ) | $ | (6,229 | ) | |||||
|
|
|
|
|
|
|
|
|
|||||||||
| Weighted average shares of common stock outstanding: |
||||||||||||||||
| Basic |
427,560,620 | |||||||||||||||
| Diluted |
427,560,620 | |||||||||||||||
| Net loss per weighted average share of common stock outstanding: |
||||||||||||||||
| Basic |
$ | (0.38 | ) | |||||||||||||
| Diluted |
$ | (0.38 | ) | |||||||||||||
| Dividend declared per share of common stock |
$ | 2.32 | ||||||||||||||
See Notes to the Consolidated Financial Statements.
F-8
Table of Contents
STATEMENTS OF CONSOLIDATED COMPREHENSIVE INCOME (LOSS)
(Millions of Dollars)
| Successor | Predecessor | |||||||||||||||
| Period from October 3, 2016 through December 31, 2016 |
Period from January 1, 2016 through October 2, 2016 |
Year Ended December 31, |
||||||||||||||
| 2015 | 2014 | |||||||||||||||
| Net income (loss) |
$ | (163 | ) | $ | 22,851 | $ | (4,677 | ) | $ | (6,229 | ) | |||||
| Effects related to pension and other retirement benefit obligations (net of tax expense of $3 million) |
6 | — | — | — | ||||||||||||
| Other comprehensive income, net of tax effects — cash flow hedges derivative value net loss related to hedged transactions recognized during the period (net of tax benefit of $— in all periods) |
— | 1 | 2 | 1 | ||||||||||||
|
|
|
|
|
|
|
|
|
|||||||||
| Comprehensive income (loss) |
$ | (157 | ) | $ | 22,852 | $ | (4,675 | ) | $ | (6,228 | ) | |||||
|
|
|
|
|
|
|
|
|
|||||||||
See Notes to the Consolidated Financial Statements.
F-9
Table of Contents
STATEMENTS OF CONSOLIDATED CASH FLOWS
(Millions of Dollars)
| Successor | Predecessor | |||||||||||||||
| Period from October 3, 2016 through December 31, 2016 |
Period from January 1, 2016 through October 2, 2016 |
Year Ended December 31, |
||||||||||||||
| 2015 | 2014 | |||||||||||||||
| Cash flows — operating activities: |
||||||||||||||||
| Net income (loss) |
$ | (163 | ) | $ | 22,851 | $ | (4,677 | ) | $ | (6,229 | ) | |||||
| Adjustments to reconcile net income (loss) to cash provided by (used in) operating activities: |
||||||||||||||||
| Depreciation and amortization |
285 | 532 | 995 | 1,440 | ||||||||||||
| Deferred income tax benefit, net |
(76 | ) | (1,270 | ) | (883 | ) | (2,406 | ) | ||||||||
| Impairment of goodwill (Note 7) |
— | — | 2,200 | 1,600 | ||||||||||||
| Impairment of long-lived assets (Note 8) |
— | — | 2,541 | 4,670 | ||||||||||||
| Write-off of intangible and other assets (Note 7) |
— | 45 | 84 | 263 | ||||||||||||
| Gain on extinguishment of liabilities subject to compromise (Note 4) |
— | (24,344 | ) | — | — | |||||||||||
| Net loss from adopting fresh start reporting (Note 4) |
— | 2,013 | — | — | ||||||||||||
| Contract claims adjustments (Note 4) |
— | 13 | 54 | 19 | ||||||||||||
| Adjustment to asbestos liability |
— | 11 | — | — | ||||||||||||
| Noncash adjustment for estimated allowed claims related to debt (Note 4) |
— | — | 896 | — | ||||||||||||
| Adjustment to intercompany claims pursuant to Settlement Agreement (Note 4) |
— | — | (1,037 | ) | — | |||||||||||
| Sponsor management agreement settlement (Note 20) |
— | — | (19 | ) | — | |||||||||||
| Fees paid for Predecessor DIP Facility (reported as financing activities) |
— | — | 9 | 92 | ||||||||||||
| Unrealized net (gain) loss from mark-to-market valuations of commodity positions |
165 | 36 | (119 | ) | 370 | |||||||||||
| Unrealized net (gain) loss from mark-to-market valuations of interest rate swaps (Note 11) |
11 | — | — | (1,290 | ) | |||||||||||
| Liability adjustment arising from termination of interest rate swaps (Note 17) |
— | — | — | 277 | ||||||||||||
| Noncash realized loss on termination of interest rate swaps (Note 11) |
— | — | — | 1,225 | ||||||||||||
| Noncash realized gain on termination of natural gas positions (Note 17) |
— | — | — | (117 | ) | |||||||||||
| Amortization of debt related costs, discounts, fair value discounts and losses on dedesignated cash flow hedges (Note 4) |
— | — | — | 88 | ||||||||||||
| Income tax benefit due to IRS audit resolutions (Note 9) |
— | — | — | 53 | ||||||||||||
| Impacts of Tax Receivable Agreement (Note 10) |
22 | — | — | — | ||||||||||||
| Other, net |
7 | 52 | 67 | 61 | ||||||||||||
| Changes in operating assets and liabilities: |
||||||||||||||||
| Affiliate accounts receivable/payable — net |
— | 31 | (4 | ) | 11 | |||||||||||
| Accounts receivable — trade |
135 | (216 | ) | 17 | 72 | |||||||||||
| Inventories |
3 | 71 | 34 | (67 | ) | |||||||||||
| Accounts payable — trade |
(79 | ) | 26 | 40 | 94 | |||||||||||
| Commodity and other derivative contractual assets and liabilities |
(48 | ) | 29 | 27 | (27 | ) | ||||||||||
| Margin deposits, net |
(193 | ) | (124 | ) | 129 | (192 | ) | |||||||||
| Accrued interest |
32 | (10 | ) | 2 | 493 | |||||||||||
| Other — net assets |
(2 | ) | (3 | ) | (22 | ) | (67 | ) | ||||||||
| Other — net liabilities |
(18 | ) | 19 | (97 | ) | 11 | ||||||||||
|
|
|
|
|
|
|
|
|
|||||||||
| Cash provided by (used in) operating activities |
81 | (238 | ) | 237 | 444 | |||||||||||
|
|
|
|
|
|
|
|
|
|||||||||
F-10
Table of Contents
| Cash flows — financing activities: |
||||||||||||||||
| Borrowings under DIP Roll Facilities and DIP Facility (Note 13) |
— | 4,680 | — | 1,425 | ||||||||||||
| DIP Roll Facilities and DIP Facility financing fees |
— | (112 | ) | (9 | ) | (92 | ) | |||||||||
| Repayments/repurchases of debt (Note 13) |
— | (2,655 | ) | (21 | ) | (223 | ) | |||||||||
| Net proceeds from issuance of preferred stock (Note 3) |
— | 69 | — | — | ||||||||||||
| Payments to extinguish claims of TCEH first lien creditors |
— | (486 | ) | — | — | |||||||||||
| Payments to extinguish claims of TCEH unsecured creditors |
— | (429 | ) | — | — | |||||||||||
| Fees paid for credit facilities |
— | (8 | ) | — | — | |||||||||||
| Incremental Term Loan B Facility (Note 13) |
1,000 | — | — | — | ||||||||||||
| Special Dividend (Note 15) |
(992 | ) | — | — | — | |||||||||||
| Other, net |
(2 | ) | — | — | 1 | |||||||||||
|
|
|
|
|
|
|
|
|
|||||||||
| Cash provided by (used in) financing activities |
6 | 1,059 | (30 | ) | 1,111 | |||||||||||
|
|
|
|
|
|
|
|
|
|||||||||
| Cash flows — investing activities: |
||||||||||||||||
| Notes/advances due from affiliates |
— | (41 | ) | (37 | ) | (34 | ) | |||||||||
| Lamar and Forney acquisition — net of cash acquired (Note 6) |
— | (1,343 | ) | — | — | |||||||||||
| Capital expenditures |
(48 | ) | (230 | ) | (337 | ) | (336 | ) | ||||||||
| Nuclear fuel purchases |
(41 | ) | (33 | ) | (123 | ) | (77 | ) | ||||||||
| Changes in restricted cash |
48 | 233 | (123 | ) | 42 | |||||||||||
| Proceeds from sales of nuclear decommissioning trust fund securities (Note 22) |
25 | 201 | 401 | 314 | ||||||||||||
| Investments in nuclear decommissioning trust fund securities (Note 22) |
(30 | ) | (215 | ) | (418 | ) | (331 | ) | ||||||||
| Other, net |
1 | 8 | (13 | ) | (36 | ) | ||||||||||
|
|
|
|
|
|
|
|
|
|||||||||
| Cash used in investing activities |
(45 | ) | (1,420 | ) | (650 | ) | (458 | ) | ||||||||
|
|
|
|
|
|
|
|
|
|||||||||
| Net change in cash and cash equivalents |
42 | (599 | ) | (443 | ) | 1,097 | ||||||||||
| Cash and cash equivalents — beginning balance |
801 | 1,400 | 1,843 | 746 | ||||||||||||
|
|
|
|
|
|
|
|
|
|||||||||
| Cash and cash equivalents — ending balance |
$ | 843 | $ | 801 | $ | 1,400 | $ | 1,843 | ||||||||
|
|
|
|
|
|
|
|
|
See Notes to the Consolidated Financial Statements.
F-11
Table of Contents
CONSOLIDATED BALANCE SHEETS
(Millions of Dollars)
| Successor | Predecessor | |||||||
| December 31, 2016 |
December 31, 2015 |
|||||||
| ASSETS | ||||||||
| Current assets: |
||||||||
| Cash and cash equivalents |
$ | 843 | $ | 1,400 | ||||
| Restricted cash (Note 22) |
95 | 519 | ||||||
| Trade accounts receivable — net (Note 22) |
612 | 533 | ||||||
| Advances to parent and affiliates of Predecessor (Note 20) |
— | 34 | ||||||
| Inventories (Note 22) |
285 | 428 | ||||||
| Commodity and other derivative contractual assets (Note 17) |
350 | 465 | ||||||
| Margin deposits related to commodity contracts |
213 | 6 | ||||||
| Other current assets |
75 | 65 | ||||||
|
|
|
|
|
|||||
| Total current assets |
2,473 | 3,450 | ||||||
| Restricted cash (Note 22) |
650 | 507 | ||||||
| Advances to parent and affiliates of Predecessor (Note 20) |
— | 20 | ||||||
| Investments (Note 22) |
1,064 | 962 | ||||||
| Property, plant and equipment — net (Note 22) |
4,443 | 9,349 | ||||||
| Goodwill (Note 7) |
1,907 | 152 | ||||||
| Identifiable intangible assets — net (Note 7) |
3,205 | 1,179 | ||||||
| Commodity and other derivative contractual assets (Note 17) |
64 | 10 | ||||||
| Deferred income taxes (Note 9) |
1,122 | — | ||||||
| Other noncurrent assets |
239 | 29 | ||||||
|
|
|
|
|
|||||
| Total assets |
$ | 15,167 | $ | 15,658 | ||||
|
|
|
|
|
|||||
| LIABILITIES AND EQUITY | ||||||||
| Current liabilities: |
||||||||
| Borrowings under debtor-in-possession credit facility (Note 13) |
$ | — | $ | 1,425 | ||||
| Long-term debt due currently (Note 13) |
46 | 16 | ||||||
| Trade accounts payable |
479 | 394 | ||||||
| Trade accounts and other payables to affiliates of Predecessor |
— | 120 | ||||||
| Commodity and other derivative contractual liabilities (Note 17) |
359 | 203 | ||||||
| Margin deposits related to commodity contracts |
41 | 152 | ||||||
| Accrued income taxes payable to parent (Note 9) |
— | 11 | ||||||
| Accrued taxes |
31 | — | ||||||
| Accrued taxes other than income |
128 | 98 | ||||||
| Accrued interest |
33 | 120 | ||||||
| Other current liabilities |
387 | 273 | ||||||
|
|
|
|
|
|||||
| Total current liabilities |
1,504 | 2,812 | ||||||
| Long-term debt, less amounts due currently (Note 13) |
4,577 | 3 | ||||||
| Liabilities subject to compromise (Note 5) |
— | 33,734 | ||||||
| Commodity and other derivative contractual liabilities (Note 17) |
2 | 1 | ||||||
| Deferred income taxes (Note 9) |
— | 213 | ||||||
| Tax Receivable Agreement obligation (Note 10) |
596 | — | ||||||
| Asset retirement obligations (Note 22) |
1,671 | 764 | ||||||
| Other noncurrent liabilities and deferred credits (Note 22) |
220 | 1,015 | ||||||
|
|
|
|
|
|||||
| Total liabilities |
8,570 | 38,542 | ||||||
|
|
|
|
|
|||||
F-12
Table of Contents
| Commitments and Contingencies (Note 14) |
||||||||
| Equity (Note 15): |
||||||||
| Common stock |
4 | — | ||||||
| Additional paid-in-capital |
7,742 | — | ||||||
| Retained deficit |
(1,155 | ) | — | |||||
| Accumulated other comprehensive income (loss) |
6 | — | ||||||
| Predecessor membership interests |
— | (22,884 | ) | |||||
|
|
|
|
|
|||||
| Total equity |
$ | 6,597 | $ | (22,884 | ) | |||
|
|
|
|
|
|||||
| Total liabilities and equity |
$ | 15,167 | $ | 15,658 | ||||
|
|
|
|
|
See Notes to the Consolidated Financial Statements.
F-13
Table of Contents
STATEMENTS OF CONSOLIDATED EQUITY
(Millions of Dollars, Except Per Share Amounts)
| Successor | ||||
| Period from October 3, 2016 through December 31, 2016 |
||||
| Shareholders’ equity in Successor: |
||||
| Common stock (par value — $0.01; number of authorized shares — 1,800,000,000) |
||||
| Shares issued upon Emergence (number of shares issued: 427,500,000) |
$ | 4 | ||
| Other issuances (number of shares issued: 80,232) |
— | |||
|
|
|
|||
| Balance at end of period (number of shares outstanding: 427,580,232) |
4 | |||
|
|
|
|||
| Additional paid-in capital: |
||||
| Amount resulting from Emergence |
7,737 | |||
| Effects of stock-based incentive compensation plans |
4 | |||
| Shares issued |
1 | |||
|
|
|
|||
| Balance at end of period |
7,742 | |||
|
|
|
|||
| Retained deficit: |
||||
| Balance at beginning of period |
— | |||
| Net loss |
(163 | ) | ||
| Dividends declared on common stock ($2.32 per share) |
(992 | ) | ||
|
|
|
|||
| Balance at end of period |
(1,155 | ) | ||
|
|
|
|||
| Accumulated other comprehensive income (loss), net of tax effects: |
||||
| Balance at beginning of period |
— | |||
| Pension and other postretirement employee benefit liability — change in funded status |
6 | |||
|
|
|
|||
| Balance at end of period |
6 | |||
|
|
|
|||
| Total shareholders’ equity at end of period |
$ | 6,597 | ||
|
|
|
|||
F-14
Table of Contents
VISTRA ENERGY CORP.
STATEMENTS OF CONSOLIDATED EQUITY
(Millions of Dollars, Except Per Share Amounts)
| Predecessor | ||||||||||||
| Period from January 1, 2016 through October 2, 2016 |
Year Ended December 31, |
|||||||||||
| 2015 | 2014 | |||||||||||
| Membership interests in Predecessor: |
||||||||||||
| Capital account: |
||||||||||||
| Balance at beginning of period |
$ | (22,851 | ) | $ | (18,174 | ) | $ | (11,947 | ) | |||
| Net income (loss) attributable to Predecessor |
22,851 | (4,677 | ) | (6,229 | ) | |||||||
| Effects of stock-based incentive compensation plans |
— | — | 2 | |||||||||
|
|
|
|
|
|
|
|||||||
| Balance at end of period |
— | (22,851 | ) | (18,174 | ) | |||||||
|
|
|
|
|
|
|
|||||||
| Accumulated other comprehensive loss, net of tax effects: |
||||||||||||
| Balance at beginning of period |
(33 | ) | (35 | ) | (36 | ) | ||||||
| Cash flow hedges — change during period |
33 | 2 | 1 | |||||||||
|
|
|
|
|
|
|
|||||||
| Balance at end of period |
— | (33 | ) | (35 | ) | |||||||
|
|
|
|
|
|
|
|||||||
| Total Predecessor membership interests at end of period |
— | (22,884 | ) | (18,209 | ) | |||||||
|
|
|
|
|
|
|
|||||||
| Noncontrolling interests in subsidiaries of Predecessor: |
||||||||||||
| Balance at beginning of period |
— | — | 1 | |||||||||
| Investment in subsidiary by noncontrolling interests |
— | — | 1 | |||||||||
| Other |
— | — | (2 | ) | ||||||||
|
|
|
|
|
|
|
|||||||
| Noncontrolling interests in subsidiaries of Predecessor at end of period |
— | — | — | |||||||||
|
|
|
|
|
|
|
|||||||
| Total membership interests at end of period |
$ | — | $ | (22,884 | ) | $ | (18,209 | ) | ||||
|
|
|
|
|
|
|
|||||||
See Notes to the Consolidated Financial Statements.
F-15
Table of Contents
NOTES TO CONSOLIDATED FINANCIAL STATEMENTS
1. BUSINESS AND SIGNIFICANT ACCOUNTING POLICIES
Description of Business, Bankruptcy Proceedings and Emergence
References in the 2016 Annual Financial Statements to “we,” “our,” “us” and “the Company” are to Vistra Energy and/or its subsidiaries in the Successor period, and to TCEH and/or its subsidiaries in the Predecessor periods, as apparent in the context. See Glossary for defined terms.
On April 29, 2014 (the Petition Date), EFH Corp. and the substantial majority of its direct and indirect subsidiaries, including EFIH, EFCH and TCEH but excluding the Oncor Ring-Fenced Entities (collectively, the Debtors), filed voluntary petitions for relief (the Bankruptcy Filing) under Chapter 11 of the United States Bankruptcy Code (the Bankruptcy Code) in the United States Bankruptcy Court for the District of Delaware (the Bankruptcy Court).
On October 3, 2016 (the Effective Date), subsidiaries of TCEH that were Debtors in the Chapter 11 Cases (the TCEH Debtors) and certain EFH Corp. subsidiaries (the Contributed EFH Debtors) completed their reorganization under the Bankruptcy Code and emerged from the Chapter 11 Cases (Emergence) as subsidiaries of a newly-formed company, Vistra Energy (our Successor). On the Effective Date, Vistra Energy was spun-off from EFH Corp. in a tax-free transaction to the former first lien creditors of TCEH (Spin-Off). As a result, as of the Effective Date, Vistra Energy is a holding company for subsidiaries principally engaged in competitive electricity market activities including power generation, wholesale energy sales and purchases, commodity risk management and retail sales of electricity to end users. TCEH is the Predecessor to Vistra Energy. See Note 2 for further discussion regarding the Chapter 11 Cases.
Vistra Energy is a holding company operating an integrated power business in Texas. Through our Luminant and TXU Energy subsidiaries, we are engaged in competitive electricity market activities including power generation, wholesale energy sales and purchases, commodity risk management and retail sales of electricity to end users. Prior to the Effective Date, TCEH was a holding company for subsidiaries principally engaged in the same activities as Vistra Energy.
Subsequent to the Effective Date, Vistra Energy has two reportable segments: our Wholesale Generation segment, consisting largely of Luminant, and our Retail Electricity segment, consisting largely of TXU Energy. Prior to the Effective Date, there were no reportable business segments for our Predecessor. See Note 21 for further information concerning reportable business segments.
Basis of Presentation
As of the Effective Date, Vistra Energy applied fresh start reporting under the applicable provisions of Financial Accounting Standards Board (FASB) Accounting Standards Codification (ASC) 852, Reorganizations (ASC 852). Fresh start reporting includes (1) distinguishing the consolidated financial statements of the entity that was previously in restructuring (TCEH, or the Predecessor) from the financial statements of the entity that emerges from restructuring (Vistra Energy, or the Successor), (2) accounting for the effects of the Plan of Reorganization, (3) assigning the reorganized value of the Successor entity by measuring all assets and liabilities of the Successor entity at fair value, and (4) selecting accounting policies for the Successor entity. The financial statements of Vistra Energy for periods subsequent to the Effective Date are not comparable to the financial statements of TCEH for periods prior to the Effective Date, as those previous periods do not give effect to any adjustments to the carrying values of assets or amounts of liabilities that resulted from the Plan of Reorganization and the related application of fresh start reporting. The reorganization value of Vistra Energy was assigned to its assets and liabilities in conformity with the procedures specified by FASB ASC 805, Business Combinations, and the portion of the reorganization value that was not attributable to identifiable tangible or intangible assets was recognized as goodwill. See Note 3 for further discussion regarding fresh start reporting.
F-16
Table of Contents
The consolidated financial statements of the Predecessor reflect the application of ASC 852 as it applies to entities that have filed a petition for bankruptcy under Chapter 11 of the Bankruptcy Code. As a result, the consolidated financial statements of the Predecessor have been prepared as if TCEH was a going concern and contemplated the realization of assets and liabilities in the normal course of business. During the Chapter 11 Cases, the Debtors operated their businesses as debtors-in-possession under the jurisdiction of the Bankruptcy Court and in accordance with the applicable provisions of the Bankruptcy Code. The guidance requires that transactions and events directly associated with the reorganization be distinguished from the ongoing operations of the business. In addition, the guidance provides for changes in the accounting and presentation of liabilities. Prior to the Effective Date, the Predecessor recorded the effects of the Plan of Reorganization in accordance with ASC 852. See Notes 4 and 5 for further discussion of these accounting and reporting changes.
The consolidated financial statements have been prepared in accordance with US GAAP. All intercompany transactions and balances have been eliminated in consolidation. All dollar amounts in the financial statements and tables in the notes are stated in millions of US dollars unless otherwise indicated. Subsequent events have been evaluated through March 30, 2017, the date these consolidated financial statements were issued.
Use of Estimates
Preparation of financial statements requires estimates and assumptions about future events that affect the reporting of assets and liabilities at the balance sheet dates and the reported amounts of revenue and expense, including fair value measurements, estimates of expected obligations, judgment related to the potential timing of events and other estimates. In the event estimates and/or assumptions prove to be different from actual amounts, adjustments are made in subsequent periods to reflect more current information.
Derivative Instruments and Mark-to-Market Accounting
We enter into contracts for the purchase and sale of electricity, natural gas, coal, uranium and other commodities and also enter into other derivative instruments such as options, swaps, futures and forwards primarily to manage commodity price and interest rate risks. If the instrument meets the definition of a derivative under accounting standards related to derivative instruments and hedging activities, changes in the fair value of the derivative are recognized in net income as unrealized gains and losses, unless the criteria for certain exceptions are met, and an offsetting derivative asset or liability is recorded in the consolidated balance sheets. This recognition is referred to as mark-to-market accounting. The fair values of our unsettled derivative instruments under mark-to-market accounting are reported in the consolidated balance sheets as commodity and other derivative contractual assets or liabilities. We report derivative assets and liabilities in the consolidated balance sheets without taking into consideration netting arrangements we have with counterparties. Margin deposits that contractually offset these assets and liabilities are reported separately in the consolidated balance sheets. When derivative instruments are settled and realized gains and losses are recorded, the previously recorded unrealized gains and losses and derivative assets and liabilities are reversed. See Notes 16 and 17 for additional information regarding fair value measurement and commodity and other derivative contractual assets and liabilities. Under the election criteria of accounting standards related to derivative instruments and hedging activities, we may elect the normal purchase and sale exemption. A commodity-related derivative contract may be designated as a normal purchase or sale if the commodity is to be physically received or delivered for use or sale in the normal course of business. If designated as normal, the derivative contract is accounted for under the accrual method of accounting (not marked-to-market) with no balance sheet or income statement recognition of the contract until settlement.
Because derivative instruments are frequently used as economic hedges, accounting standards related to derivative instruments and hedging activities allow for hedge accounting, which provides for the designation of such instruments as cash flow or fair value hedges if certain conditions are met. At December 31, 2016 and 2015, there were no derivative positions accounted for as cash flow or fair value hedges.
F-17
Table of Contents
Realized and unrealized gains and losses from transacting in energy-related derivative instruments are primarily reported in the statements of consolidated income (loss) in either operating revenues or fuel, purchased power costs and delivery fees in the Successor period depending on the type of derivative instrument and net gain (loss) from commodity hedging and trading activities in the Predecessor period. Further, realized and unrealized gains and losses associated with interest rate swap transactions are reported in the statements of consolidated income (loss) in interest expense for both the Predecessor and Successor.
Revenue Recognition
We record revenue from electricity sales under the accrual method of accounting. Revenues are recognized when electricity is provided to customers on the basis of periodic cycle meter readings and include an estimated accrual for the revenues earned from the meter reading date to the end of the period (unbilled revenue).
In the statements of consolidated income (loss), we report physically delivered commodity sales and related hedging activity in operating revenues and physically delivered purchases and related hedging activity in fuel, purchased power costs and delivery fees for the Successor period, whereas hedging activity was reported as net gain (loss) from commodity hedging and trading activities in the Predecessor period. Volumes under bilateral purchase and sales contracts, including contracts intended as hedges, are not scheduled as physical power with ERCOT. Accordingly, unless the volumes represent physical deliveries to customers or purchases from counterparties, such contracts are reported in operating revenues, for the Successor, and in net gain (loss) from commodity hedging and trading activities, for the Predecessor. If volumes delivered to our retail and wholesale customers are less than our generation volumes (as determined on a daily settlement basis), we record net bilateral activity as wholesale revenues, and if volumes delivered to our retail and wholesale customers exceed our generation volumes, we record net bilateral activity as purchased costs in the Successor period. The additional wholesale revenues or purchased power costs were offset in net gain (loss) from commodity hedging and trading activities in the Predecessor period.
Advertising Expense
We expense advertising costs as incurred and include them within selling, general and administrative expenses. Advertising expenses totaled $9 million, $35 million, $44 million and $42 million for the Successor period from October 3, 2016 through December 31, 2016 and the Predecessor period from January 1, 2016 through October 2, 2016 and the years ended December 31, 2015 and 2014, respectively.
Impairment of Long-Lived Assets
We evaluate long-lived assets (including intangible assets with finite lives) for impairment whenever indications of impairment exist. The carrying value of such assets is deemed to be impaired if the projected undiscounted cash flows are less than the carrying value. If there is such impairment, a loss would be recognized based on the amount by which the carrying value exceeds the fair value. Fair value is determined primarily by discounted cash flows, supported by available market valuations, if applicable. See Note 8 for discussion of impairments of certain long-lived assets recorded by the Predecessor.
Finite-lived intangibles identified as a result of fresh start reporting are amortized over their estimated useful lives based on the expected realization of economic effects. See Note 7 for details of intangible assets with indefinite lives, including discussion of fair value determinations.
Goodwill and Intangible Assets with Indefinite Lives
As part of fresh start reporting, reorganization value is generally allocated, first, to identifiable tangible assets, identifiable intangible assets and liabilities, then any remaining excess reorganization value is allocated to goodwill (see Note 3). We evaluate goodwill and intangible assets with indefinite lives for impairment at least
F-18
Table of Contents
annually, or when indications of impairment exist. As part of fresh start reporting, we have established October 1 as the date we evaluate goodwill and intangible assets with indefinite lives for impairment. The Predecessor’s annual evaluation date was December 1. See Note 7 for details of goodwill, including discussion of fair value determinations and our Predecessor’s goodwill impairments.
Nuclear Fuel
Nuclear fuel is capitalized and reported as a component of our property, plant and equipment in our consolidated balance sheets. Amortization of nuclear fuel is calculated on the units-of-production method and is reported as a component of fuel, purchased power costs and delivery fees in our statements of consolidated income (loss).
Major Maintenance Costs
Major maintenance costs incurred by the Successor during generation plant outages are deferred and amortized into operating costs over the period between the major maintenance outages for the respective asset. Other costs of maintenance activities are charged to expense as incurred and reported as operating costs in our statements of consolidated income (loss). The Predecessor charged major and other maintenance activities to expense as incurred.
Defined Benefit Pension Plans and OPEB Plans
On the Effective Date, EFH Corp. transferred sponsorship of certain employee benefit plans (including related assets), programs and policies to a subsidiary of Vistra Energy. Certain health care and life insurance benefits are offered to eligible employees and their dependents upon the retirement of such employee from the company and also offer pension benefits to eligible employees under collective bargaining agreements based on either a traditional defined benefit formula or a cash balance formula. Effective January 1, 2017, the OPEB plan was amended to discontinue the life insurance benefits for active employees. Costs of pension and OPEB plans are dependent upon numerous factors, assumptions and estimates.
Prior to the Effective Date, our Predecessor bore a portion of the costs of the EFH Corp. sponsored pension and OPEB plans and accounted for the arrangement under multiemployer plan accounting.
See Note 18 for additional information regarding pension and OPEB plans.
Stock-Based Compensation
Stock-based compensation is accounted for in accordance with ASC 718, Compensation — Stock Compensation. The fair value of our non-qualified stock options is estimated on the date of grant using the Black-Scholes option-pricing model. Forfeitures are recognized as they occur. We recognize compensation expense for graded vesting awards on a straight-line basis over the requisite service period for the entire award. See Note 19 for additional information regarding stock-based compensation.
Sales and Excise Taxes
Sales and excise taxes are accounted for as a “pass through” item on the consolidated balance sheets with no effect on the statements of consolidated income (loss) (i.e., the tax is billed to customers and recorded as trade accounts receivable with an offsetting amount recorded as a liability to the taxing jurisdiction).
Franchise and Revenue-Based Taxes
Unlike sales and excise taxes, franchise and gross receipt taxes are not a “pass through” item. These taxes are imposed on us by state and local taxing authorities, based on revenues or kWh delivered, as a cost of doing business and are recorded as an expense. Rates we charge to customers are intended to recover our costs, including the
F-19
Table of Contents
franchise and gross receipt taxes, but we are not acting as an agent to collect the taxes from customers. We report franchise and revenue-based taxes in SG&A expense in our statements of consolidated income (loss).
Income Taxes
Subsequent to the Effective Date, Vistra Energy will file a consolidated US federal income tax return. Prior to the Effective Date, EFH Corp. filed a consolidated US federal income tax return that included the results of our Predecessor; however, our Predecessor’s income tax expense and related balance sheet amounts were recorded as if it filed separate corporate income tax returns.
Deferred income taxes are provided for temporary differences between the book and tax basis of assets and liabilities as required under accounting rules. See Note 9.
We report interest and penalties related to uncertain tax positions as current income tax expense. See Note 9.
Accounting for Contingencies
Our financial results may be affected by judgments and estimates related to loss contingencies. Accruals for loss contingencies are recorded when management determines that it is probable that an asset has been impaired or a liability has been incurred and that such economic loss can be reasonably estimated. Such determinations are subject to interpretations of current facts and circumstances, forecasts of future events and estimates of the financial impacts of such events. See Note 14 for a discussion of contingencies.
Cash and Cash Equivalents
For purposes of reporting cash and cash equivalents, temporary cash investments purchased with a remaining maturity of three months or less are considered to be cash equivalents.
Restricted Cash
The terms of certain agreements require the restriction of cash for specific purposes. See Notes 13 and 22 for more details regarding restricted cash.
Property, Plant and Equipment
In connection with fresh start reporting, carrying amounts of property, plant and equipment were adjusted to estimated fair values as of the Effective Date (see Note 3). Significant improvements or additions to our property, plant and equipment that extend the life of the respective asset are capitalized at cost, while other costs are expensed when incurred. The cost of self-constructed property additions includes materials and both direct and indirect labor and applicable overhead, including payroll-related costs. Interest related to qualifying construction projects and qualifying software projects is capitalized in accordance with accounting guidance related to capitalization of interest cost. See Note 11.
Depreciation of our property, plant and equipment (except for nuclear fuel) is calculated on a straight-line basis over the estimated service lives of the properties. Depreciation expense is calculated on an asset-by-asset basis. Estimated depreciable lives are based on management’s estimates of the assets’ economic useful lives. See Note 22.
Asset Retirement Obligations (ARO)
A liability is initially recorded at fair value for an asset retirement obligation associated with the legal obligation associated with law, regulatory, contractual or constructive retirement requirements of tangible long-lived assets in the period in which it is incurred if a fair value is reasonably estimable. At initial recognition of an ARO obligation, an offsetting asset is also recorded for the long-lived asset that the liability corresponds with, which is subsequently depreciated over the estimated useful life of the asset. These liabilities primarily relate to
F-20
Table of Contents
our nuclear generation plant decommissioning, land reclamation related to lignite mining, removal of lignite/coal fueled plant ash treatment facilities and generation plant asbestos removal and disposal costs. Over time, the liability is accreted for the change in present value and the initial capitalized costs are depreciated over the remaining useful lives of the assets. Generally, changes in estimates related to ARO obligations are recorded as increases to the liability and related asset as information becomes available. See Note 22.
Inventories
Inventories consist of materials and supplies, fuel stock and natural gas in storage. Materials and supplies inventory is valued at weighted average cost and is expensed or capitalized when used for repairs/maintenance or capital projects, respectively. Fuel stock and natural gas in storage are reported at the lower of cost (on a weighted average basis) or market. We expect to recover the value of inventory costs in the normal course of business.
Investments
Investments in a nuclear decommissioning trust fund are carried at current market value in the consolidated balance sheets. Assets related to employee benefit plans represent investments held to satisfy deferred compensation liabilities and are recorded at current market value. See Note 22 for discussion of these and other investments.
Changes in Accounting Standards
In February 2016, the Financial Accounting Standards Board (FASB) issued Accounting Standards Update 2016-02 (ASU 2016-02), Leases. The ASU amends previous GAAP to require the recognition of lease assets and liabilities for operating leases. The ASU will be effective for fiscal years beginning after December 15, 2018, including interim periods within those years. Retrospective application to comparative periods presented will be required in the year of adoption. We are currently evaluating the impact of this ASU on our financial statements.
In May 2016, the FASB issued Accounting Standards Update 2016-09, Revenue from Contracts with Customers (Topic 606), which was further amended through various updates issued by the FASB thereafter. The guidance under Topic 606 provides the core principle and key steps in determining the recognition of revenue and expands disclosure requirements related to revenue recognition. We intend to adopt the new standard on January 1, 2018 using the modified retrospective method and expect to elect the practical expedient available under Topic 606 for measuring progress toward complete satisfaction of a performance obligation and for disclosure requirements of remaining performance obligations. The practical expedient allows an entity to recognize revenue in the amount to which the entity has the right to invoice such that the entity has a right to the consideration in an amount that corresponds directly with the value to the customer for performance completed to date by the entity. In 2016, we continued to assess the new standard, including the expanded disclosure requirements. We do not anticipate that the adoption of the standard will have a material effect on our results of operations, cash flows or financial condition.
In June 2016, the FASB issued ASU 2016-13, Financial Instruments — Credit Losses (Topic 326): Measurement of Credit Losses on Financial Instruments (ASU 2016-13). The ASU provides for a new impairment model which requires measurement and recognition of expected credit losses for most financial assets held. The ASU is effective for public companies for annual periods, and interim periods within those annual periods, beginning after December 15, 2019. We do not anticipate ASU 2016-13 to have a material impact on our financial statements.
In January 2017, the FASB issued ASU 2017-04, Intangibles — Goodwill and Other (Topic 350): Simplifying the Test for Goodwill Impairment (ASU 2017-04). The ASU provides for the elimination of Step 2 from the goodwill impairment test. If impairment charges are recognized, the amount recorded will be the amount by which the carrying amount exceeds the reporting unit’s fair value with certain limitations. The ASU is effective for public companies for annual periods, and interim periods within those annual periods, beginning after December 15, 2019. Early adoption is permitted for interim or annual goodwill impairment tests performed on testing dates after
F-21
Table of Contents
January 1, 2017 and the adoption should be applied prospectively. We expect to early adopt this standard in 2017. We do not currently anticipate ASU 2017-04 to have a material impact on our financial statements.
2. EMERGENCE FROM CHAPTER 11 CASES
On the Petition Date, EFH Corp. and the substantial majority of its direct and indirect subsidiaries, including EFIH, EFCH and TCEH but excluding the Oncor Ring-Fenced Entities, filed voluntary petitions for relief under Chapter 11 of the United States Bankruptcy Code in the United States Bankruptcy Court for the District of Delaware. On the Effective Date, the TCEH Debtors and the Contributed EFH Debtors completed their reorganization under the Bankruptcy Code and emerged from the Chapter 11 Cases as subsidiaries of Vistra Energy.
Separation of Vistra Energy from EFH Corp. and its Subsidiaries
Upon the Effective Date, Vistra Energy separated from EFH Corp. pursuant to a tax-free spin-off transaction that was part of a series of transactions that included a taxable component. The taxable portion of the transaction generated a taxable gain that resulted in no regular tax liability due to available net operating loss carryforwards of EFH Corp. The transaction did result in an alternative minimum tax liability of approximately $14 million payable by EFH Corp. to the IRS. Vistra Energy has an obligation to reimburse EFH Corp. 50% of such alternative minimum tax, approximately $7 million, pursuant to the Tax Matters Agreement. The spin-off transaction resulted in Vistra Energy, including the TCEH Debtors and the Contributed EFH Debtors, no longer being an affiliate of EFH Corp. and its subsidiaries. In addition to the Plan of Reorganization, the separation was effectuated, in part, pursuant to the terms of a separation agreement, a transition services agreement and a tax matters agreement.
Separation Agreement
On the Effective Date, EFH Corp., Vistra Energy and a subsidiary of Vistra Energy entered into a separation agreement that provides for, among other things, the transfer of certain assets and liabilities by EFH Corp., EFCH and TCEH to Vistra Energy. Among other things, EFH Corp., EFCH and/or TCEH, as applicable, (a) transferred the TCEH Debtors and certain contracts and assets (and related liabilities) primarily related to the business of the TCEH Debtors to Vistra Energy, (b) transferred sponsorship of certain employee benefit plans (including related assets), programs and policies to a subsidiary of Vistra Energy and (c) assigned certain employment agreements from EFH Corp. and certain of the Contributed EFH Debtors to a subsidiary of Vistra Energy.
Tax Matters Agreement
On the Effective Date, Vistra Energy and EFH Corp. entered into a tax matters agreement (the Tax Matters Agreement), which provides for the allocation of certain taxes among the parties and for certain rights and obligations related to, among other things, the filing of tax returns, resolutions of tax audits and preserving the tax-free nature of the spin-off. See Note 9 for further information about the Tax Matters Agreement.
Settlement Agreement
The Debtors, the Sponsor Group, certain settling TCEH first lien creditors, certain settling TCEH second lien creditors, certain settling TCEH unsecured creditors and the official committee of unsecured creditors of the TCEH Debtors entered into a settlement agreement (the Settlement Agreement) in August 2015 (as amended in September 2015 and approved by the Bankruptcy Court in December 2015) to settle, among other things, (a) intercompany claims among the Debtors, (b) claims and causes of actions against holders of first lien claims against TCEH and the agents under the TCEH Senior Secured Facilities, (c) claims and causes of action against holders of interests in EFH Corp. and certain related entities and (d) claims and causes of action against each of the Debtors’ current and former directors, the Sponsor Group, managers and officers and other related entities.
Tax Matters
In July 2016, EFH Corp. received a private letter ruling from the IRS in connection with our emergence from bankruptcy, which provides, among other things, for certain rulings regarding the qualification of (a) the
F-22
Table of Contents
transfer of certain assets and ordinary course operating liabilities to Vistra Energy and (b) the distribution of the equity of Vistra Energy, the cash proceeds from Vistra Energy debt, the cash proceeds from the sale of preferred stock in a newly-formed subsidiary of Vistra Energy, and the right to receive payments under a tax receivables agreement, to holders of TCEH first lien claims, as a reorganization qualifying for tax-free treatment.
Pre-Petition Claims
On the Effective Date, the TCEH Debtors (together with the Contributed EFH Debtors) emerged from the Chapter 11 Cases and discharged approximately $33.8 billion in LSTC. Distributions for the settled claims related to the funded debt of the TCEH Debtors commenced subsequent to the Effective Date. With respect to remaining claims related to the TCEH Debtors, as of December 31, 2016, the TCEH Debtors have approximately $54 million in escrow to allocate among and resolve the remaining claims, which consist primarily of remaining trade payable and legal claims, including asbestos claims. The Bankruptcy code allows up to 180 days from the Effective Date to resolve these claims. These remaining claims and the related escrow balance for the claims are recorded in Vistra Energy’s consolidated balance sheet as other current liabilities and restricted cash, respectively.
3. FRESH START REPORTING
As of the Effective Date, Vistra Energy applied fresh start reporting under the applicable provisions of ASC 852. In order to apply fresh-start reporting, ASC 852 requires two criteria to be satisfied: (1) that total post-petition liabilities and allowed claims immediately before the date of confirmation of the Plan of Reorganization be in excess of reorganization value and (2) that holders of our Predecessor’s voting shares immediately before confirmation of the Plan receive less than 50% of the voting shares of the emerging entity. Vistra Energy met both criteria. Under ASC 852, application of fresh start reporting is required on the date on which a plan of reorganization is confirmed by a bankruptcy court and all material conditions to the plan of reorganization are satisfied. All material conditions to the Plan of Reorganization were satisfied on the Effective Date, including the execution of the Spin-Off.
Reorganization Value
A third-party valuation specialist submitted a report to the Bankruptcy Court in July 2016 assuming an emergence from bankruptcy as of December 31, 2016. This report provided an estimated value range for the total Vistra Energy enterprise. Management selected an enterprise value within that range of $10.5 billion. The enterprise value submitted by the valuation specialist was based upon:
| • | historical financial information of our Predecessor for recent years and interim periods; |
| • | certain internal financial and operating data of our Predecessor; |
| • | certain financial, tax and operational forecasts of Vistra Energy; |
| • | certain publicly available financial data for comparable companies to the operating business of Vistra Energy; |
| • | the Plan of Reorganization and related documents; |
| • | certain economic and industry information relevant to the operating business, and |
| • | other studies, analyses and inquiries. |
The valuation analysis for Vistra Energy included (i) a discounted cash flow calculation and (ii) peer group company analysis. Equal weighting was assigned to the two methodologies, before adding the value of the tax basis step-up resulting from certain transactions pursuant to the Plan of Reorganization, which was valued separately. The estimated future cash flows included annual forecasts through 2021. A terminal value was included in the discounted cash flow calculation using an exit multiple approach based on the cash flows of the final year of the forecast period.
F-23
Table of Contents
The valuation analysis used a discount rate of approximately 7%. The determination of the discount rate takes into consideration the capital structure, credit ratings and current debt yields of comparable publicly traded companies as well as an estimate of return on equity that reflects historical market returns and current market volatility for the industry.
Although the Company believes the assumptions and estimates used by the valuation specialist to develop the enterprise value are reasonable and appropriate, different assumption and estimates could materially impact the analysis and resulting conclusions.
Under ASC 852, reorganization value is generally allocated, first, to identifiable tangible assets, identifiable intangible assets and liabilities, then any remaining excess reorganization value is allocated to goodwill. Vistra Energy estimates its reorganization value of assets at approximately $15.161 billion as of October 3, 2016, which consists of the following:
| Business enterprise value |
$ | 10,500 | ||
| Cash excluded from business enterprise value |
1,594 | |||
| Deferred asset related to prepaid capital lease obligation |
38 | |||
| Current liabilities, excluding short-term portion of debt and capital leases |
1,123 | |||
| Noncurrent, non-interest bearing liabilities |
1,906 | |||
|
|
|
|||
| Vistra Energy reorganization value of assets |
$ | 15,161 | ||
|
|
|
F-24
Table of Contents
Consolidated Balance Sheet
The adjustments to TCEH’s October 3, 2016 consolidated balance sheet below include the impacts of the Plan of Reorganization and the adoption of fresh start reporting.
| October 3, 2016 | ||||||||||||||||||||||||
| TCEH (Predecessor) (1) |
Reorganization Adjustments (2) |
Fresh Start Adjustments |
Vistra Energy (Successor) |
|||||||||||||||||||||
| ASSETS |
||||||||||||||||||||||||
| Current assets: |
||||||||||||||||||||||||
| Cash and cash equivalents |
$ | 1,829 | $ | (1,028 | ) | (3) | $ | — | $ | 801 | ||||||||||||||
| Restricted cash |
12 | 131 | (4) | — | 143 | |||||||||||||||||||
| Trade accounts receivable — net |
750 | 4 | — | 754 | ||||||||||||||||||||
| Advances to parents and affiliates of Predecessor |
78 | (78 | ) | — | — | |||||||||||||||||||
| Inventories |
374 | — | (86 | ) | (17) | 288 | ||||||||||||||||||
| Commodity and other derivative contractual assets |
255 | — | — | 255 | ||||||||||||||||||||
| Margin deposits related to commodity contracts |
42 | — | — | 42 | ||||||||||||||||||||
| Other current assets |
47 | 17 | 3 | 67 | ||||||||||||||||||||
|
|
|
|
|
|
|
|
|
|||||||||||||||||
| Total current assets |
3,387 | (954 | ) | (83 | ) | 2,350 | ||||||||||||||||||
| Restricted cash |
650 | — | — | 650 | ||||||||||||||||||||
| Advance to parent and affiliates of Predecessor |
17 | (21 | ) | 4 | — | |||||||||||||||||||
| Investments |
1,038 | 1 | 9 | (18) | 1,048 | |||||||||||||||||||
| Property, plant and equipment — net |
10,359 | 53 | (5,970 | ) | (19) | 4,442 | ||||||||||||||||||
| Goodwill |
152 | — | 1,755 | (27) | 1,907 | |||||||||||||||||||
| Identifiable intangible assets — net |
1,148 | 4 | 2,256 | (20) | 3,408 | |||||||||||||||||||
| Commodity and other derivative contractual assets |
73 | — | (14 | ) | 59 | |||||||||||||||||||
| Deferred income taxes |
— | 320 | (5) | 730 | (21) | 1,050 | ||||||||||||||||||
| Other noncurrent assets |
51 | 38 | 158 | (22) | 247 | |||||||||||||||||||
|
|
|
|
|
|
|
|
|
|||||||||||||||||
| Total assets |
$ | 16,875 | $ | (559 | ) | $ | (1,155 | ) | $ | 15,161 | ||||||||||||||
|
|
|
|
|
|
|
|
|
|||||||||||||||||
F-25
Table of Contents
| October 3, 2016 | ||||||||||||||||||||||||
| TCEH (Predecessor) (1) |
Reorganization Adjustments (2) |
Fresh Start Adjustments |
Vistra Energy (Successor) |
|||||||||||||||||||||
| LIABILITIES AND EQUITY |
||||||||||||||||||||||||
| Current liabilities: |
||||||||||||||||||||||||
| Long-term debt due currently |
$ | 4 | $ | 5 | $ | (1 | ) | $ | 8 | |||||||||||||||
| Trade accounts payable |
402 | 145 | (6) | 3 | 550 | |||||||||||||||||||
| Trade accounts and other payables to affiliates of Predecessor |
152 | (152 | ) | (6) | — | — | ||||||||||||||||||
| Commodity and other derivative contractual liabilities |
125 | — | — | 125 | ||||||||||||||||||||
| Margin deposits related to commodity contracts |
64 | — | — | 64 | ||||||||||||||||||||
| Accrued income taxes |
12 | 12 | — | 24 | ||||||||||||||||||||
| Accrued taxes other than income |
119 | 4 | — | 123 | ||||||||||||||||||||
| Accrued interest |
110 | (109 | ) | (7) | — | 1 | ||||||||||||||||||
| Other current liabilities |
243 | 170 | (8) | 5 | 418 | |||||||||||||||||||
|
|
|
|
|
|
|
|
|
|||||||||||||||||
| Total current liabilities |
1,231 | 75 | 7 | 1,313 | ||||||||||||||||||||
| Long-term debt, less amounts due currently |
— | 3,476 | (9) | 151 | (23) | 3,627 | ||||||||||||||||||
| Borrowings under debtor-in-possession credit facilities |
3,387 | (3,387 | ) | (9) | — | — | ||||||||||||||||||
| Liabilities subject to compromise |
33,749 | (33,749 | ) | (10) | — | — | ||||||||||||||||||
| Commodity and other derivative contractual liabilities |
5 | — | 3 | 8 | ||||||||||||||||||||
| Deferred income taxes |
256 | (256 | ) | (11) | — | — | ||||||||||||||||||
| Tax Receivable Agreement obligation |
— | 574 | (12) | — | 574 | |||||||||||||||||||
| Asset retirement obligations |
809 | — | 854 | (24) | 1,663 | |||||||||||||||||||
| Other noncurrent liabilities and deferred credits |
1,018 | 117 | (13) | (900 | ) | (25) | 235 | |||||||||||||||||
|
|
|
|
|
|
|
|
|
|||||||||||||||||
| Total liabilities |
40,455 | (33,150 | ) | 115 | 7,420 | |||||||||||||||||||
|
|
|
|
|
|
|
|
|
|||||||||||||||||
| Equity: |
||||||||||||||||||||||||
| Common stock |
— | 4 | (14) | — | 4 | |||||||||||||||||||
| Additional paid-in-capital |
— | 7,737 | (15) | — | 7,737 | |||||||||||||||||||
| Accumulated other comprehensive income (loss) |
(32 | ) | 22 | 10 | (26) | — | ||||||||||||||||||
| Predecessor membership interests |
(23,548 | ) | 24,828 | (16) | (1,280 | ) | (26) | — | ||||||||||||||||
|
|
|
|
|
|
|
|
|
|||||||||||||||||
| Total equity |
(23,580 | ) | 32,591 | (1,270 | ) | 7,741 | ||||||||||||||||||
|
|
|
|
|
|
|
|
|
|||||||||||||||||
| Total liabilities and equity |
$ | 16,875 | $ | (559 | ) | $ | (1,155 | ) | $ | 15,161 | ||||||||||||||
|
|
|
|
|
|
|
|
|
|||||||||||||||||
| (1) | Represents the consolidated balance sheet of TCEH as of October 3, 2016. |
Reorganization adjustments
| (2) | Includes the addition of certain assets and liabilities associated with the Contributed EFH Entities. Also includes EFH Corp.‘s contribution of liabilities associated with certain employee benefit plans to Vistra Energy. |
F-26
Table of Contents
| (3) | Net adjustments to cash, which represent distributions made or funding provided to an escrow account, classified as restricted cash, under the Plan of Reorganization, as follows: |
| Sources (uses): |
||||
| Net proceeds from PrefCo preferred stock sale |
$ | 69 | ||
| Addition of cash balances from the Contributed EFH Debtors |
22 | |||
| Payments to TCEH first lien creditors, including adequate protection |
(486 | ) | ||
| Payment to TCEH unsecured creditors (including $73 million to escrow) |
(502 | ) | ||
| Payment of administrative claims to TCEH creditors |
(53 | ) | ||
| Payment of legal fees, professional fees and other costs (including $52 million to escrow) |
(78 | ) | ||
|
|
|
|||
| Net use of cash |
$ | (1,028 | ) | |
|
|
|
| (4) | Increase in restricted cash primarily reflects amounts placed in escrow to satisfy certain secured claims, unsecured claims and professional fee obligations associated with the bankruptcy. |
| (5) | Reflects the deferred income tax impact of the Plan of Reorganization implementation, including cancellation of debts and adjustment of tax-basis for certain assets of PrefCo that issued mandatorily redeemable preferred stock as part of the Spin-Off. |
| (6) | Primarily reflects the reclassification of transmission and distribution service payables to Oncor from payables with affiliates to trade payables with third parties pursuant to the separation of Vistra Energy from EFH Corp. and payment of accrued professional fees and unsecured claimant obligations incurred in conjunction with Emergence. |
| (7) | Primarily reflects the payment of accrued interest and adequate protection to the TCEH first lien creditors on the Effective Date. |
| (8) | Primarily reflects the following: |
| • | Reclassification of $82 million from LSTC related to secured and unsecured claims and $16 million in accrued professional fees from accounts payable to other current liabilities. |
| • | Additional accruals for $23 million of change-in-control obligations and $26 million in success fees triggered by Emergence, $7 million in professional fees, and $28 million of accrued liabilities related to the Contributed EFH Entities. |
| • | Payment of $12 million in professional fees. |
| (9) | Reflects the conversion of the TCEH DIP Roll Facilities of $3.387 billion to the Vistra Operations Credit Facilities at Emergence, the issuance and sale of mandatorily redeemable preferred stock of PrefCo for $70 million, and the obligation related to a corporate office space lease contributed to Vistra Energy pursuant to the Plan of Reorganization. See Note 13 for additional details. |
F-27
Table of Contents
| (10) | Reflects the elimination of TCEH’s liabilities subject to compromise pursuant to the Plan of Reorganization (see Note 5). Liabilities subject to compromise were settled as follows in accordance with the Plan of Reorganization: |
| Notes, loans and other debt |
$ | 31,668 | ||
| Accrued interest on notes, loans and other debt |
646 | |||
| Net liability under terminated TCEH interest rate swap and natural gas hedging agreements |
1,243 | |||
| Trade accounts payable and other expected allowed claims |
192 | |||
|
|
|
|||
| Third-party liabilities subject to compromise |
33,749 | |||
| LSTC from the Contributed EFH Entities |
8 | |||
|
|
|
|||
| Total liabilities subject to compromise |
33,757 | |||
| Fair value of equity issued to TCEH first lien creditors |
(7,741 | ) | ||
| TRA Rights issued to TCEH first lien creditors |
(574 | ) | ||
| Cash distributed and accruals for TCEH first lien creditors |
(377 | ) | ||
| Cash distributed for TCEH unsecured claims |
(502 | ) | ||
| Cash distributed and accruals for TCEH administrative claims |
(60 | ) | ||
| Settlement of affiliate balances |
(99 | ) | ||
| Net liabilities of contributed entities and other items |
(60 | ) | ||
|
|
|
|||
| Gain on extinguishment of LSTC |
$ | 24,344 | ||
|
|
|
| (11) | Reflects the deferred income tax impact of the Plan of Reorganization implementation, including cancellation of debts and adjustment of tax basis of certain assets of PrefCo. |
| (12) | Reflects the estimated present value of the TRA obligation. See Note 10 for further discussion of the TRA obligation valuation assumptions. |
| (13) | Primarily reflects the following: |
| • | Addition of $122 million in liabilities primarily related to benefit plan obligations associated with a pension plan and a health and welfare plan assumed by Vistra Energy pursuant to the Plan of Reorganization. See Note 18 for further discussion of the benefit plan obligations. |
| • | Payment of $7 million in settlements related to split life insurance costs with a prior affiliate entity. |
| (14) | Reflects the issuance of approximately 427,500,000 shares of Vistra Energy common stock, par value of $0.01 per share, to the TCEH first lien creditors. See Note 15. |
F-28
Table of Contents
| (15) | Reflects adjustments to present Vistra Energy equity value at approximately $7.741 billion based on a reconciliation from the $10.5 billion enterprise value described above under Reorganization Value as depicted below: |
| Enterprise value |
$ | 10,500 | ||
| Vistra Operations Credit Facility — Initial Term Loan B Facility |
(2,871 | ) | ||
| Vistra Operations Credit Facility — Term Loan C Facility |
(655 | ) | ||
| Accrual for post-Emergence claims satisfaction |
(181 | ) | ||
| Tax Receivable Agreement Obligation |
(574 | ) | ||
| Preferred stock of PrefCo |
(70 | ) | ||
| Other items |
(2 | ) | ||
| Cash and cash equivalents |
801 | |||
| Restricted cash |
793 | |||
|
|
|
|||
| Equity value at Emergence |
$ | 7,741 | ||
|
|
|
|||
| Common stock at par value |
$ | 4 | ||
| Additional paid-in capital |
7,737 | |||
|
|
|
|||
| Equity value |
$ | 7,741 | ||
| Shares outstanding at October 3, 2016 (in millions) |
427.5 | |||
| Per share value |
$ | 18.11 |
| (16) | Membership Interest impact of Plan of Reorganization are shown below: |
| Gain on extinguishment of LSTC |
$ | 24,344 | ||
| Elimination of accumulated other comprehensive income |
(22 | ) | ||
| Change in Control payments |
(23 | ) | ||
| Professional fees |
(33 | ) | ||
| Other items |
(14 | ) | ||
|
|
|
|||
| Pretax gain on reorganization adjustments (Note 4) |
24,252 | |||
| Deferred tax impact of the Plan of Reorganization and spin-off |
576 | |||
|
|
|
|||
| Total impact to membership interests |
$ | 24,828 | ||
|
|
|
Fresh start adjustments
| (17) | Reflects the reduction of inventory to fair value, including (1) adjustment of fuel inventory to current market prices, and (2) an adjustment to the fair value of materials and supplies inventory primarily used in our lignite/coal fueled generation assets and related mining operations. |
| (18) | Reflects the $12 million increase in the fair value of certain real property assets and $3 million reduction of the fair value for other investments. |
F-29
Table of Contents
| (19) | Reflects the change in fair value of property, plant and equipment related primarily to generation and mining assets as detailed below: |
| Property, Plant and Equipment |
Adjustment | Fair Value |
||||||
| Generation plants and mining assets |
$ | (6,057 | ) | $ | 3,698 | |||
| Land |
140 | 490 | ||||||
| Nuclear Fuel |
(23 | ) | 157 | |||||
| Other equipment |
(30 | ) | 97 | |||||
|
|
|
|
|
|||||
| Total |
$ | (5,970 | ) | $ | 4,442 | |||
|
|
|
|
|
|||||
We engaged a third-party valuation specialist to assist in preparing the values for our property, plant and equipment. For our generation plants and related mining assets, an income approach was utilized in valuing those assets based on discounted cash flow models that forecast the cash flows of the related assets over their respective useful lives. Significant estimates and assumptions utilized in those models include (1) long-term wholesale power price forecasts, (2) fuel cost forecasts, (3) expected generation volumes based on prevailing forecasts and expected maintenance outages, (4) operations and maintenance costs, (5) capital expenditure forecasts and (6) risk adjusted discount rates based on the cash flows produced by the specific generation asset. The fair value of the generation plants and mining assets is based upon Level 3 inputs utilized in the income approach.
The fair value estimates for land and nuclear fuel utilized the market approach, which included utilizing recent comparable sales information and current market conditions for similarly situated land. Nuclear fuel values were determined by utilizing market pricing information for uranium. The fair value of land and nuclear fuel are based upon Level 2 inputs.
| (20) | Reflects the adjustment in fair value of $2.256 billion to identifiable intangible assets, including $1.636 billion increase related to retail customer relationships, $270 million increase related to the retail trade name, $190 million increase related to an electricity supply contract, $164 million increase related to retail and wholesale contracts and $4 million decrease related to other intangible assets (see Note 7). |
Also reflects the reduction of fair value of $476 million to identifiable intangible liabilities, including a reduction of $525 million related to an electricity supply contract and an increase of $49 million to wholesale contracts.
| (21) | Reflects the deferred income tax impact of fresh-start adjustments to property, plant, and equipment, inventory, intangibles and debt issuance costs. |
| (22) | Primarily reflects the following: |
| • | Addition of $197 million regulatory asset related to the deficiency of the nuclear decommissioning trust investment as compared to the nuclear generation plant retirement obligation. Pursuant to Texas regulatory provisions, the trust fund for decommissioning our nuclear generation facility is funded by a fee surcharge billed to REPs by Oncor, as a collection agent, and remitted monthly to Vistra Energy. |
| • | Adjustment to remove $26 million of unamortized debt issuance costs to reflect the Vistra Operations Credit Facilities at fair market value. |
| (23) | Reflects the increase in fair value of the Vistra Operations Credit Facilities in the amount of $151 million based on the quoted market prices of the facilities. |
| (24) | Increase in fair value of asset retirement obligation related to the plant retirement, mining and reclamation retirement, and coal combustion residuals. See Note 22 for further discussion of our asset retirement obligations. |
F-30
Table of Contents
| (25) | Reflects the following: |
| • | Reduction in fair value of unfavorable contracts related to wholesale contracts and a portion of an electricity supply contract in the amount of $476 million. See footnote (20) above for further detail. |
| • | Reduction of $465 million related to reduction in liability that represented excess amounts in the nuclear decommissioning trust above the carrying value of the asset retirement obligation related to our nuclear generation plant decommissioning. |
| • | Increase in fair value of obligations related to leased property in the amount of $29 million. |
| • | Increase in fair value of Pension and OPEB obligations in the amount of $12 million. |
| (26) | Reflects the extinguishment of Predecessor membership interest and accumulated other comprehensive loss per the Plan of Reorganization. |
| (27) | Reflects increase in goodwill balance to present final goodwill as the reorganization value in excess of the identifiable tangible assets, intangible assets, and liabilities at Emergence. |
| Business enterprise value |
$ | 10,500 | ||
| Add: Fair value of liabilities excluded from enterprise value |
3,030 | |||
| Less: Fair value of tangible assets |
(8,215 | ) | ||
| Less: Fair value of identified intangible assets |
(3,408 | ) | ||
|
|
|
|||
| Vistra Energy goodwill |
$ | 1,907 | ||
|
|
|
4. PREDECESSOR REORGANIZATION ITEMS
Expenses and income directly associated with the Chapter 11 Cases are reported separately in the statements of consolidated loss as reorganization items as required by ASC 852, Reorganizations. Reorganization items also included adjustments to reflect the carrying value of LSTC at their estimated allowed claim amounts, as such adjustments were determined. For the period from January 1, 2016 through October 2, 2016, reorganization items include the gain from extinguishing LSTC and the impacts of fresh start reporting. The following table presents reorganization items as reported in the statements of consolidated loss:
| Predecessor | ||||||||||||
| Period from January 1, 2016 through October 2, 2016 |
Year Ended December 31, 2015 |
Post-Petition Period Ended December 31, 2014 |
||||||||||
| Gain on reorganization adjustments (Note 3) |
$ | (24,252 | ) | $ | — | $ | — | |||||
| Loss from the adoption of fresh start reporting |
2,013 | — | — | |||||||||
| Expenses related to legal advisory and representation services |
55 | 141 | 65 | |||||||||
| Expenses related to other professional consulting and advisory services |
39 | 69 | 67 | |||||||||
| Contract claims adjustments |
13 | 54 | 19 | |||||||||
| Noncash adjustment for estimated allowed claims related to debt |
— | 896 | — | |||||||||
| Adjustment to affiliate claims pursuant to Settlement Agreement (Note 20) |
— | (635 | ) | — | ||||||||
| Gain on settlement of debt held by affiliates (Note 20) |
— | (382 | ) | — | ||||||||
| Gain on settlement of interest on debt held by affiliates |
— | (20 | ) | — | ||||||||
| Sponsor management agreement settlement (Notes 2 and 20) |
— | (19 | ) | — | ||||||||
| Contract assumption adjustments |
— | (14 | ) | — | ||||||||
| Fees associated with extension/completion of the DIP Facility |
— | 9 | 92 | |||||||||
| Noncash liability adjustment arising from termination of interest rate swaps |
— | — | 277 | |||||||||
| Other |
11 | 2 | — | |||||||||
|
|
|
|
|
|
|
|||||||
| Total reorganization items |
$ | (22,121 | ) | $ | 101 | $ | 520 | |||||
|
|
|
|
|
|
|
|||||||
F-31
Table of Contents
5. PREDECESSOR LIABILITIES SUBJECT TO COMPROMISE (LSTC)
On the Effective Date, the TCEH Debtors (together with the Contributed EFH Debtors) emerged from the Chapter 11 Cases and discharged substantially all of the $33.8 billion in LSTC, which includes approximately $8 million of claims from the Contributed EFH Entities (see Note 3).
The amounts classified as LSTC reflected the Predecessor’s estimate of pre-petition liabilities and other expected allowed claims to be addressed in the Chapter 11 Cases. Amounts classified as LSTC did not include pre-petition liabilities that were fully collateralized by letters of credit, cash deposits or other credit enhancements. The following table presents LSTC as reported in the consolidated balance sheet at December 31, 2015:
| Predecessor | ||||
| December 31, 2015 |
||||
| Notes, loans and other debt per the following table |
$ | 31,668 | ||
| Accrued interest on notes, loans and other debt |
646 | |||
| Net liability under terminated TCEH interest rate swap and natural gas hedging agreements (Note 17) |
1,243 | |||
| Trade accounts payable, advances and other payables to affiliates and other expected allowed claims |
177 | |||
|
|
|
|||
| Total liabilities subject to compromise |
$ | 33,734 | ||
|
|
|
|||
F-32
Table of Contents
Pre-Petition Notes, Loans and Other Debt Reported as LSTC
Amounts presented below represent principal amounts of pre-petition notes, loans and other debt reported as LSTC at December 31, 2015.
| Predecessor | ||||
| December 31, 2015 |
||||
| Senior Secured Facilities |
||||
| TCEH Floating Rate Term Loan Facilities due October 10, 2014 |
$ | 3,809 | ||
| TCEH Floating Rate Letter of Credit Facility due October 10, 2014 |
42 | |||
| TCEH Floating Rate Revolving Credit Facility due October 10, 2016 |
2,054 | |||
| TCEH Floating Rate Term Loan Facilities due October 10, 2017 |
15,691 | |||
| TCEH Floating Rate Letter of Credit Facility due October 10, 2017 |
1,020 | |||
| 11.5% Fixed Senior Secured Notes due October 1, 2020 |
1,750 | |||
| 15% Fixed Senior Secured Second Lien Notes due April 1, 2021 |
336 | |||
| 15% Fixed Senior Secured Second Lien Notes due April 1, 2021, Series B |
1,235 | |||
| 10.25% Fixed Senior Notes due November 1, 2015 |
1,833 | |||
| 10.25% Fixed Senior Notes due November 1, 2015, Series B |
1,292 | |||
| 10.50% /11.25% Senior Toggle Notes due November 1, 2016 |
1,749 | |||
| Pollution Control Revenue Bonds |
||||
| Brazos River Authority: |
||||
| 5.40% Fixed Series 1994A due May 1, 2029 |
39 | |||
| 7.70% Fixed Series 1999A due April 1, 2033 |
111 | |||
| 7.70% Fixed Series 1999C due March 1, 2032 |
50 | |||
| 8.25% Fixed Series 2001A due October 1, 2030 |
71 | |||
| 8.25% Fixed Series 2001D-1 due May 1, 2033 |
171 | |||
| 6.30% Fixed Series 2003B due July 1, 2032 |
39 | |||
| 6.75% Fixed Series 2003C due October 1, 2038 |
52 | |||
| 5.40% Fixed Series 2003D due October 1, 2029 |
31 | |||
| 5.00% Fixed Series 2006 due March 1, 2041 |
100 | |||
| Sabine River Authority of Texas: |
||||
| 6.45% Fixed Series 2000A due June 1, 2021 |
51 | |||
| 5.20% Fixed Series 2001C due May 1, 2028 |
70 | |||
| 5.80% Fixed Series 2003A due July 1, 2022 |
12 | |||
| 6.15% Fixed Series 2003B due August 1, 2022 |
45 | |||
| Trinity River Authority of Texas: |
||||
| 6.25% Fixed Series 2000A due May 1, 2028 |
14 | |||
| Other |
1 | |||
|
|
|
|||
| Total TCEH consolidated notes, loans and other debt |
$ | 31,668 | ||
|
|
|
|||
TCEH Letter of Credit Facility Activity
Borrowings under the TCEH Letter of Credit Facility had been recorded by TCEH as restricted cash that supported issuances of letters of credit. At December 31, 2015, the restricted cash related to the pre-petition TCEH Letter of Credit Facility totaled $507 million, and there were no outstanding letters of credit related to the pre-petition TCEH Letter of Credit Facility. Pursuant to the confirmation of the Plan of Reorganization in August 2016 with respect to the TCEH Debtors and the Contributed EFH Debtors, the restricted cash was released to TCEH and reclassified to cash and cash equivalents.
F-33
Table of Contents
6. LAMAR AND FORNEY ACQUISITION
In April 2016, Luminant purchased all of the membership interests in La Frontera Holdings, LLC (La Frontera), the indirect owner of two combined-cycle gas turbine (CCGT) natural gas fueled generation facilities representing nearly 3,000 MW of capacity located in ERCOT, from a subsidiary of NextEra Energy, Inc. (the Lamar and Forney Acquisition). The facility in Forney, Texas has a capacity of 1,912 MW and the facility in Paris, Texas has a capacity of 1,076 MW. The acquisition diversified our fuel mix and increased the dispatch flexibility in our generation fleet. The aggregate purchase price was approximately $1.313 billion, which included the repayment of approximately $950 million of existing project financing indebtedness of La Frontera at closing, plus approximately $236 million for cash and net working capital. The purchase price was funded by cash-on-hand and additional borrowings under our Predecessor’s DIP Facility totaling $1.1 billion. After completing the acquisition, we repaid approximately $230 million of borrowings under our Predecessor’s DIP Revolving Credit Facility primarily utilizing cash acquired in the transaction. La Frontera and its subsidiaries were subsidiary guarantors under our Predecessor’s DIP Roll Facilities and, on the Effective Date, became subsidiary guarantors under the Vistra Operations Credit Facilities (see Note 13).
Predecessor Purchase Accounting
The Lamar and Forney Acquisition was accounted for in accordance with ASC 805, Business Combinations (ASC 805), with identifiable assets acquired and liabilities assumed recorded at their estimated fair values on the acquisition date.
To fair value the acquired property, plant and equipment, we used a discounted cash flow analysis, classified as Level 3 within the fair value hierarchy levels (see Note 16). This discounted cash flow model was created for each generation facility based on its remaining useful life. The discounted cash flow model included gross margin forecasts for each power generation facility determined using forward commodity market prices obtained from long-term forecasts. We also used management’s forecasts of generation output, operations and maintenance expense, SG&A and capital expenditures. The resulting cash flows, estimated based upon the age of the assets, efficiency, location and useful life, were then discounted using plant specific discount rates of approximately 9%.
The following table summarizes the consideration paid and the allocation of the purchase price to the fair value amounts recognized for the assets acquired and liabilities assumed related to the Lamar and Forney Acquisition as of the acquisition date. During the three months ended September 30, 2016, the working capital adjustment included in the purchase price was finalized between the parties, and the purchase price allocation was completed.
| Cash paid to seller at close |
$ | 603 | ||
| Net working capital adjustments |
(4 | ) | ||
|
|
|
|||
| Consideration paid to seller |
599 | |||
| Cash paid to repay project financing at close |
950 | |||
|
|
|
|||
| Total cash paid related to acquisition |
$ | 1,549 | ||
|
|
|
|||
| Cash and cash equivalents |
$ | 210 | ||
| Property, plant and equipment — net |
1,316 | |||
| Commodity and other derivative contractual assets |
47 | |||
| Other assets |
44 | |||
|
|
|
|||
| Total assets acquired |
1,617 | |||
|
|
|
|||
| Commodity and other derivative contractual liabilities |
53 | |||
| Trade accounts payable and other liabilities |
15 | |||
|
|
|
|||
| Total liabilities assumed |
68 | |||
|
|
|
|||
| Identifiable net assets acquired |
$ | 1,549 | ||
|
|
|
F-34
Table of Contents
The Lamar and Forney Acquisition did not result in the recording of goodwill since the purchase price did not exceed the fair value of the net assets acquired.
Unaudited Pro Forma Financial Information
The following unaudited pro forma financial information for the Predecessor periods indicated assumes that the Lamar and Forney Acquisition occurred on January 1, 2015. The unaudited pro forma financial information is provided for information purposes only and is not necessarily indicative of the results of operations that would have occurred had the Lamar and Forney Acquisition been completed on January 1, 2015, nor are they indicative of future results of operations.
| Predecessor | ||||||||
| Period from January 1, 2016 through October 2, 2016 |
December 31, 2015 |
|||||||
| Revenues |
$ | 4,116 | $ | 6,133 | ||||
| Net income (loss) |
$ | 22,835 | $ | (4,671 | ) | |||
The unaudited pro forma financial information includes adjustments for incremental depreciation as a result of the fair value determination of the net assets acquired and interest expense on borrowings under our Predecessor’s DIP Roll Facilities in lieu of interest expense incurred prior to the acquisition.
7. GOODWILL AND IDENTIFIABLE INTANGIBLE ASSETS
Goodwill
The following table provides information regarding the carrying value of goodwill. The goodwill of the Successor arose in connection with fresh start reporting that was applied at Emergence and was allocated to the Retail Electric segment (see Note 3). Of the goodwill recorded at Emergence, $1.686 billion is considered purchased goodwill and is deductible for tax purchases over 15 years on a straight-line basis. The goodwill of our Predecessor arose in connection with accounting for the Merger.
| Successor | Predecessor | |||||||||||
| Period from October 3, 2016 through December 31, 2016 |
Period from January 1, 2016 through October 2, 2016 |
Year Ended December 31, 2015 |
||||||||||
| Balance at beginning of period |
$ | 1,907 | $ | 152 | $ | 2,352 | ||||||
| Noncash impairment charges |
— | — | (2,200 | ) | ||||||||
|
|
|
|
|
|
|
|||||||
| Balance at end of period (a) |
$ | 1,907 | $ | 152 | $ | 152 | ||||||
|
|
|
|
|
|
|
|||||||
| (a) | At December 31, 2016, all goodwill related to the Retail Electricity segment. Predecessor periods are net of accumulated impairment charges totaling $18.170 billion. |
Predecessor Goodwill Impairments
Goodwill and intangible assets with indefinite useful lives are required to be tested for impairment at least annually or whenever events or changes in circumstances indicate an impairment may exist.
During the fourth quarter of 2015, our Predecessor performed a goodwill impairment analysis as of its annual testing date of December 1. Further, during the fourth quarter of 2015, there were significant declines in the market values of several similarly situated peer companies with publicly traded equity, which indicated our
F-35
Table of Contents
Predecessor’s overall enterprise value should be reassessed. Our Predecessor’s testing resulted in an impairment of goodwill of $800 million at December 1, 2015.
During the first nine months of 2015, our Predecessor experienced impairment indicators related to decreases in forward wholesale electricity prices when compared to those prices reflected in its December 1, 2014 goodwill impairment testing analysis. As a result, the likelihood of goodwill impairments had increased, and our Predecessor initiated further testing of goodwill. Our Predecessor’s testing of goodwill for impairment during the first nine months of 2015 resulted in impairment charges totaling $1.4 billion.
Identifiable Intangible Assets
Identifiable intangible assets, including the impact of fresh start reporting (see Note 3), are comprised of the following:
| Successor | Predecessor | |||||||||||||||||||||||
| December 31, 2016 | December 31, 2015 | |||||||||||||||||||||||
| Identifiable Intangible Asset |
Gross Carrying Amount |
Accumulated Amortization |
Net | Gross Carrying Amount |
Accumulated Amortization |
Net | ||||||||||||||||||
| Retail customer relationship |
$ | 1,648 | $ | 152 | $ | 1,496 | $ | 463 | $ | 442 | $ | 21 | ||||||||||||
| Software and other technology-related assets |
147 | 9 | 138 | 385 | 224 | 161 | ||||||||||||||||||
| Electricity supply contract |
190 | 2 | 188 | — | — | — | ||||||||||||||||||
| Retail and wholesale contracts |
164 | 38 | 126 | — | — | — | ||||||||||||||||||
| Other identifiable intangible assets (a) |
30 | 2 | 28 | 72 | 35 | 37 | ||||||||||||||||||
|
|
|
|
|
|
|
|
|
|
|
|
|
|||||||||||||
| Total identifiable intangible assets subject to amortization (b) |
$ | 2,179 | $ | 203 | 1,976 | $ | 920 | $ | 701 | 219 | ||||||||||||||
|
|
|
|
|
|
|
|
|
|||||||||||||||||
| Retail trade names (not subject to amortization) |
1,225 | 955 | ||||||||||||||||||||||
| Mineral interests (not currently subject to amortization) |
4 | 5 | ||||||||||||||||||||||
|
|
|
|
|
|||||||||||||||||||||
| Total identifiable intangible assets |
$ | 3,205 | $ | 1,179 | ||||||||||||||||||||
|
|
|
|
|
|||||||||||||||||||||
| (a) | Includes favorable purchase and sales contracts, environmental allowances and credits and mining development costs. See discussion below regarding impairment charges recorded in the year ended December 31, 2015 related to other identifiable intangible assets. |
| (b) | Amounts related to fully amortized assets that are expired, or of no economic value, have been excluded from both the gross carrying and accumulated amortization amounts. |
F-36
Table of Contents
Amortization expense related to finite-lived identifiable intangible assets (including the classification in the statements of consolidated income (loss)) consisted of:
| Identifiable Intangible Asset |
Statements of |
Successor | Predecessor | |||||||||||||||||||
| Remaining useful lives at December 31, 2016 (weighted average in years) |
Period from October 3, 2016 through December 31, 2016 |
Period from January 1, 2016 through October 2, 2016 |
Year Ended December 31, |
|||||||||||||||||||
| 2015 | 2014 | |||||||||||||||||||||
| Retail customer relationship | Depreciation and amortization | 4 | $ | 152 | $ | 9 | $ | 17 | $ | 23 | ||||||||||||
| Software and other technology-related assets | Depreciation and amortization | 4 | 9 | 44 | 60 | 59 | ||||||||||||||||
| Electricity supply contract | Operating revenues | 22 | 2 | — | — | — | ||||||||||||||||
| Retail and wholesale contracts | Operating revenues/fuel, purchased power costs and delivery fees | 2 | 38 | — | — | — | ||||||||||||||||
| Other identifiable intangible assets | Operating revenues/fuel, purchased power costs and delivery fees/depreciation and amortization | 5 | 2 | 6 | 30 | 88 | ||||||||||||||||
|
|
|
|
|
|
|
|
|
|||||||||||||||
| Total amortization expense (a) | $ | 203 | $ | 59 | $ | 107 | $ | 170 | ||||||||||||||
|
|
|
|
|
|
|
|
|
|||||||||||||||
| (a) | Amounts recorded in depreciation and amortization totaled $162 million, $58 million, $85 million and $116 million for the Successor period from October 3, 2016 through December 31, 2016, the Predecessor period from January 1, 2016 through October 2, 2016 and the years ended December 31, 2015 and 2014, respectively. |
Following is a description of the separately identifiable intangible assets. In connection with fresh start reporting (see Note 3), the intangible assets were adjusted based on their estimated fair value as of the Effective Date, based on observable prices or estimates of fair value using valuation models.
| • | Retail customer relationship – Retail customer relationship intangible asset represents the fair value of our non-contracted retail customer base, including residential and business customers, and is being amortized using an accelerated method based on historical customer attrition rates and reflecting the expected pattern in which economic benefits are realized over their estimated useful life. |
| • | Retail trade names – Our retail trade name intangible asset represents the fair value of the TXU EnergyTM and 4Change EnergyTM trade names, and was determined to be an indefinite-lived asset not subject to amortization. This intangible asset is evaluated for impairment at least annually in accordance with accounting guidance related to goodwill and other indefinite-lived intangible assets. Significant assumptions included within the development of the fair value estimate include TXU Energy’s and 4Change Energy’s estimated gross margins for future periods and implied royalty rates. |
| • | Electricity supply contract – The electricity supply contract represents a long-term fixed-price supply contract for the sale of electricity from one of our generation facilities that was measured at fair value at Emergence. The value of this contract under our Predecessor was recorded as an unfavorable liability due to prevailing market prices of electricity when the contract was established at the Merger. Significant assumptions included in the fair value measurement for this contract include long-term wholesale electricity price forecasts and operating cost forecasts for the respective generation facility. |
F-37
Table of Contents
| • | Retail and wholesale contracts – These intangible assets represent the favorable value of various retail and wholesale contracts (both purchase and sale contracts) that were measured at fair value by utilizing prevailing market prices for commodities or services compared to the fixed prices contained in these agreements. The value of these contracts is being amortized using a method that is based on the monthly value of each contract measured at Emergence. |
Successor Estimated Amortization of Identifiable Intangible Assets
As of December 31, 2016, the estimated aggregate amortization expense of identifiable intangible assets for each of the next five fiscal years is as shown below.
| Year |
Estimated Amortization Expense | |||
| 2017 |
$ | 523 | ||
| 2018 |
$ | 365 | ||
| 2019 |
$ | 267 | ||
| 2020 |
$ | 191 | ||
| 2021 |
$ | 143 | ||
Predecessor Intangible Impairments
The impairments of generation facilities in 2015 (see Note 8) resulted in the impairment of the SO2 allowances under the Clean Air Act’s acid rain cap-and-trade program that are associated with those facilities to the extent they are not projected to be used at other sites. The fair market values of the SO2 allowances were estimated to be de minimis based on Level 3 fair value estimates (see Note 16). Our Predecessor also impaired certain of its SO2 allowances under the Cross-State Air Pollution Rule (CSAPR) related to the impaired generation facilities. Accordingly, in the year ended December 31, 2015, our Predecessor recorded noncash impairment charges of $55 million (before deferred income tax benefit) in other deductions (see Note 22) related to its existing environmental allowances and credits intangible asset. SO2 emission allowances granted under the acid rain cap-and-trade program were recorded as intangible assets at fair value in connection with purchase accounting related to the Merger in 2007. Additionally, the impairments of generation and related mining facilities in September 2015 resulted in recording noncash impairment charges of $19 million (before deferred income tax benefit) in other deductions (see Note 22) related to mine development costs (included in other identifiable intangible assets in the table above) at the facilities.
During the three months ended March 31, 2015, our Predecessor determined that certain intangible assets related to favorable power purchase contracts should be evaluated for impairment. That conclusion was based on further declines in wholesale electricity prices in ERCOT experienced during the three months ended March 31, 2015. The fair value measurement was based on a discounted cash flow analysis of the contracts that compared the contractual price and terms of the contract to forecasted wholesale electricity and renewable energy credit (REC) prices in ERCOT. As a result of the analysis, our Predecessor recorded a noncash impairment charge of $8 million (before deferred income tax benefit) in other deductions (see Note 22).
During the fourth quarter of 2014, our Predecessor determined that certain intangible assets related to favorable power purchase contracts should be evaluated for impairment. That conclusion was based on the combination of (1) the review of contracts for rejection as part of the Chapter 11 Cases, which could result in termination of contracts before the end of their estimated useful life and (2) declines in wholesale electricity prices. The fair value measurement was based on a discounted cash flow analysis of the contracts that compared the contractual price and terms of the contract to forecasted wholesale electricity and REC prices in ERCOT. As a result of the analysis, TCEH recorded a noncash impairment charge of $183 million (before deferred income tax benefit) in other deductions (see Note 22).
As a result of the CSAPR, which became effective on January 1, 2015, and other new or proposed EPA rules, our Predecessor projected that as of December 31, 2014 it had excess SO2 emission allowances under the
F-38
Table of Contents
Clean Air Act’s existing acid rain cap-and-trade program. In addition, the impairments of the Monticello, Martin Lake and Sandow 5 generation facilities (see Note 8) resulted in the impairment of the SO2 allowances associated with those facilities to the extent they are not projected to be used at other sites. The fair market values of the SO2 allowances were estimated to be de minimis based on Level 3 fair value estimates (see Note 16). Accordingly, a noncash impairment charge of $80 million (before deferred income tax benefit) was recorded in other deductions related to its existing environmental allowances and credits intangible asset in 2014. SO2 emission allowances previously granted were recorded as intangible assets at fair value in connection with purchase accounting related to the Merger in 2007.
8. PREDECESSOR IMPAIRMENT OF LONG-LIVED ASSETS
Impairment of Lignite/Coal Fueled Generation and Mining Assets
We evaluated our generation assets for impairment during 2015 as a result of impairment indicators related to the continued decline in forecasted wholesale electricity prices in ERCOT. Our evaluations concluded that impairments existed, and the carrying values at our Big Brown, Martin Lake, Monticello, Sandow 4 and Sandow 5 generation facilities and related mining facilities were reduced in total by $2.541 billion.
Our fair value measurement for these assets was determined based on an income approach that utilized probability-weighted estimates of discounted future cash flows, which were Level 3 fair value measurements (see Note 16). Key inputs into the fair value measurement for these assets included current forecasted wholesale electricity prices in ERCOT, forecasted fuel prices, capital and operating expenditure forecasts and discount rates.
9. INCOME TAXES
EFH Corp. files a US federal income tax return that includes the results of EFCH, EFIH, Oncor Holdings and, prior to the Effective Date, TCEH. Prior to the Effective Date, EFH Corp. was the corporate parent of the EFH Corp. consolidated group, while each of EFIH, Oncor Holdings, EFCH and TCEH were classified as a disregarded entity for US federal income tax purposes. Pursuant to applicable US Treasury regulations and published guidance of the IRS, corporations that are members of a consolidated group have joint and several liability for the taxes of such group. Subsequent to the Effective Date, the TCEH Debtors and the Contributed EFH Debtors are no longer included in the consolidated federal income tax return of EFH Corp. and will be included in Vistra Energy’s consolidated federal income tax return.
Prior to the Effective Date, EFH Corp. and certain of its subsidiaries (including EFCH, EFIH, and TCEH, but not including Oncor Holdings and Oncor) were parties to a Federal and State Income Tax Allocation Agreement, which provided, among other things, that any corporate member or disregarded entity in the EFH Corp. group is required to make payments to EFH Corp. in an amount calculated to approximate the amount of tax liability such entity would have owed if it filed a separate corporate tax return. Pursuant to the Plan of Reorganization, the TCEH Debtors and the Contributed EFH Debtors rejected this agreement on the Effective Date. See Notes 2 and 10 for a discussion of the Tax Matters Agreement that was entered into on the Effective Date between EFH Corp. and Vistra Energy. Additionally, since the date of the Settlement Agreement, no further cash payments among the Debtors were made in respect of federal income taxes. The Settlement Agreement did not alter the allocation and payment for state income taxes, which continued to be settled prior to the Effective Date.
F-39
Table of Contents
Income Tax Expense (Benefit)
The components of our income tax expense (benefit) are as follows:
| Successor | Predecessor | |||||||||||||||
| Period from October 3, 2016 through December 31, 2016 |
Period from January 1, 2016 through October 2, 2016 |
Year Ended December 31, |
||||||||||||||
| 2015 | 2014 | |||||||||||||||
| Current: |
||||||||||||||||
| US Federal |
$ | — | $ | (6 | ) | $ | (17 | ) | $ | 30 | ||||||
| State |
6 | 9 | 21 | 28 | ||||||||||||
|
|
|
|
|
|
|
|
|
|||||||||
| Total current |
6 | 3 | 4 | 58 | ||||||||||||
|
|
|
|
|
|
|
|
|
|||||||||
| Deferred: |
||||||||||||||||
| US Federal |
(75 | ) | (1,234 | ) | (811 | ) | (2,361 | ) | ||||||||
| State |
(1 | ) | (36 | ) | (72 | ) | (17 | ) | ||||||||
|
|
|
|
|
|
|
|
|
|||||||||
| Total deferred |
(76 | ) | (1,270 | ) | (883 | ) | (2,378 | ) | ||||||||
|
|
|
|
|
|
|
|
|
|||||||||
| Total |
$ | (70 | ) | $ | (1,267 | ) | $ | (879 | ) | $ | (2,320 | ) | ||||
|
|
|
|
|
|
|
|
|
|||||||||
Reconciliation of income taxes computed at the US federal statutory rate to income tax benefit recorded:
| Successor | Predecessor | |||||||||||||||
| Period from October 3, 2016 through December 31, 2016 |
Period from January 1, 2016 through October 2, 2016 |
Year Ended December 31, |
||||||||||||||
| 2015 | 2014 | |||||||||||||||
| Income (loss) before income taxes |
$ | (233 | ) | $ | 21,584 | $ | (5,556 | ) | $ | (8,549 | ) | |||||
|
|
|
|
|
|
|
|
|
|||||||||
| Income taxes at the US federal statutory rate of 35% |
(82 | ) | 7,554 | (1,945 | ) | (2,992 | ) | |||||||||
| Nondeductible TRA accretion |
5 | — | — | — | ||||||||||||
| IRS audit and appeals settlements |
— | — | — | 53 | ||||||||||||
| Nondeductible goodwill impairment |
— | — | 770 | 560 | ||||||||||||
| Texas margin tax, net of federal benefit |
3 | (21 | ) | — | 10 | |||||||||||
| Lignite depletion allowance |
— | — | (8 | ) | (14 | ) | ||||||||||
| Interest accrued for uncertain tax positions, net of tax |
— | — | (2 | ) | — | |||||||||||
| Nondeductible interest expense |
— | 12 | 21 | 21 | ||||||||||||
| Nondeductible debt restructuring costs |
2 | 38 | 64 | 42 | ||||||||||||
| Valuation allowance |
— | (210 | ) | 210 | — | |||||||||||
| Nontaxable gain on extinguishment of LSTC |
— | (8,593 | ) | — | — | |||||||||||
| Other |
2 | (47 | ) | 11 | — | |||||||||||
|
|
|
|
|
|
|
|
|
|||||||||
| Income tax benefit |
$ | (70 | ) | $ | (1,267 | ) | $ | (879 | ) | $ | (2,320 | ) | ||||
|
|
|
|
|
|
|
|
|
|||||||||
| Effective tax rate |
30.0 | % | (5.9 | )% | 15.8 | % | 27.1 | % | ||||||||
F-40
Table of Contents
Deferred Income Tax Balances
Deferred income taxes provided for temporary differences based on tax laws in effect at December 31, 2016 and 2015 are as follows:
| Successor | Predecessor | |||||||
| December 31, 2016 | December 31, 2015 | |||||||
| Noncurrent Deferred Income Tax Assets |
||||||||
| Alternative minimum tax credit carryforwards |
$ | — | $ | 22 | ||||
| Net operating loss (NOL) carryforwards |
8 | 440 | ||||||
| Unfavorable purchase and sales contracts |
— | 193 | ||||||
| Commodity contracts and interest rate swaps |
— | 125 | ||||||
| Property, plant and equipment |
943 | — | ||||||
| Intangible assets |
29 | — | ||||||
| Debt extinguishment gains |
52 | 1,109 | ||||||
| Employee benefit obligations |
84 | 51 | ||||||
| Other |
6 | 55 | ||||||
|
|
|
|
|
|||||
| Total deferred tax assets |
1,122 | 1,995 | ||||||
|
|
|
|
|
|||||
| Noncurrent Deferred Income Tax Liabilities |
||||||||
| Property, plant and equipment |
— | 1,541 | ||||||
| Identifiable intangible assets |
— | 320 | ||||||
| Accrued interest |
— | 138 | ||||||
|
|
|
|
|
|||||
| Total deferred tax liabilities |
— | 1,999 | ||||||
|
|
|
|
|
|||||
| Valuation allowance |
— | 209 | ||||||
|
|
|
|
|
|||||
| Net Deferred Income Tax (Asset) Liability |
$ | (1,122 | ) | $ | 213 | |||
|
|
|
|
|
|||||
Successor
At December 31, 2016, we had total deferred tax assets of approximately $1.1 billion that was substantially comprised of book and tax basis differences related to our generation and mining property, plant and equipment. As of December 31, 2016, we assessed the need for a valuation allowance related to our deferred tax asset and considered both positive and negative evidence related to the likelihood of realization of the deferred tax assets. In connection with that analysis, we concluded that it is more likely than not that the deferred tax assets would be fully utilized by future taxable income, and thus, no valuation allowance was recognized.
At December 31, 2016, we had $21 million in net operating loss (NOL) carryforwards for federal income tax purposes that will expire in 2037. At December 31, 2016, we had no alternative minimum tax (AMT) credit carryforwards available.
The income tax effects of the components included in accumulated other comprehensive income totaled a net deferred tax liability of $3 million at December 31, 2016.
Predecessor
At December 31, 2015 our Predecessor had $1.257 billion in net operating loss (NOL) carryforwards for federal income tax purposes that will expire between 2035 and 2036. Audit settlements reached in 2013 resulted in the elimination of substantially all NOL carryforwards generated through 2013 and available AMT credits. The NOL carryforwards can be used to offset future taxable income. Our Predecessor believed that it was more likely than not that the full tax benefit from the NOLs would not be realized. In recognition of this risk, our Predecessor recorded a valuation allowance of $209 million on the net deferred tax assets balance at December 31, 2015. In assessing the need for the valuation allowance, our Predecessor considered both positive and negative evidence related to the likelihood of realization of the deferred tax assets. As a result of our
F-41
Table of Contents
Predecessor’s assessment, it was concluded that there was uncertainty as to whether the current deferred tax assets (other than our Predecessor’s indefinite lived deferred tax assets) would be fully utilized by future reversals of existing taxable temporary differences.
During 2015, our Predecessor’s deferred tax liabilities related to property, plant and equipment were significantly reduced due to impairment charges on certain long-lived assets recorded in those periods. See Note 8 for a discussion of impairment charges. Additionally, our deferred tax liabilities related to debt fair value discounts were eliminated due to the write-off of unamortized deferred debt issuance and extension costs, premiums and discounts previously classified as LSTC.
The income tax effects of the components included in accumulated other comprehensive income totaled a net deferred tax asset of $18 million at December 31, 2015.
Liability for Uncertain Tax Positions
Accounting guidance related to uncertain tax positions requires that all tax positions subject to uncertainty be reviewed and assessed with recognition and measurement of the tax benefit based on a “more-likely-than-not” standard with respect to the ultimate outcome, regardless of whether this assessment is favorable or unfavorable.
Successor
Vistra Energy and its subsidiaries file income tax returns in US federal and state jurisdictions and are expected to be subject to examinations by the IRS and other taxing authorities. Vistra Energy is not currently under audit for any period, and we have no uncertain tax positions at December 31, 2016.
Predecessor
EFH Corp. and its subsidiaries file or have filed income tax returns in US Federal, state and foreign jurisdictions and are subject to examinations by the IRS and other taxing authorities. Examinations of income tax returns filed by EFH Corp. and any of its subsidiaries for the years ending prior to January 1, 2015 are complete. The IRS chose not to audit the tax return filed by EFH Corp. for the 2015 tax year, and the federal income tax return for the 2016 tax year has not yet been filed. Texas franchise and margin tax return examinations have been completed.
In September 2016, EFH Corp. entered into a settlement agreement with the Texas Comptroller of Public Accounts (Comptroller) whereby the Comptroller agreed to release all claims and liabilities related to the EFH Corp. consolidated group’s state taxes, including sales tax, gross receipts utility tax, franchise tax and direct pay tax, through the agreement date, in exchange for a release of all refund claims and a one-time payment of $12 million. This settlement was entered and approved by the Bankruptcy Court in September 2016. As a result of the settlement, our Predecessor reduced the liability for uncertain tax positions by $27 million.
In July 2016, EFH Corp. executed a Revenue Agent Report (RAR) with the IRS for the 2010 through 2013 tax years. As a result of the RAR, our Predecessor reduced the liability for uncertain tax positions by $1 million, resulting in a reclassification to the accumulated deferred income tax liability. Total cash payment to be assessed by the IRS for tax years 2010 through 2013, but not expected to be paid during the pendency of the Chapter 11 Cases of the EFH Debtors, is approximately $15 million, plus any interest that may be assessed.
In March 2016, EFH Corp. signed a RAR with the IRS for the 2014 tax year. No financial statement impacts resulted from the signing of the 2014 RAR.
In June 2015, EFH Corp. signed a RAR with the IRS for the 2008 and 2009 tax years. The Bankruptcy Court approved EFH Corp.’s signing of the RAR in July 2015. As a result of EFH Corp. signing this RAR, our
F-42
Table of Contents
Predecessor reduced the liability for uncertain tax positions by $22 million, resulting in a $18 million increase in noncurrent inter-company tax payable to EFH Corp., a $2 million reclassification to the accumulated deferred income tax liability and the recording of a $2 million income tax benefit. Total cash payment to be assessed by the IRS for tax years 2008 and 2009, but not paid during the pendency of the Chapter 11 Cases of the EFH Debtors, is approximately $15 million, plus any interest that may be assessed.
In 2014, the IRS filed a claim with the Bankruptcy Court for open tax years through 2013 that was consistent with the settlement EFH Corp. reached with IRS Appeals for tax years 2003-2006. Also in 2014, EFH Corp. signed a final RAR with the IRS and associated documentation for the 2007 tax year. As a result of these events, EFH Corp. effectively settled the 2003-2007 open tax years, and our Predecessor reduced the liability for uncertain tax positions related to such years by $123 million, resulting in a $119 million reclassification to the accumulated deferred income tax liability and the recording of a $4 million income tax benefit reflecting the settlement of certain positions.
In recording the 2014 impacts, our Predecessor identified approximately $85 million of income tax expense related to 2013 which was recorded in December 2014. The impact of recording this expense was not material to the financial statements in 2013 or 2014.
Our Predecessor classified interest and penalties related to uncertain tax positions as current income tax expense. Ongoing accruals of interest after the IRS settlements were not material in 2015 and 2014.
Noncurrent liabilities of our Predecessor included a total of $4 million in accrued interest at December 31, 2015. The federal income tax benefit on the interest accrued on uncertain tax positions was recorded as accumulated deferred income taxes.
The following table summarizes the changes to the uncertain tax positions, reported in other noncurrent liabilities in the consolidated balance sheets, during the Predecessor period from January 1, 2016 through October 2, 2016 and the years ended December 31, 2015 and 2014, respectively:
| Predecessor | ||||||||||||
| Period from January 1, 2016 through October 2, 2016 |
Year Ended December 31, |
|||||||||||
| 2015 | 2014 | |||||||||||
| Balance at beginning of period, excluding interest and penalties |
$ | 36 | $ | 65 | $ | 184 | ||||||
| Additions based on tax positions related to prior years |
— | — | 55 | |||||||||
| Reductions based on tax positions related to prior years |
(1 | ) | (11 | ) | (155 | ) | ||||||
| Additions based on tax positions related to the current year |
— | — | — | |||||||||
| Settlements with taxing authorities |
(35 | ) | (18 | ) | (19 | ) | ||||||
|
|
|
|
|
|
|
|||||||
| Balance at end of period, excluding interest and penalties |
$ | — | $ | 36 | $ | 65 | ||||||
|
|
|
|
|
|
|
|||||||
Tax Matters Agreement
On the Effective Date, we entered into a Tax Matters Agreement (the Tax Matters Agreement), with EFH Corp. whereby the parties have agreed to take certain actions and refrain from taking certain actions in order to preserve the intended tax treatment of the Spin-Off and to indemnify the other parties to the extent a breach of such agreement results in additional taxes to the other parties.
Among other things, the Tax Matters Agreement allocates the responsibility for taxes for periods prior to the Spin-Off between EFH Corp. and us. For periods prior to the Spin-Off: (a) Vistra Energy is generally required to reimburse EFH Corp. with respect to any taxes paid by EFH Corp. that are attributable to us and (b) EFH Corp. is generally required to reimburse us with respect to any taxes paid by us that are attributable to EFH Corp.
F-43
Table of Contents
We are also required to indemnify EFH Corp. against taxes, under certain circumstance, if the IRS or another taxing authority successfully challenges the amount of gain relating to the PrefCo Preferred Stock Sale or the amount or allowance of EFH Corp.’s net operating loss deductions.
Subject to certain exceptions, the Tax Matters Agreement prohibits us from taking certain actions that could reasonably be expected to undermine the intended tax treatment of the Spin-Off or to jeopardize the conclusions of the private letter ruling we obtained from the IRS or opinions of counsel received by us or EFH Corp., in each case, in connection with the Spin-Off. Certain of these restrictions apply for two years after the Spin-Off.
Under the Tax Matters Agreement, we may engage in an otherwise restricted action if (a) we obtain written consent from EFH Corp., (b) such action or transaction is described in or otherwise consistent with the facts in the private letter ruling we obtained from the IRS in connection with the Spin-Off, (c) we obtain a supplemental private letter ruling from the IRS, or (d) we obtain an unqualified opinion of a nationally recognized law or accounting firm that is reasonably acceptable to EFH Corp. that the action will not affect the intended tax treatment of the Spin-Off.
10. TAX RECEIVABLE AGREEMENT OBLIGATION
On the Effective Date, Vistra Energy entered into a tax receivable agreement (the TRA) with a transfer agent on behalf of certain former first lien creditors of TCEH. The TRA generally provides for the payment by us to holders of TRA Rights of 85% of the amount of cash savings, if any, in United States federal and state income tax that we realize in periods after Emergence as a result of (a) certain transactions consummated pursuant to the Plan of Reorganization (including any step-up in tax basis in our assets resulting from the PrefCo Preferred Stock Sale), (b) the tax basis of all assets acquired in connection with the Lamar and Forney Acquisition in April 2016 and (c) tax benefits related to imputed interest deemed to be paid by us as a result of payments under the TRA, plus interest accruing from the due date of the applicable tax return.
Pursuant to the TRA, we issued the TRA Rights for the benefit of the first lien secured creditors of our Predecessor entitled to receive such TRA Rights under the Plan. Such TRA Rights are subject to various transfer restrictions described in the TRA and are entitled to certain registration rights more fully described in the Registration Rights Agreement.
The estimate of fair value of $574 million for the Tax Receivable Agreement Obligation on the Effective Date was the discounted amount of projected payments under the TRA, based on certain assumptions, including but not limited to:
| • | the amount of tax basis step-up resulting from the PrefCo Preferred Stock Sale, which is expected to be approximately $5.5 billion, and the allocation of such tax basis step-up among the assets subject thereto; |
| • | the depreciable lives of the assets subject to such tax basis step-up, which generally is expected to be 15 years for most of such assets; |
| • | a federal corporate income tax rate of 35%; |
| • | the Company will generally generate sufficient taxable income so as to be able to utilize the deductions arising out of (i) the tax basis step-up attributable to the PrefCo Preferred Stock Sale, (ii) the entire tax basis of the assets acquired as a result of the Lamar and Forney Acquisition (as defined herein), and (iii) tax benefits related to imputed interest deemed to be paid by us as a result of payments under the TRA in the tax year in which such deductions arise, and |
| • | a discount rate of 15%, which represents our view of the rate that a market participant would use based on the risk associated with the uncertainty in the amount and timing of the cash flows. The aggregate amount of undiscounted payments under the TRA is estimated to be approximately $2.1 billion, with more than 90% of such amount expected to be attributable to the first 15 tax years following Emergence, and the final payment expected to be made approximately 40 years following Emergence (assuming that the TRA is not terminated earlier pursuant to its terms). |
F-44
Table of Contents
The fair value of the obligation at the Emergence Date is being accreted to the amount of the gross expected obligation using the effective interest method. Changes in the amount of this obligation resulting from changes to either the timing or amount of cash flows are recognized in the period of change and measured using the discount rate inherent in the initial fair value of the obligation. During the period from October 3, 2016 to December 31, 2016, the Impacts of Tax Receivable Agreement on the statement of consolidated income (loss) was $22 million, which represents accretion expense for the period, and the balance at December 31, 2016 totaled $596 million.
Under the Internal Revenue Code, a corporation’s ability to utilize certain tax attributes, including depreciation, may be limited following an ownership change if the corporation’s overall asset tax basis exceeds the overall fair market value of its assets (after making certain adjustments). The Spin-Off resulted in an ownership change and it is expected that the overall tax basis of our assets may have exceeded the overall fair market value of our assets at such time. As a result, there may be a limitation on our ability to claim a portion of our depreciation deductions for a five-year period. This limitation could have a material impact on our tax liabilities and on our obligations under the TRA Rights. In addition, any future ownership change of Vistra Energy following Emergence could likewise result in additional limitations on our ability to use certain tax attributes existing at the time of any such ownership change and have an impact on our tax liabilities and on our obligations with respect to the TRA Rights under the TRA.
11. INTEREST EXPENSE AND RELATED CHARGES
| Successor | Predecessor | |||||||||||||||
| Period from October 3, 2016 through December 31, 2016 |
Period from January 1, 2016 through October 2, 2016 |
Year Ended December 31, |
||||||||||||||
| 2015 | 2014 | |||||||||||||||
| Interest paid/accrued post-Emergence |
$ | 51 | $ | — | $ | — | $ | — | ||||||||
| Interest paid/accrued on debtor-in-possession financing |
— | 76 | 63 | 37 | ||||||||||||
| Adequate protection amounts paid/accrued |
— | 977 | 1,233 | 828 | ||||||||||||
| Interest paid/accrued on pre-petition debt (a) |
— | 1 | 4 | 878 | ||||||||||||
| Noncash realized net loss on termination of interest rate swaps (offset in unrealized net gain) (Note 17) |
— | — | — | 1,225 | ||||||||||||
| Unrealized mark-to-market net (gain) loss on interest rate swaps |
11 | — | — | (1,290 | ) | |||||||||||
| Amortization of debt issuance, amendment and extension costs and premiums/discounts |
(1 | ) | 4 | — | 86 | |||||||||||
| Dividends on mandatorily redeemable preferred stock |
2 | — | — | — | ||||||||||||
| Capitalized interest |
(3 | ) | (9 | ) | (11 | ) | (17 | ) | ||||||||
| Other |
— | — | — | 2 | ||||||||||||
|
|
|
|
|
|
|
|
|
|||||||||
| Total interest expense and related charges |
$ | 60 | $ | 1,049 | $ | 1,289 | $ | 1,749 | ||||||||
|
|
|
|
|
|
|
|
|
|||||||||
| (a) | Includes amounts related to interest rate swaps totaling $193 million for the year ended December 31, 2014. Of the $193 million, $127 million is included in the liability arising from the termination of TCEH interest swaps as discussed in Note 17. |
Predecessor
Interest expense for the Predecessor period from January 1, 2016 through October 2, 2016, the year ended December 31, 2015 and the post-petition period ended December 31, 2014 reflects interest paid and accrued on debtor-in-possession financing (see Note 13), adequate protection amounts paid and accrued, as approved by the Bankruptcy Court in June 2014 for the benefit of secured creditors of (a) $22.616 billion principal amount of outstanding borrowings from the TCEH Senior Secured Facilities, (b) $1.750 billion principal amount of outstanding TCEH Senior Secured Notes and (c) the $1.243 billion net liability related to the TCEH first lien
F-45
Table of Contents
interest rate swaps and natural gas hedging positions terminated shortly after the Bankruptcy Filing (see Note 2), in exchange for their consent to the senior secured, super-priority liens contained in the DIP Facility and any diminution in value of their interests in the pre-petition collateral from the Petition Date. The interest rates applicable to the adequate protection amounts paid/accrued was 4.95%, 4.69% and 4.65% (one-month LIBOR plus 4.50%) for the Predecessor period from January 1, 2016 through October 2, 2016, the year ended December 31, 2015 and the post-petition period ended December 31, 2014, respectively. As of the Effective Date, amounts of adequate protection payments were re-characterized as payments of principal.
The Bankruptcy Code generally restricts payment of interest on pre-petition debt, subject to certain exceptions. Other than amounts ordered or approved by the Bankruptcy Court, effective on the Petition Date, our Predecessor discontinued recording interest expense on outstanding pre-petition debt classified as LSTC. The table below shows contractual interest amounts, which were amounts due under the contractual terms of the outstanding debt, including debt subject to compromise during the Chapter 11 Cases. Interest expense reported in the statements of consolidated income (loss) does not include contractual interest on pre-petition debt classified as LSTC totaling $640 million, $897 million and $604 million for the Predecessor period from January 1, 2016 through October 2, 2016, the year ended December 31, 2015 and the post-petition period ended December 31, 2014, respectively, which had been stayed by the Bankruptcy Court effective on the Petition Date. Adequate protection paid/accrued presented below excludes interest paid/accrued on the TCEH first-lien interest rate and commodity hedge claims (see Note 17) totaling $47 million, $60 million and $40 million for the Predecessor period from January 1, 2016 through October 2, 2016, the year ended December 31, 2015 and the post-petition period ended December 31, 2014, respectively, as such amounts are not included in contractual interest amounts below. All adequate protection payments ceased as of the Emergence Date.
| Predecessor | ||||||||||||
| Period from January 1, 2016 through October 2, 2016 |
Year Ended December 31, 2015 |
Post-Petition Period Ended December 31, 2014 |
||||||||||
| Contractual interest on debt classified as LSTC |
$ | 1,570 | $ | 2,070 | $ | 1,392 | ||||||
| Adequate protection amounts paid/accrued |
930 | 1,173 | 788 | |||||||||
|
|
|
|
|
|
|
|||||||
| Contractual interest on debt classified as LSTC not paid/accrued |
$ | 640 | $ | 897 | $ | 604 | ||||||
|
|
|
|
|
|
|
|||||||
12. EARNINGS PER SHARE
Basic earnings per share available to common shareholders are based on the weighted average number of common shares outstanding during the period. Diluted earnings per share is calculated using the treasury stock method. Due to the net loss for the Successor period from October 3, 2016 through December 31, 2016, the application of the treasury stock method would be antidilutive and all shares of stock options and restricted stock units (see Note 19) were excluded from the calculation of diluted net loss available for common stock presented below.
| Successor | ||||||||||||
| Period from October 3, 2016 through December 31, 2016 |
||||||||||||
| Net Loss | Shares | Per Share Amount |
||||||||||
| Net loss available for common stock — basic |
$ | (163 | ) | 427,560,620 | $ | (0.38 | ) | |||||
|
|
|
|
|
|
|
|||||||
| Net loss available for common stock — diluted |
$ | (163 | ) | 427,560,620 | $ | (0.38 | ) | |||||
|
|
|
|
|
|
|
|||||||
F-46
Table of Contents
13. LONG-TERM DEBT
Successor
Amounts in the table below represent the categories of long-term debt obligation incurred by the Successor.
| Successor | ||||
| December 31, 2016 |
||||
| Vistra Operations Credit Facilities (a) |
$ | 4,515 | ||
| Mandatorily redeemable preferred stock (b) |
70 | |||
| 8.82% Building Financing due semiannually through February 11, 2022 (c) |
36 | |||
| Capital lease obligations |
2 | |||
|
|
|
|||
| Total long-term debt including amounts due currently |
4,623 | |||
| Less amounts due currently |
(46 | ) | ||
|
|
|
|||
| Total long-term debt less amounts due currently |
$ | 4,577 | ||
|
|
|
|||
| (a) | Borrowings under the Vistra Operations Credit Facilities in the consolidated balance sheet include debt premiums of $25 million, debt discounts of $2 million and debt issuance costs of $8 million. |
| (b) | Shares of mandatorily redeemable preferred stock in PrefCo issued as part of the spin-off of Vistra Energy from EFH Corp. (see Note 2). This subsidiary’s preferred stock is accounted for as a debt instrument under relevant accounting guidance. |
| (c) | Obligation related to a corporate office space capital lease contributed to Vistra Energy pursuant to the Plan of Reorganization. This obligation will be funded by amounts held in an escrow account and reflected in other noncurrent assets on the consolidated balance sheet at December 31, 2016. |
Vistra Operations Credit Facilities — As of the Effective Date, the Vistra Operations Credit Facilities initially consisted of up to $4.250 billion in senior secured, first lien financing consisting of a revolving credit facility of up to $750 million, including a $500 million letter of credit sub-facility (Initial Revolving Credit Facility), a term loan facility of up to $2.850 billion (Initial Term Loan B Facility) and a term loan letter of credit facility of up to $650 million (Term Loan C Facility).
In December 2016, we incurred $1 billion of incremental term loans (Incremental Term Loan B Facility, and together with the Initial Term Loan B Facility, the Term Loan B Facility) and $110 million of incremental revolving credit commitments (Incremental Revolving Credit Facility, and together with the Initial Revolving Credit Facility, the Revolving Credit Facility). The letter of credit sub-facility was also increased from $500 million to $600 million. Proceeds from the Incremental Term Loan B Facility were used to fund the special cash dividend in the aggregate amount of $1 billion that was approved by Vistra Energy’s board of directors and paid in December 2016 (see Note 15).
F-47
Table of Contents
The Vistra Operations Credit Facilities and related available capacity at December 31, 2016 are presented below.
| December 31, 2016 | ||||||||||||||||
| Vistra Operations Credit Facilities |
Maturity Date | Facility Limit | Cash Borrowings |
Available Credit Capacity |
||||||||||||
| Revolving Credit Facility (a) |
August 4, 2021 | $ | 860 | $ | — | $ | 860 | |||||||||
| Initial Term Loan B Facility (b) |
August 4, 2023 | 2,850 | 2,850 | — | ||||||||||||
| Incremental Term Loan B Facility (c) |
December 14, 2023 | 1,000 | 1,000 | — | ||||||||||||
| Term Loan C Facility (d) |
August 4, 2023 | 650 | 650 | 131 | ||||||||||||
|
|
|
|
|
|
|
|||||||||||
| Total Vistra Operations Credit Facilities |
$ | 5,360 | $ | 4,500 | $ | 991 | ||||||||||
|
|
|
|
|
|
|
|||||||||||
| (a) | Facility to be used for general corporate purposes. |
| (b) | Facility used to repay all amounts outstanding under the Predecessor’s DIP Facility and issuance costs for the DIP Roll Facilities, with the remaining balance used for general corporate purposes. |
| (c) | Facility used to fund a special cash dividend paid in December 2016 (see Note 15). |
| (d) | Facility used for issuing letters of credit for general corporate purposes. Borrowings under this facility were funded to collateral accounts that are reported as restricted cash in the consolidated balance sheet. At December 31, 2016, the restricted cash supported $519 million in letters of credit outstanding (see Note 22), leaving $131 million in available letter of credit capacity. |
As of December 31, 2016, amounts borrowed under the Revolving Credit Facility would bear interest based on applicable LIBOR rates plus 3.25%, and there were no outstanding borrowings at December 31, 2016. As of December 31, 2016, amounts borrowed under the Initial Term Loan B Facility and the Term Loan C Facility bear interest based on applicable LIBOR rates, subject to a 1% floor, plus 4%, and the interest rate on outstanding borrowings was 5% at December 31, 2016. Amounts borrowed under the Incremental Term Loan B Facility bear interest based on applicable LIBOR rates, subject to a 0.75% floor, plus 3.25%, and the rate outstanding on outstanding borrowings was 4% at December 31, 2016. The Vistra Operation Credit Facilities also provides for certain additional fees payable to the agents and lenders, as well as availability fees payable with respect to any unused portions of the available Vistra Operations Credit Facilities.
In February 2017, certain pricing terms for the Vistra Operations Credit Facility were amended. Any amounts borrowed under the Revolving Credit Facility will bear interest based on applicable LIBOR rates plus 2.75%. Amounts borrowed under the Initial Term Loan B Facility and the Term Loan C Facility will bear interest based on applicable LIBOR rates, subject to a 0.75% floor, plus 2.75%.
We are required to make scheduled quarterly payments on the Term Loan B Facility in annual amounts equal to 1% of the original principal amount of the Term Loan B Facility with the balance paid at maturity. The first repayment will be made on March 31, 2017.
Obligations under the Vistra Operations Credit Facilities are secured by a lien covering substantially all of Vistra Energy’s consolidated assets, rights and properties, subject to certain exceptions set forth in the Vistra Operations Credit Facilities.
The Vistra Operations Credit Facilities also permit certain hedging agreements to be secured on a pari-passu basis with the Vistra Operations Credit Facilities in the event those hedging agreements met certain criteria set forth in the Vistra Operations Credit Facilities.
The Vistra Operation Credit Facilities provide for affirmative and negative covenants applicable to Vistra Energy, including affirmative covenants requiring us to provide financial and other information to the agents
F-48
Table of Contents
under the Vistra Operations Credit Facilities and to not change our lines of business, and negative covenants restricting Vistra Energy’s ability to incur additional indebtedness, make investments, dispose of assets, pay dividends, grant liens or take certain other actions, in each case except as permitted in the Vistra Operation Credit Facilities. Vistra Energy’s ability to borrow under the Vistra Operations Credit Facilities is subject to the satisfaction of certain customary conditions precedent set forth therein.
The Vistra Operations Credit Facilities provide for certain customary events of default, including events of default resulting from non-payment of principal, interest or fees when due, material breaches of representations and warranties, material breaches of covenants in the Vistra Operations Credit Facilities or ancillary loan documents, cross-defaults under other agreements or instruments and the entry of material judgments against Vistra Energy. Solely with respect to the Revolving Credit Facility, and solely during a compliance period (which, in general, is applicable when the aggregate revolving borrowings and issued revolving letters of credit (in excess of $100 million) exceed 30% of the revolving commitments), the agreement includes a covenant that requires the consolidated first lien net leverage ratio, which is based on the ratio of net first lien debt compared to an EBITDA calculation defined under the terms of the facilities, not exceed 4.25 to 1.00. Although we had no borrowings under the Revolving Credit Facility as of December 31, 2016, we would have been in compliance with this financial covenant if it were required to be tested. Upon the existence of an event of default, the Vistra Operations Credit Facilities provides that all principal, interest and other amounts due thereunder will become immediately due and payable, either automatically or at the election of specified lenders.
Maturities — Long-term debt maturities at December 31, 2016 are as follows:
| Successor | ||||
| December 31, 2016 |
||||
| 2017 |
$ | 46 | ||
| 2018 |
44 | |||
| 2019 |
44 | |||
| 2020 |
44 | |||
| 2021 |
45 | |||
| Thereafter |
4,380 | |||
| Unamortized premiums, discounts and debt issuance costs |
20 | |||
|
|
|
|||
| Total long-term debt including amounts due currently |
$ | 4,623 | ||
|
|
|
|||
Interest Rate Swaps — In the Successor period from October 3, 2016 through December 31, 2016, we entered into $3.0 billion notional amount of interest rate swaps to hedge our exposure to our variable rate debt. The interest rate swaps, which become effective in January 2017, expire in July 2023 and, when taking into consideration the amended pricing on the Vistra Operations Credit Facilities discussed above, effectively fix the interest rates between 4.67% and 4.91%.
The interest rate swaps are secured by a first lien secured interest on a pari-passu basis with the Vistra Operations Credit Facilities.
Predecessor
DIP Roll Facilities — In August 2016, the Predecessor entered into the DIP Roll Facilities. The facilities provided for up to $4.250 billion in senior secured, super-priority financing consisting of a revolving credit facility of up to $750 million (DIP Roll Revolving Credit Facility), a term loan letter of credit facility of up to $650 million (DIP Roll Letter of Credit Facility) and a term loan facility of up to $2.850 billion (DIP Roll Term Loan Facility). The DIP Roll Facilities were senior, secured, super-priority debtor-in-possession credit
F-49
Table of Contents
agreements by and among the TCEH Debtors, the lenders that were party thereto from time to time and an administrative and collateral agent. The maturity date of the DIP Roll Facilities was the earlier of (a) October 31, 2017 or (b) the Effective Date. On the Effective Date, the DIP Roll Facilities converted to the Vistra Operations Credit Facilities discussed above.
Net proceeds from the DIP Roll Facilities totaled $3.465 billion and were used to repay $2.65 billion outstanding under the former DIP Facility, fund a $650 million collateral account used to backstop the issuances of letters of credit and pay $107 million of issuance costs. The remaining balance was used for general corporate purposes. Additionally, $800 million of cash from collateral accounts under the former DIP Facility that was used to backstop letters of credit was released to the Predecessor to be used for general corporate purposes.
DIP Facility — The DIP Facility provided for up to $3.375 billion in senior secured, super-priority financing consisting of a revolving credit facility of up to $1.950 billion (DIP Revolving Credit Facility) and a term loan facility of up to $1.425 billion (DIP Term Loan Facility). The DIP Facility was a senior, secured, super-priority credit agreement by and among the TCEH Debtors, the lenders that were party thereto and an administrative and collateral agent. At December 31, 2015, all $1.425 billion of the DIP Term Loan Facility were borrowed at an interest rate of 3.75%. Of this amount, $800 million represented amounts that supported issuances of letters of credit that were funded to a collateral account. Of the collateral account at December 31, 2015, $281 million was reported as cash and cash equivalents and $519 million was reported as restricted cash, which represented the amounts of outstanding letters of credit. At December 31, 2015, no amounts were borrowed under the DIP Revolving Credit Facility. As discussed above, in August 2016 all amounts under the DIP Facility were repaid using proceeds from the DIP Roll Facilities, and the $800 million of cash that was funded to the collateral account was released to TCEH to be used for general corporate purposes.
Other Long-Term Debt — Amounts in the Predecessor period represent pre-petition liabilities of the Predecessor that were not subject to compromise due to the debt being fully collateralized or specific orders from the Bankruptcy Court approving repayment of the debt.
| Predecessor | ||||
| December 31, 2015 |
||||
| 7.48% Fixed Secured Facility Bonds with amortizing payments through January 2017 (a) |
$ | 13 | ||
| Capital lease and other obligations |
6 | |||
|
|
|
|||
| Total |
19 | |||
| Less amounts due currently |
(16 | ) | ||
|
|
|
|||
| Total long-term debt not subject to compromise |
$ | 3 | ||
|
|
|
|||
| (a) | Debt issued by trust and secured by assets held by the trust. |
F-50
Table of Contents
14. COMMITMENTS AND CONTINGENCIES
Contractual Commitments
At December 31, 2016, we had contractual commitments under energy-related contracts, leases and other agreements as follows.
| Coal purchase and transportation agreements |
Pipeline transportation and storage reservation fees |
Nuclear Fuel Contracts |
Other Contracts |
|||||||||||||
| 2017 |
$ | 338 | $ | 30 | $ | 72 | $ | 128 | ||||||||
| 2018 |
— | 21 | 91 | 55 | ||||||||||||
| 2019 |
— | 22 | 39 | 57 | ||||||||||||
| 2020 |
— | 22 | 43 | 54 | ||||||||||||
| 2021 |
— | 22 | 49 | 36 | ||||||||||||
| Thereafter |
— | 161 | 222 | 350 | ||||||||||||
|
|
|
|
|
|
|
|
|
|||||||||
| Total |
$ | 338 | $ | 278 | $ | 516 | $ | 680 | ||||||||
|
|
|
|
|
|
|
|
|
|||||||||
Amounts in other contracts include certain long-term service and maintenance contracts related to our generation assets. The table above excludes TRA and pension and OPEB plan payments due to the uncertainty in the timing of those payments.
Expenditures under our coal purchase and coal transportation agreements totaled $109 million, $139 million, $218 million and $348 million for the Successor period from October 3, 2016 through December 31, 2016 and the Predecessor period from January 1, 2016 through October 2, 2016 and the years ended December 31, 2015 and 2014, respectively.
At December 31, 2016, future minimum lease payments under both capital leases and operating leases are as follows:
| Capital Leases |
Operating Leases (a) |
|||||||
| 2017 |
$ | 2 | $ | 25 | ||||
| 2018 |
— | 17 | ||||||
| 2019 |
— | 14 | ||||||
| 2020 |
— | 12 | ||||||
| 2021 |
— | 9 | ||||||
| Thereafter |
— | 153 | ||||||
|
|
|
|
|
|||||
| Total future minimum lease payments |
2 | $ | 230 | |||||
|
|
|
|||||||
| Less amounts representing interest |
— | |||||||
|
|
|
|||||||
| Present value of future minimum lease payments |
2 | |||||||
| Less current portion |
(2 | ) | ||||||
|
|
|
|||||||
| Long-term capital lease obligation |
$ | — | ||||||
|
|
|
|||||||
| (a) | Includes operating leases with initial or remaining noncancellable lease terms in excess of one year. |
Rent reported as operating costs, fuel costs and SG&A expenses totaled $20 million, $39 million, $55 million and $54 million for the Successor period from October 3, 2016 through December 31, 2016 and the Predecessor period from January 1, 2016 through October 2, 2016 and the years ended December 31, 2015 and 2014, respectively.
F-51
Table of Contents
Guarantees
We have entered into contracts that contain guarantees to unaffiliated parties that could require performance or payment under certain conditions. As of December 31, 2016, there are no material outstanding claims related to our guarantee obligations, and we do not anticipate we will be required to make any material payments under these guarantees.
Letters of Credit
At December 31, 2016, we had outstanding letters of credit under the Vistra Operations Credit Facilities totaling $519 million as follows:
| • | $363 million to support commodity risk management and trading collateral requirements in the normal course of business, including over-the-counter and exchange-traded hedging transactions and collateral postings with ERCOT; |
| • | $70 million to support executory contracts and insurance agreements; |
| • | $55 million to support our REP financial requirements with the PUCT, and |
| • | $31 million for other credit support requirements. |
Litigation
Litigation Related to EPA Reviews — In June 2008, the EPA issued an initial request for information to Luminant under the EPA’s authority under Section 114 of the Clean Air Act (CAA). The stated purpose of the request is to obtain information necessary to determine compliance with the CAA, including New Source Review standards and air permits issued by the TCEQ for the Big Brown, Monticello and Martin Lake generation facilities. In April 2013, Luminant received an additional information request from the EPA under Section 114 related to our Big Brown, Martin Lake and Monticello facilities as well as an initial information request related to our Sandow 4 generation facility.
In July 2012, the EPA sent Luminant a notice of violation alleging noncompliance with the CAA’s New Source Review standards and the air permits at our Martin Lake and Big Brown generation facilities. In August 2013, the US Department of Justice, acting as the attorneys for the EPA, filed a civil enforcement lawsuit against Luminant in federal district court in Dallas, alleging violations of the CAA, including its New Source Review standards, at our Big Brown and Martin Lake generation facilities. In August 2015, the district court granted Luminant’s motion to dismiss seven of the nine claims asserted by the EPA in the lawsuit. In August 2016, the EPA filed an amended complaint, eliminating one of the two remaining claims and withdrawing with prejudice a request for civil penalties in the other remaining claim. The EPA also filed a motion for entry of final judgment so that it could seek to appeal the district court’s dismissal decision. In September 2016, Luminant filed a response opposing the EPA’s motion for entry of final judgment. In October 2016, the district court denied the EPA’s motion for entry of final judgment and agreed that the remaining claim must be fully adjudicated at the district court or withdrawn with prejudice before the EPA may appeal the dismissal decision. In January 2017, the EPA dismissed its two remaining claims with prejudice and the district court entered final judgment in our favor. In March 2017, the EPA appealed the final judgment to the Fifth Circuit Court and Luminant filed a motion in the district court to recover its attorney fees and costs. We believe that we and Luminant have complied with all requirements of the CAA and intend to vigorously defend against the remaining allegations. The lawsuit requests the maximum civil penalties available under the CAA to the government of up to $32,500 to $37,500 per day for each alleged violation, depending on the date of the alleged violation, and injunctive relief, including an order requiring the installation of best available control technology at the affected units. An adverse outcome could require substantial capital expenditures that cannot be determined at this time or retirement of the plants at issue and could possibly require the payment of substantial penalties. We cannot predict the outcome of these proceedings, including the financial effects, if any.
F-52
Table of Contents
Greenhouse Gas Emissions
In August 2015, the EPA finalized rules to address greenhouse gas (GHG) emissions from new, modified and reconstructed and existing electricity generation units, referred to as the Clean Power Plan. The rule for existing facilities would establish state-specific emissions rate goals to reduce nationwide CO2 emissions related to affected units by over 30% from 2012 emission levels by 2030. A number of parties, including Luminant, filed petitions for review in the US Court of Appeals for the District of Columbia Circuit (D.C. Circuit Court) for the rule for new, modified and reconstructed plants. In addition, a number of petitions for review of the rule for existing plants were filed in the D.C. Circuit Court by various parties and groups, including challenges from twenty-seven different states opposed to the rule as well as those from, among others, certain power generating companies, various business groups and some labor unions. Luminant also filed its own petition for review. In January 2016, a coalition of states, industry (including Luminant) and other parties filed applications with the US Supreme Court (Supreme Court) asking that the Supreme Court stay the rule while the D.C. Circuit Court reviews the legality of the rule for existing plants. In February 2016, the Supreme Court stayed the rule pending the conclusion of legal challenges on the rule before the D.C. Circuit Court and until the Supreme Court disposes of any subsequent petition for review. Oral argument on the merits of the legal challenges to the rule were heard in September 2016 before the entire D.C. Circuit Court. In March 2017, President Trump issued an Executive Order entitled Promoting Energy Independence and Economic Growth (Order). The Order covers a number of matters, including the Clean Power Plan. Among other provisions, the Order directs the EPA to review the Clean Power Plan and, if appropriate, suspend, revise or rescind the rules on existing and new, modified and reconstructed generating units. In addition, the Department of Justice has filed motions seeking to abate those cases until the EPA concludes its review of the rules, including any new rulemaking that results from that review. While we cannot predict the outcome of these rulemakings and related legal proceedings, or estimate a range of reasonably probable costs, if the rules are ultimately implemented or upheld as they were issued, they could have a material impact on our results of operations, liquidity or financial condition.
In August 2015, the EPA proposed model rules and federal plan requirements for states to consider as they develop state plans to comply with the rules for GHG emissions. A federal plan would then be finalized for a state if a state fails to submit a state plan by the deadlines established in the Clean Power Plan for existing plants or if the EPA disapproves a submitted state plan. Luminant filed comments on the federal plan proposal and model rules in January 2016. The Executive Order issued in March 2017, directed the EPA to review this proposed rule for consistency with the policies in the Order and, if appropriate, to revise or withdraw the proposed rule. While we cannot predict the timing or outcome of this rulemaking and related legal proceedings, or estimate a range of reasonably possible costs, they could have a material impact on our results of operations, liquidity or financial condition.
Cross-State Air Pollution Rule (CSAPR)
In July 2011, the EPA issued the CSAPR, compliance with which would have required significant additional reductions of SO2 and NOx emissions from our fossil fueled generation units. In February 2012, the EPA released a final rule (Final Revisions) and a proposed rule revising certain aspects of the CSAPR, including increases in the emissions budgets for Texas and our generation assets as compared to the July 2011 version of the rule. In June 2012, the EPA finalized the proposed rule (Second Revised Rule).
The CSAPR became effective January 1, 2015. In July 2015, following a remand of the case from the Supreme Court to consider further legal challenges, the D.C. Circuit Court unanimously ruled in favor of Luminant and other petitioners, holding that the CSAPR emissions budgets over-controlled Texas and other states. The D.C. Circuit Court remanded those states’ budgets to the EPA for prompt reconsideration. While Luminant planned to participate in the EPA’s reconsideration process to develop increased budgets for the 1997 ozone standard that do not over-control Texas, the EPA instead responded to the remand by proposing a new rulemaking that created new NOX ozone season budgets for the 2008 ozone standard without addressing the over-controlling budgets for the 1997 standard. Comments on the EPA’s proposal were submitted by Luminant in February 2016. In August 2016, the EPA disapproved Texas’s 2008 ozone SIP submittal and imposed a FIP in its
F-53
Table of Contents
place in October 2016. Texas filed a petition in the Fifth Circuit Court challenging the SIP disapproval and Luminant has intervened in support of Texas’s challenge. The State of Texas and Luminant have also both filed challenges in the D.C. Circuit Court challenging the EPA’s FIP and those cases are currently pending before that court. With respect to Texas’s SO2 emission budgets, in June 2016, the EPA issued a memorandum describing the EPA’s proposed approach for responding to the D.C. Circuit Court’s remand for reconsideration of the CSAPR SO2 emission budgets for Texas and three other states that had been remanded to the EPA by the D.C. Circuit Court. In the memorandum, the EPA stated that those four states could either voluntarily participate in the CSAPR by submitting a State Implementation Plan (SIP) revision adopting the SO2 budgets that had been previously held invalid by the D.C. Circuit Court and the current annual NOx budgets or, if the state chooses not to participate in the CSAPR, the EPA could withdraw the CSAPR Federal Implementation Plan (FIP) by the fall of 2016 for those states and address any interstate transport and regional haze obligations on a state-by-state basis. Texas has not indicated that it intends to adopt the over-controlling budgets and, in November 2016, the EPA proposed to withdraw the CSAPR FIP for Texas. Because the EPA has not finalized its proposal to remove Texas from the annual CSAPR programs, these programs will continue to apply to Texas and Texas sources. At this time, the EPA has not populated the allowance accounts for Texas sources with 2017 annual CSAPR program allowances. While we cannot predict the outcome of future proceedings related to the CSAPR, including the EPA’s recent actions concerning the CSAPR annual emissions budgets for affected states and participating in the CSAPR program, based upon our current operating plans we do not believe that the CSAPR itself will cause any material operational, financial or compliance issues to our business or require us to incur any material compliance costs.
Regional Haze — Reasonable Progress and Long-Term Strategies
The Regional Haze Program of the CAA establishes “as a national goal the prevention of any future, and the remedying of any existing, impairment of visibility in mandatory Class I federal areas, like national parks, which impairment results from manmade pollution.” There are two components to the Regional Haze Program. First, states must establish goals for reasonable progress for Class I federal areas within the state and establish long-term strategies to reach those goals and to assist Class I federal areas in neighboring states to achieve reasonable progress set by those states towards a goal of natural visibility by 2064. In February 2009, the TCEQ submitted a SIP concerning regional haze (Regional Haze SIP) to the EPA. In December 2011, the EPA proposed a limited disapproval of the Regional Haze SIP due to its reliance on the Clean Air Interstate Rule (CAIR) instead of the EPA’s replacement CSAPR program that the EPA proposed in July 2011. In August 2012, Luminant filed a petition for review in the Fifth Circuit Court challenging the EPA’s limited disapproval of the Regional Haze SIP on the grounds that the CAIR continued in effect pending the D.C. Circuit Court’s decision in the CSAPR litigation. In September 2012, Luminant filed a petition to intervene in a case filed by industry groups and other states and private parties in the D.C. Circuit Court challenging the EPA’s limited disapproval and issuance of a FIP regarding the regional haze BART program. The Fifth Circuit Court case has since been transferred to the D.C. Circuit Court and consolidated with other pending BART program regional haze appeals. Briefing in the D.C. Circuit Court was completed in March 2017.
In June 2014, the EPA issued requests for information under Section 114 of the CAA to Luminant and other generators in Texas related to the reasonable progress program. After releasing a proposed rule in November 2014 and receiving comments from a number of parties, including Luminant and the State of Texas in April 2015, the EPA released a final rule in January 2016 approving in part and disapproving in part Texas’ SIP for Regional Haze and issuing a FIP for Regional Haze. In the rule, the EPA asserts that the Texas SIP does not show reasonable progress in improving visibility for two areas in Texas and that its long-term strategy fails to make emission reductions needed to achieve reasonable progress in improving visibility in the Wichita Mountains of Oklahoma. The EPA’s proposed emission limits in the FIP assume additional control equipment for specific lignite/coal-fueled generation units across Texas, including new flue gas desulfurization systems (scrubbers) at seven electricity generating units and upgrades to existing scrubbers at seven electricity generating units. Specifically, for Luminant, the EPA’s FIP is based on new scrubbers at Big Brown Units 1 and 2 and Monticello Units 1 and 2 and scrubber upgrades at Martin Lake Units 1, 2 and 3, Monticello Unit 3 and Sandow
F-54
Table of Contents
Unit 4. Luminant is continuing to evaluate the requirements and potential financial and operational impacts of the rule, but new scrubbers at the Big Brown and Monticello units necessary to achieve the emission limits required by the FIP (if those limits are possible to attain), along with the existence of low wholesale electricity prices in ERCOT, would likely challenge the long-term economic viability of those units. Under the terms of the rule, the scrubber upgrades will be required by February 2019, and the new scrubbers will be required by February 2021.
In March 2016, Luminant and a number of other parties, including the State of Texas, filed petitions for review in the US Fifth Circuit Court challenging the FIP’s Texas requirements. Luminant and other parties also filed motions to stay the FIP while the court reviews the legality of the EPA’s action. In July 2016, the Fifth Circuit Court denied the EPA’s motion to dismiss Luminant’s challenge to the FIP and denied the EPA’s motion to transfer the challenges Luminant, the other industry petitioners and the State of Texas filed to the D.C. Circuit Court. In addition, the Fifth Circuit Court granted the motions to stay filed by Luminant, the other industry petitioners and the State of Texas pending final review of the petitions for review. The case was abated until the end of November 2016 in order to allow the parties to pursue settlement discussions. Settlement discussions were unsuccessful, and in December 2016 the EPA filed a motion seeking a voluntary remand of the rule back to the EPA for further consideration of Luminant’s pending request for administrative reconsideration. Luminant and some of the other petitioners filed a response opposing the EPA’s motion to remand and filed a cross motion for vacatur of the rule in December 2016. In March 2017, the Fifth Circuit Court remanded the rule back to the EPA for reconsideration in light of the Court’s prior determination that we and the other petitioners demonstrated a substantial likelihood that the EPA exceeded its statutory authority and acted arbitrarily and capriciously, but the Court denied all of the other pending motions. The stay of the rule (and the emission control requirements) remains in effect. In addition, the Fifth Circuit Court denied the EPA’s motion to lift the stay as to parts of the rule implicated in the EPA’s subsequent BART proposal and the Court is retaining jurisdiction of the case and requiring the EPA to file status reports on its reconsideration every 15 days. While we cannot predict the outcome of the rulemaking and legal proceedings, or estimate a range of reasonably possible costs, the result may have a material impact on our results of operations, liquidity or financial condition.
Regional Haze — Best Available Retrofit Technology
The second part of the Regional Haze Program subjects electricity generation units built between 1962 and 1977, to best available retrofit technology (BART) standards designed to improve visibility if such units cause or contribute to impairment of visibility in a federal class I area. BART reductions of SO2 and NOX are required either on a unit-by-unit basis or are deemed satisfied by state participation in an EPA-approved regional trading program such as the CSAPR. In response to a lawsuit by environmental groups, the D.C. Circuit Court issued a consent decree in March 2012 that required the EPA to propose a decision on the Regional Haze SIP by May 2012 and finalize that decision by November 2012. The consent decree requires a FIP for any provisions that the EPA disapproves. The D.C. Circuit Court has amended the consent decree several times to extend the dates for the EPA to propose and finalize a decision on the Regional Haze SIP. The consent decree was modified in December 2015 to extend the deadline for the EPA to finalize action on the determination and adoption of requirements for BART for electricity generation. Under the amended consent decree, the EPA had until December 2016 to propose, and has until September 2017 to finalize, a FIP for BART for Texas electricity generation sources if the EPA determines that BART requirements have not been met. The EPA issued its proposed BART FIP for Texas in December 2016. The EPA’s proposed emission limits assume additional control equipment for specific lignite/coal-fueled generation units across Texas, including new flue gas desulfurization systems (scrubbers) at 12 electric generation units and upgrades to existing scrubbers at four electric generation units. Specifically, for Luminant, the EPA’s emission limitations are based on new scrubbers at Big Brown Units 1 and 2 and Monticello Units 1 and 2 and scrubber upgrades at Martin Lake Units 1, 2 and 3 and Monticello Unit 3. Luminant is continuing to evaluate the requirements and potential financial and operational impacts of the proposed rule, but new scrubbers at the Big Brown and Monticello units necessary to achieve the emission limits required by the FIP (if those limits are possible to attain), along with the existence of low wholesale power prices in ERCOT, would likely challenge the long-term economic viability of those units. Under the terms of the rule, the scrubber upgrades will be required within three years of the effective date of the
F-55
Table of Contents
final rule and the new scrubbers will be required within five years of the effective date of the final rule. We anticipate submitting comments on the proposed FIP when those are due in May 2017. While we cannot predict the outcome of the rulemaking and potential legal proceedings, or estimate a range of reasonably possible costs, the result may have a material impact on our results of operations, liquidity or financial condition.
Intersection of the CSAPR and Regional Haze Programs
Historically the EPA has considered compliance with a regional trading program, such as the CSAPR, as satisfying a state’s obligations under the BART portion of the Regional Haze Program. However, in the reasonable progress FIP, the EPA diverged from this approach and did not treat Texas’ compliance with the CSAPR as satisfying its obligations under the BART portion of the Regional Haze Program. The EPA concluded that it would not be appropriate to finalize that determination given the remand of the CSAPR budgets. As described above, the EPA has now proposed to remove Texas from the annual CSAPR trading programs. If Texas were in the CSAPR annual trading programs, the EPA would have no basis for its BART FIP because it has made a determination for Texas and all other states that participate in the CSAPR annual trading programs that such participation satisfies their BART obligations. We do not believe that EPA’s proposal to remove Texas from the CSAPR annual trading programs satisfies the D.C. Circuit Court’s mandate to the EPA to develop non-over-controlling budgets for Texas and we submitted comments on the EPA’s proposed rule to remove Texas from the CSAPR annual trading programs. While we cannot predict the outcome of these matters, or estimate a range of reasonably possible costs, the result may have a material impact on our results of operations, liquidity or financial condition.
Affirmative Defenses During Malfunctions
In February 2013, in response to a petition for rulemaking filed by the Sierra Club, the EPA proposed a rule requiring certain states to replace SIP exemptions for excess emissions during malfunctions with an affirmative defense. Texas was not included in that original proposal since it already had an EPA-approved affirmative defense provision in its SIP that was found to be lawful by the Fifth Circuit Court in 2013. In 2014, as a result of a D.C. Circuit Court decision striking down an affirmative defense in another EPA rule, the EPA revised its 2013 proposal to extend the EPA’s proposed findings of inadequacy to states that have affirmative defense provisions, including Texas. The EPA’s revised proposal would require Texas to remove or replace its EPA-approved affirmative defense provisions for excess emissions during startup, shutdown and maintenance events. In May 2015, the EPA finalized the proposal. In June 2015, Luminant filed a petition for review in the Fifth Circuit Court challenging certain aspects of the EPA’s final rule as they apply to the Texas SIP. The State of Texas and other parties have also filed similar petitions in the Fifth Circuit Court. In August 2015, the Fifth Circuit Court transferred the petitions that Luminant and other parties filed to the D.C. Circuit Court, and in October 2015 the petitions were consolidated with the pending petitions challenging the EPA’s action in the D.C. Circuit Court. Briefing in the D.C. Circuit Court on the challenges was completed in October 2016 and oral argument is set for May 2017. We cannot predict the timing or outcome of this proceeding, or estimate a range of reasonably possible costs, but implementation of the rule as finalized may have a material impact on our results of operations, liquidity or financial condition.
SO2 Designations for Texas
In February 2016, the EPA notified Texas of the EPA’s preliminary intention to designate nonattainment areas for counties surrounding our Big Brown, Monticello and Martin Lake generation plants based on modeling data submitted to the EPA by the Sierra Club. Such designation would potentially require the implementation of various controls or other requirements to demonstrate attainment. Luminant submitted comments challenging the use of modeling data rather than data from actual air quality monitoring equipment. In November 2016, the EPA finalized its proposed designations for Texas including finalizing the nonattainment designations for the areas referenced above. In doing so, the EPA ignored contradictory modeling that we submitted with our comments. The final designation mandates would be for Texas to begin the multi-year process to evaluate what potential emission controls or operational changes, if any, may be necessary to demonstrate attainment. In February 2017,
F-56
Table of Contents
the State of Texas and Luminant filed challenges to the nonattainment designations in the Fifth Circuit Court and protective petitions in the D.C. Circuit Court. In March 2017, the EPA filed a motion to transfer or dismiss our Fifth Circuit Court petition. In addition, Luminant has filed a request with the EPA to reconsider the rule and immediately stay its effective date. While we cannot predict the outcome of this matter, or estimate a range of reasonably possible costs, the result may have a material impact on our results of operations, liquidity or financial condition.
Other Matters
We are involved in various legal and administrative proceedings in the normal course of business, the ultimate resolutions of which, in the opinion of management, are not anticipated to have a material effect on our results of operations, liquidity or financial condition.
Labor Contracts
We employ certain personnel who are represented by labor unions, the terms of whose employment are governed by collective bargaining agreements. During 2015, all collective bargaining agreements covering bargaining unit personnel engaged in lignite mining operations, lignite-, coal- and nuclear-fueled generation operations and some of our natural gas-fueled generation operations were extended to March 2017. While we cannot predict the outcome of labor contract negotiations, we do not expect any changes in collective bargaining agreements to have a material adverse effect on our results of operations, liquidity or financial condition.
Nuclear Insurance
Nuclear insurance includes nuclear liability coverage, property damage, decontamination and accidental premature decommissioning coverage and accidental outage and/or extra expense coverage. We maintain nuclear insurance that meets or exceeds requirements promulgated by Section 170 (Price-Anderson) of the Atomic Energy Act (the Act) and Title 10 of the Code of Federal Regulations. We intend to maintain insurance against nuclear risks as long as such insurance is available. We are self-insured to the extent that losses (i) are within the policy deductibles, (ii) are not covered per policy exclusions, terms and limitations, (iii) exceed the amount of insurance maintained, or (iv) are not covered due to lack of insurance availability. Any such self-insured losses could have a material adverse effect on our results of operations, liquidity or financial condition.
With regard to liability coverage, the Act provides for financial protection for the public in the event of a significant nuclear generation plant incident. The Act sets the statutory limit of public liability for a single nuclear incident at $13.4 billion and requires nuclear generation plant operators to provide financial protection for this amount. However, the United States Congress could impose revenue-raising measures on the nuclear industry to pay claims that exceed the $13.4 billion limit for a single incident. As required, we insure against a possible nuclear incident at our Comanche Peak facility resulting in public nuclear-related bodily injury and property damage through a combination of private insurance and an industry-wide retrospective payment plan known as the Secondary Financial Protection (SFP).
Under the SFP, in the event of any single nuclear liability loss in excess of $375 million at any nuclear generation facility in the United States, each operating licensed reactor in the United States is subject to an annual assessment of up to $127.3 million. This approximately $127.3 million maximum assessment is subject to increases for inflation every five years, with the next expected adjustment scheduled to occur in September 2018. Assessments are currently limited to $19 million per operating licensed reactor per year per incident. As of December 31, 2016, our maximum potential assessment under the industry retrospective plan would be approximately $254.6 million per incident but no more than $37.9 million in any one year for each incident. The potential assessment is triggered by a nuclear liability loss in excess of $375 million per accident at any nuclear facility. For losses after January 1, 2017, the potential assessment applies in excess of $450 million.
F-57
Table of Contents
The United States Nuclear Regulatory Commission (NRC) requires that nuclear generation plant license holders maintain at least $1.06 billion of nuclear decontamination and property damage insurance, and requires that the proceeds thereof be used to place a plant in a safe and stable condition, to decontaminate a plant pursuant to a plan submitted to, and approved by, the NRC prior to using the proceeds for plant repair or restoration, or to provide for premature decommissioning. We maintain nuclear decontamination and property damage insurance for our Comanche Peak facility in the amount of $2.25 billion and non-nuclear related property damage in the amount of $1.75 billion (subject to a $5 million deductible per accident except for natural hazards which are subject to a $9.5 million deductible per accident), above which we are self-insured.
We also maintain Accidental Outage insurance to cover the additional costs of obtaining replacement electricity from another source if one or both of the units at our Comanche Peak facility are out of service for more than 20 weeks as a result of covered direct physical damage. Such coverage provides for weekly payments per unit of up to $5.25 million for the first 52 weeks, up to $4.35 million for the next 35 weeks and up to $3.6 million for the remaining 36 weeks, after the initial waiting period. The total maximum coverage is $393 million for non-nuclear accidents and $555 million for nuclear accidents. The coverage amounts applicable to each unit will be reduced to 80% if both units are out of service at the same time as a result of the same accident.
15. EQUITY
Successor Shareholders’ Equity
Equity Issuances — As of December 31, 2016, 427,580,232 shares of Vistra Energy common stock were outstanding. On the Effective Date, 427,500,000 shares were issued pursuant to the Plan of Reorganization (see Note 2).
Dividends Declared — In December 2016, the board of directors of Vistra Energy approved the payment of a special cash dividend (Special Dividend) in the aggregate amount of approximately $1 billion ($2.32 per share of common stock) to holders of record of our common stock on December 19, 2016. The dividend was funded using borrowings under the Vistra Operations Credit Facilities (see Note 13).
Dividend Restrictions — The agreement governing the Vistra Operations Credit Facilities generally restricts our ability to make distributions or loans to any of our parent companies or their subsidiaries unless such distributions or loans were expressly permitted under the agreement governing such facility.
Under applicable Delaware General Corporate Law, we are prohibited from paying any distribution to the extent that immediately following payment of such distribution, we would be insolvent.
Accumulated Other Comprehensive Income — During the period from October 3, 2016 through December 31, 2016, we recorded a $6 million change in the funded status of our pension and other postretirement employee benefit liability; there were no amounts reclassified from accumulated other comprehensive income.
Predecessor Membership Interests
TCEH paid no dividends in the period from January 1, 2016 through October 2, 2016 nor the years ended December 31, 2015 and 2014.
16. FAIR VALUE MEASUREMENTS
Accounting standards related to the determination of fair value define fair value as the price that would be received to sell an asset, or paid to transfer a liability, in an orderly transaction between willing market
F-58
Table of Contents
participants at the measurement date. We use a mid-market valuation convention (the mid-point price between bid and ask prices) as a practical expedient to measure fair value for the majority of our assets and liabilities subject to fair value measurement on a recurring basis. We primarily use the market approach for recurring fair value measurements and use valuation techniques to maximize the use of observable inputs and minimize the use of unobservable inputs.
We categorize our assets and liabilities recorded at fair value based upon the following fair value hierarchy:
| • | Level 1 valuations use quoted prices in active markets for identical assets or liabilities that are accessible at the measurement date. An active market is a market in which transactions for the asset or liability occur with sufficient frequency and volume to provide pricing information on an ongoing basis. Our Level 1 assets and liabilities include exchange-traded commodity contracts. For example, some of our derivatives are NYMEX or the IntercontinentalExchange (ICE, an electronic commodity derivative exchange) futures and swaps transacted through clearing brokers for which prices are actively quoted. |
| • | Level 2 valuations use inputs that, in the absence of actively quoted market prices, are observable for the asset or liability, either directly or indirectly. Level 2 inputs include: (a) quoted prices for similar assets or liabilities in active markets, (b) quoted prices for identical or similar assets or liabilities in markets that are not active, (c) inputs other than quoted prices that are observable for the asset or liability such as interest rates and yield curves observable at commonly quoted intervals and (d) inputs that are derived principally from or corroborated by observable market data by correlation or other mathematical means. Our Level 2 valuations utilize over-the-counter broker quotes, quoted prices for similar assets or liabilities that are corroborated by correlations or other mathematical means, and other valuation inputs. For example, our Level 2 assets and liabilities include forward commodity positions at locations for which over-the-counter broker quotes are available. |
| • | Level 3 valuations use unobservable inputs for the asset or liability. Unobservable inputs are used to the extent observable inputs are not available, thereby allowing for situations in which there is little, if any, market activity for the asset or liability at the measurement date. We use the most meaningful information available from the market combined with internally developed valuation methodologies to develop our best estimate of fair value. For example, our Level 3 assets and liabilities include certain derivatives with values derived from pricing models that utilize multiple inputs to the valuations, including inputs that are not observable or easily corroborated through other means. See further discussion below. |
Our valuation policies and procedures were developed, maintained and validated by a centralized risk management group that reports to the Vistra Energy Chief Financial Officer.
We utilize several different valuation techniques to measure the fair value of assets and liabilities, relying primarily on the market approach of using prices and other market information for identical and/or comparable assets and liabilities for those items that are measured on a recurring basis. These methods include, among others, the use of broker quotes and statistical relationships between different price curves.
In utilizing broker quotes, we attempt to obtain multiple quotes from brokers (generally non-binding) that are active in the markets in which we participate (and require at least one quote from two brokers to determine a pricing input as observable); however, not all pricing inputs are quoted by brokers. The number of broker quotes received for certain pricing inputs varies depending on the depth of the trading market, each individual broker’s publication policy, recent trading volume trends and various other factors.
Probable loss from default by either us or our counterparties is considered in determining the fair value of derivative assets and liabilities. These non-performance risk adjustments take into consideration credit enhancements and the credit risks associated with our credit standing and the credit standing of our counterparties (see Note 17 for additional information regarding credit risk associated with our derivatives). We utilize credit ratings and default rate factors in calculating these fair value measurement adjustments.
F-59
Table of Contents
Certain derivatives and financial instruments are valued utilizing option pricing models that take into consideration multiple inputs including, but not limited to, commodity prices, volatility factors, discount rates and other market based factors. Additionally, when there is not a sufficient amount of observable market data, valuation models are developed that incorporate proprietary views of market factors. Significant unobservable inputs used to develop the valuation models include volatility curves, correlation curves, illiquid pricing locations and credit/non-performance risk assumptions. Those valuation models are generally used in developing long-term forward price curves for certain commodities, in particular, long-term ERCOT wholesale power prices. We believe the development of such curves is consistent with industry practice; however, the fair value measurements resulting from such curves are classified as Level 3.
The significant unobservable inputs and valuation models are developed by employees trained and experienced in market operations and fair value measurements and validated by the company’s risk management group, which also further analyzes any significant changes in Level 3 measurements. Significant changes in the unobservable inputs could result in significant upward or downward changes in the fair value measurement.
With respect to amounts presented in the following fair value hierarchy tables, the fair value measurement of an asset or liability (e.g., a contract) is required to fall in its entirety in one level, based on the lowest level input that is significant to the fair value measurement. Certain assets and liabilities would be classified in Level 2 instead of Level 3 of the hierarchy except for the effects of credit reserves and non-performance risk adjustments, respectively. Assessing the significance of a particular input to the fair value measurement in its entirety requires judgment, considering factors specific to the asset or liability being measured.
F-60
Table of Contents
Assets and liabilities measured at fair value on a recurring basis consisted of the following at the respective balance sheet dates shown below:
| Successor |
||||||||||||||||||||
| December 31, 2016 |
||||||||||||||||||||
| Level 1 | Level 2 | Level 3 (a) | Reclassification (b) | Total | ||||||||||||||||
| Assets: |
||||||||||||||||||||
| Commodity contracts |
$ | 167 | $ | 131 | $ | 98 | $ | — | $ | 396 | ||||||||||
| Interest rate swaps |
— | 5 | — | 13 | 18 | |||||||||||||||
| Nuclear decommissioning trust — equity securities (c) |
425 | — | — | — | 425 | |||||||||||||||
| Nuclear decommissioning trust — debt securities (c) |
— | 340 | — | — | 340 | |||||||||||||||
|
|
|
|
|
|
|
|
|
|||||||||||||
| Subtotal |
$ | 592 | $ | 476 | $ | 98 | $ | 13 | 1,179 | |||||||||||
|
|
|
|
|
|
|
|
|
|||||||||||||
| Assets measured at net asset value (d): |
||||||||||||||||||||
| Nuclear decommissioning trust — equity securities (c) |
247 | |||||||||||||||||||
|
|
|
|||||||||||||||||||
| Total assets |
$ | 1,426 | ||||||||||||||||||
|
|
|
|||||||||||||||||||
| Liabilities: |
||||||||||||||||||||
| Commodity contracts |
$ | 302 | $ | 15 | $ | 15 | $ | — | $ | 332 | ||||||||||
| Interest rate swaps |
— | 16 | — | 13 | 29 | |||||||||||||||
|
|
|
|
|
|
|
|
|
|
|
|||||||||||
| Total liabilities |
$ | 302 | $ | 31 | $ | 15 | $ | 13 | $ | 361 | ||||||||||
|
|
|
|
|
|
|
|
|
|
|
|||||||||||
| Predecessor |
||||||||||||||||||||
| December 31, 2015 |
||||||||||||||||||||
| Level 1 | Level 2 | Level 3 (a) | Reclassification (b) | Total | ||||||||||||||||
| Assets: |
||||||||||||||||||||
| Commodity contracts |
$ | 385 | $ | 41 | $ | 49 | $ | — | $ | 475 | ||||||||||
| Nuclear decommissioning trust — equity securities (c) |
380 | — | — | — | 380 | |||||||||||||||
| Nuclear decommissioning trust — debt securities (c) |
— | 319 | — | — | 319 | |||||||||||||||
|
|
|
|
|
|
|
|
|
|
|
|||||||||||
| Subtotal |
$ | 765 | $ | 360 | $ | 49 | $ | — | 1,174 | |||||||||||
|
|
|
|
|
|
|
|
|
|||||||||||||
| Assets measured at net asset value (d): |
||||||||||||||||||||
| Nuclear decommissioning trust — equity securities (c) |
219 | |||||||||||||||||||
|
|
|
|||||||||||||||||||
| Total assets |
$ | 1,393 | ||||||||||||||||||
|
|
|
|||||||||||||||||||
| Liabilities: |
||||||||||||||||||||
| Commodity contracts |
$ | 128 | $ | 64 | $ | 12 | $ | — | $ | 204 | ||||||||||
|
|
|
|
|
|
|
|
|
|
|
|||||||||||
| Total liabilities |
$ | 128 | $ | 64 | $ | 12 | $ | — | $ | 204 | ||||||||||
|
|
|
|
|
|
|
|
|
|
|
|||||||||||
| (a) | See table below for description of Level 3 assets and liabilities. |
| (b) | Fair values are determined on a contract basis, but certain contracts result in a current asset and a noncurrent liability, or vice versa, as presented in the consolidated balance sheets. |
| (c) | The nuclear decommissioning trust investment is included in the investments line in the condensed consolidated balance sheets. See Note 22. |
F-61
Table of Contents
| (d) | Certain investments measured at fair value using the net asset value per share (or its equivalent) have not been classified in the fair value hierarchy. The fair value amounts presented in this line are intended to permit reconciliation of the fair value hierarchy to the amounts presented in the condensed consolidated balance sheets. |
Commodity contracts consist primarily of natural gas, electricity, fuel oil, uranium and coal agreements and include financial instruments entered into for hedging purposes as well as physical contracts that have not been designated normal purchases or sales. See Note 17 for further discussion regarding derivative instruments.
Nuclear decommissioning trust assets represent securities held for the purpose of funding the future retirement and decommissioning of our nuclear generation facility. These investments include equity, debt and other fixed-income securities consistent with investment rules established by the NRC and the PUCT.
The following tables present the fair value of the Level 3 assets and liabilities by major contract type and the significant unobservable inputs used in the valuations at December 31, 2016 and 2015:
| Successor | ||||||||||||||||||
| December 31, 2016 | ||||||||||||||||||
| Fair Value | ||||||||||||||||||
| Contract Type (a) |
Assets |
Liabilities |
Total |
Valuation |
Significant Unobservable Input |
Range (b) | ||||||||||||
| Electricity purchases and sales |
$ | 32 | $ | — | $ | 32 | Valuation Model |
Hourly price curve shape (d) | $0 to $35/MWh | |||||||||
| Illiquid delivery periods for ERCOT hub power prices and heat rates (e) |
$30 to $70/MWh | |||||||||||||||||
| Electricity congestion revenue rights |
42 | (6 | ) | 36 | Market Approach (f) |
Illiquid price differences between settlement points (g) |
$0 to $10/MWh | |||||||||||
| Other (h) |
24 | (9 | ) | 15 | ||||||||||||||
|
|
|
|
|
|
|
|||||||||||||
| Total |
$ | 98 | $ | (15 | ) | $ | 83 | |||||||||||
|
|
|
|
|
|
|
|||||||||||||
| Predecessor | ||||||||||||||||||
| December 31, 2015 | ||||||||||||||||||
| Fair Value | ||||||||||||||||||
| Contract Type (a) |
Assets |
Liabilities |
Total |
Valuation |
Significant Unobservable Input |
Range (b) | ||||||||||||
| Electricity purchases and sales |
$ | 1 | $ | (1 | ) | $ | — | Valuation Model |
Illiquid pricing locations (c) | $15 to $35/MWh | ||||||||
| Hourly price curve shape (d) | $15 to $45/MWh | |||||||||||||||||
| Electricity congestion revenue rights |
39 | (4 | ) | 35 | Market Approach (f) |
Illiquid price differences between settlement points (g) |
$0 to $10/MWh | |||||||||||
| Other (h) |
9 | (7 | ) | 2 | ||||||||||||||
|
|
|
|
|
|
|
|||||||||||||
| Total |
$ | 49 | $ | (12 | ) | $ | 37 | |||||||||||
|
|
|
|
|
|
|
|||||||||||||
| (a) | Electricity purchase and sales contracts include power and heat rate hedging positions in ERCOT regions. Electricity options contracts consist of physical electricity options and spread options. Electricity congestion revenue rights contracts consist of forward purchase contracts (swaps and options) used to hedge electricity price differences between settlement points within ERCOT. |
| (b) | The range of the inputs may be influenced by factors such as time of day, delivery period, season and location. |
F-62
Table of Contents
| (c) | Based on the historical range of forward average monthly ERCOT hub and load zone prices. |
| (d) | Based on the historical range of forward average hourly ERCOT North Hub prices. |
| (e) | Based on historical forward ERCOT power price and heat rate variability. |
| (f) | While we use the market approach, there is insufficient market data to consider the valuation liquid. |
| (g) | Based on the historical price differences between settlement points within ERCOT hubs and load zones. |
| (h) | Other includes contracts for ancillary services, natural gas, electricity options and coal options. |
There were no significant transfers between Level 1 and Level 2 of the fair value hierarchy for the Successor period from October 3, 2016 through December 31, 2016 or the Predecessor period from January 1, 2016 through October 2, 2016 and the years ended December 31, 2015 and 2014. See the table of changes in fair values of Level 3 assets and liabilities below for discussion of transfers between Level 2 and Level 3 for the Successor period from October 3, 2016 through December 31, 2016 and the Predecessor period from January 1, 2016 through October 2, 2016 and the years ended December 31, 2015 and 2014. During the Predecessor period from January 1, 2016 through October 2, 2016, in conjunction with the Lamar and Forney Acquisition, we acquired certain electricity spread options that are classified in Level 3 of the fair value hierarchy.
The following table presents the changes in fair value of the Level 3 assets and liabilities for the Successor period from October 3, 2016 through December 31, 2016, the Predecessor period from January 1, 2016 through October 2, 2016 and the years ended December 31, 2015 and 2014.
| Successor | Predecessor | |||||||||||||||
| Period from October 3, 2016 through December 31, 2016 |
Period from January 1, 2016 through October 2, 2016 |
Year Ended December 31, |
||||||||||||||
| 2015 | 2014 | |||||||||||||||
| Net asset (liability) balance at beginning of period (a) |
$ | 81 | $ | 37 | $ | 35 | $ | (973 | ) | |||||||
|
|
|
|
|
|
|
|
|
|||||||||
| Total unrealized valuation gains (losses) |
31 | 122 | 27 | (97 | ) | |||||||||||
| Purchases, issuances and settlements (b) |
||||||||||||||||
| Purchases |
15 | 37 | 49 | 63 | ||||||||||||
| Issuances |
(7 | ) | (20 | ) | (13 | ) | (5 | ) | ||||||||
| Settlements |
(30 | ) | (51 | ) | (48 | ) | 1,053 | |||||||||
| Transfers into Level 3 (c) |
3 | 1 | 1 | — | ||||||||||||
| Transfers out of Level 3 (c) |
(10 | ) | 1 | (14 | ) | (6 | ) | |||||||||
| Net liabilities assumed in the Lamar and Forney Acquisition (Note 6) (d) |
— | (30 | ) | — | — | |||||||||||
|
|
|
|
|
|
|
|
|
|||||||||
| Net change (e) |
2 | 60 | 2 | 1,008 | ||||||||||||
|
|
|
|
|
|
|
|
|
|||||||||
| Net asset balance at end of period |
$ | 83 | $ | 97 | $ | 37 | $ | 35 | ||||||||
|
|
|
|
|
|
|
|
|
|||||||||
| Unrealized valuation gains (losses) relating to instruments held at end of period |
$ | 28 | $ | 98 | $ | 18 | $ | (5 | ) | |||||||
| (a) | The beginning balance for the Successor period reflects a $16 million adjustment to the fair value of certain Level 3 assets driven by power prices utilized by the Successor for unobservable delivery periods. |
| (b) | Settlements reflect reversals of unrealized mark-to-market valuations. Purchases and issuances reflect option premiums paid or received, respectively. |
| (c) | Includes transfers due to changes in the observability of significant inputs. All Level 3 transfers during the periods presented are in and out of Level 2. |
| (d) | Includes fair value of Level 3 assets and liabilities as of the purchase date and any related rolloff between the purchase date and the period ended October 2, 2016. |
| (e) | Activity excludes changes in fair value in the month the positions settled as well as amounts related to positions entered into and settled in the same quarter. For the Successor period, substantially all changes in |
F-63
Table of Contents
| values of commodity contracts are reported in the statements of consolidated income (loss) in operating revenues or fuel, purchased power costs and delivery fees. For the Predecessor period, substantially all changes in values of commodity contracts (excluding net liabilities assumed in the Lamar and Forney Acquisition) are reported in the statements of consolidated income (loss) in net gain from commodity hedging and trading activities. |
17. COMMODITY AND OTHER DERIVATIVE CONTRACTUAL ASSETS AND LIABILITIES
Strategic Use of Derivatives
We transact in derivative instruments, such as options, swaps, futures and forward contracts, to manage commodity price and interest rate risk. See Note 16 for a discussion of the fair value of derivatives.
Commodity Hedging and Trading Activity — We utilize natural gas derivatives as hedging instruments designed to reduce exposure to changes in future electricity prices due to changes in the price of natural gas, thereby hedging future revenues from electricity sales from our generation assets. In ERCOT, the wholesale price of electricity has generally moved with the price of natural gas. We also enter into derivatives, including electricity, natural gas, fuel oil, uranium, emission and coal instruments, generally for short-term fuel hedging and other purposes. Unrealized gains and losses arising from changes in the fair value of hedging and trading instruments as well as realized gains and losses upon settlement of the instruments are reported in the statements of consolidated income (loss) in operating revenues and fuel, purchased power costs and delivery fees in the Successor period and net gain from commodity hedging and trading activities in the Predecessor periods.
Interest Rate Swaps — Interest rate swap agreements are used to reduce exposure to interest rate changes by converting floating-rate interest rates to fixed rates, thereby hedging future interest costs and related cash flows. Unrealized gains and losses arising from changes in the fair value of the swaps as well as realized gains and losses upon settlement of the swaps are reported in the statements of consolidated income (loss) in interest expense and related charges.
Termination of Predecessor’s Commodity Hedges and Interest Rate Swaps — Commodity hedges and interest rate swaps entered into prior to the Petition Date are deemed to be forward contracts under the Bankruptcy Code. The Bankruptcy Filing constituted an event of default under these arrangements, and in accordance with the contractual terms, counterparties terminated certain positions shortly after the Bankruptcy Filing. The positions terminated consisted almost entirely of natural gas hedging positions and interest rate swaps that were secured by a first-lien interest in the same assets of TCEH on a pari passu basis with the TCEH Senior Secured Facilities and the TCEH Senior Secured Notes.
Entities with a first-lien security interest included counterparties to both our Predecessor’s natural gas hedging positions and interest rate swaps, which had entered into master agreements that provided for netting and setoff of amounts related to these positions. Additionally, certain counterparties to only our Predecessor’s interest rate swaps hold the same first-lien security interest. The total net liability of $1.243 billion as of December 31, 2015 was reported in the consolidated balance sheets as a liability subject to compromise. Additionally, prior to the Effective Date, counterparties associated with the net liability were allowed, and had been receiving, adequate protection payments related to their claims as permitted by TCEH’s cash collateral order approved by the Bankruptcy Court (see Note 11).
Financial Statement Effects of Derivatives
Substantially all derivative contractual assets and liabilities are accounted for under mark-to-market accounting consistent with accounting standards related to derivative instruments and hedging activities. The following tables provide detail of derivative contractual assets and liabilities as reported in the consolidated
F-64
Table of Contents
balance sheets at December 31, 2016 and 2015. Derivative asset and liability totals represent the net value of the contract, while the balance sheet totals represent the gross value of the contract.
| Successor | ||||||||||||||||||||
| December 31, 2016 | ||||||||||||||||||||
| Derivative Assets | Derivative Liabilities | |||||||||||||||||||
| Commodity contracts |
Interest rate swaps |
Commodity contracts |
Interest rate swaps |
Total | ||||||||||||||||
| Current assets |
$ | 350 | $ | — | $ | — | $ | — | $ | 350 | ||||||||||
| Noncurrent assets |
46 | 17 | — | 1 | 64 | |||||||||||||||
| Current liabilities |
— | (12 | ) | (330 | ) | (17 | ) | (359 | ) | |||||||||||
| Noncurrent liabilities |
— | — | (2 | ) | — | (2 | ) | |||||||||||||
|
|
|
|
|
|
|
|
|
|
|
|||||||||||
| Net assets (liabilities) |
$ | 396 | $ | 5 | $ | (332 | ) | $ | (16 | ) | $ | 53 | ||||||||
|
|
|
|
|
|
|
|
|
|
|
|||||||||||
| Predecessor | ||||||||||||||||||||
| December 31, 2015 | ||||||||||||||||||||
| Derivative Assets | Derivative Liabilities | |||||||||||||||||||
| Commodity contracts |
Interest rate swaps |
Commodity contracts |
Interest rate swaps |
Total | ||||||||||||||||
| Current assets |
$ | 465 | $ | — | $ | — | $ | — | $ | 465 | ||||||||||
| Noncurrent assets |
10 | — | — | — | 10 | |||||||||||||||
| Current liabilities |
— | — | (203 | ) | — | (203 | ) | |||||||||||||
| Noncurrent liabilities |
— | — | (1 | ) | — | (1 | ) | |||||||||||||
|
|
|
|
|
|
|
|
|
|
|
|||||||||||
| Net assets (liabilities) |
$ | 475 | $ | — | $ | (204 | ) | $ | — | $ | 271 | |||||||||
|
|
|
|
|
|
|
|
|
|
|
|||||||||||
At December 31, 2016 and 2015, there were no derivative positions accounted for as cash flow or fair value hedges.
The following table presents the pretax effect of derivatives on net income (gains (losses)), including realized and unrealized effects:
| Successor | Predecessor | |||||||||||||||
| Period from October 3, 2016 through December 31, 2016 |
Period from January 1, 2016 through October 2, 2016 |
Year Ended December 31, |
||||||||||||||
| Derivative (statements of consolidated income (loss) presentation) |
2015 |
2014 |
||||||||||||||
| Commodity contracts (Operating revenues) (a) |
$ | (92 | ) | $ | — | $ | — | $ | — | |||||||
| Commodity contracts (Fuel, purchased power costs and delivery fees) (a) |
21 | — | — | — | ||||||||||||
| Commodity contracts (Net gain (loss) from commodity hedging and trading activities) (a) |
— | 194 | 380 | 17 | ||||||||||||
| Interest rate swaps (Interest expense and related charges) (b) |
(11 | ) | — | — | (128 | ) | ||||||||||
| Interest rate swaps (Reorganization items) (Note 4) |
— | — | — | (277 | ) | |||||||||||
|
|
|
|
|
|
|
|
|
|||||||||
| Net gain (loss) |
$ | (82 | ) | $ | 194 | $ | 380 | $ | (388 | ) | ||||||
|
|
|
|
|
|
|
|
|
|||||||||
| (a) | Amount represents changes in fair value of positions in the derivative portfolio during the period, as realized amounts related to positions settled are assumed to equal reversals of previously recorded unrealized amounts. |
| (b) | Includes unrealized mark-to-market net gain (loss) as well as the net realized effect on interest paid/accrued, both reported in Interest Expense and Related Charges (see Note 11). |
F-65
Table of Contents
The pretax effect (all losses) on net income and other comprehensive income (OCI) of derivative instruments previously accounted for as cash flow hedges were immaterial in the Predecessor period from January 1, 2016 through October 2, 2016 and the years ended December 31, 2015 and 2014. There were no amounts recognized in OCI for the Successor period from October 3, 2016 through December 31, 2016 and the Predecessor period from January 1, 2016 through October 2, 2016 and the years ended December 31, 2015 and 2014.
Accumulated other comprehensive income related to cash flow hedges at December 31, 2015 totaled $33 million in net losses (after-tax), substantially all of which related to interest rate swaps previously accounted for as cash flow hedges. In conjunction with fresh start reporting (see Note 3), the balances in accumulated other comprehensive income were eliminated from the consolidated balance sheet on the Effective Date.
Balance Sheet Presentation of Derivatives
Consistent with elections under US GAAP to present amounts on a gross basis, we report derivative assets and liabilities in the consolidated balance sheets without taking into consideration netting arrangements we have with counterparties to those derivatives. We may enter into offsetting positions with the same counterparty, resulting in both assets and liabilities. Volatility in underlying commodity prices can result in significant changes in derivative assets and liabilities presented from period to period.
Margin deposits that contractually offset these derivative instruments are reported separately in the condensed consolidated balance sheets. Margin deposits received from counterparties are either used for working capital or other general corporate purposes or, if there are restrictions on the use of cash, amounts are deposited in a separate restricted cash account. At December 31, 2016 and 2015, essentially all margin deposits held were unrestricted.
We maintain standardized master netting agreements with certain counterparties that allow for the netting of positive and negative exposures. These agreements contain credit enhancements that allow for the right to offset assets and liabilities and collateral received in order to reduce credit exposure between us and the counterparty. These agreements contain specific language related to margin requirements, monthly settlement netting, cross-commodity netting and early termination netting, which is negotiated with the contract counterparty.
F-66
Table of Contents
The following tables reconcile our derivative assets and liabilities as presented in the condensed consolidated balance sheets to net amounts after taking into consideration netting arrangements with counterparties and financial collateral:
| Successor | Predecessor | |||||||||||||||||||||||||||||||
| December 31, 2016 | December 31, 2015 | |||||||||||||||||||||||||||||||
| Amounts Presented in Balance Sheet |
Offsetting Instruments (a) |
Financial Collateral (Received) Pledged (b) |
Net Amounts |
Amounts Presented in Balance Sheet |
Offsetting Instruments (a) |
Financial Collateral (Received) Pledged (b) |
Net Amounts |
|||||||||||||||||||||||||
| Derivative assets: |
||||||||||||||||||||||||||||||||
| Commodity contracts |
$ | 396 | $ | (193 | ) | $ | (20 | ) | $ | 183 | $ | 475 | $ | (145 | ) | $ | (147 | ) | $ | 183 | ||||||||||||
| Interest rate swaps |
5 | — | — | 5 | — | — | — | — | ||||||||||||||||||||||||
|
|
|
|
|
|
|
|
|
|
|
|
|
|
|
|
|
|||||||||||||||||
| Total derivative assets |
401 | (193 | ) | (20 | ) | 188 | 475 | (145 | ) | (147 | ) | 183 | ||||||||||||||||||||
|
|
|
|
|
|
|
|
|
|
|
|
|
|
|
|
|
|||||||||||||||||
| Derivative liabilities: |
||||||||||||||||||||||||||||||||
| Commodity contracts |
(332 | ) | 193 | 136 | (3 | ) | (204 | ) | 145 | 6 | (53 | ) | ||||||||||||||||||||
| Interest rate swaps |
(16 | ) | — | — | (16 | ) | — | — | — | — | ||||||||||||||||||||||
|
|
|
|
|
|
|
|
|
|
|
|
|
|
|
|
|
|||||||||||||||||
| Total derivative liabilities |
(348 | ) | 193 | 136 | (19 | ) | (204 | ) | 145 | 6 | (53 | ) | ||||||||||||||||||||
|
|
|
|
|
|
|
|
|
|
|
|
|
|
|
|
|
|||||||||||||||||
| Net amounts |
$ | 53 | $ | — | $ | 116 | $ | 169 | $ | 271 | $ | — | $ | (141 | ) | $ | 130 | |||||||||||||||
|
|
|
|
|
|
|
|
|
|
|
|
|
|
|
|
|
|||||||||||||||||
| (a) | Amounts presented exclude trade accounts receivable and payable related to settled financial instruments. |
| (b) | Financial collateral consists entirely of cash margin deposits. |
Derivative Volumes
The following table presents the gross notional amounts of derivative volumes at December 31, 2016 and 2015:
| Successor | Predecessor | |||||||||
| December 31, 2016 |
December 31, 2015 |
|||||||||
| Derivative type |
Notional Volume |
Notional Volume |
Unit of Measure | |||||||
| Natural gas (a) |
1,282 | 1,489 | Million MMBtu | |||||||
| Electricity |
75,322 | 58,022 | GWh | |||||||
| Congestion Revenue Rights (b) |
126,573 | 106,260 | GWh | |||||||
| Coal |
12 | 10 | Million US tons | |||||||
| Fuel oil |
34 | 35 | Million gallons | |||||||
| Uranium |
25 | 75 | Thousand pounds | |||||||
| Interest rate swaps — Floating/Fixed (c) |
$ | 3,000 | $ | — | Million US dollars | |||||
| (a) | Represents gross notional forward sales, purchases and options transactions, locational basis swaps and other natural gas transactions. |
F-67
Table of Contents
| (b) | Represents gross forward purchases associated with instruments used to hedge electricity price differences between settlement points within ERCOT. |
| (c) | Successor period includes notional amounts of interest rate swaps that become effective in January 2017 and have maturity dates through July 2023. |
Credit Risk-Related Contingent Features of Derivatives
The agreements that govern our derivative instrument transactions may contain certain credit risk-related contingent features that could trigger liquidity requirements in the form of cash collateral, letters of credit or some other form of credit enhancement. Certain of these agreements require the posting of collateral if our credit rating is downgraded by one or more credit rating agencies.
At December 31, 2016 and 2015, the fair value of liabilities related to derivative instruments under agreements with credit risk-related contingent features that were not fully collateralized totaled $13 million and $58 million, respectively. The liquidity exposure associated with these liabilities was reduced by cash and letter of credit postings with counterparties totaling $1 million and $31 million at December 31, 2016 and 2015, respectively. If all the credit risk-related contingent features related to these derivatives had been triggered, including cross-default provisions, remaining liquidity requirements would be immaterial at both December 31, 2016 and 2015.
In addition, certain derivative agreements include cross-default provisions that could result in the settlement of such contracts if there were a failure under other financing arrangements to meet payment terms or to comply with other covenants that could result in the acceleration of such indebtedness. At December 31, 2016 and 2015, the fair value of derivative liabilities subject to such cross-default provisions totaled $18 million and $1 million, respectively. At December 31, 2016 and 2015, no cash collateral or letters of credit were posted with these counterparties, and the liquidity exposure associated with these liabilities totaled $17 million and zero at December 31, 2016 and 2015, respectively.
As discussed immediately above, the aggregate fair values of liabilities under derivative agreements with credit risk-related contingent features, including cross-default provisions, totaled $31 million and $59 million at December 31, 2016 and 2015, respectively. These amounts are before consideration of cash and letter of credit collateral posted, net accounts receivable and derivative assets under netting arrangements and assets subject to related liens.
Some commodity derivative contracts contain credit risk-related contingent features that do not provide for specific amounts to be posted if the features are triggered. These provisions include material adverse change, performance assurance, and other clauses that generally provide counterparties with the right to request additional credit enhancements. The amounts disclosed above exclude credit risk-related contingent features that do not provide for specific amounts or exposure calculations.
Concentrations of Credit Risk Related to Derivatives
We have concentrations of credit risk with the counterparties to our derivative contracts. At December 31, 2016, total credit risk exposure to all counterparties related to derivative contracts totaled $555 million (including associated accounts receivable). The net exposure to those counterparties totaled $306 million at December 31, 2016 after taking into effect netting arrangements, setoff provisions and collateral, with the largest net exposure to a single counterparty totaling $88 million. At December 31, 2016, the credit risk exposure to the banking and financial sector represented 59% of the total credit risk exposure and 39% of the net exposure.
Exposure to banking and financial sector counterparties is considered to be within an acceptable level of risk tolerance because all of this exposure is with counterparties with investment grade credit ratings. However, this concentration increases the risk that a default by any of these counterparties would have a material effect on our
F-68
Table of Contents
financial condition, results of operations and liquidity. The transactions with these counterparties contain certain provisions that would require the counterparties to post collateral in the event of a material downgrade in their credit rating.
We maintain credit risk policies with regard to our counterparties to minimize overall credit risk. These policies authorize specific risk mitigation tools including, but not limited to, use of standardized master agreements that allow for netting of positive and negative exposures associated with a single counterparty. Credit enhancements such as parent guarantees, letters of credit, surety bonds, liens on assets and margin deposits are also utilized. Prospective material changes in the payment history or financial condition of a counterparty or downgrade of its credit quality result in the reassessment of the credit limit with that counterparty. The process can result in the subsequent reduction of the credit limit or a request for additional financial assurances. An event of default by one or more counterparties could subsequently result in termination-related settlement payments that reduce available liquidity if amounts are owed to the counterparties related to the derivative contracts or delays in receipts of expected settlements if the counterparties owe amounts to us.
18. PENSION AND OTHER POSTRETIREMENT EMPLOYEE BENEFITS (OPEB) PLANS
On the Effective Date, the EFH Retirement Plan was transferred to Vistra Energy pursuant to a separation agreement between Vistra Energy and EFH Corp. As of the Effective Date, Vistra Energy is the plan sponsor of the Vistra Retirement Plan (the Retirement Plan), which provides benefits to eligible employees of its subsidiaries. Oncor is a participant in the Retirement Plan. As Vistra Energy accounts for its interests in the Retirement Plan as a multiple employer plan, only Vistra Energy’s share of the plan assets and obligations are reported in the pension benefit information presented below. After amendments in 2012, employees in the Retirement Plan now consist entirely of active and retired collective bargaining unit employees. The Retirement Plan is a qualified defined benefit pension plan under Section 401(a) of the Internal Revenue Code of 1986, as amended (Code), and is subject to the provisions of ERISA. The Retirement Plan provides benefits to participants under one of two formulas: (i) a Cash Balance Formula under which participants earn monthly contribution credits based on their compensation and a combination of their age and years of service, plus monthly interest credits or (ii) a Traditional Retirement Plan Formula based on years of service and the average earnings of the three years of highest earnings. Under the Cash Balance Formula, future increases in earnings will not apply to prior service costs. It is our policy to fund the Retirement Plan assets only to the extent deductible under existing federal tax regulations.
Vistra Energy offers other postretirement employee benefits (OPEB) in the form of health care and life insurance to eligible employees of its subsidiaries and their eligible dependents upon the retirement of such employees. Vistra Energy is the sponsor of an OPEB plan that EFH Corp. participates in, and Oncor is the sponsor of an OPEB plan that Vistra Energy participates in. As Vistra Energy accounts for its interest in these OPEB plans as multiple employer plans, only Vistra Energy’s share of the plan assets and obligations are reported in postretirement benefits other than pension information presented below. For employees retiring on or after January 1, 2002, the retiree contributions required for such coverage vary based on a formula depending on the retiree’s age and years of service.
F-69
Table of Contents
Pension and OPEB Costs
| Successor | Predecessor | |||||||||||||||
| Period from October 3, 2016 through December 31, 2016 |
Period from January 1, 2016 through October 2, 2016 |
Year Ended December 31, |
||||||||||||||
| 2015 | 2014 | |||||||||||||||
| Pension costs |
$ | 2 | $ | 4 | $ | 8 | $ | 7 | ||||||||
| OPEB costs |
2 | — | 3 | 5 | ||||||||||||
| Total benefit costs recognized as expense |
$ | 4 | $ | 4 | $ | 11 | $ | 12 | ||||||||
|
|
|
|
|
|
|
|
|
|||||||||
Market-Related Value of Assets Held in Postretirement Benefit Trusts
We use the calculated value method to determine the market-related value of the assets held in the trust for purposes of calculating pension costs. We include the realized and unrealized gains or losses in the market-related value of assets over a rolling four-year period. Each year, 25% of such gains and losses for the current year and for each of the preceding three years is included in the market-related value. Each year, the market-related value of assets is increased for contributions to the plan and investment income and is decreased for benefit payments and expenses for that year.
Detailed Information Regarding Pension Benefits
The following information is based on a December 31, 2016 measurement date:
| Successor | ||||
| Period from October 3, 2016 through December 31, 2016 |
||||
| Assumptions Used to Determine Net Periodic Pension Cost: |
||||
| Discount rate |
3.79 | % | ||
| Expected return on plan assets |
4.89 | % | ||
| Expected rate of compensation increase |
3.50 | % | ||
| Components of Net Pension Cost: |
||||
| Service cost |
$ | 2 | ||
| Interest cost |
1 | |||
| Expected return on assets |
(1 | ) | ||
| Net periodic pension cost |
$ | 2 | ||
| Other Changes in Plan Assets and Benefit Obligations Recognized in Other Comprehensive Income: |
||||
| Net gain |
$ | (4 | ) | |
|
|
|
|||
| Total recognized in net periodic benefit cost and other comprehensive income |
$ | (2 | ) | |
|
|
|
|||
| Assumptions Used to Determine Benefit Obligations: |
||||
| Discount rate |
4.31 | % | ||
| Expected rate of compensation increase |
3.50 | % | ||
F-70
Table of Contents
| Successor | ||||
| Period from October 3, 2016 through December 31, 2016 |
||||
| Change in Pension Obligation: |
||||
| Projected benefit obligation at beginning of period |
$ | 154 | ||
| Service cost |
2 | |||
| Interest cost |
1 | |||
| Actuarial gain |
(12 | ) | ||
| Benefits paid |
(1 | ) | ||
|
|
|
|||
| Projected benefit obligation at end of year |
$ | 144 | ||
|
|
|
|||
| Accumulated benefit obligation at end of year |
$ | 136 | ||
|
|
|
|||
| Change in Plan Assets: |
||||
| Fair value of assets at beginning of period |
$ | 124 | ||
| Actual loss on assets |
(6 | ) | ||
| Benefits paid |
(1 | ) | ||
|
|
|
|||
| Fair value of assets at end of year |
$ | 117 | ||
|
|
|
|||
| Funded Status: |
||||
| Projected pension benefit obligation |
$ | (144 | ) | |
| Fair value of assets |
117 | |||
| Funded status at end of year |
$ | (27 | ) | |
|
|
|
|||
| Amounts Recognized in Accumulated Other Comprehensive Income Consist of: |
||||
| Net gain |
$ | 4 | ||
|
|
|
|||
The following table provides information regarding pension plans with projected benefit obligation (PBO) and accumulated benefit obligation (ABO) in excess of the fair value of plan assets.
| Successor | ||||
| December 31, 2016 |
||||
| Pension Plans with PBO and ABO in Excess Of Plan Assets: |
||||
| Projected benefit obligations |
$ | 144 | ||
| Accumulated benefit obligation |
$ | 136 | ||
| Plan assets |
$ | 117 | ||
Pension Plan Investment Strategy and Asset Allocations
Our investment objective for the Retirement Plan is to invest in a suitable mix of assets to meet the future benefit obligations at an acceptable level of risk, while minimizing the volatility of contributions. Fixed income securities held primarily consist of corporate bonds from a diversified range of companies, US Treasuries and agency securities and money market instruments. Equity securities are held to enhance returns by participating in a wide range of investment opportunities. International equity securities are used to further diversify the equity portfolio and may include investments in both developed and emerging markets.
F-71
Table of Contents
The target asset allocation ranges of pension plan investments by asset category are as follows:
| Asset Category: | Target Allocation Ranges | |
| Fixed income |
74% - 86% | |
| US equities |
8% - 14% | |
| International equities |
6% - 12% |
Expected Long-Term Rate of Return on Assets Assumption
The Retirement Plan strategic asset allocation is determined in conjunction with the plan’s advisors and utilizes a comprehensive Asset-Liability modeling approach to evaluate potential long-term outcomes of various investment strategies. The study incorporates long-term rate of return assumptions for each asset class based on historical and future expected asset class returns, current market conditions, rate of inflation, current prospects for economic growth, and taking into account the diversification benefits of investing in multiple asset classes and potential benefits of employing active investment management.
| Retirement Plan |
||||
| Asset Class: | Expected Long- Term Rate of Return |
|||
| US equity securities |
6.4 | % | ||
| International equity securities |
7.0 | % | ||
| Fixed income securities |
4.2 | % | ||
| Weighted average |
4.9 | % | ||
Fair Value Measurement of Pension Plan Assets
At December 31, 2016, pension plan assets measured at fair value on a recurring basis consisted of the following:
| Successor | ||||
| Asset Category: | December 31, 2016 |
|||
| Level 2 valuations (see Note 16): |
||||
| Interest-bearing cash |
$ | (4 | ) | |
| Fixed income securities: |
||||
| Corporate bonds (a) |
54 | |||
| US Treasuries |
30 | |||
| Other (b) |
6 | |||
| Total assets categorized as Level 2 |
86 | |||
| Assets measured at net asset value (c): |
||||
| Interest-bearing cash |
2 | |||
| Equity securities: |
||||
| US |
14 | |||
| International |
9 | |||
| Fixed income securities: |
||||
| Corporate bonds (a) |
6 | |||
| Total assets measured at net asset value |
31 | |||
|
|
|
|||
| Total assets |
$ | 117 | ||
|
|
|
|||
| (a) | Substantially all corporate bonds are rated investment grade by a major ratings agency such as Moody’s. |
F-72
Table of Contents
| (b) | Other consists primarily of municipal bonds. |
| (c) | Certain investments measured at fair value using the net asset value per share (or its equivalent) have not been classified in the fair value hierarchy. The fair value amounts presented in this line are intended to permit reconciliation of the fair value hierarchy to total Vistra Retirement Plan assets. |
Detailed Information Regarding Postretirement Benefits Other Than Pensions
The following OPEB information is based on a December 31, 2016 measurement date:
| Successor | ||||
| Period from October 3, 2016 through December 31, 2016 |
||||
| Assumptions Used to Determine Net Periodic Benefit Cost: |
||||
| Discount rate (Vistra Energy Plan) |
4.00 | % | ||
| Discount rate (Oncor Plan) |
3.69 | % | ||
| Components of Net Postretirement Benefit Cost: |
||||
| Service cost |
$ | 1 | ||
| Interest cost |
1 | |||
| Plan Amendments (a) |
(4 | ) | ||
| Net periodic OPEB cost |
$ | (2 | ) | |
|
|
|
|||
| Other Changes in Plan Assets and Benefit Obligations Recognized in Other Comprehensive Income: |
||||
| Net gain |
$ | (5 | ) | |
|
|
|
|||
| Total recognized in net periodic benefit cost and other comprehensive income |
$ | (7 | ) | |
|
|
|
|||
| Assumptions Used to Determine Benefit Obligations at Period End: |
||||
| Discount rate (Vistra Energy Plan) |
4.11 | % | ||
| Discount rate (Oncor Plan) |
4.18 | % | ||
| (a) | Curtailment gain recognized as other income in the statements of consolidated income (loss) as a result of discontinued life insurance benefits for active employees. |
| Successor | ||||
| Period from October 3, 2016 through December 31, 2016 |
||||
| Change in Postretirement Benefit Obligation: |
||||
| Benefit obligation at beginning of year |
$ | 97 | ||
| Service cost |
1 | |||
| Interest cost |
1 | |||
| Participant contributions |
1 | |||
| Plan amendments (a) |
(4 | ) | ||
| Actuarial gain |
(5 | ) | ||
| Benefits paid |
(3 | ) | ||
|
|
|
|||
| Benefit obligation at end of year |
$ | 88 | ||
|
|
|
|||
| Change in Plan Assets: |
||||
| Fair value of assets at beginning of year |
$ | — | ||
| Employer contributions |
1 | |||
| Participant contributions |
1 | |||
| Benefits paid |
(2 | ) | ||
|
|
|
|||
| Fair value of assets at end of year |
$ | — | ||
|
|
|
|||
F-73
Table of Contents
| Successor | ||||
| Period from October 3, 2016 through December 31, 2016 |
||||
| Funded Status: |
||||
| Benefit obligation |
$ | 88 | ||
|
|
|
|||
| Funded status at end of year |
$ | 88 | ||
|
|
|
|||
| Amounts Recognized on the Balance Sheet Consist of: |
||||
| Other current liabilities |
$ | 5 | ||
| Other noncurrent liabilities |
83 | |||
|
|
|
|||
| Net liability recognized |
$ | 88 | ||
|
|
|
|||
| Amounts Recognized in Accumulated Other Comprehensive Income Consist of: |
||||
| Net gain |
$ | 5 | ||
|
|
|
|||
| Net amount recognized |
$ | 5 | ||
|
|
|
|||
| (a) | Curtailment gain recognized as other income in the statements of consolidated income (loss) as a result of discontinued life insurance benefits for active employees. |
The following tables provide information regarding the assumed health care cost trend rates.
| Successor | ||||
| December 31, 2016 |
||||
| Assumed Health Care Cost Trend Rates-Not Medicare Eligible: |
||||
| Health care cost trend rate assumed for next year |
5.80 | % | ||
| Rate to which the cost trend is expected to decline (the ultimate trend rate) |
5.00 | % | ||
| Year that the rate reaches the ultimate trend rate |
2024 | |||
| Assumed Health Care Cost Trend Rates-Medicare Eligible: |
||||
| Health care cost trend rate assumed for next year |
5.70 | % | ||
| Rate to which the cost trend is expected to decline (the ultimate trend rate) |
5.00 | % | ||
| Year that the rate reaches the ultimate trend rate |
2024 | |||
| 1-Percentage Point Increase |
1-Percentage Point Decrease |
|||||||
| Sensitivity Analysis of Assumed Health Care Cost Trend Rates: |
||||||||
| Effect on accumulated postretirement obligation |
$ | (5 | ) | $ | 4 | |||
| Effect on postretirement benefits cost |
$ | — | $ | — | ||||
Fair Value Measurement of OPEB Plan Assets
At December 31, 2016, the Vistra Energy OPEB plan had no plan assets.
Significant Concentrations of Risk
The plans’ investments are exposed to risks such as interest rate, capital market and credit risks. We seek to optimize return on investment consistent with levels of liquidity and investment risk which are prudent and reasonable, given prevailing capital market conditions and other factors specific to us. While we recognize the importance of return, investments will be diversified in order to minimize the risk of large losses unless, under the circumstances, it is clearly prudent not to do so. There are also various restrictions and guidelines in place including limitations on types of investments allowed and portfolio weightings for certain investment securities to assist in the mitigation of the risk of large losses.
F-74
Table of Contents
Assumed Discount Rate
We selected the assumed discount rate using the Aon Hewitt AA Above Median yield curve, which is based on corporate bond yields and at December 31, 2016 consisted of 489 corporate bonds with an average rating of AA using Moody’s, Standard & Poor’s Rating Services and Fitch Ratings, Ltd. ratings.
Amortization in 2017
We estimate amortization of the net actuarial gain for the defined benefit pension plan from accumulated other comprehensive income into net periodic benefit cost will be immaterial. We estimate amortization of the net actuarial gain and prior service credit for the OPEB plan from accumulated other comprehensive income into net periodic benefit cost will be immaterial.
Contributions
No contributions are expected to be made to the pension plan in 2017. OPEB plan funding in the period from October 3, 2016 through December 31, 2016 totaled $1 million, and funding in 2017 is expected to total $5 million.
In September 2016, a cash contribution totaling $2 million was made to the EFH Retirement Plan, all of which was contributed by our Predecessor. In December 2015, a cash contribution totaling $67 million was made to the EFH Retirement Plan assets, of which $51 million was contributed by Oncor and $16 million was contributed by our Predecessor. Each of these contributions resulted in the Retirement Plan being fully funded as calculated under the provisions of ERISA. As a result of the Bankruptcy Filing, participants in the EFH Retirement Plan who chose to retire would not be eligible for the lump sum payout option under the EFH Retirement Plan unless the EFH Retirement Plan was fully funded. OPEB plan funding in the period from January 1, 2016 through October 2, 2016 totaled $3 million.
Future Benefit Payments
Estimated future benefit payments to beneficiaries are as follows:
| 2017 | 2018 | 2019 | 2020 | 2021 | 2022-26 | |||||||||||||||||||
| Pension benefits |
$ | 6 | $ | 6 | $ | 7 | $ | 8 | $ | 8 | $ | 53 | ||||||||||||
| OPEB |
$ | 5 | $ | 5 | $ | 5 | $ | 6 | $ | 6 | $ | 32 | ||||||||||||
Thrift Plan
Our employees may participate in a qualified savings plan (the Thrift Plan). This plan is a participant-directed defined contribution plan intended to qualify under Section 401(a) of the Code, and is subject to the provisions of ERISA. Under the terms of the Thrift Plan, employees who do not earn more than the IRS threshold compensation limit used to determine highly compensated employees may contribute, through pre-tax salary deferrals and/or after-tax payroll deductions, the lesser of 75% of their regular salary or wages or the maximum amount permitted under applicable law. Employees who earn more than such threshold may contribute from 1% to 20% of their regular salary or wages. Employer matching contributions are also made in an amount equal to 100% (75% for employees covered under the Traditional Retirement Plan Formula) of the first 6% of employee contributions. Employer matching contributions are made in cash and may be allocated by participants to any of the plan’s investment options.
Employer contributions to the Thrift Plan totaled $5 million, $16 million, $21 million and $21 million for the Successor period from October 3, 2016 through December 31, 2016 and the Predecessor period from January 1, 2016 through October 2, 2016 and the years ended December 31, 2015 and 2014, respectively.
F-75
Table of Contents
19. STOCK-BASED COMPENSATION
Vistra Energy 2016 Omnibus Incentive Plan
On the Effective Date, the Vistra Energy board of directors (Board) adopted the 2016 Omnibus Incentive Plan (2016 Incentive Plan), under which an aggregate of 22,500,000 shares of our common stock were reserved for issuance as equity-based awards to our non-employee directors, employees, and certain other persons. The Board or any committee duly authorized by the Board will administer the 2016 Incentive Plan and has broad authority under the 2016 Incentive Plan to, among other things: (a) select participants, (b) determine the types of awards that participants are to receive and the number of shares that are to be subject to such awards and (c) establish the terms and conditions of awards, including the price (if any) to be paid for the shares of the award. The types of awards that may be granted under the 2016 Incentive Plan include stock options, RSUs, restricted stock, performance awards and other forms of awards granted or denominated in shares of Vistra Energy common stock, as well as certain cash-based awards.
If any stock option or other stock-based award granted under the 2016 Incentive Plan expires, terminates or is canceled for any reason without having been exercised in full, the number of shares of Vistra Energy common stock underlying any unexercised award shall again be available for the purpose of awards under the 2016 Incentive Plan. If any shares of restricted stock, performance awards or other stock-based awards denominated in shares of Vistra Energy common stock awarded under the 2016 Incentive Plan are forfeited for any reason, the number of forfeited shares shall again be available for purposes of awards under the 2016 Incentive Plan. Any award under the 2016 Incentive Plan settled in cash shall not be counted against the maximum share limitation.
As is customary in incentive plans of this nature, each share limit and the number and kind of shares available under the 2016 Incentive Plan and any outstanding awards, as well as the exercise or purchase price of awards, and performance targets under certain types of performance-based awards, are required to be adjusted in the event of certain reorganizations, mergers, combinations, recapitalizations, stock splits, stock dividends or other similar events that change the number or kind of shares outstanding, and extraordinary dividends or distributions of property to the Vistra Energy stockholders.
Stock-based compensation expense is reported as SG&A in the statement of consolidated net income (loss) as follows:
| Successor | ||||
| Period from October 3, 2016 through December 31, 2016 |
||||
| Total stock-based compensation expense |
$ | 3 | ||
| Income tax benefit |
(1 | ) | ||
|
|
|
|||
| Stock based-compensation expense, net of tax |
$ | 2 | ||
|
|
|
|||
Stock Options
The table below summarizes information about stock options granted during the the Successor period from October 3, 2016 through December 31, 2016. The fair value of each stock option is estimated on the date of grant using a Black-Scholes option-pricing model. The risk-free interest rate used in the option valuation model was based on yields available on the grant dates for US Treasury Strips with maturity consistent with the expected life assumption. The expected term of the option represents the period of time that options granted are expected to be outstanding and is based on the SEC Simplified Method (midpoint of average vesting time and contractual term). Expected volatility is based on an average of the historical, daily volatility of a peer group selected by Vistra Energy over a period consistent with the expected life assumption ending on the grant date. We assumed no
F-76
Table of Contents
dividend yield in the valuation of the options. These options may be exercised over a four year graded vesting period and will expire ten years from the grant date. The 2016 Incentive Plan includes an anti-dilutive provision that requires any outstanding option awards to be adjusted for the effect of equity restructurings. In March 2017, the board of directors of Vistra Energy declared that the exercise price of each outstanding option be reduced by $2.32, the amount per share of common stock related to the Special Dividend (see Note 15). Stock options outstanding at December 31, 2016 are all held by current employees. The weighted average assumptions used to value grant options are detailed below:
| Stock Options (in thousands) |
Weighted Average Exercise Price |
Weighted Average Remaining Contractual Term (Years) |
Aggregate Intrinsic Value (in millions) |
|||||||||||||
| Total outstanding at beginning of period |
— | $ | — | — | $ | — | ||||||||||
| Granted |
7,379 | $ | 15.81 | 9.81 | $ | — | ||||||||||
| Forfeited or expired |
(22 | ) | $ | 15.58 | 9.81 | $ | — | |||||||||
|
|
|
|
|
|||||||||||||
| Total outstanding at end of period |
7,357 | $ | 15.81 | 9.81 | $ | — | ||||||||||
| Expected to vest |
7,357 | $ | 15.81 | 9.81 | $ | — | ||||||||||
At December 31, 2016, $32 million of unrecognized compensation cost related to unvested stock options granted under the 2016 Incentive Plan are expected to be recognized over a weighted average period of 3.8 years.
Restricted Stock Units
We granted 2.165 million restricted stock units to employees in the Successor period from October 3, 2016 through December 31, 2016.
| Restricted Stock Units (in thousands) |
Weighted Average Grant Date Fair Value |
Weighted Average Remaining Contractual Term (Years) |
Aggregate Intrinsic Value (in millions) |
|||||||||||||
| Total outstanding at beginning of period |
— | $ | — | — | $ | — | ||||||||||
| Granted |
2,165 | $ | 15.79 | 2.3 | $ | 33.6 | ||||||||||
| Forfeited or expired |
(6 | ) | $ | 15.58 | 2.3 | $ | (0.1 | ) | ||||||||
|
|
|
|
|
|||||||||||||
| Total outstanding at end of period |
2,159 | $ | 15.79 | 2.3 | $ | 33.5 | ||||||||||
| Expected to vest |
2,159 | $ | 15.79 | 2.3 | $ | 33.5 | ||||||||||
At December 31, 2016, $32 million of unrecognized compensation cost related to unvested restricted stock units granted under the 2016 Incentive Plan are expected to be recognized over a weighted average period of 3.8 years.
20. RELATED-PARTY TRANSACTIONS
Successor
In connection with Emergence, we entered into agreements with certain of our affiliates and with parties who received shares of common stock and TRA Rights in exchange for their claims.
Registration Rights Agreement
Pursuant to the Plan of Reorganization, on the Effective Date, we entered into a Registration Rights Agreement (the Registration Rights Agreement) with certain selling stockholders providing for registration of the resale of the Vistra Energy common stock held by such selling stockholders.
F-77
Table of Contents
In December 2016, we filed a Form S-1 registration statement with the SEC to register for resale the shares of Vistra Energy common stock held by certain significant stockholders pursuant to the Registration Rights Agreement. The registration statement was amended in February 2017. The registration statement has not yet been declared effective by the SEC. Among other things, under the terms of the Registration Rights Agreement:
| • | we will be required to use reasonable best efforts to convert the Form S-1 registration statement into a registration statement on Form S-3 as soon as reasonably practicable after we become eligible to do so and to have such Form S-3 declared effective as promptly as practicable (but in no event more than 30 days after it is filed with the SEC); |
| • | if we propose to file certain types of registration statements under the Securities Act with respect to an offering of equity securities, we will be required to use our reasonable best efforts to offer the other parties to the Registration Rights Agreement the opportunity to register all or part of their shares on the terms and conditions set forth in the Registration Rights Agreement; and |
| • | the selling stockholders received the right, subject to certain conditions and exceptions, to request that we file registration statements or amend or supplement registration statements, with the SEC for an underwritten offering of all or part of their respective shares of Vistra Energy common stock (a Demand Registration), and the Company is required to cause any such registration statement or amendment or supplement (a) to be filed with the SEC promptly and, in any event, on or before the date that is 45 days, in the case of a registration statement on Form S-1, or 30 days, in the case of a registration statement on Form S-3, after we receive the written request from the relevant selling stockholders to effectuate the Demand Registration and (b) to become effective as promptly as reasonably practicable and in any event no later than 120 days after it is initially filed. |
All expenses of registration under the Registration Rights Agreement, including the legal fees of one counsel retained by or on behalf of the selling stockholders, will be paid by us. There were no legal fee expenses paid or accrued by Vistra Energy on behalf of the selling stockholders during the Successor period from October 3, 2016 through December 31, 2016.
Tax Receivable Agreement
On the Effective Date, Vistra Energy entered into the TRA with a transfer agent on behalf of certain former first lien creditors of TCEH. See Note 10 for discussion of the TRA.
Predecessor
See Note 2 for a discussion of certain agreements entered into on the Effective Date between EFH Corp. and Vistra Energy with respect to the separation of the entities, including a separation agreement, a transition services agreement, a tax matters agreement and a settlement agreement.
The following represent our Predecessor’s significant related-party transactions. As of the Effective Date, pursuant to the Plan of Reorganization, the Sponsor Group, EFH Corp., EFIH, Oncor Holdings and Oncor ceased being affiliates of Vistra Energy and its subsidiaries, including the TCEH Debtors and the Contributed EFH Debtors.
| • | Our retail operations (and prior to the Effective Date, our Predecessor) pay Oncor for services it provides, principally the delivery of electricity. Expenses recorded for these services, reported in fuel, purchased power costs and delivery fees, totaled approximately $700 million, $955 million and $971 million for the Predecessor period from January 1, 2016 through October 2, 2016 and the years ended December 31, 2015 and 2014, respectively. The consolidated balance sheet at December 31, 2015 reflected amounts due currently to Oncor totaling $118 million (included in trade accounts and other payables to affiliates) largely related to these electricity delivery fees. |
F-78
Table of Contents
| • | Contributions to the EFH Corp. retirement plan by both Oncor and TCEH in 2014, 2015 and 2016 resulted in the EFH Corp. retirement plan being fully funded as calculated under the provisions of the Employee Retirement Income Security Act of 1974, as amended (ERISA). In September 2016, a cash contribution totaling $2 million was made to the EFH Corp. retirement plan, all of which was contributed by TCEH, which resulted in the EFH Retirement Plan continuing to be fully funded as calculated under the provisions of ERISA. The balance of the advance totaled $24 million at December 31, 2015, with $6 million recorded as a current asset and $18 million recorded as a noncurrent asset. On the Effective Date, the EFH Retirement Plan was transferred to Vistra Energy pursuant to a separation agreement between Vistra Energy and EFH Corp., and the advance was settled as part of fresh-start reporting. |
| • | Receivables from affiliates were measured at historical cost and primarily consisted of notes receivable for cash loaned by our Predecessor to EFH Corp. for debt principal and interest payments and other general corporate purposes of EFH Corp. as discussed above. Our Predecessor reviewed economic conditions, counterparty credit scores and historical payment activity to assess the overall collectability of its affiliated receivables. There were no credit loss allowances at December 31, 2015. |
| • | A former subsidiary of EFH Corp. billed our subsidiaries for information technology, financial, accounting and other administrative services at cost. These charges, which are largely settled in cash and primarily reported in SG&A expenses, totaled $157 million, $205 million and $204 million for the Predecessor period from January 1, 2016 through October 2, 2016 and the years ended December 31, 2015 and 2014, respectively. These amounts included allocated expense, which totaled $10 million for the year ended December 31, 2014, for management fees owed and paid by EFH Corp. to the Sponsor Group. Effective with the Petition Date, EFH Corp. suspended allocations of such fees to TCEH. Fees accrued as of the Petition Date were classified as LSTC and were eliminated in December 2015 as part of the Settlement Agreement. |
| • | Under Texas regulatory provisions, the trust fund for decommissioning the Comanche Peak nuclear generation facility is funded by a delivery fee surcharge billed to REPs by Oncor, as collection agent, and remitted monthly to a subsidiary of Vistra Energy (and prior to the Effective Date, our Predecessor) for contribution to the trust fund with the intent that the trust fund assets, reported in investments in the consolidated balance sheets, will ultimately be sufficient to fund the future decommissioning liability, reported in noncurrent liabilities in the consolidated balance sheets. The delivery fee surcharges remitted to our Predecessor totaled $15 million, $17 million and $17 million for the Predecessor period from January 1, 2016 through October 2, 2016 and the years ended December 31, 2015 and 2014, respectively. Income and expenses associated with the trust fund and the decommissioning liability incurred by a subsidiary of Vistra Energy (and prior to the Effective Date, our Predecessor) are offset by a net change in a receivable/payable that ultimately will be settled through changes in Oncor’s delivery fee rates. At December 31, 2015, the excess of the trust fund balance over the decommissioning liability resulted in a payable totaling $409 million and is reported in noncurrent liabilities. |
| • | EFH Corp. files consolidated federal income tax and Texas state margin tax returns that included our results prior to the Effective Date; however, under a Federal and State Income Tax Allocation Agreement, our federal income tax and Texas margin tax expense and related balance sheet amounts, including income taxes payable to or receivable from EFH Corp., were recorded as if our Predecessor filed its own corporate income tax return. As of December 31, 2015, our Predecessor had current income tax liabilities due to EFH Corp. of $11 million. Our Predecessor made tax payments to EFH Corp. of $22 million, $29 million and $31 million for the Predecessor period from January 1, 2016 through December 31, 2016 and the years ended December 31, 2015 and 2014, respectively. In 2015, $609 million of income tax liability was eliminated under the terms of the Settlement Agreement. See Note 9 for discussion of cessation of payment of federal income taxes pursuant to the Settlement Agreement. |
F-79
Table of Contents
| • | In 2007, TCEH entered into the TCEH Senior Secured Facilities with syndicates of financial institutions and other lenders. These syndicates included affiliates of GS Capital Partners, which is a member of the Sponsor Group. Affiliates of each member of the Sponsor Group have from time to time engaged in commercial banking transactions with TCEH and/or provided financial advisory services to TCEH, in each case in the normal course of business. |
| • | Affiliates of GS Capital Partners were parties to certain commodity and interest rate hedging transactions with our Predecessor in the normal course of business. |
| • | Affiliates of the Sponsor Group sold or acquired debt or debt securities issued by our Predecessor in open market transactions or through loan syndications. |
| • | As a result of debt repurchase and exchange transactions in 2009 through 2011, EFH Corp. and EFIH held TCEH debt securities at December 31, 2014 as shown below (principal amounts). The $382 million in notes payable as of the Petition Date was classified as LSTC. The amounts of TCEH debt held by EFIH or EFH Corp. were eliminated as a result of the Settlement Agreement approved by the Bankruptcy Court in December 2015 (see Note 2). In conjunction with the Settlement Agreement approved by the Bankruptcy Court in December 2015, EFH Corp. and EFIH waived their rights to the claims associated with these debt securities resulting in a gain recorded in reorganization items (see Note 4). |
| Principal Amount |
||||
| TCEH Senior Notes: |
||||
| Held by EFH Corp. |
$ | 284 | ||
| Held by EFIH |
79 | |||
| TCEH Term Loan Facilities: |
||||
| Held by EFH Corp. |
19 | |||
|
|
|
|||
| Total |
$ | 382 | ||
|
|
|
|||
Interest expense on the notes totaled $1 million and $13 million for the years ended December 31, 2015 and 2014, respectively. Contractual interest, not paid or recorded, totaled $37 million and $25 million for the years ended December 31, 2015 and 2014, respectively. See Note 11.
21. SEGMENT INFORMATION
The operations of Vistra Energy are aligned into two reportable business segments: Wholesale Generation and Retail Electricity. Our chief operating decision maker reviews the results of these two segments separately and allocates resources to the respective segments as part of our strategic operations. These two business units offer different products or services and involve different risks.
The Wholesale Generation segment is engaged in electricity generation, wholesale energy sales and purchases, commodity risk management activities, fuel production and fuel logistics management, all largely in the ERCOT market. These activities are substantially all conducted by Luminant.
The Retail Electricity segment is engaged in retail sales of electricity and related services to residential, commercial and industrial customers, all largely in the ERCOT market. These activities are substantially all conducted by TXU Energy.
Corporate and Other represents the remaining non-segment operations consisting primarily of general corporate expenses, interest, taxes and other expenses related to our support functions that provide shared services to our Wholesale Generation and Retail Electricity segments.
F-80
Table of Contents
The accounting policies of the business segments are the same as those described in the summary of significant accounting policies in Note 1. Our chief operating decision maker uses more than one measure to assess segment performance, including reported segment operating income and segment net income (loss), which is the measure most comparable to consolidated net income (loss) prepared based on GAAP. We account for intersegment sales and transfers as if the sales or transfers were to third parties, that is, at current market prices or regulated rates. Certain shared services costs are allocated to the segments.
| Successor | ||||
| Period from October 3, 2016 through December 31, 2016 |
||||
| Operating revenues (a) |
||||
| Wholesale Generation |
$ | 450 | ||
| Retail Electricity |
912 | |||
| Eliminations |
(171 | ) | ||
|
|
|
|||
| Consolidated operating revenues |
$ | 1,191 | ||
| Depreciation and amortization |
||||
| Wholesale Generation |
$ | 53 | ||
| Retail Electricity |
153 | |||
| Corporate and Other |
11 | |||
| Eliminations |
(1 | ) | ||
|
|
|
|||
| Consolidated depreciation and amortization |
$ | 216 | ||
|
|
|
|||
| Operating income (loss) |
||||
| Wholesale Generation |
$ | (255 | ) | |
| Retail Electricity |
111 | |||
| Corporate and Other |
(17 | ) | ||
|
|
|
|||
| Consolidated operating income (loss) |
$ | (161 | ) | |
|
|
|
|||
| Interest expense and related charges |
||||
| Wholesale Generation |
$ | (1 | ) | |
| Retail Electricity |
— | |||
| Corporate and Other |
66 | |||
| Eliminations |
(5 | ) | ||
|
|
|
|||
| Consolidated interest expense and related charges |
$ | 60 | ||
|
|
|
|||
| Income tax benefit (all Corporate and Other) |
$ | 70 | ||
|
|
|
|||
| Net income (loss) |
||||
| Wholesale Generation |
$ | (251 | ) | |
| Retail Electricity |
114 | |||
| Corporate and Other |
(26 | ) | ||
|
|
|
|||
| Consolidated net income (loss) |
$ | (163 | ) | |
|
|
|
|||
| Capital expenditures |
||||
| Wholesale Generation |
$ | 84 | ||
| Retail Electricity |
5 | |||
|
|
|
|||
| Consolidated capital expenditures |
$ | 89 | ||
|
|
|
|||
F-81
Table of Contents
| (a) | Includes third-party unrealized net losses from mark-to-market valuations of commodity positions of $182 million recorded to the Wholesale Generation segment and $6 million recorded to the Retail Electricity segment. In addition, an unrealized net loss with an affiliate of $113 million was recorded to the Wholesale Generation segment which is eliminated in the consolidated results. |
| Successor | ||||
| December 31, 2016 |
||||
| Total assets |
||||
| Wholesale Generation |
$ | 6,952 | ||
| Retail Electricity |
5,753 | |||
| Corporate and Other and Eliminations |
2,462 | |||
|
|
|
|||
| Consolidated total assets |
$ | 15,167 | ||
Prior to the Effective Date, our Predecessor’s chief operating decision maker reviewed the retail electricity, wholesale generation and commodity risk management activities together. Consequently, there were no reportable business segments for TCEH.
22. SUPPLEMENTARY FINANCIAL INFORMATION
Other Income and Deductions
| Successor | Predecessor | |||||||||||||||
| Period from October 3, 2016 through December 31, 2016 |
Period from January 1, 2016 through October 2, 2016 |
Year Ended December 31, |
||||||||||||||
| 2015 | 2014 | |||||||||||||||
| Other income: |
||||||||||||||||
| Office space sublease rental income (a) |
$ | 2 | $ | — | $ | — | $ | — | ||||||||
| Curtailment gain on employee benefit plans (a) |
4 | — | — | — | ||||||||||||
| Mineral rights royalty income (b) |
1 | 3 | 4 | 4 | ||||||||||||
| Insurance settlement |
— | 9 | — | — | ||||||||||||
| All other |
2 | 4 | 13 | 12 | ||||||||||||
|
|
|
|
|
|
|
|
|
|||||||||
| Total other income |
$ | 9 | $ | 16 | $ | 17 | $ | 16 | ||||||||
|
|
|
|
|
|
|
|
|
|||||||||
| Other deductions: |
||||||||||||||||
| Adjustment to asbestos liability |
$ | — | $ | 11 | $ | — | $ | — | ||||||||
| Write-off of generation equipment |
— | 45 | — | — | ||||||||||||
| Fees associated with DIP Roll Facilities |
— | 5 | — | |||||||||||||
| Impairment of favorable purchase contracts (Note 7) |
— | — | 8 | 183 | ||||||||||||
| Impairment of emission allowances (Note 7) |
— | — | 55 | 80 | ||||||||||||
| Impairment of mining development costs (Note 7) |
— | — | 19 | — | ||||||||||||
| All other |
— | 14 | 11 | 18 | ||||||||||||
|
|
|
|
|
|
|
|
|
|||||||||
| Total other deductions |
$ | — | $ | 75 | $ | 93 | $ | 281 | ||||||||
|
|
|
|
|
|
|
|
|
|||||||||
| (a) | Corporate and Other nonsegment (Successor period only). |
| (b) | Wholesale Generation segment (Successor period only). |
F-82
Table of Contents
Restricted Cash
| Successor | Predecessor | |||||||||||||||
| December 31, 2016 | December 31, 2015 | |||||||||||||||
| Current Assets |
Noncurrent Assets |
Current Assets |
Noncurrent Assets |
|||||||||||||
| Amounts related to the Vistra Operations Credit Facilities (Note 13) |
$ | — | $ | 650 | $ | — | $ | — | ||||||||
| Amounts related to the DIP Facility (Note 13) |
519 | — | ||||||||||||||
| Amounts related to TCEH’s pre-petition Letter of Credit Facility (Note 5) |
— | — | — | 507 | ||||||||||||
| Amounts related to restructuring escrow accounts |
90 | — | — | — | ||||||||||||
| Other |
5 | — | — | — | ||||||||||||
|
|
|
|
|
|
|
|
|
|||||||||
| Total restricted cash |
$ | 95 | $ | 650 | $ | 519 | $ | 507 | ||||||||
|
|
|
|
|
|
|
|
|
|||||||||
Trade Accounts Receivable
| Successor | Predecessor | |||||||
| December 31, 2016 |
December 31, 2015 |
|||||||
| Wholesale and retail trade accounts receivable |
$ | 622 | $ | 542 | ||||
| Allowance for uncollectible accounts |
(10 | ) | (9 | ) | ||||
|
|
|
|
|
|||||
| Trade accounts receivable — net |
$ | 612 | $ | 533 | ||||
|
|
|
|
|
|||||
Gross trade accounts receivable at December 31, 2016 and 2015 included unbilled revenues of $225 million and $231 million, respectively.
Allowance for Uncollectible Accounts Receivable
| Successor | Predecessor | |||||||||||||||
| Period from October 3, 2016 through December 31, 2016 |
Period from January 1, 2016 through October 2, 2016 |
Year Ended December 31, |
||||||||||||||
| 2015 | 2014 | |||||||||||||||
| Allowance for uncollectible accounts receivable at beginning of period |
$ | — | $ | 9 | $ | 15 | $ | 14 | ||||||||
| Increase for bad debt expense |
(10 | ) | 20 | 34 | 38 | |||||||||||
| Decrease for account write-offs |
— | (16 | ) | (40 | ) | (37 | ) | |||||||||
|
|
|
|
|
|
|
|
|
|||||||||
| Allowance for uncollectible accounts receivable at end of period |
$ | (10 | ) | $ | 13 | $ | 9 | $ | 15 | |||||||
|
|
|
|
|
|
|
|
|
|||||||||
Inventories by Major Category
| Successor | Predecessor | |||||||
| December 31, 2016 |
December 31, 2015 |
|||||||
| Materials and supplies |
$ | 173 | $ | 226 | ||||
| Fuel stock |
88 | 170 | ||||||
| Natural gas in storage |
24 | 32 | ||||||
|
|
|
|
|
|||||
| Total inventories |
$ | 285 | $ | 428 | ||||
|
|
|
|
|
|||||
F-83
Table of Contents
Investments
| Successor | Predecessor | |||||||
| December 31, 2016 |
December 31, 2015 |
|||||||
| Nuclear plant decommissioning trust |
$ | 1,012 | $ | 918 | ||||
| Land |
49 | 36 | ||||||
| Miscellaneous other |
3 | 8 | ||||||
|
|
|
|
|
|||||
| Total investments |
$ | 1,064 | $ | 962 | ||||
|
|
|
|
|
|||||
Nuclear Decommissioning Trust — Investments in a trust that will be used to fund the costs to decommission the Comanche Peak nuclear generation plant are carried at fair value. Decommissioning costs are being recovered from Oncor’s customers as a delivery fee surcharge over the life of the plant and deposited by Vistra Energy (and prior to the Effective Date, a subsidiary of TCEH) in the trust fund. Income and expense associated with the trust fund and the decommissioning liability are offset by a corresponding change in a receivable/payable (currently a payable reported in noncurrent liabilities) that will ultimately be settled through changes in Oncor’s delivery fees rates. The nuclear decommissioning trust fund was not a debtor in the Chapter 11 Cases. A summary of investments in the fund follows:
| Successor | ||||||||||||||||
| December 31, 2016 | ||||||||||||||||
| Cost (a) | Unrealized gain |
Unrealized loss |
Fair market value |
|||||||||||||
| Debt securities (b) |
$ | 333 | $ | 10 | $ | (3 | ) | $ | 340 | |||||||
| Equity securities (c) |
309 | 368 | (5 | ) | 672 | |||||||||||
|
|
|
|
|
|
|
|
|
|||||||||
| Total |
$ | 642 | $ | 378 | $ | (8 | ) | $ | 1,012 | |||||||
|
|
|
|
|
|
|
|
|
|||||||||
| Predecessor | ||||||||||||||||
| December 31, 2015 | ||||||||||||||||
| Cost (a) | Unrealized gain |
Unrealized loss |
Fair market value |
|||||||||||||
| Debt securities (b) |
$ | 310 | $ | 11 | $ | (2 | ) | $ | 319 | |||||||
| Equity securities (c) |
291 | 315 | (7 | ) | 599 | |||||||||||
|
|
|
|
|
|
|
|
|
|||||||||
| Total |
$ | 601 | $ | 326 | $ | (9 | ) | $ | 918 | |||||||
|
|
|
|
|
|
|
|
|
|||||||||
| (a) | Includes realized gains and losses on securities sold. |
| (b) | The investment objective for debt securities is to invest in a diversified tax efficient portfolio with an overall portfolio rating of AA or above as graded by S&P or Aa2 by Moody’s Investors Services, Inc. The debt securities are heavily weighted with municipal bonds. The debt securities had an average coupon rate of 3.56% and 3.68% at December 31, 2016 and 2015, respectively, and an average maturity of 9 years and 8 years at December 31, 2016 and 2015, respectively. |
| (c) | The investment objective for equity securities is to invest tax efficiently and to match the performance of the S&P 500 Index. |
Debt securities held at December 31, 2016 mature as follows: $102 million in one to five years, $90 million in five to ten years and $148 million after ten years.
F-84
Table of Contents
The following table summarizes proceeds from sales of available-for-sale securities and the related realized gains and losses from such sales.
| Successor | Predecessor | |||||||||||||||
| Period from October 3, 2016 through December 31, 2016 |
Period from January 1, 2016 through October 2, 2016 |
Year Ended December 31, |
||||||||||||||
| 2015 | 2014 | |||||||||||||||
| Realized gains |
$ | 1 | $ | 3 | $ | 1 | $ | 11 | ||||||||
| Realized losses |
$ | — | $ | (2 | ) | $ | (1 | ) | $ | (2 | ) | |||||
| Proceeds from sales of securities |
$ | 25 | $ | 201 | $ | 401 | $ | 314 | ||||||||
| Investments in securities |
$ | (30 | ) | $ | (215 | ) | $ | (418 | ) | $ | (331 | ) | ||||
Property, Plant and Equipment
| Successor | ||||
| December 31, 2016 |
||||
| Successor |
||||
| Wholesale Generation: |
||||
| Generation and mining |
$ | 3,997 | ||
| Retail Electricity |
3 | |||
| Corporate and Other |
107 | |||
|
|
|
|||
| Total |
4,107 | |||
| Less accumulated depreciation |
(54 | ) | ||
|
|
|
|||
| Net of accumulated depreciation |
4,053 | |||
| Nuclear fuel (net of accumulated amortization of $31 million) |
166 | |||
| Construction work in progress: |
||||
| Wholesale Generation |
210 | |||
| Retail Electricity |
6 | |||
| Corporate and Other |
8 | |||
|
|
|
|||
| Total construction work in progress |
224 | |||
|
|
|
|||
| Property, plant and equipment — net |
$ | 4,443 | ||
|
|
|
|||
| Predecessor | ||||
| December 31, 2015 |
||||
| Predecessor |
||||
| Generation and mining |
$ | 10,886 | ||
| Other assets |
546 | |||
|
|
|
|||
| Total |
11,432 | |||
| Less accumulated depreciation |
(2,654 | ) | ||
|
|
|
|||
| Net of accumulated depreciation |
8,778 | |||
| Nuclear fuel (net of accumulated amortization of $1.383 billion) |
248 | |||
| Construction work in progress |
323 | |||
|
|
|
|||
| Property, plant and equipment — net |
$ | 9,349 | ||
|
|
|
|||
F-85
Table of Contents
Depreciation expense totaled $54 million, $401 million, $767 million and $1.154 billion for the Successor period from October 3, 2016 through December 31, 2016 and the Predecessor period from January 1, 2016 through October 2, 2016 and the years ended December 31, 2015 and 2014, respectively.
Our property, plant and equipment consists of our power generation assets, related mining assets, information system hardware, capitalized corporate office lease space and other leasehold improvements. At December 31, 2016, the capital lease for the building totaled $64 million with accumulated depreciation of less than $1 million. The estimated remaining useful lives range from 3 to 37 years for our property, plant and equipment.
Asset Retirement and Mining Reclamation Obligations (ARO)
These liabilities primarily relate to nuclear generation plant decommissioning, land reclamation related to lignite mining, removal of lignite/coal fueled plant ash treatment facilities and generation plant asbestos removal and disposal costs. There is no earnings impact with respect to changes in the nuclear plant decommissioning liability, as all costs are recoverable through the regulatory process as part of delivery fees charged by Oncor. As part of fresh start reporting, new fair values were established for all AROs for the Successor.
At December 31, 2016, the current value of our ARO related to our nuclear generation plant decommissioning totaled $1.2 billion, which exceeds the fair value of the assets contained in the nuclear decommissioning trust. Since the costs to ultimately decommission that plant are recoverable through the regulatory rate making process as part of Oncor’s delivery fees, a corresponding regulatory asset has been recorded to our consolidated balance sheet of $188 million in other noncurrent assets.
The following tables summarize the changes to these obligations, reported in other current liabilities and other noncurrent liabilities and deferred credits in the consolidated balance sheets for the Successor period ended December 31, 2016, and the Predecessor periods ended October 2, 2016 and December 31, 2015:
| Successor: | Nuclear Plant Decommissioning |
Mining Land Reclamation |
Other | Total | ||||||||||||
| Fair value of liability established at October 3, 2016 |
$ | 1,192 | $ | 374 | $ | 152 | $ | 1,718 | ||||||||
| Additions: |
||||||||||||||||
| Accretion — October 3, 2016 through December 31, 2016 |
8 | 5 | 1 | 14 | ||||||||||||
| Reductions: |
||||||||||||||||
| Payments — October 3, 2016 through December 31, 2016 |
— | (4 | ) | (2 | ) | (6 | ) | |||||||||
|
|
|
|
|
|
|
|
|
|||||||||
| Liability at December 31, 2016 |
1,200 | 375 | 151 | 1,726 | ||||||||||||
| Less amounts due currently |
— | (53 | ) | (2 | ) | (55 | ) | |||||||||
|
|
|
|
|
|
|
|
|
|||||||||
| Noncurrent liability at December 31, 2016 |
$ | 1,200 | $ | 322 | $ | 149 | $ | 1,671 | ||||||||
|
|
|
|
|
|
|
|
|
|||||||||
F-86
Table of Contents
| Predecessor: | Nuclear Plant Decommissioning |
Mining Land Reclamation |
Other | Total | ||||||||||||
| Liability at January 1, 2015 |
$ | 413 | $ | 165 | $ | 36 | $ | 614 | ||||||||
| Additions: |
||||||||||||||||
| Accretion |
25 | 20 | 6 | 51 | ||||||||||||
| Adjustment for new cost estimate (a) |
70 | — | — | 70 | ||||||||||||
| Incremental reclamation costs (b) |
— | 84 | 69 | 153 | ||||||||||||
| Reductions: |
||||||||||||||||
| Payments |
— | (54 | ) | (4 | ) | (58 | ) | |||||||||
|
|
|
|
|
|
|
|
|
|||||||||
| Liability at December 31, 2015 (c) |
508 | 215 | 107 | 830 | ||||||||||||
| Additions: |
||||||||||||||||
| Accretion — January 1, 2016 through October 2, 2016 |
22 | 16 | 5 | 43 | ||||||||||||
| Adjustment for new cost estimate |
— | — | 1 | 1 | ||||||||||||
| Incremental reclamation costs |
— | 14 | 12 | 26 | ||||||||||||
| Reductions: |
||||||||||||||||
| Payments — January 1, 2016 through October 2, 2016 |
— | (37 | ) | (3 | ) | (40 | ) | |||||||||
|
|
|
|
|
|
|
|
|
|||||||||
| Liability at October 2, 2016 |
530 | 208 | 122 | 860 | ||||||||||||
| Less amounts due currently |
— | (50 | ) | (1 | ) | (51 | ) | |||||||||
|
|
|
|
|
|
|
|
|
|||||||||
| Noncurrent liability at October 2, 2016 |
$ | 530 | $ | 158 | $ | 121 | $ | 809 | ||||||||
|
|
|
|
|
|
|
|
|
|||||||||
| (a) | The adjustment for nuclear plant decommissioning resulted from a new cost estimate completed in 2015. Under applicable accounting standards, the liability is remeasured when significant changes in the amount or timing of cash flows occurs, and PUCT rules require a new cost estimate at least every five years. The increase in the liability was driven by increased security and fuel-handling costs. |
| (b) | The adjustment for other asset retirement obligations resulted from the effect on our estimated retirement obligation related to coal combustion residual facilities at our lignite/coal fueled generation facilities that arose from the Disposal of Coal Combustion Residuals from Electric Utilities rule. |
| (c) | Includes $66 million recorded to other current liabilities in the consolidated balance sheet of the Predecessor. |
Other Noncurrent Liabilities and Deferred Credits
The balance of other noncurrent liabilities and deferred credits consists of the following:
| Successor | Predecessor | |||||||
| December 31, 2016 |
December 31, 2015 |
|||||||
| Unfavorable purchase and sales contracts |
$ | 46 | $ | 543 | ||||
| Nuclear decommissioning fund excess over asset retirement obligation (Note 20) |
— | 409 | ||||||
| Uncertain tax positions, including accrued interest |
— | 41 | ||||||
| Other, including retirement and other employee benefits |
174 | 22 | ||||||
|
|
|
|
|
|||||
| Total other noncurrent liabilities and deferred credits |
$ | 220 | $ | 1,015 | ||||
|
|
|
|
|
|||||
Unfavorable Purchase and Sales Contracts — The amortization of unfavorable purchase and sales contracts totaled $3 million, $18 million, $23 million and $23 million for the Successor period from October 3, 2016 through December 31, 2016, the Predecessor period from January 1, 2016 through October 2, 2016 and the years
F-87
Table of Contents
ended December 31, 2015 and 2014, respectively. See Note 7 for intangible assets related to favorable purchase and sales contracts.
Fair Value of Debt
| Successor | Predecessor | |||||||||||||||
| December 31, 2016 | December 31, 2015 | |||||||||||||||
| Debt: |
Carrying Amount |
Fair Value |
Carrying Amount |
Fair Value |
||||||||||||
| Long-term debt under the Vistra Operations Credit Facilities (Note 13) |
$ | 4,515 | $ | 4,552 | $ | — | $ | — | ||||||||
| Other long-term debt, excluding capital lease obligations (Note 13) |
$ | 36 | $ | 32 | $ | 14 | $ | 15 | ||||||||
| Mandatorily redeemable preferred stock (Note 13) |
$ | 70 | $ | 70 | $ | — | $ | — | ||||||||
| Borrowings under debtor-in-possession or senior secured exit facilities (Note 13) |
$ | — | $ | — | $ | 1,425 | $ | 1,411 | ||||||||
We determine fair value in accordance with accounting standards as discussed in Note 16, and at December 31, 2016, our debt fair value represents Level 2 valuations. We obtain security pricing from an independent party who uses broker quotes and third-party pricing services to determine fair values. Where relevant, these prices are validated through subscription services such as Bloomberg. The fair value estimates of Predecessor pre-petition notes, loans and other debt reported as liabilities subject to compromise have been excluded from the table above.
Supplemental Cash Flow Information
| Successor | Predecessor | |||||||||||||||
| Period from October 3, 2016 through December 31, 2016 |
Period from January 1, 2016 through October 2, 2016 |
Year Ended December 31, |
||||||||||||||
| 2015 | 2014 | |||||||||||||||
| Cash payments related to: |
||||||||||||||||
| Interest paid (a) |
$ | 19 | $ | 1,064 | $ | 1,298 | $ | 1,252 | ||||||||
| Capitalized interest |
(3 | ) | (9 | ) | (11 | ) | (17 | ) | ||||||||
|
|
|
|
|
|
|
|
|
|||||||||
| Interest paid (net of capitalized interest) (a) |
$ | 16 | $ | 1,055 | $ | 1,287 | $ | 1,235 | ||||||||
| Reorganization items (b) |
$ | — | $ | 104 | $ | 224 | $ | 93 | ||||||||
| Income taxes paid (refund) |
$ | (2 | ) | $ | 22 | $ | 29 | $ | 31 | |||||||
| Noncash investing and financing activities: |
||||||||||||||||
| Construction expenditures (c) |
$ | 1 | $ | 53 | $ | 75 | $ | 108 | ||||||||
| Contribution to membership interests |
$ | — | $ | — | $ | — | $ | 2 | ||||||||
| (a) | This amount includes amounts paid for adequate protection. Net of amounts received under interest rate swap agreements in 2014. |
| (b) | Represents cash payments for legal and other consulting services, including amounts paid on behalf of third parties pursuant to contractual obligations approved by the Bankruptcy Court. |
| (c) | Represents end-of-period accruals for ongoing construction projects. |
F-88
Table of Contents
SCHEDULE I – CONDENSED FINANCIAL INFORMATION OF REGISTRANT
VISTRA ENERGY CORP. (PARENT)
SCHEDULE I – CONDENSED FINANCIAL INFORMATION OF REGISTRANT
CONDENSED STATEMENT OF LOSS
(Millions of Dollars)
| Successor | ||||
| Period from October 3, 2016 through December 31, 2016 |
||||
| Selling, general and administrative expense |
$ | (7 | ) | |
|
|
|
|||
| Loss from operations |
(7 | ) | ||
| Impacts of Tax Receivable Agreement |
(22 | ) | ||
|
|
|
|||
| Loss before income taxes and equity earnings |
(29 | ) | ||
| Pretax equity in losses of consolidated subsidiaries |
(204 | ) | ||
| Income tax benefit |
70 | |||
|
|
|
|||
| Net loss |
$ | (163 | ) | |
|
|
|
|||
See Notes to the Condensed Financial Statements.
CONDENSED STATEMENT OF CASH FLOWS
(Millions of Dollars)
| Successor | ||||
| Period from October 3, 2016 through December 31, 2016 |
||||
| Cash flows — operating activities: |
||||
| Net loss |
$ | (163 | ) | |
| Adjustments to reconcile net loss to cash provided by (used in) operating activities: |
||||
| Pretax equity in losses of consolidated subsidiaries |
204 | |||
| Deferred income tax benefit, net |
(76 | ) | ||
| Impacts of Tax Receivables Agreement |
22 | |||
| Other, net |
3 | |||
| Changes in operating assets and liabilities |
(26 | ) | ||
|
|
|
|||
| Cash used in operating activities |
(36 | ) | ||
| Cash flows — financing activities: |
||||
| Special dividend (Note 4) |
(992 | ) | ||
| Other, net |
1 | |||
|
|
|
|||
| Cash used in financing activities |
(991 | ) | ||
| Cash flows — investing activities: |
||||
| Dividend received from subsidiaries |
997 | |||
| Changes in restricted cash |
36 | |||
|
|
|
|||
| Cash provided by financing activities |
1,033 | |||
| Net change in cash and cash equivalents |
6 | |||
| Cash and cash equivalents — beginning balance |
20 | |||
|
|
|
|||
| Cash and cash equivalents — ending balance |
$ | 26 | ||
|
|
|
|||
See Notes to the Condensed Financial Statements.
F-89
Table of Contents
VISTRA ENERGY CORP. (PARENT)
SCHEDULE I – CONDENSED FINANCIAL INFORMATION OF REGISTRANT
CONDENSED BALANCE SHEET
(Millions of Dollars)
| Successor | ||||
| December 31, 2016 | ||||
| ASSETS | ||||
| Current assets: |
||||
| Cash and cash equivalents |
$ | 26 | ||
| Restricted cash |
90 | |||
| Other current assets |
3 | |||
|
|
|
|||
| Total current assets |
119 | |||
| Equity investments in consolidated subsidiaries |
6,067 | |||
| Accumulated deferred income taxes |
1,122 | |||
| Other noncurrent assets |
7 | |||
|
|
|
|||
| Total assets |
$ | 7,315 | ||
|
|
|
|||
| LIABILITIES AND EQUITY | ||||
| Current liabilities: |
||||
| Accrued taxes |
$ | 31 | ||
| Other current liabilities |
91 | |||
|
|
|
|||
| Total current liabilities |
122 | |||
| Tax Receivable Agreement obligation |
596 | |||
|
|
|
|||
| Total liabilities |
718 | |||
| Total shareholders’ equity |
6,597 | |||
|
|
|
|||
| Total liabilities and equity |
$ | 7,315 | ||
|
|
|
|||
See Notes to the Condensed Financial Statements.
F-90
Table of Contents
NOTES TO CONDENSED FINANCIAL STATEMENTS
| 1. | BASIS OF PRESENTATION |
The accompanying unconsolidated condensed balance sheets, statements of net loss and cash flows present results of operations and cash flows of Vistra Energy Corp. (Parent). Certain information and footnote disclosures normally included in financial statements prepared in accordance with US GAAP have been omitted pursuant to the rules of the SEC. Because the unconsolidated condensed financial statements do not include all of the information and footnotes required by US GAAP, they should be read in conjunction with the financial statements and related notes of Vistra Energy Corp. and Subsidiaries included in the 2016 Annual Financial Statements. Vistra Energy Corp.‘s subsidiaries have been accounted for under the equity method. All dollar amounts in the financial statements and tables in the notes are stated in millions of US dollars unless otherwise indicated.
Vistra Energy Corp. (Parent) will file a consolidated US federal income tax return. All consolidated tax expenses/benefits and deferred tax assets/liabilities are recorded at Vistra Energy Corp. (Parent).
| 2. | RESTRICTIONS ON SUBSIDIARIES |
The agreement governing the Vistra Operations Credit Facilities (the Credit Facilities Agreement) generally restricts the ability of Vistra Operations to make distributions to any direct or indirect parent unless such distributions are expressly permitted thereunder. As of December 31, 2016, Vistra Operations Company LLC (Vistra Operations) can distribute approximately $1.1 billion to Vistra Energy Corp. (Parent) under the Credit Facilities Agreement without the consent of any party. Additionally, Vistra Operations may make distributions to Vistra Energy Corp. (Parent) in amounts sufficient for Vistra Energy Corp. (Parent) to make any payments required under the Tax Receivables Agreement or the Tax Matters Agreement or, to the extent arising out of Vistra Energy Corp.’s (Parent) ownership or operation of Vistra Operations, to pay any taxes or general operating or corporate overhead expenses.
| 3. | GUARANTEES |
As of December 31, 2016, there are no material outstanding guarantees at Vistra Energy Corp. (Parent).
| 4. | DIVIDEND RESTRICTIONS |
Under applicable law, Vistra Energy Corp. (Parent) is prohibited from paying any dividend to the extent that immediately following payment of such dividend there would be no statutory surplus or Vistra Energy Corp. (Parent) would be insolvent. On December 30, 2016, Vistra Energy Corp. (Parent) paid a special cash dividend in the aggregate amount of approximately $992 million to holders of record of its common stock on December 19, 2016.
Vistra Energy Corp. received $997 million in dividends from its consolidated subsidiaries in the Successor period from October 3, 2016 through December 31, 2016.
F-91
Table of Contents
PART II
INFORMATION NOT REQUIRED IN PROSPECTUS
Item 13. Other Expenses of Issuance and Distribution.
Expenses payable by the Company in connection with the sale of the common stock being registered, other than underwriting discount and commissions, are estimated as follows. All amounts except the SEC registration fee are estimated.
| SEC Registration Fee |
$ | 275,726.77 | ||
| Legal fees and expenses |
$ | 1,000,000 | ||
| Accounting fees and expenses |
$ | 500,000 | ||
| Printing of registration statement, prospectus, etc. |
$ | 325,000 | ||
|
|
|
|||
| Total |
$ | 2,100,726.77 | ||
|
|
|
Item 14. Indemnification of Directors and Officers.
Delaware General Corporation Law
Vistra Energy Corp. is incorporated under the laws of the state of Delaware.
Section 145(a) of the DGCL authorizes a corporation to indemnify any person who was or is a party, or is threatened to be made a party, to a threatened, pending or completed action, suit or proceeding, whether civil, criminal, administrative or investigative (other than an action by or in the right of the corporation), by reason of the fact that the person is or was a director, officer, employee or agent of the corporation, or is or was serving at the request of the corporation as a director, officer, employee or agent of another corporation, partnership, joint venture, trust or other enterprise, against expenses (including attorneys’ fees), judgments, fines and amounts paid in settlement actually and reasonably incurred by the person in connection with such action, suit or proceeding, if the person acted in good faith and in a manner the person reasonably believed to be in, or not opposed to, the best interests of the corporation and, with respect to any criminal action or proceeding, had no reasonable cause to believe the person’s conduct was unlawful.
Section 145(b) of the DGCL provides in relevant part that a corporation may indemnify any person who was or is a party or is threatened to be made a party to any threatened, pending or completed action or suit by or in the right of the corporation to procure a judgment in its favor by reason of the fact that the person is or was a director, officer, employee or agent of the corporation, or is or was serving at the request of the corporation as a director, officer, employee or agent of another corporation, partnership, joint venture, trust or other enterprise against expenses (including attorneys’ fees) actually and reasonably incurred by the person in connection with the defense or settlement of such action or suit if the person acted in good faith and in a manner the person reasonably believed to be in or not opposed to the best interests of the corporation and except that no indemnification shall be made in respect of any claim, issue or matter as to which such person shall have been adjudged to be liable to the corporation unless and only to the extent that the Court of Chancery or the court in which such action or suit was brought shall determine upon application that, despite the adjudication of liability but in view of all the circumstances of the case, such person is fairly and reasonably entitled to indemnity for such expenses which the Court of Chancery or such other court shall deem proper.
The DGCL also provides that indemnification under Sections 145(a) and (b) can only be made upon a determination that indemnification of the present or former director, officer or employee or agent is proper in the circumstances because such person has met the applicable standard of conduct set forth in Sections 145(a) and
II-1
Table of Contents
(b). Such determination shall be made, with respect to a person who is a director or officer at the time of such determination, (1) by a majority vote of directors who are not a party to the action at issue (even though less than a quorum), or (2) by a majority vote of a designated committee of these directors (even though less than a quorum), or (3) if there are no such directors, or these directors authorize, by the written opinion of independent legal counsel, or (4) by the stockholders.
Section 145(c) of the DGCL provides that to the extent a present or former director or officer of a corporation has been successful on the merits or otherwise in defense of any action, suit or proceeding referred to in Sections 145(a) or (b), or in defense of any claim, issue or matter therein, such person shall be indemnified against expenses (including attorney’s fees) actually and reasonably incurred by such person in connection therewith.
Section 145(e) of the DGCL provides that expenses (including attorneys’ fees) incurred by an officer or director of the corporation in defending any civil, criminal, administrative or investigative action, suit or proceeding may be paid by the corporation in advance of the final disposition of such action, suit or proceeding upon receipt of an undertaking by or on behalf of such director or officer to repay such amount if it shall ultimately be determined that such person is not entitled to be indemnified by the corporation as authorized in Section 145 of the DGCL. Such expenses (including attorneys’ fees) incurred by former directors and officers or other employees and agents of the corporation or by persons serving at the request of the corporation as directors, officers, employees or agents of another corporation, partnership, joint venture, trust or other enterprise may be so paid upon such terms and conditions, if any, as the corporation deems appropriate.
Section 145(g) of the DGCL also empowers a corporation to purchase and maintain insurance on behalf of any person who is or was a director, officer, employee or agent of the corporation, or is or was serving at the request of the corporation as a director, officer, employee or agent of another corporation, partnership, joint venture, trust or other enterprise against any liability asserted against such person and incurred by such person in any such capacity, or arising out of such person’s status as such, whether or not the corporation would have the power to indemnify such person against such liability under Section 145 of the DGCL.
Section 102(b)(7) of the DGCL permits a corporation to provide for eliminating or limiting the personal liability of one of its directors for any monetary damages related to a breach of fiduciary duty as a director, as long as the corporation does not eliminate or limit the liability of a director for (a) a breach of the director’s duty of loyalty to the corporation or its stockholders, (b) acts or omissions not in good faith or involving intentional misconduct or a knowing violation of law, (c) a violation of Section 174 of the DGCL (unlawful dividends) or (d) any transaction from which the director derived an improper personal benefit.
Article XII of the Charter eliminates the personal liability of Vistra Energy’s directors to the fullest extent permitted by the DGCL. Such section eliminates the personal liability of a director to Vistra Energy or our stockholders for monetary damages for breach of fiduciary duty as a director, except for liability (a) for any breach of the director’s duty of loyalty to Vistra Energy or our stockholders, (b) for acts or omissions not in good faith or which involve intentional misconduct or a knowing violation of law, (c) under Section 174 of the DGCL (unlawful dividends), or (d) for any transaction from which the director derived an improper personal benefit. Under the Bylaws, Vistra Energy agrees that it is the indemnitor of first resort to provide advancement of expenses or indemnification to directors and officers.
Article VI of the Bylaws provides that Vistra Energy shall indemnify and hold harmless each person who was or is made a party or is threatened to be made a party to, or was or is otherwise involved in, any action, suit, arbitration, alternative dispute mechanism, inquiry, judicial, administrative or legislative hearing, investigation or other threatened, pending or completed proceeding, whether brought by or in the right of Vistra Energy or otherwise, including any and all appeals, whether of a civil, criminal, administrative, legislative, investigative or other nature by reason of the fact that he or she is or was a director, an officer, or while a director or officer of Vistra Energy is or was serving at the request of Vistra Energy as a director, officer, employee, agent or trustee
II-2
Table of Contents
of another corporation or of a partnership, joint venture, trust or other enterprise, including service with respect to an employee benefit plan, to the fullest extent authorized by applicable law, including, without limitation, the DGCL. Under the Bylaws, except as otherwise required by law, Vistra Energy shall indemnify an officer or director in connection with a proceeding initiated by the officer or director, only if such proceeding or part thereof was authorized or ratified by the Board.
Indemnification Agreements
We have entered into indemnification agreements with each of our officers and directors that provide, in general, that we will indemnify them to the fullest extent permitted by law in connection with their service to us or on our behalf.
Directors’ and Officers’ Liability Insurance
We have obtained directors’ and officers’ liability insurance which insures against certain liabilities that our directors and officers may, in such capacities, incur.
Item 15. Recent Sales of Unregistered Securities.
On the Effective Date, Vistra Energy issued 427,500,000 shares of common stock in reliance on the exemption provided by Section 1145 of the Bankruptcy Code to holders of certain claims against our Predecessor in exchange for the cancellation of such claims. Also on the Effective Date, Vistra Energy issued 427,500,000 TRA Rights pursuant to Regulation D and Regulation S promulgated under the Securities Act into an escrow account primarily for distribution to former holders of claims against our Predecessor or to settle future disputes in connection with the Plan.
On October 25, 2016, Vistra Energy sold 80,231 shares of common stock to Curtis A. Morgan at a price per share of $15.58 pursuant to a stock purchase agreement in reliance on Section 4(a)(2) and Rule 506 of Regulation D of the Securities Act.
Item 16. Exhibits and Financial Statement Schedules.
(a) Exhibit Index
See the Exhibit Index following the signature page.
(b) Financial Statement Schedule
Schedule I — Condensed Financial Information of Vistra Energy Corp. (included at page F-89 of the prospectus).
Item 17. Undertakings.
(a) The undersigned Registrant hereby undertakes:
(1) To file, during any period in which offers or sales are being made, a post-effective amendment to this registration statement:
(i) To include any prospectus required by Section 10(a)(3) of the Securities Act of 1933;
(ii) To reflect in the prospectus any facts or events arising after the effective date of the registration statement (or the most recent post-effective amendment thereof) which, individually or in the aggregate, represent a fundamental change in the information set forth in the registration statement. Notwithstanding the foregoing, any increase or decrease in volume of securities offered (if the total dollar value of securities offered would not exceed that which was registered) and any deviation from the low or high end of the
II-3
Table of Contents
estimated maximum offering range may be reflected in the form of prospectus filed with the Commission pursuant to Rule 424(b) if, in the aggregate, the changes in volume and price represent no more than 20 percent change in the maximum aggregate offering price set forth in the “Calculation of Registration Fee” table in the effective registration statement;
(iii) To include any material information with respect to the plan of distribution not previously disclosed in the registration statement or any material change to such information in the registration statement.
(2) That, for the purpose of determining any liability under the Securities Act of 1933, each such post-effective amendment shall be deemed to be a new registration statement relating to the securities offered therein, and the offering of such securities at that time shall be deemed to be the initial bona fide offering thereof.
(3) To remove from registration by means of a post-effective amendment any of the securities being registered which remain unsold at the termination of the offering.
(b) Insofar as indemnification for liabilities arising under the Securities Act of 1933 may be permitted to directors, officers and controlling persons of the registrant pursuant to the foregoing provisions, or otherwise, the registrant has been advised that in the opinion of the Securities and Exchange Commission such indemnification is against public policy as expressed in the Act and is, therefore, unenforceable. In the event that a claim for indemnification against such liabilities (other than the payment by the registrant of expenses incurred or paid by a director, officer or controlling person of the registrant in the successful defense of any action, suit or proceeding) is asserted by such director, officer or controlling person in connection with the securities being registered, the registrant will, unless in the opinion of its counsel the matter has been settled by controlling precedent, submit to a court of appropriate jurisdiction the question whether such indemnification by it is against public policy as expressed in the Act and will be governed by the final adjudication of such issue.
II-4
Table of Contents
SIGNATURES
Pursuant to the requirements of the Securities Act of 1933, the registrant has duly caused this registration statement to be signed on its behalf by the undersigned, thereunto duly authorized in the City of Dallas, State of Texas on May 1, 2017.
| Vistra Energy Corp. (Registrant) | ||
| By: |
/s/ Curtis A. Morgan | |
| Name: Curtis A. Morgan | ||
| Title: President and Chief Executive Officer | ||
Pursuant to the requirements of the Securities Act of 1933, this registration statement has been signed below by the following persons in the capacities and on the dates indicated:
| Name |
Title |
Date | ||
| /s/ Curtis A. Morgan Curtis A. Morgan |
Director, President and Chief Executive Officer (Principal Executive Officer) |
May 1, 2017 | ||
| * J. William Holden |
Executive Vice President and Chief Financial Officer (Principal Financial Officer and Principal Accounting Officer) |
May 1, 2017 | ||
| * Gavin R. Baiera |
Director | May 1, 2017 | ||
| * Jennifer Box |
Director | May 1, 2017 | ||
| * Jeff Hunter |
Director | May 1, 2017 | ||
| * Cyrus Madon |
Director | May 1, 2017 | ||
| * Geoff Strong |
Director | May 1, 2017 | ||
| * By: | /s/ Curtis A. Morgan | |
| Name: | Curtis A. Morgan | |
| Title: | Attorney-in-Fact |
Table of Contents
INDEX OF EXHIBITS
| Exhibit |
Description | |
| 2.1* | Order of the United States Bankruptcy Court for the District of Delaware Confirming the Third Amended Joint Plan of Reorganization | |
| 3.1* | Certificate of Incorporation of TCEH Corp. (now known as Vistra Energy Corp.), dated October 3, 2016 | |
| 3.2* | Certificate of Amendment of Certificate of Incorporation of TCEH Corp. (now known as Vistra Energy Corp.), dated November 2, 2016 | |
| 3.3* | Restated Bylaws of Vistra Energy Corp., dated November 4, 2016 | |
| 4.1* | Registration Rights Agreement, by and among TCEH Corp. (now known as Vistra Energy Corp.) and the Holders party thereto, dated as of October 3, 2016 | |
| 5.1 | Opinion of Sidley Austin LLP | |
| 10.1* | Credit Agreement, by and among TEX Intermediate Company LLC (now known as Vistra Intermediate Company LLC), TEX Operations Company LLC (now known as Vistra Operations LLC) and its subsidiary guarantors named therein, the lenders party thereto from time to time, and Deutsche Bank AG, New York Branch, as administrative and collateral agent, dated as of October 3, 2016 | |
| 10.2* | Amendment to Credit Agreement, dated December 14, 2016 | |
| 10.3* | Second Amendment to Credit Agreement, dated February 1, 2017 | |
| 10.4* | Third Amendment to Credit Agreement, dated February 28, 2017 | |
| 10.5* | Collateral Trust Agreement, by and among TEX Operations Company LLC (now known as Vistra Operations LLC), the Grantors from time to time thereto, Railroad Commission of Texas, as first-out representative, and Deutsche Bank AG, New York Branch, as senior credit agreement representative, dated as of October 3, 2016 | |
| 10.6* | 2016 Omnibus Incentive Plan | |
| 10.7* | Form of Option Award Agreement (Management) for 2016 Omnibus Incentive Plan | |
| 10.8* | Form of Restricted Stock Unit Award Agreement (Management) for 2016 Omnibus Incentive Plan | |
| 10.9* | Vistra Energy Corp Executive Annual Incentive Plan | |
| 10.10* | Stockholder’s Agreement, by and between TCEH Corp. (now known as Vistra Energy Corp.) and Apollo Management Holdings, L.P., dated as of October 3, 2016 | |
| 10.11* | Stockholder’s Agreement, by and between TCEH Corp. (now known as Vistra Energy Corp.) and Brookfield Asset Management Private Institutional Capital Adviser (Canada), dated as of October 3, 2016 | |
| 10.12* | Stockholder’s Agreement, by and between TCEH Corp. (now known as Vistra Energy Corp.) and Oaktree Capital Management, L.P. and certain of its affiliated entities, dated as of October 3, 2016 | |
| 10.13* | Tax Receivable Agreement, by and between TEX Energy LLC (now known as Vistra Energy Corp.) and American Stock Transfer & Trust Company, as transfer agent, dated as of October 3, 2016 | |
| 10.14* | Tax Matters Agreement, by and among TEX Energy LLC (now known as Vistra Energy Corp.), Energy Future Holdings Corp., Energy Future Intermediate Holding Company LLC, EFI Finance Inc. and EFH Merger Co. LLC, dated as of October 3, 2016 | |
| 10.15* | Transition Services Agreement, by and between Energy Future Holdings Corp. and TEX Operations Company LLC (now known as Vistra Operations Company LLC), dated as of October 3, 2016 | |
Table of Contents
| Exhibit |
Description | |
| 10.16* | Separation Agreement, by and between Energy Future Holdings Corp., TEX Energy LLC (now known as Vistra Energy Corp.) and TEX Operations Company LLC (now known as Vistra Operations LLC), dated as of October 3, 2016 | |
| 10.17* | Purchase and Sale Agreement, dated as of November 25, 2015, by and between La Frontera Ventures, LLC and Luminant Holding Company LLC | |
| 10.18* | Amended and Restated Split Participant Agreement, by and between Oncor Electric Delivery Company LLC (f/k/a TXU Electric Delivery Company) and TEX Operations Company LLC (now known as Vistra Operations Company LLC), dated as of October 3, 2016 | |
| 10.19* | Employment Agreement between Curtis A. Morgan and Vistra Energy Corp., effective as of October 4, 2016 | |
| 10.20* | Employment Agreement between James A. Burke and Vistra Energy Corp., effective as of October 4, 2016 | |
| 10.21* | Employment Agreement between William Holden and Vistra Energy Corp., effective as of December 5, 2016 | |
| 10.22* | Employment Agreement between Stephanie Zapata Moore and Vistra Energy Corp., effective as of October 4, 2016 | |
| 10.23* | Employment Agreement between Carrie Lee Kirby and Vistra Energy Corp., effective as of October 4, 2016 | |
| 10.24* | Employment Agreement between Sara Graziano and Vistra Energy Corp., effective as of October 4, 2016 | |
| 10.25* | General Release Agreement, dated as of January 31, 2017, by and between Michael Liebelson and Vistra Energy Corp. | |
| 10.26* | Form of indemnification agreement with directors | |
| 10.27* | Lease Agreement, dated February 14, 2002, between State Street Bank and Trust Company of Connecticut, National Association, an owner trustee of ZSF/Dallas Tower Trust, a Delaware grantor trust, as lessor and EFH Properties Company (now known as Vistra EP Properties Company), as Lessee (Energy Plaza Property) | |
| 10.28* | First Amendment, dated June 1, 2007, to Lease Agreement, dated February 14, 2002 | |
| 10.29* | Stock Purchase Agreement, dated as of October 25, 2016, by and between TCEH Corp. (now known as Vistra Energy Corp.) and Curtis A. Morgan | |
| 21.1 | Subsidiaries of Vistra Energy | |
| 23.1 | Consent of Deloitte & Touche LLP | |
| 23.2* | Consent of Sidley Austin LLP (included in Exhibit 5.1) | |
| 24.1* | Powers of Attorney (included in signature pages hereto) | |
| * | Previously filed. |