Attached files
| file | filename |
|---|---|
| EX-99.1 - EXHIBIT 99.1 - NOBLE ENERGY INC | nbl-20170331xearningsrelea.htm |
| 8-K - 8-K - NOBLE ENERGY INC | nbl-20170331x8kearningsrel.htm |
NBL
First Quarter 2017 Supplement
May 2017
2NBL
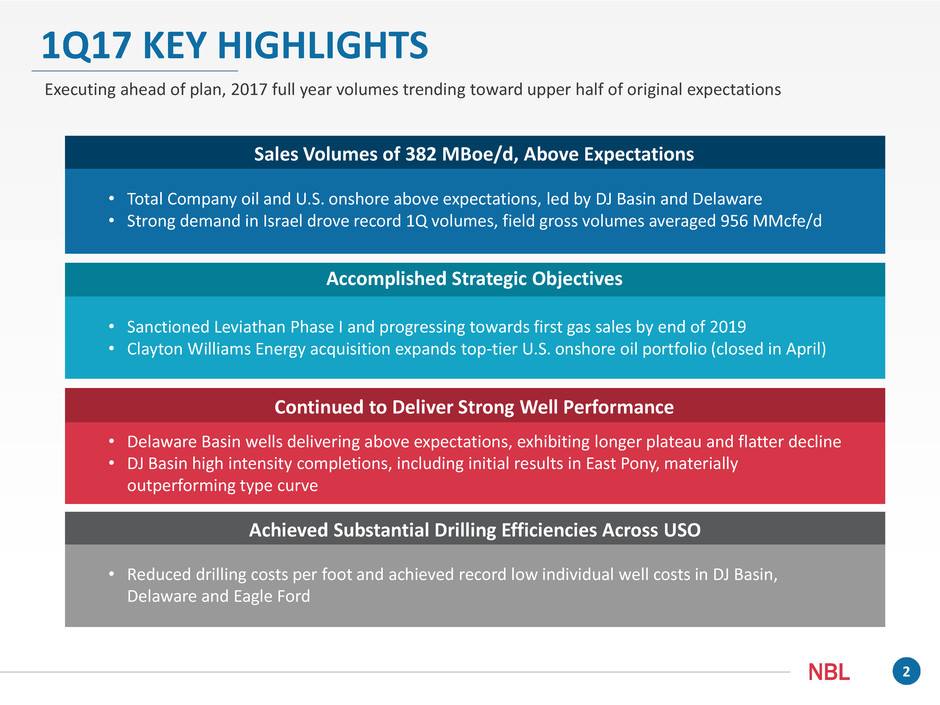
1Q17 KEY HIGHLIGHTS
Executing ahead of plan, 2017 full year volumes trending toward upper half of original expectations
Sales Volumes of 382 MBoe/d, Above Expectations
Continued to Deliver Strong Well Performance
Achieved Substantial Drilling Efficiencies Across USO
Accomplished Strategic Objectives
• Total Company oil and U.S. onshore above expectations, led by DJ Basin and Delaware
• Strong demand in Israel drove record 1Q volumes, field gross volumes averaged 956 MMcfe/d
• Sanctioned Leviathan Phase I and progressing towards first gas sales by end of 2019
• Clayton Williams Energy acquisition expands top-tier U.S. onshore oil portfolio (closed in April)
• Delaware Basin wells delivering above expectations, exhibiting longer plateau and flatter decline
• DJ Basin high intensity completions, including initial results in East Pony, materially
outperforming type curve
• Reduced drilling costs per foot and achieved record low individual well costs in DJ Basin,
Delaware and Eagle Ford
3NBL
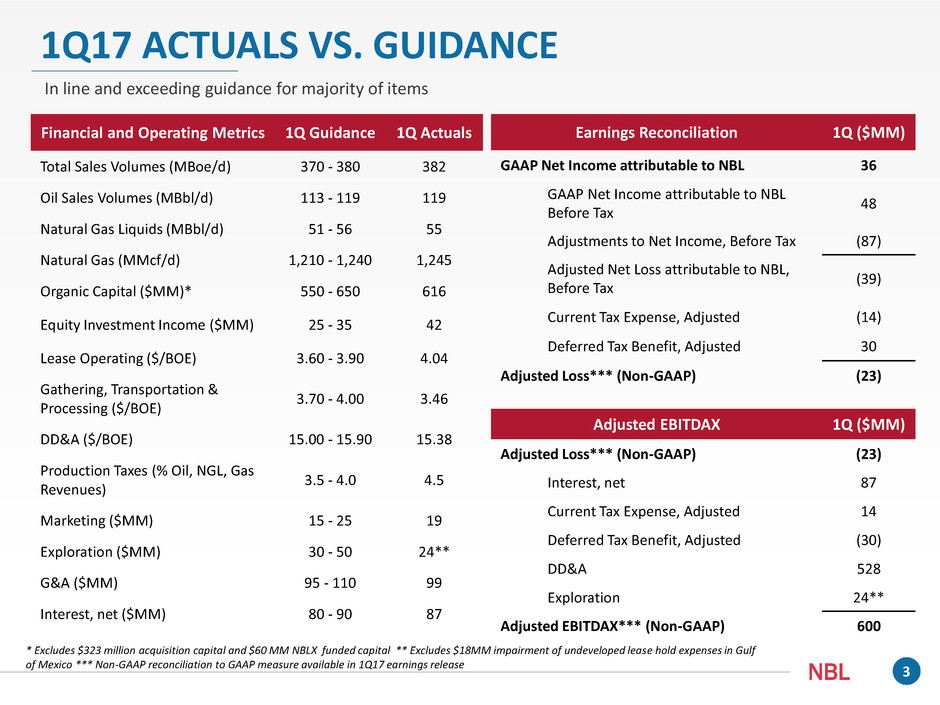
1Q17 ACTUALS VS. GUIDANCE
In line and exceeding guidance for majority of items
Financial and Operating Metrics 1Q Guidance 1Q Actuals
Total Sales Volumes (MBoe/d) 370 - 380 382
Oil Sales Volumes (MBbl/d) 113 - 119 119
Natural Gas Liquids (MBbl/d) 51 - 56 55
Natural Gas (MMcf/d) 1,210 - 1,240 1,245
Organic Capital ($MM)* 550 - 650 616
Equity Investment Income ($MM) 25 - 35 42
Lease Operating ($/BOE) 3.60 - 3.90 4.04
Gathering, Transportation &
Processing ($/BOE)
3.70 - 4.00 3.46
DD&A ($/BOE) 15.00 - 15.90 15.38
Production Taxes (% Oil, NGL, Gas
Revenues)
3.5 - 4.0 4.5
Marketing ($MM) 15 - 25 19
Exploration ($MM) 30 - 50 24**
G&A ($MM) 95 - 110 99
Interest, net ($MM) 80 - 90 87
Earnings Reconciliation 1Q ($MM)
GAAP Net Income attributable to NBL 36
GAAP Net Income attributable to NBL
Before Tax
48
Adjustments to Net Income, Before Tax (87)
Adjusted Net Loss attributable to NBL,
Before Tax
(39)
Current Tax Expense, Adjusted (14)
Deferred Tax Benefit, Adjusted 30
Adjusted Loss*** (Non-GAAP) (23)
Adjusted EBITDAX 1Q ($MM)
Adjusted Loss*** (Non-GAAP) (23)
Interest, net 87
Current Tax Expense, Adjusted 14
Deferred Tax Benefit, Adjusted (30)
DD&A 528
Exploration 24**
Adjusted EBITDAX*** (Non-GAAP) 600
* Excludes $323 million acquisition capital and $60 MM NBLX funded capital ** Excludes $18MM impairment of undeveloped lease hold expenses in Gulf
of Mexico *** Non-GAAP reconciliation to GAAP measure available in 1Q17 earnings release
4NBL
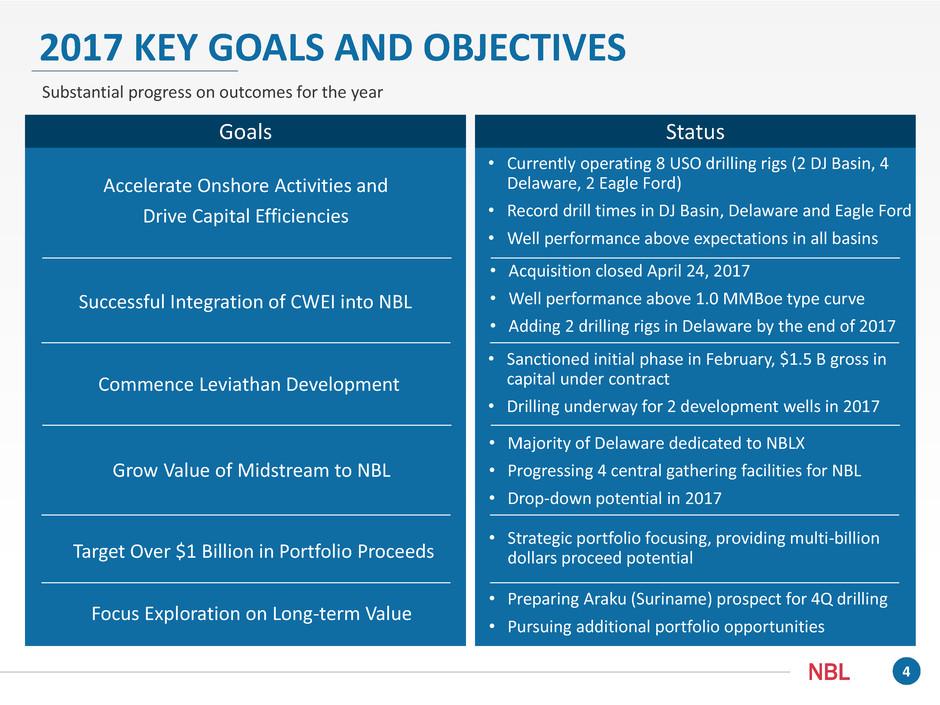
2017 KEY GOALS AND OBJECTIVES
Substantial progress on outcomes for the year
Accelerate Onshore Activities and
Drive Capital Efficiencies
• Currently operating 8 USO drilling rigs (2 DJ Basin, 4
Delaware, 2 Eagle Ford)
• Record drill times in DJ Basin, Delaware and Eagle Ford
• Well performance above expectations in all basins
Goals Status
Successful Integration of CWEI into NBL
Commence Leviathan Development
Target Over $1 Billion in Portfolio Proceeds
Focus Exploration on Long-term Value
• Acquisition closed April 24, 2017
• Well performance above 1.0 MMBoe type curve
• Adding 2 drilling rigs in Delaware by the end of 2017
• Sanctioned initial phase in February, $1.5 B gross in
capital under contract
• Drilling underway for 2 development wells in 2017
• Majority of Delaware dedicated to NBLX
• Progressing 4 central gathering facilities for NBL
• Drop-down potential in 2017
Grow Value of Midstream to NBL
• Preparing Araku (Suriname) prospect for 4Q drilling
• Pursuing additional portfolio opportunities
• Strategic portfolio focusing, providing multi-billion
dollars proceed potential
5NBL
U.S. ONSHORE
Accelerating activity in liquids-rich basins
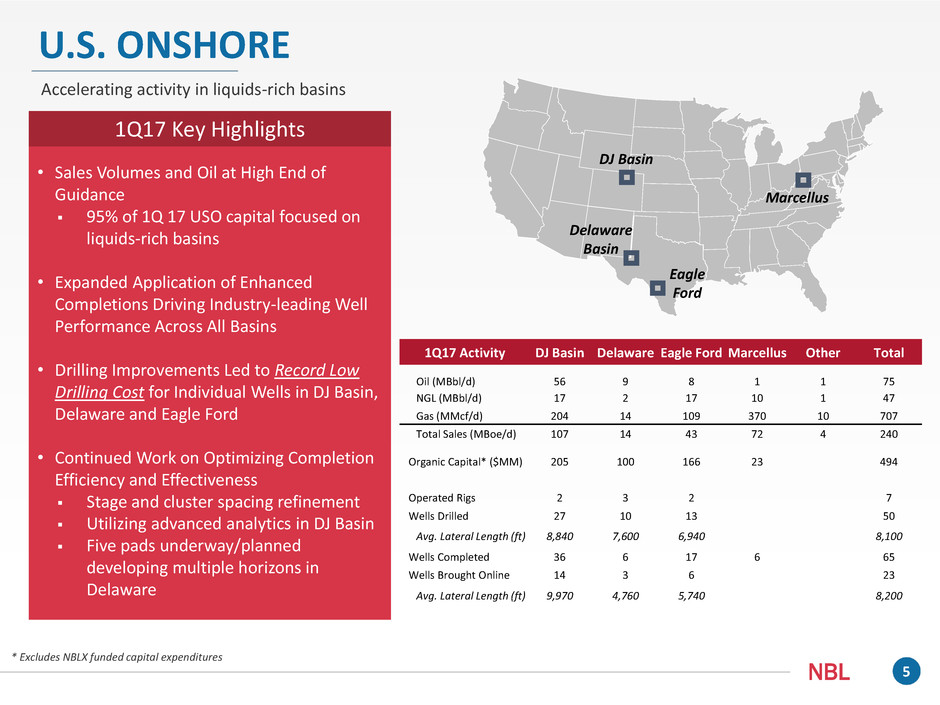
1Q17 Activity DJ Basin Delaware Eagle Ford Marcellus Other Total
Oil (MBbl/d) 56 9 8 1 1 75
NGL (MBbl/d) 17 2 17 10 1 47
Gas (MMcf/d) 204 14 109 370 10 707
Total Sales (MBoe/d) 107 14 43 72 4 240
Organic Capital* ($MM) 205 100 166 23 494
Operated Rigs 2 3 2 7
Wells Drilled 27 10 13 50
Avg. Lateral Length (ft) 8,840 7,600 6,940 8,100
Wells Completed 36 6 17 6 65
Wells Brought Online 14 3 6 23
Avg. Lateral Length (ft) 9,970 4,760 5,740 8,200
DJ Basin
Delaware
Basin
Marcellus
Eagle
Ford
1Q17 Key Highlights
• Sales Volumes and Oil at High End of
Guidance
95% of 1Q 17 USO capital focused on
liquids-rich basins
• Expanded Application of Enhanced
Completions Driving Industry-leading Well
Performance Across All Basins
• Drilling Improvements Led to Record Low
Drilling Cost for Individual Wells in DJ Basin,
Delaware and Eagle Ford
• Continued Work on Optimizing Completion
Efficiency and Effectiveness
Stage and cluster spacing refinement
Utilizing advanced analytics in DJ Basin
Five pads underway/planned
developing multiple horizons in
Delaware
* Excludes NBLX funded capital expenditures
6NBL
U.S. ONSHORE CATALYST-RICH 2017
U.S. onshore oil projected at high end of original expectations
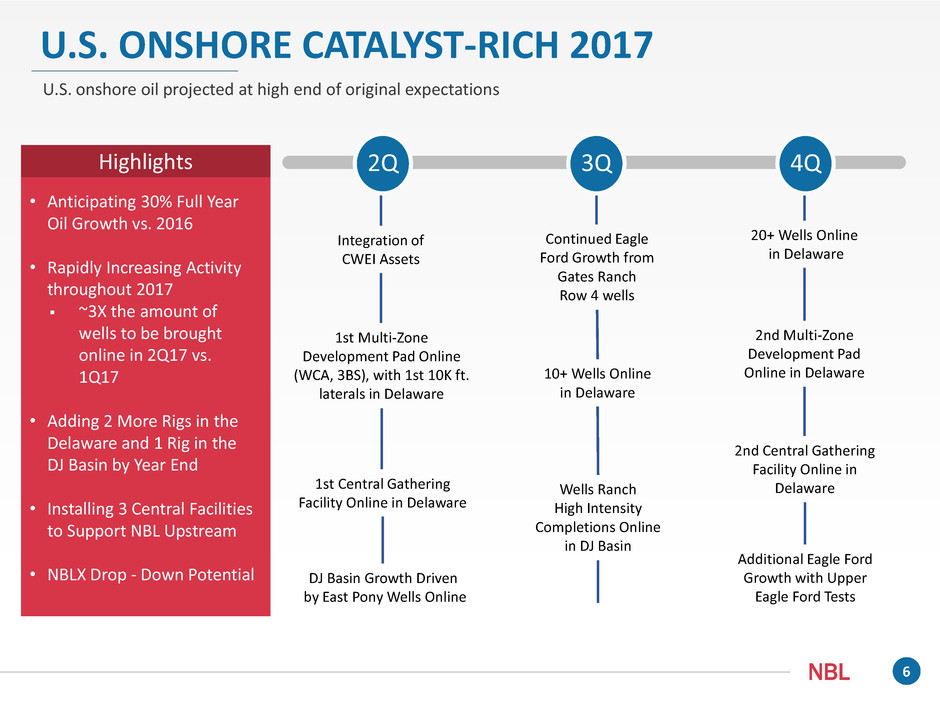
2Q
Integration of
CWEI Assets
1st Multi-Zone
Development Pad Online
(WCA, 3BS), with 1st 10K ft.
laterals in Delaware
10+ Wells Online
in Delaware
1st Central Gathering
Facility Online in Delaware
Wells Ranch
High Intensity
Completions Online
in DJ Basin
20+ Wells Online
in Delaware
2nd Multi-Zone
Development Pad
Online in Delaware
4Q3Q
DJ Basin Growth Driven
by East Pony Wells Online
Additional Eagle Ford
Growth with Upper
Eagle Ford Tests
Highlights
• Anticipating 30% Full Year
Oil Growth vs. 2016
• Rapidly Increasing Activity
throughout 2017
~3X the amount of
wells to be brought
online in 2Q17 vs.
1Q17
• Adding 2 More Rigs in the
Delaware and 1 Rig in the
DJ Basin by Year End
• Installing 3 Central Facilities
to Support NBL Upstream
• NBLX Drop - Down Potential
2nd Central Gathering
Facility Online in
Delaware
Continued Eagle
Ford Growth from
Gates Ranch
Row 4 wells
7NBL
DELAWARE BASIN
Accelerating value in top-tier Southern Delaware position
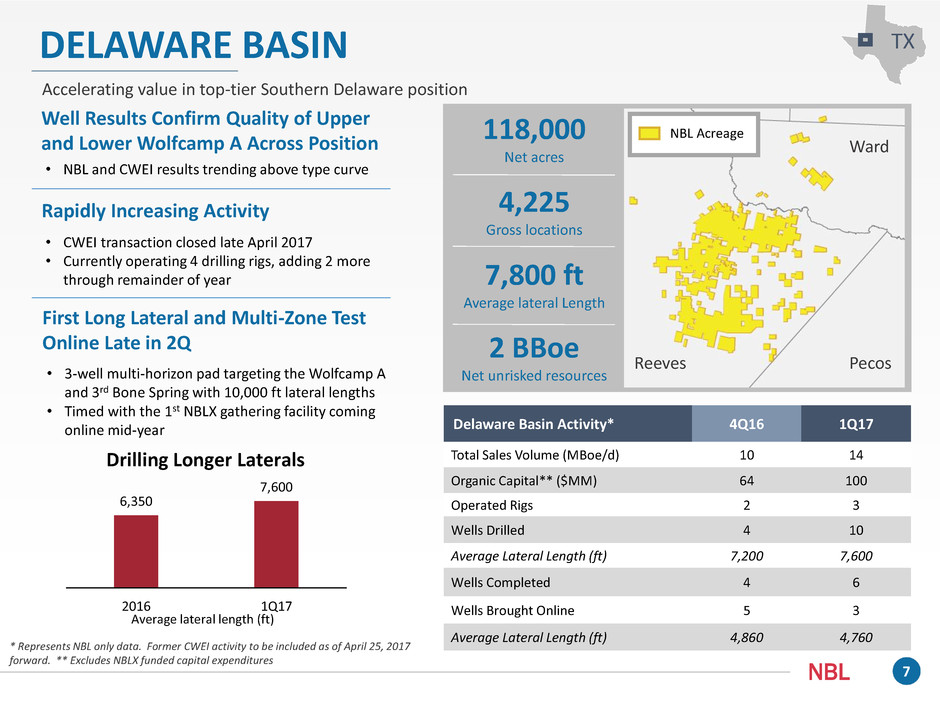
Delaware Basin Activity* 4Q16 1Q17
Total Sales Volume (MBoe/d) 10 14
Organic Capital** ($MM) 64 100
Operated Rigs 2 3
Wells Drilled 4 10
Average Lateral Length (ft) 7,200 7,600
Wells Completed 4 6
Wells Brought Online 5 3
Average Lateral Length (ft) 4,860 4,760
118,000
Net acres
4,225
Gross locations
7,800 ft
Average lateral Length
2 BBoe
Net unrisked resources
Rapidly Increasing Activity
• CWEI transaction closed late April 2017
• Currently operating 4 drilling rigs, adding 2 more
through remainder of year
First Long Lateral and Multi-Zone Test
Online Late in 2Q
• 3-well multi-horizon pad targeting the Wolfcamp A
and 3rd Bone Spring with 10,000 ft lateral lengths
• Timed with the 1st NBLX gathering facility coming
online mid-year
6,350
7,600
2016 1Q17
Drilling Longer Laterals
* Represents NBL only data. Former CWEI activity to be included as of April 25, 2017
forward. ** Excludes NBLX funded capital expenditures
Average lateral length (ft)
Well Results Confirm Quality of Upper
and Lower Wolfcamp A Across Position
• NBL and CWEI results trending above type curve
TX
NBL Acreage
Ward
Reeves Pecos
8NBL
0
50
100
150
200
250
0 20 40 60 80 100 120
Days on Production
2016 Average (8 wells) 1Q17 Average (3 wells)
WCA 1.2 MMBoe Type Curve
DELAWARE BASIN
Industry-leading well performance
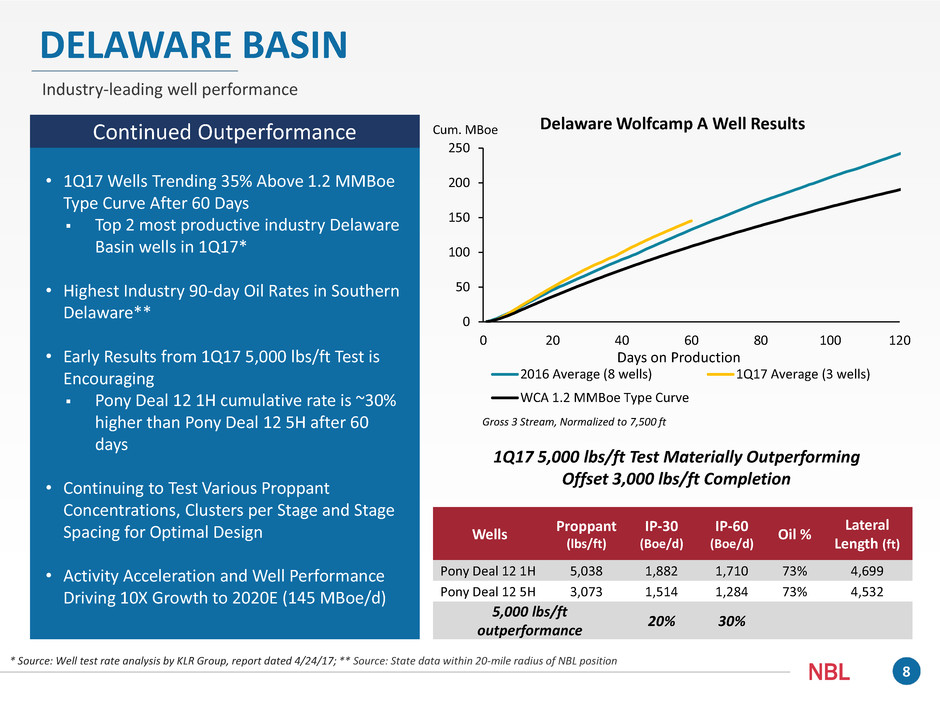
Continued Outperformance
• 1Q17 Wells Trending 35% Above 1.2 MMBoe
Type Curve After 60 Days
Top 2 most productive industry Delaware
Basin wells in 1Q17*
• Highest Industry 90-day Oil Rates in Southern
Delaware**
• Early Results from 1Q17 5,000 lbs/ft Test is
Encouraging
Pony Deal 12 1H cumulative rate is ~30%
higher than Pony Deal 12 5H after 60
days
• Continuing to Test Various Proppant
Concentrations, Clusters per Stage and Stage
Spacing for Optimal Design
• Activity Acceleration and Well Performance
Driving 10X Growth to 2020E (145 MBoe/d)
Wells
Proppant
(lbs/ft)
IP-30
(Boe/d)
IP-60
(Boe/d)
Oil %
Lateral
Length (ft)
Pony Deal 12 1H 5,038 1,882 1,710 73% 4,699
Pony Deal 12 5H 3,073 1,514 1,284 73% 4,532
5,000 lbs/ft
outperformance
20% 30%
Gross 3 Stream, Normalized to 7,500 ft
Cum. MBoe
1Q17 5,000 lbs/ft Test Materially Outperforming
Offset 3,000 lbs/ft Completion
* Source: Well test rate analysis by KLR Group, report dated 4/24/17; ** Source: State data within 20-mile radius of NBL position
Delaware Wolfcamp A Well Results
9NBL
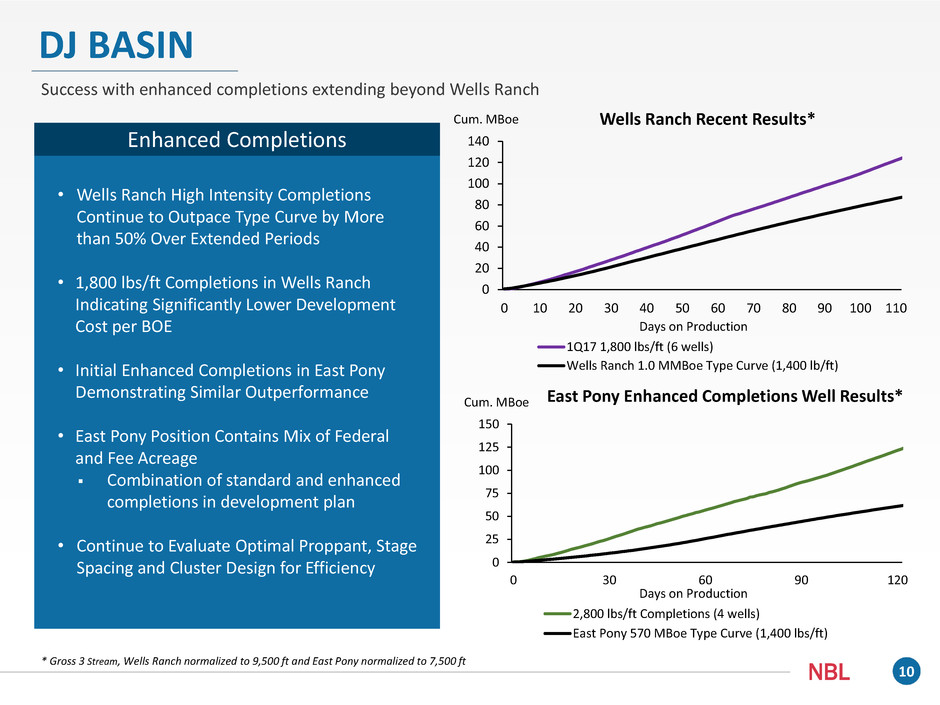
DJ BASIN
Rapidly accelerating rate of change
CO
352,000
Net acres
3,220
Gross locations
8,400 ft
Average lateral Length
2 BBoe
Net unrisked resources
DJ Basin Activity 4Q16 1Q17
Total Sales Volume (MBoe/d) 112 107
Organic Capital* ($MM) 164 205
Operated Rigs 2 2
Wells Drilled 33 27
Average Lateral Length (ft) 5,560 8,840
Wells Completed 20 36
Wells Brought Online 16 14
Average Lateral Length (ft) 8,400 9,970
Enhanced Capital Efficiency with
Increased 2017 Volume Outlook
• Record low drill times and reduced frac cycle times
• More than doubling wells online in 2Q17 vs. 1Q17
Extending Success of High Intensity
Completions Across Basin
Activity in Low GOR Areas Driving
Increased Oil Percentage
• East Pony pilot substantially outperforming type curve
• Combined Wells Ranch and East Pony volumes up 3%
from 4Q16 at 62 MBoe/d
• Total horizontal volumes at 90 MBoe/d for 1Q17
46%
49%
50%
52%
2Q16 3Q16 4Q16 1Q17
Increasing Oil Mix
* Excludes NBLX funded capital expenditures
Weld
Wells
Ranch
East
Pony
NBL Acreage
10NBL
0
20
40
60
80
100
120
140
0 10 20 30 40 50 60 70 80 90 100 110
Days on Production
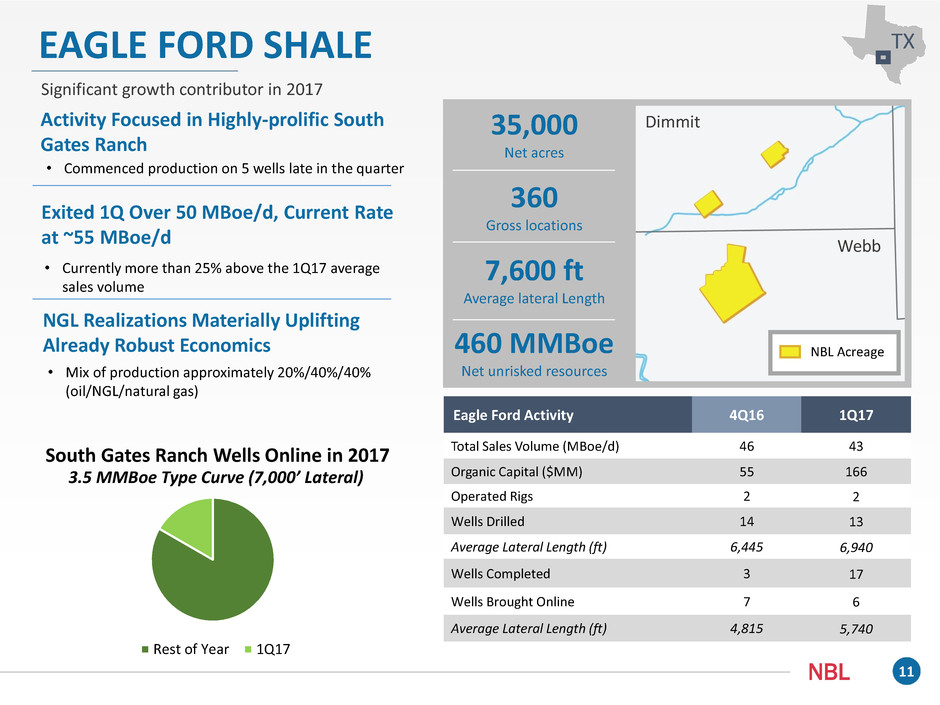
Wells Ranch Recent Results*
1Q17 1,800 lbs/ft (6 wells)
Wells Ranch 1.0 MMBoe Type Curve (1,400 lb/ft)
DJ BASIN
Success with enhanced completions extending beyond Wells Ranch
Enhanced Completions
• Wells Ranch High Intensity Completions
Continue to Outpace Type Curve by More
than 50% Over Extended Periods
• 1,800 lbs/ft Completions in Wells Ranch
Indicating Significantly Lower Development
Cost per BOE
• Initial Enhanced Completions in East Pony
Demonstrating Similar Outperformance
• East Pony Position Contains Mix of Federal
and Fee Acreage
Combination of standard and enhanced
completions in development plan
• Continue to Evaluate Optimal Proppant, Stage
Spacing and Cluster Design for Efficiency 0
25
50
75
100
125
150
0 30 60 90 120
Days on Production
East Pony Enhanced Completions Well Results*
2,800 lbs/ft Completions (4 wells)
East Pony 570 MBoe Type Curve (1,400 lbs/ft)
* Gross 3 Stream, Wells Ranch normalized to 9,500 ft and East Pony normalized to 7,500 ft
Cum. MBoe
Cum. MBoe
11NBL
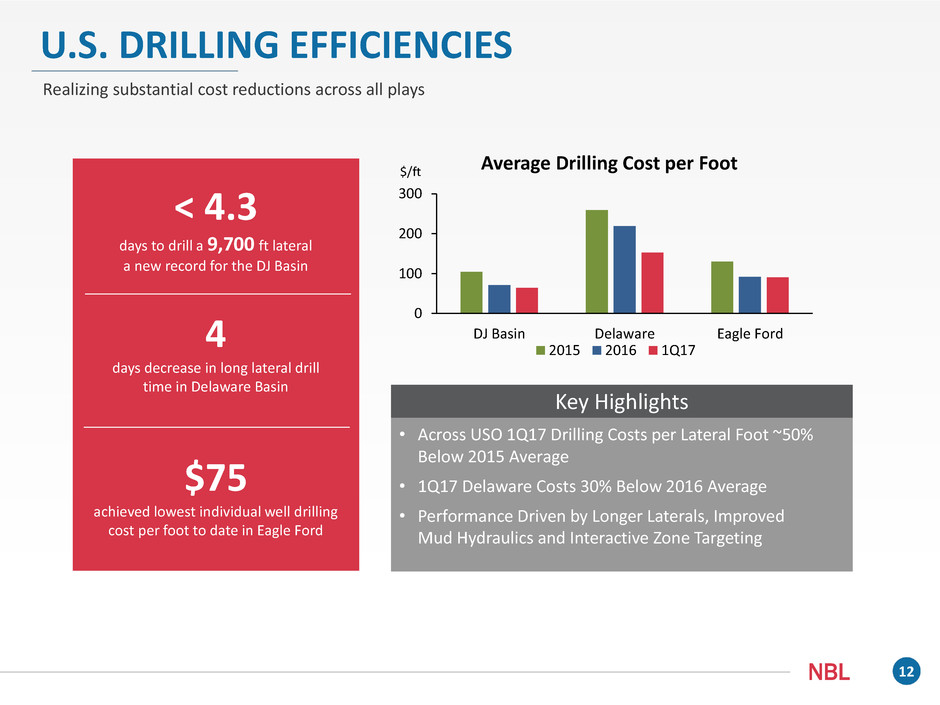
EAGLE FORD SHALE
Significant growth contributor in 2017
TX
Eagle Ford Activity 4Q16 1Q17
Total Sales Volume (MBoe/d) 46 43
Organic Capital ($MM) 55 166
Operated Rigs 2 2
Wells Drilled 14 13
Average Lateral Length (ft) 6,445 6,940
Wells Completed 3 17
Wells Brought Online 7 6
Average Lateral Length (ft) 4,815 5,740
35,000
Net acres
360
Gross locations
7,600 ft
Average lateral Length
460 MMBoe
Net unrisked resources
Activity Focused in Highly-prolific South
Gates Ranch
• Commenced production on 5 wells late in the quarter
Exited 1Q Over 50 MBoe/d, Current Rate
at ~55 MBoe/d
NGL Realizations Materially Uplifting
Already Robust Economics
• Currently more than 25% above the 1Q17 average
sales volume
• Mix of production approximately 20%/40%/40%
(oil/NGL/natural gas)
NBL Acreage
3.5 MMBoe Type Curve (7,000’ Lateral)
Dimmit
Webb
South Gates Ranch Wells Online in 2017
Rest of Year 1Q17
12NBL
U.S. DRILLING EFFICIENCIES
Realizing substantial cost reductions across all plays
• Across USO 1Q17 Drilling Costs per Lateral Foot ~50%
Below 2015 Average
• 1Q17 Delaware Costs 30% Below 2016 Average
• Performance Driven by Longer Laterals, Improved
Mud Hydraulics and Interactive Zone Targeting
< 4.3
days to drill a 9,700 ft lateral
a new record for the DJ Basin
4
days decrease in long lateral drill
time in Delaware Basin
$75
achieved lowest individual well drilling
cost per foot to date in Eagle Ford
0
100
200
300
DJ Basin Delaware Eagle Ford
2015 2016 1Q17
Average Drilling Cost per Foot
Key Highlights
$/ft
13NBL
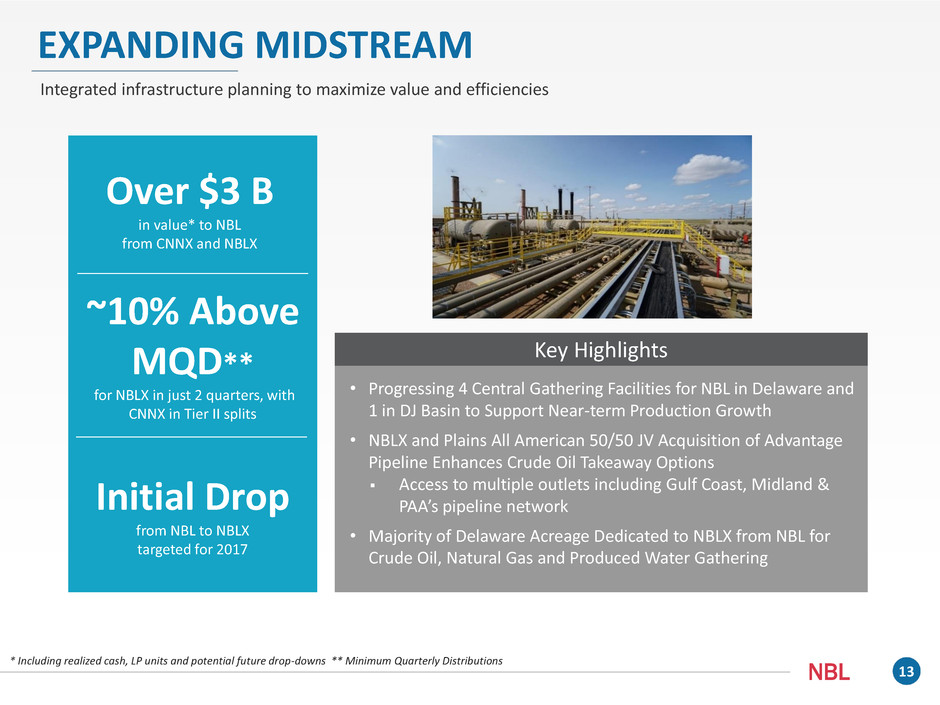
EXPANDING MIDSTREAM
Integrated infrastructure planning to maximize value and efficiencies
Over $3 B
in value* to NBL
from CNNX and NBLX
~10% Above
MQD**
for NBLX in just 2 quarters, with
CNNX in Tier II splits
Initial Drop
from NBL to NBLX
targeted for 2017
• Progressing 4 Central Gathering Facilities for NBL in Delaware and
1 in DJ Basin to Support Near-term Production Growth
• NBLX and Plains All American 50/50 JV Acquisition of Advantage
Pipeline Enhances Crude Oil Takeaway Options
Access to multiple outlets including Gulf Coast, Midland &
PAA’s pipeline network
• Majority of Delaware Acreage Dedicated to NBLX from NBL for
Crude Oil, Natural Gas and Produced Water Gathering
Key Highlights
* Including realized cash, LP units and potential future drop-downs ** Minimum Quarterly Distributions
14NBL
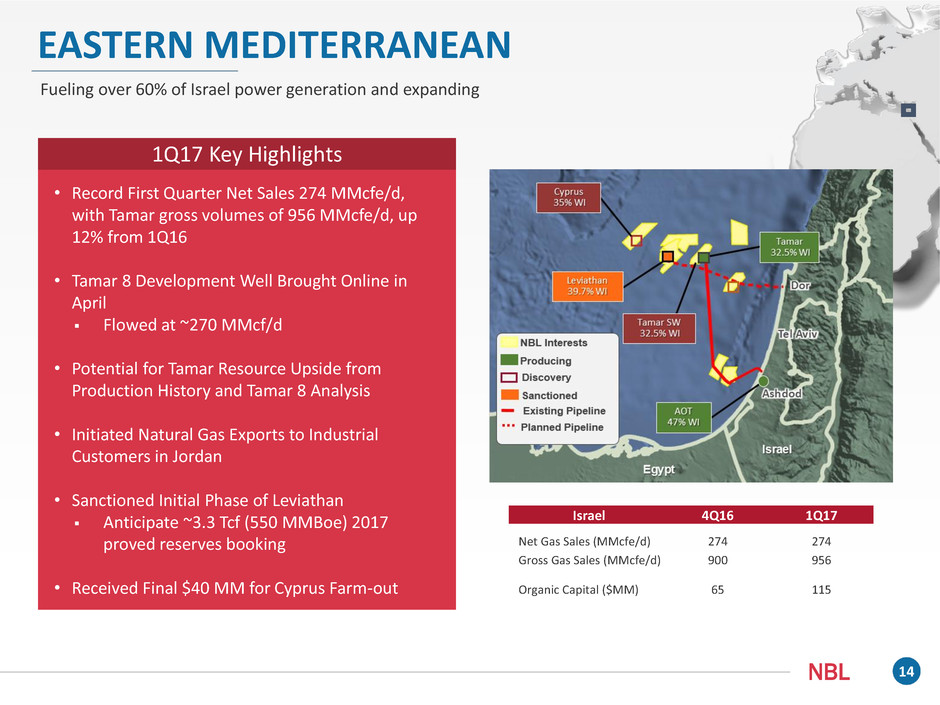
EASTERN MEDITERRANEAN
Fueling over 60% of Israel power generation and expanding
Israel 4Q16 1Q17
Net Gas Sales (MMcfe/d) 274 274
Gross Gas Sales (MMcfe/d) 900 956
Organic Capital ($MM) 65 115
1Q17 Key Highlights
• Record First Quarter Net Sales 274 MMcfe/d,
with Tamar gross volumes of 956 MMcfe/d, up
12% from 1Q16
• Tamar 8 Development Well Brought Online in
April
Flowed at ~270 MMcf/d
• Potential for Tamar Resource Upside from
Production History and Tamar 8 Analysis
• Initiated Natural Gas Exports to Industrial
Customers in Jordan
• Sanctioned Initial Phase of Leviathan
Anticipate ~3.3 Tcf (550 MMBoe) 2017
proved reserves booking
• Received Final $40 MM for Cyprus Farm-out
15NBL
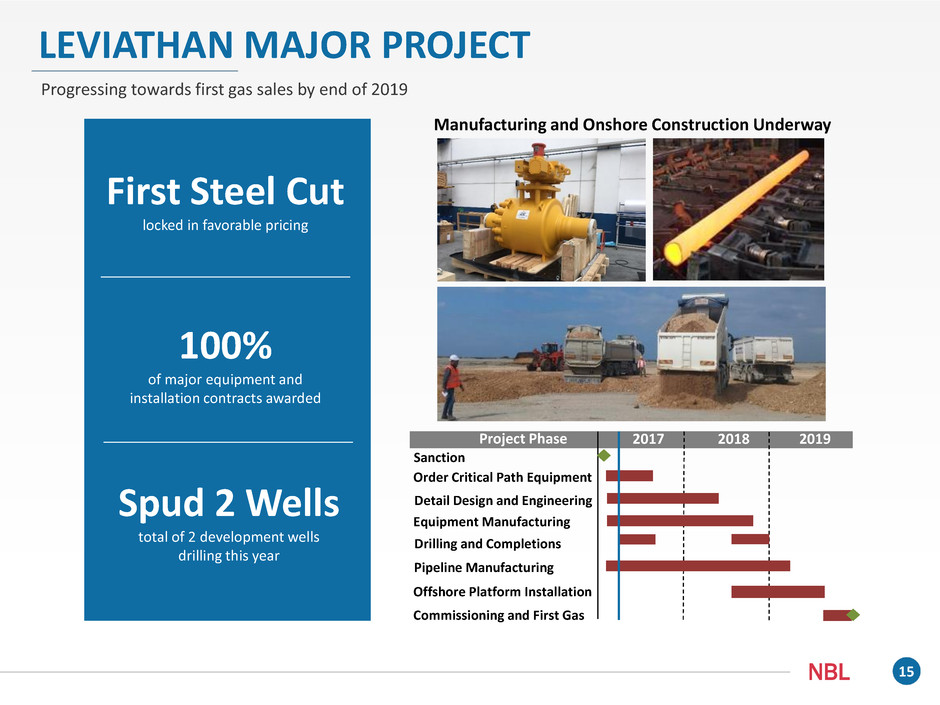
LEVIATHAN MAJOR PROJECT
Progressing towards first gas sales by end of 2019
First Steel Cut
locked in favorable pricing
100%
of major equipment and
installation contracts awarded
Spud 2 Wells
total of 2 development wells
drilling this year
Project Phase 2017 2018 2019
Sanction
Order Critical Path Equipment
Detail Design and Engineering
Pipeline Manufacturing
Equipment Manufacturing
Commissioning and First Gas
Drilling and Completions
Offshore Platform Installation
Manufacturing and Onshore Construction Underway
16NBL
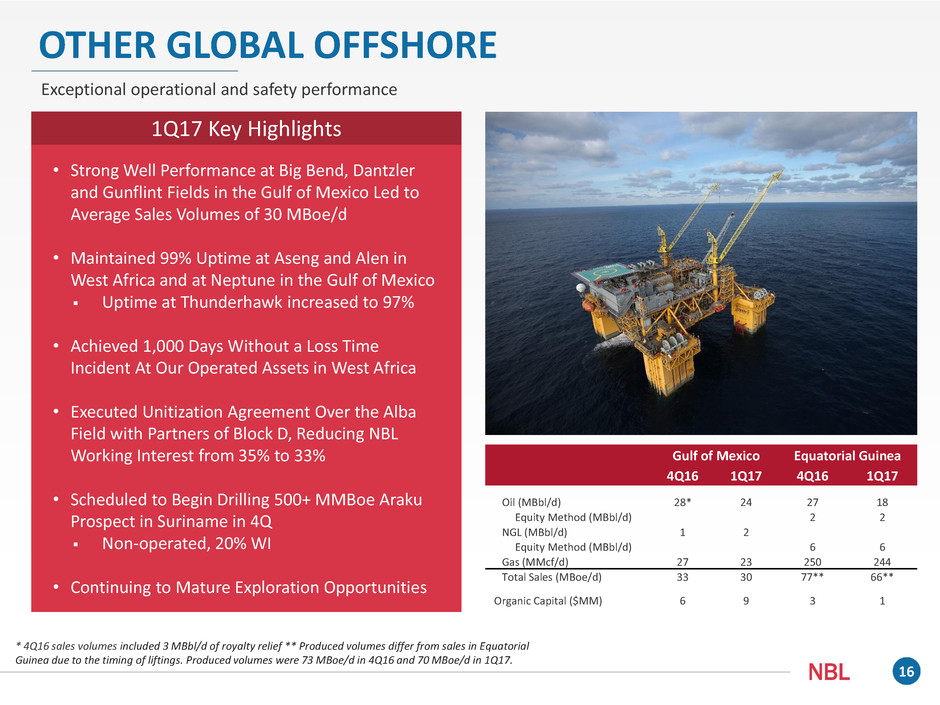
OTHER GLOBAL OFFSHORE
Exceptional operational and safety performance
1Q17 Key Highlights
• Strong Well Performance at Big Bend, Dantzler
and Gunflint Fields in the Gulf of Mexico Led to
Average Sales Volumes of 30 MBoe/d
• Maintained 99% Uptime at Aseng and Alen in
West Africa and at Neptune in the Gulf of Mexico
Uptime at Thunderhawk increased to 97%
• Achieved 1,000 Days Without a Loss Time
Incident At Our Operated Assets in West Africa
• Executed Unitization Agreement Over the Alba
Field with Partners of Block D, Reducing NBL
Working Interest from 35% to 33%
• Scheduled to Begin Drilling 500+ MMBoe Araku
Prospect in Suriname in 4Q
Non-operated, 20% WI
• Continuing to Mature Exploration Opportunities
Gulf of Mexico Equatorial Guinea
4Q16 1Q17 4Q16 1Q17
Oil (MBbl/d) 28* 24 27 18
Equity Method (MBbl/d) 2 2
NGL (MBbl/d) 1 2
Equity Method (MBbl/d) 6 6
Gas (MMcf/d) 27 23 250 244
Total Sales (MBoe/d) 33 30 77** 66**
Organic Capital ($MM) 6 9 3 1
* 4Q16 sales volumes included 3 MBbl/d of royalty relief ** Produced volumes differ from sales in Equatorial
Guinea due to the timing of liftings. Produced volumes were 73 MBoe/d in 4Q16 and 70 MBoe/d in 1Q17.
17NBL
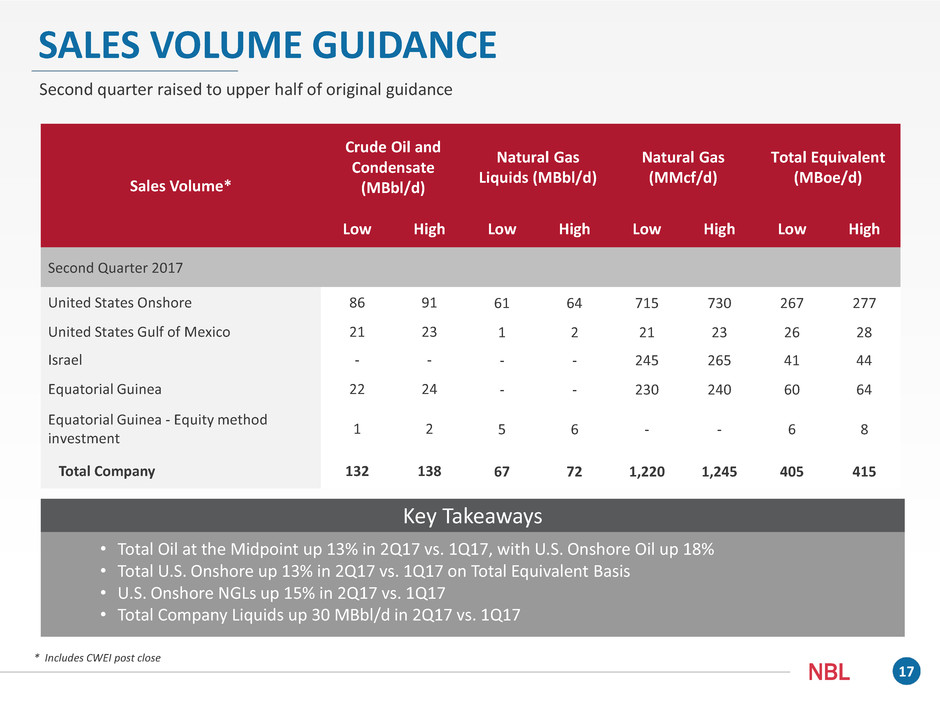
Sales Volume*
Crude Oil and
Condensate
(MBbl/d)
Natural Gas
Liquids (MBbl/d)
Natural Gas
(MMcf/d)
Total Equivalent
(MBoe/d)
Low High Low High Low High Low High
Second Quarter 2017
United States Onshore 86 91 61 64 715 730 267 277
United States Gulf of Mexico 21 23 1 2 21 23 26 28
Israel - - - - 245 265 41 44
Equatorial Guinea 22 24 - - 230 240 60 64
Equatorial Guinea - Equity method
investment
1 2 5 6 - - 6 8
Total Company 132 138 67 72 1,220 1,245 405 415
* Includes CWEI post close
Second quarter raised to upper half of original guidance
SALES VOLUME GUIDANCE
• Total Oil at the Midpoint up 13% in 2Q17 vs. 1Q17, with U.S. Onshore Oil up 18%
• Total U.S. Onshore up 13% in 2Q17 vs. 1Q17 on Total Equivalent Basis
• U.S. Onshore NGLs up 15% in 2Q17 vs. 1Q17
• Total Company Liquids up 30 MBbl/d in 2Q17 vs. 1Q17
Key Takeaways
18NBL
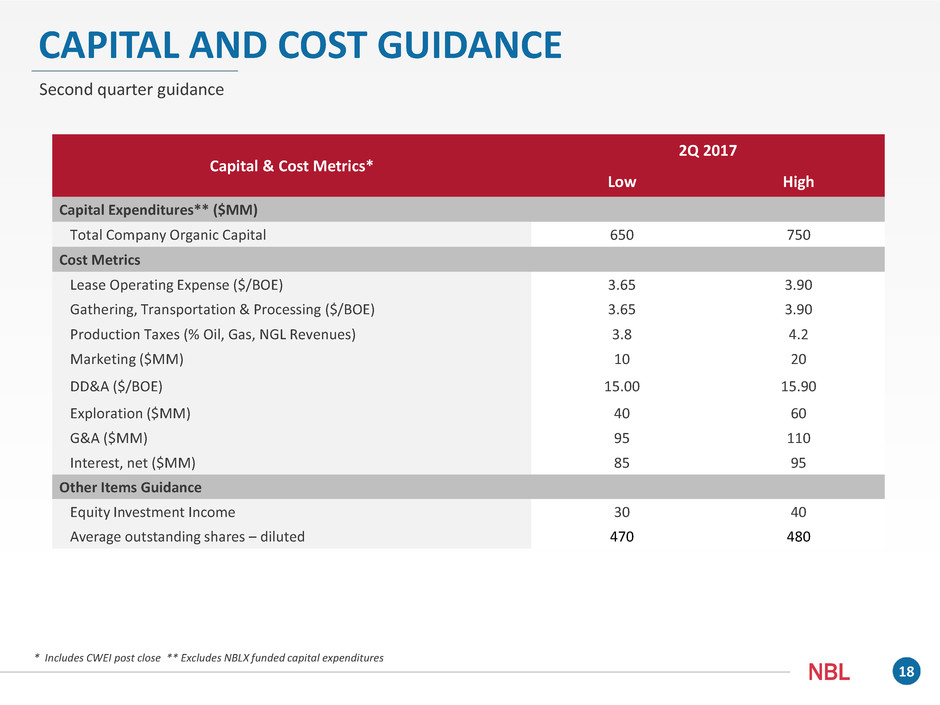
* Includes CWEI post close ** Excludes NBLX funded capital expenditures
Capital & Cost Metrics*
2Q 2017
Low High
Capital Expenditures** ($MM)
Total Company Organic Capital 650 750
Cost Metrics
Lease Operating Expense ($/BOE) 3.65 3.90
Gathering, Transportation & Processing ($/BOE) 3.65 3.90
Production Taxes (% Oil, Gas, NGL Revenues) 3.8 4.2
Marketing ($MM) 10 20
DD&A ($/BOE) 15.00 15.90
Exploration ($MM) 40 60
G&A ($MM) 95 110
Interest, net ($MM) 85 95
Other Items Guidance
Equity Investment Income 30 40
Average outstanding shares – diluted 470 480
CAPITAL AND COST GUIDANCE
Second quarter guidance
19NBL
Forward-Looking Statements and Other Matters
This presentation contains certain "forward-looking statements" within the meaning of federal securities laws. Words such as "anticipates", "believes,"
"expects", "intends", "will", "should", "may", and similar expressions may be used to identify forward-looking statements. Forward-looking statements
are not statements of historical fact and reflect Noble Energy's current views about future events. Such forward-looking statements may include, but
are not limited to, future financial and operating results, and other statements that are not historical facts, including estimates of oil and natural gas
reserves and resources, estimates of future production, assumptions regarding future oil and natural gas pricing, planned drilling activity, future results
of operations, projected cash flow and liquidity, business strategy and other plans and objectives for future operations. No assurances can be given
that the forward-looking statements contained in this presentation will occur as projected and actual results may differ materially from those
projected. Forward-looking statements are based on current expectations, estimates and assumptions that involve a number of risks and uncertainties
that could cause actual results to differ materially from those projected. These risks and uncertainties include, without limitation, the risk that the cost
savings and any other synergies from the recent merger with Clayton Williams Energy, Inc. may not be fully realized or may take longer to realize than
expected, disruption from the merger transaction making it more difficult to maintain relationships with customers, employees or suppliers, the
diversion of management time on post-merger related issues, the volatility in commodity prices for crude oil and natural gas, the presence or
recoverability of estimated reserves, the ability to replace reserves, environmental risks, drilling and operating risks, exploration and development
risks, competition, government regulation or other actions, the ability of management to execute its plans to meet its goals and other risks inherent in
Noble Energy's businesses that are discussed in Noble Energy's and Clayton Williams' most recent annual reports on Form 10-K, respectively, and in
other Noble Energy and Clayton Williams reports on file with the Securities and Exchange Commission (the "SEC"). These reports are also available
from the sources described above. Forward-looking statements are based on the estimates and opinions of management at the time the statements
are made. Noble Energy does not assume any obligation to update any forward-looking statements should circumstances or management’s estimates
or opinions change.
The SEC requires oil and gas companies, in their filings with the SEC, to disclose proved reserves that a company has demonstrated by actual
production or conclusive formation tests to be economically and legally producible under existing economic and operating conditions. The SEC permits
the optional disclosure of probable and possible reserves, however, we have not disclosed our probable and possible reserves in our filings with the
SEC. We use certain terms in this presentation, such as “net unrisked resources”, “type curve” or “MMBoe type curve”, which are by their nature more
speculative than estimates of proved, probable and possible reserves and accordingly are subject to substantially greater risk of being actually realized.
The SEC guidelines strictly prohibit us from including these estimates in filings with the SEC. Investors are urged to consider closely the disclosures and
risk factors in our and Clayton Williams’ most recent Form 10-K and in other reports on file with the SEC, available from Noble Energy’s offices or
website, http://www.nblenergy.com.
This presentation also contains certain historical non-GAAP measures of financial performance that management believes are good tools for internal
use and the investment community in evaluating Noble Energy’s overall financial performance. These non-GAAP measures are broadly used to value
and compare companies in the crude oil and natural gas industry. Please see the Noble Energy’s respective earnings release for reconciliations of the
differences between any historical non-GAAP measures used in this presentation and the most directly comparable GAAP financial measures.
