Attached files
| file | filename |
|---|---|
| 8-K - 8-K - Marathon Petroleum Corp | mpc8-kirpacket2017.htm |
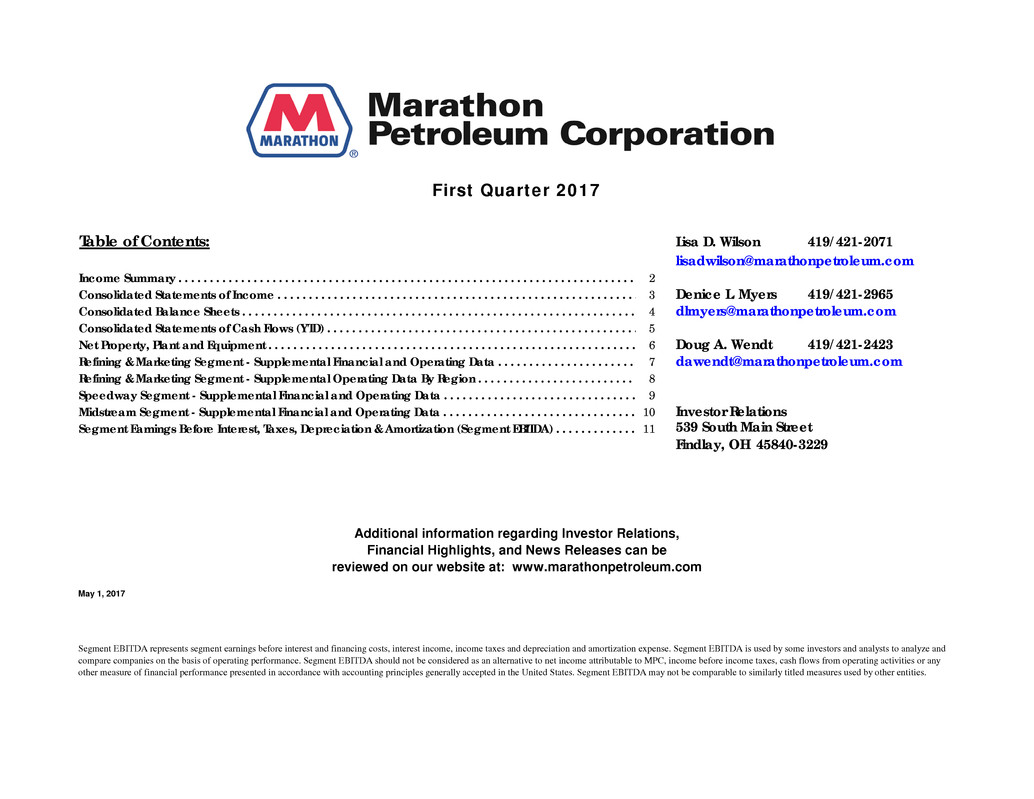
Table of Contents: Lisa D. Wilson 419/421-2071
lisadwilson@marathonpetroleum.com
Income Summary . . . . . . . . . . . . . . . . . . . . . . . . . . . . . . . . . . . . . . . . . . . . . . . . . . . . . . . . . . . . . . . . . . . . . . . . . 2
Consolidated Statements of Income . . . . . . . . . . . . . . . . . . . . . . . . . . . . . . . . . . . . . . . . . . . . . . . . . . . . . . . . . . 3 Denice L. Myers 419/421-2965
Consolidated Balance Sheets . . . . . . . . . . . . . . . . . . . . . . . . . . . . . . . . . . . . . . . . . . . . . . . . . . . . . . . . . . . . . . . 4 dlmyers@marathonpetroleum.com
Consolidated Statements of Cash Flows (YTD) . . . . . . . . . . . . . . . . . . . . . . . . . . . . . . . . . . . . . . . . . . . . . . . . . . 5
Net Property, Plant and Equipment . . . . . . . . . . . . . . . . . . . . . . . . . . . . . . . . . . . . . . . . . . . . . . . . . . . . . . . . . . . 6 Doug A. Wendt 419/421-2423
Refining & Marketing Segment - Supplemental Financial and Operating Data . . . . . . . . . . . . . . . . . . . . . . 7 dawendt@marathonpetroleum.com
Refining & Marketing Segment - Supplemental Operating Data By Region . . . . . . . . . . . . . . . . . . . . . . . . . 8
Speedway Segment - Supplemental Financial and Operating Data . . . . . . . . . . . . . . . . . . . . . . . . . . . . . . . 9
Midstream Segment - Supplemental Financial and Operating Data . . . . . . . . . . . . . . . . . . . . . . . . . . . . . . . 10 Investor Relations
Segment Earnings Before Interest, Taxes, Depreciation & Amortization (Segment EBITDA) . . . . . . . . . . . . . 11 539 South Main Street
Findlay, OH 45840-3229
May 1, 2017
Segment EBITDA represents segment earnings before interest and financing costs, interest income, income taxes and depreciation and amortization expense. Segment EBITDA is used by some investors and analysts to analyze and
compare companies on the basis of operating performance. Segment EBITDA should not be considered as an alternative to net income attributable to MPC, income before income taxes, cash flows from operating activities or any
other measure of financial performance presented in accordance with accounting principles generally accepted in the United States. Segment EBITDA may not be comparable to similarly titled measures used by other entities.
First Quarter 2017
Additional information regarding Investor Relations,
Financial Highlights, and News Releases can be
reviewed on our website at: www.marathonpetroleum.com

2
Year Year Year 1st Qtr 2nd Qtr 3rd Qtr 4th Qtr Year 1st Qtr
(In millions) 2013 2014 2015 2016 2016 2016 2016 2016 2017
Income from operations by segment:(a)
1 Refining & Marketing(b) 3,131$ 3,538$ 3,997$ (86)$ 1,025$ 252$ 166$ 1,357$ (70)$
2 Speedway(b) 375 544 673 167 193 209 165 734 135
3 Midstream(c)(d) 275 342 463 189 253 310 296 1,048 309
Items not allocated to segments:
4 Corporate and other unallocated items (261) (277) (293) (65) (64) (65) (74) (268) (82)
5 Pension settlement expenses (95) (96) (4) (1) (2) (4) - (7) -
6 Impairments(e) - - (144) (129) (90) (267) - (486) -
7 Income from operations(b) 3,425 4,051 4,692 75 1,315 435 553 2,378 292
8 Net interest and other financial income (costs)(d) (179) (216) (318) (142) (137) (141) (136) (556) (150)
9 Income before taxes 3,246 3,835 4,374 (67) 1,178 294 417 1,822 142
10 Income tax provision 1,113 1,280 1,506 11 395 75 128 609 41
11 Net income 2,133 2,555 2,868 (78) 783 219 289 1,213 101
Less net income (loss) attributable to:
12 Redeemable noncontrolling interest - - - - 9 16 16 41 16
13 Noncontrolling interests 21 31 16 (79) (27) 58 46 (2) 55
14 Net income attributable to MPC 2,112$ 2,524$ 2,852$ 1$ 801$ 145$ 227$ 1,174$ 30$
15 Effective tax rate 34% 33% 34% -17% 33% 26% 31% 33% 29%
(a)
(b)
(c)
(d)
(e)
Full year 2015 includes transaction costs of $36 million related to the MarkWest merger. The Midstream segment results for 2015 reflect $30 million of these costs. The remaining $6 million is included in net interest and
other financial income (costs).
Reflects an impairment charge in 2015 for the cancellation of the Residual Oil Upgrader Expansion ("ROUX") project, a goodwill impairment in first quarter 2016 and equity method investment impairments in the second
and third quarters of 2016.
Income Summary
Marathon Petroleum Corporation
We revised our operating segment presentation in the first quarter of 2016 and the first quarter of 2017 in connection with the contribution of assets to MPLX; the operating results for these assets were previously included in
Refining & Marketing, but now are included in Midstream. Comparable prior period information has been recast to reflect our revised segment presentation. The results for the pipeline and storage assets were recast
effective January 1, 2015 and the results for the terminal assets were recast effective April 1, 2016. Prior to these dates these assets were not considered businesses and therefore there are no financial results from which to
recast segment results.
Full year 2015 includes a non-cash LCM inventory valuation charge of $370 million, which reduced Refining & Marketing and Speedway segment income by $345 million and $25 million, respectively. The first quarter
2016 includes a non-cash LCM inventory valuation charge of $15 million, which reduced Refining & Marketing segment income. The second quarter 2016 includes a benefit from reversing the previous LCM inventory
valuation charges of $385 million, which increased Refining & Marketing and Speedway segment income by $360 million and $25 million, respectively.
Includes the results of MarkWest from the December 4, 2015 merger date.
3
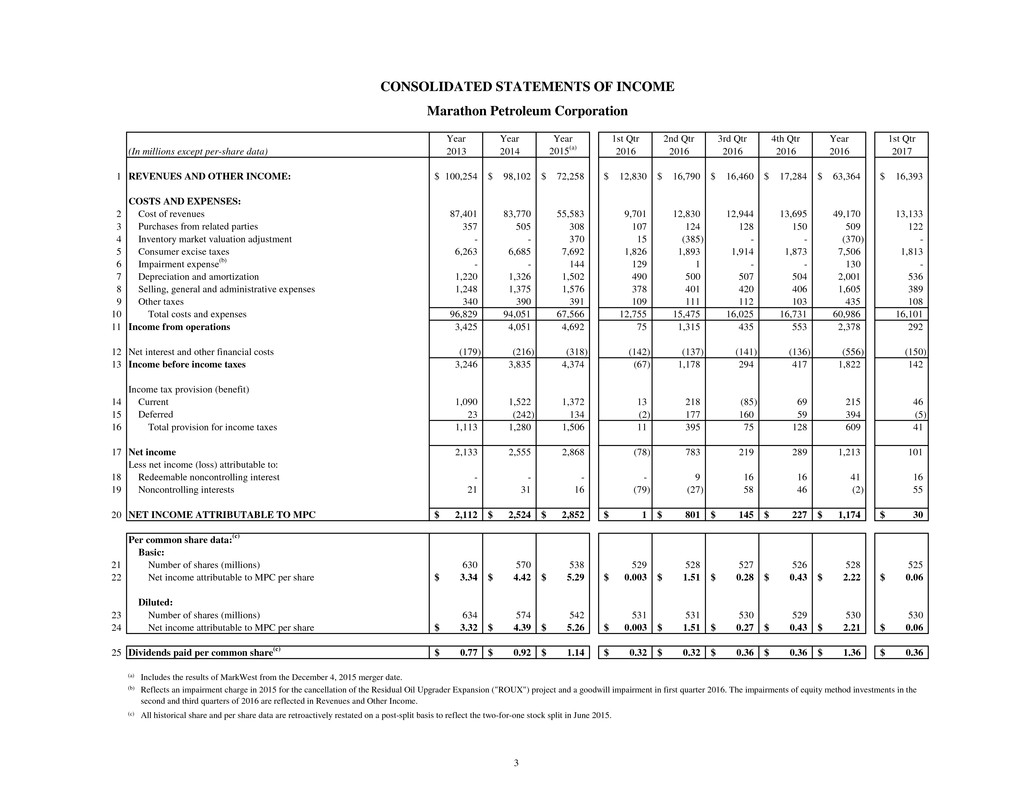
Year Year Year 1st Qtr 2nd Qtr 3rd Qtr 4th Qtr Year 1st Qtr
2013 2014 2015(a) 2016 2016 2016 2016 2016 2017
1 100,254$ 98,102$ 72,258$ 12,830$ 16,790$ 16,460$ 17,284$ 63,364$ 16,393$
2 87,401 83,770 55,583 9,701 12,830 12,944 13,695 49,170 13,133
3 357 505 308 107 124 128 150 509 122
4 - - 370 15 (385) - - (370) -
5 6,263 6,685 7,692 1,826 1,893 1,914 1,873 7,506 1,813
6 - - 144 129 1 - - 130 -
7 1,220 1,326 1,502 490 500 507 504 2,001 536
8 1,248 1,375 1,576 378 401 420 406 1,605 389
9 340 390 391 109 111 112 103 435 108
10 96,829 94,051 67,566 12,755 15,475 16,025 16,731 60,986 16,101
11 3,425 4,051 4,692 75 1,315 435 553 2,378 292
12 (179) (216) (318) (142) (137) (141) (136) (556) (150)
13 3,246 3,835 4,374 (67) 1,178 294 417 1,822 142
14 1,090 1,522 1,372 13 218 (85) 69 215 46
15 23 (242) 134 (2) 177 160 59 394 (5)
16 1,113 1,280 1,506 11 395 75 128 609 41
17 2,133 2,555 2,868 (78) 783 219 289 1,213 101
18 - - - - 9 16 16 41 16
19 21 31 16 (79) (27) 58 46 (2) 55
20 2,112$ 2,524$ 2,852$ 1$ 801$ 145$ 227$ 1,174$ 30$
21 630 570 538 529 528 527 526 528 525
22 3.34$ 4.42$ 5.29$ 0.003$ 1.51$ 0.28$ 0.43$ 2.22$ 0.06$
23 634 574 542 531 531 530 529 530 530
24 3.32$ 4.39$ 5.26$ 0.003$ 1.51$ 0.27$ 0.43$ 2.21$ 0.06$
25 0.77$ 0.92$ 1.14$ 0.32$ 0.32$ 0.36$ 0.36$ 1.36$ 0.36$
(a)
(b)
(c)
Net income attributable to MPC per share
Dividends paid per common share(c)
Includes the results of MarkWest from the December 4, 2015 merger date.
Reflects an impairment charge in 2015 for the cancellation of the Residual Oil Upgrader Expansion ("ROUX") project and a goodwill impairment in first quarter 2016. The impairments of equity method investments in the
second and third quarters of 2016 are reflected in Revenues and Other Income.
All historical share and per share data are retroactively restated on a post-split basis to reflect the two-for-one stock split in June 2015.
Number of shares (millions)
Net income attributable to MPC per share
Diluted:
Number of shares (millions)
Noncontrolling interests
NET INCOME ATTRIBUTABLE TO MPC
Per common share data:(c)
Basic:
Total provision for income taxes
Net income
Less net income (loss) attributable to:
Redeemable noncontrolling interest
Income before income taxes
Income tax provision (benefit)
Current
Deferred
Other taxes
Total costs and expenses
Income from operations
Net interest and other financial costs
Inventory market valuation adjustment
Consumer excise taxes
Impairment expense(b)
Depreciation and amortization
Selling, general and administrative expenses
REVENUES AND OTHER INCOME:
COSTS AND EXPENSES:
Cost of revenues
Purchases from related parties
CONSOLIDATED STATEMENTS OF INCOME
Marathon Petroleum Corporation
(In millions except per-share data)
4
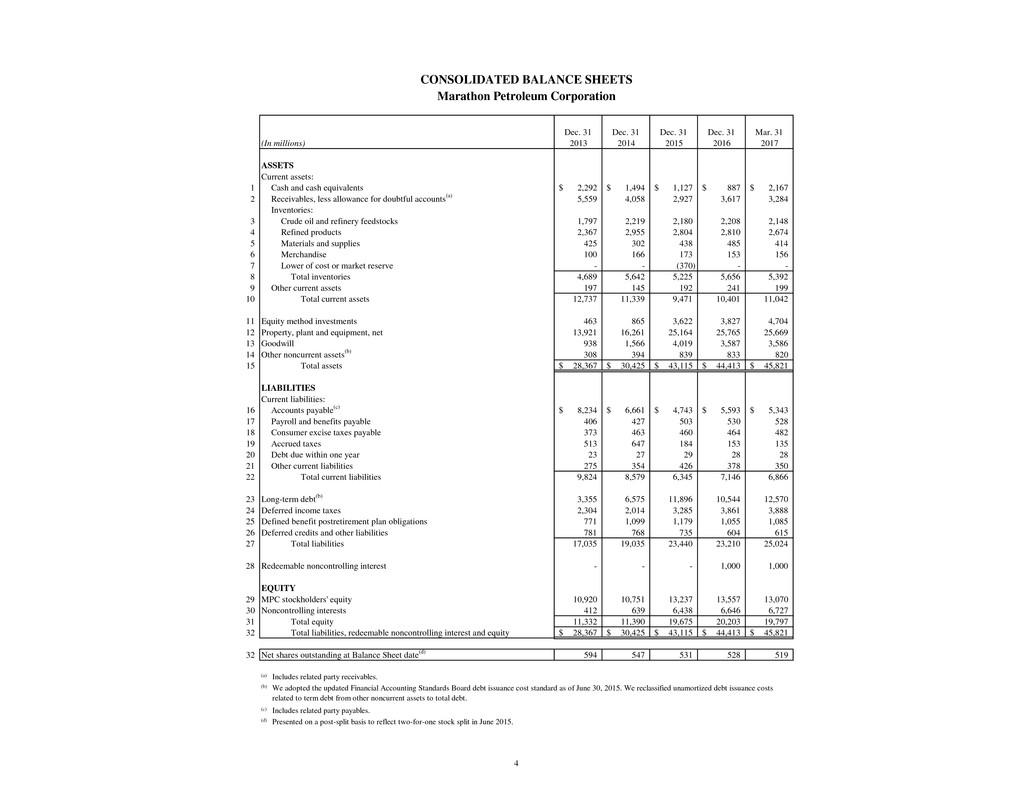
Dec. 31 Dec. 31 Dec. 31 Dec. 31 Mar. 31
2013 2014 2015 2016 2017
1 2,292$ 1,494$ 1,127$ 887$ 2,167$
2 5,559 4,058 2,927 3,617 3,284
3 1,797 2,219 2,180 2,208 2,148
4 2,367 2,955 2,804 2,810 2,674
5 425 302 438 485 414
6 100 166 173 153 156
7 - - (370) - -
8 4,689 5,642 5,225 5,656 5,392
9 197 145 192 241 199
10 12,737 11,339 9,471 10,401 11,042
11 463 865 3,622 3,827 4,704
12 13,921 16,261 25,164 25,765 25,669
13 938 1,566 4,019 3,587 3,586
14 308 394 839 833 820
15 28,367$ 30,425$ 43,115$ 44,413$ 45,821$
16 8,234$ 6,661$ 4,743$ 5,593$ 5,343$
17 406 427 503 530 528
18 373 463 460 464 482
19 513 647 184 153 135
20 23 27 29 28 28
21 275 354 426 378 350
22 9,824 8,579 6,345 7,146 6,866
23 3,355 6,575 11,896 10,544 12,570
24 2,304 2,014 3,285 3,861 3,888
25 771 1,099 1,179 1,055 1,085
26 781 768 735 604 615
27 17,035 19,035 23,440 23,210 25,024
28 - - - 1,000 1,000
29 10,920 10,751 13,237 13,557 13,070
30 412 639 6,438 6,646 6,727
31 11,332 11,390 19,675 20,203 19,797
32 28,367$ 30,425$ 43,115$ 44,413$ 45,821$
32 594 547 531 528 519
(a)
(b)
(c)
(d)
Includes related party receivables.
We adopted the updated Financial Accounting Standards Board debt issuance cost standard as of June 30, 2015. We reclassified unamortized debt issuance costs
related to term debt from other noncurrent assets to total debt.
Includes related party payables.
Presented on a post-split basis to reflect two-for-one stock split in June 2015.
MPC stockholders' equity
Noncontrolling interests
Total equity
Total liabilities, redeemable noncontrolling interest and equity
Net shares outstanding at Balance Sheet date(d)
Total liabilities
Redeemable noncontrolling interest
EQUITY
Long-term debt(b)
Deferred income taxes
Defined benefit postretirement plan obligations
Deferred credits and other liabilities
Consumer excise taxes payable
Accrued taxes
Debt due within one year
Other current liabilities
Total current liabilities
LIABILITIES
Current liabilities:
Accounts payable(c)
Payroll and benefits payable
Equity method investments
Property, plant and equipment, net
Goodwill
Other noncurrent assets(b)
Total assets
Lower of cost or market reserve
Total inventories
Other current assets
Total current assets
Inventories:
Crude oil and refinery feedstocks
Refined products
Materials and supplies
Merchandise
ASSETS
Current assets:
Cash and cash equivalents
Receivables, less allowance for doubtful accounts(a)
CONSOLIDATED BALANCE SHEETS
Marathon Petroleum Corporation
(In millions)
5
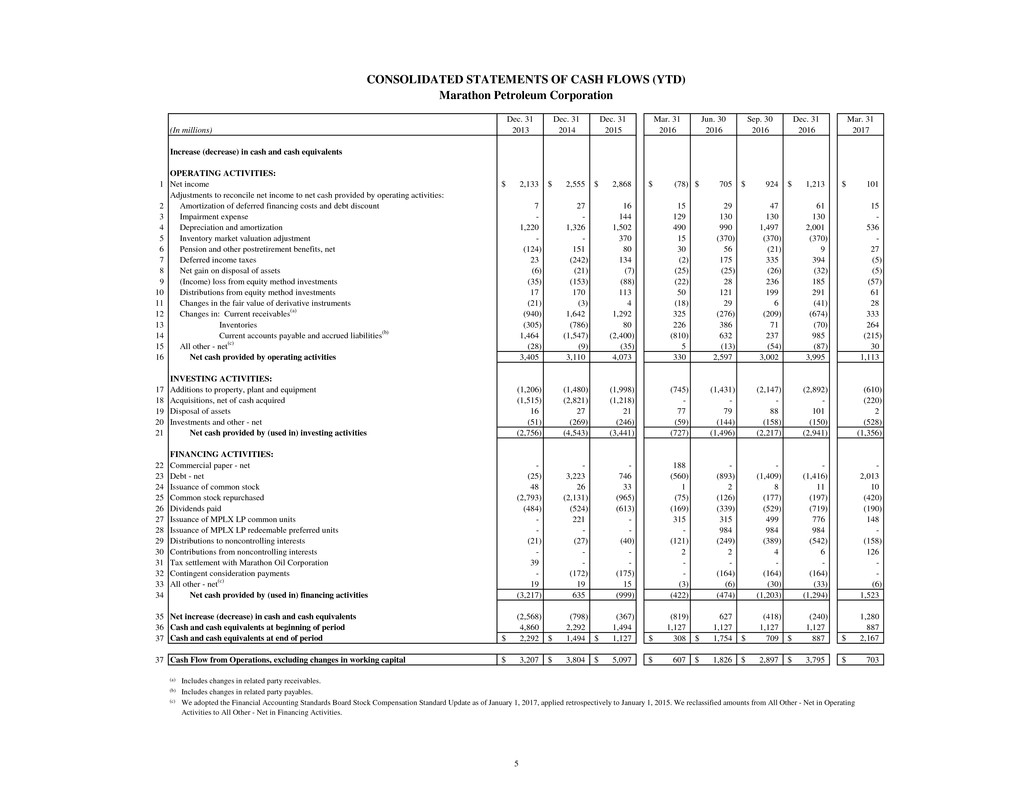
Dec. 31 Dec. 31 Dec. 31 Mar. 31 Jun. 30 Sep. 30 Dec. 31 Mar. 31
2013 2014 2015 2016 2016 2016 2016 2017
1 2,133$ 2,555$ 2,868$ (78)$ 705$ 924$ 1,213$ 101$
2 7 27 16 15 29 47 61 15
3 - - 144 129 130 130 130 -
4 1,220 1,326 1,502 490 990 1,497 2,001 536
5 - - 370 15 (370) (370) (370) -
6 (124) 151 80 30 56 (21) 9 27
7 23 (242) 134 (2) 175 335 394 (5)
8 (6) (21) (7) (25) (25) (26) (32) (5)
9 (35) (153) (88) (22) 28 236 185 (57)
10 17 170 113 50 121 199 291 61
11 (21) (3) 4 (18) 29 6 (41) 28
12 (940) 1,642 1,292 325 (276) (209) (674) 333
13 (305) (786) 80 226 386 71 (70) 264
14 1,464 (1,547) (2,400) (810) 632 237 985 (215)
15 (28) (9) (35) 5 (13) (54) (87) 30
16 3,405 3,110 4,073 330 2,597 3,002 3,995 1,113
17 (1,206) (1,480) (1,998) (745) (1,431) (2,147) (2,892) (610)
18 (1,515) (2,821) (1,218) - - - - (220)
19 16 27 21 77 79 88 101 2
20 (51) (269) (246) (59) (144) (158) (150) (528)
21 (2,756) (4,543) (3,441) (727) (1,496) (2,217) (2,941) (1,356)
22 - - - 188 - - - -
23 (25) 3,223 746 (560) (893) (1,409) (1,416) 2,013
24 48 26 33 1 2 8 11 10
25 (2,793) (2,131) (965) (75) (126) (177) (197) (420)
26 (484) (524) (613) (169) (339) (529) (719) (190)
27 - 221 - 315 315 499 776 148
28 - - - - 984 984 984 -
29 (21) (27) (40) (121) (249) (389) (542) (158)
30 - - - 2 2 4 6 126
31 39 - - - - - - -
32 - (172) (175) - (164) (164) (164) -
33 19 19 15 (3) (6) (30) (33) (6)
34 (3,217) 635 (999) (422) (474) (1,203) (1,294) 1,523
35 (2,568) (798) (367) (819) 627 (418) (240) 1,280
36 4,860 2,292 1,494 1,127 1,127 1,127 1,127 887
37 2,292$ 1,494$ 1,127$ 308$ 1,754$ 709$ 887$ 2,167$
37 3,207$ 3,804$ 5,097$ 607$ 1,826$ 2,897$ 3,795$ 703$
(a)
(b)
(c) We adopted the Financial Accounting Standards Board Stock Compensation Standard Update as of January 1, 2017, applied retrospectively to January 1, 2015. We reclassified amounts from All Other - Net in Operating
Activities to All Other - Net in Financing Activities.
Includes changes in related party payables.
Cash and cash equivalents at end of period
Cash Flow from Operations, excluding changes in working capital
Includes changes in related party receivables.
All other - net(c)
Net cash provided by (used in) financing activities
Net increase (decrease) in cash and cash equivalents
Cash and cash equivalents at beginning of period
Issuance of MPLX LP redeemable preferred units
Distributions to noncontrolling interests
Contributions from noncontrolling interests
Tax settlement with Marathon Oil Corporation
Contingent consideration payments
Debt - net
Issuance of common stock
Common stock repurchased
Dividends paid
Issuance of MPLX LP common units
Investments and other - net
Net cash provided by (used in) investing activities
FINANCING ACTIVITIES:
Commercial paper - net
INVESTING ACTIVITIES:
Additions to property, plant and equipment
Acquisitions, net of cash acquired
Disposal of assets
Changes in: Current receivables(a)
Inventories
Current accounts payable and accrued liabilities(b)
All other - net(c)
Net cash provided by operating activities
Deferred income taxes
Net gain on disposal of assets
(Income) loss from equity method investments
Distributions from equity method investments
Changes in the fair value of derivative instruments
Amortization of deferred financing costs and debt discount
Impairment expense
Depreciation and amortization
Inventory market valuation adjustment
Pension and other postretirement benefits, net
Increase (decrease) in cash and cash equivalents
OPERATING ACTIVITIES:
Net income
Adjustments to reconcile net income to net cash provided by operating activities:
CONSOLIDATED STATEMENTS OF CASH FLOWS (YTD)
Marathon Petroleum Corporation
(In millions)

6
Dec. 31 Dec. 31 Dec. 31 Mar. 31 Jun. 30 Sep. 30 Dec. 31 Mar. 31
(In millions) 2013 2014 2015 2016 2016 2016 2016 2017
1 Refining & Marketing(a) 10,708$ 10,753$ 10,634$ 10,609$ 10,222$ 10,217$ 10,224$ 10,207$
2 Speedway(b) 1,281 3,464 3,686 3,673 3,675 3,671 3,493 3,463
3 Midstream(a)(c) 1,671 1,760 10,455 10,657 11,230 11,428 11,660 11,660
4 Corporate and Other 261 284 389 380 385 381 388 339
5 Total 13,921$ 16,261$ 25,164$ 25,319$ 25,512$ 25,697$ 25,765$ 25,669$
(a)
(b)
(c)
Net Property, Plant and Equipment
Marathon Petroleum Corporation
We revised our operating segment presentation in the first quarter of 2016 and the first quarter of 2017 in connection with the contribution of assets to
MPLX; these assets were previously included in Refining & Marketing, but now are included in Midstream. Comparable prior period information has
been recast to reflect our revised segment presentation.
Includes Hess net property, plant and equipment from the September 30, 2014 acquisition date.
Includes MarkWest net property, plant and equipment from the December 4, 2015 merger.
7
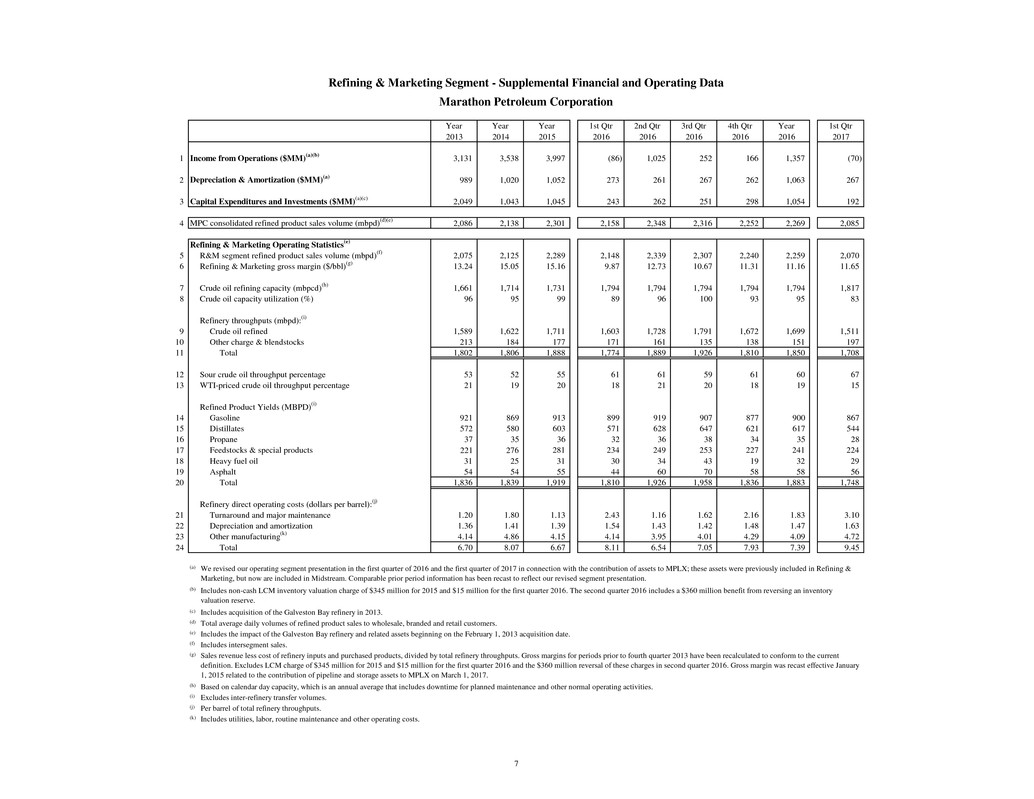
Year Year Year 1st Qtr 2nd Qtr 3rd Qtr 4th Qtr Year 1st Qtr
2013 2014 2015 2016 2016 2016 2016 2016 2017
1 3,131 3,538 3,997 (86) 1,025 252 166 1,357 (70)
2 989 1,020 1,052 273 261 267 262 1,063 267
3 2,049 1,043 1,045 243 262 251 298 1,054 192
4 2,086 2,138 2,301 2,158 2,348 2,316 2,252 2,269 2,085
5 2,075 2,125 2,289 2,148 2,339 2,307 2,240 2,259 2,070
6 13.24 15.05 15.16 9.87 12.73 10.67 11.31 11.16 11.65
7 1,661 1,714 1,731 1,794 1,794 1,794 1,794 1,794 1,817
8 96 95 99 89 96 100 93 95 83
9 1,589 1,622 1,711 1,603 1,728 1,791 1,672 1,699 1,511
10 213 184 177 171 161 135 138 151 197
11 1,802 1,806 1,888 1,774 1,889 1,926 1,810 1,850 1,708
12 53 52 55 61 61 59 61 60 67
13 21 19 20 18 21 20 18 19 15
14 921 869 913 899 919 907 877 900 867
15 572 580 603 571 628 647 621 617 544
16 37 35 36 32 36 38 34 35 28
17 221 276 281 234 249 253 227 241 224
18 31 25 31 30 34 43 19 32 29
19 54 54 55 44 60 70 58 58 56
20 1,836 1,839 1,919 1,810 1,926 1,958 1,836 1,883 1,748
21 1.20 1.80 1.13 2.43 1.16 1.62 2.16 1.83 3.10
22 1.36 1.41 1.39 1.54 1.43 1.42 1.48 1.47 1.63
23 4.14 4.86 4.15 4.14 3.95 4.01 4.29 4.09 4.72
24 6.70 8.07 6.67 8.11 6.54 7.05 7.93 7.39 9.45
(a)
(b)
(c)
(d)
(e)
(f)
(g)
(h)
(i)
(j)
(k) Includes utilities, labor, routine maintenance and other operating costs.
Includes intersegment sales.
Sales revenue less cost of refinery inputs and purchased products, divided by total refinery throughputs. Gross margins for periods prior to fourth quarter 2013 have been recalculated to conform to the current
definition. Excludes LCM charge of $345 million for 2015 and $15 million for the first quarter 2016 and the $360 million reversal of these charges in second quarter 2016. Gross margin was recast effective January
1, 2015 related to the contribution of pipeline and storage assets to MPLX on March 1, 2017.
Based on calendar day capacity, which is an annual average that includes downtime for planned maintenance and other normal operating activities.
Excludes inter-refinery transfer volumes.
Per barrel of total refinery throughputs.
We revised our operating segment presentation in the first quarter of 2016 and the first quarter of 2017 in connection with the contribution of assets to MPLX; these assets were previously included in Refining &
Marketing, but now are included in Midstream. Comparable prior period information has been recast to reflect our revised segment presentation.
Includes non-cash LCM inventory valuation charge of $345 million for 2015 and $15 million for the first quarter 2016. The second quarter 2016 includes a $360 million benefit from reversing an inventory
valuation reserve.
Includes acquisition of the Galveston Bay refinery in 2013.
Total average daily volumes of refined product sales to wholesale, branded and retail customers.
Includes the impact of the Galveston Bay refinery and related assets beginning on the February 1, 2013 acquisition date.
Refinery direct operating costs (dollars per barrel):(j)
Turnaround and major maintenance
Depreciation and amortization
Other manufacturing(k)
Total
Feedstocks & special products
Heavy fuel oil
Asphalt
Total
Refined Product Yields (MBPD)(i)
Gasoline
Distillates
Propane
Other charge & blendstocks
Total
Sour crude oil throughput percentage
WTI-priced crude oil throughput percentage
Crude oil refining capacity (mbpcd)(h)
Crude oil capacity utilization (%)
Refinery throughputs (mbpd):(i)
Crude oil refined
MPC consolidated refined product sales volume (mbpd)(d)(e)
Refining & Marketing Operating Statistics(e)
R&M segment refined product sales volume (mbpd)(f)
Refining & Marketing gross margin ($/bbl)(g)
Income from Operations ($MM)(a)(b)
Depreciation & Amortization ($MM)(a)
Capital Expenditures and Investments ($MM)(a)(c)
Refining & Marketing Segment - Supplemental Financial and Operating Data
Marathon Petroleum Corporation
8
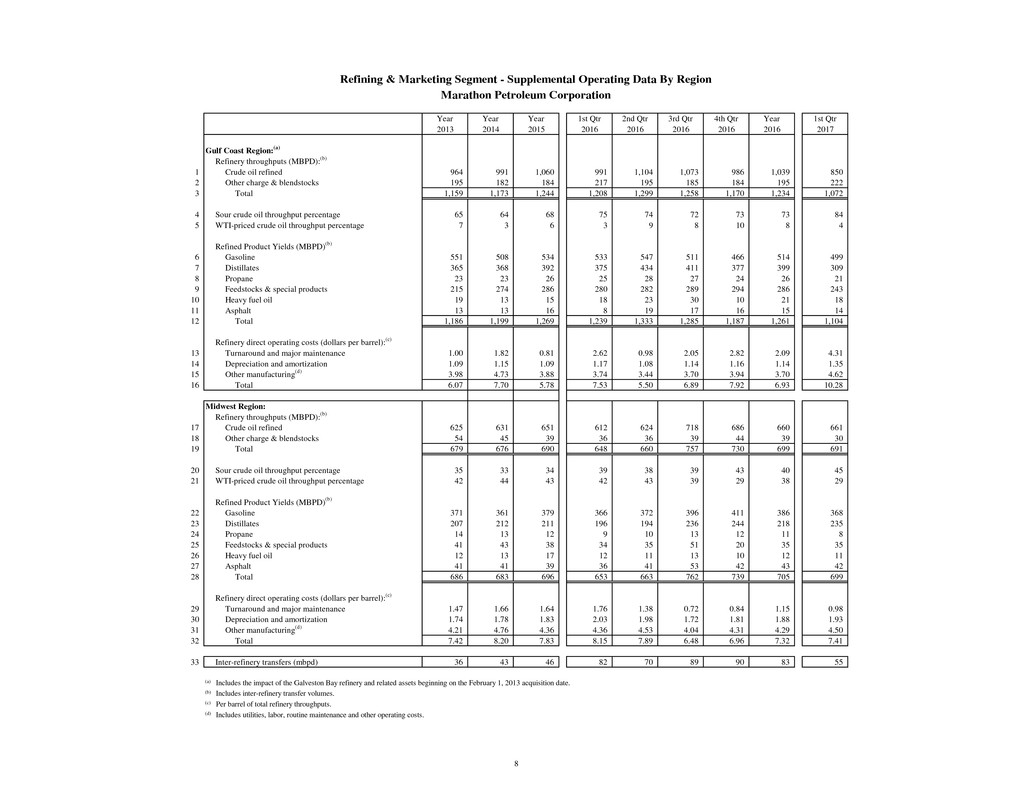
Year Year Year 1st Qtr 2nd Qtr 3rd Qtr 4th Qtr Year 1st Qtr
2013 2014 2015 2016 2016 2016 2016 2016 2017
1 964 991 1,060 991 1,104 1,073 986 1,039 850
2 195 182 184 217 195 185 184 195 222
3 1,159 1,173 1,244 1,208 1,299 1,258 1,170 1,234 1,072
4 65 64 68 75 74 72 73 73 84
5 7 3 6 3 9 8 10 8 4
6 551 508 534 533 547 511 466 514 499
7 365 368 392 375 434 411 377 399 309
8 23 23 26 25 28 27 24 26 21
9 215 274 286 280 282 289 294 286 243
10 19 13 15 18 23 30 10 21 18
11 13 13 16 8 19 17 16 15 14
12 1,186 1,199 1,269 1,239 1,333 1,285 1,187 1,261 1,104
13 1.00 1.82 0.81 2.62 0.98 2.05 2.82 2.09 4.31
14 1.09 1.15 1.09 1.17 1.08 1.14 1.16 1.14 1.35
15 3.98 4.73 3.88 3.74 3.44 3.70 3.94 3.70 4.62
16 6.07 7.70 5.78 7.53 5.50 6.89 7.92 6.93 10.28
17 625 631 651 612 624 718 686 660 661
18 54 45 39 36 36 39 44 39 30
19 679 676 690 648 660 757 730 699 691
20 35 33 34 39 38 39 43 40 45
21 42 44 43 42 43 39 29 38 29
22 371 361 379 366 372 396 411 386 368
23 207 212 211 196 194 236 244 218 235
24 14 13 12 9 10 13 12 11 8
25 41 43 38 34 35 51 20 35 35
26 12 13 17 12 11 13 10 12 11
27 41 41 39 36 41 53 42 43 42
28 686 683 696 653 663 762 739 705 699
29 1.47 1.66 1.64 1.76 1.38 0.72 0.84 1.15 0.98
30 1.74 1.78 1.83 2.03 1.98 1.72 1.81 1.88 1.93
31 4.21 4.76 4.36 4.36 4.53 4.04 4.31 4.29 4.50
32 7.42 8.20 7.83 8.15 7.89 6.48 6.96 7.32 7.41
33 36 43 46 82 70 89 90 83 55
(a)
(b)
(c)
(d)
Includes the impact of the Galveston Bay refinery and related assets beginning on the February 1, 2013 acquisition date.
Includes inter-refinery transfer volumes.
Per barrel of total refinery throughputs.
Includes utilities, labor, routine maintenance and other operating costs.
Depreciation and amortization
Other manufacturing(d)
Total
Inter-refinery transfers (mbpd)
Asphalt
Total
Refinery direct operating costs (dollars per barrel):(c)
Turnaround and major maintenance
Gasoline
Distillates
Propane
Feedstocks & special products
Heavy fuel oil
Sour crude oil throughput percentage
WTI-priced crude oil throughput percentage
Refined Product Yields (MBPD)(b)
Midwest Region:
Refinery throughputs (MBPD):(b)
Crude oil refined
Other charge & blendstocks
Total
Turnaround and major maintenance
Depreciation and amortization
Other manufacturing(d)
Total
Heavy fuel oil
Asphalt
Total
Refinery direct operating costs (dollars per barrel):(c)
Refined Product Yields (MBPD)(b)
Gasoline
Distillates
Propane
Feedstocks & special products
Total
Sour crude oil throughput percentage
WTI-priced crude oil throughput percentage
Gulf Coast Region:(a)
Refinery throughputs (MBPD):(b)
Crude oil refined
Other charge & blendstocks
Refining & Marketing Segment - Supplemental Operating Data By Region
Marathon Petroleum Corporation

9
Year Year Year 1st Qtr 2nd Qtr 3rd Qtr 4th Qtr Year 1st Qtr
2013 2014 2015 2016 2016 2016 2016 2016 2017
1 375 544 673 167 193 209 165 734 135
2 112 152 254 63 69 71 70 273 64
3 296 2,981 501 50 70 71 112 303 35
4 3,146 3,942 6,038 1,483 1,547 1,575 1,489 6,094 1,393
5 0.1441 0.1775 0.1823 0.1682 0.1549 0.1773 0.1617 0.1656 0.1566
6 3,135 3,611 4,879 1,152 1,287 1,338 1,230 5,007 1,127
7 825 975 1,368 330 369 386 350 1,435 320
8 26.3% 27.0% 28.0% 28.6% 28.7% 28.9% 28.4% 28.7% 28.4%
9 1,478 2,746 2,766 2,771 2,773 2,773 2,733 2,733 2,731
10 0.5% -0.7% -0.3% 1.0% 0.3% -0.6% -2.4% -0.4% -1.0%
11 4.3% 5.0% 4.1% 3.1% 2.0% 4.0% 3.7% 3.2% 2.1%
(a)
(b)
(c)
(d)
(e)
(f)
(g)
Includes 1,245 stores acquired on September 30, 2014 through the acquisition of Hess' Retail Operations and Related Assets. Segment results for the period prior to the acquisition do not include results from these
operations.
Same store comparison includes only locations owned at least 13 months, and therefore excludes locations acquired from Hess until the fourth quarter 2015.
Excludes cigarettes.
Same store merchandise sales (period over period)(f)(g)
Full year 2015 includes non-cash LCM inventory valuation charge of $25 million. The second quarter 2016 includes a $25 million benefit from reversing an inventory valuation reserve.
Includes acquisition of Hess' Retail Operations and Related Assets in 2014.
The price paid by consumers less the cost of refined products, including transportation, consumer excise taxes and bankcard processing fees, divided by gasoline and distillate sales volume. Excludes LCM
inventory valuation charge of $25 million for 2015 and the $25 million benefit in second quarter and full-year 2016.
In Q4 2016, Speedway contributed 41 travel centers to the Pilot Flying J joint venture. From the contribution date forward, the Speedway operating statistics exclude these locations.
Merchandise gross margin ($MM)(e)
Merchandise gross margin percent(e)
Convenience stores at period end(d)(e)
Same store gasoline sales volume (period over period)(f)
Capital Expenditures and Investments ($MM)(b)
Gasoline and distillate sales (MMgal)(e)
Gasoline and distillate gross margin ($/gal)(c)(e)
Merchandise sales ($MM)(e)
Income from Operations ($MM)(a)
Depreciation & Amortization ($MM)
Speedway Segment - Supplemental Financial and Operating Data
Marathon Petroleum Corporation

10
Year Year Year 1st Qtr 2nd Qtr 3rd Qtr 4th Qtr Year 1st Qtr
2013 2014 2015(a) 2016 2016 2016 2016 2016 2017
1 275 342 463 189 253 310 296 1,048 309
2 96 102 144 140 153 155 157 605 191
3 279 604 14,545 350 419 410 389 1,568 1,070
4
5 1,293 1,241 1,836 1,823 1,954 2,124 1,936 1,960 1,937
6 911 878 993 995 997 1,001 1,003 999 951
7 2,204 2,119 2,829 2,818 2,951 3,125 2,939 2,959 2,888
8 63,133 63,704 62,812 63,217 59,793
9 3,075 3,345 3,288 3,306 3,164 3,275 3,184
10 5,468 5,636 5,529 5,906 5,970 5,761 6,132
11 307 321 322 348 346 335 367
(a)
(b)
(c)
(d)
(e)
(f)
(g) Includes amounts related to unconsolidated equity method investments.
We revised our operating segment presentation in the first quarter of 2016 and the first quarter of 2017 in connection with the contribution of assets to MPLX; these assets were previously included in Refining &
Marketing, but now are included in Midstream. Comparable prior period information has been recast to reflect our revised segment presentation.
Includes income from equity method investments.
Full year 2015 includes $13.85 billion for the MarkWest merger. First quarter 2017 includes $220 million for the acquisition of the Ozark pipeline and an investment of $500 million in MarEn Bakken related to the
Bakken Pipeline system. Also includes contributions to equity affiliates.
Includes common-carrier pipelines and private pipelines contributed to MPLX, excluding equity method investments.
We revised our operating statistics in connection with the contribution of certain terminal, pipeline and storage assets to MPLX. Pipeline throughputs were recast effective January 1, 2015 and we included terminal
throughput effective April 1, 2016. Prior to these dates these assets were not considered businesses and therefore there are no operating statistics from which to recast.
Terminal throughput (mbpd)(f)
Gathering system throughput (million cubic feet per day)(g)
Natural gas processed (million cubic feet per day)(g)
C2 + NGLs fractionated (mbpd)(g)
Includes the results of MarkWest from the December 4, 2015 merger date.
Pipeline Throughput (mbpd)(e)(f)
Crude oil pipelines
Refined product pipelines
Total
Midstream Segment - Supplemental Financial and Operating Data
Marathon Petroleum Corporation
Income from Operations ($MM)(b)(c)
Depreciation & Amortization ($MM)(b)
Capital Expenditures and Investments ($MM)(b)(d)
11
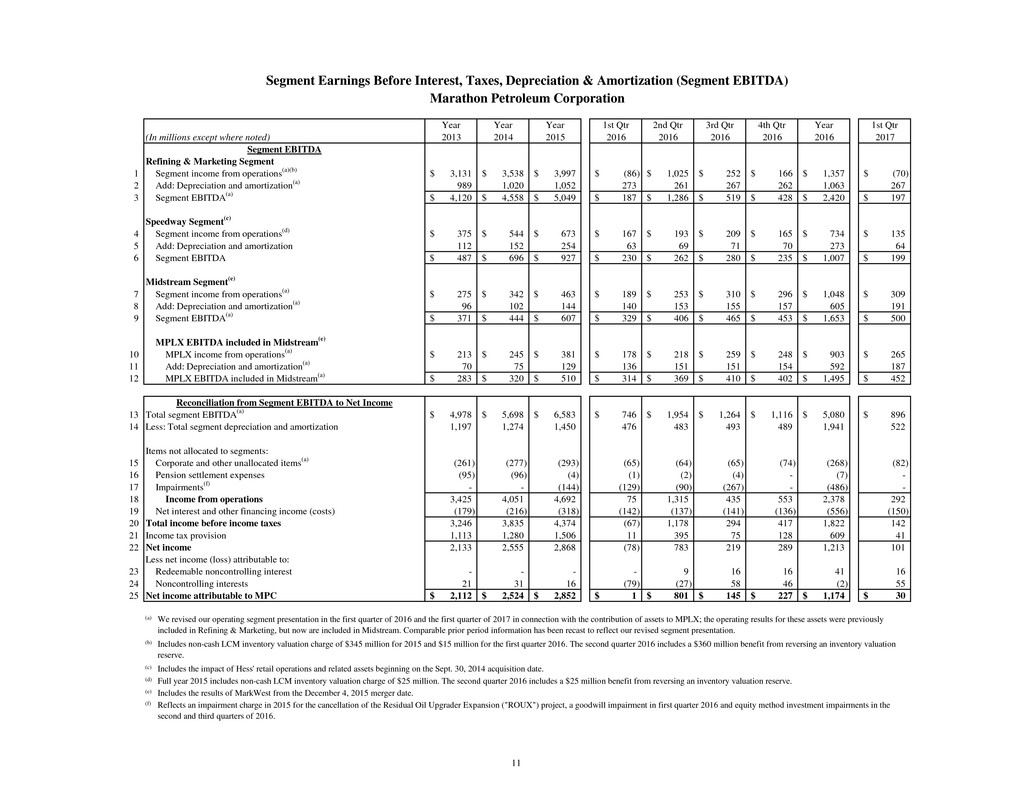
Year Year Year 1st Qtr 2nd Qtr 3rd Qtr 4th Qtr Year 1st Qtr
2013 2014 2015 2016 2016 2016 2016 2016 2017
1 3,131$ 3,538$ 3,997$ (86)$ 1,025$ 252$ 166$ 1,357$ (70)$
2 989 1,020 1,052 273 261 267 262 1,063 267
3 4,120$ 4,558$ 5,049$ 187$ 1,286$ 519$ 428$ 2,420$ 197$
4 375$ 544$ 673$ 167$ 193$ 209$ 165$ 734$ 135$
5 112 152 254 63 69 71 70 273 64
6 487$ 696$ 927$ 230$ 262$ 280$ 235$ 1,007$ 199$
7 275$ 342$ 463$ 189$ 253$ 310$ 296$ 1,048$ 309$
8 96 102 144 140 153 155 157 605 191
9 371$ 444$ 607$ 329$ 406$ 465$ 453$ 1,653$ 500$
10 213$ 245$ 381$ 178$ 218$ 259$ 248$ 903$ 265$
11 70 75 129 136 151 151 154 592 187
12 283$ 320$ 510$ 314$ 369$ 410$ 402$ 1,495$ 452$
13 4,978$ 5,698$ 6,583$ 746$ 1,954$ 1,264$ 1,116$ 5,080$ 896$
14 1,197 1,274 1,450 476 483 493 489 1,941 522
15 (261) (277) (293) (65) (64) (65) (74) (268) (82)
16 (95) (96) (4) (1) (2) (4) - (7) -
17 - - (144) (129) (90) (267) - (486) -
18 3,425 4,051 4,692 75 1,315 435 553 2,378 292
19 (179) (216) (318) (142) (137) (141) (136) (556) (150)
20 3,246 3,835 4,374 (67) 1,178 294 417 1,822 142
21 1,113 1,280 1,506 11 395 75 128 609 41
22 2,133 2,555 2,868 (78) 783 219 289 1,213 101
23 - - - - 9 16 16 41 16
24 21 31 16 (79) (27) 58 46 (2) 55
25 2,112$ 2,524$ 2,852$ 1$ 801$ 145$ 227$ 1,174$ 30$
(a)
(b)
(c)
(d)
(e)
(f)
Full year 2015 includes non-cash LCM inventory valuation charge of $25 million. The second quarter 2016 includes a $25 million benefit from reversing an inventory valuation reserve.
Includes the results of MarkWest from the December 4, 2015 merger date.
Reflects an impairment charge in 2015 for the cancellation of the Residual Oil Upgrader Expansion ("ROUX") project, a goodwill impairment in first quarter 2016 and equity method investment impairments in the
second and third quarters of 2016.
Noncontrolling interests
Net income attributable to MPC
We revised our operating segment presentation in the first quarter of 2016 and the first quarter of 2017 in connection with the contribution of assets to MPLX; the operating results for these assets were previously
included in Refining & Marketing, but now are included in Midstream. Comparable prior period information has been recast to reflect our revised segment presentation.
Includes non-cash LCM inventory valuation charge of $345 million for 2015 and $15 million for the first quarter 2016. The second quarter 2016 includes a $360 million benefit from reversing an inventory valuation
reserve.
Includes the impact of Hess' retail operations and related assets beginning on the Sept. 30, 2014 acquisition date.
Total income before income taxes
Income tax provision
Net income
Less net income (loss) attributable to:
Redeemable noncontrolling interest
Corporate and other unallocated items(a)
Pension settlement expenses
Impairments(f)
Income from operations
Net interest and other financing income (costs)
Reconciliation from Segment EBITDA to Net Income
Total segment EBITDA(a)
Less: Total segment depreciation and amortization
Items not allocated to segments:
MPLX EBITDA included in Midstream(e)
MPLX income from operations(a)
Add: Depreciation and amortization(a)
MPLX EBITDA included in Midstream(a)
Midstream Segment(e)
Segment income from operations(a)
Add: Depreciation and amortization(a)
Segment EBITDA(a)
Speedway Segment(c)
Segment income from operations(d)
Add: Depreciation and amortization
Segment EBITDA
Refining & Marketing Segment
Segment income from operations(a)(b)
Add: Depreciation and amortization(a)
Segment EBITDA(a)
Segment Earnings Before Interest, Taxes, Depreciation & Amortization (Segment EBITDA)
Marathon Petroleum Corporation
(In millions except where noted)
Segment EBITDA
