Attached files
| file | filename |
|---|---|
| EX-99.1 - EXHIBIT 99.1 - WRKCo Inc. | exh_991.htm |
| 8-K - FORM 8-K - WRKCo Inc. | f8k_042617.htm |
EXHIBIT 99.2
Q2 FY17 Results April 26, 2017 Steve Voorhees Chief Executive Officer Ward Dickson Chief Financial Officer Jim Porter President, Business Development and Latin America Jeff Chalovich President, Corrugated Packaging Bob Feeser President, Consumer Packaging

2 Forward Looking Statements This presentation contains forward - looking statements within the meaning of the Private Securities Litigation Reform Act of 1995, including but not limited to the statements on the slides entitled “WestRock – Building a Paper and Packaging Leader”, “Q2 FY17 Land and Development Results”, “Synergy and Performance Improvements” and “Guidance”, that give guidance or estimates for future periods as well as statements regarding, among other things, that we expect a run - rate of $800 million in synergy and performance improvements by end of FY17 and to achieve $1 billion goal by end of Q3 FY18; that we expect to complete the monetization program is proceeding as planned; that we expect after - tax free cash flow of $150 - 175 million in fiscal 2017 and $275 - 300 million overall from monetization; and that we expect FY17 Adjusted Free Cash Flow to be $1.2 billion. Forward - looking statements are based on our current expectations, beliefs, plans or forecasts and are typically identified by words or phrases such as "may," "will," "could," "should," "would," "anticipate," "estimate," "expect," "project," "intend," "plan," "believe," "target," "prospects," "potential" and "forecast," and other words, terms and phrases of similar meaning. Forward - looking statements involve estimates, expectations, projections, goals, forecasts, assumptions, risks and uncertainties. WestRock cautions readers that a forward - looking statement is not a guarantee of future performance and that actual results could differ materially from those contain ed in the forward - looking statement. Such forward - looking statements include statements such as that the acquisition of Multi Packaging So lutions is expected to close in fiscal Q3 2017. With respect to this statement, WestRock has made assumptions regarding, among other things, whether and when the waiting period under the Hart - Scott - Rodino Antitrust Improvements Act expires or terminates; whether and when antitrust approvals in the European Union, China, Canada and Mexico are obtained; whether and when the other conditions to the completion of the MPS acquisition will be satisfied; economic, competitive and market conditions generally; volumes and price levels of purchases by customers; competitive conditions in WestRock's businesses and possible adverse actions of their customers, competitors and suppliers. Further, WestRock's businesses are subject to a number of general risks that would affect any such forward - looking statements. Such risks and other factors that may impact management's assumptions are more particularly described in our filings with the Securities and Exchange Commission, including in Item 1A under the caption "Risk Factors" in our Annual Report on Form 10 - K for the year ended September 30, 2016 and our Form 10 - Q for the quarter ended December 31, 2016. The information contained herein speaks as of the date hereof and WestRock does not have or undertake any obligation to update or revise its forward - looking statements, whether as a result of new information, future events or otherwise.

3 Disclaimer; Non - GAAP Financial Measures We may from time to time be in possession of certain information regarding WestRock that applicable law would not require us to disclose to the public in the ordinary course of business, but would require us to disclose if we were engaged in the purchase or sale of our securities. This presentation shall not be considered to be part of any solicitation of an offer to buy or sell WestRock securities. This presentation also may not include all of the information regarding WestRock that you may need to make an investment decision regarding WestRock securities. Any investment decision should be made on the basis of the total mix of information regarding WestRock that is publicly available as of the date of the decision. We report our financial results in accordance with accounting principles generally accepted in the United States ("GAAP"). However, management believes certain non - GAAP financial measures provide users with additional meaningful financial information that should be considered when assessing our ongoing performance. Management also uses these non - GAAP financial measures in making financial, operating and planning decisions and in evaluating our performance. Non - GAAP financial measures should be viewed in addition to, and not as an alternative for, our GAAP results. The non - GAAP financial measures we present may differ from similarly captioned measures presented by other companies. See the Appendix for details about these non - GAAP financial measures, as well as the required reconciliations.

4 WestRock Building a Paper and Packaging Leader 1) Non - GAAP Financial Measure. We believe the most directly comparable GAAP measure is Operating Cash Flow. See Forward Looking Guidance in Non GAAP Financial Measures in Appendix Co m p re h e n si v e Portfolio of Paper and Packaging Solutions • Holds #1 or #2 positions in attractive paper and packaging markets • Unmatched breadth of product offerings, capabilities and geographic reach • Differentiated paper and packaging solutions that help our customers win Track Record of Solid Execution • Strong productivity gains with $103 million realized in the quarter • Run - rate of $675 million; expect to exceed $800 million run - rate by end of FY17 and to achieve $1 billion goal by end of Q3 FY18 • Reaffirm $1.2 billion adjusted free cash flow guidance for FY17 (1) Growing S h are ho l d er Value Using Disciplined Capital Allocation • Completed divestiture of Home, Health and Beauty business and realized net proceeds of $1 billion, after taxes and transaction expenses • Announced planned acquisition of Multi Packaging Solutions for $2.3 billion • Acquired Star Pizza, an innovative provider of customized foodservice packaging • Repurchased $25 million of stock during the quarter; 15.3 million cumulative shares purchased under authorization at average price of $49 per share • Returned $1.4 billion to stockholders since merger through dividends and share repurchases

5 Focusing the WestRock Portfolio Merged MWV and RockTenn to form WestRock JULY 2015 Acquired Cenveo P a c k a ging Consumer Packaging J A N U AR Y 2016 APRIL 2016 Completed joint venture with Grupo Gondi Corrugated and Consumer Packaging Completed separation of Ingevity Specialty Chemicals MAY 2016 J A N U AR Y 2017 A nnounc e d planned a c quis i tion of MPS Consumer Packaging APRIL 2017 Completed sale of HHB to Silgan OCTOBER 2015 A cqui r ed SP Fiber Con ta inerboard Mills Acquired Star Pizza Box Corrugated Packaging MARCH 2017

6 $531 14 103 23 $547 ( 125 ) ( 27 ) Q2 Volume Price / Mix Energy/ Wage and Productivity Land and Q2 FY16 Materials/ Other Inflation Development F Y 1 7 Freight & Other Q2 FY17 WestRock Consolidated Results 1) Non - GAAP Financial Measure. See Non - GAAP Financial Measures and Reconciliations in Appendix. 2) On a GAAP basis, EPS from continuing operations was $0.40 in Q2 FY17 and $0.22 in Q2 FY16. See Non - GAAP Financial Measures and Reconciliations in Appendix. Q2 FY17 Business Highlights: • Adjusted earnings per share of $0.54 (1)(2) • Adjusted free cash flow of $109 million (1) • Significant cost inflation impact • Productivity initiatives contributed $103 million • Leverage of 2.32x, within targeted range • Repurchased 0.5 million shares Financial Performance ($ in millions, except percentages and per share items) Q2 FY17 Q2 FY16 Segment Sales $3,656 $3,493 Adj. Segment Income (1) $296 $273 Adj. Segment EBITDA (1) $547 $531 % Margin (1) 14.9% 15.2% Adjusted Earnings from Continuing Operations per Diluted Share (1) $0.54 (2) $0.55 (2) Adjusted Free Cash Flow (1) $109 $81 Adjusted Segment EBITDA (1) ($ in millions) 28
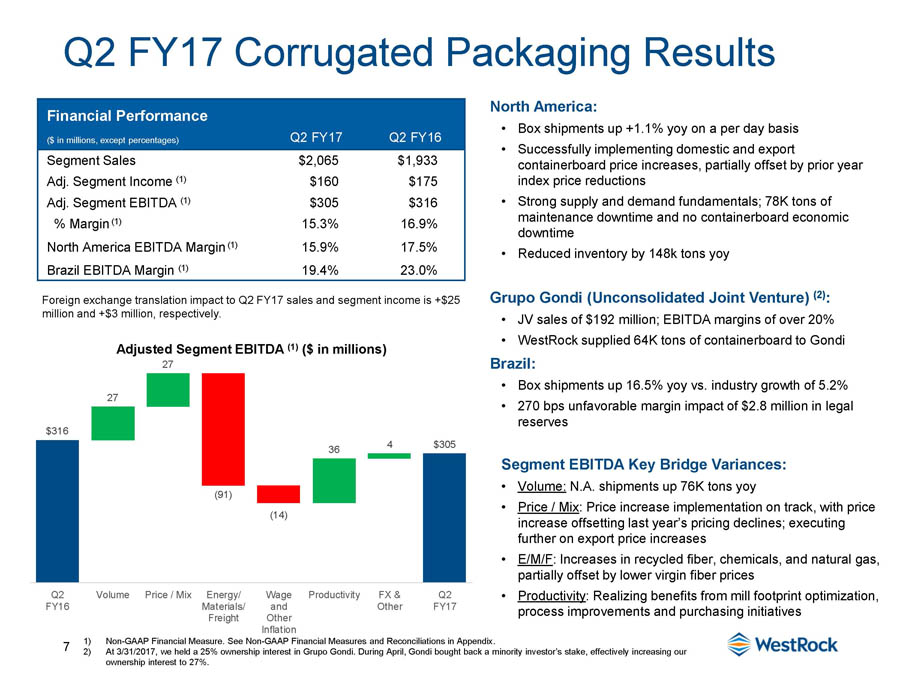
7 $316 27 36 4 $305 ( 91) (14) Q2 F Y 16 Volume Price / Mix Energy/ M a t e r i a l s/ Freight W age P r oduc t i v i t y and Other I n f l a t i on FX & O t her Q2 F Y 17 Q2 FY17 Corrugated Packaging Results 1) Non - GAAP Financial Measure. See Non - GAAP Financial Measures and Reconciliations in Appendix. 2) At 3/31/2017, we held a 25% ownership interest in Grupo Gondi. During April, Gondi bought back a minority investor’s stake, effectively increasing our ownership interest to 27%. North America: • Box shipments up +1.1% yoy on a per day basis • Successfully implementing domestic and export containerboard price increases, partially offset by prior year index price reductions • Strong supply and demand fundamentals; 78K tons of maintenance downtime and no containerboard economic downtime • Reduced inventory by 148k tons yoy Grupo Gondi (Unconsolidated Joint Venture) (2) : • JV sales of $192 million; EBITDA margins of over 20% • WestRock supplied 64K tons of containerboard to Gondi Brazil: • Box shipments up 16.5% yoy vs. industry growth of 5.2% • 270 bps unfavorable margin impact of $2.8 million in legal reserves Segment EBITDA Key Bridge Variances: • Volume: N.A. shipments up 76K tons yoy • Price / Mix : Price increase implementation on track, with price increase offsetting last year’s pricing declines; executing further on export price increases • E/M/F : Increases in recycled fiber, chemicals, and natural gas, partially offset by lower virgin fiber prices • Productivity : Realizing benefits from mill footprint optimization, process improvements and purchasing initiatives Financial Performance ($ in millions, except percentages) Q2 FY17 Q2 FY16 Segment Sales $2,065 $1 , 933 Adj. Segment Income (1) $160 $175 Adj. Segment EBITDA (1) $305 $316 % Margin (1) 15.3% 16 . 9% North America EBITDA Margin (1) 15.9% 17 . 5% Brazil EBITDA Margin (1) 19.4% 23 . 0% Adjusted Segment EBITDA (1) ($ in millions) 27 Foreign exchange translation impact to Q2 FY17 sales and segment income is +$25 million and +$3 million, respectively.

Q2 FY17 Consumer Packaging Results 8 1) Non - GAAP Financial Measure. See Non - GAAP Financial Measures and Reconciliations in Appendix. Segment Highlights: • Adjusted Segment EBITDA margin favorable 100 bps yoy (1) • Shipments of paperboard and converted products were up 0 . 9 % driven by growth in foodservice, liquid packaging and modest gains in folding cartons offset by weaker beverage volumes • Prices reflected flow through of previously published paperboard price decreases • Strong operational execution and realization of productivity benefits • Profitability improvements in Beverage and Displays • Paperboard inventory declined by 69k tons yoy Segment EBITDA Key Bridge Variances: • Volume: Lower pulp sales and stable converted product shipments partially offset by higher paperboard shipments • Price / Mix : Prior year PPW index price reductions partially offset by favorable mix • E/M/F : Increases in recycled fiber, chemicals and energy, partially offset by lower virgin fiber prices • Productivity : Strong synergy and productivity improvements from internalizing SBS volume, procurement savings and operations productivity − Integrating 250k tons per year from merger, Carolina branded products and Cenveo integration Financial Performance ($ in millions, except percentages) Q2 FY17 Q2 FY16 Segment Sales $1,555 $1,588 Adj. Segment Income (1) $119 $102 Adj. Segment EBITDA (1) $235 $224 % Margin (1) 15.1% 14.1% Adjusted Segment EBITDA (1) ($ in millions) Foreign exchange translation impact to Q2 FY17 sales and segment income is $(1) million and $(1) million, respectively. 72 $235 $224 (3) (7) (1) (34) (16) Q2 F Y 16 Volume Price / Mix Energy/ M a t e r i a l s/ Freight W age P r oduc t i v i t y and Other I n f l a t i on O t he r Q2 F Y 17
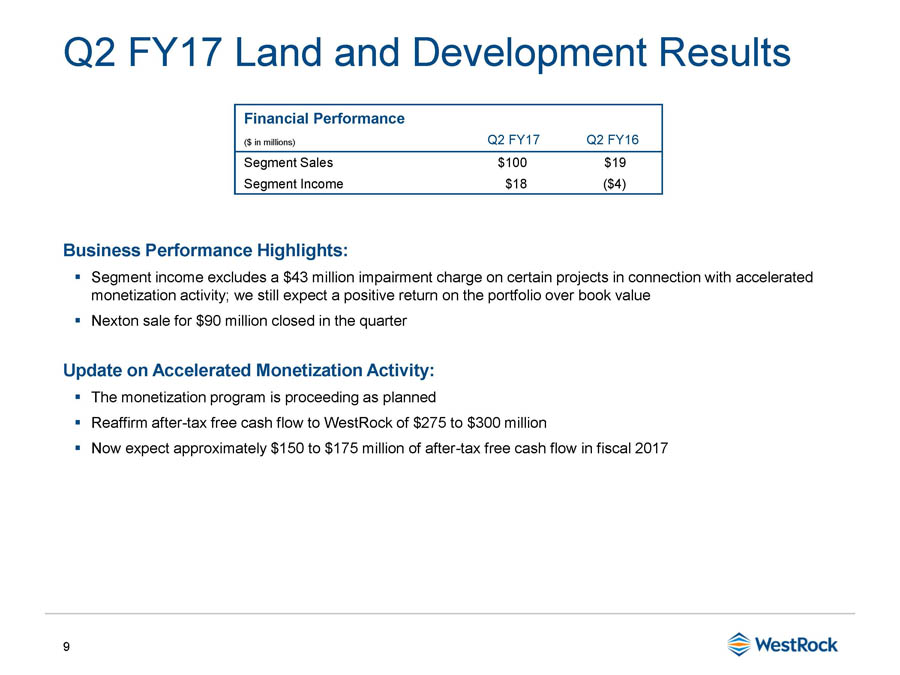
9 Business Performance Highlights: ▪ Segment income excludes a $43 million impairment charge on certain projects in connection with accelerated monetization activity; we still expect a positive return on the portfolio over book value ▪ Nexton sale for $90 million closed in the quarter Update on Accelerated Monetization Activity: ▪ The monetization program is proceeding as planned ▪ Reaffirm after - tax free cash flow to WestRock of $275 to $300 million ▪ Now expect approximately $150 to $175 million of after - tax free cash flow in fiscal 2017 Q2 FY17 Land and Development Results Financial Performance ($ in millions) Q2 FY17 Q2 FY16 Segment Sales $100 $19 Segment Income $18 ($4)

10 $800+ $1 b illi o n Synergy and Performance Improvements On track to achieve $1 billion objective by end of Q3 FY18 $165 million $255 million $350 million $425 million $500 million $580 million $675 million million Q4 F Y 15 Q1 F Y 16 Q2 F Y 16 Q3 F Y 1 6 Q4 F Y 16 Q1 F Y 1 7 Q2 F Y 1 7 FY17 Q3 F Y 1 8 • Achieved annualized run - rate of $675 million at 3/31 • Estimate annualized run - rate of $800+ million by end of FY17 Q2 FY17 PROGRESS 29% Procurement 23% Capital In v e s t m en t Ongoing Produ c t i v i ty 35% Corporate & 13% Support $1 billion RUN - RATE AT 3/31/17 THREE YEAR GOAL $675 milli o n Corporate & 10% Support 25% Capital In v e s t m en t Ongoing Produ c t i v i ty 35% 30% Procurement

11 Capital E x penditures $1,389 million 40% Dividends $680 million 20% Stock Re p urchase s $756 million 22% M&A $620 million 18% Allocated Capital Since Merger (1) $3.4 billion Disciplined Capital Allocation Strategy Focused on Value Creation 1) At end of Q2 FY17. Excludes merger - related share repurchases for $668 million. • Annual dividend of $1.60 per share • Increased annual dividend by 6.7% in Nov. 2016 • Q2 FY17: $101 million • Maintenance capital expenditures: 60% • Cost reduction or strategic capital expenditures: 40% • Q2 FY17: $189 million • 15.3 million shares repurchased • 6% of shares outstanding • Q4 FY15: $328 million • FY16: $335 million • FY17 YTD: $93 million • Acquisition of SP Fiber • Acquisition of Cenveo Packaging • JV with Grupo Gondi • Acquisition of Star Pizza • $1.4 billion returned to stockholders in last 7 quarters

Guidance Scheduled Maintenance Downtime (tons) – North America Q1 FY17 Q2 FY17 Q3 FY17 Q4 FY17 Total FY17 Corrugated Mills 115K 78K 40K 15K 248K Consumer Mills 30K 2K 35K 5K 72K 12 1) Non - GAAP Financial Measure. We believe the most directly comparable GAAP measure is Operating Cash Flow. See Forward Looking Guidance in Non GAAP Financial Measures in Appendix FY17 Adjusted Free Cash Flow (1) $1.2 Billion – Excludes impact of MPS Q3 FY17 Pre - Tax Earnings Drivers as Compared to Q2 FY17 Higher than Q2 FY17 Adjusted EPS of $0.54 (excl. MPS) Acquisition of MPS Excluded from guidance Volumes Positive due to seasonally stronger third quarter volumes Price / Mix / Pulp ~ $50 - $70 million Sequentially positive as flow - through of previously announced sequential benefit Corrugated and Consumer price increases occur Productivity Commodity Inflation ~ $10 - $20 million Negative sequential impact driven by recycled fiber neg. sequential impact and chemicals, partially offset by lower energy costs Sale of Home, Health and Beauty ~ $27 million Divested in early April neg. sequential impact Land and Development ~ $15 million L&D results included in adj. EBITDA and neg. sequential impact FCF but excluded from adj. EPS Book Tax Rate for Adjusted EPS 34%

WestRock Building a Paper and Packaging Leader 13 1) Non - GAAP Financial Measure. We believe the most directly comparable GAAP measure is Operating Cash Flow. See Forward Looking Guidance in Non GAAP Financial Measures in Appendix Co m p re h e n si v e Portfolio of Paper and Packaging Solutions • Holds #1 or #2 positions in attractive paper and packaging markets • Unmatched breadth of product offerings, capabilities and geographic reach • Differentiated paper and packaging solutions that help our customers win Track Record of Solid Execution • Strong productivity gains with $103 million realized in the quarter • Run - rate of $675 million; expect to exceed $800 million run - rate by end of FY17 and to achieve $1 billion goal by end of Q3 FY18 • Reaffirm $1.2 billion adjusted free cash flow guidance for FY17 (1) Growing S h are ho l d er Value Using Disciplined Capital Allocation • Completed divestiture of Home, Health and Beauty business and realized net proceeds of $1 billion, after taxes and transaction expenses • Announced planned acquisition of Multi Packaging Solutions for $2.3 billion • Acquired Star Pizza, an innovative provider of customized foodservice packaging • Repurchased $25 million of stock during the quarter; 15.3 million cumulative shares purchased under authorization at average price of $49 per share • Returned $1.4 billion to stockholders since merger through dividends and share repurchases

App e ndix

15 Non - GAAP Financial Measures Credit Agreement EBITDA “Credit Agreement EBITDA” is calculated in accordance with the definition contained in our Credit Agreement. Credit Agreement EBITDA is generally defined as Consolidated Net Income plus: consolidated interest expense, income taxes of the consolidated companies det ermined in accordance with GAAP, depreciation and amortization expense of the consolidated companies determined in accordance with GAAP, loss on extinguishment of debt and financing fees, certain non - cash and cash charges incurred, including goodwill impairment, certain restructuring and other costs, merger / acquisition and integration costs, charges and expenses associated with the write - up of inventory acquired and other items. LTM Credit Agreement EBITDA margin is calculated by dividing LTM Credit Agreement EBITDA by Net Sales adjusted for Trade Sales. Adjusted Free Cash Flow Free Cash Flow is defined as Cash Provided by Operating Activities, excluding after - tax cash restructuring costs minus capital expenditures. We believe the most directly comparable GAAP measure is net cash provided by operating activities. Management believes this is an important measure in evaluating our financial performance and measures our ability to generate cash without incurring additional external financings. Total Funded Debt and Leverage Ratio “Total Funded Debt” is calculated in accordance with the definition contained in our Credit Agreement. Total Funded Debt is generally defined as aggregate debt obligations reflected in our balance sheet less the stepped up value of said debt, less non - recourse debt except for Securitization related debt, less trade payables related debt that may be recharacterized as debt, less insurance policy loans to the extent offset by assets of the applicable insurance policies, obligations with the hedge adjustments resulting from terminated and existing fair value interest rate derivatives or swaps, if any, less certain cash, plus additional outstanding letters of credit not already reflected in debt and certain guarantees. Our management uses Credit Agreement EBITDA and Total Funded Debt to evaluate compliance with our debt covenants and borrowing capacity available under our Credit Agreement, as a measure of operating performance and to compare to our target Leverage Ratio of 2.25x – 2.50x. Management believes that investors also use these measures to evaluate our compliance with our debt covenants and available borrowing capacity. Borrowing capacity is dependent upon, in addition to other measures, the “Credit Agreement Debt/EBITDA ratio” or the “Leverage Ratio,” which is defined as Total Funded Debt divided by Credit Agreement EBITDA. As of the March 31, 2017 calculation, our Leverage Ratio was 2.32 times. While the Leverage Ratio under the Credit Agreement determines the credit spread on our debt we are not subject to a Leverage Ratio cap. The Credit Agreement is subject to a Debt to Capitalization and Consolidated Interest Coverage Ratio, as defined in the Credit Agreement.

16 Non - GAAP Financial Measures (cont.) Adjusted Segment EBITDA Margins Our management uses “Adjusted Segment EBITDA Margins”, along with other factors, to evaluate our segment performance against our peers. Management believes that investors also use this measure to evaluate our performance relative to our peers. “Adjusted Segment EBITDA Margin” is calculated for each segment by dividing that segment’s Adjusted Segment EBITDA by Adjusted Segment Sales. “Adjusted Segment EBITDA” is calculated for each segment by adding that segment’s “Adjusted Segment Income” to its Depreciation, Depletion and Amortization. Adjusted Earnings Per Diluted Share We also use the non - GAAP measure “adjusted earnings per diluted share,” also referred to as “adjusted earnings per share” or “Adjusted EPS.” Management believes this non - GAAP financial measure provides our board of directors, investors, potential investors, securities analysts and others with useful information to evaluate our performance because it excludes restructuring and other costs, net, and other specific items that management believes are not indicative of the ongoing operating results of the business. We and our board of directors use this information to evaluate our performance relative to other periods. Forward - looking Guidance We are not providing forward - looking guidance for U.S. GAAP reported financial measures or a reconciliation of forward - looking non - GAAP financial measures to the most directly comparable U.S. GAAP measure because it is unable to predict with reasonable certainty the ultimate outcome of certain significant items without unreasonable effort. These items include, but are not limited to, merger and acquisition - related expenses, restructuring expenses, asset impairments, litigation settlements, changes to contingent consideration and certain other gains or losses. These items are uncertain, depend on various factors, and could have a material impact on U.S. GAAP reported results for the guidance period.

17 Q2 FY17 Adjusted Earnings Per Share Reconciliation 1) Net of $6.4 million of noncontrolling interest in Q2 FY17 2) Q2 FY17 had no discontinued operations ($ in millions, except per share data) Q2 FY17 $ 103 . 1 ( 7 . 8 ) ( 11 . 0 ) 21.9 17.7 12.0 1.1 Net Income attributable to common stockholders HH&B – impact of held for sale accounting, net of income tax expense of $2.3 Land and Development operating results, net of income tax expense of $7.2 Land and Development impairment, net of income tax benefit of $14.4 (1) Pension lump sum settlement, net of income tax benefit of $11.1 Restructuring and other items, net of income tax benefit of $11.4 Loss on contribution of subsidiary, net of income tax benefit of $0.6 Acquisition inventory step - up, net of income tax benefit of $0.2 Adjusted net income 0 . 3 $ 137 . 3 $ 0.40 ( 0 . 03 ) ( 0 . 04 ) 0.09 0.07 0.05 - Earnings per diluted share (2) HH&B – impact of held for sale accounting Land and Development operating results Land and Development impairment Pension lump sum settlement Restructuring and other items Loss on contribution of subsidiary Acquisition inventory step - up Adjusted earnings per diluted share (2) - $ 0 . 5 4

18 Q2 FY16 Adjusted Earnings Per Share Reconciliation ($ in millions, except per share data) Q2 FY16 $ 56.9 ( 1 . 4 ) Net Income attributable to common stockholders Less: Income from discontinued operations, net of income tax expense of $5.9 Less: Net income attributable to noncontrolling interests Income from continuing operations 2 . 9 $ 58 . 4 Land and Development operating results, net of income tax benefit of $1.3 Restructuring and other items from continuing operations, net of income tax benefit of $33.1 Acquisition inventory step - up from continuing operations, net of income tax benefit of $0.6 Less: Net income attributable to noncontrolling interests from continued operations Adjusted income from continuing operations 1 . 9 81 . 5 1 . 4 ( 1 . 3 ) $ 141 . 9 $ 0 . 2 2 0 . 0 1 0 . 3 1 Earnings per diluted share / Earnings per share from continuing operations Land and Development impairment Restructuring and other items from continuing operations Acquisition inventory step - up from continuing operations Adjusted earnings from continuing operations per diluted share 0 . 0 1 $ 0 . 5 5

19 Q2 FY17 Adjusted Segment Sales, Adjusted EBITDA and Adjusted EBITDA Margin Q2 FY17 ($ in millions, except percentages) Corrugated Packaging Consumer Packaging Land and Development Corporate / Eliminations C on s o li da t e d Segment Net Sales $ 2,065.0 $ 1,554.6 $ 100.0 $ ( 63 . 3 ) $ 3 , 656 . 3 Less: Trade Sales ( 72 . 0 ) - - - ( 72 . 0 ) Adjusted Segment Sales $ 1 , 993 . 0 $ 1 , 554 . 6 $ 100 . 0 $ ( 63 . 3 ) $ 3 , 584 . 3 Segment Income $ 159.5 $ 118.8 $ 17.5 $ - $ 295 . 8 Non - allocated Expenses - - - ( 12 . 6 ) ( 12 . 6 ) Depreciation and Amortization 145 . 3 116 . 3 0 . 2 2 . 1 263 . 9 Less: Deferred Financing Costs - - - ( 1 . 1 ) ( 1 . 1 ) Segment EBITDA 304 . 8 235 . 1 17 . 7 ( 11 . 6 ) 546 . 0 Plus: Inventory Step - up 0 . 5 - - - 0 . 5 Adjusted Segment EBITDA $ 305 . 3 $ 235 . 1 $ 17 . 7 $ ( 11 . 6 ) $ 546 . 5 Segment EBITDA Margins 14 . 8 % 15 . 1 % Adjusted Segment EBITDA Margins 15 . 3 % 15 . 1 %

20 Q2 FY16 Adjusted Segment Sales, Adjusted EBITDA and Adjusted EBITDA Margin Q2 FY16 ($ in millions, except percentages) Corrugated Packaging Consumer Packaging Land and Development Corporate / Eliminations C on s o li da t e d Segment Net Sales $ 1,932.8 $ 1,588.4 $ 18.7 $ ( 47 . 2 ) $ 3 , 492 . 7 Less: Trade Sales ( 67 . 4 ) - - - ( 67 . 4 ) Adjusted Segment Sales $ 1 , 865 . 4 $ 1 , 588 . 4 $ 18 . 7 $ ( 47 . 2 ) $ 3 , 425 . 3 Segment Income (Loss) $ 175.0 $ 99.7 $ ( 4 . 0 ) $ - $ 270 . 7 Non - allocated Expenses - - - ( 9 . 2 ) ( 9 . 2 ) Depreciation and Amortization 140 . 8 122 . 6 0 . 2 4 . 7 268 . 3 Less: Deferred Financing Costs - - - ( 1 . 1 ) ( 1 . 1 ) Segment EBITDA 315 . 8 222 . 3 ( 3 . 8 ) ( 5 . 6 ) 528 . 7 Plus: Inventory Step - up - 1 . 8 - - 1 . 8 Adjusted Segment EBITDA $ 315 . 8 $ 224 . 1 $ ( 3 . 8 ) $ ( 5 . 6 ) $ 530 . 5 Segment EBITDA Margins 16 . 3 % 14 . 0 % Adjusted Segment EBITDA Margins 16 . 9 % 14 . 1 %

Corrugated Packaging EBITDA Margins Q2 FY17 C o rr uga t e d ($ in millions, except percentages) North America Brazil Other Packaging Segment Net Sales $ 1,807.3 $ 104 . 7 $ 153.0 $ 2,065.0 Less: Trade Sales (72.0) - - ( 72 . 0 ) Adjusted Segment Sales $ 1,735.3 $ 104 . 7 $ 153.0 $ 1,993.0 Segment Income $ 146.7 $ 5 . 8 $ 7.0 $ 159.5 Depreciation and Amortization 128.2 14 . 5 2 . 6 145 . 3 Segment EBITDA 274 . 9 20 . 3 9 . 6 304 . 8 Plus: Inventory Step - up 0 . 5 - - 0 . 5 Adjusted Segment EBITDA $ 275.4 $ 20 . 3 $ 9.6 $ 305.3 Segment EBITDA Margins 15 . 2 % 19 . 4 % 14 . 8 % Adjusted Segment EBITDA Margins 15 . 9 % 19 . 4 % 15 . 3 % Q2 FY16 ($ in millions, except percentages) North America Brazil Other Corrugated Packaging Segment Net Sales $ 1,740.9 $ 80 . 8 $ 111.1 $ 1,932.8 Less: Trade Sales (67.4) - - ( 67 . 4 ) Adjusted Segment Sales $ 1,673.5 $ 80 . 8 $ 111.1 $ 1,865.4 Segment Income $ 166.3 $ 6 . 6 $ 2.1 $ 175.0 Depreciation and Amortization 126.0 12 . 0 2 . 8 140 . 8 Segment EBITDA 292 . 3 18 . 6 4 . 9 315 . 8 Plus: Inventory Step - up Adjusted Segment EBITDA - $ 292.3 - $ 18.6 - $ 4.9 - $ 315.8 Segment EBITDA Margins 16 . 8 % 23 . 0 % 16 . 3 % Adjusted Segment EBITDA Margins 17 . 5 % 23 . 0 % 16 . 9 % 21
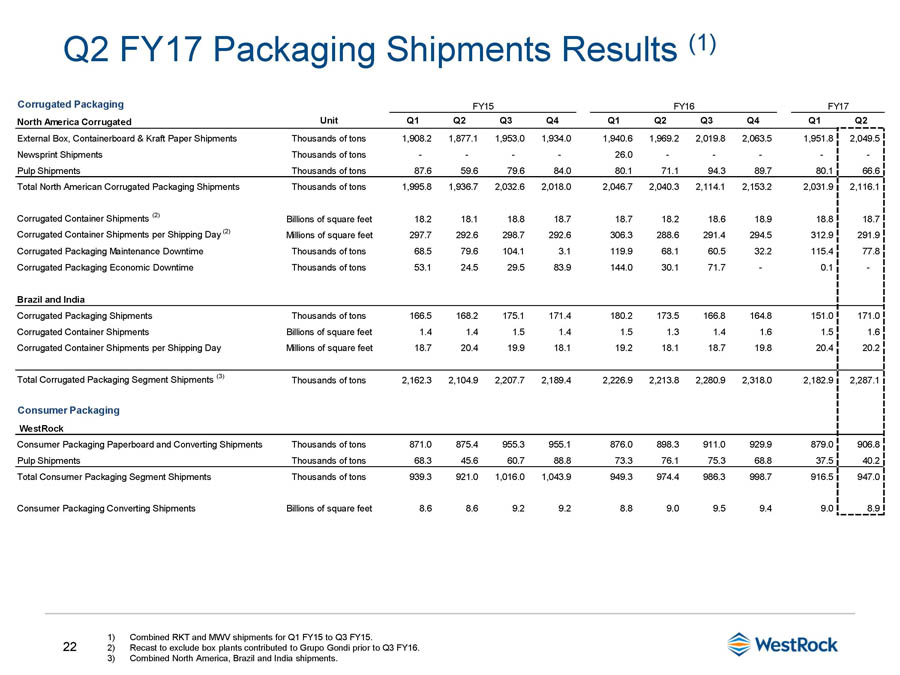
22 Q2 FY17 Packaging Shipments Results (1) 1) Combined RKT and MWV shipments for Q1 FY15 to Q3 FY15. 2) Recast to exclude box plants contributed to Grupo Gondi prior to Q3 FY16. 3) Combined North America, Brazil and India shipments. Corrugated Packaging North America Corrugated U ni t FY15 Q1 Q2 Q3 Q4 FY16 Q1 Q2 Q3 Q4 FY17 Q1 Q2 External Box, Containerboard & Kraft Paper Shipments Newsprint Shipments Pulp Shipments Thousands of tons Thousands of tons Thousands of tons 1,908.2 - 87 . 6 1,877.1 - 59 . 6 1,953.0 - 79 . 6 1,934.0 - 84 . 0 1,940.6 26.0 80.1 1,969.2 - 71 . 1 2,019.8 - 94 . 3 2,063.5 - 89 . 7 1,951.8 - 80 . 1 2,049.5 - 66 . 6 Total North American Corrugated Packaging Shipments Thousands of tons 1 , 995 . 8 1 , 936 . 7 2 , 032 . 6 2 , 018 . 0 2 , 046 . 7 2 , 040 . 3 2 , 114 . 1 2 , 153 . 2 2 , 031 . 9 2 , 116 . 1 Corrugated Container Shipments (2) Billions of square feet 18 . 2 18 . 1 18 . 8 18 . 7 18 . 7 18 . 2 18 . 6 18 . 9 18 . 8 18 . 7 Corrugated Container Shipments per Shipping Day (2) Millions of square feet 297 . 7 292 . 6 298 . 7 292 . 6 306 . 3 288 . 6 291 . 4 294 . 5 312 . 9 291 . 9 Corrugated Packaging Maintenance Downtime Thousands of tons 68 . 5 79 . 6 104 . 1 3 . 1 119 . 9 68 . 1 60 . 5 32 . 2 115 . 4 77 . 8 Corrugated Packaging Economic Downtime Thousands of tons 53 . 1 24 . 5 29 . 5 83 . 9 144 . 0 30 . 1 71 . 7 - 0 . 1 - Brazil and India Corrugated Packaging Shipments Thousands of tons 166 . 5 168 . 2 175 . 1 171 . 4 180 . 2 173 . 5 166 . 8 164 . 8 151 . 0 171 . 0 Corrugated Container Shipments Billions of square feet 1 . 4 1 . 4 1 . 5 1 . 4 1 . 5 1 . 3 1 . 4 1 . 6 1 . 5 1 . 6 Corrugated Container Shipments per Shipping Day Millions of square feet 18 . 7 20 . 4 19 . 9 18 . 1 19 . 2 18 . 1 18 . 7 19 . 8 20 . 4 20 . 2 Total Corrugated Packaging Segment Shipments (3) Consumer Packaging WestRock Thousands of tons 2 , 162 . 3 2 , 104 . 9 2 , 207 . 7 2 , 189 . 4 2 , 226 . 9 2 , 213 . 8 2 , 280 . 9 2 , 318 . 0 2 , 182 . 9 2 , 287 . 1 Consumer Packaging Paperboard and Converting Shipments Thousands of tons 871 . 0 875 . 4 955 . 3 955 . 1 876 . 0 898 . 3 911 . 0 929 . 9 879 . 0 906 . 8 Pulp Shipments Thousands of tons 68 . 3 45 . 6 60 . 7 88 . 8 73 . 3 76 . 1 75 . 3 68 . 8 37 . 5 40 . 2 Total Consumer Packaging Segment Shipments Thousands of tons 939 . 3 921 . 0 1 , 016 . 0 1 , 043 . 9 949 . 3 974 . 4 986 . 3 998 . 7 916 . 5 947 . 0 Consumer Packaging Converting Shipments Billions of square feet 8 . 6 8 . 6 9 . 2 9 . 2 8 . 8 9 . 0 9 . 5 9 . 4 9 . 0 8 . 9
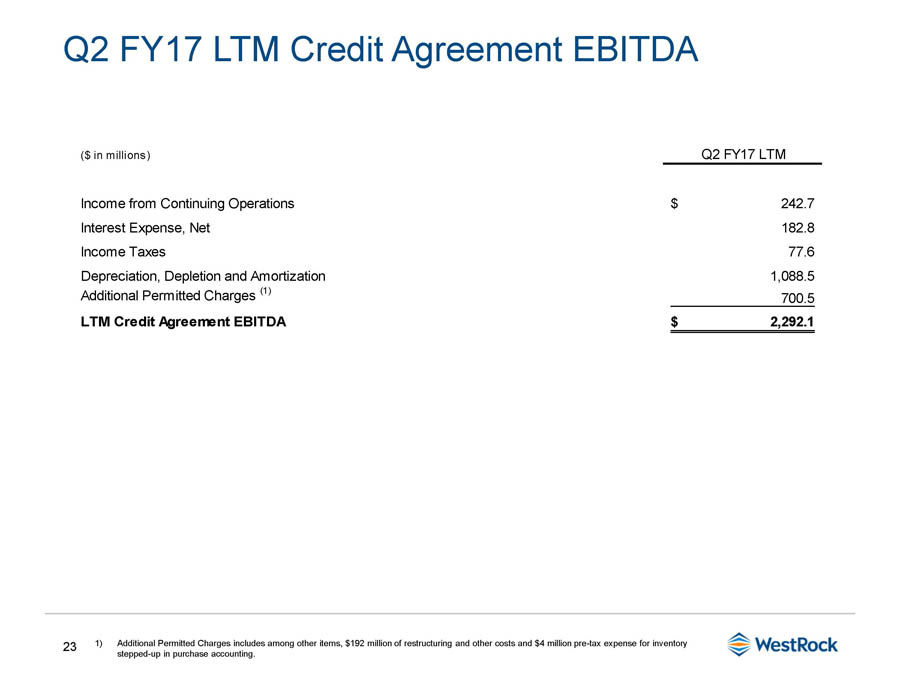
23 Q2 FY17 LTM Credit Agreement EBITDA 1) Additional Permitted Charges includes among other items, $192 million of restructuring and other costs and $4 million pre - tax expense for inventory stepped - up in purchase accounting. ($ in millions) Q2 FY17 LTM $ 242 . 7 182 . 8 77 . 6 1 , 088 . 5 Income from Continuing Operations Interest Expense, Net Income Taxes Depreciation, Depletion and Amortization Additional Permitted Charges (1) LTM Credit Agreement EBITDA 700 . 5 $ 2 , 292 . 1
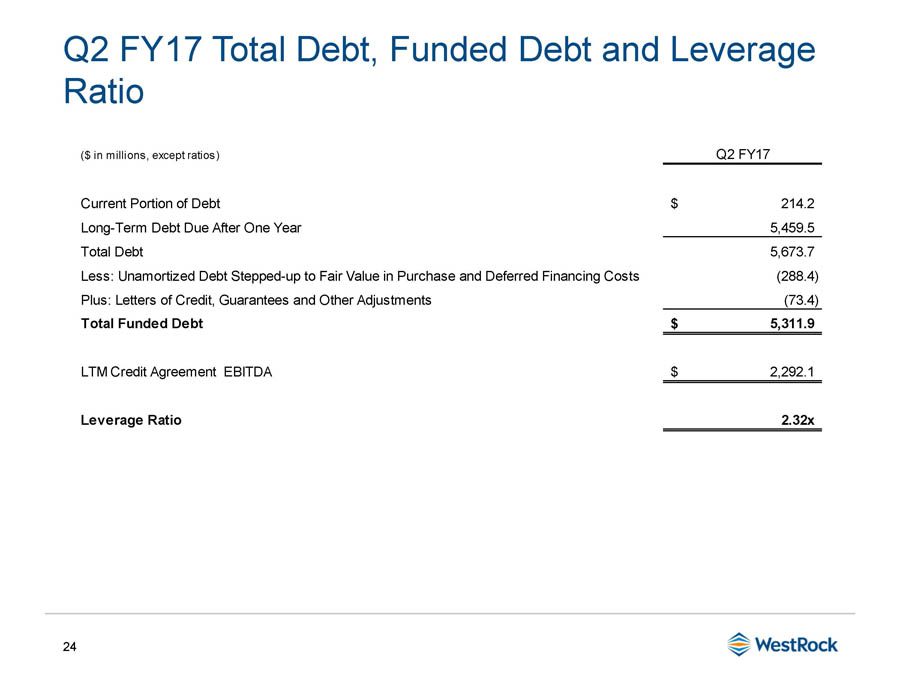
24 Q2 FY17 Total Debt, Funded Debt and Leverage Ratio ($ in millions, except ratios) Q2 FY17 $ 214 . 2 5 , 459 . 5 5 , 673 . 7 ( 288 . 4 ) ( 73 . 4 ) Current Portion of Debt Long - Term Debt Due After One Year Total Debt Less: Unamortized Debt Stepped - up to Fair Value in Purchase and Deferred Financing Costs Plus: Letters of Credit, Guarantees and Other Adjustments Total Funded Debt 5 , 311 . 9 $ LTM Credit Agreement EBITDA 2 , 292 . 1 $ Leverage Ratio 2 . 32 x
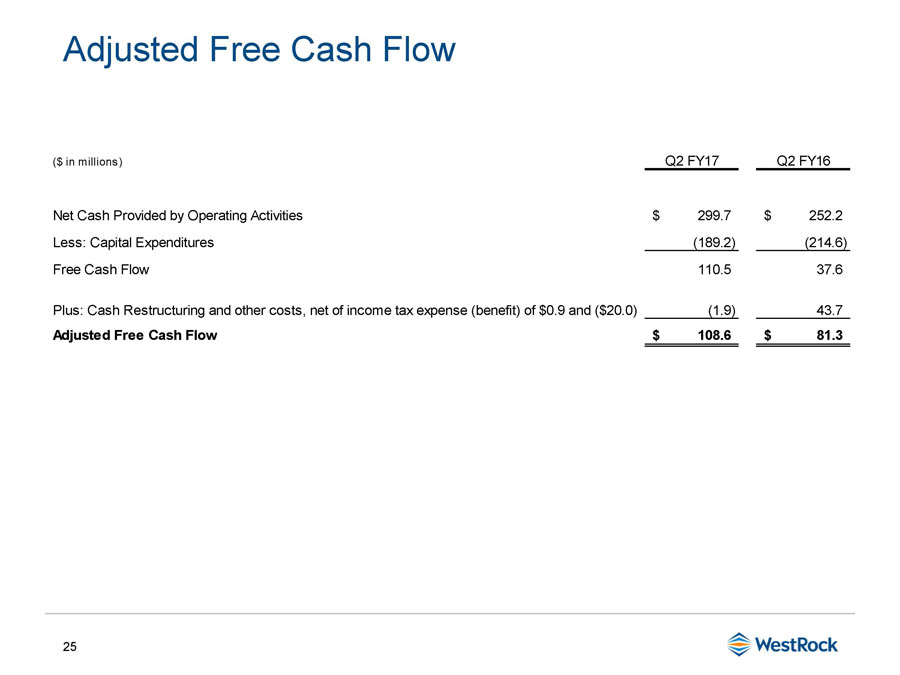
25 Adjusted Free Cash Flow ($ in millions) Q2 FY17 Q2 FY16 Net Cash Provided by Operating Activities $ 299.7 $ 252.2 Less: Capital Expenditures ( 189 . 2 ) (214.6) Free Cash Flow 110 . 5 37.6 Plus: Cash Restructuring and other costs, net of income tax expense (benefit) of $0.9 and ($20.0) ( 1 . 9 ) 43.7 Adjusted Free Cash Flow $ 108.6 $ 81.3
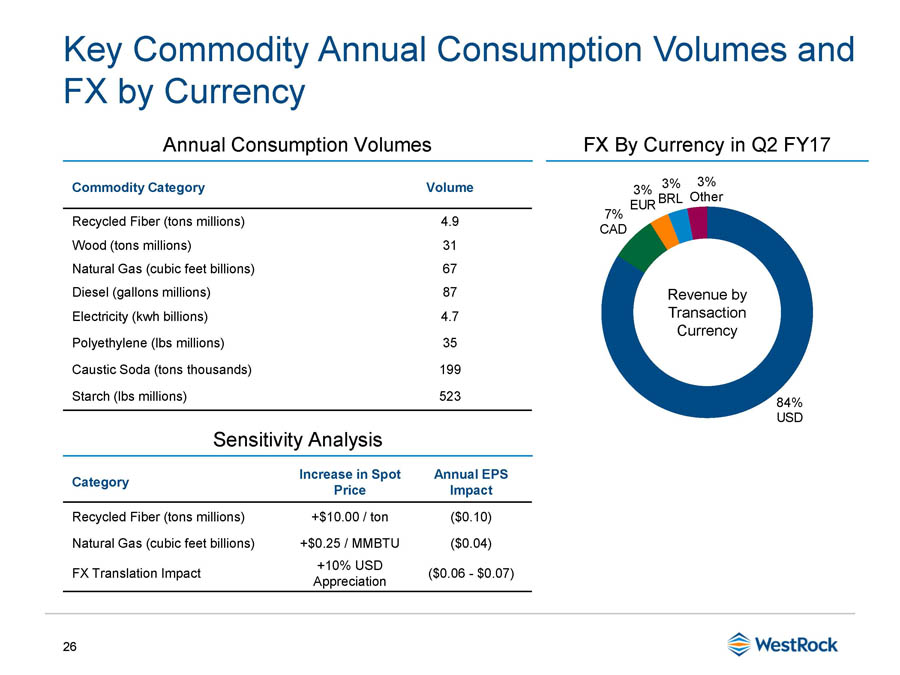
26 84 % U S D 7% C A D 3 % 3 % 3 % EUR BRL Other Key Commodity Annual Consumption Volumes and FX by Currency Commodity Category Volume Recycled Fiber (tons millions) 4.9 Wood (tons millions) 31 Natural Gas (cubic feet billions) 67 Diesel (gallons millions) 87 Electricity (kwh billions) 4.7 Polyethylene (lbs millions) 35 Caustic Soda (tons thousands) 199 Starch (lbs millions) 523 Annual Consumption Volumes FX By Currency in Q2 FY17 Sensitivity Analysis Category Increase in Spot Price Annual EPS Impact Recycled Fiber (tons millions) +$10.00 / ton ($0.10) Natural Gas (cubic feet billions) +$0.25 / MMBTU ($0.04) FX Translation Impact +10% USD Appreciation ($0.06 - $0.07) Revenue by T ransaction Currency

* Wes t Roc k