Attached files
| file | filename |
|---|---|
| EX-99.1 - EXHIBIT 99.1 - Clearwater Paper Corp | a51544013ex99_1.htm |
| 8-K - CLEARWATER PAPER CORPORATION 8-K - Clearwater Paper Corp | a51544013.htm |
Exhibit 99.2

Clearwater Paper CorporationFIRST quarter 2017 Supplemental Information Linda Massman President, Chief Executive Officer and DirectorJohn HertzSenior Vice President Finance and Chief Financial Officer 04/20/17
Forward-Looking Statements This presentation of supplemental information contains, in addition to historical information, certain forward-looking statements within the meaning of the Private Securities Litigation Reform Act of 1995, including statements regarding outlook for Q2 2017; the costs, timing and benefits associated with strategic capital investments and operational improvements; financial models; estimated Q2 2017 net earnings, EBITDA, adjusted EBITDA, operating income, adjusted operating income, adjusted net earnings, net earnings per diluted common share, adjusted net earnings per diluted common share, net sales and adjusted operating margin; product volumes shipped; product pricing and sales mix; pulp costs; cost and timing of major maintenance and repairs; inventory unit costs; and productivity gains. These forward-looking statements are based on management’s current expectations, estimates, assumptions and projections that are subject to change. Our actual results of operations may differ materially from those expressed or implied by the forward-looking statements contained in this presentation. Important factors that could cause or contribute to such differences include the risks and uncertainties described from time to time in the company's public filings with the Securities and Exchange Commission, as well as the following: our ability to execute on our growth and expansion strategies; unanticipated construction delays involving our planned new tissue manufacturing operations in Shelby, NC; competitive pricing pressures for our products, including as a result of increased capacity as additional manufacturing facilities are operated by our competitors; customer acceptance and timing and quantity of purchases of our tissue products, including the existence of sufficient demand for and the quality of tissue produced at our newly announced Shelby, NC facility when it becomes operational; changes in the U.S. and international economies and in general economic conditions in the regions and industries in which we operate; the loss of or changes in prices in regards to a significant customer; our ability to successfully implement our operational efficiencies and cost savings strategies; changes in customer product preferences and competitors' product offerings;manufacturing or operating disruptions, including IT system and IT system implementation failures, equipment malfunction and damage to our manufacturing facilities; changes in transportation costs and disruptions in transportation services; changes in the cost and availability of wood fiber and wood pulp; labor disruptions; cyclical industry conditions; changes in costs for and availability of packaging supplies, chemicals, energy and maintenance and repairs; environmental liabilities or expenditures; our ability to realize the expected benefits of our Manchester Industries acquisition;changes in expenses and required contributions associated with our pension plans; cyber-security risks;reliance on a limited number of third-party suppliers for raw materials; our inability to service our debt obligations;restrictions on our business from debt covenants and terms; andchanges in laws, regulations or industry standards affecting our business.Forward-looking statements contained in this presentation present management’s views only as of the date of this presentation. We undertake no obligation to publicly update forward-looking statements, whether as a result of new information, future events or otherwise. 1
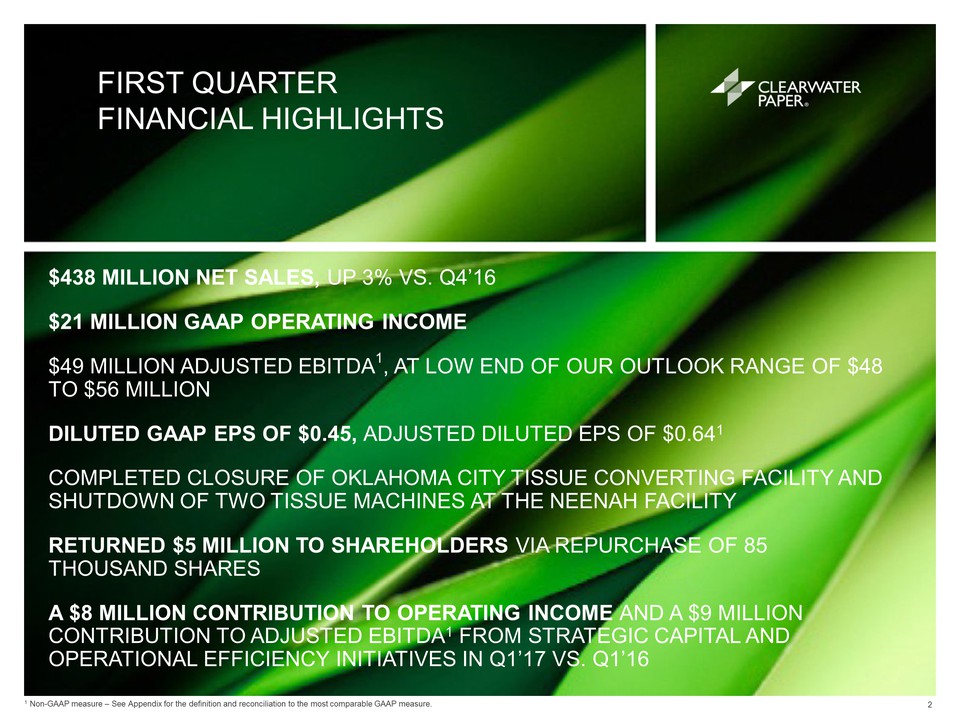
FIRST Quarter financial highlights $438 million net sales, up 3% VS. Q4’16 $21 million gaap operating income$49 million adjusted EBitda1, at low end of OUR outlook range of $48 to $56 millionDiluted gaap eps of $0.45, adjusted diluted eps of $0.641completed closure of Oklahoma city tissue converting facility and shutdown of two tissue machines at the Neenah facilityReturned $5 million to shareholders VIA repurchase of 85 thousand sharesA $8 million contribution to operating income and A $9 million contribution to adjusted ebitda1 from strategic capital and operational efficiency initiatives in q1’17 vs. Q1’16 2 1 Non-GAAP measure – See Appendix for the definition and reconciliation to the most comparable GAAP measure.
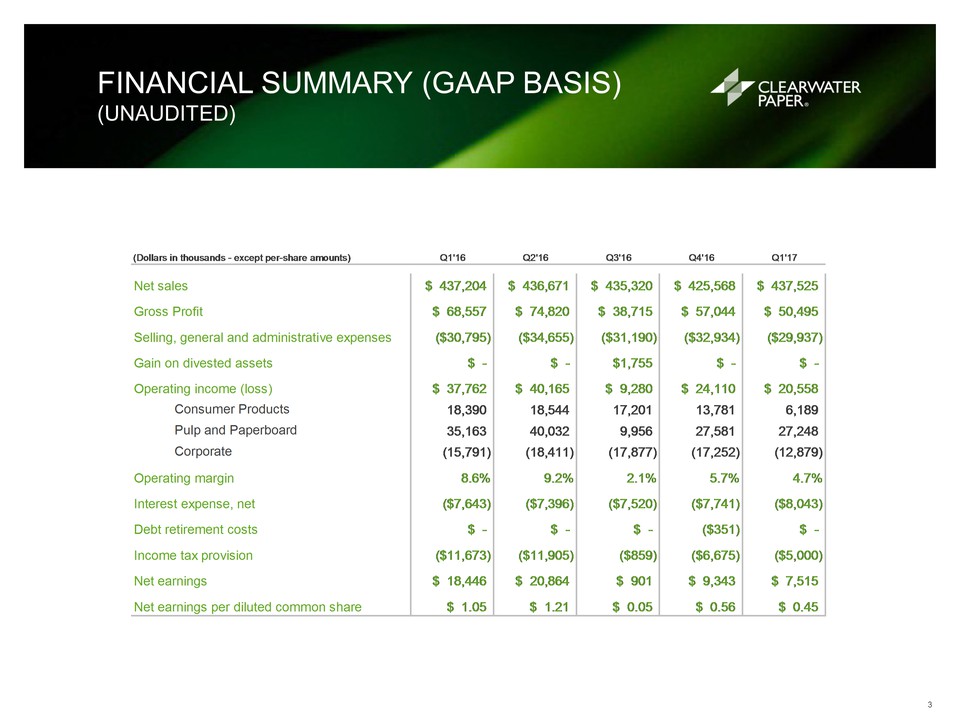
Financial Summary (GAAP basis)(Unaudited) 3
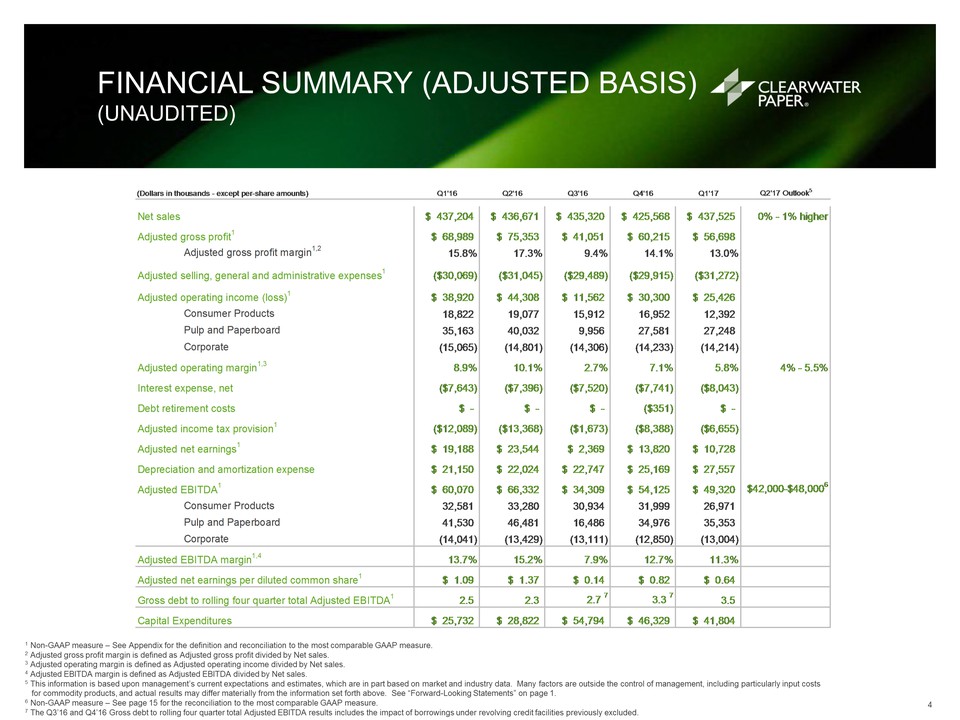
Financial Summary (adjusted basis)(Unaudited) 1 Non-GAAP measure – See Appendix for the definition and reconciliation to the most comparable GAAP measure.2 Adjusted gross profit margin is defined as Adjusted gross profit divided by Net sales.3 Adjusted operating margin is defined as Adjusted operating income divided by Net sales.4 Adjusted EBITDA margin is defined as Adjusted EBITDA divided by Net sales.5 This information is based upon management’s current expectations and estimates, which are in part based on market and industry data. Many factors are outside the control of management, including particularly input costs for commodity products, and actual results may differ materially from the information set forth above. See “Forward-Looking Statements” on page 1.6 Non-GAAP measure – See page 15 for the reconciliation to the most comparable GAAP measure.7 The Q3’16 and Q4’16 Gross debt to rolling four quarter total Adjusted EBITDA results includes the impact of borrowings under revolving credit facilities previously excluded... 4
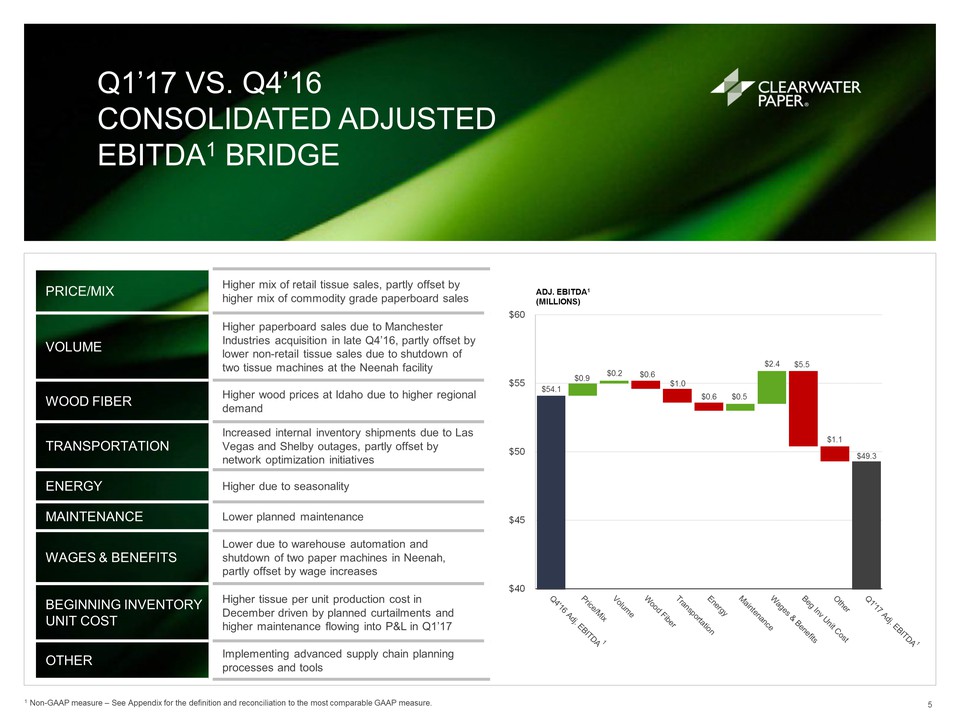
Q1’17 vs. Q4’16Consolidated Adjusted EBITDA1 Bridge 5 1 Non-GAAP measure – See Appendix for the definition and reconciliation to the most comparable GAAP measure. Price/mix Higher mix of retail tissue sales, partly offset by higher mix of commodity grade paperboard sales volume Higher paperboard sales due to Manchester Industries acquisition in late Q4’16, partly offset bylower non-retail tissue sales due to shutdown of two tissue machines at the Neenah facility Wood Fiber Higher wood prices at Idaho due to higher regional demand TRANSPORTATION Increased internal inventory shipments due to Las Vegas and Shelby outages, partly offset by network optimization initiatives energy Higher due to seasonality Maintenance Lower planned maintenance Wages & benefits Lower due to warehouse automation and shutdown of two paper machines in Neenah, partly offset by wage increases Beginning inventory unit cost Higher tissue per unit production cost in December driven by planned curtailments and higher maintenance flowing into P&L in Q1’17 Other Implementing advanced supply chain planning processes and tools
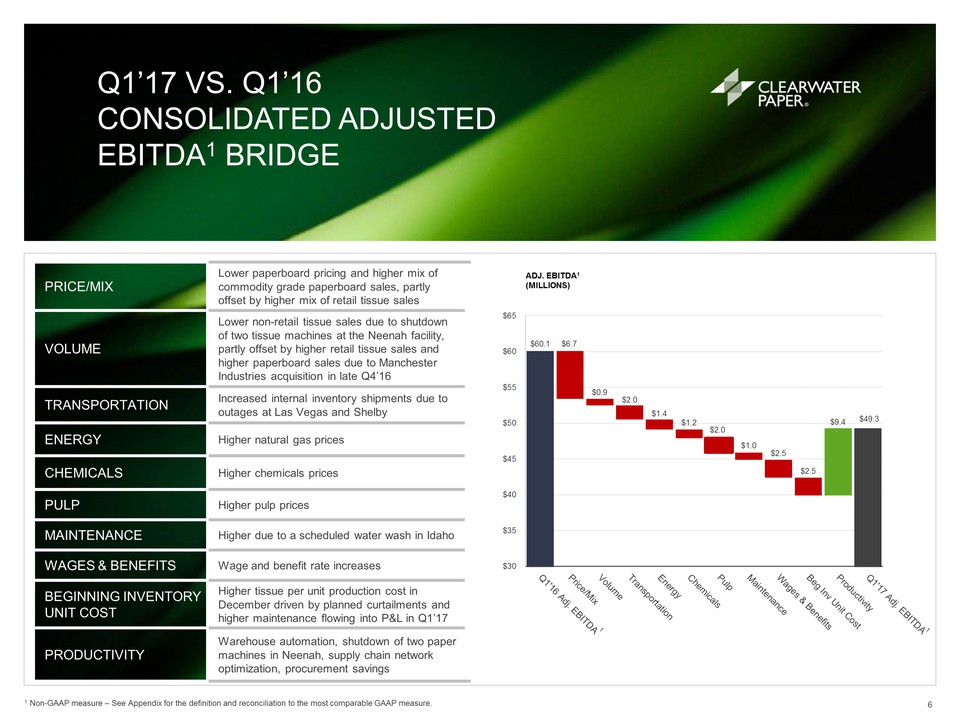
Q1’17 vs. Q1’16Consolidated Adjusted EBITDA1 Bridge 6 1 Non-GAAP measure – See Appendix for the definition and reconciliation to the most comparable GAAP measure. Price/Mix Lower paperboard pricing and higher mix of commodity grade paperboard sales, partly offset by higher mix of retail tissue sales Volume Lower non-retail tissue sales due to shutdown of two tissue machines at the Neenah facility, partly offset by higher retail tissue sales and higher paperboard sales due to Manchester Industries acquisition in late Q4’16 transportation Increased internal inventory shipments due to outages at Las Vegas and Shelby Energy Higher natural gas prices Chemicals Higher chemicals prices pulp Higher pulp prices Maintenance Higher due to a scheduled water wash in Idaho Wages & Benefits Wage and benefit rate increases Beginning inventory unit cost Higher tissue per unit production cost in December driven by planned curtailments and higher maintenance flowing into P&L in Q1’17 Productivity Warehouse automation, shutdown of two paper machines in Neenah, supply chain network optimization, procurement savings
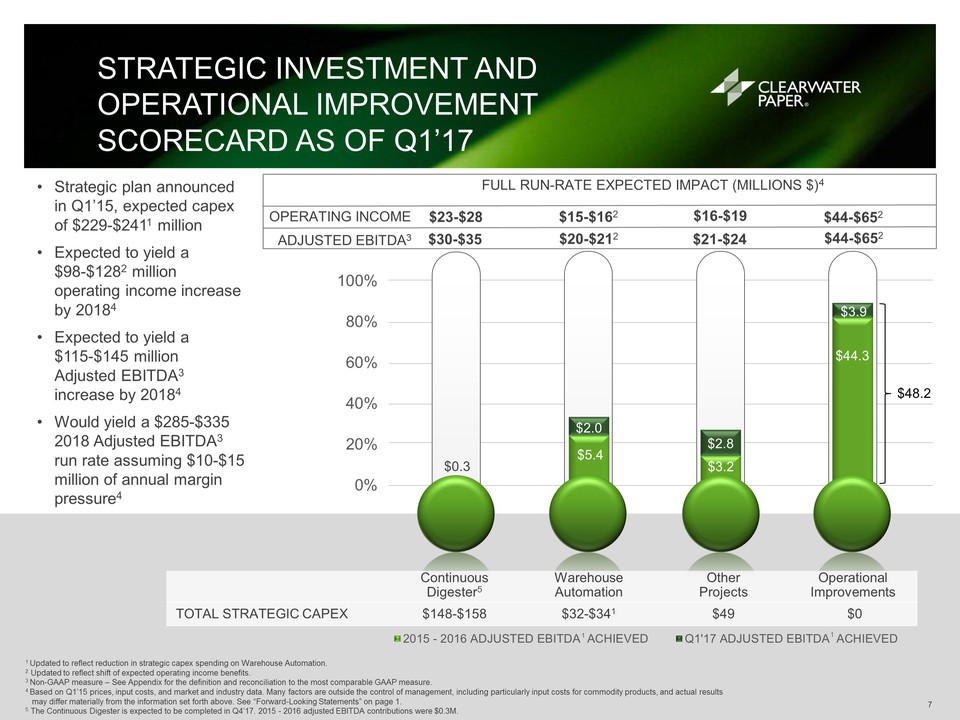
Strategic investment and operational improvement scorecard as of Q1’17 7 Strategic plan announced in Q1’15, expected capex of $229-$2411 millionExpected to yield a $98-$1282 million operating income increase by 20184Expected to yield a $115-$145 million Adjusted EBITDA3 increase by 20184Would yield a $285-$335 2018 Adjusted EBITDA3 run rate assuming $10-$15 million of annual margin pressure4 Continuous Digester5 Warehouse Automation Other Projects Operational Improvements TOTAL STRATEGIC CAPEX $148-$158 $32-$341 $49 $0 1 Updated to reflect reduction in strategic capex spending on Warehouse Automation. 2 Updated to reflect shift of expected operating income benefits.3 Non-GAAP measure – See Appendix for the definition and reconciliation to the most comparable GAAP measure.4 Based on Q1’15 prices, input costs, and market and industry data. Many factors are outside the control of management, including particularly input costs for commodity products, and actual results may differ materially from the information set forth above. See “Forward-Looking Statements” on page 1.5 The Continuous Digester is expected to be completed in Q4’17. 2015 - 2016 adjusted EBITDA contributions were $0.3M.. 1 1 FULL RUN-RATE EXPECTED IMPACT (MILLIONS $)4 ADJUSTED EBITDA3 $23-$28 OPERATING INCOME $15-$162 $48.2
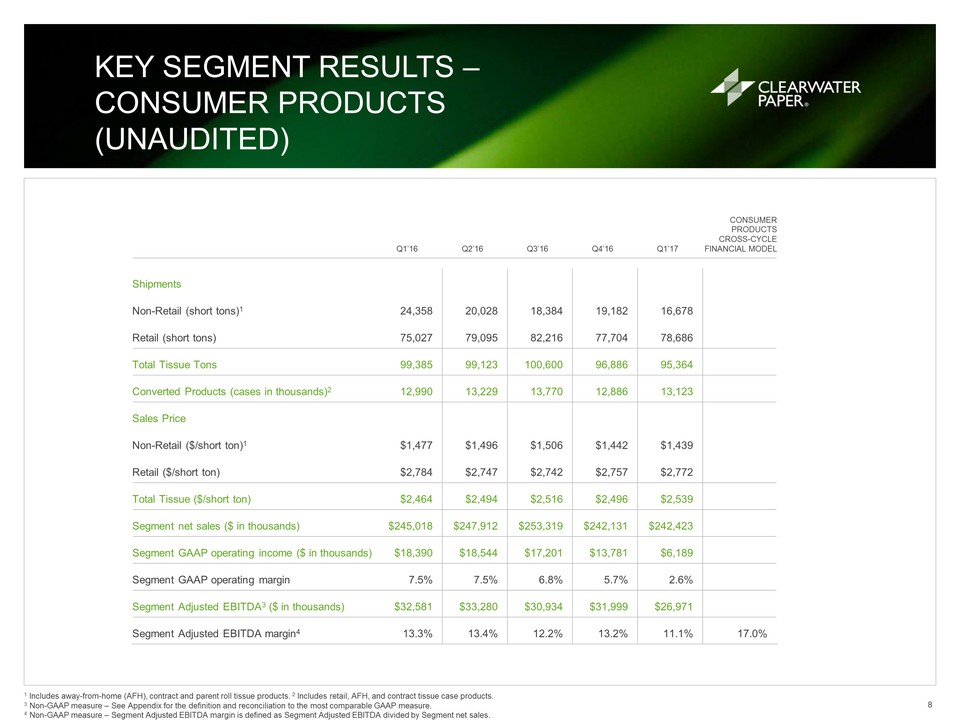
Key Segment Results – Consumer Products (Unaudited) 8 1 Includes away-from-home (AFH), contract and parent roll tissue products. 2 Includes retail, AFH, and contract tissue case products. 3 Non-GAAP measure – See Appendix for the definition and reconciliation to the most comparable GAAP measure. 4 Non-GAAP measure – Segment Adjusted EBITDA margin is defined as Segment Adjusted EBITDA divided by Segment net sales. Q1’16 Q2’16 Q3’16 Q4’16 Q1’17 Consumer Products Cross-Cycle Financial Model Shipments Non-Retail (short tons)1 24,358 20,028 18,384 19,182 16,678 Retail (short tons) 75,027 79,095 82,216 77,704 78,686 Total Tissue Tons 99,385 99,123 100,600 96,886 95,364 Converted Products (cases in thousands)2 12,990 13,229 13,770 12,886 13,123 Sales Price Non-Retail ($/short ton)1 $1,477 $1,496 $1,506 $1,442 $1,439 Retail ($/short ton) $2,784 $2,747 $2,742 $2,757 $2,772 Total Tissue ($/short ton) $2,464 $2,494 $2,516 $2,496 $2,539 Segment net sales ($ in thousands) $245,018 $247,912 $253,319 $242,131 $242,423 Segment GAAP operating income ($ in thousands) $18,390 $18,544 $17,201 $13,781 $6,189 Segment GAAP operating margin 7.5% 7.5% 6.8% 5.7% 2.6% Segment Adjusted EBITDA3 ($ in thousands) $32,581 $33,280 $30,934 $31,999 $26,971 Segment Adjusted EBITDA margin4 13.3% 13.4% 12.2% 13.2% 11.1% 17.0%
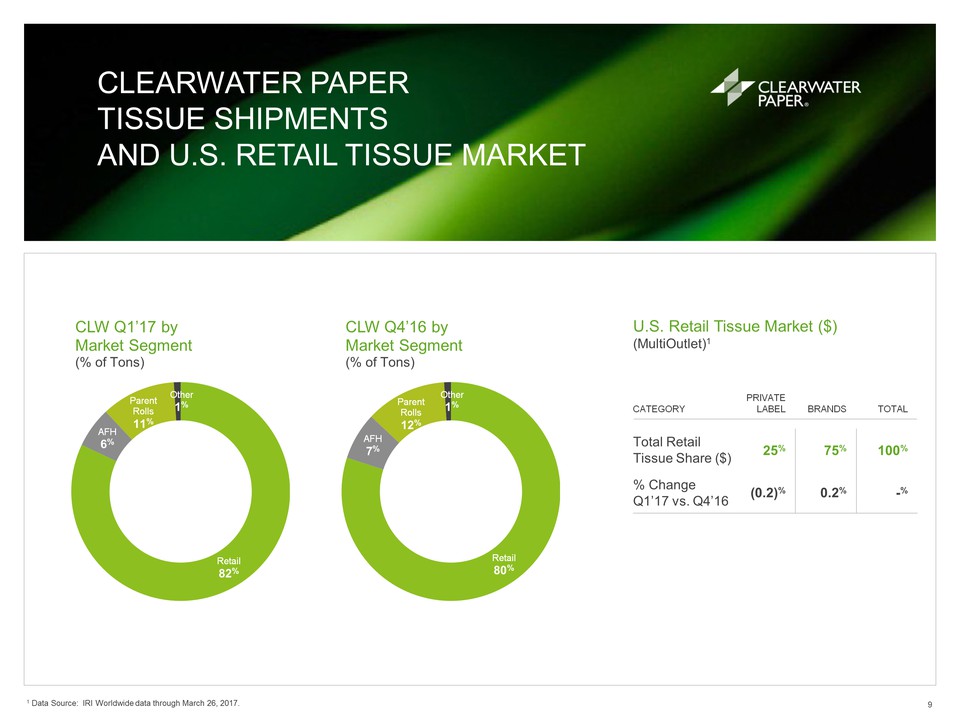
Clearwater Paper Tissue Shipmentsand U.S. Retail Tissue Market 9 U.S. Retail Tissue Market ($) (MultiOutlet)1 Category Private Label BRANDS Total Total RetailTissue Share ($) 25% 75% 100% % ChangeQ1’17 vs. Q4’16 (0.2)% 0.2% -% 1 Data Source: IRI Worldwide data through March 26, 2017.
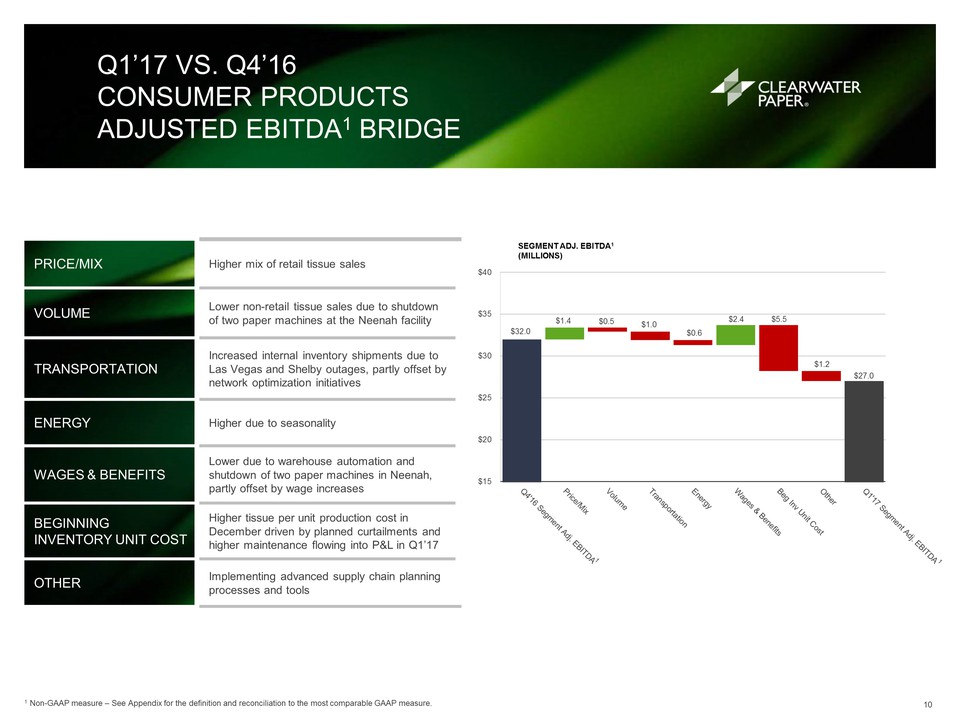
Price/mix Higher mix of retail tissue sales Volume Lower non-retail tissue sales due to shutdown of two paper machines at the Neenah facility Transportation Increased internal inventory shipments due to Las Vegas and Shelby outages, partly offset by network optimization initiatives Energy Higher due to seasonality Wages & benefits Lower due to warehouse automation and shutdown of two paper machines in Neenah, partly offset by wage increases Beginning inventory unit cost Higher tissue per unit production cost in December driven by planned curtailments and higher maintenance flowing into P&L in Q1’17 Other Implementing advanced supply chain planning processes and tools Q1’17 vs. Q4’16Consumer Products Adjusted EBITDA1 Bridge 10 1 Non-GAAP measure – See Appendix for the definition and reconciliation to the most comparable GAAP measure. 1
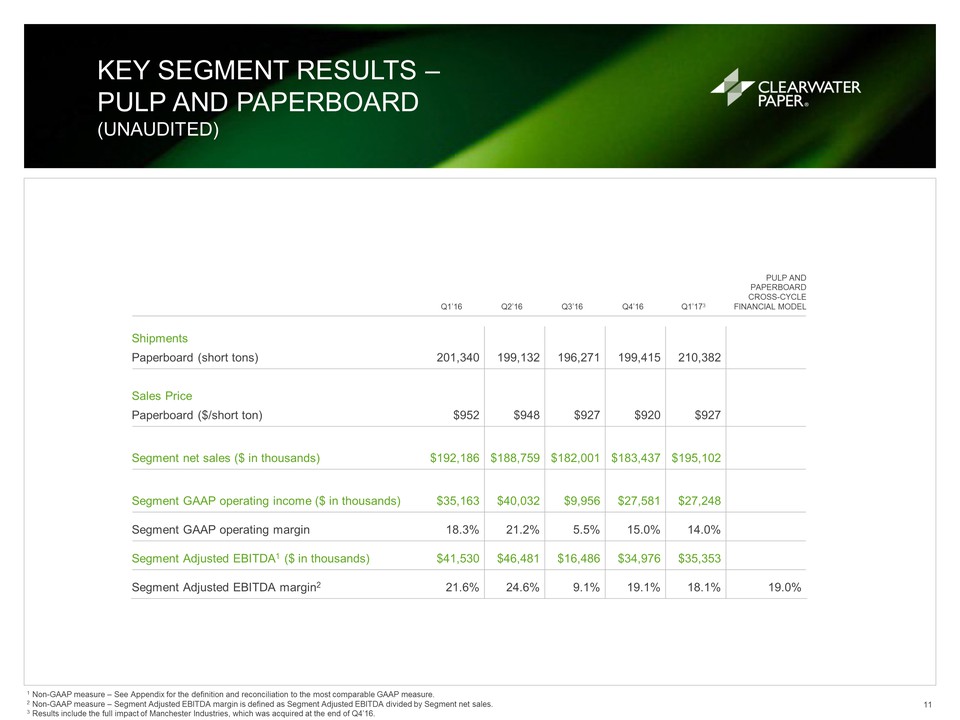
Key Segment Results – Pulp and Paperboard(Unaudited) 11 1 Non-GAAP measure – See Appendix for the definition and reconciliation to the most comparable GAAP measure.2 Non-GAAP measure – Segment Adjusted EBITDA margin is defined as Segment Adjusted EBITDA divided by Segment net sales.3 Results include the full impact of Manchester Industries, which was acquired at the end of Q4’16. Pulp and PaperboardCross-Cycle Financial Model Q1’16 Q2’16 Q3’16 Q4’16 Q1’173 Shipments Paperboard (short tons) 201,340 199,132 196,271 199,415 210,382 Sales Price Paperboard ($/short ton) $952 $948 $927 $920 $927 Segment net sales ($ in thousands) $192,186 $188,759 $182,001 $183,437 $195,102 Segment GAAP operating income ($ in thousands) $35,163 $40,032 $9,956 $27,581 $27,248 Segment GAAP operating margin 18.3% 21.2% 5.5% 15.0% 14.0% Segment Adjusted EBITDA1 ($ in thousands) $41,530 $46,481 $16,486 $34,976 $35,353 Segment Adjusted EBITDA margin2 21.6% 24.6% 9.1% 19.1% 18.1% 19.0%
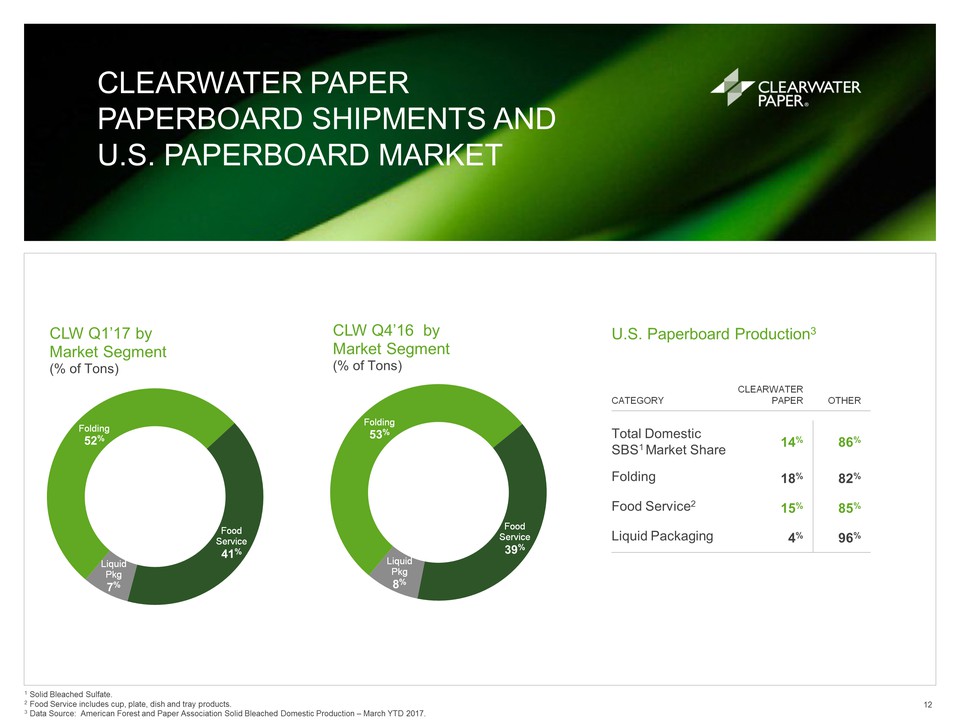
Clearwater Paper Paperboard Shipments and U.S. Paperboard Market 12 U.S. Paperboard Production3 Category Clearwater Paper Other Total Domestic SBS1 Market Share 14% 86% Folding 18% 82% Food Service2 15% 85% Liquid Packaging 4% 96% 1 Solid Bleached Sulfate.2 Food Service includes cup, plate, dish and tray products.3 Data Source: American Forest and Paper Association Solid Bleached Domestic Production – March YTD 2017.
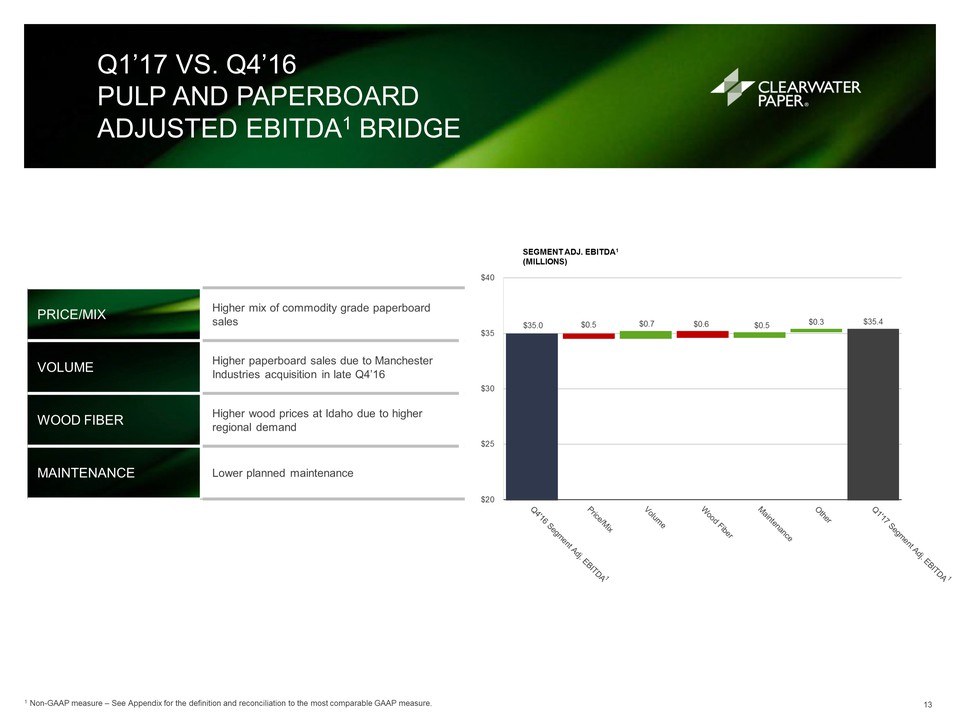
Price/mix Higher mix of commodity grade paperboard sales volume Higher paperboard sales due to Manchester Industries acquisition in late Q4’16 Wood fiber Higher wood prices at Idaho due to higher regional demand Maintenance Lower planned maintenance Q1’17 vs. Q4’16 Pulp and Paperboard Adjusted EBITDA1 Bridge 13 1 Non-GAAP measure – See Appendix for the definition and reconciliation to the most comparable GAAP measure. 1 1
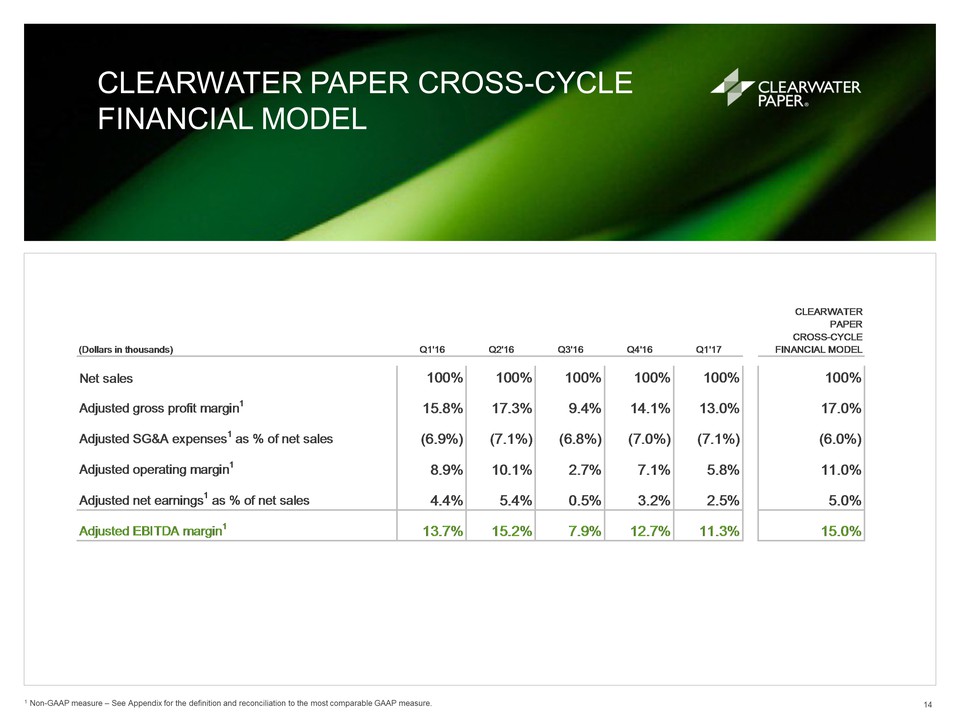
Clearwater Paper Cross-Cycle Financial Model 14 1 Non-GAAP measure – See Appendix for the definition and reconciliation to the most comparable GAAP measure.
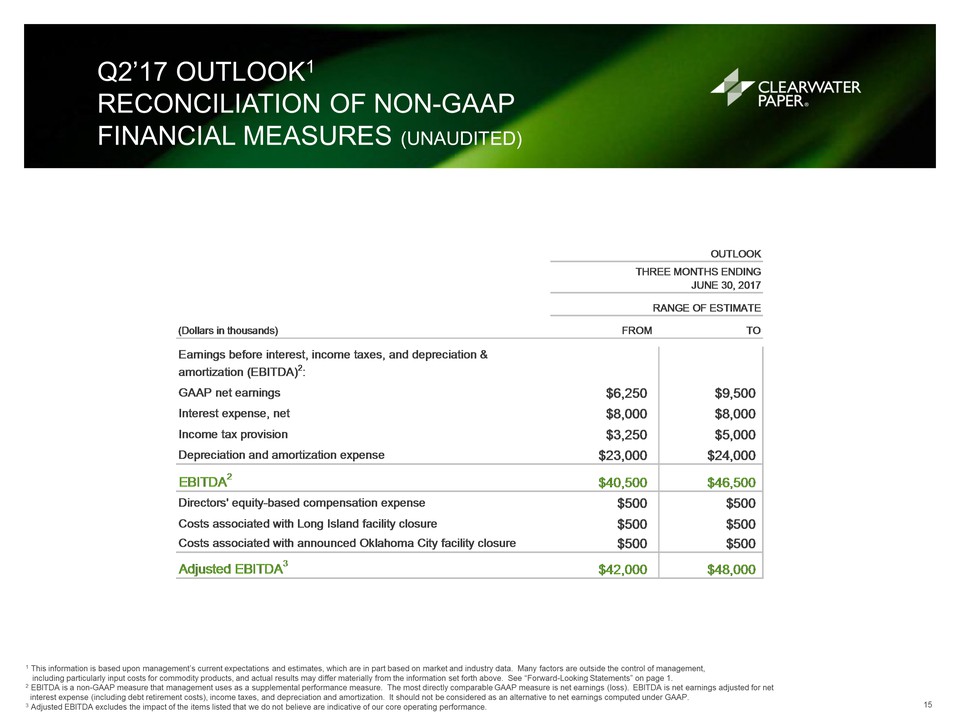
Q2’17 Outlook1Reconciliation of Non-GAAP Financial Measures (Unaudited) 15 1 This information is based upon management’s current expectations and estimates, which are in part based on market and industry data. Many factors are outside the control of management, including particularly input costs for commodity products, and actual results may differ materially from the information set forth above. See “Forward-Looking Statements” on page 1.2 EBITDA is a non-GAAP measure that management uses as a supplemental performance measure. The most directly comparable GAAP measure is net earnings (loss). EBITDA is net earnings adjusted for net interest expense (including debt retirement costs), income taxes, and depreciation and amortization. It should not be considered as an alternative to net earnings computed under GAAP.3 Adjusted EBITDA excludes the impact of the items listed that we do not believe are indicative of our core operating performance.
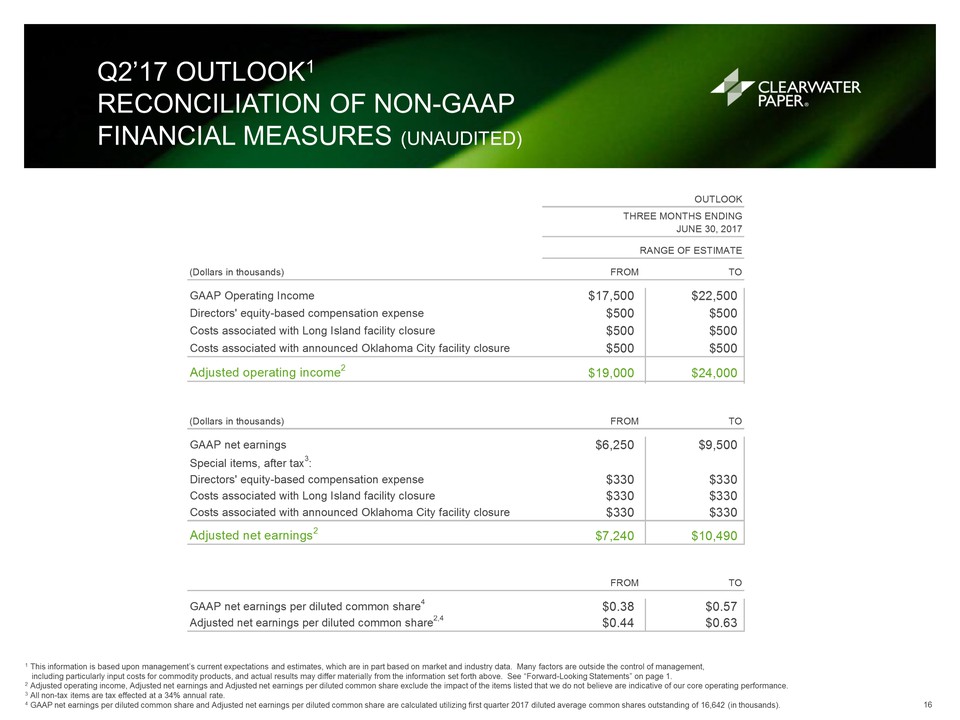
Q2’17 Outlook1Reconciliation of Non-GAAP Financial Measures (Unaudited) 16 1 This information is based upon management’s current expectations and estimates, which are in part based on market and industry data. Many factors are outside the control of management, including particularly input costs for commodity products, and actual results may differ materially from the information set forth above. See “Forward-Looking Statements” on page 1.2 Adjusted operating income, Adjusted net earnings and Adjusted net earnings per diluted common share exclude the impact of the items listed that we do not believe are indicative of our core operating performance.3 All non-tax items are tax effected at a 34% annual rate.4 GAAP net earnings per diluted common share and Adjusted net earnings per diluted common share are calculated utilizing first quarter 2017 diluted average common shares outstanding of 16,642 (in thousands).
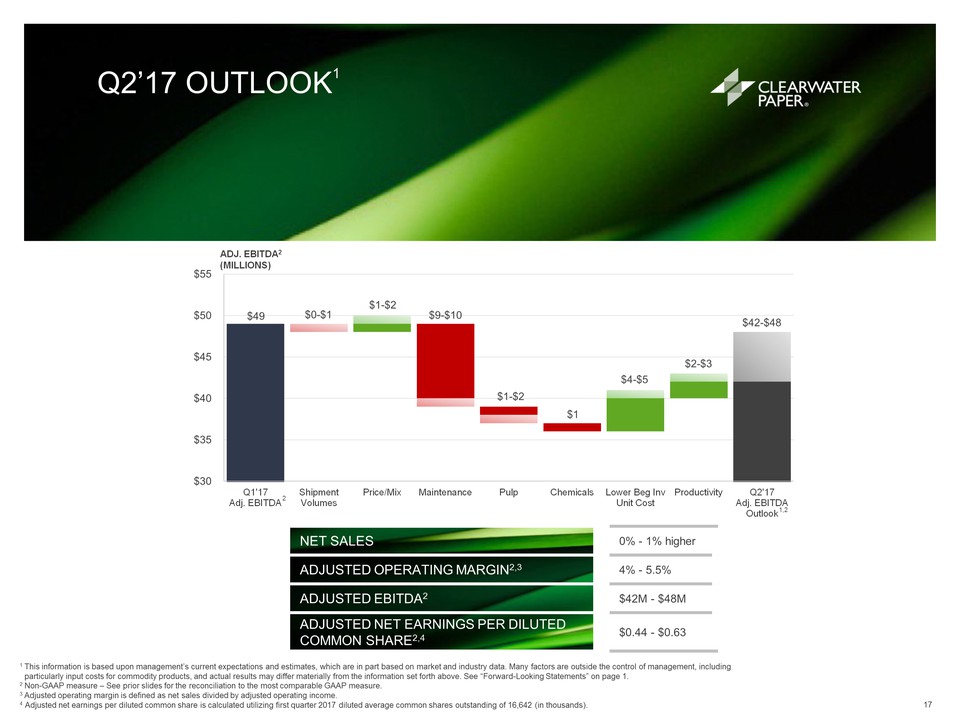
Q2’17 OUTLOOK1 17 1 This information is based upon management’s current expectations and estimates, which are in part based on market and industry data. Many factors are outside the control of management, including particularly input costs for commodity products, and actual results may differ materially from the information set forth above. See “Forward-Looking Statements” on page 1.2 Non-GAAP measure – See prior slides for the reconciliation to the most comparable GAAP measure.3 Adjusted operating margin is defined as net sales divided by adjusted operating income.4 Adjusted net earnings per diluted common share is calculated utilizing first quarter 2017 diluted average common shares outstanding of 16,642 (in thousands). Net sales 0% - 1% higher Adjusted operating margin2,3 4% - 5.5% Adjusted ebitda2 $42M - $48M Adjusted net earnings per diluted common share2,4 $0.44 - $0.63

Appendix 18
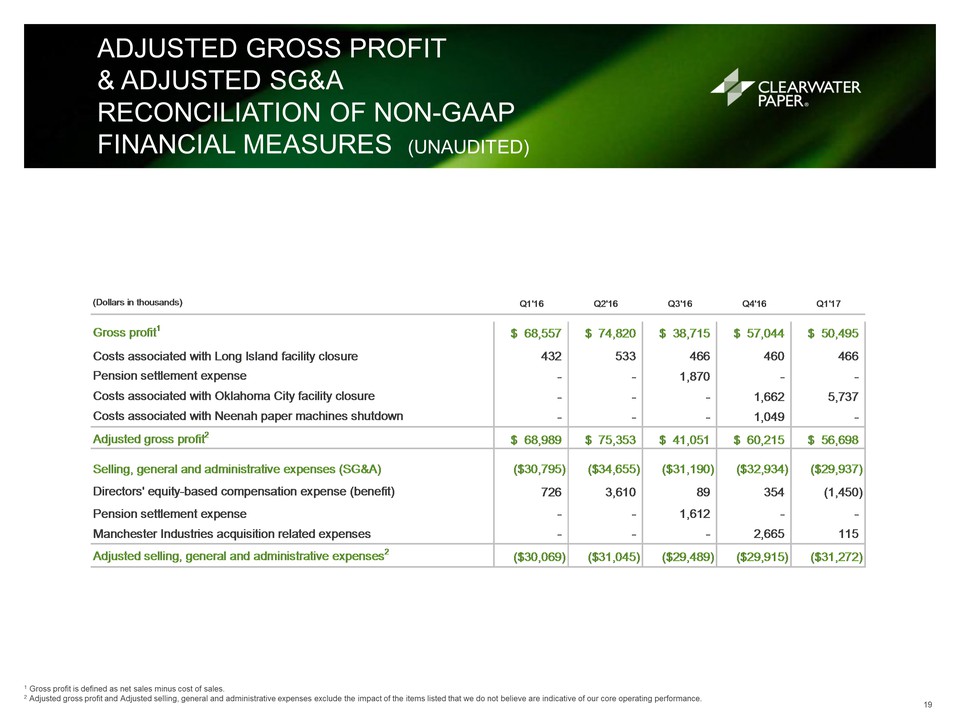
Adjusted Gross Profit& Adjusted SG&AReconciliation of Non-GAAP Financial Measures (Unaudited) 19 1 Gross profit is defined as net sales minus cost of sales.2 Adjusted gross profit and Adjusted selling, general and administrative expenses exclude the impact of the items listed that we do not believe are indicative of our core operating performance.
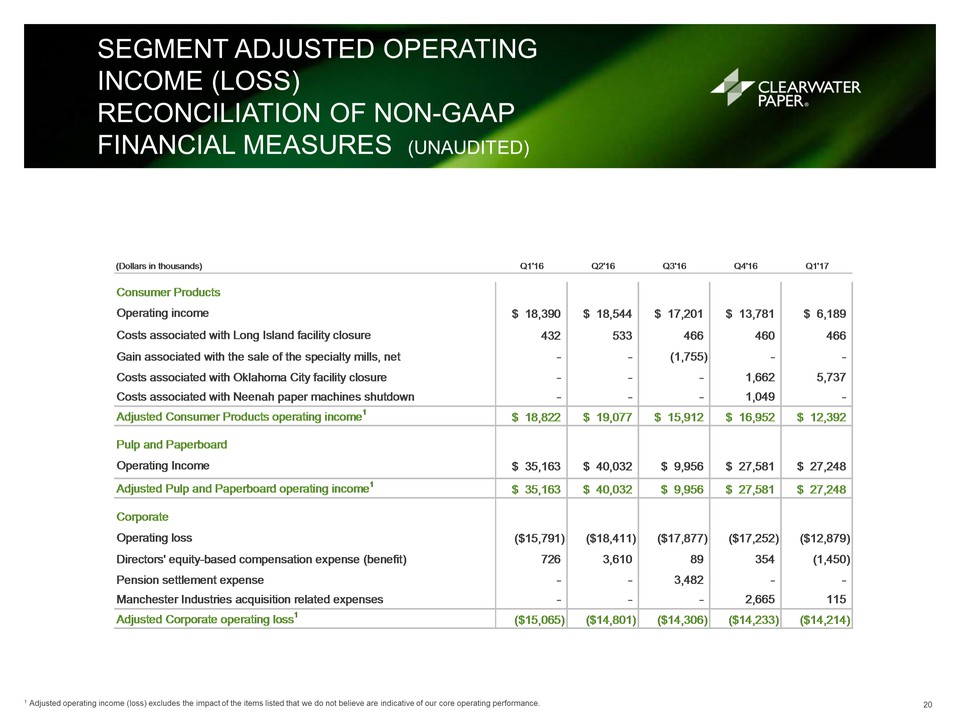
Segment Adjusted Operating Income (Loss)Reconciliation of Non-GAAP Financial Measures (Unaudited) 20 1 Adjusted operating income (loss) excludes the impact of the items listed that we do not believe are indicative of our core operating performance.
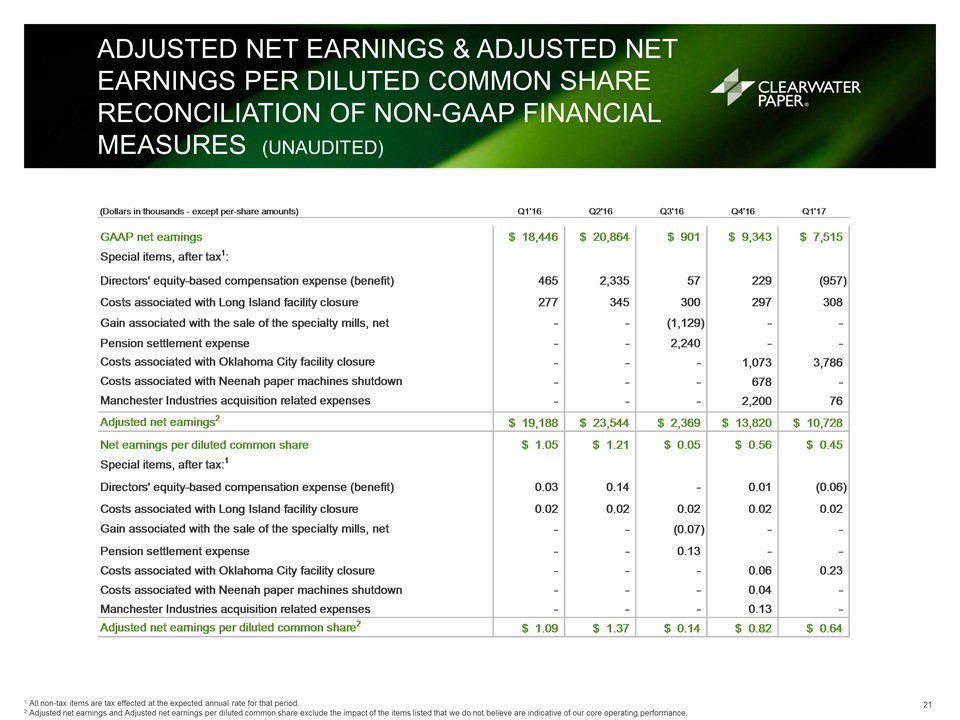
Adjusted Net Earnings & Adjusted Net Earnings per Diluted common shareReconciliation of Non-GAAP Financial Measures (Unaudited) 21 1 All non-tax items are tax effected at the expected annual rate for that period.2 Adjusted net earnings and Adjusted net earnings per diluted common share exclude the impact of the items listed that we do not believe are indicative of our core operating performance.
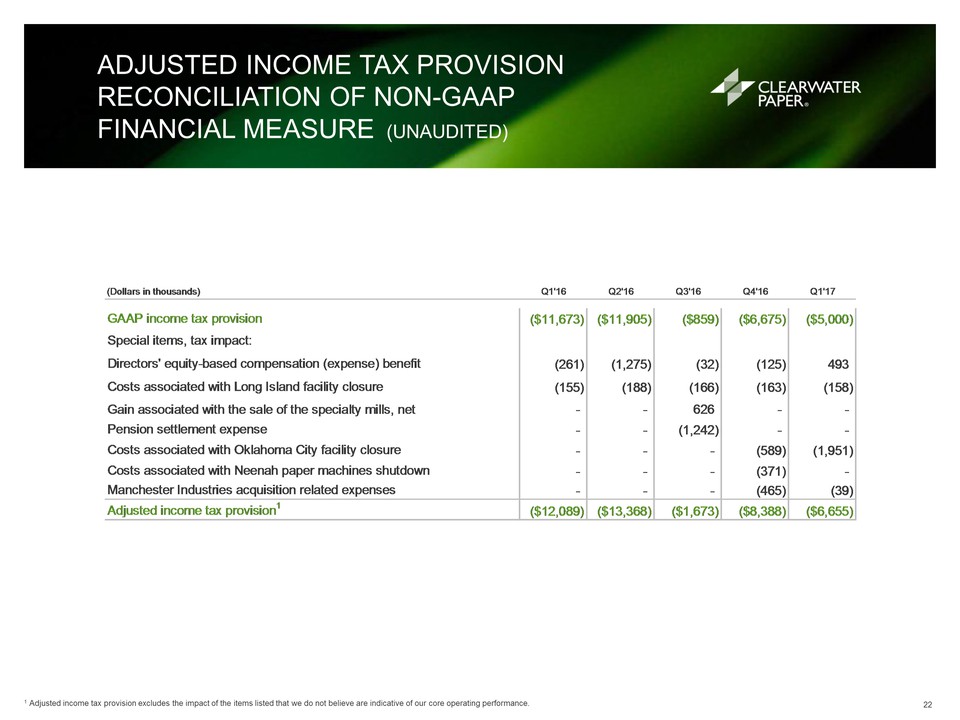
Adjusted Income Tax ProvisionReconciliation of Non-GAAP Financial Measure (Unaudited) 22 1 Adjusted income tax provision excludes the impact of the items listed that we do not believe are indicative of our core operating performance.
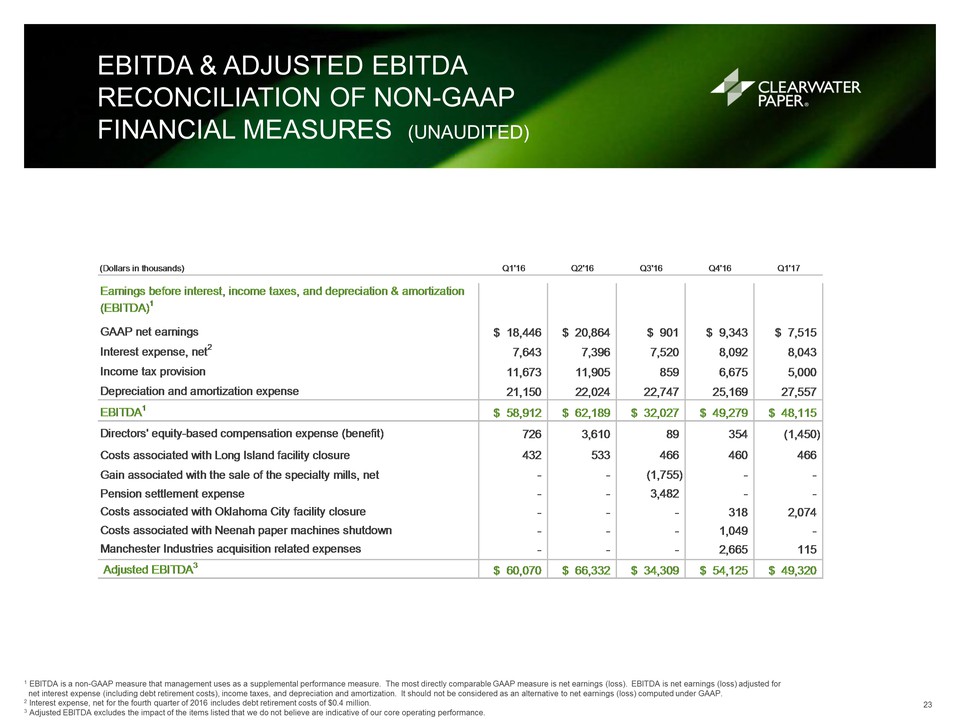
EBITDA & Adjusted EBITDA Reconciliation of Non-GAAP Financial Measures (Unaudited) 23 1 EBITDA is a non-GAAP measure that management uses as a supplemental performance measure. The most directly comparable GAAP measure is net earnings (loss). EBITDA is net earnings (loss) adjusted for net interest expense (including debt retirement costs), income taxes, and depreciation and amortization. It should not be considered as an alternative to net earnings (loss) computed under GAAP.2 Interest expense, net for the fourth quarter of 2016 includes debt retirement costs of $0.4 million.3 Adjusted EBITDA excludes the impact of the items listed that we do not believe are indicative of our core operating performance.
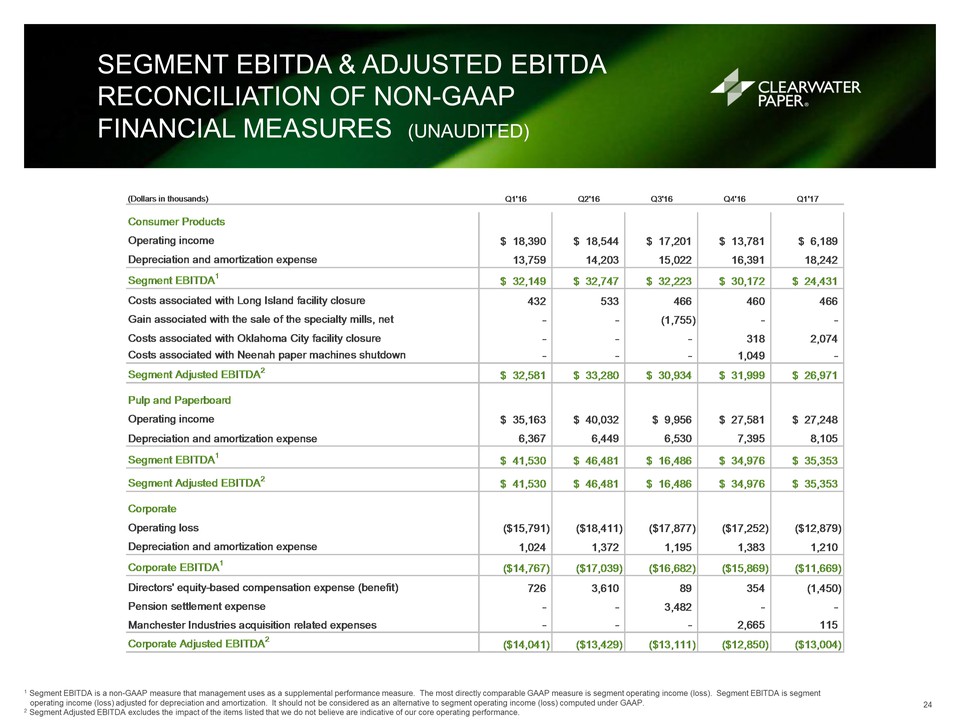
Segment EBITDA & Adjusted EBITDA Reconciliation of Non-GAAPFinancial Measures (Unaudited) 24 1 Segment EBITDA is a non-GAAP measure that management uses as a supplemental performance measure. The most directly comparable GAAP measure is segment operating income (loss). Segment EBITDA is segment operating income (loss) adjusted for depreciation and amortization. It should not be considered as an alternative to segment operating income (loss) computed under GAAP. 2 Segment Adjusted EBITDA excludes the impact of the items listed that we do not believe are indicative of our core operating performance.
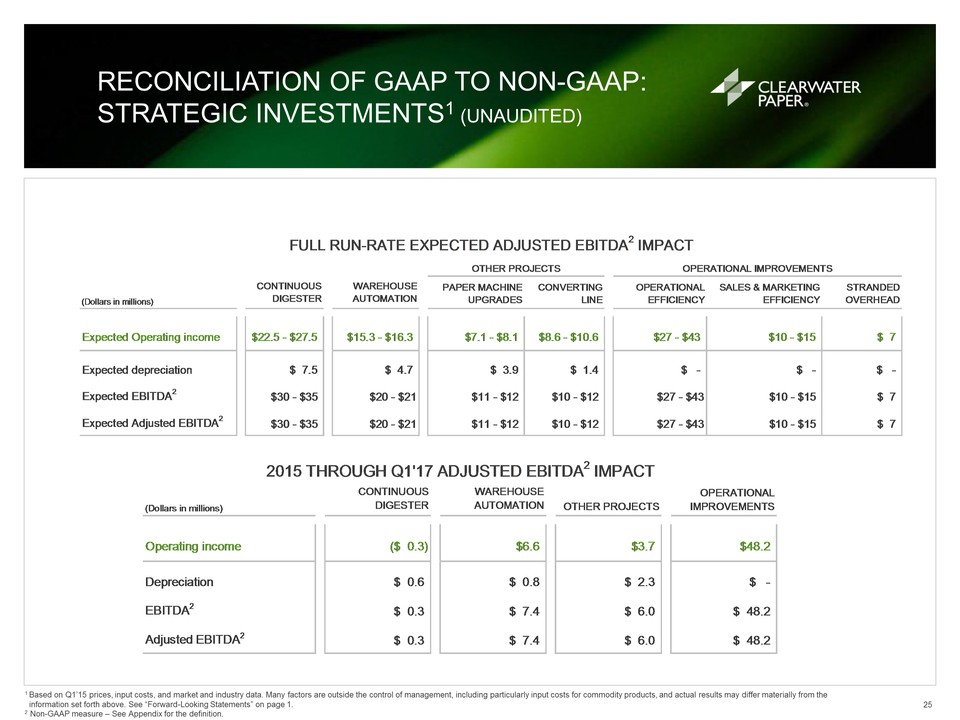
Reconciliation of GAAP to Non-GAAP: Strategic investments1 (Unaudited) 25 1 Based on Q1’15 prices, input costs, and market and industry data. Many factors are outside the control of management, including particularly input costs for commodity products, and actual results may differ materially from the information set forth above. See “Forward-Looking Statements” on page 1.2 Non-GAAP measure – See Appendix for the definition.
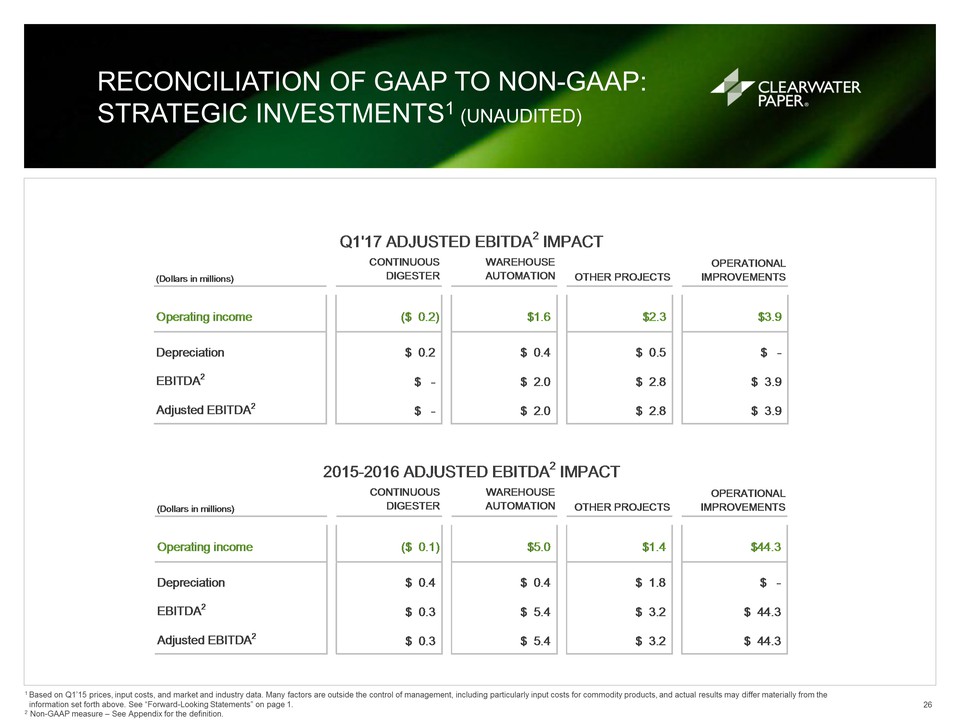
Reconciliation of GAAP to Non-GAAP: Strategic investments1 (Unaudited) 26 1 Based on Q1’15 prices, input costs, and market and industry data. Many factors are outside the control of management, including particularly input costs for commodity products, and actual results may differ materially from the information set forth above. See “Forward-Looking Statements” on page 1.2 Non-GAAP measure – See Appendix for the definition.

For more information:www.clearwaterpaper.com 27