Attached files
| file | filename |
|---|---|
| EX-99.1 - EX-99.1 - INTERNATIONAL BUSINESS MACHINES CORP | a17-11403_2ex99d1.htm |
| 8-K - 8-K - INTERNATIONAL BUSINESS MACHINES CORP | a17-11403_28k.htm |
Exhibit 99.2
IBM 1Q 2017 Earnings: Non GAAP slides April 18, 2017 ibm.com/investor
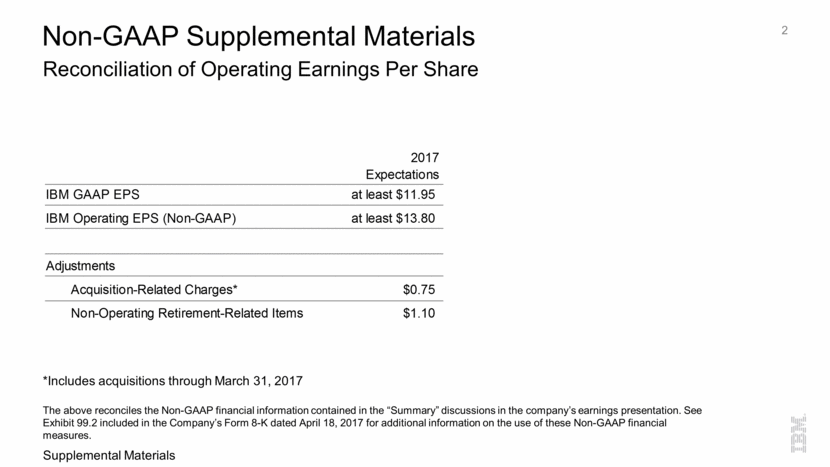
Reconciliation of Operating Earnings Per Share 2 Non-GAAP Supplemental Materials *Includes acquisitions through March 31, 2017 The above reconciles the Non-GAAP financial information contained in the “Summary” discussions in the company’s earnings presentation. See Exhibit 99.2 included in the Company’s Form 8-K dated April 18, 2017 for additional information on the use of these Non-GAAP financial measures. Supplemental Materials 2017 Expectations IBM GAAP EPS at least $11.95 IBM Operating EPS (Non-GAAP) at least $13.80 Adjustments Acquisition-Related Charges* $0.75 Non-Operating Retirement-Related Items $1.10
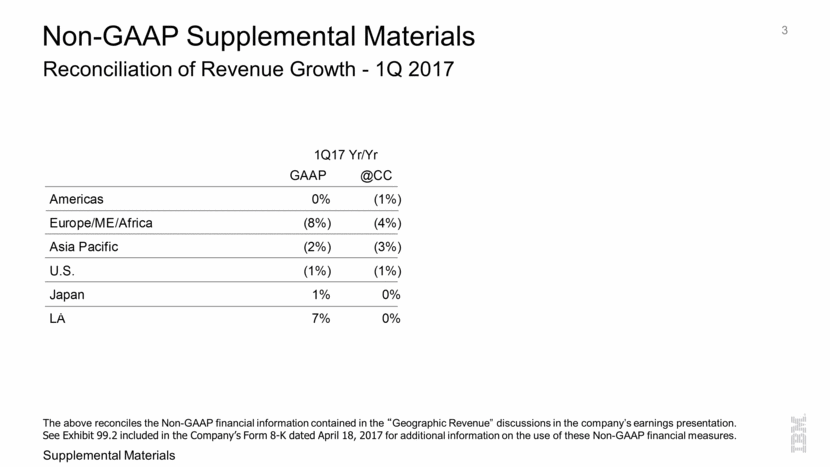
Reconciliation of Revenue Growth - 1Q 2017 3 Non-GAAP Supplemental Materials The above reconciles the Non-GAAP financial information contained in the “Geographic Revenue” discussions in the company’s earnings presentation. See Exhibit 99.2 included in the Company’s Form 8-K dated April 18, 2017 for additional information on the use of these Non-GAAP financial measures. Supplemental Materials GAAP @CC Americas 0% (1%) Europe/ME/Africa (8%) (4%) Asia Pacific (2%) (3%) U.S. (1%) (1%) Japan 1% 0% LA 7% 0% 1Q17 Yr/Yr
Reconciliation of Revenue Growth - 1Q 2017 4 Non-GAAP Supplemental Materials The above reconciles the Non-GAAP financial information contained in the “A Cognitive Solutions & Cloud Platform Company” discussions in the company’s earnings presentation. See Exhibit 99.2 included in the Company’s Form 8-K dated April 18, 2017 for additional information on the use of these Non-GAAP financial measures. Supplemental Materials GAAP @CC Strategic Imperatives 12% 13% Analytics 6% 7% Cloud 33% 35% Mobile 20% 22% Security 9% 10% Social (4%) (3%) 1Q17 Yr/Yr
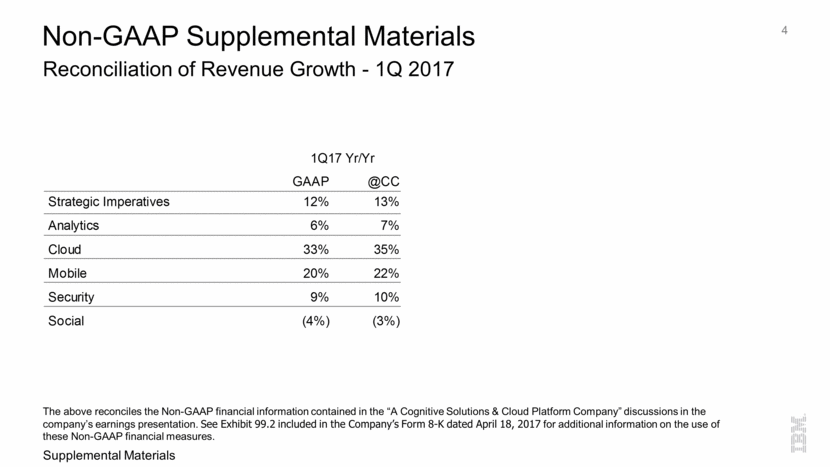
Reconciliation of Revenue Growth - 1Q 2017 5 Non-GAAP Supplemental Materials The above reconciles the Non-GAAP financial information contained in the “Segment Revenue & Gross Profit”, “Additional Revenue & Backlog Information”, “Cognitive Solutions Segment”, “Global Business Services Segment”, “Technology Services & Cloud Platforms Segment”, and “Systems Segment” discussions in the company’s earnings presentation. See Exhibit 99.2 included in the Company’s Form 8-K dated April 18, 2017 for additional information on the use of these Non-GAAP financial measures. Supplemental Materials GAAP @CC Cognitive Solutions 2% 3% Solutions Software 4% 5% Transaction Processing Software (1%) (1%) Strategic Imperatives 6% 7% Cloud 44% 45% Global Business Services (3%) (2%) Consulting (4%) (2%) Global Process Services (10%) (9%) Application Management (1%) 0% Strategic Imperatives 12% 13% Cloud 56% 57% Cognitive Solutions & Industry Svcs (1%) 0% 1Q17 Yr/Yr GAAP @CC Tech Svcs & Cloud Platforms (2%) (2%) Global Technology Services (2%) (2%) Infrastructure Services (3%) (2%) Technical Support Services (1%) (2%) Integration Software (4%) (3%) Strategic Imperatives 30% 31% Cloud 41% 42% Systems (17%) (16%) Systems Hardware (19%) (18%) z Systems (40%) (40%) Power (28%) (27%) Storage 6% 7% Operating Systems Software (10%) (10%) Strategic Imperatives (16%) (15%) Cloud (16%) (16%) Global Financing (1%) (2%) 1Q17 Yr/Yr
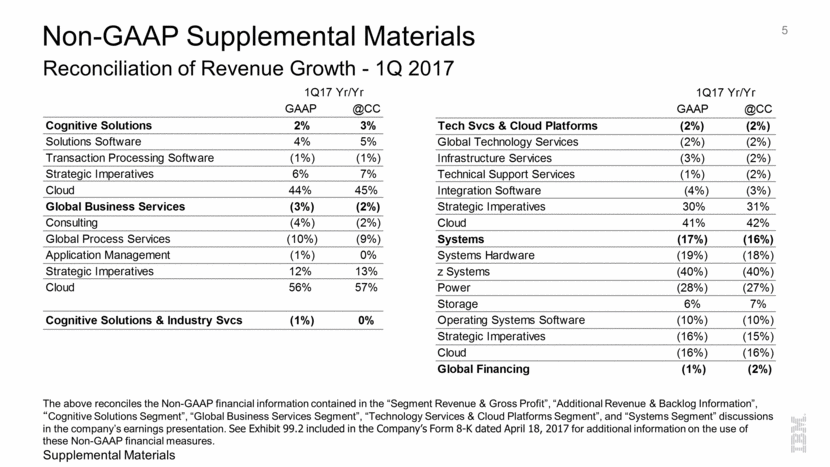
Reconciliation of Expense Summary - 1Q 2017 6 Non-GAAP Supplemental Materials The above reconciles the Non-GAAP financial information contained in the “Expense Summary” discussions in the company’s earnings presentation. See Exhibit 99.2 included in the Company’s Form 8-K dated April 18, 2017 for additional information on the use of these Non-GAAP financial measures. *Represents the percentage change after excluding the impact of currency and acquisitions. Supplemental Materials Non-GAAP Operating GAAP Adjustments (Non-GAAP) SG&A Currency 1 pts 0 pts 1 pts Acquisitions (2 pts) 0 pts (2 pts) Base * 16 pts 3 pts 19 pts RD&E Currency 1 pts 0 pts 1 pts Acquisitions (4 pts) 0 pts (4 pts) Base * (2 pts) 3 pts 1 pts Operating Expense & Other Income Currency 1 pts 0 pts 1 pts Acquisitions (3 pts) 0 pts (3 pts) Base* 20 pts 2 pts 22 pts
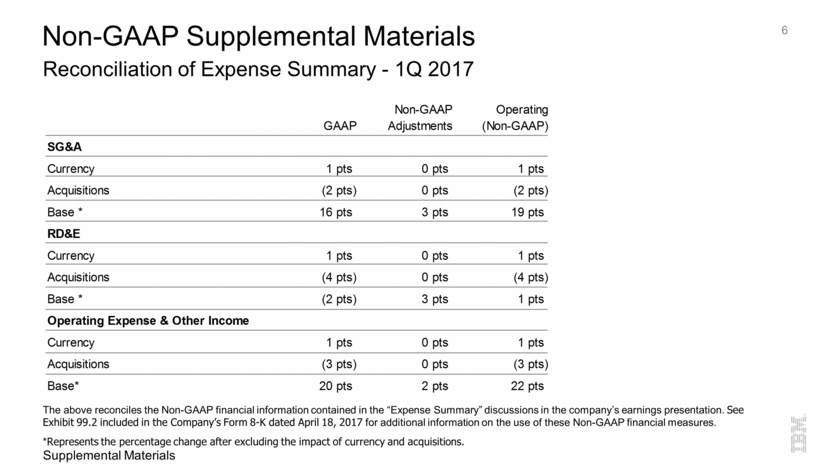
Reconciliation of Debt-to-Capital Ratio 7 Non-GAAP Supplemental Materials Supplemental Materials The above reconciles the Non-GAAP financial information contained in the “Cash Flow and Balance Sheet Highlights” and “Balance Sheet Summary” discussions in the company’s earnings presentation. See Exhibit 99.2 included in the Company’s Form 8-K dated April 18, 2017 for additional information on the use of these Non-GAAP financial measures. Management presents its debt-to-capital ratio excluding the Global Financing business. A financing business is managed on a leveraged basis. The company funds its Global Financing segment using a debt-to-equity ratio target which increased to 9 to 1 in the first quarter 2017 from approximately 7 to 1 at Dec 31,2016. Given this significant leverage, the company presents a debt-to-capital ratio which excludes the Global Financing segment debt and equity because the company believes this is more representative of the company’s core business operations. Mar 2017 Dec 2016 Mar 2016 Non-Global Financing Debt/Capital 48% 50% 62% IBM Consolidated Debt/Capital 70% 70% 75%
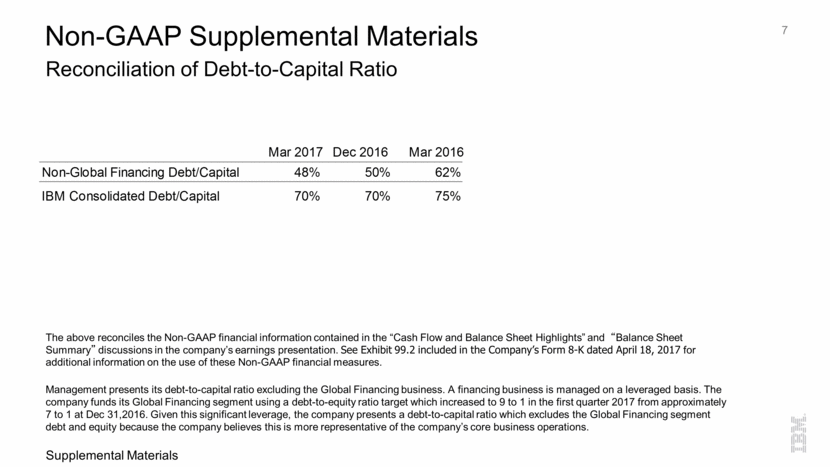
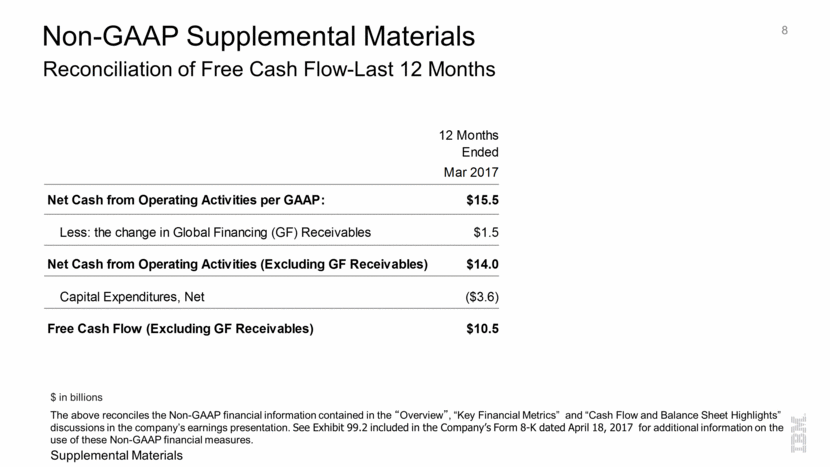
Reconciliation of Free Cash Flow-Last 12 Months Non-GAAP Supplemental Materials The above reconciles the Non-GAAP financial information contained in the “Overview”, “Key Financial Metrics” and “Cash Flow and Balance Sheet Highlights” discussions in the company’s earnings presentation. See Exhibit 99.2 included in the Company’s Form 8-K dated April 18, 2017 for additional information on the use of these Non-GAAP financial measures. Supplemental Materials $ in billions 8 12 Months Ended Mar 2017 Net Cash from Operating Activities per GAAP: $15.5 Less: the change in Global Financing (GF) Receivables $1.5 Net Cash from Operating Activities (Excluding GF Receivables) $14.0 Capital Expenditures, Net ($3.6) Free Cash Flow (Excluding GF Receivables) $10.5
9 ibm.com/investor
