Attached files
| file | filename |
|---|---|
| EX-32 - New Concept Energy, Inc. | ex321.htm |
| EX-31 - New Concept Energy, Inc. | ex311.htm |
| EX-21 - New Concept Energy, Inc. | ex221.htm |
| 10-K - New Concept Energy, Inc. | nce10k123116.htm |
ESTIMATED RESERVES
AND FUTURE NET REVENUE
OIL AND GAS PROPERTIES
Owned By
MOUNTAINEER STATE ENERGY, INC.
LOCATED IN
ATHENS AND MEIGS COUNTIES, OHIO
AND
CALHOUN, JACKSON AND ROANE
COUNTIES, WEST VIRGINIA
Effective Date
12131/2016
ESTIMATED RESERVES
AND FUTURE NET REVENUE
INTERESTS OWNED BY
MOUNTAINEER STATE ENERGY, INC.
INDEX
LETTER
SCHEDULES
| Discounted at Ten Per Cent (10%)Summary Forecast of Production, Income and Estimated Future Net Revenue | 1 | |
| Maximum to Minimum One-Line Summary of Discounted Future Net Revenue | 2 | |
| Alphabetical One-Line Summary of the Forecast Entities | 3 | |
| Individual Cash Flows Accompanied by Production Decline Curves | 4 |
LETTER
LEE KEELING AND ASSOCIATES, INC.
PETROLEUM CONSULTANTS
First Place Tower
15 East Fifth Street· Suile 3500
Tulsa, Oklahoma 74103-4350
(9 I 8) 587-5521 • Fax: (918) 587-2881
www.lkaengineers.com
January 25, 2017
New Concept Energy, Inc.
1603 LBJ Freeway, Suite 300
Dallas, Texas 75234
Attn:
Mr. Gene Bertcher
Chief Executive Officer
Re:
Estimated Reserves and Future Net Revenue Proved Producing and Undeveloped Reserves Oil and Gas Properties Owned by State Energy, Inc. Mountaineer
Gentlemen:
In accordance with your request, we have prepared an estimate of net proved producing, non producing, and undeveloped reserves and the future net revenue to be realized from the interests owned by Mountaineer State Energy, Inc. (Mountaineer) in oil and gas properties located in the states of Ohio and West Virginia. Our estimate includes all of Mountaineer's net reserves. The of this estimate Is December 31,2016, and the results are summarized as follows: effective date
| RESERVE | Oil | Gas | TOTAL | Disc.@ 10% | |||||
| (BBLS) | (MCF) | ($) | ($) | ||||||
| Proved Developed | |||||||||
| Producing | 64,533 | 1,028,555 | 3,021,212 | 1,778,778 | |||||
| Behind Pipe | 16,346 | 22,885 | 303,264 | 132,022 | |||||
| Sub-Total | 80,879 | 1,051,440 | 3,324,476 | 1,910,800 | |||||
| Proved Undeveloped | |||||||||
| Primary | 68,396 | 2,168,396 | 7,148,857 | 4,412,498 | |||||
| Total All Reserves | 149,275 | 3,219,836 | 10,473,333 | 6,323,298 |
Note: Tolals may not agree with schedules due to roundoff.
Future net revenue is the amount, exclusive of state and federal income taxes, which will accrue to the subject interests from continued operation of the properties to depletion. It should not be construed as a fair market or trading value.
No attempt has been made to determine whether the wells and facilities are in compliance with various governmental regulations, nor have costs been included in the event they are not.
This report consists of various summaries. Schedule No. 1 presents summary forecasts by reserve type of annual gross and net production, severance and ad valorem taxes, operating income and net revenue. Schedule No.2 is a sequential listing of the forecast entities based on discounted future net revenue. A one-line alphabetical listing of the forecast entities is presented Schedule No.3. Supplemental data, presented as Schedule No.4, includes the individual cash on
flows for the various entities. These are accompanied by production decline curves that show our projections of future producing rates.
BACKGROUND
This estimate is concerned with approximately one hundred seventeen (117) gas and oil wells of which one hundred eight (108) were selling gas with nine (9) producing oil on the effective date. Several additional wells are shut-in. These wells are located in two Ohio counties, Athens and Meigs, and the three West Virginia counties of Calhoun, Jackson and Roane. Composite production decline curves have been prepared of gas procluction (sales) for each of the five counties. These composite decline curves are the "forecast entities" referred to in the preceding paragraphs. Individual production decline curves with cash flows for the nine Berea oil wells and one gas well In Jackson County, West Virginia are also included.
CLASSIFICATION OF RESERVES
Reserves assigned to the various leases andlor wells have been classified as either "proved developed" or "proved undeveloped" in accordance with the definitions of the proved reserves as promulgated by the Securities and Exchange Commission (SEC). These are as follows:
Proved Developed Oil and Gas Reserves are reserves that can be expected to be recovered through existing wells with existing equipment and operating methods. Additional oil and gas expected to be obtained through the application of fluid injection or other improved recovery techniques for supplementing the natural forces and mechanisms of primary recovery should be included as "proved developed reserves" only after testing by a pilot project or after the operation of an installed program has confirmed through production response that increased recovery will be achieved.
Proved Undeveloped Oil and Gas Reserves are reserves that are expected to be recovered from new wells on undrilled acreage, or from existing wells where a relatively major expenditure is required for recompletion. Reserves on undrilled acreage shall be limited to those drilling units offsetting productive units that are reasonably certain of production when drilled. Proved reserves for other undrilled units can be claimed only where it can be demonstrated with certainty that there is continuity of production from the existing productive formation. Under no circumstances should estimates for proved undeveloped reserves be attributable to any acreage for which an application of fluid injection or other improved recovery technique is contemplated, unless such techniques have been proved effective by actual tests In the area and in the same reservoir.
Proved Developed Oil and Gas Reserves attributed to the subject leases have been further classified as "proved developed producing," and "proved developed behind-pipe."
Proved Developed Producing Reserves are those reserves expected to be recovered from currently producing zones under continuation of present operating methods.
2
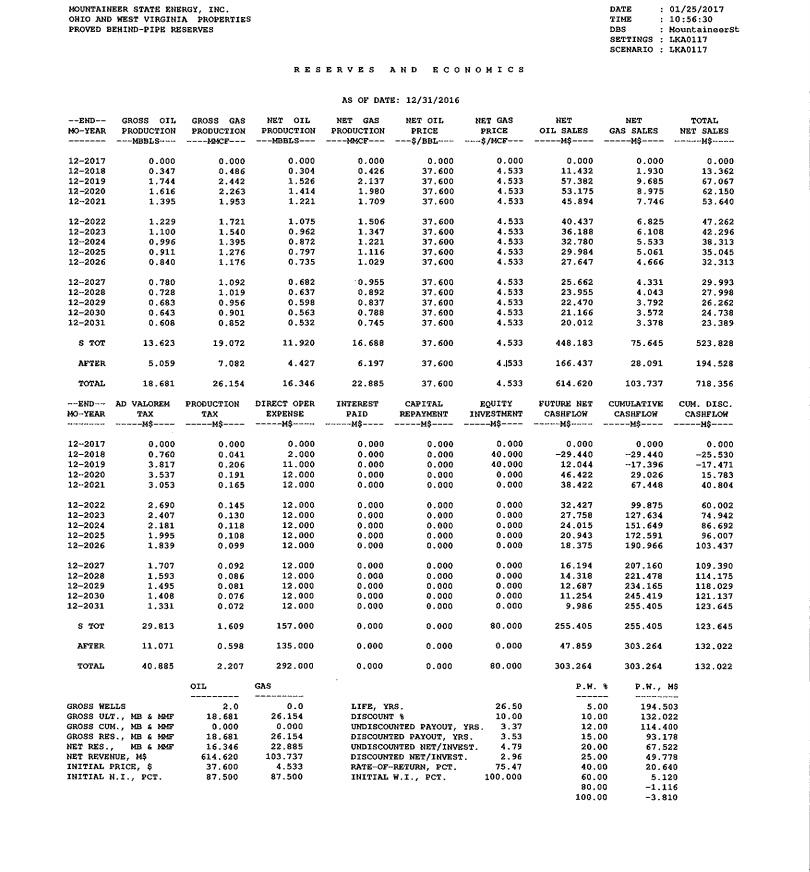
Proved Developed Behind-Pipe Reserves are those reserves currently behind the pipe in existing wells that are considered proved by virtue of successful testing or production in offsetting wells.
ESTIMATION OF RESERVES
All of Mountaineer's active gas wells have been producing for a considerable length of time and all have well-defined production declining trends. Reserves attributable to these wells were based upon extrapolation of these decline trends to an economic limit. Reserves attributable to the oldest of the Berea oil wells were estimated by extrapolation of the production decline trend to the limit. economic
Reserves anticipated from newer wells, behind pipe and/or undeveloped locations were based wells which are producing from the same horizons in the respective upon analogy with nearby
areas.
Our estimate of reserves used all methods and procedures considered necessary, under the circumstances, to prepare this report.
FUTURE NET REVENUE
Oil and Gas Income
Income from the recovery and sale of the estimated gas reserves was based on the average of prices received on the first day of each month for October 2015 through September 2016, as provided by the staff of Mountaineer. Gas was being sold in both Ohio and West Virginia under contract, and the price used was $4.533 per MCF in Ohio and $4.158 in West Virginia. These prices were held constant, but provisions were made for state severance and ad valorem taxes.
Income from oil sales was also based on the average of prices received the first day of each month for October 2015 through September 2016. This price supplied by Mountaineer was $37.60 per barrel and held constant with provisions for state severance and ad valorem taxes.
Operating Expenses
Anticipated monthly expenses were based on expenses supplied by Mountaineer. Expenses were not escalated but held constant for the various recovery periods.
Future Expenses
As provided by Mountaineer, provisions have been made for future expenses required for drilling and completion or recompletion of wells to capture the proved undeveloped reserves. These costs held constant from current estimates. have been
GENERAL
The assumptions, data, methods and procedures used are appropriate for the purpose served by the report.
Information upon which this estimate of net reserves and future net revenue has been based was furnished by the staff of Mountaineer or was obtained by us from outside sources we consider to
3
be reliable. This information is assumed to be correct. No attempt has been made to verify title or ownership of the subject properties. Wells were not inspected by a representative of this firm, nor were they tested under our supervision; however, the performance of the majority of the wells was discussed with the employees of Mountaineer.
This report has been prepared utilizing methods and procedures regularly used by petroleum engineers to estimate 011 and gas reserves for properties of this type and character. The recovery of oil and gas reserves and projection of producing rates are dependent upon many variable factors including prudent operation, compression of gas when needed, market demand, installation of lifting equipment, and remedial work when required. The reserves included in this report have been based upon the assumption that the wells will be operated in a prudent manner under the same conditions existing on the effective date. Actual production results and future well data may yield additional facts, not presently available to us, which may require an adjustment to our estimates.
The projection of cash flow has been made assuming constant prices. There is no assurance that prices will not vary. For this reason and those listed In the previous paragraph, the future net cash may vary from the estimates contained in from the sale of production from the subject properties
this report.
The information developed during the course of this investigation, basic data, maps and worksheets showing recovery determinations are available for inspection in our office.
We appreciate this opportunity to be of service to you.
Very truly yours,
Lee Keeling and Associates, Inc
LKA7657
4
SCHEDULE 1
MOUNTAINEER STATE ENERGY,INC. DATE 01/25/2017 OHIO ANDHEST VIRGINIA PROPERTIES TIME 10:56:30 ALL PROVED RESERVES DBS MountaineerSt SETTINGS LKAOl17 SCENARIO LKAOl17 RES ER V E SAN 0 E CON 0 M I C S E AS OF DATE:12/31/2016 7--END-- GROSS OIL GROSS GAS NET OIL NET GAS NET OIL NET GAS NET NET TOTAL PO-YEAR PRODUCTION PRODUCTION PRODUCTION PRODUCTION PRICE PRICE OIL SALES GAS SALES NET SALES ---MBBLS--- ----MMCF--- ---MBBLS--- ----HMCF--- ---$/BBL--- ---$/MCF--- -----1-1$---------1-1$---------1-1$--- 12-2017 5.267 287.028 4.339 249.464 37.600 4.298 163.144 1072.099 1235.244 12-2018 5.164 253.790 4.279 220.706 37.600 4.306 160.888 950.375 1111.264 12-2019 10.025 360.656 37.600 4.262 1661.767 8.557 314.437 321.742 1340. 025 12-2020 19.802 659.320 17.132 575.930 37.600 4.217 644.176 2428.838 3073.014 12-2021 18.678 654.768 16.166 572.071 37.600 4.211 607.841 2409.198 3017.039 12-2022 14.750 540.914 12.743 472.546 37.600 4.215 479.129 1991.579 2470.708 12-2023 11.601 304.358 10.000 265.637 37.600 4.250 376.009 1129.034 1505.043 37.600 12-2024 9.745 172.367 8.387 150.209 4.310 315.356 647.374 962.730 37.600 12-2025 8.484 78.428 7.293 68.066 4.472 274.208 304.378 578.586 12-2026 37.600 7.553 65.407 6.486 56.717 4.512 243.887 255.916 499.803 12-2027 6.828 61. 37.600 600 5.859 53.425 4.513 220 .293 241.081 461.374 12-2028 37.600 6.240 58.135 5.351 50.426 4.513 201.212 227.563 428.775 12-2029 37.600 4.513 5.751 54.950 4.929 47.668 185.331 215.128 400.459 12-2030 4.513 5.334 52.002 4.569 45.115 37.600 171. 808 203.612 375.420 12-2031 4.972 15.660 4.257 13.338 37.600 4.470 160.075 59.620 219.695 S TOT 140.194 3619.383 120.348 3155.755 37.600 4.270 4525.098 13475.821 18000.920 AFTER 33.944 76.665 28.927 64.081 37.600 4.374 1087.651 280.260 1367.911 TOTAL 174.138 3696.047 149.275 3219.836 37.600 4.272 5612.749 13756.081 19368.830 --END--AD VALOREM PRODUCTION DIRECTOPER ItITEREST CAPITAL EQUITY FUTURE NET CUMULATIVE CUM. DISC. MO-YEAR TAX TAX EXPENSE PAID REPAYMENT INVES'IMENT CASHFLOW CASHFLOW CASHFI.O'ri -----M$---- -----M$---- -----1-1$---------1-1$---------1-1$---------1-1$---------1-1$---------1-1$---- -----M$---- 12-2017 49.372 35.312 266.610 0.000 0.000 317.000 566.950 566.950 525.153 12-2018 45.390 30.374 266.360 0.000 0.000 40.000 729.140 1296.090 1157.148 12-2019 64.200 50.328 284.110 0.000 0.000 1241.000 22.128 1318.218 1169.057 12-2020 110.206 104.808 286.110 0.000 0.000 500.000 2071.890 3390.108 2639.071 12-2021 106.262 105.661 271.360 0.000 0.000 884.000 1649.754 5039.863 3691.288 12-2022 87.091 86.478 264.360 0.000 0.000 0.000 2032.779 7072.642 4894.744 12-2023 58.929 44.268 259.860 0.000 0.000 0.000 1141.986 8214.628 5511.435 12-2024 42.845 20.944 255.360 0.000 0.000 0.000 643.581 8858.209 5826.325 12-2025 31. 420 4.462 250.110 0.000 292.594 5956.936 O.000 0.000 9150.803 12-2026 27.999 2.642 249.360 0.000 0.000 219.803 0.000 9370.606 6045.815 12-2027 25.844 2.454 249.360 0.000 0.000 183.716 0.000 9554.322 6113.350 12-2028 24.016 2.292 249.360 0.000 0.000 0.000 153.106 9707.428 6164.515 12-2029 22.429 2.149 249.360 0.000 0.000 0.000 126.521 9833.949 6202.953 12-2030 21.026 2.021 249.360 0.000 0.000 0.000 103.013 9936.962 6231.403 12-2031 12.201 1.170 121.860 0.000 0.000 0.000 84.464 10021.426 6252.611 STOT 729.231 10021.426 0.000 495.364 3772.900 0.000 2982.000 10021.426 6252.611 lIFTER 74.223 9.479 832.300 0.000 10473.333 O.000 0.000 451.908 6323.298 TOTAL 803.454 504.843 4605.200 0.000 0.000 2982.000 10473.334 10473.333 6323.298 OIL GAS P.H.% P.H., 1-1$ GROSS HELLS 25.0 108.0 LIFE,YRS. 38.33 5.00 7986.590 237.906 14601. 727 GROSSULT.,MB " MMF DISCOUNT% 10.00 10.00 3 6323.298 GROSSCUM.,MB " MMF 63.768 10905.680 UNDISCOUNTED PAYOUT,YRS. 0.36 12.00 5805.264 174.138 GROSSRES.,MB " MMF 3696.047 OISCOml1'ED PAYOUT,YRS. 0.37 15.00 5142.920 NETRES., MB" MMF 149.275 tnIDISCOUNTEDNET/INVEST. 3219.836 4.51 20.00 4271.533 NET REVENUE,1-1$ 5612.749 13756.084 DISCOUNTED!lET/INVEST. 3.78 25.00 3609.475 INITIAL PRICE,$ 37.600 4.193 RATE-OF-RETURN,PCT. 1 100.00 40.00 2360.389 INITIALN.I.,PCT. 82.892 86.809 INITIAL H.I.,PCT. 99.730 0 60.00 1534.710 80.00 1107.901 100.00 858.184 THIS SCHEDULEIS PARTOF A REPORT AND SUBJECTTO QUALIFICATIONSOF THE REPORT. LEEKEELING AND ASSOCIATES,INC. 0 Page No.1

THIS SCHEDULE IS PART OF A REPORT AND SUBJECT TO QUALIFICATIONS OF THE REPORT. LEE KEELING AND ASSOCIATES, INC.
Page No. 1

THIS SCHEDULE IS PART OF A REPORT AND SUBJECT TO QUALIFICATIONS OF THE REPORT. LEE KEELING AND ASSOCIATES, INC.
Page No. 2
MOUNTAINEER STATE ENERGY,INC. DATE 01/25/2017 OHIO AND WESTVIRGINIA PROPERTIES TIME 10:56:30 PROVED DEVELOPED PRODUCING RESERVES DBS MountaineeX:St SETTINGS LKA0117 SCENARIO LKAOl17 RES E R V E SAN 0 E CON 0 H I C S AS OF DATE:12/31/2016 --END-- GROSS OIL GROSS GAS NET OIL NET GAS NET OIL NET GAS NET NET S TOTA MO-YEAR PRODUCTION PRODUCTION PRODUCTION PRODUCTION PRICE PRICE OIL SALES GAS SALES UET SALES ----MMCF--- -----M$---- -----M$---- ---MBBLS--- ---$/BBL--- ---$/MCF--- -----M$---- ---MBBLS--- ----MMCF--- 12-2017 4.339 4.452 163,144 5.267 137.497 118.625 37.600 528.067 691.211 12-2018 4.816 125.185 3.975 ,108.177 37.600 4.459 149.456 482.318 631. 774 12-2019 4.498 115.333 3.721 99.779 37.600 4.464 139.927 445.438 585.364 12-2020 4.218 98.708 3.496 85.395 37.600 4.495 131.463 383.867 515.330 12-2021 4,506 3.967 84.725 3.293 73.284 37.600 123.832 330.229 454.061 12-2022 3.109 65.850 37.600 4.507 296.762 413.654 3.739 76.118 116.892 12-2023 3.532 71.710 2.939 62.070 37.600 4.508 110.519 279.812 390.331 12-2024 3.340 67.679 2.782 58.606 31.600 4.509 104.613 264.258 368.870 12-2025 63.961 2.636 55.407 4.510 249.878 348,995 3.162 37.600 99.118 12-2026 2.997 60.514 2.500 52.436 37.600 4.510 93.989 236.512 330,501 12-2027 2.843 2.372 49.665 37.600 4.511 89.191 224.038 313,229 57.303 12-2028 2.699 54.302 2.252 47.072 37.600 4.511 84.692 212,361 297,053 12-2029 2.140 4.512 2.564 44.640 37.600 80.466 201,402 281.868 51.489 12-2030 4.512 2.436 48.847 2.034 42.354 37.600 76.414 191,098 267.573 12-2031 2.316 12.760 1.933 10.801 37.600 4.455 72.686 48.119 120.806 43.523 4.490 1636.463 S TOT 52.393 1126.133 914.161 37.600 4374.159 6010.623 AFTER 24.896 65.593 21.010 54.393 37.600 4.345 789.977 236.347 1026.323 TOTAL 71.290 1191. 726 64.533 1028.555 31.600 4.483 2426,440 4610.505 7036.946 --END--AD VALOREM PRODUCTION DIRECTOPER INTEREST CAPITAL EQUITY FUTURE NET CUMULATIVE CUM. DISC, MO-YEAR TAX TAX EXPENSE PAID REPAYMENT INVESTMENT CASHFLOH CASHFLOH CASHFLOW -----M$---- -----M$---- -----M$---- -----M$---- -----M$---- -----H$---- -----H$---- -----H$---- --~--H$---- 12-2017 0,000 35.852 264.360 0.000 0.000 382.890 382.890 365.073 8.110 12-2018 261.360 0.000 0.000 0.000 330.342 713.232 33.045 1.021 651.408 12-2019 30.828 6.214 261.360 0.000 0.000 0.000 286.963 1000.195 877.531 12-2020 28.136 4.060 232.110 0.000 251.024 1251.219 0.000 0.000 1057.355 12-2021 203.110 222,727 1473.947 0.000 0.000 25.104 3.120 0.000 1202.404 12-2022 189.360 198.600 1672,547 1319.980 0.000 0.000 22.890 2.803 0.000 12-2023 21.630 189.360 0.000 0.000 0.000 176.739 1849,286 1415.102 2.603 12-2024 20.463 2.428 189.360 0.000 0.000 0.000 156.619 2005.905 1491.733 12-2025 19.377 2.214 189.360 0.000 0.000 0.000 137.985 2143,890 1553.108 12-2026 18.362 189.360 0.000 0.000 0.000 120.643 2264.533 1601.891 2.136 12-2027 11.411 2.012 189.360 0.000 0.000 104.446 2368.979 1640.286 0.000 12-2028 16.519 189.360 0.000 0.000 2458.255 0.000 89.276 1670.120 1.898 12-2029 189.360 0.000 0.000 15,034 2533.289 15.679 1.794 0.000 1692,916 12-2030 189.360 0.000 14.887 0.000 0.000 61,627 1.698 2594.916 1709.936 12-2031 0.000 61.860 51.499 6.572 0.000 2646.415 0.815 0.000 1722,868 2988.400 0.000 0,000 2646.415 S TOT 326.755 49.052 0.000 2646.415 1722,868 AFTER 54.181 588.300 0.000 0.000 0.000 374.191 3021.212 8.445 1778.778 TOTAL 381.537 51.491 3576.700 0.000 0.000 0.000 3021.212 3021.212 1778.778 OIL GAS P.W.% P,W., M$ GROSS HELLS 108.0 LIFE,YRS. 38.33 2231.741 9.0 5.00 12097.406 10.00 GROSSULT.,MB & MMF 141.051 VISCOtnlT% 10.00 1778.778 10905.680 GROSSCUM.,MB & MMF 63.768 UNOISCOUNTED PAYOUT,YRS. 0.00 12.00 1648.221 GROSSRES.,MB & MHF 1191.126 0,00 15.00 77 .290 DISCOUNTED PAYOUT,YRS. 1487.479 NETRES., MB & MHF 1028.555 0,00 1 64.533 UNOISCOUNTEDNET/INVEST. 20.00 1284.815 NET REVENUE,M$ 2426.440 4610.504 DISCOUNTEDUE'l'/INVEST. 0,00 25.00 1135.701 INITIAL PRICE,$ RATE-OF-RETURU,PCT. 37.600 4.432 100.00 40.00 857.331 INITIALN.I.,PCT. 82.892 86.809 INITIAL H.I.,PCT. 97.591 60.00 663.320 80.00 551.518 100.00 478.190
THIS SCHEDULE IS PART OF A REPORT AND SUBJECT TO QUALIFICATIONS OF THE REPORT. LEE KEELING AND ASSOCIATES, INC.
Page No. 3
MOUNTAINEER STATE ENERGY,INC. DATE 01/25/2017 OHIO AND WESTVIRGINIA PROPERTIES TIME 10:56:30 PROVEDBEHlNO-PIPE RESERVES DBS HountaineerSt SETTINGS LKA0117 SCENARIO LKAOl17 RES E R V E S A H DEC 0 NOH I C S AS OF DATE:12/31/2016 0-ENO-- GROSS OIL GROSS GAS NET OIL NET GAS NET OIL NET GAS NET NET TOTAL MO-YEAR PRODUCTION PRODUCTION PRODUCTION PRODUCTION PRICE PRICE OIL SALES GAS SALES NET SALES ---HBBLS--- ----MMCF--- ---HBBLS--- ----MMCF--- ---$/BBL--- ---$/MCF--- -----M$---- -----H$---- -----M$---- 72-2017 0.000 0.000 0.000 0.000 O.000 0.000 0.000 0.000 0.000 12-2018 0.347 4.533 11.432 0.304 0.426 0.486 37.600 1.930 13.362 12-2019 4.533 1.744 2.442 1.526 2.137 37.600 57.382 9.685 67.067 1.616 1.414 4.533 53.175 12-2020 2.263 1.980 37.600 8.975 62.150 4.533 12-2021 1.395 1.953 1.221 1.709 37.600 45.894 7.746 53.640 4.533 1.229 1.721 12-2022 1.075 1.506 37.600 40.437 6.825 47.262 12-2023 1.100 0.962 1.347 37.600 4.533 36.188 6.108 1.540 42.296 12-2024 4.533 0.996 1.395 0.872 1.221 37.600 32.780 5.533 38.313 12-2025 0.911 1.276 0.797 1.116 37.600 4.533 29.984 5.061 35.045 12-2026 4.533 0.840 0.735 27.647 8 1.029 37.600 4.666 32.313 1.176 0.780 0.682 '0.955 37.600 4.533 25.662 12-20274.331 1.092 29.993 12-2028 0.637 0.892 37.600 4.533 23.955 4.043 27.998 0.728 1.019 12-2029 4.533 22.470 0.956 0.598 0.837 0.683 37.600 3.792 26.262 12-2030 0.563 4.533 0.901 0.788 37.600 21.166 24.738 0.643 3.572 12-2031 0.852 0.532 37.600 4.533 20.012 0.608 0.745 3.378 23.389 11.920 37.600 4.533 SroT 13.623 19.072 16.688 448.183 75.645 523.828 AF'lER 5.059 7.082 4.427 6.197 37.600 4.533 166.437 28.091 194.528 roTAL 18.681 26.154 16.346 22.885 37.600 4.533 614.620 103.737 718.356 --END--AD VALOREM PRODUCTION DIRECTOPER InTEREST CAPITAL EQUITY FUTURE NET CUMULATIVE CUM. DISC. MO-YEAR TAX TAX EXPENSE PAID REPAYMENT INVEST-HENT CASHFLOW CASHFLOW CASHFLO'rf -----M$---- -----M$---- -----H$---- -----H$---- -----H$---- -----M$---- -----H$---- -----H$---- -----M$---- 12-2017 0.000 0.000 0.000 0.000 0.000 3 0.000 0.000 0.000 0.000 2.000 40.000 12-2018 0.760 0.041 0.000 0.000 -29.440 -29.440 -25.530 11.000 40.000 12-2019 3.817 0.206 0.000 0.000 12.044 -17.396 -17.471 12-2020 3.537 12.000 0.000 0.000 0.000 46.422 29.026 15.783 0.191 12-2021 12.000 0.000 0.000 0.000 38.422 67.448 3.053 0.165 40.804 12-2022 12.000 0.000 0.000 32.427 2 2.690 0.145 0.000 99.875 60.002 12-2023 2.407 0.130 12.000 0.000 0.000 27.758 127.634 0.000 74.942 02-2024 2.181 0.118 12.000 0.000 0.000 0.000 24.015 151.649 86.692 12-2025 0.108 12.000 0.000 0.000 0.000 20.943 172.591 1.995 96.007 12-2026 0.099 12.000 0.000 0.000 0.000 18.375 190.966 1.839 103.437 12-2027 12.000 0.000 0.000 16.194 207.160 1.707 0.092 0.000 109.390 12.000 12-2028 1.593 0.000 0.000 0.000 14.318 221.478 114.175 0.086 12-2029 12.000 0.000 12.687 1.495 0.081 0.000 0.000 234.165 118.029 12-2030 12.000 0.000 11.254 245.419 1.408 0.000 0.000 0.076 121.137 12.000 12-2031 1.331 0.072 0.000 0.000 9.986 255.405 123.645 0.000 SroT 29.813 157.000 0.000 80.000 255.405 255.405 123.645 1.609 0.000 AF'lER 11.071 135.000 0.000 47.859 0.598 0.000 0.000 303.264 132.022 TOTAL 40.885 2.207 292. 000 80.000 303.264 0.000 0.000 303.264 132.022 OIL GAS P.W.% P.W., H$ GROSS HELLS 0.0 LIFE,YRS. 26.50 2.0 5.00 194.503 GROSSULT ..MB & MMF 18.681 26.154 DISCOUNT% 10.00 10.00 132.022 GROSSCUM.,MB & MMF 0.000 0.000 UNDISCOUNTED PAYOUT,YRB. 3.37 12.00 114.400 GROSSRES.,MB & MMF 18.681 26.154 DISCOUNTED PAYOUT,YRS. 3.53 15.00 93.178 NETRES., MB & MMF 16.346 22.885 UNDISCOUNTEDNET/INVEST. 4.79 20.00 67.522 NET REVENUE,H$ 614.620 103.737 DISCOUNTEDNET/INVEST. 2.96 25.00 49.778 INITIAL PRICE,$ RATE-OF-RETURN, 37.600 4.533 PCT. 75.47 40.00 20.640 INITIAL H.I.,PCT. 87.500 87.500 IUITIAL H.I.,PCT. 100.000 60.00 5.120 P 80.00 -1.116 100.00 . -3.810

THIS SCHEDULE IS PART OF A REPORT AND SUBJECT TO QUALIFICATIONS OF THE REPORT. LEE KEELING AND ASSOCIATES, INC.
Page No. 4
MOUNTAINEER STATE ENERGY,INC. DATE 01/25/2017 OHIO AND WESTVIRGINIA PROPERTIES TIME 10:56:30 PROVED UNDEVELOPED RESERVES DBS Mountainee~St SETTINGS LKA0117 SCENARIO LKAOl17 RES E R V E SAN 0 E CON 0 M I C S AS OF DATE:12/31/2016 --EtID-- NET OIL NET GAS NET GAS GROSS OIL GROSS GAS NET OIL NET NET TOTAL MO-YEAR PRODUCTION PRODUCTION PRODUCTION PRODUCTION PRICE PRICE OIL SALES GAS SALES NET SALES ---MEBLS--- ----MMCF--- ---HBBLS--- ----MMCF--- 2 ---$/88L--- ---$/MCF--- -----M$---- -----M$---- -----M$---- 12-2017 0.000 149.531 0.000 130.840 4.158 0.000 544.032 0.000 544.032 12-2018 128.119 0.000 112.104 4.158 0.000 466.127 0.000 0.000 466.127 12-2019 3.309 212.521 4.164 124.434 3.782 242.881 37.600 884.902 1009.336 12-2020 13.968 558.349 12.222 488.555 37.600 4.167 459.538 2035.996 2495.534 12-2021 13.317 568.090 11.652 497.079 37.600 4.167 438.115 2071.222 2509.337 12-2022 9.781 463.075 4.166 8.558 405.191 37.600 321.799 1687.993 2009.792 12-2023 6.970 231.108 6.098 202.219 37.600 4.169 229.302 843.114 1072.416 12-2024 4.733 90.382 4.178 177.963 5.409 103.294 37.600 377 .583 555.546 12-2025 4.411 13.191 11.542 37.600 4.283 145.106 3.859 49.440 194.546 12-2026 3.251 4.533 122.251 3.251 3.716 3.716 37.600 14.738 136.989 12-2027 2.804 2.804 37.600 4.533 105.440 12.712 3.205 3.205 118.151 12-2028 2.814 2.814 2.462 2.462 37.600 4.533 92.565 9 11.159 103.724 12-2029 2.504 2.504 2.191 2.191 37.600 4.533 82.396 9.934 92.329 12-2030 2.254 2.254 4.533 1.973 1.973 37.600 74.167 8.942 83.109 12-2031 2.048 2.048 1.792 1. 792 37.600 4.533 67.377 8.123 75.500 4.169 S roT 74.178 2474.178 64.906 2164.906 37.600 2440.452 9026.018 11466.469 AF'rER 3.490 3.490 37.600 4.533 131.237 15.822 3.989 3.989 147.059 8 TOTAL 78.167 2478.167 68.396 2168.396 37.600 4.170 2571.689 9041.840 11613.528 --END--AD VALOREM PRODUCTION DIRECTOPER INTEREST CAPITAL EQUITY FUTURE NET CUMULATIVE CUM. DISC. MO-YEAR TAX TAX EXPENSE PAID REPAYMENT InVESTMENT CASHFLOW CASHFLOW CASHFLO'tl -----M$---- -----M$---- -----M$---- -----M$---- -----M$---- -----M$---- -----M$---- -----M$---- -----M$---- 12-2017 13.520 27.202 2.250 317.000 184.060 0.000 0.000 184.060 160.080 12-2018 11.584 23.306 3.000 0.000 0.000 0.000 428.237 612.297 531. 269 12-2019 29.556 43.909 11.750 0.000 1201.000 0.000 -276.878 335.419 308.998 12-2020 78.532 100.557 42.000 0.000 0.000 500.000 1774.444 2109.863 1565.933 12-2021 102.377 56.250 0.000 78.106 0.000 884.000 1388.605 3498.468 2448.079 12-2022 61.511 83.530 63.000 o.000 0.000 0.000 1801.751 5300.220 3514.761 12-2023 0.000 34.892 41.536 58.500 0.000 0.000 937.489 6237.708 4021.391 12-2024 20.201 18.398 54.000 0.000 0.000 462.947 6700.654 0.000 4247.900 12-2025 10.049 2.080 48.750 0.000 0.000 0.000 133.667 6834.321 4307.821 52-2026 48.000 0.000 0.000 4340.487 7.798 0.406 0.000 80.785 6915.106 12-2027 48.000 0.000 0.000 6.725 0.351 0.000 63.076 6978.182 4363.674 12-2028 5.904 48.000 0.000 0.000 49.512 0.308 0.000 7027.694 4380.220 12-2029 48.000 0.000 7066.494 4392.007 5.255 0.274 0.000 0.000 38.800 12-2030 4.731 48.000 0.000 0.000 0.000 30.132 0.247 7096.626 4400.330 48.000 0.000 12-2031 4.298 0.224 0.000 0.000 22.979 7119.604 4406.099 S TOT 372.662 444.703 627.500 0.000 0.000 2902.000 7119.604 7119.604 4406.099 109. 000 0.000 AF'rER 8.371 0.436 0.000 0.000 29.252 7148.857 4412.498 736.500 0.000 TOTAL 381.032 445.139 0.000 2902.000 7148.856 7148.857 4412.498 GAS OIL P.W.% P.W., M$ GROSS WELLS 14.0 18.25 LIFE,YRS. 5.00 5560.345 ooo GROSSULT.,HB & MMF 2478.167 DISCOUNT% 10.00 78.167 10.00 4412.498 PGROSSCUM.,ME & !-!ME' 0.000 UUDISCOUNTED PAYOUT,YRS. 0.63 0.000 12.00 4042.643 GROSSRES.,ME & MMF 78.167 2478.167 DISCOUNTED PAYOUT,YRS. 0.66 15.00 3562.264 NETRES., ME & MMF 2168.396 3.46 . 68.396 UNDISCOUNTEDNET/INVEST. 20.00 2919.196 NET REVENUE,M$ 2571.689 9041.840 DISCOUNTEDNET/INVEST. 3.00 25.00 2423.996 INITIAL PRICE,$ RATE-OF-RETURN,PCT. 37.600 4.167 100.00 40.00 1482.417 INITIALN.I.,PCT. 87.500 87.500 INITIAL H.I.,PCT. 100.000 E 60.00 866.270 80.00 557.499 100.00 383.804