Attached files
| file | filename |
|---|---|
| EX-99 - EX-99.2 - WildHorse Resource Development Corp | wrd-ex992_24.htm |
| EX-99 - EX-99.1 - WildHorse Resource Development Corp | wrd-ex991_23.htm |
| EX-32 - EX-32.1 - WildHorse Resource Development Corp | wrd-ex321_20.htm |
| EX-31 - EX-31.2 - WildHorse Resource Development Corp | wrd-ex312_21.htm |
| EX-31 - EX-31.1 - WildHorse Resource Development Corp | wrd-ex311_22.htm |
| EX-23 - EX-23.3 - WildHorse Resource Development Corp | wrd-ex233_132.htm |
| EX-23 - EX-23.2 - WildHorse Resource Development Corp | wrd-ex232_241.htm |
| EX-23 - EX-23.1 - WildHorse Resource Development Corp | wrd-ex231_131.htm |
| EX-21 - EX-21.1 - WildHorse Resource Development Corp | wrd-ex211_130.htm |
UNITED STATES SECURITIES AND EXCHANGE COMMISSION
Washington, D.C. 20549
Form 10-K
(Mark One)
|
☒ |
ANNUAL REPORT PURSUANT TO SECTION 13 OR 15(d) OF THE SECURITIES EXCHANGE ACT OF 1934 |
For the fiscal year ended December 31, 2016
OR
|
☐ |
TRANSITION REPORT PURSUANT TO SECTION 13 OR 15(d) OF THE SECURITIES EXCHANGE ACT OF 1934 |
Commission File Number: 001-37964
WildHorse Resource Development Corporation
(Exact name of Registrant as specified in its Charter)
|
Delaware |
|
81-3470246 |
|
( State or other jurisdiction of incorporation or organization) |
|
(I.R.S. Employer Identification No.) |
|
|
|
|
|
9805 Katy Freeway, Suite 400, Houston, TX |
|
77024 |
|
(Address of principal executive offices) |
|
(Zip Code) |
Registrant’s telephone number, including area code: (713) 568-4910
Securities registered pursuant to Section 12(b) of the Act:
|
Common Stock, par value $0.01 per share |
|
New York Stock Exchange |
|
(Title of each class) |
|
(Name of each exchange on which registered) |
Securities registered pursuant to Section 12(g) of the Act: None
Indicate by check mark if the Registrant is a well-known seasoned issuer, as defined in Rule 405 of the Securities Act. Yes ☐ No ☒
Indicate by check mark if the Registrant is not required to file reports pursuant to Section 13 or 15(d) of the Act. Yes ☐ No ☒
Indicate by check mark whether the Registrant: (1) has filed all reports required to be filed by Section 13 or 15(d) of the Securities Exchange Act of 1934 during the preceding 12 months (or for such shorter period that the Registrant was required to file such reports), and (2) has been subject to such filing requirements for the past 90 days. Yes ☒ No ☐
Indicate by check mark whether the Registrant has submitted electronically and posted on its corporate Web site, if any, every Interactive Data File required to be submitted and posted pursuant to Rule 405 of Regulation S-T (§232.405 of this chapter) during the preceding 12 months (or for such shorter period that the Registrant was required to submit and post such files). Yes ☐ No ☐
Indicate by check mark if disclosure of delinquent filers pursuant to Item 405 of Regulation S-K (§229.405) is not contained herein, and will not be contained, to the best of Registrant’s knowledge, in definitive proxy or information statements incorporated by reference in Part III of this Form 10-K or any amendment to this Form 10-K. ☒
Indicate by check mark whether the Registrant is a large accelerated filer, an accelerated filer, a non-accelerated filer, or a smaller reporting company. See the definition of “large accelerated filer”, “accelerated filer”, and “smaller reporting company” in Rule 12b-2 of the Exchange Act. (Check one):
|
Large accelerated filer |
☐ |
|
Accelerated filer |
☐ |
|
|
|
|
|
|
|
Non-accelerated filer |
☒ |
(Do not check if a small reporting company) |
Small reporting company |
☐ |
Indicate by check mark whether the Registrant is a shell company (as defined in Rule 12b-2 of the Exchange Act). Yes ☐ No ☒
As of June 30, 2016, the last business day of the registrant’s most recently completed second fiscal quarter, the registrant’s equity was not listed on any domestic exchange or over-the-counter market. The registrant’s common stock began trading on the New York Stock Exchange on December 14, 2016.
As of March 16, 2017, the registrant had 93,987,541 shares of common stock, $0.01 par value outstanding.
DOCUMENTS INCORPORATED BY REFERENCE
The Company’s definitive proxy statement relating to the annual meeting of shareholders (to be held May 18, 2017) will be filed with the Securities and Exchange Commission within 120 days after the close of the Company’s fiscal year ended December 31, 2016 and is incorporated by reference in Part III to the extent described herein.
WILDHORSE RESOURCE DEVELOPMENT CORPORATION
TABLE OF CONTENTS
|
|
|
|
|
Page |
|
|
|
PART I |
|
|
|
Item 1. |
|
|
10 |
|
|
Item 1A. |
|
|
31 |
|
|
Item 1B. |
|
|
53 |
|
|
Item 2. |
|
|
53 |
|
|
Item 3. |
|
|
53 |
|
|
Item 4. |
|
|
53 |
|
|
|
|
|
|
|
|
|
|
PART II |
|
|
|
Item 5. |
|
|
54 |
|
|
Item 6. |
|
|
55 |
|
|
Item 7. |
|
Management’s Discussion and Analysis of Financial Condition and Results of Operations |
|
57 |
|
Item 7A. |
|
|
73 |
|
|
Item 8. |
|
|
75 |
|
|
Item 9. |
|
Changes in and Disagreements With Accountants on Accounting and Financial Disclosure |
|
75 |
|
Item 9A. |
|
|
75 |
|
|
Item 9B. |
|
|
76 |
|
|
|
|
|
|
|
|
|
|
PART III |
|
|
|
Item 10. |
|
|
77 |
|
|
Item 11. |
|
|
77 |
|
|
Item 12. |
|
Security Ownership of Certain Beneficial Owners and Management and Related Stockholder Matters |
|
77 |
|
Item 13. |
|
Certain Relationships and Related Transactions, and Director Independence |
|
77 |
|
Item 14. |
|
|
77 |
|
|
|
|
|
|
|
|
|
|
PART IV |
|
|
|
Item 15. |
|
|
79 |
i
GLOSSARY OF OIL AND NATURAL GAS TERMS
The following are abbreviations and definitions of certain terms used in this document, which are commonly used in the oil and natural gas industry:
3-D seismic: Geophysical data that depict the subsurface strata in three dimensions. 3-D seismic typically provides a more detailed and accurate interpretation of the subsurface strata than 2-D, or two-dimensional, seismic.
Basin: A large natural depression on the earth’s surface in which sediments generally brought by water accumulate.
Bbl: One stock tank barrel of 42 U.S. gallons liquid volume used herein in reference to crude oil, condensate or NGLs.
Bcf: One billion cubic feet of natural gas.
Boe: One barrel of oil equivalent, calculated by converting natural gas to oil equivalent barrels at a ratio of six Mcf of natural gas to one Bbl of oil. This is an energy content correlation and does not reflect a value or price relationship between the commodities.
Boe/d: One Boe per day.
British thermal unit or Btu: The quantity of heat required to raise the temperature of a one-pound mass of water from 58.5 to 59.5 degrees Fahrenheit.
Completion: Installation of permanent equipment for production of oil or gas, or, in the case of a dry well, to reporting to the appropriate authority that the well has been abandoned.
Condensate: A mixture of hydrocarbons that exists in the gaseous phase at original reservoir temperature and pressure, but that, when produced, is in the liquid phase at surface pressure and temperature.
Delineation: The process of placing a number of wells in various parts of a reservoir to determine its boundaries and production characteristics.
Developed acreage: The number of acres that are allocated or assignable to productive wells or wells capable of production.
Development costs: Costs incurred to obtain access to proved reserves and to provide facilities for extracting, treating, gathering and storing the oil and natural gas. For a complete definition of development costs refer to the SEC’s Regulation S-X, Rule 4-10(a)(7).
Development project: The means by which petroleum resources are brought to the status of economically producible. As examples, the development of a single reservoir or field, an incremental development in a producing field or the integrated development of a group of several fields and associated facilities with a common ownership may constitute a development project.
Development well: A well drilled within the proved area of an oil or natural gas reservoir to the depth of a stratigraphic horizon known to be productive.
Differential: An adjustment to the price of oil or natural gas from an established spot market price to reflect differences in the quality and/or location of oil or natural gas.
Downspacing: Additional wells drilled between known producing wells to better develop the reservoir.
Dry well: A well found to be incapable of producing hydrocarbons in sufficient quantities such that proceeds from the sale of such production exceed production expenses and taxes.
Economically producible: The term economically producible, as it relates to a resource, means a resource which generates revenue that exceeds, or is reasonably expected to exceed, the costs of the operation. For a complete definition of economically producible, refer to the SEC’s Regulation S-X, Rule 4-10(a)(10).
Estimated ultimate recovery or EUR: The sum of reserves remaining as of a given date and cumulative production as of that date.
2
Exploratory well: A well drilled to find a new field or to find a new reservoir in a field previously found to be productive of oil or natural gas in another reservoir.
Field: An area consisting of a single reservoir or multiple reservoirs all grouped on, or related to, the same individual geological structural feature or stratigraphic condition. The field name refers to the surface area, although it may refer to both the surface and the underground productive formations. For a complete definition of field, refer to the SEC’s Regulation S-X, Rule 4-10(a)(15).
Formation: A layer of rock which has distinct characteristics that differs from nearby rock.
Generation 1: With respect to our Eagle Ford Acreage, a hybrid fracking technique using approximately 1,500 pounds per foot of sand and 33 Bbls per foot of fluid, with 200 foot stages and five clusters per stage at 80 barrels per minute. With respect to our North Louisiana Acreage, a slickwater fracking technique using approximately 1,450 pounds per foot of sand, with 200 foot stages and one cluster per stage at 57 barrels per minute.
Generation 3: With respect to our Eagle Ford Acreage, a slickwater fracking technique using approximately 3,700 pounds per foot of sand and 75 Bbls per foot of fluid, with 150 foot stages and nine clusters per stage at 90 barrels per minute.
Gross acres or gross wells: The total acres or wells, as the case may be, in which a working interest is owned.
Held by production: Acreage covered by a mineral lease that perpetuates a company’s right to operate a property as long as the property produces a minimum paying quantity of oil or gas.
Horizontal drilling: A drilling technique used in certain formations where a well is drilled vertically to a certain depth and then drilled at a right angle within a specified interval.
MBbls: One thousand barrels of crude oil, condensate or NGLs.
MBoe: One thousand Boe.
Mcf: One thousand cubic feet of natural gas.
MMBbls: One million barrels of crude oil, condensate or NGLs.
MMBoe: One million Boe.
MMBtu: One million British thermal units.
Net acres or net wells: Gross acres or wells, as the case may be, multiplied by our working interest ownership percentage.
Net production: Production that is owned less royalties and production due to others.
NGLs: Natural gas liquids. Hydrocarbons found in natural gas which may be extracted as liquefied petroleum gas and natural gasoline.
NYMEX: The New York Mercantile Exchange.
Offset operator: Any entity that has an active lease on an adjoining property for oil, natural gas or NGLs purposes.
Operator: The individual or company responsible for the development and/or production of an oil or natural gas well or lease.
Play: A geographic area with hydrocarbon potential.
Possible Reserves: Reserves that are less certain to be recovered than probable reserves.
Present value of future net revenues or PV-10: The estimated future gross revenue to be generated from the production of proved reserves, net of estimated production and future development and abandonment costs, using prices and costs in effect at the determination date, before income taxes, and without giving effect to non-property-related expenses, discounted to a present value using an annual discount rate of 10% in accordance with the guidelines of the SEC.
3
Probable Reserves: Reserves that are less certain to be recovered than proved reserves but that, together with proved reserves, are as likely as not to be recovered.
Production costs: Costs incurred to operate and maintain wells and related equipment and facilities, including depreciation and applicable operating costs of support equipment and facilities and other costs of operating and maintaining those wells and related equipment and facilities. For a complete definition of production costs, refer to the SEC’s Regulation S-X, Rule 4-10(a)(20).
Productive well: A well that is found to be capable of producing hydrocarbons in sufficient quantities such that proceeds from the sale of the production exceed production expenses and taxes.
Prospect: A specific geographic area which, based on supporting geological, geophysical or other data and also preliminary economic analysis using reasonably anticipated prices and costs, is deemed to have potential for the discovery of commercial hydrocarbons.
Proved area: Part of a property to which proved reserves have been specifically attributed.
Proved developed reserves: Reserves that can be expected to be recovered through (i) existing wells with existing equipment and operating methods or in which the cost of the required equipment is relatively minor compared with the cost of a new well or (ii) through installed extraction equipment and infrastructure operational at the time of the reserves estimate if the extraction is by means not involving a well.
Proved properties: Properties with proved reserves.
Proved reserves: Those quantities of oil, natural gas and NGLs, which, by analysis of geoscience and engineering data, can be estimated with reasonable certainty to be economically producible—from a given date forward, from known reservoirs, and under existing economic conditions, operating methods, and government regulations—prior to the time at which contracts providing the right to operate expire, unless evidence indicates that renewal is reasonably certain, regardless of whether deterministic or probabilistic methods are used for the estimation. The project to extract the hydrocarbons must have commenced or the operator must be reasonably certain that it will commence the project within a reasonable time. For a complete definition of proved oil and natural gas reserves, refer to the SEC’s Regulation S-X, Rule 4-10(a)(22).
Proved undeveloped reserves or PUDs: Proved reserves that are expected to be recovered from new wells on undrilled acreage or from existing wells where a relatively major expenditure is required for recompletion. Reserves on undrilled acreage are limited to those directly offsetting development spacing areas that are reasonably certain of production when drilled, unless evidence using reliable technology exists that establishes reasonable certainty of economic producibility at greater distances. Undrilled locations are classified as having undeveloped reserves only if a development plan has been adopted indicating that they are scheduled to be drilled within five years, unless the specific circumstances justify a longer time. Under no circumstances are estimates for proved undeveloped reserves attributable to any acreage for which an application of fluid injection or other improved recovery technique is contemplated, unless such techniques have been proved effective by actual projects in the same reservoir or an analogous reservoir, or by other evidence using reliable technology establishing reasonable certainty.
Realized price: The cash market price less all expected quality, transportation and demand adjustments.
Reasonable certainty: A high degree of confidence. For a complete definition of reasonable certainty, refer to the SEC’s Regulation S-X, Rule 4-10(a)(24).
Recompletion: The completion for production of an existing wellbore in another formation from that which the well has been previously completed
Reliable technology: Reliable technology is a grouping of one or more technologies (including computational methods) that has been field tested and has been demonstrated to provide reasonably certain results with consistency and repeatability in the formation being evaluated or in an analogous formation.
4
Reserves: Estimated remaining quantities of oil and natural gas and related substances anticipated to be economically producible, as of a given date, by application of development projects to known accumulations. In addition, there must exist, or there must be a reasonable expectation that there will exist, the legal right to produce or a revenue interest in the production, installed means of delivering oil and natural gas or related substances to market and all permits and financing required to implement the project. Reserves should not be assigned to adjacent reservoirs isolated by major, potentially sealing, faults until those reservoirs are penetrated and evaluated as economically producible. Reserves should not be assigned to areas that are clearly separated from a known accumulation by a non-productive reservoir (i.e., absence of reservoir, structurally low reservoir or negative test results). Such areas may contain prospective resources (i.e., potentially recoverable resources from undiscovered accumulations).
Reservoir: A porous and permeable underground formation containing a natural accumulation of producible oil and/or natural gas that is confined by impermeable rock or water barriers and is individual and separate from other reservoirs.
Resources: Quantities of oil and natural gas estimated to exist in naturally occurring accumulations. A portion of the resources may be estimated to be recoverable and another portion may be considered to be unrecoverable. Resources include both discovered and undiscovered accumulations.
Royalty: An interest in an oil and natural gas lease that gives the owner the right to receive a portion of the production from the leased acreage (or of the proceeds from the sale thereof), but does not require the owner to pay any portion of the production or development costs on the leased acreage. Royalties may be either landowner’s royalties, which are reserved by the owner of the leased acreage at the time the lease is granted, or overriding royalties, which are usually reserved by an owner of the leasehold in connection with a transfer to a subsequent owner.
Service well: A well drilled or completed for the purpose of supporting production in an existing field.
Spacing: The distance between wells producing from the same reservoir. Spacing is often expressed in terms of acres, e.g., 40-acre spacing, and is often established by regulatory agencies.
Spot market price: The cash market price without reduction for expected quality, transportation and demand adjustments.
Standardized measure: Discounted future net cash flows estimated by applying year-end prices to the estimated future production of year-end proved reserves. Future cash inflows are reduced by estimated future production and development costs based on period-end costs to determine pre-tax cash inflows. Future income taxes, if applicable, are computed by applying the statutory tax rate to the excess of pre-tax cash inflows over our tax basis in the oil and natural gas properties. Future net cash inflows after income taxes are discounted using a 10% annual discount rate.
Stratigraphic test well: A drilling effort, geologically directed, to obtain information pertaining to a specific geologic condition. Such wells customarily are drilled without the intent of being completed for hydrocarbon production. The classification also includes tests identified as core tests and all types of expendable holes related to hydrocarbon exploration. Stratigraphic tests are classified as “exploratory type” if not drilled in a known area or “development type” if drilled in a known area.
Undeveloped acreage: Lease acreage on which wells have not been drilled or completed to a point that would permit the production of commercial quantities of oil and natural gas regardless of whether such acreage contains proved reserves.
Unit: The joining of all or substantially all interests in a reservoir or field, rather than a single tract, to provide for development and operation without regard to separate property interests. Also, the area covered by a unitization agreement.
Unproved properties: Properties with no proved reserves.
Wellbore: The hole drilled by the bit that is equipped for natural gas production on a completed well. Also called well or borehole.
Working interest: The right granted to the lessee of a property to develop and produce and own natural gas or other minerals. The working interest owners bear the exploration, development and operating costs on either a cash, penalty or carried basis.
Workover: Operations on a producing well to restore or increase production.
WTI: West Texas Intermediate.
5
As used in this Annual Report unless the context indicates or otherwise requires, the terms listed below have the following meanings:
|
|
• |
“the Company”, “WildHorse Development,” “we,” “our,” “us” or like terms refer collectively to WHR II and Esquisto, together with their consolidated subsidiaries before the completion of our Corporate Reorganization and to WildHorse Resource Development Corporation and its consolidated subsidiaries, including WHR II, Esquisto and Acquisition Co., as of and following the completion of our Corporate Reorganization; |
|
|
• |
“WHR II” or our “predecessor” refers to WildHorse Resources II, LLC, together with its consolidated subsidiaries, which owns all of our North Louisiana Acreage; |
|
|
• |
“Esquisto” refers (i) for the period beginning January 1, 2014 through June 19, 2014, to the Initial Esquisto Assets, (ii) for the period beginning June 20, 2014 through February 16, 2015, to Esquisto I (iii) for the period beginning February 17, 2015 (date of common control) through January 11, 2016, to Esquisto I and Esquisto II on a combined basis and (iv) for the period beginning January 12, 2016 through the completion of our initial public offering on December 19, 2016, to Esquisto II; |
|
|
• |
“Initial Esquisto Assets” refers to the oil and natural gas properties contributed to Esquisto I in connection with the formation of Esquisto I on June 20, 2014; |
|
|
• |
“Esquisto I” refers to Esquisto Resources, LLC; |
|
|
• |
“Esquisto II” refers to Esquisto Resources II, LLC; |
|
|
• |
“Esquisto Merger” refers to the merger of Esquisto I with and into Esquisto II on January 12, 2016; |
|
|
• |
“Acquisition Co.” refers to WHE AcqCo., LLC, an entity formed to acquire the Burleson North Assets; |
|
|
• |
“Previous owner” refers to both Esquisto and Acquisition Co.; |
|
|
• |
“Management Members” refers (i) in the case of WHR II, collectively to the individual founders and employees and other individuals who, together with NGP, initially formed WHR II and (ii) in the case of Esquisto, collectively to the individual founders and employees and other individuals who initially formed Esquisto; |
|
|
• |
the “Corporate Reorganization” refers to (prior to and in connection with our initial public offering) (i) the former owners of WHR II exchanging all of their interests in WHR II for equivalent interests in WildHorse Investment Holdings and the former owners of Esquisto exchanging all of their interests in Esquisto for equivalent interests in Esquisto Investment Holdings, (ii) the contribution by WildHorse Investment Holdings to WildHorse Holdings of all of the interests in WHR II, the contribution by Esquisto Investment Holdings to Esquisto Holdings of all of the interests in Esquisto and the contribution by the former owner of Acquisition Co. of all its interests in Acquisition Co. to Acquisition Co. Holdings, (iii) the issuance of management incentive units by WildHorse Holdings, Esquisto Holdings and Acquisition Co. Holdings to certain of our officers and employees and (iv) the contribution by WildHorse Holdings, Esquisto Holdings and Acquisition Co. Holdings to us of all of the interests in WHR II, Esquisto and Acquisition Co., respectively, in exchange for shares of our common stock; |
|
|
• |
“WildHorse Holdings” refers to WHR Holdings, LLC, a limited liability company formed to own a portion of our common stock following the Corporate Reorganization; |
|
|
• |
“WildHorse Investment Holdings” refers to WildHorse Investment Holdings, LLC, a limited liability company formed to own all of the outstanding equity interests in WildHorse Holdings other than certain management incentive units issued by WildHorse Holdings in connection with our initial public offering as further described elsewhere in this Annual Report; |
|
|
• |
“Esquisto Holdings” refers to Esquisto Holdings, LLC, a limited liability company formed to own a portion of our common stock following the Corporate Reorganization; |
|
|
• |
“Esquisto Investment Holdings” refers to Esquisto Investment Holdings, LLC, a limited liability company formed to own all of the outstanding equity interests in Esquisto Holdings other than certain management incentive units issued by Esquisto Holdings in connection with our initial public offering as further described elsewhere in this Annual Report; |
|
|
• |
“Acquisition Co. Holdings” refers to WHE AcqCo Holdings, LLC, a limited liability company formed to own a portion of our common stock following the Corporate Reorganization; |
6
|
|
• |
“Terryville Complex” refers to the play located primarily in Lincoln Parish, Louisiana, and northern Jackson Parish, Louisiana; |
|
|
• |
“RCT Area” refers to our Ruston-Choudrant-Tremont acreage within the Terryville Complex located primarily in Lincoln Parish, Louisiana; |
|
|
• |
“Weyerhaeuser Area” refers to the acreage that we have the right to lease within the Terryville Complex located in northern Jackson Parish, Louisiana, which acreage is included in our acreage in this Annual Report (see “Business—Reserve Data—Acreage); |
|
|
• |
“Eagle Ford Acreage” refers to our acreage in the northern area of the Eagle Ford Shale in Southeast Texas, which has historically been owned and operated by Esquisto; |
|
|
• |
“Burleson North Assets” refers to certain producing properties and undeveloped acreage that Acquisition Co. acquired from Clayton Williams Energy, Inc. prior to or contemporaneously with the closing of our initial public offering, which acquisition is referred to as the “Burleson North Acquisition;” and |
|
|
• |
“NGP” refers to Natural Gas Partners, a family of private equity investment funds organized to make direct equity investments in the energy industry, including the funds invested in WHR II, Esquisto and Acquisition Co. |
7
This Annual Report on Form 10-K (“Annual Report”) contains “forward-looking statements” within the meaning of Section 27A of the Securities Act of 1933, as amended (the “Securities Act”), and Section 21E of the Securities Exchange Act of 1934, as amended (the “Exchange Act”). All statements, other than statements of historical fact included in this Annual Report, regarding our strategy, future operations, financial position, estimated revenues and losses, projected costs, prospects, plans and objectives of management are forward-looking statements. When used in this Annual Report, the words “could,” “believe,” “anticipate,” “intend,” “estimate,” “expect,” “project” and similar expressions are intended to identify forward-looking statements, although not all forward-looking statements contain such identifying words. These forward-looking statements are based on management’s current expectations and assumptions about future events and are based on currently available information as to the outcome and timing of future events. When considering forward-looking statements, you should keep in mind the risk factors and other cautionary statements described under “Item 1A. Risk Factors” included in this Annual Report.
Forward-looking statements may include statements about:
|
|
• |
our business strategy; |
|
|
• |
our estimated proved, probable and possible reserves; |
|
|
• |
our drilling prospects, inventories, projects and programs; |
|
|
• |
our ability to replace the reserves we produce through drilling and property acquisitions; |
|
|
• |
our financial strategy, liquidity and capital required for our development program; |
|
|
• |
our realized oil, natural gas and NGL prices; |
|
|
• |
the timing and amount of our future production of oil, natural gas and NGLs; |
|
|
• |
our hedging strategy and results; |
|
|
• |
our future drilling plans; |
|
|
• |
competition and government regulations; |
|
|
• |
our ability to obtain permits and governmental approvals; |
|
|
• |
pending legal or environmental matters; |
|
|
• |
our marketing of oil, natural gas and NGLs; |
|
|
• |
our leasehold or business acquisitions; |
|
|
• |
costs of developing our properties; |
|
|
• |
general economic conditions; |
|
|
• |
credit markets; |
|
|
• |
uncertainty regarding our future operating results; and |
|
|
• |
plans, objectives, expectations and intentions contained in this Annual Report that are not historical. |
We caution you that these forward-looking statements are subject to all of the risks and uncertainties, most of which are difficult to predict and many of which are beyond our control, incident to the development, production, gathering and sale of oil and natural gas. These risks include, but are not limited to, commodity price volatility, inflation, lack of availability of drilling and production equipment and services, environmental risks, drilling and other operating risks, regulatory changes, the uncertainty inherent in estimating reserves and in projecting future rates of production, cash flow and access to capital, the timing of development expenditures and the other risks described under “Item 1A. Risk Factors” included in this Annual Report.
Reserve engineering is a process of estimating underground accumulations of oil and natural gas that cannot be measured in an exact way. The accuracy of any reserve estimate depends on the quality of available data, the interpretation of such data and price and cost assumptions made by reserve engineers. In addition, the results of drilling, testing and production activities may justify revisions of estimates that were made previously. If significant, such revisions would change the schedule of any further production and development program. Accordingly, reserve estimates may differ significantly from the quantities of oil and natural gas that are ultimately recovered.
8
Should one or more of the risks or uncertainties described in this Annual Report occur, or should underlying assumptions prove incorrect, our actual results and plans could differ materially from those expressed in any forward-looking statements.
All forward-looking statements, expressed or implied, included in this Annual Report are expressly qualified in their entirety by this cautionary statement. This cautionary statement should also be considered in connection with any subsequent written or oral forward-looking statements that we or persons acting on our behalf may issue.
Except as otherwise required by applicable law, we disclaim any duty to update any forward-looking statements, all of which are expressly qualified by the statements in this section, to reflect events or circumstances after the date of this Annual Report.
9
Overview
WildHorse Resource Development Corporation (the “Company”) is a Delaware corporation, the common stock, par value $0.01 per share, of which are listed on the New York Stock Exchange (“NYSE”) under the symbol “WRD.”
Our predecessor was formed in 2013. We operate in one reportable segment engaged in the acquisition, exploitation, development and production of oil, natural gas and NGL resources. Our assets are characterized by concentrated acreage positions in Southeast Texas and North Louisiana with multiple producing stratigraphic horizons, or stacked pay zones, and attractive single-well rates of return. In Southeast Texas, we primarily operate in Burleson, Lee and Washington Counties where we primarily target the Eagle Ford Shale. In North Louisiana, we operate in and around the highly prolific Terryville Complex, where we primarily target the overpressured Cotton Valley play.
As of December 31, 2016, we had assembled a total leasehold position of approximately 467,319 gross (371,198 net) acres across our expanding acreage, including approximately 321,661 gross (262,742 net) acres in the Eagle Ford and approximately 145,658 gross (108,456 net) acres in North Louisiana. We have identified a total of approximately 4,548 gross (2,350 net) drilling locations across our acreage. For the year ended December 31, 2016, approximately 60%, 34% and 5% of our revenues were attributable to oil, natural gas and NGLs, respectively.
Recent Developments
Eagle Ford Acquisitions
In February 2017, we announced multiple third-party transactions to acquire certain oil and natural gas producing and non-producing properties in Burleson County, TX for an aggregate price of approximately $15.6 million, subject to customary post-closing adjustments. One transaction closed in February 2017 and the remaining transactions are expected to close in April 2017.
2025 Senior Notes Offering
In February 2017, we completed a private placement of $350.0 million aggregate principal amount of 6.875% senior unsecured notes due 2025 (the “2025 Senior Notes”) at 99.244% of par. The 2025 Senior Notes will mature on February 1, 2025 and are fully and unconditionally guaranteed on a joint and several basis by all of our existing and certain future subsidiaries. We used the net proceeds of the offering to repay all of the borrowings outstanding under our revolving credit facility and for general corporate purposes, including funding our 2017 capital expenditures.
Initial Public Offering
On December 19, 2016, we completed our initial public offering pursuant to which we sold 27,500,000 shares of our common stock at an offering price of $15.00 per share. We received net proceeds from such offering of $393.4 million, after deducting underwriting discounts and commissions and fees and expenses associated with such offering.
We used the net proceeds from our initial public offering, along with approximately $230.6 million of borrowings under our revolving credit facility, as described below, to (i) fund the remaining portion of the Burleson North Acquisition purchase price and (ii) repay in full and terminate our prior revolving credit facilities and repay in full all notes payable by Esquisto to its members. In connection with our initial public offering, we completed the Corporate Reorganization, pursuant to which, among other things, WHR II, Esquisto and Acquisition Co. were contributed to us by WildHorse Holdings, Esquisto Holdings and Acquisition Co. Holdings, respectively.
On January 17, 2017, we also issued and sold 2,297,100 shares of our common stock at an offering price of $15.00 per share pursuant to the partial exercise of the underwriters’ over-allotment option associated with our initial public offering (the “Option Exercise”). We received net proceeds of $32.6 million from the Option Exercise, all of which was used to repay outstanding borrowings under our revolving credit facility.
10
In connection with the closing of our initial public offering, we, as borrower, and our subsidiaries, as guarantors, entered into a five-year, $1.0 billion senior secured revolving credit facility, with an initial borrowing base of $450.0 million (our “revolving credit facility”). In connection with our 2025 Senior Notes offering, our borrowing base was automatically reduced by $87.5 million. For more information, please see “Item 7. Management’s Discussion and Analysis of Financial Condition and Results of Operations—Liquidity and Capital Resources—Debt Agreements—Revolving Credit Facility.”
Rosewood Acquisition
In December 2016, we acquired from certain third parties approximately 7,500 net acres, consisting primarily of additional working interests in our Eagle Ford Acreage in Lee County in exchange for 1,308,427 shares of our common stock. The acreage we acquired resulted in the addition of approximately 78 net drilling locations to our drilling inventory.
Burleson North Acquisition
In December 2016, we acquired approximately 158,000 net acres of oil and gas properties adjacent to our Eagle Ford Acreage (the “Burleson North Assets”) from Clayton Williams Energy, Inc. for a purchase price of $389.8 million in cash. The Burleson North Assets produced an average of approximately 3.9 MBoe/d (80% oil) for the three months ended September 30, 2016 and added 637 gross and net drilling locations to our drilling inventory.
November Acquisition
In November 2016, we acquired from certain third parties approximately 4,900 net acres in Burleson County for approximately $30.0 million. Such assets acquired added 68 gross (66 net) drilling locations to our drilling inventory and produced approximately 14 Boe/d as of October 1, 2016.
Our Properties
Eagle Ford Acreage
The Eagle Ford Shale is one of the most active unconventional shale trends in North America. According to weekly rig count metrics published by Baker Hughes, the Eagle Ford Shale has consistently been one of the most active basins in the United States since 2011 and currently has the second highest rig count of all major U.S. basins. The Eagle Ford Shale trends across Texas from the Mexican border north into East Texas and is roughly 50 miles wide and 400 miles long. The Eagle Ford Shale rests between the Austin Chalk and the Buda Lime at a depth of approximately 4,000 to 14,000 feet. As of December 31, 2016, there were approximately 35,227 producing wells in the Eagle Ford with total production of 2.0 MMBoe/d in December 2016.
We currently target a portion of the Eagle Ford Shale at depths between 7,000 feet and 12,200 feet primarily in Burleson, Lee and Washington Counties, Texas. This portion of the Eagle Ford Shale averages 125 feet in thickness and contains 70% carbonate. We believe that the elevated carbonate percentages are in large part responsible for the brittleness of the Eagle Ford and successful completions which exhibit high productivity when fractured. The overall clay content of the Eagle Ford increases regionally as it continues northeast into Brazos, Grimes and Madison Counties, Texas.
We are focused on maximizing returns and expect operational efficiencies to extend beyond our existing drilling inventory to additional horizons. In addition, our acreage has been extensively developed for more than 40 years through the development of the Giddings Austin Chalk Trend. Based on analysis and interpretation of well results and other geologic and engineering data, we believe our acreage is also prospective for the Georgetown, Buda, Woodbine and Pecan Gap formations. Historical operators in the Giddings Austin Chalk Trend have experienced drilling and production success in these four horizons during our industry’s pre-multistage frac era (1970s-2000s). Future development results achieved by us and offset operators may allow us to expand our existing location inventory in these four intervals throughout our leasehold.
We entered the Eagle Ford with the goal of redeveloping the area with horizontal drilling and modern completion techniques. Since that time, we have completed multiple bolt-on acquisitions and in-fill leases to build our current position in the Eagle Ford. We divide our Burleson County acreage into sub-regions, which we refer to as Burleson Main, Burleson North, Burleson West and Burleson South, based on our assessment of depth and reservoir characteristics, such as gas to oil ratio, pressure and clay content. All of our drilling activity has historically been focused in our Burleson Main area. We have identified a substantial inventory of 3,135 gross drilling locations within our Eagle Ford Acreage, consisting of 2,676 gross drilling locations in Burleson County, Texas, 423 gross drilling locations in Lee County, Texas, and 36 gross drilling locations in Washington County, Texas. The wells in our Eagle Ford Acreage have shown a strong track record of increasing EURs and a decreasing trend in drilling and completion capital costs.
11
As of December 31, 2016, our Eagle Ford position included approximately 262,742 net acres. Also, as of December 31, 2016, approximately 49% of our Eagle Ford Acreage was held by production, with an average working interest of 82%, and, as of December 31, 2016, 24% of our 104.7 MMBoe of proved reserves were developed, 93% of which were liquids. To date, we have drilled and completed 38 wells, acquired 388 wells and participated in 28 wells resulting in total net production of approximately 6.7 MBoe/d (72% oil, 12% natural gas and 16% NGLs), including non-operated production.
North Louisiana Acreage
Within our North Louisiana Acreage we primarily target the overpressured Cotton Valley formation in the Terryville Complex. The Cotton Valley formation, extending across East Texas, North Louisiana and Southern Arkansas, has been under development since the 1930s and is characterized by thick, multi-zone natural gas and oil reservoirs with well-known geologic characteristics and long-lived, predictable production profiles. Over 23,000 vertical and horizontal wells have been completed throughout the trend. In 2005, operators started redeveloping the Cotton Valley using horizontal drilling and advanced hydraulic fracturing techniques. Through December 31, 2016, operators have drilled over 1,100 horizontal Cotton Valley wells. Some large, analogous redevelopment projects in the Terryville Complex include the Terryville play in Lincoln Parish, the Nan-Su-Gail area in Freestone County, East Texas and the Carthage Complex in Panola County, East Texas.
Our North Louisiana Acreage spans across the Webster, Claiborne, Bienville, Lincoln, Jackson and Ouachita Parishes, focusing on the Bear Creek field and the RCT and Weyerhaeuser Areas, where we are targeting overpressured Cotton Valley opportunities in multiple zones. We believe the Terryville Complex, which has been producing since 1954, is one of North America’s most prolific liquids rich natural gas plays, characterized by high recoveries relative to drilling and completion costs, high initial production rates with high liquids yields, long reserve life, multiple stacked pay zones, available infrastructure and a large number of service providers. The RCT Area is a direct offset of the Terryville Field and is part of the same Terryville Complex trend. Our drilling activity is expected to focus on producing natural gas from the overpressured Cotton Valley formation in the Terryville Complex where we intend to target the Upper and Lower Red and Upper Deep Pink intervals.
As of December 31, 2016, our North Louisiana Acreage included approximately 108,455 net acres. Also, as of December 31, 2016, 46% of our acreage was then held by production, with an average working interest of 74%, and 46% of our 48 MMBoe of proved reserves were developed, 98% of which were natural gas. As of December 31, 2016, we had drilled and completed 13 wells, acquired 605 wells and participated in two non-operated wells resulting in a total 2016 net production of approximately 7.8 MBoe/d (3% oil, 95% natural gas and 2% NGLs), including non-operated production.
Reserve Summary
Our estimated proved reserves of were prepared by our internal reserve engineers and audited by Cawley, Gillespie and Associates, Inc. (“Cawley”), our independent reserve engineers. As of December 31, 2016, we had 152.5 MMBoe of estimated proved reserves. As of this date, our proved reserves were 35.5% natural gas and 64.5% oil and NGLs. The following table provides summary information regarding our estimated proved reserves data and our average net daily production by area based on our reserve reports as of December 31, 2016:
|
Region |
|
Proved Total (MMBoe) |
|
|
% Oil & Liquids |
|
|
%Developed |
|
|
Average Net Daily Production (MBoe/d) |
|
||||
|
Eagle Ford |
|
|
104.7 |
|
|
|
92.8 |
% |
|
|
24.3 |
% |
|
|
6.7 |
|
|
North Louisiana |
|
|
47.8 |
|
|
|
2.5 |
% |
|
|
45.7 |
% |
|
|
7.8 |
|
|
Total |
|
|
152.5 |
|
|
|
|
|
|
|
|
|
|
|
14.5 |
|
|
|
(1) |
Our estimated net proved reserves as of December 31, 2016 were determined using average first-day-of-the month prices for the prior 12 months in accordance with SEC rules. For oil and NGL volumes, the average WTI posted price of $42.75 per barrel as of December 31, 2016 was adjusted for quality, transportation fees and a regional price differential. For natural gas volumes, the average Henry Hub spot price of $2.481 per MMBtu as of December 31, 2016 was adjusted for energy content, transportation fees and a regional price differential. All prices are held constant throughout the lives of the properties. The average adjusted product prices weighted by production over the remaining lives of our properties are $40.34 per barrel of oil, $10.77 per barrel of NGL and $1.788 per Mcf of natural gas as of December 31, 2016. |
Business Strategies
To achieve our primary objective of delivering shareholder value, we intend to execute the following business strategies:
12
Grow production, reserves and cash flow through the development of our extensive drilling inventory. We believe our extensive inventory of drilling locations in the Eagle Ford and the overpressured Cotton Valley formation in and around the Terryville Complex, combined with our operating expertise, will enable us to continue to deliver accretive production, reserves and cash flow growth and create shareholder value. We have identified a total of approximately 4,548 gross (2,350 net) drilling locations across our acreage, with further upside potential given the multiple stacked pay zones across much of our acreage in addition to potential downspacing. We will continue to closely monitor offset operators as they delineate adjoining acreage and zones, providing us further data to optimize our development plan over time. We believe the location, concentration and scale of our core leasehold positions, coupled with our technical understanding of the reservoirs will allow us to efficiently develop our core areas and to allocate capital to maximize the value of our resource base.
Maximize returns by optimizing drilling and completion techniques and improving operating efficiencies. Our management is intently focused on driving efficiencies in the development of our resource base by maximizing our hydrocarbon recovery per well while minimizing our drilling, completion and operating costs. To achieve these efficiencies, we focus on:
|
|
• |
minimizing the costs of drilling and completing horizontal wells through our knowledge of the target formations, pad drilling and reduced drilling times; |
|
|
• |
maximizing EURs through advanced drilling, completion and production techniques, such as by optimizing lateral lengths, the number of hydraulic fracturing stages and perforation intervals, water and proppant volumes, fluid chemistry, choke management and the strategic use of artificial lift techniques; |
|
|
• |
maximizing our cash flows by targeting specific areas within our balanced portfolio of oil and natural gas drilling opportunities based on the existing commodity price environment; and |
|
|
• |
minimizing operating costs through our experience in efficient well management. |
In our Eagle Ford Acreage, we have reduced our drilling and completion costs per completed lateral foot by approximately 67%, from $2,958 per foot for our wells completed using Generation 1 hydraulic fracturing design to approximately $989 per foot for our wells completed using Generation 3 hydraulic fracturing design. Additionally, as we have transitioned our completion techniques in our Eagle Ford Acreage from Generation 1 to Generation 3 hydraulic fracturing designs, we have increased EURs by approximately 28% per completed lateral foot from an average of 76 Boe per foot to 97 Boe per foot. In our North Louisiana Acreage, we have reduced our drilling and completion costs per completed lateral foot by approximately 17%, from approximately $1,878 per foot for the year ended December 31, 2015 to approximately $1,559 per foot for the year ended December 31, 2016. Our drilling and completion cost reductions coupled with our completion design improvements are generating enhanced single-well recoveries and attractive returns in the current commodity environment, and we believe we can further optimize our results through these and other technologies across our acreage position.
Capture additional horizontal development opportunities on current acreage. Our existing asset base provides numerous opportunities for our management team to create shareholder value by increasing our inventory beyond our currently identified drilling locations. Based on results from our horizontal drilling program and those of offset operators, including offset production trends, mud logs, 2-D and 3-D seismic, well data analysis and geologic trend mapping, we believe our acreage has multiple productive zones providing significant upside potential to our current inventory of identified drilling locations. We have excluded from our identified drilling locations potential opportunities associated with downspacing and with additional horizontal drilling locations in (i) the Austin Chalk trend in Burleson County, (ii) the Eagle Ford Shale in Washington County, (iii) the Buda, Woodbine, Georgetown and Pecan Gap zones that are present across much of our Eagle Ford Acreage and (iv) additional Cotton Valley intervals across our North Louisiana Acreage.
Utilize extensive acquisition and technical expertise to grow our core acreage position. We have a demonstrated track record of identifying and cost effectively acquiring attractive resource development opportunities, including the recent acquisitions highlighted under “—Recent Developments.” To date, our management and technical teams have completed numerous acquisitions, and we expect to continue to identify and opportunistically lease or acquire additional acreage and producing assets to add to our multi-year drilling inventory. We have followed a geologically driven strategy to establish large, contiguous leasehold positions in our two basins and strategically expand those positions through bolt-on acquisitions over time. We believe our Eagle Ford and North Louisiana Acreage create a platform upon which we can add value by acquiring additional acreage and incremental drilling locations near our current acreage. In this regard, NGP and its affiliates are not limited in their ability to compete with us for future acquisitions, and we do not expect to enter into any agreements or arrangement to apportion future opportunities between us, on the one hand, and NGP and its affiliates, on the other hand.
Maintain a disciplined, growth-oriented financial strategy. We prudently manage our liquidity and leverage levels by monitoring cash flow, capital spending and debt capacity, which, being a two-basin company, we believe will allow us to strategically deploy capital among projects across our acreage. After giving effect to our 2025 Senior Notes offering, we have approximately
13
$362.5 million of available borrowing capacity under our revolving credit facility. We also had $105.9 million in cash and cash equivalents as of March 15, 2017. We intend to fund our growth primarily with internally generated cash flows while maintaining ample liquidity and access to the capital markets, which we believe will allow us to accelerate our development program and maximize the present value of our resource potential. Consistent with our disciplined approach to financial management, we have an active commodity hedging program that seeks to reduce our exposure to downside commodity price fluctuations, enabling us to protect cash flows and maintain liquidity to fund our capital program and investment opportunities.
Business Strengths
We believe that the following strengths will allow us to successfully execute our business strategies.
Extensive, contiguous acreage position in two of North America’s leading oil and gas plays. We own an extensive and substantially contiguous acreage position targeting two of the premier plays in North America, the Eagle Ford Shale and the overpressured Cotton Valley formation in and around the Terryville Complex. As of December 31, 2016, we had approximately 467,319 gross (371,198 net) acres and we had 152.5 MMBoe of proved reserves (57.4% oil, 35.5% natural gas and 7.1% NGLs) across our acreage. We believe that our recent well results demonstrate that many of the wells on our high-quality acreage are capable of producing single-well rates of return that are competitive with many of the top performing basins in the United States. Furthermore, the location of our acreage provides us with lower operating costs and better realized pricing than other companies operating in different basins around the country due to our acreage’s proximity to the end markets for oil, natural gas and NGLs.
Multi-year inventory of drilling opportunities across our acreage position. We have identified approximately 4,548 gross (2,350 net) drilling locations across our acreage position, providing us with approximately 45 years of drilling inventory based on our 2017 drilling program. On our Eagle Ford Acreage, our horizontal drilling locations target the Eagle Ford Shale in Burleson and Lee Counties and the Austin Chalk in Washington County, and on our North Louisiana Acreage, our horizontal drilling locations target the Upper Red, Lower Red and Upper Deep Pink zones in the RCT and Weyerhaeuser Areas in the overpressured Cotton Valley formation in the Terryville Complex. In addition, we believe our acreage position includes a number of additional areas and zones that are prospective for hydrocarbons. For example, we believe we may identify additional horizontal drilling locations in (i) the Austin Chalk trend in Burleson County, (ii) the Eagle Ford Shale in Washington County, (iii) the Buda, Woodbine, Georgetown and Pecan Gap zones that are present across much of our Eagle Ford Acreage and (iv) additional Cotton Valley intervals across our North Louisiana Acreage. Furthermore, we also believe that we may add horizontal drilling locations across our entire acreage position through downspacing.
Significant operational control over our assets with low-cost operations. As the operator of a majority of our acreage, we have significant operational control over our assets. We seek to allocate capital among projects in a manner that optimizes both costs and returns, which we believe results in a highly efficient drilling program. We believe maintaining operational control will enable us to enhance returns by implementing more efficient and cost-effective operating practices, such as through the selection of economic drilling locations, the opportunistic timing of development and ongoing improvement of drilling, completion and operating techniques. Our contiguous acreage blocks, and our practice and history of exchanging and consolidating acreage with adjacent operators, allow us to increase our working interest in our wells and provide flexibility to adjust our drilling and completion techniques, such as pad drilling and the length of our horizontal laterals, in order to optimize our well results, drilling costs and returns.
Balanced asset portfolio with significant capital allocation optionality. We believe our balanced exposure to both oil and natural gas gives us the ability to adjust our capital plan and drilling program to rebalance our production as market conditions evolve. We have significant exposure to natural gas and NGLs in our North Louisiana Acreage and significant exposure to oil and NGLs in our Eagle Ford Acreage. As of December 31, 2016, 64.5% and 35.5% of our total proved reserves were comprised of liquids and natural gas, respectively. In addition, approximately 44% and 56% of our production for the year ended December 31, 2016 was comprised of liquids and natural gas, respectively. As changes in the commodity price environment occur, we intend to adapt and manage our capital spending and production profile to benefit from these trends.
Management and technical teams with substantial technical and operational expertise. Our management and technical teams have significant industry experience and a long history of collaboration in the identification, execution and integration of acquisitions and in cost-efficient management of profitable, large-scale drilling programs. Additionally, we have substantial expertise in advanced drilling and completion technologies and decades of collective experience in operating in the Eagle Ford and North Louisiana. Mr. Graham, our Chief Executive Officer, and Mr. Bahr, our President, co-founded one of the predecessors to, and Mr. Graham served as Chief Executive Officer of, Memorial Resource Development Corp. (“MRD”), which pioneered the horizontal redevelopment of the Terryville Complex, participating in the drilling of MRD’s initial 55 horizontal wells. Further, our management team has a proven track record of returning value to shareholders and a significant economic interest in us directly and through its equity interests in each of WildHorse Holdings and Esquisto Holdings. We believe our management team is motivated to use its experience in identifying
14
and creating value across our acreage and drilling highly productive wells to deliver attractive returns, maintain safe and reliable operations and create shareholder value.
Geographically advantaged assets with significant midstream infrastructure to service our production. Our acreage position is in close proximity to end markets for oil, natural gas and NGLs, providing us with a regional price advantage. For example, low oil and natural gas basis differentials along the Gulf Coast represent a competitive advantage when compared to other plays, such as the Marcellus, Utica, Permian and DJ. Recently developed and low-cost legacy infrastructure is in place across significant portions of our acreage to support our development program. In addition, we own and operate a large portion of our necessary midstream infrastructure which provides us with improved netbacks. On our North Louisiana Acreage, we own and operate a gathering system with capacity of approximately 250 MMcf/d as of December 31, 2016, as well as a saltwater disposal well. On our Eagle Ford Acreage, we own substantial fresh water supply and storage and are in the process of developing a saltwater disposal well. Our midstream infrastructure allows us to realize lower operating costs and provides us with increased flexibility in our development program. In addition, while not currently contemplated, our midstream infrastructure could prove to be a future source of additional capital if monetized at an attractive valuation.
Our Principal Stockholders
WildHorse Holdings, Esquisto Holdings, Acquisition Co. Holdings, NGP XI US Holdings, L.P. (“NGP XI”), and management directly own 22.6%, 41.2%, 2.7%, 9.6% and 1.4%, respectively, of our common stock. WildHorse Holdings, Esquisto Holdings and Acquisition Co. Holdings are controlled by NGP. As of February 14, 2017, according to its Schedule 13G filing, NGP and its affiliates (through WildHorse Holdings, Esquisto Holdings, Acquisition Co. Holdings and NGP XI) beneficially owned approximately 76.1% of our common stock.
Reserve Data
Preparation of Reserve Estimates
Our reserve estimates as of December 31, 2016 included in this Annual Report are based on evaluations prepared by our management and audited by the independent petroleum engineering firm of Cawley in accordance with Standards Pertaining to the Estimating and Auditing of Oil and Gas Reserves Information promulgated by the Society of Petroleum Evaluation Engineers and definitions and guidelines established by the SEC. Our independent reserve engineers were selected for their historical experience and geographic expertise in engineering similar resources.
Proved reserves are reserves which, by analysis of geoscience and engineering data, can be estimated with reasonable certainty to be economically producible from a given date forward from known reservoirs under existing economic conditions, operating methods and government regulations prior to the time at which contracts providing the right to operate expires, unless evidence indicates that renewal is reasonably certain, regardless of whether deterministic or probabilistic methods are used for estimation. If deterministic methods are used, the term “reasonable certainty” implies a high degree of confidence that the quantities of oil or natural gas actually recovered will equal or exceed the estimate. If probabilistic methods are used, there should at least be a 90% probability that the quantities actually recovered will equal or exceed the estimate. The technical and economic data used in the estimation of our proved reserves include, but are not limited to, well logs, geologic maps, well-test data, production data (including flow rates), well data (including lateral lengths), historical price and cost information, and property ownership interests. Our independent reserve engineers use this technical data, together with standard engineering and geoscience methods, or a combination of methods, including performance analysis, volumetric analysis, and analogy. The proved developed reserves and EURs per well are estimated using performance analysis and volumetric analysis. The estimates of the proved developed reserves and EURs for each developed well are used to estimate the proved undeveloped reserves for each proved undeveloped location (utilizing type curves, statistical analysis, and analogy).
Internal Controls
Our internal staff of petroleum engineers and geoscience professionals works closely with our independent reserve engineers to ensure the integrity, accuracy and timeliness of data furnished to our independent reserve engineers in their reserve auditing process. Periodically, our technical team meets with the independent reserve engineers to review properties and discuss methods and assumptions used by us to prepare reserve estimates.
Reserve engineering is and must be recognized as a subjective process of estimating volumes of economically recoverable oil and natural gas that cannot be measured in an exact manner. The accuracy of any reserve estimate is a function of the quality of available data and of engineering and geological interpretation. As a result, the estimates of different engineers often vary. In addition, the results of drilling, testing and production may justify revisions of such estimates. Accordingly, reserve estimates often differ from
15
the quantities of oil, natural gas and NGLs that are ultimately recovered. Estimates of economically recoverable oil, natural gas and NGLs and of future net revenues are based on a number of variables and assumptions, all of which may vary from actual results, including geologic interpretation, prices and future production rates and costs. Please read “Item 1A. Risk Factors” appearing elsewhere in this Annual Report.
For the year ended December 31, 2016, our reserve estimates and related reports were prepared internally and reviewed and approved by Jason Pearce. Mr. Pearce is our Senior Vice President, Reserves and has approximately 18 years of experience in oil and gas operations, reservoir engineering, reserve management, unconventional reservoir characterization and strategic planning. Cawley performed audits of our internally prepared reserves estimates on our proved reserves as of December 31, 2016. Our proved reserves are, in the aggregate, reasonable and within the established audit tolerance guidelines of 10%. The reports of Cawley contain further discussion of the reserves estimates and its audit procedure.
Cawley was founded in 1961 and performs consulting petroleum engineering services under Texas Board of Professional Engineers Registration No. F-693. Within Cawley, the technical person primarily responsible for preparing the estimates shown herein with respect to WHR II and Esquisto, was Todd Brooker. Prior to joining Cawley, Mr. Brooker worked in Gulf of Mexico drilling and production engineering at Chevron USA. Mr. Brooker has been an employee of Cawley since 1992. His responsibilities include reserve and economic evaluations, fair market valuations, field studies, pipeline resource studies and acquisition/divestiture analysis. His reserve reports are routinely used for public company SEC disclosures. His experience includes significant projects in both conventional and unconventional resources in every major U.S. producing basin and abroad, including oil and gas shale plays, coalbed methane fields, waterfloods and complex, faulted structures. Mr. Brooker graduated with honors from the University of Texas at Austin in 1989 with a Bachelor of Science degree in Petroleum Engineering, and is a registered Professional Engineer in the State of Texas. He is also a member of the Society of Petroleum Engineers.
Estimated Proved Reserves
The following table presents the estimated net proved oil and natural gas reserves as of December 31, 2016, based on our audited reserve reports.
|
|
|
Oil (MBbls) |
|
|
Natural Gas (MMcf) |
|
|
NGLs (MBbls) |
|
|
Total (MBoe) |
|
||||
|
Estimated Proved Reserves |
|
|
|
|
|
|
|
|
|
|
|
|
|
|
|
|
|
Total Proved Developed |
|
|
19,192 |
|
|
|
145,880 |
|
|
|
3,765 |
|
|
|
47,270 |
|
|
Total Proved Undeveloped |
|
|
68,255 |
|
|
|
179,222 |
|
|
|
7,109 |
|
|
|
105,235 |
|
|
Total Proved Reserves |
|
|
87,447 |
|
|
|
325,102 |
|
|
|
10,874 |
|
|
|
152,505 |
|
Development of Proved Undeveloped Reserves
As of December 31, 2016, we had 105.2 MMBoe of proved undeveloped reserves consisting of 68.3 MBbls of oil, 179.2 MMcf of natural gas and 7.1 MBbls of NGLs. None of our PUDs as of December 31, 2016 are scheduled to be developed on a date more than five years from the date the reserves were initially booked to PUDs. PUDs will be converted from undeveloped to developed as the applicable wells begin production.
Our PUDs changed during 2016 as a result of:
|
|
• |
upward performance and price revisions of 5.4 MMBoe; |
|
|
• |
acquisitions of 21.5 MMBoe; and |
|
|
• |
reserve additions of 19.7 MMBoe. |
Reconciliation of PV-10 to Standardized Measure
PV-10 is a non-GAAP financial measure and differs from the Standardized Measure of discounted future net cash flows, which is the most directly comparable GAAP financial measure. PV-10 is a computation of the Standardized Measure of discounted future net cash flows on a pre-tax basis. PV-10 is equal to the Standardized Measure of discounted future net cash flows at the applicable date, before deducting future income taxes, discounted at 10 percent. We believe that the presentation of PV-10 is relevant and useful to investors because it presents the discounted future net cash flows attributable to our estimated net proved reserves prior to taking into account future corporate income taxes, and it is a useful measure for evaluating the relative monetary significance of our oil and
16
natural gas properties. Further, investors may utilize the measure as a basis for comparison of the relative size and value of our reserves to other companies without regard to the specific tax characteristics of such entities. We use this measure when assessing the potential return on investment related to our oil and natural gas properties. PV-10, however, is not a substitute for the Standardized Measure of discounted future net cash flows. Our PV-10 measure and the Standardized Measure of discounted future net cash flows do not purport to represent the fair value of our oil and natural gas reserves.
The following table provides a reconciliation of PV-10 of our proved reserves to the Standardized Measure of discounted future net cash flows at December 31, 2016, 2015 and 2014:
|
|
|
For the Year Ending December 31, |
|
|||||||||
|
|
|
2016 |
|
|
2015 |
|
|
2014 |
|
|||
|
|
|
(in thousands) |
|
|||||||||
|
PV-10 |
|
$ |
749,988 |
|
|
$ |
451,861 |
|
|
$ |
230,201 |
|
|
Less: present value of future income taxes discounted at 10% |
|
|
(206,947 |
) |
|
|
(5,931 |
) |
|
|
(302 |
) |
|
Standardized measure |
|
$ |
543,041 |
|
|
$ |
445,930 |
|
|
$ |
229,899 |
|
Reserves Sensitivity
Historically, commodity prices have been extremely volatile and we expect this volatility to continue for the foreseeable future. For example, for the three years ended December 31, 2016, the NYMEX-WTI oil spot price ranged from a high of $107.95 per Bbl to a low of $26.19 per Bbl, while the NYMEX-Henry Hub natural gas spot price ranged from a high of $8.15 per MMBtu to a low of $1.49 per MMBtu. For the year ended December 31, 2016, the West Texas Intermediate posted price ranged from a high of $54.01 per Bbl on December 28, 2016 to a low of $26.19 per Bbl on February 11, 2016 and the Henry Hub spot market price ranged from a high of $3.80 per MMBtu on December 7, 2016 to a low of $1.49 per MMBtu on March 4, 2016. NGL prices have also suffered significant recent declines. The continuation of low prices for oil or natural gas could materially and adversely affect our financial position, our results of operations, the quantities of oil and natural gas reserves that we can economically produce and our access to capital.
While it is difficult to quantify the impact of the continuation of low commodity prices on our estimated proved reserves with any degree of certainty because of the various components and assumptions used in the process of estimating reserves, the following sensitivity table is provided to illustrate the estimated impact of pricing changes on our estimated proved reserve volumes and standardized measure. In addition to different price assumptions, the sensitivity cases below include assumed capital and operating expense changes we would expect to realize under each scenario. Sensitivity cases are used to demonstrate the impact that a change in price and cost environment may have on reserves volumes and standardized measure. There is no assurance that these prices or cost savings will actually be achieved.
|
|
|
Base Case (1) |
|
|
Case A (2) |
|
|
Case B (2) |
|
|||
|
Crude oil price ($/Bbl) |
|
$ |
42.75 |
|
|
$ |
48.00 |
|
|
$ |
55.00 |
|
|
Natural gas price ($/Mcf) |
|
$ |
2.481 |
|
|
$ |
2.93 |
|
|
$ |
3.43 |
|
|
NGL price ($/Bbl) |
|
$ |
42.75 |
|
|
$ |
48.00 |
|
|
$ |
55.00 |
|
|
|
|
|
|
|
|
|
|
|
|
|
|
|
|
Capital expenditure increase |
|
n/a |
|
|
Flat |
|
|
|
5 |
% |
||
|
Operating expenditure increase |
|
n/a |
|
|
Flat |
|
|
|
5 |
% |
||
|
|
|
|
|
|
|
|
|
|
|
|
|
|
|
Proved developed reserves (MMBoe) |
|
|
47,270 |
|
|
|
49,166 |
|
|
|
51,211 |
|
|
Proved undeveloped reserves (MMBoe) |
|
|
105,235 |
|
|
|
109,827 |
|
|
|
116,824 |
|
|
Total proved reserves (MMBoe) |
|
|
152,505 |
|
|
|
158,993 |
|
|
|
168,035 |
|
|
|
|
|
|
|
|
|
|
|
|
|
|
|
|
PV-10 value (in thousands) (3) |
|
$ |
749,988 |
|
|
$ |
1,036,433 |
|
|
$ |
1,484,776 |
|
|
Less: present value of future income taxes discounted at 10% (in thousands) |
|
|
(206,947 |
) |
|
|
(292,641 |
) |
|
|
(455,182 |
) |
|
Standardized measure (in thousands) |
|
$ |
543,041 |
|
|
$ |
743,792 |
|
|
$ |
1,029,594 |
|
|
|
(1) |
SEC pricing as of December 31, 2016 before adjustment for market differentials. |
|
|
(2) |
Prices represent potential SEC pricing based on different pricing assumptions before adjustments for market differentials. |
|
|
(3) |
PV-10 is a non-GAAP financial measure. For a definition of PV-10, see “—Reserve Data—Reconciliation of PV-10 to Standard Measure.” |
17
Production, Revenue and Price History
For a description of ours, our predecessor’s and the previous owners’ combined historical production, revenues and average sales prices and unit costs, see “Item 7. Management’s Discussion and Analysis of Financial Condition and Results of Operations – Results of Operations.”
The following tables summarize our average net production, average unhedged sales prices by product and average production costs by geographic region for the years ended December 31, 2016, 2015 and 2014, respectively:
|
|
|
Year Ended December 31, 2016 |
|
|||||||||||||||||||||||||||||||||
|
|
|
Oil |
|
|
Natural Gas |
|
|
NGLs |
|
|
Total |
|
|
|
|
|
||||||||||||||||||||
|
|
|
Production Volumes |
|
|
Average Sales Price |
|
|
Production Volumes |
|
|
Average Sales Price |
|
|
Production Volumes |
|
|
Average Sales Price |
|
|
Production Volumes |
|
|
Average Sales Price |
|
|
Lease Operating Expense |
|
|||||||||
|
|
|
(MBbls) |
|
|
($/Bbl) |
|
|
(MMcf) |
|
|
($/Mcf) |
|
|
(MBbls) |
|
|
($/Bbl) |
|
|
(MBoe) |
|
|
($/MBoe) |
|
|
($/MBoe) |
|
|||||||||
|
Eagle Ford |
|
|
1,765 |
|
|
$ |
41.21 |
|
|
|
1,750 |
|
|
$ |
2.20 |
|
|
|
404 |
|
|
$ |
11.74 |
|
|
|
2,461 |
|
|
$ |
33.05 |
|
|
$ |
2.42 |
|
|
North Louisiana |
|
|
83 |
|
|
$ |
38.70 |
|
|
|
16,070 |
|
|
$ |
2.47 |
|
|
|
67 |
|
|
$ |
15.54 |
|
|
|
2,828 |
|
|
$ |
15.52 |
|
|
$ |
2.25 |
|
|
Total |
|
|
1,848 |
|
|
|
|
|
|
|
17,820 |
|
|
|
|
|
|
|
471 |
|
|
|
|
|
|
|
5,289 |
|
|
|
|
|
|
$ |
2.33 |
|
|
Average net production (MBoe/d) |
|
|
|
|
|
|
|
|
|
|
|
|
|
|
|
|
|
|
|
|
|
|
|
|
|
|
14.5 |
|
|
|
|
|
|
|
|
|
|
|
|
Year Ended December 31, 2015 |
|
|||||||||||||||||||||||||||||||||
|
|
|
Oil |
|
|
Natural Gas |
|
|
NGLs |
|
|
Total |
|
|
|
|
|
||||||||||||||||||||
|
|
|
Production Volumes |
|
|
Average Sales Price |
|
|
Production Volumes |
|
|
Average Sales Price |
|
|
Production Volumes |
|
|
Average Sales Price |
|
|
Production Volumes |
|
|
Average Sales Price |
|
|
Lease Operating Expense |
|
|||||||||
|
|
|
(MBbls) |
|
|
($/Bbl) |
|
|
(MMcf) |
|
|
($/Mcf) |
|
|
(MBbls) |
|
|
($/Bbl) |
|
|
(MBoe) |
|
|
($/MBoe) |
|
|
($/MBoe) |
|
|||||||||
|
Eagle Ford |
|
|
895 |
|
|
$ |
44.45 |
|
|
|
1,210 |
|
|
$ |
2.34 |
|
|
|
248 |
|
|
$ |
11.38 |
|
|
|
1,345 |
|
|
$ |
33.78 |
|
|
$ |
4.05 |
|
|
North Louisiana |
|
|
73 |
|
|
$ |
43.98 |
|
|
|
13,637 |
|
|
$ |
2.63 |
|
|
|
103 |
|
|
$ |
14.24 |
|
|
|
2,449 |
|
|
$ |
16.54 |
|
|
$ |
3.51 |
|
|
Total |
|
|
968 |
|
|
|
|
|
|
|
14,847 |
|
|
|
|
|
|
|
351 |
|
|
|
|
|
|
|
3,794 |
|
|
|
|
|
|
$ |
3.70 |
|
|
Average net production (MBoe/d) |
|
|
|
|
|
|
|
|
|
|
|
|
|
|
|
|
|
|
|
|
|
|
|
|
|
|
10.4 |
|
|
|
|
|
|
|
|
|
|
|
|
Year Ended December 31, 2014 |
|
|||||||||||||||||||||||||||||||||
|
|
|
Oil |
|
|
Natural Gas |
|
|
NGLs |
|
|
Total |
|
|
|
|
|
||||||||||||||||||||
|
|
|
Production Volumes |
|
|
Average Sales Price |
|
|
Production Volumes |
|
|
Average Sales Price |
|
|
Production Volumes |
|
|
Average Sales Price |
|
|
Production Volumes |
|
|
Average Sales Price |
|
|
Lease Operating Expense |
|
|||||||||
|
|
|
(MBbls) |
|
|
($/Bbl) |
|
|
(MMcf) |
|
|
($/Mcf) |
|
|
(MBbls) |
|
|
($/Bbl) |
|
|
(MBoe) |
|
|
($/MBoe) |
|
|
($/MBoe) |
|
|||||||||
|
North Louisiana |
|
|
31 |
|
|
$ |
90.55 |
|
|
|
9,388 |
|
|
$ |
4.44 |
|
|
|
41 |
|
|
$ |
23.89 |
|
|
|
1,637 |
|
|
$ |
27.78 |
|
|
$ |
5.76 |
|
|
Average net production (MBoe/d) |
|
|
|
|
|
|
|
|
|
|
|
|
|
|
|
|
|
|
|
|
|
|
|
|
|
|
4.5 |
|
|
|
|
|
|
|
|
|
Productive Wells
Productive wells consist of producing wells and wells capable of production, including natural gas wells awaiting pipeline connections to commence deliveries and oil wells awaiting connection to production facilities. Gross wells are the total number of producing wells in which we own an interest, and net wells are the sum of our fractional working interests owned in gross wells. The following table sets forth information relating to the productive wells in which we owned a working interest as of December 31, 2016.
|
|
|
Oil |
|
|
Natural Gas |
|
||||||||||||||||||
|
|
|
Gross |
|
|
Net |
|
|
Average Working Interest |
|
|
Gross |
|
|
Net |
|
|
Average Working Interest |
|
||||||
|
Eagle Ford Acreage |
|
|
|
|
|
|
|
|
|
|
|
|
|
|
|
|
|
|
|
|
|
|
|
|
|
Operated |
|
|
359.00 |
|
|
|
337.44 |
|
|
|
93.99 |
% |
|
|
36.00 |
|
|
|
30.25 |
|
|
|
84.03 |
% |
|
Non-operated |
|
|
61.00 |
|
|
|
16.16 |
|
|
|
26.49 |
% |
|
|
4.00 |
|
|
|
0.36 |
|
|
|
9.00 |
% |
|
North Louisiana Acreage |
|
|
|
|
|
|
|
|
|
|
|
|
|
|
|
|
|
|
|
|
|
|
|
|
|
Operated |
|
|
7.00 |
|
|
|
4.78 |
|
|
|
68.29 |
% |
|
|
428.00 |
|
|
|
316.03 |
|
|
|
73.84 |
% |
|
Non-operated |
|
|
1.00 |
|
|
|
0.11 |
|
|
|
11.00 |
% |
|
|
92.00 |
|
|
|
10.22 |
|
|
|
11.11 |
% |
|
Total |
|
|
428.00 |
|
|
|
358.49 |
|
|
|
83.76 |
% |
|
|
560.00 |
|
|
|
356.86 |
|
|
|
63.73 |
% |
18
The following table sets forth certain information regarding the total developed and undeveloped acreage in which we owned an interest as of December 31, 2016. Approximately 49% of our net Eagle Ford Acreage and 46% of our net North Louisiana Acreage was held by production at December 31, 2016.
|
Region |
|
Developed Acres(1) |
|
|
Undeveloped Acres |
|
|
Total Acres |
|
|||||||||||||||
|
|
|
Gross (2) |
|
|
Net (3) |
|
|
Gross (2) |
|
|
Net (3) |
|
|
Gross (2) |
|
|
Net (3) |
|
||||||
|
Eagle Ford Acreage |
|
|
10,752 |
|
|
|
8,325 |
|
|
|
310,909 |
|
|
|
254,418 |
|
|
|
321,661 |
|
|
|
262,743 |
|
|
North Louisiana Acreage |
|
|
80,759 |
|
|
|
49,450 |
|
|
|
64,899 |
|
|
|
59,005 |
|
|
|
145,658 |
|
|
|
108,455 |
|
|
Total |
|
|
91,511 |
|
|
|
57,775 |
|
|
|
375,808 |
|
|
|
313,423 |
|
|
|
467,319 |
|
|
|
371,198 |
|
|
|
(1) |
Developed acres are acres spaced or assigned to productive wells or wells capable of production. |
|
|
(2) |
A gross acre is an acre in which we own a working interest. The number of gross acres is the total number of acres in which we own a working interest. |
|
|
(3) |
A net acre is deemed to exist when the sum of our fractional ownership working interests in gross acres equals one. The number of net acres is the sum of the fractional working interests owned in gross acres expressed as whole numbers and fractions thereof. |
Included in our North Louisiana Acreage in the table above are approximately 12,848 net acres we have the right to lease pursuant to an oil and gas lease option agreement with affiliates of Weyerhaeuser Company (“Weyerhaeuser”). Pursuant to that agreement, we have the right, upon notice to Weyerhaeuser, to lease acreage in exchange for a specified bonus payment. Upon such notice and our payment of the applicable bonus payment, Weyerhaeuser is obligated under the option agreement to enter into a three-year lease with us for the acreage we specify in the notice. The purchase price of this option was $0.5 million, and in addition, we also made a prepayment of $0.4 million as an initial lease bonus for 1,285 unspecified net acres associated with leases under the option. In October 2016, we made a payment of $1.5 million to extend the option for one year, as further described below.
Undeveloped Acreage Expirations
The following table sets forth the number of total net undeveloped acres as of December 31, 2016 across our Eagle Ford and North Louisiana Acreage that will expire in 2017, 2018, 2019, 2020 and 2021, unless production is established within the spacing units covering the acreage prior to the expiration dates or unless such leasehold rights are extended or renewed.
|
Region |
|
2017 |
|
|
2018 |
|
|
2019 |
|
|
2020 |
|
|
2021 |
|
|||||
|
Eagle Ford Acreage |
|
|
49,016 |
|
|
|
45,889 |
|
|
|
31,334 |
|
|
|
4,618 |
|
|
|
100 |
|
|
North Louisiana Acreage |
|
|
42,971 |
|
|
|
11,445 |
|
|
|
1,784 |
|
|
|
1,326 |
|
|
|
1 |
|
|
Total |
|
|
91,987 |
|
|
|
57,334 |
|
|
|
33,118 |
|
|
|
5,944 |
|
|
|
101 |
|
We intend to extend substantially all of the net acreage associated with our drilling locations through a combination of development drilling and leasehold extension and renewal payments. Of the 49,016 net acres expiring in 2017 across our Eagle Ford Acreage, we have the option to extend or renew the leases covering 17,251 net acres and have budgeted approximately $9.9 million in 2017 to execute extensions and renewals. With respect to the remaining 31,765 net acres for which we do not have an option to extend or renew in the Eagle Ford, 3,716 net acres are associated with 30 gross (20.6 net) wells of proved undeveloped reserves where the leases covering such expected wells will expire prior to our expected drilling date though we expect to extend or renew such leases. Further, with respect to the total remaining 28,049 net acres for which we do not have an option to extend or renew in the Eagle Ford, we intend to retain substantially all such acreage by negotiating lease extensions or renewals or drilling wells. Of the 42,971 net acres expiring in 2017 across our North Louisiana Acreage, we have the option to extend 22,762 of the 26,560 net acres in the RCT and Weyerhaeuser Areas, and we have budgeted approximately $14.2 million in 2017 to execute such extensions and renewals. In October 2016, we executed a second amendment to an option for an oil and gas lease agreement with affiliates of Weyerhaeuser Company to extend our option to lease approximately 12,848 net acres to October 2017, which we refer to in this Annual Report as our “Weyerhaeuser Area.” Upon notice and payment of the applicable lease bonus payment, we can enter into a three-year lease covering all such acreage. With respect to the remaining 3,798 net acres for which we do not have an option to extend or renew, we have not assigned any proved undeveloped reserves to such locations, although we intend to retain substantially all such acreage by negotiating lease extensions or renewals or drilling wells. We also have 16,411 net acres in our North Louisiana Acreage expiring in 2017 other areas. We plan to extend or renew approximately 1,211 net acres for an estimated cost of approximately $0.7 million and intend to let the remainder of this acreage expire. Accordingly, we have not assigned any drilling locations to such acreage. Please see Item 1A “Risk Factors—Risks Related to Our Business—Certain of our undeveloped leasehold acreage is subject to leases that will expire over the next several years unless production is established on units containing the acreage or the leases are renewed.”
19
The following table describes the development and exploratory wells drilled on our acreage during the years ended December 31, 2016, 2015 and 2014. At December 31, 2016, 5.0 gross (4.1 net) wells were in various stages of completion.
|
|
|
Year Ended December 31, |
|
|||||||||||||||||||||
|
|
|
2016 |
|
|
2015 |
|
|
2014 |
|
|||||||||||||||
|
|
|
Gross |
|
|
Net |
|
|
Gross |
|
|
Net |
|
|
Gross |
|
|
Net |
|
||||||
|
Eagle Ford Acreage |
|
|
|
|
|
|
|
|
|
|
|
|
|
|
|
|
|
|
|
|
|
|
|
|
|
Development wells: |
|
|
|
|
|
|
|
|
|
|
|
|
|
|
|
|
|
|
|
|
|
|
|
|
|
Productive |
|
|
20.00 |
|
|
|
16.06 |
|
|
|
18.00 |
|
|
|
17.84 |
|
|
|
— |
|
|
|
— |
|
|
Dry |
|
|
— |
|
|
|
— |
|
|
|
— |
|
|
|
— |
|
|
|
— |
|
|
|
— |
|
|
Exploratory wells: |
|
|
|
|
|
|
|
|
|
|
|
|
|
|
|
|
|
|
|
|
|
|
|
|
|
Productive |
|
|
— |
|
|
|
— |
|
|
|
— |
|
|
|
— |
|
|
|
— |
|
|
|
— |
|
|
Dry |
|
|
— |
|
|
|
— |
|
|
|
— |
|
|
|
— |
|
|
|
— |
|
|
|
— |
|
|
North Louisiana Acreage |
|
|
|
|
|
|
|
|
|
|
|
|
|
|
|
|
|
|
|
|
|
|
|
|
|
Development wells: |
|
|
|
|
|
|
|
|
|
|
|
|
|
|
|
|
|
|
|
|
|
|
|
|
|
Productive |
|
|
4.00 |
|
|
|
1.78 |
|
|
|
6.00 |
|
|
|
4.51 |
|
|
|
3.00 |
|
|
|
2.95 |
|
|
Dry |
|
|
— |
|
|
|
— |
|
|
|
— |
|
|
|
— |
|
|
|
— |
|
|
|
— |
|
|
Exploratory wells: |
|
|
|
|
|
|
|
|
|
|
|
|
|
|
|
|
|
|
|
|
|
|
|
|
|
Productive |
|
|
— |
|
|
|
— |
|
|
|
3.00 |
|
|
|
2.70 |
|
|
|
— |
|
|
|
— |
|
|
Dry |
|
|
— |
|
|
|
— |
|
|
|
— |
|
|
|
— |
|
|
|
— |
|
|
|
— |
|
|
Total wells |
|
|
|
|
|
|
|
|
|
|
|
|
|
|
|
|
|
|
|
|
|
|
|
|
|
Development wells: |
|
|
|
|
|
|
|
|
|
|
|
|
|
|
|
|
|
|
|
|
|
|
|
|
|
Productive |
|
|
24.00 |
|
|
|
17.84 |
|
|
|
24.00 |
|
|
|
22.35 |
|
|
|
3.00 |
|
|
|
2.95 |
|
|
Dry |
|
|
— |
|
|
|
— |
|
|
|
— |
|
|
|
— |
|
|
|
— |
|
|
|
— |
|
|
Total development wells |
|
|
24.00 |
|
|
|
17.84 |
|
|
|
24.00 |
|
|
|
22.35 |
|
|
|
3.00 |
|
|
|
2.95 |
|
|
Exploratory wells: |
|
|
|
|
|
|
|
|
|
|
|
|
|
|
|
|
|
|
|
|
|
|
|
|
|
Productive |
|
|
— |
|
|
|
— |
|
|
|
3.00 |
|
|
|
2.70 |
|
|
|
— |
|
|
|
— |
|
|
Dry |
|
|
— |
|
|
|
— |
|
|
|
— |
|
|
|
— |
|
|
|
— |
|
|
|
— |
|
|
Total exploratory wells |
|
|
— |
|
|
|
— |
|
|
|
3.00 |
|
|
|
2.70 |
|
|
|
— |
|
|
|
— |
|
|
Total |
|
|
24.00 |
|
|
|
17.84 |
|
|
|
27.00 |
|
|
|
25.05 |
|
|
|
3.00 |
|
|
|
2.95 |
|
All wells drilled were productive wells, except for one development well drilled in our North Louisiana Acreage during the year ended December 31, 2014 and one exploratory well drilled in our North Louisiana Acreage during the year ended December 31, 2015, each of which was not productive.
In July 2015, we reduced our drilling program in our North Louisiana Acreage to one rig in response to low commodity prices and continued operating a one-rig drilling program through February 2016. Similarly, in early October 2015, we reduced our drilling program in our Eagle Ford Acreage to one rig, which we ran until February 2016, at which point we ceased drilling due to the commodity price environment. We are currently running a five-rig program in our Eagle Ford Acreage and a one-rig program in North Louisiana Acreage, which we are utilizing on a well-to-well basis. We are not currently a party to any long-term drilling rig contracts.
Delivery Commitments
We have no commitments to deliver a fixed and determinable quantity of our oil or natural gas production to customers in the near future under our existing contracts.
We were assigned a firm gas transportation service agreement with Regency Intrastate Gas LLC (“RIGS”) as a result of our predecessor’s property acquisition on August 8, 2013. Under the terms of the agreement, we are obligated to pay total daily transportation fees not to exceed $0.30 per MMBtu per day for quantities of 40,000 MMBtu per day to RIGS until March 5, 2019.
Our Operations
General
We have leased or acquired approximately 467,319 gross (371,198 net) acres where we had a weighted-average working interest of approximately 79%, as of December 31, 2016. As operator of a majority of our acreage, we design and manage the development of a well and supervise operation and maintenance activities on a day-to-day basis. Independent contractors engaged by us provide all the
20
equipment and personnel associated with these activities. We employ petroleum engineers, geologists and land professionals who work to improve production rates, increase reserves and lower the cost of operating our oil and natural gas properties.
Facilities
We maintain active development of our infrastructure to reduce lease operating costs and support our drilling schedule and production growth. Our production facilities are located near the producing well and consist of storage tanks, two-phase and three-phase separation equipment, flowlines, metering equipment and safety systems. Predominate artificial lift methods include foamer, gas, plunger and rod lift.
In the Eagle Ford, our crude oil is trucked by third-party purchasers in a process, which is actively managed to ensure the best available market for our oil. For gas gathering, processing and fractionation, our Eagle Ford assets are in proximity to active third party low-pressure systems across our acreage. We have favorable long-term agreements in place with two gas gathering and processing companies with the benefit of minimal connection costs. We own substantial fresh water supply and storage and are in the process of developing a saltwater disposal well.
In North Louisiana, approximately half of our gas production is gathered into a company owned, high-pressure pipeline system and then delivered and sold to various intrastate and interstate markets on a competitive pricing basis. The majority of our gas production is not currently processed due to current processing economics, but we have access to several third-party gas processors if processing is economically justified. We also own and operate a salt water disposal well, which currently receives the majority of our associated water production. We own another saltwater disposal well that is currently inactive. We have also purchased a site for an additional disposal well where we intend to construct the facility as needed to support our development program.
Marketing and Customers
The following table sets forth the percentage of our revenues attributed to our customers who have accounted for 10% or more of our revenues during 2016 or 2015, and 10% or more of our predecessors’ revenue during 2014.
|
Major Customers |
|
Years Ending December 31, |
|
|||||||||
|
|
|
2016 (1) |
|
|
2015 (1) |
|
|
2014 |
|
|||
|
Energy Transfer Equity, L.P. and subsidiaries |
|
|
63% |
|
|
|
36% |
|
|
|
10% |
|
|
Royal Dutch Shell plc and subsidiaries |
|
|
12% |
|
|
|
20% |
|
|
|
41% |
|
|
Cima Energy LTD |
|
|
15% |
|
|
|
16% |
|
|
n/a |
|
|
|
BP Corporation North America |
|
n/a |
|
|
n/a |
|
|
|
31% |
|
||
|
|
(1) |
The amounts listed represent the percentage of WHR II and Esquisto’s total revenue on a combined basis. |
We market the majority of our production from properties we operate for both our account and the account of the other working interest owners in these properties. We sell our oil, natural gas and NGL production to purchasers at market prices. We sell all of our oil and certain of our natural gas and NGLs under contracts with terms of twelve months or less and the remainder of our natural gas and NGLs under contracts with terms of greater than twelve months.
No other purchaser accounted for 10% or more of our revenue on a combined basis in the years ended December 31, 2016 or 2015 or of our predecessors’ revenue in the year ended December 31, 2014. The loss of any such purchaser could adversely affect our revenues in the short term. However, based on the current demand for oil and natural gas and the availability of other purchasers, we believe that the loss of any such purchaser as a purchaser would not have a material adverse effect on our financial condition and results of operations because crude oil and natural gas are fungible products with well-established markets and numerous purchasers.
Competition
The oil and natural gas industry is intensely competitive, and we compete with other companies that have greater resources. Many of these companies not only explore for and produce oil and natural gas, but also carry on midstream and refining operations and market petroleum and other products on a regional, national or worldwide basis. These companies may be able to pay more for productive oil and natural gas properties and exploratory prospects or to define, evaluate, bid for and purchase a greater number of properties and prospects than our financial or human resources permit. In addition, these companies may have a greater ability to continue exploration activities during periods of low oil and natural gas market prices. Our larger or more integrated competitors may be able to absorb the burden of existing, and any changes to, federal, state and local laws and regulations more easily than we can, which would adversely affect our competitive position. Our ability to acquire additional properties and to discover reserves in the
21
future will be dependent upon our ability to evaluate and select suitable properties and to consummate transactions in a highly competitive environment. In addition, because we have fewer financial and human resources than many companies in our industry, we may be at a disadvantage in bidding for exploratory prospects and producing oil and natural gas properties.
There is also competition between oil and natural gas producers and other industries producing energy and fuel. Furthermore, competitive conditions may be substantially affected by various forms of energy legislation and/or regulation considered from time to time by the governments of the United States and the jurisdictions in which we operate. It is not possible to predict the nature of any such legislation or regulation which may ultimately be adopted or its effects upon our future operations. Such laws and regulations may substantially increase the costs of developing oil and natural gas and may prevent or delay the commencement or continuation of a given operation. Our larger competitors may be able to absorb the burden of existing, and any changes to, federal, state and local laws and regulations more easily than we can, which would adversely affect our competitive position.
Seasonality of Business
Weather conditions can affect the demand for, and prices of, oil and natural gas. Demand for natural gas is typically higher in the fourth and first quarters resulting in higher prices while the demand for oil is typically higher during the second and third quarters. Due to these seasonal fluctuations, results of operations for individual quarterly periods may not be indicative of the results that may be realized on an annual basis.
Title to Properties
As is customary in the oil and natural gas industry, we initially conduct only a cursory review of the title to our properties in connection with acquisition of leasehold acreage. At such time as we determine to conduct drilling operations on those properties, we conduct a thorough title examination and perform curative work with respect to significant defects prior to commencement of drilling operations. To the extent title opinions or other investigations reflect title defects on those properties, we are typically responsible for curing any title defects at our expense. We generally will not commence drilling operations on a property until we have cured any material title defects on such property. We have obtained title opinions on substantially all of our producing properties and believe that we have satisfactory title to our producing properties in accordance with standards generally accepted in the oil and natural gas industry.
Prior to completing an acquisition of producing oil and natural gas leases, we perform title reviews on the most significant leases and, depending on the materiality of properties, we may obtain a title opinion, obtain an updated title review or opinion or review previously obtained title opinions. Our oil and natural gas properties are subject to customary royalty and other interests, liens for current taxes and other burdens which we believe do not materially interfere with the use of or affect our carrying value of the properties.
We believe that we have satisfactory title to all of our material assets. Although title to these properties is subject to encumbrances in some cases, such as customary interests generally retained in connection with the acquisition of real property, customary royalty interests and contract terms and restrictions, liens under operating agreements, liens related to environmental liabilities associated with historical operations, liens for current taxes and other burdens, easements, restrictions and minor encumbrances customary in the oil and natural gas industry, we believe that none of these liens, restrictions, easements, burdens and encumbrances will materially detract from the value of these properties or from our interest in these properties or materially interfere with our use of these properties in the operation of our business. In addition, we believe that we have obtained sufficient rights-of-way grants and permits from public authorities and private parties for us to operate our business in all material respects as described in this Annual Report.
Oil and Natural Gas Leases
The typical oil and natural gas lease agreement covering our properties provides for the payment of royalties to the mineral owner for all oil and natural gas produced from any wells drilled on the leased premises. The lessor royalties and other leasehold burdens on our properties generally range from approximately 20% to 30%.
Regulation of the Oil and Natural Gas Industry
Our operations are substantially affected by federal, state and local laws and regulations. In particular, oil and natural gas production and related operations are, or have been, subject to price controls, taxes and numerous other laws and regulations. All of the jurisdictions in which we own or operate producing oil and natural gas properties have statutory provisions regulating the development and production of oil and natural gas, including provisions related to permits for the drilling of wells, bonding requirements to drill or operate wells, the location of wells, the method of drilling and casing wells, the surface use and restoration of
22
properties upon which wells are drilled, sourcing and disposal of water used in the drilling and completion process, and the abandonment of wells. Our operations are also subject to various conservation laws and regulations. These include the regulation of the size of drilling and spacing units or proration units, the number of wells which may be drilled in an area, and the unitization or pooling of crude oil or natural gas wells, as well as regulations that generally prohibit the venting or flaring of natural gas, and impose certain requirements regarding the ratability or fair apportionment of production from fields and individual wells.
Failure to comply with applicable laws and regulations can result in substantial penalties. The regulatory burden on the industry increases the cost of doing business and affects profitability. Such laws and regulations are frequently amended or reinterpreted. Therefore, we are unable to predict the future costs or impact of compliance. Additional proposals and proceedings that affect the oil and natural gas industry are regularly considered by Congress, the states, the Federal Energy Regulatory Commission (“FERC”), the United States Environmental Protection Agency (“EPA”), the Bureau of Land Management (“BLM”) , the Department of Transportation (“DOT”), other federal agencies, and the courts. We cannot predict when or whether any such proposals may become effective.
In addition, unforeseen environmental incidents may occur or past non-compliance with environmental laws or regulations may be discovered.
Regulation of Production of Oil and Natural Gas
The production of oil and natural gas is subject to regulation under a wide range of local, state and federal statutes, rules, orders and regulations. Federal, state and local statutes and regulations require permits for drilling operations, drilling bonds and reports concerning operations. We own interests in properties located in Texas and Louisiana, which regulate drilling and operating activities by, among other things, requiring permits for the drilling of wells, maintaining bonding requirements in order to drill or operate wells, and regulating the location of wells, the method of drilling and casing wells, the surface use and restoration of properties upon which wells are drilled and the plugging and abandonment of wells.
The laws of both states also govern a number of conservation matters, including provisions for the unitization or pooling of oil and natural gas properties, the establishment of maximum allowable rates of production from oil and natural gas wells, the regulation of well spacing or density, and plugging and abandonment of wells. The effect of these regulations is to limit the amount of oil and natural gas that we can produce from our wells and to limit the number of wells or the locations at which we can drill, although we can apply for exceptions to such regulations or to have reductions in well spacing or density. Moreover, various states impose a production or severance tax with respect to the production and sale of oil, natural gas and NGLs within its jurisdiction.
The failure to comply with these rules and regulations can result in substantial penalties. Our competitors in the oil and natural gas industry are subject to the same regulatory requirements and restrictions that affect our operations.
Regulation of Sales and Transportation of Oil
Sales of oil, condensate and NGLs are not currently regulated and are made at negotiated prices. Nevertheless, Congress could reenact price controls in the future.
Our sales of oil are affected by the availability, terms and cost of transportation. The transportation of oil in common carrier pipelines is also subject to rate and access regulation. FERC regulates interstate oil pipeline transportation rates under the Interstate Commerce Act. In general, interstate oil pipeline rates must be cost-based, although settlement rates agreed to by all shippers are permitted and market-based rates may be permitted in certain circumstances.
Intrastate oil pipeline transportation rates are subject to regulation by state regulatory commissions. The basis for intrastate oil pipeline regulation, and the degree of regulatory oversight and scrutiny given to intrastate oil pipeline rates, varies from state to state. Insofar as effective interstate and intrastate rates and regulations regarding access are equally applicable to all comparable shippers, we believe that the regulation of oil transportation will not affect our operations in any way that is of material difference from those of our competitors who are similarly situated.
Regulation of Transportation and Sales of Natural Gas
Historically, the transportation and sale for resale of natural gas in interstate commerce have been regulated by agencies of the U.S. federal government, primarily FERC. In the past, the federal government has regulated the prices at which natural gas could be sold. While sales by producers of natural gas can currently be made at uncontrolled market prices, Congress could reenact price controls in the future. Deregulation of wellhead natural gas sales began with the enactment of the NGPA, and culminated in adoption of the Natural Gas Wellhead Decontrol Act which removed controls affecting wellhead sales of natural gas effective January 1, 1993.
23
The transportation and sale for resale of natural gas in interstate commerce is regulated primarily under the NGA, and by regulations and orders promulgated under the NGA by FERC. In certain limited circumstances, intrastate transportation and wholesale sales of natural gas may also be affected directly or indirectly by laws enacted by Congress and by FERC regulations.
The EP Act of 2005 is a comprehensive compilation of tax incentives, authorized appropriations for grants and guaranteed loans, and significant changes to the statutory policy that affects all segments of the energy industry. Among other matters, the EP Act of 2005 amends the NGA to add an anti-market manipulation provision which makes it unlawful for any entity to engage in prohibited behavior to be prescribed by FERC, and furthermore provides FERC with additional civil penalty authority. The EP Act of 2005 provides FERC with the power to assess civil penalties of up to $1,000,000 per day for violations of the NGA and increases FERC’s civil penalty authority under the NGPA from $5,000 per violation per day to $1,000,000 per violation per day. The civil penalty provisions are applicable to entities that engage in the sale of natural gas for resale in interstate commerce. On January 19, 2006, FERC issued Order No. 670, a rule implementing the anti-market manipulation provision of the EP Act of 2005, and subsequently denied rehearing. The rules make it unlawful to: (i) in connection with the purchase or sale of natural gas subject to the jurisdiction of FERC, or the purchase or sale of transportation services subject to the jurisdiction of FERC, for any entity, directly or indirectly, use or employ any device, scheme or artifice to defraud; (ii) make any untrue statement of material fact or omit to make any such statement necessary to make the statements made not misleading; or (iii) engage in any act or practice that operates as a fraud or deceit upon any person. The new anti-market manipulation rule does not apply to activities that relate only to intrastate or other non-jurisdictional sales or gathering, but does apply to activities of gas pipelines and storage companies that provide interstate services, as well as otherwise non-jurisdictional entities to the extent the activities are conducted “in connection with” gas sales, purchases or transportation subject to FERC jurisdiction, which now includes the annual reporting requirements under Order 704, described below. The anti-market manipulation rule and enhanced civil penalty authority reflect an expansion of FERC’s NGA enforcement authority.
On December 26, 2007, FERC issued Order 704, a final rule on the annual natural gas transaction reporting requirements, as amended by subsequent orders on rehearing. Under Order 704, wholesale buyers and sellers of more than 2.2 million MMBtus of physical natural gas in the previous calendar year, including natural gas producers, gatherers and marketers, are now required to report, on May 1 of each year, aggregate volumes of natural gas purchased or sold at wholesale in the prior calendar year to the extent such transactions utilize, contribute to, or may contribute to the formation of price indices. It is the responsibility of the reporting entity to determine which individual transactions should be reported based on the guidance of Order 704. Order 704 also requires market participants to indicate whether they report prices to any index publishers, and if so, whether their reporting complies with FERC’s policy statement on price reporting.
Gathering service, which occurs upstream of jurisdictional transmission services, is regulated by the states onshore and in state waters. Section 1(b) of the NGA exempts natural gas gathering facilities from regulation by FERC as a natural gas company under the NGA. Although FERC has set forth a general test for determining whether facilities perform a non-jurisdictional gathering function or a jurisdictional transmission function, FERC’s determinations as to the classification of facilities are done on a case-by-case basis. To the extent that FERC issues an order that reclassifies certain jurisdictional transmission facilities as non-jurisdictional gathering facilities, and depending on the scope of that decision, our costs of getting gas to point of sale locations may increase. We believe that the natural gas pipelines in our gathering systems meet the traditional tests FERC has used to establish a pipeline’s status as a gatherer not subject to regulation as a natural gas company. However, the distinction between FERC-regulated transmission services and federally unregulated gathering services is the subject of ongoing litigation, so the classification and regulation of our gathering facilities are subject to change based on future determinations by FERC, the courts or Congress. State regulation of natural gas gathering facilities generally includes various occupational safety, environmental and, in some circumstances, nondiscriminatory-take requirements. Although such regulation has not generally been affirmatively applied by state agencies, natural gas gathering may receive greater regulatory scrutiny in the future.
The price at which we sell natural gas is not currently subject to federal rate regulation and, for the most part, is not subject to state regulation. However, with regard to our physical sales of these energy commodities, we are required to observe anti-market manipulation laws and related regulations enforced by FERC under the EP Act of 2005 and under the Commodity Exchange Act (“CEA”), and regulations promulgated thereunder by the CFTC. The CEA prohibits any person from manipulating or attempting to manipulate the price of any commodity in interstate commerce or futures on such commodity. The CEA also prohibits knowingly delivering or causing to be delivered false or misleading or knowingly inaccurate reports concerning market information or conditions that affect or tend to affect the price of a commodity. Should we violate the anti-market manipulation laws and regulations, we could also be subject to related third-party damage claims by, among others, sellers, royalty owners and taxing authorities.
Intrastate natural gas transportation is also subject to regulation by state regulatory agencies. The basis for intrastate regulation of natural gas transportation and the degree of regulatory oversight and scrutiny given to intrastate natural gas pipeline rates and services varies from state to state. Insofar as such regulation within a particular state will generally affect all intrastate natural gas shippers within the state on a comparable basis, we believe that the regulation of similarly situated intrastate natural gas transportation in any states in which we operate and ship natural gas on an intrastate basis will not affect our operations in any way that is of material difference from
24
those of our competitors. Like the regulation of interstate transportation rates, the regulation of intrastate transportation rates affects the marketing of natural gas that we produce, as well as the revenues we receive for sales of our natural gas.
Changes in law and to FERC or state policies and regulations may adversely affect the availability and reliability of firm and/or interruptible transportation service on interstate and intrastate pipelines, and we cannot predict what future action FERC or state regulatory bodies will take. We do not believe, however, that any regulatory changes will affect us in a way that materially differs from the way they will affect other natural gas producers and marketers with which we compete.
Regulation of Pipeline Safety and Maintenance
We are subject to regulation by the Pipeline and Hazardous Materials Safety Administration, (“PHMSA”), of the DOT, pursuant to the NGPSA, and the Pipeline Safety Improvement Act of 2002, or the PSIA, which was reauthorized and amended by the Pipeline Inspection, Protection, Enforcement and Safety Act of 2006. The NGPSA regulates safety requirements in the design, construction, operation and maintenance of gas pipeline facilities, while the PSIA establishes mandatory inspections for all U.S. oil and natural gas transportation pipelines and some gathering lines in high-consequence areas. PHMSA has developed regulations implementing the PSIA that require transportation pipeline operators to implement integrity management programs, including more frequent inspections and other measures to ensure pipeline safety in “high consequence areas,” such as high population areas, areas unusually sensitive to environmental damage and commercially navigable waterways.
On January 3, 2012, the Pipeline Safety, Regulatory Certainty, and Job Creation Act of 2011, or the Pipeline Safety Act, was signed into law. In addition to reauthorizing the PSIA through 2015, the Pipeline Safety Act expanded the DOT’s authority under the PSIA and requires the DOT to evaluate whether integrity management programs should be expanded beyond high consequence areas, authorizes the DOT to promulgate regulations requiring the use of automatic and remote-controlled shut-off valves for new or replaced pipelines, and requires the DOT to promulgate regulations requiring the use of excess flow values where feasible. In addition, new pipeline safety legislation, the “Protecting Our Infrastructure of Pipelines and Enhancing Safety Act of 2016” (the “PIPES Act”), was signed into law in June 2016. The PIPES Act provides PHMSA with additional authority to address imminent hazards by imposing emergency restrictions, prohibitions, and safety measures on owners and operators of gas or hazardous liquids pipeline facilities. The Act also directs PHMSA to issue minimum safety standards for natural gas storage facilities by June 2018, and calls for a review, study, and analysis of a number of issues related to pipeline management and safety.
PHMSA has also proposed additional regulations for gas pipeline safety. For example, in March 2016 PHMSA proposed a rule that would explain integrity management requirements beyond “High Consequence Areas” to apply to gas pipelines in newly defined “Moderate Consequence Areas.” Many gas pipelines that were in place before 1970, and thus grandfathered from certain pressure testing obligations, would be required to be pressure tested to determine their maximum allowable operating pressures. Many gathering lines in rural areas that are currently not regulated at the federal level would also be covered by this proposal. Any new or amended pipeline safety regulations may require us to incur additional capital expenditures and may increase our operating costs. We cannot predict what future action the DOT will take, but we do not believe that any regulatory changes will affect us in a way that materially differs from the way they will affect other natural gas gatherers with which we compete.
States are largely preempted by federal law from regulating pipeline safety for interstate lines but most are certified by the DOT to assume responsibility for enforcing federal intrastate pipeline regulations and inspection of intrastate pipelines. In practice, because states can adopt stricter standards for intrastate pipelines than those imposed by the federal government for interstate lines, states vary considerably in their authority and capacity to address pipeline safety. Changes in existing regulations or future pipeline construction activities may subject some of our pipelines to more stringent DOT regulations, and could adversely affect our business.
Regulation of Environmental and Occupational Safety and Health Matters
Our oil and natural gas development operations are subject to numerous stringent federal, regional, state and local statutes and regulations governing occupational safety and health, the discharge of materials into the environment or otherwise relating to environmental protection, some of which carry substantial administrative, civil and criminal penalties for failure to comply. These laws and regulations may require the acquisition of a permit before drilling or other regulated activity commences; restrict the types, quantities and concentrations of various substances that can be released into the environment in connection with drilling, production and transporting through pipelines; govern the sourcing and disposal of water used in the drilling and completion process; limit or prohibit drilling activities in certain areas and on certain lands lying within wilderness, wetlands, frontier, seismically active areas and other protected areas; require some form of remedial action to prevent or mitigate pollution from former operations such as plugging abandoned wells or closing earthen pits; establish specific safety and health criteria addressing worker protection; and impose substantial liabilities for pollution resulting from operations or failure to comply with regulatory filings. In addition, these laws and regulations may restrict the rate of production.
25
The following is a summary of the more significant existing environmental and occupational health and safety laws and regulations, as amended from time to time, to which our business operations are subject and for which compliance may have a material adverse impact on our capital expenditures, results of operations or financial position.
Hazardous Substances and Waste Handling
The Comprehensive Environmental Response, Compensation, and Liability Act of 1980 (“CERCLA”), also known as the “Superfund” law, and comparable state laws impose liability, without regard to fault or the legality of the original conduct, on certain classes of persons that are considered to have contributed to the release of a “hazardous substance” into the environment. These persons include the current and past owner or operator of the disposal site or the site where the release occurred and persons that disposed or arranged for the disposal of the hazardous substances at the site where the release occurred. Under CERCLA, such persons may be subject to joint and several strict liability for the costs of cleaning up the hazardous substances that have been released into the environment and for damages to natural resources, and it is not uncommon for neighboring landowners and other third parties to file claims for personal injury and property damage allegedly caused by the hazardous substances released into the environment. We are able to control directly the operation of only those wells with respect to which we act as operator. Notwithstanding our lack of direct control over wells operated by others, the failure of an operator other than us to comply with applicable environmental regulations may, in certain circumstances, be attributed to us. We generate materials in the course of our operations that may be regulated as hazardous substances but we are unaware of any liabilities for which we may be held responsible that would materially and adversely affect us.
The Resource Conservation and Recovery Act (“RCRA”) and analogous state laws, impose detailed requirements for the generation, handling, storage, treatment and disposal of nonhazardous and hazardous solid wastes. RCRA specifically excludes drilling fluids, produced waters and other wastes associated with the development or production of crude oil, natural gas or geothermal energy from regulation as hazardous wastes. However, these wastes may be regulated by the EPA or state agencies under RCRA’s less stringent nonhazardous solid waste provisions, state laws or other federal laws. Moreover, it is possible that these particular oil and natural gas development and production wastes now classified as nonhazardous solid wastes could be classified as hazardous wastes in the future. For example, from time to time various environmental groups have challenged the EPA’s exemption of certain oil and gas wastes from RCRA. A loss of the RCRA exclusion for drilling fluids, produced waters and related wastes could result in an increase in our costs to manage and dispose of generated wastes, which could have a material adverse effect on our results of operations and financial position. In addition, in the course of our operations, we generate some amounts of ordinary industrial wastes, such as paint wastes, waste solvents, laboratory wastes and waste compressor oils that may be regulated as hazardous wastes if such wastes have hazardous characteristics. Although the costs of managing hazardous waste may be significant, we do not believe that our costs in this regard are materially more burdensome than those for similarly situated companies.
We currently own, lease or operate numerous properties that have been used for oil and natural gas development and production activities for many years. Although we believe that we have utilized operating and waste disposal practices that were standard in the industry at the time, hazardous substances, wastes or petroleum hydrocarbons may have been released on, under or from the properties owned or leased by us, or on, under or from other locations, including off-site locations, where such substances have been taken for recycling or disposal. In addition, some of our properties have been operated by third parties or by previous owners or operators whose treatment and disposal of hazardous substances, wastes or petroleum hydrocarbons was not under our control. These properties and the substances disposed or released on, under or from them may be subject to CERCLA, RCRA and analogous state laws. Under such laws, we could be required to undertake response or corrective measures, which could include removal of previously disposed substances and wastes, cleanup of contaminated property or performance of remedial plugging or pit closure operations to prevent future contamination.
Water Discharges
The Clean Water Act and comparable state laws impose restrictions and strict controls regarding the discharge of pollutants, including produced waters and other oil and natural gas wastes, into or near navigable waters. The discharge of pollutants into regulated waters is prohibited, except in accordance with the terms of a permit issued by the EPA or the state. The discharge of dredge and fill material in regulated waters, including wetlands, is also prohibited, unless authorized by a permit issued by the U.S. Army Corps of Engineers (the “Corps”). In September 2015, the EPA and the Corps issued new rules defining the scope of the EPA’s and the Corps’ jurisdiction under the Clean Water Act with respect to certain types of waterbodies and classifying these waterbodies as regulated wetlands. The rule has been challenged in court on the grounds that it unlawfully expands the reach of the Clean Water Act, and implementation of the rule has been stayed pending resolution of the court challenge. In February 2017, President Trump issued an executive order directing the EPA and the Corps to review the rule and to publish a proposed rule rescinding or revising the rule. At present we cannot predict the outcome of the pending litigation or any revisions to the rule. To the extent the rule expands the scope of the Clean Water Act’s jurisdiction, we could face increased costs and delays with respect to obtaining permits for dredge and fill activities in wetland areas. Obtaining permits has the potential to delay the development of oil and natural gas projects. These laws and any
26
implementing regulations provide for administrative, civil and criminal penalties for any unauthorized discharges of oil and other substances in reportable quantities and may impose substantial potential liability for the costs of removal, remediation and damages.
Pursuant to these laws and regulations, we may be required to obtain and maintain approvals or permits for the discharge of wastewater or storm water and are required to develop and implement spill prevention, control and countermeasure plans, also referred to as “SPCC plans,” in connection with on-site storage of significant quantities of oil. We are currently undertaking a review of recently acquired oil properties to determine the need for new or updated SPCC plans and, where necessary, we will be developing or upgrading such plans and implementing the physical and operation controls imposed by these plans, the costs of which are not expected to be material.
The primary federal law related specifically to oil spill liability is the Oil Pollution Act of 1990 (“OPA”), which amends and augments the oil spill provisions of the Clean Water Act and imposes certain duties and liabilities on certain “responsible parties” related to the prevention of oil spills and damages resulting from such spills in or threatening waters of the United States or adjoining shorelines. For example, operators of certain oil and natural gas facilities must develop, implement and maintain facility response plans, conduct annual spill training for certain employees and provide varying degrees of financial assurance. Owners or operators of a facility, vessel or pipeline that is a source of an oil discharge or that poses the substantial threat of discharge is one type of “responsible party” who is liable. The OPA applies joint and several liability, without regard to fault, to each liable party for oil removal costs and a variety of public and private damages. Although defenses exist, they are limited. As such, a violation of the OPA has the potential to adversely affect our operations.
Air Emissions
The federal Clean Air Act and comparable state laws restrict the emission of air pollutants from many sources (e.g., compressor stations), through the imposition of air emissions standards, construction and operating permitting programs and other compliance requirements. These laws and regulations may require us to obtain pre-approval for the construction or modification of certain projects or facilities expected to produce or significantly increase air emissions, obtain and strictly comply with stringent air permit requirements or utilize specific equipment or technologies to control emissions of certain pollutants. For example, in October 2015, the EPA lowered the National Ambient Air Quality Standard (“NAAQS”) for ozone from 75 to 70 parts per billion.
State implementation of the revised NAAQS could result in stricter permitting requirements, delay or prohibit our ability to obtain such permits, and result in increased expenditures for pollution control equipment, the costs of which could be significant. Over the next several years, we may be required to incur certain capital expenditures for air pollution control equipment or other air emissions related issues.
In addition, the EPA has adopted new rules under the Clean Air Act that require the reduction of volatile organic compound and methane emissions from certain fractured and refractured oil and natural gas wells for which well completion operations are conducted and further require that most wells use reduced emission completions, also known as “green completions.” These regulations also establish specific new requirements regarding emissions from production-related wet seal and reciprocating compressors, and from pneumatic controllers and storage vessels. In addition, the regulations place new requirements to detect and repair volatile organic compound and methane at certain well sites and compressor stations. In May 2016, the EPA also finalized rules regarding criteria for aggregating multiple small surface sites into a single source for air-quality permitting purposes applicable to the oil and gas industry. This rule could cause small facilities, on an aggregate basis, to be deemed a major source, thereby triggering more stringent air permitting processes and requirements. Compliance with these and other air pollution control and permitting requirements has the potential to delay the development of oil and natural gas projects and increase our costs of development, which costs could be significant.
Regulation of GHG Emissions
In response to findings that emissions of carbon dioxide, methane and other GHGs present an endangerment to public health and the environment, the EPA has adopted regulations pursuant to the federal Clean Air Act to reduce GHG emissions from various sources. For example, the EPA requires certain large stationary sources to obtain preconstruction and operating permits for pollutants regulated under the Prevention of Significant Deterioration and Title V programs of the Clean Air Act. Facilities required to obtain preconstruction permits for such pollutants are also required to meet “best available control technology” standards that are being established by the states. These regulatory requirements could adversely affect our operations and restrict or delay our ability to obtain air permits for new or modified sources. The EPA has adopted rules requiring the monitoring and reporting of GHG emissions from specified onshore and offshore oil and natural gas production sources in the United States on an annual basis, which include certain of our operations. In May 2016, the EPA finalized rules that establish new controls for emissions of methane from new, modified or reconstructed sources in the oil and natural gas sector, including production, processing, transmission and storage activities. Compliance will require enhanced record-keeping practices, the purchase of new equipment, and increased frequency of maintenance
27
and repair activities to address emissions leakage at certain well sites and compressor stations, and also may require hiring additional personnel to support these activities or the engagement of third party contractors to assist with and verify compliance. The new rule will, and proposed rules could, result in increased compliance costs on our operations. The EPA has also announced that it intends to impose methane emission standards for existing sources but, to date, has not yet issued a proposal. And in 2015, EPA published a rule, known as the Clean Power Plan, to limit GHGs from electric power plants. In February 2016, the Supreme Court stayed the implementation of the Clean Power Plan while legal challenges to the rule proceed. Depending on the ultimate outcome of those challenges, and how various states choose to implement this rule, it may alter the power generation mix between natural gas, coal, oil, and alternative energy sources, which would ultimately affect the demand for natural gas and oil in electric generation.
While Congress has from time to time considered legislation to reduce emissions of GHGs, there has not been significant activity in the form of adopted legislation to reduce GHG emissions at the federal level in recent years. In the absence of such federal climate legislation, a number of state and regional efforts have emerged that are aimed at tracking and/or reducing GHG emissions by means of cap and trade programs. Cap and trade programs typically require major sources of GHG emissions to acquire and surrender emission allowances in return for emitting those GHGs. In addition, efforts have been made and continue to be made in the international community toward the adoption of international treaties or protocols that would address global climate change issues. For example, in April 2016, the United States signed the Paris Agreement, which requires member countries to review and “represent a progression” in their intended nationally determined contributions, which set GHG emission reduction goals, every five years beginning in 2020. The Paris Agreement entered into force in November 2016 and includes pledges to voluntarily limit or reduce future emissions. Under the Obama Administration, the United States was one of over 100 nations that indicated an intent to comply with the agreement. Although it is not possible at this time to predict how legislation or new regulations that may be adopted to address GHG emissions would impact our business, any such future laws and regulations imposing reporting obligations on, or limiting emissions of GHGs from, our equipment and operations could require us to incur costs to reduce emissions of GHGs associated with our operations. Substantial limitations on GHG emissions could adversely affect demand for the oil and natural gas we produce.
Finally, increasing concentrations of GHGs in the Earth’s atmosphere may produce climate changes that have significant physical effects, such as increased frequency and severity of storms, floods and other climatic events; if any such effects were to occur, they could have a material adverse effect on our operations.
Hydraulic Fracturing Activities
Hydraulic fracturing is an important and common practice that is used to stimulate production of oil and/or natural gas from dense subsurface rock formations. The hydraulic fracturing process involves the injection of water, proppants and chemicals under pressure into targeted subsurface formations to fracture the surrounding rock and stimulate production. We regularly use hydraulic fracturing as part of our operations. Hydraulic fracturing is typically regulated by state oil and natural gas commissions, but the EPA has asserted federal regulatory authority pursuant to the SDWA over certain hydraulic fracturing activities involving the use of diesel fuels and published permitting guidance in February 2014 addressing the performance of such activities using diesel fuels. The EPA has issued final regulations under the federal Clean Air Act establishing performance standards, including standards for the capture of air emissions released during hydraulic fracturing, and an advanced notice of proposed rulemaking under the Toxic Substances Control Act to require companies to disclose information regarding the chemicals used in hydraulic fracturing, and also finalized rules in June 2016 that prohibit the discharge of wastewater from hydraulic fracturing operations to publicly owned wastewater treatment plants. In addition, Congress has from time to time considered legislation to provide for federal regulation of hydraulic fracturing under the SDWA and to require disclosure of the chemicals used in the hydraulic fracturing process.
At the state level, several states have adopted or are considering legal requirements that could impose more stringent permitting, disclosure and well construction requirements on hydraulic fracturing activities. For example, in May 2013, the Railroad Commission of Texas (the “Railroad Commission”) issued a “well integrity rule,” which updates the requirements for drilling, putting pipe down and cementing wells. The rule also includes new testing and reporting requirements, such as (i) the requirement to submit cementing reports after well completion or after cessation of drilling, whichever is later, and (ii) the imposition of additional testing on wells less than 1,000 feet below usable groundwater. The well integrity rule took effect in January 2014. Local governments also may seek to adopt ordinances within their jurisdictions regulating the time, place and manner of drilling activities in general or hydraulic fracturing activities in particular.
Certain governmental reviews are either underway or have been conducted that focus on the environmental aspects of hydraulic fracturing practices. For example, in December 2016, the EPA released its final report on the potential impacts of hydraulic fracturing on drinking water resources. The EPA report concluded that “water cycle” activities associated with hydraulic fracturing may impact drinking water resources “under some circumstances,” noting that the following hydraulic fracturing water cycle activities and local- or regional-scale factors are more likely than others to result in more frequent or more severe impacts: water withdrawals for fracturing in times or areas of low water availability; surface spills during the management of fracturing fluids, chemicals or produced
28
water; injection of fracturing fluids into wells with inadequate mechanical integrity; injection of fracturing fluids directly into groundwater resources; discharge of inadequately treated fracturing wastewater to surface waters; and disposal or storage of fracturing wastewater in unlined pits.
Compliance with existing laws has not had a material adverse effect on our operations or financial position, but if new or more stringent federal, state or local legal restrictions relating to the hydraulic fracturing process are adopted in areas where we operate, we could incur potentially significant added costs to comply with such requirements, experience delays or curtailment in the pursuit of development activities, and perhaps even be precluded from drilling wells.
ESA and Migratory Birds
The Endangered Species Act (“ESA”) and (in some cases) comparable state laws were established to protect endangered and threatened species. Pursuant to the ESA, if a species is listed as threatened or endangered, restrictions may be imposed on activities adversely affecting that species’ habitat. We may conduct operations on oil and natural gas leases in areas where certain species that are or could be listed as threatened or endangered are known to exist. The U.S. Fish and Wildlife Service may designate critical habitat and suitable habitat areas that it believes are necessary for survival of a threatened or endangered species. A critical habitat or suitable habitat designation could result in further material restrictions to land use and may materially delay or prohibit land access for oil and natural gas development. Moreover, as a result of a settlement approved by the U.S. District Court for the District of Columbia in September 2011, the U.S. Fish and Wildlife Service is required to make a determination on listing of more than 250 species as endangered or threatened under the ESA by no later than completion of the agency’s 2017 fiscal year. Similar protections are offered to migratory birds under the Migratory Bird Treaty Act. The federal government in the past has pursued enforcement actions against oil and natural gas companies under the Migratory Bird Treaty Act after dead migratory birds were found near reserve pits associated with drilling activities. The identification or designation of previously unprotected species as threatened or endangered in areas where underlying property operations are conducted could cause us to incur increased costs arising from species protection measures or could result in limitations on our development activities that could have an adverse impact on our ability to develop and produce reserves. If we were to have a portion of our leases designated as critical or suitable habitat, it could adversely impact the value of our leases.
OSHA
We are subject to the requirements of the Occupational Safety and Health Act (“OSHA”) and comparable state statutes whose purpose is to protect the health and safety of workers. In addition, the OSHA hazard communication standard, the Emergency Planning and Community Right-to-Know Act and comparable state statutes and any implementing regulations require that we organize and/or disclose information about hazardous materials used or produced in our operations and that this information be provided to employees, state and local governmental authorities and citizens.
Related Permits and Authorizations
Many environmental laws require us to obtain permits or other authorizations from state and/or federal agencies before initiating certain drilling, construction, production, operation or other oil and natural gas activities, and to maintain these permits and compliance with their requirements for on-going operations. These permits are generally subject to protest, appeal or litigation, which can in certain cases delay or halt projects and cease production or operation of wells, pipelines and other operations.
Related Insurance
We maintain insurance against some risks associated with above or underground contamination that may occur as a result of our development activities. However, this insurance is limited to activities at the well site and there can be no assurance that this insurance will continue to be commercially available or that this insurance will be available at premium levels that justify its purchase by us. The occurrence of a significant event that is not fully insured or indemnified against could have a materially adverse effect on our financial condition and operations. Further, we have no coverage for gradual, long-term pollution events.
Employees
As of December 31, 2016, we had 85 full-time employees. We hire independent contractors on an as needed basis. We have no collective bargaining agreements with our employees. We believe that our employee relationships are satisfactory.
29
We are party to lawsuits arising in the ordinary course of our business. We cannot predict the outcome of any such lawsuits with certainty, but management believes it is remote that pending or threatened legal matters will have a material adverse impact on our financial condition, cash flows or results of operations.
Due to the nature of our business, we are, from time to time, involved in other routine litigation or subject to disputes or claims related to our business activities, including workers’ compensation claims and employment related disputes. In the opinion of our management, none of these other pending litigation, disputes or claims against us, if decided adversely, will have a material adverse effect on our financial condition, cash flows or results of operations.
Offices
Our principal executive office is located at 9805 Katy Freeway, Suite 400, Houston, Texas 77024. Our main telephone number is (713) 568-4910.
Available Information
Our annual reports on Form 10-K, quarterly reports on Form 10-Q, current reports on Form 8–K and amendments to those reports filed or furnished pursuant to Section 13(a) or 15(d) of the Exchange Act are made available free of charge on our website at www.wildhorserd.com as soon as reasonably practicable after these reports have been electronically filed with, or furnished to, the United States Securities and Exchange Commission (“SEC”). These documents are also available on the SEC’s website at www.sec.gov or you may read and copy any materials that we file with the SEC at the SEC’s Public Reference Room at 100 F Street, NE, Washington DC 20549. The public may obtain information on the operation of the Public Reference Room by calling the SEC at 1-800-SEC-0330. Our website also includes our Code of Business Conduct and Ethics and the charter of our audit committee. The information contained on, or connected to, our website is not incorporated by reference into this Form 10-K and should not be considered part of this or any other report that we file with or furnish to the SEC.
30
Risks Related to Our Business
Oil, natural gas and NGL prices are volatile. A sustained decline in oil, natural gas and NGL prices could adversely affect our business, financial condition and results of operations and our ability to meet our capital expenditure obligations and financial commitments.
The prices we receive for our oil, natural gas and NGL production heavily influence our revenue, profitability, access to capital, future rate of growth and the carrying value of our properties. Oil, natural gas and NGLs are commodities, and their prices may fluctuate widely in response to market uncertainty and to relatively minor changes in the supply of and demand for oil, natural gas and NGLs. Historically, oil, natural gas and NGL prices have been volatile. For example, during the period from January 1, 2014 through January 1, 2017, the WTI spot price for oil declined from a high of $107.95 per Bbl on June 20 2014 to a low of $26.19 per Bbl on February 11, 2016, and the Henry Hub spot price for natural gas has declined from a high of $8.15 per MMBtu on February 10, 2014 to a low of $1.49 per MMBtu on March 4, 2016. Likewise, NGLs, which are made up of ethane, propane, isobutane, normal butane and natural gasoline, each of which have different uses and different pricing characteristics, have suffered significant recent declines in realized prices. The prices we receive for our production, and the levels of our production, depend on numerous factors beyond our control, which include the following:
|
|
• |
worldwide and regional economic conditions impacting the global supply and demand for oil, natural gas and NGLs; |
|
|
• |
the price and quantity of foreign imports of oil, natural gas and NGLs; |
|
|
• |
political and economic conditions in or affecting other producing regions or countries, including the Middle East, Africa, South America and Russia; |
|
|
• |
actions of the Organization of the Petroleum Exporting Countries, its members and other state- controlled oil companies relating to oil price and production controls; |
|
|
• |
the level of global exploration, development and production; |
|
|
• |
the level of global inventories; |
|
|
• |
prevailing prices on local price indexes in the areas in which we operate; |
|
|
• |
the proximity, capacity, cost and availability of gathering and transportation facilities; |
|
|
• |
localized and global supply and demand fundamentals and transportation availability; |
|
|
• |
the cost of exploring for, developing, producing and transporting reserves; |
|
|
• |
weather conditions and natural disasters; |
|
|
• |
technological advances affecting energy consumption; |
|
|
• |
the price and availability of alternative fuels; |
|
|
• |
expectations about future commodity prices; and |
|
|
• |
U.S. federal, state and local and non-U.S. governmental regulation and taxes. |
In the second half of 2014, oil prices began a rapid and significant decline as the global oil supply began to outpace demand. During 2015 and 2016 and thus far in 2017, the global oil supply has continued to outpace demand, resulting in persistently low realized prices for oil production. In general, this imbalance between supply and demand reflects the significant supply growth achieved in the United States as a result of shale drilling and oil production increases by certain other countries, including Russia and Saudi Arabia, as part of an effort to retain market share, combined with only modest demand growth in the United States and less-than-expected demand in other parts of the world, particularly in Europe and China. Although there has been a dramatic decrease in drilling activity in the industry, oil storage levels in the United States remain at historically high levels. Until supply and demand balance and the overhang in storage levels begins to decline, prices will likely remain under pressure. The U.S. dollar has also strengthened relative to other leading currencies, which has caused oil prices to weaken, as they are U.S. dollar-denominated. In addition, the lifting of economic sanctions on Iran has resulted in increasing supplies of oil from Iran, adding further downward pressure to oil prices. NGL prices generally correlate to the price of oil. Also adversely affecting the price for NGLs is the supply of NGLs in the United States, which has continued to grow due to an increase in industry participants targeting projects that produce NGLs in recent years. Prices for domestic natural gas began to decline during the third quarter of 2014 and remained weak throughout 2015 and 2016 and thus far in 2017. The declines in natural gas prices are primarily due to an imbalance between supply and demand
31
across North America. The continued duration and magnitude of these commodity price declines cannot be accurately predicted. Compared to 2014, our realized oil price for 2015 fell 51% to $44.41 per barrel, and our realized oil price for the year ended December 31, 2016 has further decreased to $41.09 per barrel. Similarly, our realized natural gas price for 2015 decreased 41% to $2.60 per Mcf, and our realized price for NGLs declined 49% to $12.22 per barrel. For the year ended December 31, 2016, our realized price for natural gas was $2.44 per Mcf, and our realized price for NGLs was $12.28 per barrel.
Lower commodity prices may reduce our cash flow and borrowing ability. If we are unable to obtain needed capital or financing on satisfactory terms, our ability to develop future reserves could be adversely affected. Also, using lower prices in estimating proved reserves may result in a reduction in proved reserve volumes due to economic limits. In addition, sustained periods with oil and natural gas prices at levels lower than current WTI or Henry Hub strip prices may adversely affect our drilling economics and our ability to raise capital, which may require us to re-evaluate and postpone or eliminate our development program, and result in the reduction of some of our proved undeveloped reserves and related standardized measure. If we are required to curtail our drilling program, we may be unable to continue to hold leases that are scheduled to expire, which may further reduce our reserves. As a result, a substantial or extended decline in commodity prices may materially and adversely affect our future business, financial condition, results of operations, liquidity and ability to finance planned capital expenditures.
Our development projects and acquisitions require substantial capital expenditures. We may be unable to obtain required capital or financing on satisfactory terms, which could lead to a decline in our ability to access or grow production and reserves.
The oil and natural gas industry is capital-intensive. We make and expect to continue to make substantial capital expenditures related to our development projects and acquisitions. Our 2017 capital budget is $450 million to $600 million. We expect to fund our 2017 capital budget with cash generated by operations, borrowings under our revolving credit facility and proceeds from our 2025 Senior Notes offering. However, our financing needs may require us to alter or increase our capitalization substantially through the issuance of debt or equity securities or the sale of assets. The issuance of additional indebtedness would require that an additional portion of our cash flow from operations be used for the payment of interest and principal on our indebtedness, thereby further reducing our ability to use cash flow from operations to fund working capital, capital expenditures and acquisitions. The issuance of additional equity securities would be dilutive to our existing stockholders. The actual amount and timing of our future capital expenditures may differ materially from our estimates as a result of, among other things: commodity prices; actual drilling results; the availability of drilling rigs and other services and equipment; and regulatory, technological and competitive developments. A reduction in commodity prices from current levels may result in a decrease in our actual capital expenditures, which would negatively impact our ability to grow production.
Our cash flow from operations and access to capital are subject to a number of variables, including:
|
|
• |
the prices at which our production is sold; |
|
|
• |
our proved reserves; |
|
|
• |
the amount of hydrocarbons we are able to produce from existing wells; |
|
|
• |
our ability to acquire, locate and produce new reserves; |
|
|
• |
the amount of our operating expenses; |
|
|
• |
cash settlements from our derivative activities; |
|
|
• |
our ability to borrow under our revolving credit facility; and |
|
|
• |
our ability to access the capital markets. |
If our revenues or the borrowing base under our revolving credit facility decrease as a result of lower oil, natural gas and NGL prices, operational difficulties, declines in reserves or for any other reason, we may have limited ability to obtain the capital necessary to sustain our operations at current levels. If additional capital is needed, we may not be able to obtain debt or equity financing on terms acceptable to us, if at all. For a period of 180 days following the date of the prospectus used in our initial public offering, we will not be able to sell any shares of our common stock, whether pursuant to a private or public offering, without the prior written consent of Barclays Capital Inc. If cash flow generated by our operations or available borrowings under our revolving credit facility are insufficient to meet our capital requirements, the failure to obtain additional financing could result in a curtailment of the development of our properties, which in turn could lead to a decline in our reserves and production and could materially and adversely affect our business, financial condition and results of operations.
32
Part of our business strategy involves using some of the latest available horizontal drilling and completion techniques, which involve risks and uncertainties in their application.
Our operations involve utilizing some of the latest drilling and completion techniques as developed by us and our service providers. The difficulties we face drilling horizontal wells include:
|
|
• |
landing our wellbore in the desired drilling zone; |
|
|
• |
staying in the desired drilling zone while drilling horizontally through the formation; |
|
|
• |
running our casing the entire length of the wellbore; and |
|
|
• |
being able to run tools and other equipment consistently through the horizontal wellbore. |
Difficulties that we face while completing our wells include the following:
|
|
• |
the ability to fracture stimulate the planned number of stages; |
|
|
• |
the ability to run tools the entire length of the wellbore during completion operations; and |
|
|
• |
the ability to successfully clean out the wellbore after completion of the final fracture stimulation stage. |
In addition, certain of the new techniques we are adopting may cause irregularities or interruptions in production due to offset wells being shut in and the time required to drill and complete multiple wells before any such wells begin producing. Furthermore, the results of drilling in new or emerging formations are more uncertain initially than drilling results in areas that are more developed and have a longer history of established production. Newer and emerging formations and areas have limited or no production history and, consequently, we are more limited in assessing future drilling results in these areas. If our drilling results are less than anticipated, the return on our investment for a particular project may not be as attractive as we anticipated, and we could incur material write-downs of unevaluated properties and the value of our undeveloped acreage could decline in the future.
Drilling for and producing oil and natural gas are high risk activities with many uncertainties that could adversely affect our business, financial condition or results of operations.
Our future financial condition and results of operations will depend on the success of our development, production and acquisition activities, which are subject to numerous risks beyond our control, including the risk that drilling will not result in commercially viable oil and natural gas production.
Our decisions to develop or purchase prospects or properties will depend, in part, on the evaluation of data obtained through geophysical and geological analyses, production data and engineering studies, which are often inconclusive or subject to varying interpretations. For a discussion of the uncertainty involved in these processes, see “—Reserve estimates depend on many assumptions that may turn out to be inaccurate. Any material inaccuracies in reserve estimates or underlying assumptions will materially affect the quantities and present value of our reserves.” In addition, our cost of drilling, completing and operating wells is often uncertain.
Further, many factors may curtail, delay or cancel our scheduled drilling projects, including:
|
|
• |
delays imposed by, or resulting from, compliance with regulatory requirements, including limitations on wastewater disposal, emission of greenhouse gases (“GHGs”) and hydraulic fracturing; |
|
|
• |
pressure or irregularities in geological formations; |
|
|
• |
shortages of or delays in obtaining equipment and qualified personnel or in obtaining water for hydraulic fracturing activities; |
|
|
• |
equipment failures, accidents or other unexpected operational events; |
|
|
• |
lack of available gathering facilities or delays in construction of gathering facilities; |
|
|
• |
lack of available capacity on interconnecting transmission pipelines; |
|
|
• |
adverse weather conditions; |
|
|
• |
issues related to compliance with environmental regulations; |
|
|
• |
environmental hazards, such as oil and natural gas leaks, oil spills, pipeline and tank ruptures and unauthorized discharges of brine, well stimulation and completion fluids, toxic gases or other pollutants into the surface and subsurface environment; |
33
|
|
• |
limited availability of financing on acceptable terms; |
|
|
• |
title issues; and |
|
|
• |
other market limitations in our industry. |
We may not be able to generate sufficient cash to service all of our indebtedness and may be forced to take other actions to satisfy our debt obligations that may not be successful.
Our ability to make scheduled payments on or to refinance our indebtedness obligations, including the 2025 Senior Notes and our revolving credit facility, depends on our financial condition and operating performance, which are subject to prevailing economic and competitive conditions and certain financial, business and other factors beyond our control. We may not be able to maintain a level of cash flow from operating activities sufficient to permit us to pay the principal, premium, if any, and interest on the notes and our other indebtedness.
If our cash flow and capital resources are insufficient to fund debt service obligations, we may be forced to reduce or delay investments and capital expenditures, sell assets, seek additional capital or restructure or refinance indebtedness. Our ability to restructure or refinance indebtedness will depend on the condition of the capital markets and our financial condition at such time. Any refinancing of indebtedness may be at higher interest rates and may require us to comply with more onerous covenants, which could further restrict business operations. The terms of our existing or future debt instruments may restrict us from adopting some of these alternatives. In addition, any failure to make payments of interest and principal on outstanding indebtedness on a timely basis, including the notes, would likely result in a reduction of our credit rating, which could harm our ability to incur additional indebtedness. In the absence of sufficient cash flows and capital resources, we could face substantial liquidity problems and might be required to dispose of material assets or operations to meet debt service and other obligations. The indenture governing the notes restricts, and our revolving credit facility restricts, our ability to dispose of assets and imposes limitations on our use of proceeds from dispositions. We may not be able to consummate those dispositions, and the proceeds of any such disposition may not be adequate to meet any debt service obligations then due. These alternative measures may not be successful and may not permit us to meet scheduled debt service obligations.
Restrictions in our existing and future debt agreements could limit our growth and our ability to engage in certain activities.
The terms and conditions governing our indebtedness:
|
|
• |
require us to dedicate a substantial portion of our cash flow from operations to service our existing debt, thereby reducing the cash available to finance our operations and other business activities and could limit our flexibility in planning for or reacting to changes in our business and the industry in which we operate; |
|
|
• |
increase our vulnerability to economic downturns and adverse developments in our business; |
|
|
• |
limit our ability to access the capital markets to raise capital on favorable terms or to obtain additional financing for working capital, capital expenditures or acquisitions or to refinance existing indebtedness; |
|
|
• |
place restrictions on our ability to obtain additional financing, make investments, lease equipment, sell assets and engage in business combinations; |
|
|
• |
place us at a competitive disadvantage relative to competitors with lower levels of indebtedness in relation to their overall size or less restrictive terms governing their indebtedness; and |
|
|
• |
limit management’s discretion in operating our business. |
Our ability to meet our expenses and debt obligations will depend on our future performance, which will be affected by financial, business, economic, regulatory and other factors. We will not be able to control many of these factors, such as economic conditions and governmental regulation. We cannot be certain that our cash flow will be sufficient to allow us to pay the principal and interest on our debt and meet our other obligations. If we do not have enough money, we may be required to refinance all or part of our existing debt, sell assets, borrow more money or raise equity. We may not be able to refinance our debt, sell assets, borrow more money or raise equity on terms acceptable to us, if at all. For example, our existing and future debt agreements will require that we satisfy certain conditions, including coverage and leverage ratios, to borrow money. Our existing and future debt agreements will also restrict the payment of dividends and distributions by certain of our subsidiaries to us, which could affect our access to cash. In addition, our ability to comply with the financial and other restrictive covenants in our indebtedness will be affected by the levels of
34
cash flow from our operations and future events and circumstances beyond our control. Failure to comply with these covenants would result in an event of default under our indebtedness, and such an event of default could adversely affect our business, financial condition and results of operations.
Any significant reduction in our borrowing base under our revolving credit facility as a result of the periodic borrowing base redeterminations or otherwise may negatively impact our ability to fund our operations.
Our revolving credit facility limits the amounts we can borrow up to a borrowing base amount, which the lenders, in their sole discretion, will unilaterally determine based upon projected revenues from our oil, natural gas and NGL properties and our commodity derivative contracts. Such determinations will be made on a regular basis semi-annually (each a “Scheduled Redetermination”), at our option in connection with a material acquisition, at our option no more than twice in any fiscal year and at the option of lenders with more than 66.6% of the loans and commitments under the facility (the “Required Lenders”) no more than twice in any fiscal year (each such redetermination other than a Scheduled Redetermination, an “Interim Redetermination” and any Scheduled Redetermination or Interim Redetermination, a “Redetermination”). In connection with a Redetermination, any increase in the borrowing base requires the consent of the lenders holding 100% of the commitments, and maintaining or any decrease in the borrowing base requires the consent of the Required Lenders. The borrowing base will also automatically decrease upon the issuance of certain debt, including the recent offering of the 2025 Senior Notes, the sale or other disposition of certain assets and the early termination of certain swap agreements. Our initial borrowing base of $450.0 million was reduced to $362.5 million in connection with the consummation of our 2025 Senior Notes offering in February 2017 and our next Scheduled Redetermination is expected in April 2017.
In the future, we may not be able to access adequate funding under our revolving credit facility as a result of a decrease in our borrowing base due to the issuance of new indebtedness, the outcome of a borrowing base redetermination, or an unwillingness or inability on the part of lending counterparties to meet their funding obligations and the inability of other lenders to provide additional funding to cover a defaulting lender’s portion. Declines in commodity prices could result in a determination to lower the borrowing base and, in such a case, we could be required to repay any indebtedness in excess of the redetermined borrowing base. As a result, we may be unable to implement our drilling and development plan, make acquisitions or otherwise carry out business plans, which would have a material adverse effect on our financial condition and results of operations.
Our derivative activities could result in financial losses or could reduce our earnings.
We enter into derivative instrument contracts for a portion of our oil and natural gas production. As of March 15, 2017, we had entered into swaps, collars and deferred premium puts through December 2019 covering a total of 6.6 MBbl of our projected oil production and 39.2 MMBtu of our projected natural gas production. Accordingly, our earnings may fluctuate significantly as a result of changes in fair value of our derivative instruments.
Derivative instruments also expose us to the risk of financial loss in some circumstances, including when:
|
|
• |
production is less than the volume covered by the derivative instruments; |
|
|
• |
the counterparty to the derivative instrument defaults on its contractual obligations; |
|
|
• |
there is an increase in the differential between the underlying price in the derivative instrument and actual prices received; or |
|
|
• |
there are issues with regard to legal enforceability of such instruments. |
The use of derivatives may, in some cases, require the posting of cash collateral with counterparties. If we enter into derivative instruments that require cash collateral and commodity prices or interest rates change in a manner adverse to us, our cash otherwise available for use in our operations would be reduced, which could limit our ability to make future capital expenditures and make payments on our indebtedness, and which could also limit the size of our borrowing base. Future collateral requirements will depend on arrangements with our counterparties, oil, natural gas and NGL prices and interest rates. In addition, derivative arrangements could limit the benefit we would receive from increases in the prices for oil, natural gas and NGLs or from reductions in interest rates, which could have a material adverse effect on our financial condition. In addition, our revolving credit facility limits our ability to enter into commodity hedges covering greater than 100% of our reasonably anticipated projected proved production for the first two years of the facility and 75% of reasonably anticipated projected proved production for the following three years.
Our derivative contracts expose us to risk of financial loss if a counterparty fails to perform under a contract. Disruptions in the financial markets could lead to sudden decreases in a counterparty’s liquidity, which could make the counterparty unable to perform under the terms of the contract, and we may not be able to realize the benefit of the contract. We are unable to predict sudden changes
35
in a counterparty’s creditworthiness or ability to perform. Even if we do accurately predict sudden changes, our ability to negate the risk may be limited depending upon market conditions.
During periods of declining commodity prices or, to the extent we have interest rate derivative instrument contracts, increasing interest rates, our derivative contract receivable positions would generally increase, which increases our counterparty credit exposure. If the creditworthiness of our counterparties deteriorates and results in their nonperformance, we could incur a significant loss with respect to our derivative contracts.
Reserve estimates depend on many assumptions that may turn out to be inaccurate. Any material inaccuracies in reserve estimates or underlying assumptions will materially affect the quantities and present value of our reserves.
The process of estimating oil and natural gas reserves is complex. It requires interpretations of available technical data and many assumptions, including assumptions relating to current and future economic conditions and commodity prices. Any significant inaccuracies in these interpretations or assumptions could materially affect the estimated quantities and present value of our reserves. In order to prepare reserve estimates, we must project production rates and timing of development expenditures. We must also analyze available geological, geophysical, production and engineering data. The extent, quality and reliability of this data can vary. The process also requires economic assumptions about matters such as oil and natural gas prices, drilling and operating expenses, capital expenditures, taxes and availability of funds.
Actual future production, oil, natural gas and NGL prices, revenues, taxes, development expenditures, operating expenses and quantities of recoverable oil and natural gas reserves may vary from our estimates. For instance, initial production rates reported by us or other operators may not be indicative of future or long-term production rates, our recovery efficiencies may be worse than expected and production declines may be greater than we estimate and may be more rapid and irregular when compared to initial production rates. In addition, we may adjust reserve estimates of proved reserves to reflect additional production history, results of development activities, current commodity prices and other existing factors. Any significant variance could materially affect the estimated quantities and present value of our reserves. Moreover, there can be no assurance that our reserves will ultimately be produced or that our proved undeveloped reserves will be developed within the periods anticipated.
You should not assume that the present value of future net revenues from our reserves presented in this Annual Report is the current market value of our estimated reserves. Actual future prices and costs may differ materially from those used in the present value estimate. For example, our estimated proved reserves as of December 31, 2016 and related standardized measure were calculated under SEC rules using twelve-month trailing average benchmark prices of $42.75 per barrel of oil (WTI) and $2.48 per MMBtu of natural gas (Henry Hub spot), which, for certain periods in 2016, were substantially higher than the available spot prices. If spot prices are below such calculated amounts, using more recent prices in estimating proved reserves may result in a reduction in proved reserve volumes due to economic limits.
The standardized measure of our estimated reserves is not an accurate estimate of the current fair value of our estimated oil and natural gas reserves.
Standardized measure is a reporting convention that provides a common basis for comparing oil and natural gas companies subject to the rules and regulations of the SEC. Standardized measure requires historical twelve month pricing as required by the SEC as well as operating and development costs prevailing as of the date of computation. Consequently, it may not reflect the prices ordinarily received or that will be received for oil and natural gas production because of varying market conditions, nor may it reflect the actual costs that will be required to produce or develop the oil and natural gas properties. In addition, WHR II and Esquisto were generally not subject to U.S. federal, state or local income taxes other than certain state franchise taxes and federal income tax on one of our predecessor’s subsidiaries. We are subject to U.S. federal, state and local income taxes. As a result, estimates included herein of future net cash flow may be materially different from the future net cash flows that are ultimately received. Therefore, the standardized measure of our estimated reserves included in this Annual Report should not be construed as accurate estimates of the current fair value of our proved reserves.
Properties we acquire may not produce as projected, and we may be unable to determine reserve potential, identify liabilities associated with the properties that we acquire or obtain protection from sellers against such liabilities.
Acquiring oil and natural gas properties requires us to assess reservoir and infrastructure characteristics, including recoverable reserves, future oil and gas prices and their applicable differentials, development and operating costs, and potential liabilities, including environmental liabilities. In connection with these assessments, we perform a review of the subject properties that we believe to be generally consistent with industry practices. Such assessments are inexact and inherently uncertain. For these reasons, the properties we have acquired or will acquire in the future in connection with the acquisitions or otherwise may not produce as expected. In connection with the assessments, we perform a review of the subject properties, but such a review may not reveal all
36
existing or potential problems. In the course of our due diligence, we may not review every well, pipeline or associated facility. We cannot necessarily observe structural and environmental problems, such as groundwater contamination, when a review is performed. We may be unable to obtain contractual indemnities from the seller for liabilities created prior to our purchase of the property. We may be required to assume the risk of the physical condition of the properties in addition to the risk that the properties may not perform in accordance with our expectations.
We will not be the operator on all of our acreage or drilling locations, and, therefore, we will not be able to control the timing of exploration or development efforts, associated costs, or the rate of production of any non- operated assets and could be liable for certain financial obligations of the operators or any of our contractors to the extent such operator or contractor is unable to satisfy such obligations.
We have identified 4,548 potential drilling locations on our acreage. We do not expect to operate 1,798 of such locations, and there is no assurance that we will operate all of our other drilling locations. In addition, unless we are successful in increasing our working interest in our other drilling locations through acreage exchanges and consolidation efforts, we will not be the operator with respect to these other identified horizontal drilling locations. We have limited ability to exercise influence over the operations of the drilling locations operated by our partners, and there is the risk that our partners may at any time have economic, business or legal interests or goals that are inconsistent with ours. Furthermore, the success and timing of development activities operated by our partners will depend on a number of factors that will be largely outside of our control, including:
|
|
• |
the timing and amount of capital expenditures; |
|
|
• |
the operator’s expertise and financial resources; |
|
|
• |
the approval of other participants in drilling wells; |
|
|
• |
the selection of technology; and |
|
|
• |
the rate of production of reserves, if any. |
This limited ability to exercise control over the operations and associated costs of some of our drilling locations could prevent the realization of targeted returns on capital in drilling or acquisition activities.
Further, we may be liable for certain financial obligations of the operator of a well in which we own a working interest to the extent such operator becomes insolvent and cannot satisfy such obligations. Similarly, we may be liable for certain obligations of our contractors to the extent such contractor becomes insolvent and cannot satisfy their obligations. The satisfaction of such obligations could have a material adverse effect on our financial condition.
Our identified drilling locations are scheduled out over many years, making them susceptible to uncertainties that could materially alter the occurrence or timing of their drilling. In addition, we may not be able to raise the substantial amount of capital that would be necessary to drill such locations.
Our management and technical teams have specifically identified and scheduled certain drilling locations as an estimation of our future multi-year drilling activities on our existing acreage. These drilling locations represent a significant part of our growth strategy. Our ability to drill and develop these locations depends on a number of uncertainties, including oil and natural gas prices, the availability and cost of capital, drilling and production costs, availability of drilling services and equipment, drilling results, lease expirations, gathering system and pipeline transportation constraints, access to and availability of water sourcing and distribution systems, regulatory approvals, the cooperation of other working interest owners and other factors. Because of these uncertain factors, we do not know if the numerous drilling locations we have identified will ever be drilled or if we will be able to produce natural gas or oil from these or any other drilling locations. In addition, unless production is established within the spacing units covering the undeveloped acres on which some of the drilling locations are obtained, the leases for such acreage will expire. As such, our actual drilling activities may materially differ from those presently identified.
As of December 31, 2016, we had identified 3,135 gross horizontal drilling locations on our Eagle Ford Acreage and 1,413 gross horizontal drilling locations on our North Louisiana Acreage. As a result of the limitations described in this Annual Report, we may be unable to drill many of our identified locations. In addition, we will require significant additional capital over a prolonged period in order to pursue the development of these locations, and we may not be able to raise or generate the capital required to do so. See “— Our development projects and acquisitions require substantial capital expenditures. We may be unable to obtain required capital or financing on satisfactory terms, which could lead to a decline in our ability to access or grow production and reserves.” Any drilling activities we are able to conduct on these locations may not be successful, may not result in production or additions to our estimated proved reserves and could result in a downward revision of our estimated proved reserves, which could have a material adverse effect on the borrowing base under our revolving credit facility or our future business and results of operations. Additionally,
37
if we curtail our drilling program, we may lose a portion of our acreage through lease expirations and may be required to reduce our estimated proved reserves, which could reduce the borrowing base under our revolving credit facility.
Certain of our undeveloped leasehold acreage is subject to leases that will expire over the next several years unless production is established on units containing the acreage or the leases are renewed.
As of December 31, 2016, approximately 48% of our total net acreage was held by production. The leases for our net acreage not held by production will expire at the end of their primary term unless production is established in paying quantities under the units containing these leases or the leases are renewed. For example, as of December 31, 2016, 29% and 18% of our net undeveloped acreage was set to expire in 2017 and 2018, respectively. If our leases expire and we are unable to renew the leases, we will lose our right to develop the related properties. Although we intend to extend substantially all of our net acreage associated with identified drilling locations through a combination of development drilling, the payment of pre-agreed leasehold extension and renewal payments pursuant to an option to extend or the negotiation of lease extensions, we may not be successful in extending our leases. Additionally, where we do not have options to extend a lease, we may not be successful in negotiating extensions or renewals or any payments related to such extensions or renewals may be more than anticipated. Please see “Item 1. Business—Reserve Data—Undeveloped Acreage Expirations” for more information regarding acreage expirations and our plans for extending and renewing our acreage. Our ability to drill and develop our acreage and establish production to maintain our leases depends on a number of uncertainties, including oil, natural gas and NGL prices, the availability and cost of capital, drilling and production costs, availability of drilling services and equipment, drilling results, lease expirations, gathering system and pipeline transportation constraints, access to and availability of water sourcing and distribution systems, regulatory approvals and other factors.
Adverse weather conditions may negatively affect our operating results and our ability to conduct drilling activities.
Adverse weather conditions may cause, among other things, increases in the costs of, and delays in, drilling or completing new wells, power failures, temporary shut-in of production and difficulties in the transportation of our oil, natural gas and NGLs. Any decreases in production due to poor weather conditions will have an adverse effect on our revenues, which will in turn negatively affect our cash flow from operations.
Our operations are substantially dependent on the availability of water. Restrictions on our ability to obtain water may have an adverse effect on our financial condition, results of operations and cash flows.
Water is an essential component of oil and natural gas production during both the drilling and hydraulic fracturing processes. Drought conditions have persisted in our areas of operation in past years. These drought conditions have led governmental authorities to restrict the use of water, subject to their jurisdiction, for hydraulic fracturing to protect local water supplies. If we are unable to obtain water to use in our operations, we may be unable to economically produce oil and natural gas, which could have a material and adverse effect on our financial condition, results of operations and cash flows.
Our producing properties are located in the Eagle Ford and in North Louisiana, making us vulnerable to risks associated with operating in a limited number of geographic areas.
All of our producing properties are geographically concentrated in the Eagle Ford and in North Louisiana. At December 31, 2016, all of our total estimated proved reserves were attributable to properties located in these areas. As a result of this concentration, we may be disproportionately exposed to the impact of regional supply and demand factors, delays or interruptions of production from wells in these areas caused by governmental regulation, processing or transportation capacity constraints, market limitations, availability of equipment and personnel, water shortages or other drought related conditions or interruption of the processing or transportation of oil, natural gas or NGLs.
The marketability of our production is dependent upon transportation and other facilities, certain of which we do not control. If these facilities are unavailable, our operations could be interrupted and our revenues reduced.
The marketability of our oil and natural gas production depends in part upon the availability, proximity and capacity of transportation facilities owned by third parties. Our oil production is transported from the wellhead to our tank batteries by our gathering systems. The oil is then transported by the purchaser by truck to a transportation facility. Our natural gas production is generally transported by our or third-party gathering lines from the wellhead to a gas processing facility or transmission pipeline. We do not control these trucks and other third-party transportation facilities and our access to them may be limited or denied. Insufficient production from our wells to support the construction of pipeline facilities by our purchasers or a significant disruption in the availability of our or third-party transportation facilities or other production facilities could adversely impact our ability to deliver to market or produce our oil and natural gas and thereby cause a significant interruption in our operations. If, in the future, we are unable, for any sustained period, to implement acceptable delivery or transportation arrangements or encounter production related difficulties,
38
we may be required to shut in or curtail production. Any such shut-in or curtailment, or an inability to obtain favorable terms for delivery of the oil and natural gas produced from our fields, would materially and adversely affect our financial condition and results of operations.
We may incur losses as a result of title defects in the properties in which we invest.
The existence of a material title deficiency can render a lease worthless and adversely affect our results of operations and financial condition. While we typically obtain title opinions prior to commencing drilling operations on a lease or in a unit, the failure of title may not be discovered until after a well is drilled, in which case we may lose the lease and the right to produce all or a portion of the minerals under the property.
The development of our estimated PUDs may take longer and may require higher levels of capital expenditures than we currently anticipate. Therefore, our estimated PUDs may not be ultimately developed or produced.
As of December 31, 2016, approximately 69% of our total estimated proved reserves were classified as proved undeveloped. Development of these proved undeveloped reserves may take longer and require higher levels of capital expenditures than we currently anticipate. Estimated future development costs relating to the development of our PUDs at December 31, 2016 are approximately $1.10 billion over the next five years. We expect to fund these expenditures through cash generated by operations, borrowings under our revolving credit facility and other sources of capital. Our ability to fund these expenditures is subject to a number of risks. See “—Our development projects and acquisitions require substantial capital expenditures. We may be unable to obtain required capital or financing on satisfactory terms, which could lead to a decline in our ability to access or grow production and reserves.” Delays in the development of our reserves, increases in costs to drill and develop such reserves or decreases in commodity prices will reduce the value of our estimated PUDs and future net revenues estimated for such reserves and may result in some projects becoming uneconomic. In addition, delays in the development of reserves could cause us to have to reclassify our PUDs as unproved reserves. Furthermore, there is no certainty that we will be able to convert our PUDs to developed reserves or that our undeveloped reserves will be economically viable or technically feasible to produce.
Further, SEC rules require that, subject to limited exceptions, PUDs may only be booked if they relate to wells scheduled to be drilled within five years after the date of booking. This requirement has limited and may continue to limit our ability to book additional PUDs as we pursue our drilling program. As a result, we may be required to write down our PUDs if we do not drill those wells within the required five-year timeframe.
Certain factors could require us to write-down the carrying values of our properties, including commodity prices decreasing to a level such that our future undiscounted cash flows from our properties are less than their carrying value.
Accounting rules require that we periodically review the carrying value of our properties for possible impairment. Based on prevailing commodity prices and specific market factors and circumstances at the time of prospective impairment reviews, and the continuing evaluation of development plans, production data, economics and other factors, we may be required to write-down the carrying value of our properties. A write-down constitutes a non-cash impairment charge to earnings. Commodity prices have declined significantly since 2014. On March 13, 2017, the WTI spot price for crude oil was $47.95 per barrel and the Henry Hub spot price for natural gas was $3.04 per MMBtu, representing decreases of 56% and 63%, respectively, from the high of $107.95 per barrel of oil and $8.15 per MMBtu for natural gas during 2014.
Likewise, NGLs have suffered significant recent declines in realized prices. Lower commodity prices in the future could result in impairments of our properties, which could have a material adverse effect on our results of operations for the periods in which such charges are taken. As a result of lower commodity prices, we recorded $24.7 million and $9.3 million of impairment expense during the years ended December 31, 2014 and 2015, respectively. We could experience further material write-downs as a result of lower commodity prices or other factors, including low production results or high lease operating expenses, capital expenditures or transportation fees.
Unless we replace our reserves with new reserves and develop those new reserves, our reserves and production will decline, which would adversely affect our future cash flows and results of operations.
Producing oil and natural gas reservoirs generally are characterized by declining production rates that vary depending upon reservoir characteristics and other factors. Unless we conduct successful ongoing exploration and development activities or continually acquire properties containing proved reserves, our proved reserves will decline as those reserves are produced. Our future reserves and production, and therefore our future cash flow and results of operations, are highly dependent on our success in efficiently developing our current reserves and economically finding or acquiring additional recoverable reserves. We may not be able to develop, find or acquire sufficient additional reserves to replace our current and future production. If we are unable to replace our
39
current and future production, the value of our reserves will decrease, and our business, financial condition and results of operations would be materially and adversely affected.
Conservation measures and technological advances could reduce or slow the demand for oil and natural gas.
Fuel conservation measures, alternative fuel requirements, increasing consumer demand for alternatives to oil, natural gas and NGLs, technological advances in fuel economy and developments in energy generation devices could reduce or slow the demand for oil, natural gas and NGLs. The impact of the changing demand for oil, natural gas and NGLs may have a material adverse effect on our business, financial condition, results of operations and cash flows.
We depend upon a small number of significant purchasers for the sale of most of our oil, natural gas and NGL production.
We normally sell our production to a relatively small number of customers, as is customary in our business. For the years ended December 31, 2016 and 2015, there were three purchasers who accounted for an aggregate 82% and 72%, respectively, of WHR II’s and Esquisto’s total revenue on a combined basis. During such years, no other purchaser accounted for 10% or more of WHR II’s and Esquisto’s revenue on a combined basis. The loss of any such greater than 10% purchaser as a purchaser could adversely affect our revenues in the short term.
Our operations may be exposed to significant delays, costs and liabilities as a result of environmental and occupational health and safety requirements applicable to our business activities.
Our operations are subject to stringent and complex federal, state and local laws and regulations governing the discharge of materials into the environment, health and safety aspects of our operations or otherwise relating to environmental protection. These laws and regulations may impose numerous obligations applicable to our operations, including the acquisition of a permit or other approval before conducting regulated activities; the restriction of types, quantities and concentration of materials that can be released into the environment; the limitation or prohibition of drilling activities on certain lands lying within wilderness, wetlands, seismically active areas and other protected areas; the application of specific health and safety criteria addressing worker protection; and the imposition of substantial liabilities for pollution resulting from our operations. Numerous governmental authorities, such as the EPA and analogous state agencies, have the power to enforce compliance with these laws and regulations and the permits issued under them. Such enforcement actions often involve difficult and costly compliance measures or corrective actions. Failure to comply with these laws and regulations may result in the assessment of sanctions, including administrative, civil or criminal penalties, natural resource damages, the imposition of investigatory or remedial obligations, and the issuance of orders limiting or prohibiting some or all of our operations. In addition, we may experience delays in obtaining, or be unable to obtain, required permits, which may delay or interrupt our operations and limit our growth and revenue.
Certain environmental laws impose strict liability (i.e., no showing of “fault” is required) as well as joint and several liability for costs required to remediate and restore sites where hazardous substances, hydrocarbons or solid wastes have been stored or released. We may be required to remediate contaminated properties currently or formerly owned or operated by us or facilities of third parties that received waste generated by our operations regardless of whether such contamination resulted from the conduct of others or from consequences of our own actions that were in compliance with all applicable laws at the time those actions were taken. In connection with certain acquisitions, we could acquire, or be required to provide indemnification against, environmental liabilities that could expose us to material losses. In certain instances, citizen groups also have the ability to bring legal proceedings against us if we are not in compliance with environmental laws, or to challenge our ability to receive environmental permits that we need to operate. In addition, claims for damages to persons or property, including natural resources, may result from the environmental, health and safety impacts of our operations. Our insurance may not cover all environmental risks and costs or may not provide sufficient coverage if an environmental claim is made against us. Moreover, public interest in the protection of the environment has increased dramatically in recent years. The trend of more expansive and stringent environmental legislation and regulations applied to the crude oil and natural gas industry could continue, resulting in increased costs of doing business and consequently affecting profitability.
To the extent laws are enacted or other governmental action is taken that restricts drilling or imposes more stringent and costly operating, waste handling, disposal and cleanup requirements, our business, prospects, financial condition or results of operations could be materially adversely affected.
We may incur substantial losses and be subject to substantial liability claims as a result of our operations. Additionally, we may not be insured for, or our insurance may be inadequate to protect us against, these risks.
We are not insured against all risks. Losses and liabilities arising from uninsured and underinsured events could materially and adversely affect our business, financial condition or results of operations.
40
Our development activities are subject to all of the operating risks associated with drilling for and producing oil and natural gas, including the possibility of:
|
|
• |
environmental hazards, such as uncontrollable releases of oil, natural gas, brine, well fluids, toxic gas or other pollution into the environment, including groundwater, air and shoreline contamination; |
|
|
• |
abnormally pressured formations; |
|
|
• |
mechanical difficulties, such as stuck oilfield drilling and service tools and casing collapse; |
|
|
• |
fires, explosions and ruptures of pipelines; |
|
|
• |
personal injuries and death; |
|
|
• |
natural disasters; and |
|
|
• |
terrorist attacks targeting oil and natural gas related facilities and infrastructure. |
Any of these events could adversely affect our ability to conduct operations or result in substantial loss to us as a result of claims for:
|
|
• |
injury or loss of life; |
|
|
• |
damage to and destruction of property, natural resources and equipment; |
|
|
• |
pollution and other environmental damage; |
|
|
• |
regulatory investigations and penalties; and |
|
|
• |
repair and remediation costs. |
We may elect not to obtain insurance for any or all of these risks if we believe that the cost of available insurance is excessive relative to the risks presented. In addition, pollution and environmental risks generally are not fully insurable. The occurrence of an event that is not fully covered by insurance could have a material adverse effect on our business, financial condition and results of operations.
Our business is difficult to evaluate because we have a limited operating history, and we are susceptible to the potential difficulties associated with rapid growth and expansion.
WHR II and Esquisto were formed in 2013 and 2014, respectively. As a result, there is only limited historical financial and operating information available upon which to base your evaluation of our performance.
In addition, we have grown rapidly over the last several years. Our management believes that our future success depends on our ability to manage the rapid growth that we have experienced and the demands from increased responsibility on management personnel. Prior to our initial public offering, WHR II and Esquisto had separate management teams and going forward, we will have one management team. Further, the transition services agreement we entered into with affiliates of Esquisto Holdings in connection with the closing of our initial public offering is effective for six months. Additionally, the following factors could present difficulties:
|
|
• |
increased responsibilities for our executive level personnel; |
|
|
• |
increased administrative burden; |
|
|
• |
increased capital requirements; and |
|
|
• |
increased organizational challenges common to large, expansive operations. |
Our operating results could be adversely affected if we do not successfully manage these potential difficulties. The historical financial information incorporated herein is not necessarily indicative of the results that may be realized in the future. In addition, our operating history is limited and the results from our current producing wells are not necessarily indicative of success from our future drilling operations.
Properties that we decide to drill may not yield oil or natural gas in commercially viable quantities.
Properties that we decide to drill that do not yield oil or natural gas in commercially viable quantities will adversely affect our results of operations and financial condition. There is no way to predict in advance of drilling and testing whether any particular
41
prospect will yield oil or natural gas in sufficient quantities to recover drilling or completion costs or to be economically viable. The use of micro-seismic data and other technologies and the study of producing fields in the same area will not enable us to know conclusively prior to drilling whether oil or natural gas will be present or, if present, whether oil or natural gas will be present in commercial quantities. We cannot assure you that the analogies we draw from available data from other wells, more fully explored prospects or producing fields will be applicable to our drilling prospects. Further, our drilling operations may be curtailed, delayed or cancelled as a result of numerous factors, including:
|
|
• |
unexpected drilling conditions; |
|
|
• |
title issues; |
|
|
• |
pressure or lost circulation in formations; |
|
|
• |
equipment failures or accidents; |
|
|
• |
adverse weather conditions; |
|
|
• |
compliance with environmental and other governmental or contractual requirements; and |
|
|
• |
increases in the cost of, and shortages or delays in the availability of, electricity, supplies, materials, drilling or workover rigs, equipment and services. |
We may be unable to make attractive acquisitions or successfully integrate acquired businesses, and any inability to do so may disrupt our business and hinder our ability to grow.
In the future we may make acquisitions of assets or businesses that complement or expand our current business. However, there is no guarantee we will be able to identify attractive acquisition opportunities. In the event we are able to identify attractive acquisition opportunities, we may not be able to complete the acquisition or do so on commercially acceptable terms. Competition for acquisitions may also increase the cost of, or cause us to refrain from, completing acquisitions.
The success of completed acquisitions will depend on our ability to integrate effectively the acquired business into our existing operations. The process of integrating acquired businesses may involve unforeseen difficulties and may require a disproportionate amount of our managerial and financial resources. In addition, possible future acquisitions may be larger and for purchase prices significantly higher than those paid for earlier acquisitions. No assurance can be given that we will be able to identify additional suitable acquisition opportunities, negotiate acceptable terms, obtain financing for acquisitions on acceptable terms or successfully acquire identified targets. Our failure to achieve consolidation savings, to integrate the acquired businesses and assets into our existing operations successfully or to minimize any unforeseen operational difficulties could have a material adverse effect on our financial condition and results of operations.
In addition, our revolving credit facility imposes certain limitations on our ability to enter into mergers or combination transactions and to incur certain indebtedness, which could indirectly limit our ability to acquire assets and businesses.
Certain of our properties are subject to land use restrictions, which could limit the manner in which we conduct our business.
Certain of our properties are subject to land use restrictions, including city ordinances, which could limit the manner in which we conduct our business. Such restrictions could affect, among other things, our access to and the permissible uses of our facilities as well as the manner in which we produce oil and natural gas and may restrict or prohibit drilling in general. The costs we incur to comply with such restrictions may be significant in nature, and we may experience delays or curtailment in the pursuit of development activities and perhaps even be precluded from the drilling of wells.
The unavailability or high cost of drilling rigs, equipment, supplies, personnel and oilfield services could adversely affect our ability to execute our development plans within our budget and on a timely basis.
The demand for drilling rigs, pipe and other equipment and supplies, as well as for qualified and experienced field personnel to drill wells and conduct field operations, geologists, geophysicists, engineers and other professionals in the oil and natural gas industry, can fluctuate significantly, often in correlation with oil, natural gas and NGL prices, causing periodic shortages of supplies and needed personnel. Our operations are concentrated in areas in which oilfield activity levels had increased rapidly, and as a result, demand for such drilling rigs, equipment and personnel, as well as access to transportation, processing and refining facilities in these areas, had increased, as did the costs for those items. However, beginning in the second half of 2014, commodity prices began to decline and the demand for goods and services subsided due to reduced activity. To the extent that commodity prices improve in the future, the demand for and prices of these goods and services are likely to increase and we could encounter delays in or an inability to secure the
42
personnel, equipment, power, services, resources and facilities access necessary for us to resume or increase our development activities, which could result in production volumes being below our forecasted volumes. In addition, any such negative effect on production volumes, or significant increases in costs, could have a material adverse effect on our cash flow and profitability. Furthermore, if we are unable to secure a sufficient number of drilling rigs at reasonable costs, we may not be able to drill all of our acreage before our leases expire.
We could experience periods of higher costs if commodity prices rise. These increases could reduce our profitability, cash flow and ability to complete development activities as planned.
Historically, our capital and operating costs have risen during periods of increasing oil, natural gas and NGL prices. These cost increases result from a variety of factors beyond our control, such as increases in the cost of electricity, steel and other raw materials that we and our vendors rely upon; increased demand for labor, services and materials as drilling activity increases; and increased taxes. Decreased levels of drilling activity in the oil and natural gas industry in recent periods have led to declining costs of some drilling equipment, materials and supplies. However, such costs may rise faster than increases in our revenue if commodity prices rise, thereby negatively impacting our profitability, cash flow and ability to complete development activities as scheduled and on budget. This impact may be magnified to the extent that our ability to participate in the commodity price increases is limited by our derivative activities.
A change in the jurisdictional characterization of some of our assets by federal, state or local regulatory agencies or a change in policy by those agencies may result in increased regulation of our assets, which may cause our revenues to decline and operating expenses to increase.
Section 1(b) of the NGA exempts natural gas gathering facilities from regulation by the FERC, as a natural gas company under the NGA. We believe that the natural gas pipelines in our gathering systems meet the traditional tests FERC has used to establish a pipeline’s status as a gatherer not subject to regulation as a natural gas company. However, the distinction between FERC-regulated transmission services and federally unregulated gathering services is the subject of ongoing litigation, so the classification and regulation of our gathering facilities are subject to change based on future determinations by FERC, the courts or Congress. If the FERC were to consider the status of an individual facility and determine that the facility and/or services provided by it are not exempt from FERC regulation, the rates for, and terms and conditions of services provided by such facility would be subject to regulation by the FERC. Such regulation could decrease revenues, increase operating costs, and depending upon the facility in question, could adversely affect our results of operations and cash flows. In addition, if any of our facilities were found to have provided services or otherwise operated in violation of the NGA, this could result in the imposition of civil penalties as well as a requirement to disgorge charges collected for such service in excess of the cost-based rate established by the FERC.
State regulation of gathering facilities generally includes various safety, environmental and, in some circumstances, nondiscriminatory take requirements and complaint-based rate regulation. We cannot predict what new or different regulations federal and state regulatory agencies may adopt, or what effect subsequent regulation may have on our activities. Such regulations may have a material adverse effect on our financial condition, result of operations and cash flows.
We may be involved in legal proceedings that could result in substantial liabilities.
Like many oil and gas companies, we are from time to time involved in various legal and other proceedings, such as title, royalty or contractual disputes, regulatory compliance matters and personal injury or property damage matters, in the ordinary course of our business. Such legal proceedings are inherently uncertain and their results cannot be predicted. Regardless of the outcome, such proceedings could have an adverse impact on us because of legal costs, diversion of management and other personnel and other factors. In addition, it is possible that a resolution of one or more such proceedings could result in liability, penalties or sanctions, as well as judgments, consent decrees or orders requiring a change in our business practices, which could materially and adversely affect our business, operating results and financial condition. Accruals for such liability, penalties or sanctions may be insufficient, and judgments and estimates to determine accruals or range of losses related to legal and other proceedings could change from one period to the next, and such changes could be material.
Climate change laws and regulations restricting emissions of GHGs could result in increased operating costs and reduced demand for the oil and natural gas that we produce, while potential physical effects of climate change could disrupt our production and cause us to incur significant costs in preparing for or responding to those effects.
In response to findings that emissions of carbon dioxide, methane and other GHGs present an endangerment to public health and the environment, the EPA has adopted regulations pursuant to the federal Clean Air Act to reduce GHG emissions from various sources. For example, the EPA requires certain large stationary sources to obtain preconstruction and operating permits for pollutants regulated under the Prevention of Significant Deterioration and Title V programs of the Clean Air Act. Facilities required to obtain
43
preconstruction permits for such pollutants are also required to meet “best available control technology” standards that are being established by the states. These regulatory requirements could adversely affect our operations and restrict or delay our ability to obtain air permits for new or modified sources.
The EPA has adopted rules requiring the monitoring and reporting of GHG emissions from specified onshore and offshore oil and natural gas production sources in the United States on an annual basis, which include certain of our operations. In May 2016, the EPA finalized rules that establish new controls for emissions of methane from new, modified or reconstructed sources in the oil and natural gas sector, including production, processing, transmission and storage activities. Compliance will require enhanced record-keeping practices, the purchase of new equipment and could result in the increased frequency of maintenance and repair activities to address emissions leakage at well sites and compressor stations, and also may require additional personnel time to support these activities or the engagement of third party contractors to assist with and verify compliance. The EPA has also announced that it intends to impose methane emission standards for existing sources but, to date, has not yet issued a proposal. And in 2015, EPA published a rule, known as the Clean Power Plan, to limit GHG emissions from electric power plants. In February 2016, the Supreme Court stayed the implementation of the Clean Power Plan while legal challenges to the rule proceed. Depending on the ultimate outcome of those challenges, and how various states choose to implement this rule, it may alter the power generation mix between natural gas, coal, oil, and alternative energy sources, which would ultimately affect the demand for natural gas and oil in electric generation.
While Congress has from time to time considered legislation to reduce emissions of GHGs, there has not been significant activity in the form of adopted legislation to reduce GHG emissions at the federal level in recent years. In the absence of such federal climate legislation, a number of state and regional efforts have emerged that are aimed at tracking and/or reducing GHG emissions by means of cap and trade programs. Cap and trade programs typically require major sources of GHG emissions to acquire and surrender emission allowances in return for emitting those GHGs. In addition, efforts have been made and continue to be made in the international community toward the adoption of international treaties or protocols that would address global climate change issues. For example, in April 2016, the United States signed the Paris Agreement, which requires member nations to review and “represent a progression” in their intended nationally determined contributions, which set GHG emission reduction goals, every five years beginning in 2020. The Paris Agreement, which entered into force in November 2016, includes pledges to voluntarily limit or reduce future emissions. Under the Obama Administration, the United States was one of over 100 nations that have indicated an intent to comply with the agreement.
Although it is not possible at this time to predict how legislation or new regulations that may be adopted to address GHG emissions would impact our business, any such future laws and regulations imposing reporting obligations on, or limiting emissions of GHGs from, our equipment and operations could require us to incur costs to reduce emissions of GHGs associated with our operations. Substantial limitations on GHG emissions could adversely affect demand for the oil and natural gas we produce.
Finally, increasing concentrations of GHGs in the Earth’s atmosphere may produce climate changes that have significant physical effects, such as increased frequency and severity of storms, floods and other climatic events; if any such effects were to occur, they could have a material adverse effect on our operations.
Federal, state and local legislative and regulatory initiatives relating to hydraulic fracturing as well as governmental reviews of such activities could result in increased costs and additional operating restrictions or delays in the completion of oil and natural gas wells and adversely affect our production.
Hydraulic fracturing is an important and common practice that is used to stimulate production of oil and/or natural gas from dense subsurface rock formations. The hydraulic fracturing process involves the injection of water, proppants and chemicals under pressure into targeted subsurface formations to fracture the surrounding rock and stimulate production. We regularly use hydraulic fracturing as part of our operations. Hydraulic fracturing is typically regulated by state oil and natural gas commissions, but certain federal agencies have asserted regulatory authority over certain aspects of the process. For example, the EPA has asserted federal regulatory authority pursuant to the federal Safe Drinking Water Act (“SDWA”) over certain hydraulic fracturing activities involving the use of diesel fuels and published permitting guidance in February 2014 addressing the performance of such activities using diesel fuels. The EPA has also issued final regulations under the federal Clean Air Act establishing performance standards, including standards for the capture of air emissions released during hydraulic fracturing, and an advanced notice of proposed rulemaking under the Toxic Substances Control Act to require companies to disclose information regarding the chemicals used in hydraulic fracturing. The EPA also finalized rules in June 2016 that prohibit the discharge of wastewater from hydraulic fracturing operations to publicly owned wastewater treatment plants.
In addition, Congress has from time to time considered legislation to provide for federal regulation of hydraulic fracturing under the SDWA and to require disclosure of the chemicals used in the hydraulic fracturing process. It is unclear how any additional federal regulation of hydraulic fracturing activities may affect our operations.
44
Certain governmental reviews are either underway or have been conducted that focus on environmental aspects of hydraulic fracturing practices. For example, in December 2016, the EPA released its final report on the potential impacts of hydraulic fracturing on drinking water resources. The EPA report concluded that “water cycle” activities associated with hydraulic fracturing may impact drinking water resources “under some circumstances,” noting that the following hydraulic fracturing water cycle activities and local- or regional-scale factors are more likely than others to result in more frequent or more severe impacts: water withdrawals for fracturing in times or areas of low water availability; surface spills during the management of fracturing fluids, chemicals or produced water; injection of fracturing fluids into wells with inadequate mechanical integrity; injection of fracturing fluids directly into groundwater resources; discharge of inadequately treated fracturing wastewater to surface waters; and disposal or storage of fracturing wastewater in unlined pits.
At the state level, several states have adopted or are considering legal requirements that could impose more stringent permitting, disclosure and well construction requirements on hydraulic fracturing activities. For example, in May 2013, the Railroad Commission issued a “well integrity rule,” which updates the requirements for drilling, putting pipe down and cementing wells. The rule also includes new testing and reporting requirements, such as (i) the requirement to submit cementing reports after well completion or after cessation of drilling, whichever is later, and (ii) the imposition of additional testing on wells less than 1,000 feet below usable groundwater. The well integrity rule took effect in January 2014.
Local governments also may seek to adopt ordinances within their jurisdictions regulating the time, place and manner of drilling activities in general or hydraulic fracturing activities in particular. If new or more stringent federal, state or local legal restrictions relating to the hydraulic fracturing process are adopted in areas where we operate, we could incur potentially significant added costs to comply with such requirements, experience delays or curtailment in the pursuit of development activities, and perhaps even be precluded from drilling wells.
Legislation or regulatory initiatives intended to address seismic activity could restrict our drilling and production activities, as well as our ability to dispose of produced water gathered from such activities, which could have a material adverse effect on our business.
State and federal regulatory agencies have recently focused on a possible connection between the hydraulic fracturing related activities, particularly the underground injection of wastewater into disposal wells, and the increased occurrence of seismic activity, and regulatory agencies at all levels are continuing to study the possible linkage between oil and gas activity and induced seismicity. For example, in 2015, the United States Geological Study identified eight states, including Texas, with areas of increased rates of induced seismicity that could be attributed to fluid injection or oil and gas extraction.
In addition, a number of lawsuits have been filed in other states, most recently in Oklahoma, alleging that disposal well operations have caused damage to neighboring properties or otherwise violated state and federal rules regulating waste disposal. In response to these concerns, regulators in some states are seeking to impose additional requirements, including requirements in the permitting of produced water disposal wells or otherwise to assess the relationship between seismicity and the use of such wells. For example, in October 2014, the Railroad Commission published a new rule governing permitting or re-permitting of disposal wells that would require, among other things, the submission of information on seismic events occurring within a specified radius of the disposal well location, as well as logs, geologic cross sections and structure maps relating to the disposal area in question. If the permittee or an applicant of a disposal well permit fails to demonstrate that the produced water or other fluids are confined to the disposal zone or if scientific data indicates such a disposal well is likely to be or determined to be contributing to seismic activity, then the agency may deny, modify, suspend or terminate the permit application or existing operating permit for that well. The Railroad Commission has used this authority to deny permits for waste disposal wells. In some instances, regulators may also order that disposal wells be shut in. For example, in September 2016 the Oklahoma Corporations Commission ordered that all disposal wells with a certain proximity to a particular earthquake in central Oklahoma be shut in.
We dispose of large volumes of produced water gathered from our drilling and production operations by injecting it into wells pursuant to permits issued to us by governmental authorities overseeing such disposal activities. While these permits are issued pursuant to existing laws and regulations, these legal requirements are subject to change, which could result in the imposition of more stringent operating constraints or new monitoring and reporting requirements, owing to, among other things, concerns of the public or governmental authorities regarding such gathering or disposal activities. The adoption and implementation of any new laws or regulations that restrict our ability to use hydraulic fracturing or dispose of produced water gathered from our drilling and production activities by limiting volumes, disposal rates, disposal well locations or otherwise, or requiring us to shut down disposal wells, could have a material adverse effect on our business, financial condition and results of operations.
45
Competition in the oil and natural gas industry is intense, making it more difficult for us to acquire properties, market oil or natural gas and secure trained personnel.
Our ability to acquire additional prospects and to find and develop reserves in the future will depend on our ability to evaluate and select suitable properties for acquisitions and to consummate transactions in a highly competitive environment for acquiring properties, marketing oil and natural gas and securing trained personnel. Also, there is substantial competition for capital available for investment in the oil and natural gas industry. Many of our competitors possess and employ greater financial, technical and personnel resources than we do. Those companies may be able to pay more for productive properties and exploratory prospects and to evaluate, bid for and purchase a greater number of properties and prospects than our financial or personnel resources permit. In addition, other companies may be able to offer better compensation packages to attract and retain qualified personnel than we are able to offer. The cost to attract and retain qualified personnel has historically continually increased due to competition and may increase substantially in the future. We may not be able to compete successfully in the future in acquiring prospective reserves, developing reserves, marketing hydrocarbons, attracting and retaining quality personnel and raising additional capital, which could have a material adverse effect on our business.
NGP and their affiliates are not limited in their ability to compete with us, which could cause conflicts of interest and limit our ability to acquire additional assets or businesses.
Our governing documents provide that NGP and their respective affiliates (including NGP and its affiliates’ portfolio investments) are not restricted from owning assets or engaging in businesses that compete directly or indirectly with us. In addition, NGP and their respective affiliates may acquire, develop or dispose of additional oil and natural gas properties or other assets in the future, without any obligation to offer us the opportunity to purchase or develop any of those assets. NGP are established participants in the oil and natural gas industry, and have resources greater than ours, which factors may make it more difficult for us to compete with them with respect to commercial activities as well as for potential acquisitions. As a result, competition from these affiliates could adversely impact our results of operations.
The loss of senior management or technical personnel could adversely affect operations.
We depend on the services of our senior management and technical personnel. We do not maintain, nor do we plan to obtain, any insurance against the loss of any of these individuals. The loss of the services of our senior management or technical personnel could have a material adverse effect on our business, financial condition and results of operations.
Increases in interest rates could adversely affect our business.
We require continued access to capital and our business and operating results can be harmed by factors such as the availability, terms of and cost of capital, increases in interest rates or a reduction in credit rating. We expect to use our revolving credit facility to finance a portion of our future growth, and these changes could cause our cost of doing business to increase, limit our ability to pursue acquisition opportunities, reduce cash flow used for drilling and place us at a competitive disadvantage. Recent and continuing disruptions and volatility in the global financial markets may lead to a contraction in credit availability impacting our ability to finance our operations. A significant reduction in cash flows from operations or the availability of credit could materially and adversely affect our ability to achieve our planned growth and operating results.
Certain U.S. federal income tax deductions currently available with respect to natural gas and oil exploration and development may be eliminated as a result of future legislation.
In past years, legislation has been proposed that would, if enacted into law, make significant changes to U.S. tax laws, including to certain key U.S. federal income tax provisions currently available to oil and gas exploration and production companies. Such legislative changes have included, but not been limited to, (i) the repeal of the percentage depletion allowance for oil and gas properties, (ii) the elimination of current deductions for intangible drilling and development costs, (iii) the elimination of the deduction for certain domestic production activities, and (iv) an extension of the amortization period for certain geological and geophysical expenditures. It is unclear whether these or similar changes will be enacted and, if enacted, how soon any such changes could become effective. Congress could consider, and could include, some or all of these proposals as part of tax reform legislation, to accompany lower federal income tax rates. Moreover, other more general features of tax reform legislation, including changes to cost recovery rules and to the deductibility of interest expense, may be developed that also would change the taxation of oil and gas companies. It is unclear whether these or similar changes will be enacted and, if enacted, how soon any such changes could take effect. The passage of any legislation as a result of these proposals or any similar changes in U.S. federal income tax laws could eliminate or postpone certain tax deductions that currently are available with respect to oil and gas development, or increase costs, and any such changes could have an adverse effect on our financial position, results of operations and cash flows.
46
Our use of seismic data is subject to interpretation and may not accurately identify the presence of oil and natural gas, which could adversely affect the results of our drilling operations.
Even when properly used and interpreted, seismic data and visualization techniques are only tools used to assist geoscientists in identifying subsurface structures and hydrocarbon indicators and do not enable the interpreter to know whether hydrocarbons are, in fact, present in those structures. As a result, our drilling activities may not be successful or economical. In addition, the use of advanced technologies, such as 3-D seismic data, requires greater pre-drilling expenditures than traditional drilling strategies, and we could incur losses as a result of such expenditures.
Restrictions on drilling activities intended to protect certain species of wildlife may adversely affect our ability to conduct drilling activities in areas where we operate.
Oil and natural gas operations in our operating areas may be adversely affected by seasonal or permanent restrictions on drilling activities designed to protect various wildlife. Such restrictions may limit our ability to operate in protected areas and can intensify competition for drilling rigs, oilfield equipment, services, supplies and qualified personnel, which may lead to periodic shortages when drilling is allowed. These constraints and the resulting shortages or high costs could delay our operations or materially increase our operating and capital costs. Permanent restrictions imposed to protect threatened or endangered species or their habitat could prohibit drilling in certain areas or require the implementation of expensive mitigation measures. The designation of previously unprotected species in areas where we operate as threatened or endangered could cause us to incur increased costs arising from species protection measures or could result in limitations on our activities that could have a material and adverse impact on our ability to develop and produce our reserves.
The enactment of derivatives legislation could have an adverse effect on our ability to use derivative instruments to reduce the effect of commodity price, interest rate and other risks associated with our business.
The Dodd-Frank Act, enacted on July 21, 2010, established federal oversight and regulation of the over-the-counter derivatives market and of entities, such as us, that participate in that market. The Dodd- Frank Act requires the CFTC and the SEC to promulgate rules and regulations implementing the Dodd- Frank Act. In its rulemaking under the Dodd-Frank Act, in November 2013, the CFTC proposed new rules that would place limits on positions in certain core futures and equivalent swaps contracts for or linked to certain physical commodities, subject to exceptions for certain bona fide hedging transactions. As these new position limit rules are not yet final, the impact of those provisions on us is uncertain at this time.
The Dodd-Frank Act and CFTC rules also will require us, in connection with certain derivatives activities, to comply with clearing and trade-execution requirements (or to take steps to qualify for an exemption to such requirements). In addition, the CFTC and certain banking regulators have recently adopted final rules establishing minimum margin requirements for uncleared swaps. Although we currently qualify for the end-user exception to the mandatory clearing, trade-execution and margin requirements for swaps entered to hedge our commercial risks, the application of such requirements to other market participants, such as swap dealers, may change the cost and availability of the swaps that we use for hedging. In addition, if any of our swaps do not qualify for the commercial end-user exception, posting of collateral could impact liquidity and reduce cash available to us for capital expenditures, therefore reducing our ability to execute hedges to reduce risk and protect cash flow.
It is not possible at this time to predict with certainty the full effects of the Dodd-Frank Act and CFTC rules on us or the timing of such effects. The Dodd-Frank Act and any new regulations could significantly increase the cost of derivative contracts, materially alter the terms of derivative contracts, reduce the availability of derivatives to protect against risks we encounter, and reduce our ability to monetize or restructure our existing derivative contracts. If we reduce our use of derivatives as a result of the Dodd-Frank Act and CFTC rules, our results of operations may become more volatile and our cash flows may be less predictable, which could adversely affect our ability to plan for and fund capital expenditures.
Finally, the Dodd-Frank Act was intended, in part, to reduce the volatility of oil, natural gas and NGL prices, which some legislators attributed to speculative trading in derivatives and commodity instruments related to oil, natural gas and NGL. Our revenues could therefore be adversely affected if a consequence of the Dodd-Frank Act and CFTC rules is to lower commodity prices. Any of these consequences could have a material and adverse effect on us, our financial condition or our results of operations. In addition, the European Union and other non-U.S. jurisdictions are implementing regulations with respect to the derivatives market. To the extent we transact with counterparties in foreign jurisdictions, we may become subject to such regulations, the impact of which is not clear at this time.
We may not be able to keep pace with technological developments in our industry.
The oil and natural gas industry is characterized by rapid and significant technological advancement and the introduction of new products and services using new technologies. As others use or develop new technologies, we may be placed at a competitive disadvantage or may be forced by competitive pressures to implement those new technologies at substantial costs. In addition, other
47
oil and natural gas companies may have greater financial, technical and personnel resources that allow them to enjoy technological advantages and that may in the future allow them to implement new technologies before we can. We may not be able to respond to these competitive pressures or implement new technologies on a timely basis or at an acceptable cost. If one or more of the technologies we use now or in the future were to become obsolete, our business, financial condition or results of operations could be materially and adversely affected.
Our business could be adversely affected by security threats, including cyber-security threats, and related disruptions.
We rely heavily on our information systems, and the availability and integrity of these systems are essential for us to conduct our business and operations. As a producer of natural gas and oil, we face various security threats, including cyber-security threats, to gain unauthorized access to our sensitive information or to render our information or systems unusable, and threats to the security of our facilities and infrastructure or third-party facilities and infrastructure, such as gathering and processing and other facilities, refineries and pipelines. The potential for such security threats subjects our operations to increased risks that could have a material adverse effect on our business, financial condition, results of operations and cash flows.
Our implementation of various procedures and controls to monitor and mitigate such security threats and to increase security for our information, systems, facilities and infrastructure may result in increased costs. Moreover, there can be no assurance that such procedures and controls will be sufficient to prevent security breaches from occurring. If any of these security breaches were to occur, they could lead to losses of, or damage to, sensitive information or facilities, infrastructure and systems essential to our business and operations, as well as data corruption, communication interruptions or other disruptions to our operations, which, in turn, could have a material adverse effect on our business, financial position, results of operations and cash flows.
Risks Related Our Common Stock
If securities or industry analysts do not publish research or reports about our business, if they adversely change their recommendations regarding our common stock or if our operating results do not meet their expectations, our stock price could decline.
We expect that the trading market for our common stock will be influenced by the research and reports that industry or securities analysts publish about us or our business. If one or more of these analysts cease coverage of our company or fail to publish reports on us regularly, we could lose visibility in the financial markets, which in turn could cause our stock price or trading volume to decline. Moreover, if one or more of the analysts who cover our company downgrades our common stock or if our operating results do not meet their expectations, our stock price could decline.
NGP has the ability to direct the voting of a majority of our common stock, and its interests may conflict with those of our other stockholders.
NGP and its affiliates, through WildHorse Holdings, Esquisto Holdings, Acquisition Co. Holdings and NGP XI, beneficially own approximately 76.1% of our outstanding common stock. As a result, NGP is currently able to control matters requiring stockholder approval, including the election of directors, changes to our organizational documents and significant corporate transactions. This concentration of ownership makes it unlikely that any other holder or group of holders of our common stock will be able to affect the way we are managed or the direction of our business. The interests of NGP with respect to matters potentially or actually involving or affecting us, such as future acquisitions, financings and other corporate opportunities and attempts to acquire us, may conflict with the interests of our other stockholders. Given this concentrated ownership, NGP would have to approve any potential acquisition of us. In addition, certain of our directors are currently employees of NGP. These directors’ duties as employees of NGP may conflict with their duties as our directors, and the resolution of these conflicts may not always be in our or your best interest. Furthermore, we are party to a stockholders’ agreement with WildHorse Holdings, Esquisto Holdings and Acquisition Co. Holdings that provides WildHorse Holdings and Esquisto Holdings with the right to designate a certain number of nominees to our board of directors so long as they, Acquisition Co. Holdings, NGP XI and their affiliates collectively beneficially own more than 5% of the outstanding shares of our common stock. The existence of a significant stockholder and the stockholders’ agreement may have the effect of deterring hostile takeovers, delaying or preventing changes in control or changes in management, or limiting the ability of our other stockholders to approve transactions that they may deem to be in the best interests of our company. Moreover, NGP’s concentration of stock ownership may adversely affect the trading price of our common stock to the extent investors perceive a disadvantage in owning stock of a company with a significant stockholder.
48
Certain of our directors have significant duties with, and spend significant time serving, entities that may compete with us in seeking acquisitions and business opportunities and, accordingly, may have conflicts of interest in allocating time or pursuing business opportunities.
Certain of our directors, who are responsible for managing the direction of our operations and acquisition activities, hold positions of responsibility with other entities (including NGP-affiliated entities) that are in the business of identifying and acquiring oil and natural gas properties. For example, three of our directors (Messrs. Gieselman, Hayes and Weber) are Partners or Managing Partners of NGP, which is in the business of investing in oil and natural gas companies with independent management teams that seek to acquire oil and natural gas properties, and Mr. Brannon is President of certain NGP portfolio companies. The existing positions held by these directors may give rise to fiduciary or other duties that are in conflict with the duties they owe to us. These directors may become aware of business opportunities that may be appropriate for presentation to us as well as to the other entities with which they are or may become affiliated. Due to these existing and potential future affiliations, they may present potential business opportunities to other entities prior to presenting them to us, which could cause additional conflicts of interest. They may also decide that certain opportunities are more appropriate for other entities with which they are affiliated, and as a result, they may elect not to present those opportunities to us. These conflicts may not be resolved in our favor.
NGP and its affiliates are not limited in their ability to compete with us, and the corporate opportunity provisions in our amended and restated certificate of incorporation could enable NGP to benefit from corporate opportunities that might otherwise be available to us.
Our governing documents will provide that NGP and its affiliates (including portfolio investments of NGP and its affiliates) are not restricted from owning assets or engaging in businesses that compete directly or indirectly with us. In particular, subject to the limitations of applicable law, our amended and restated certificate of incorporation will, among other things:
|
|
• |
permit NGP and its affiliates to conduct business that competes with us and to make investments in any kind of property in which we may make investments; and |
|
|
• |
provide that if NGP or any of its affiliates, or any employee, partner, member, manager, officer or director of NGP or its affiliates who is also one of our directors or officers, becomes aware of a potential business opportunity, transaction or other matter, they will have no duty to communicate or offer that opportunity to us. |
Currently, NGP has multiple portfolio companies operating in the oil and natural gas industry, some of which may compete with us directly, including one company which operates in the broader Eagle Ford. Further, NGP or its affiliates may become aware, from time to time, of certain business opportunities (such as acquisition opportunities) and may direct such opportunities to other businesses in which they have invested, in which case we may not become aware of or otherwise have the ability or option to pursue such opportunity. Such businesses may choose to compete with us for these opportunities, possibly causing these opportunities to be unavailable to, or more expensive for, us to pursue. In this regard, we do not expect to enter into any agreement or arrangement with NGP and its affiliates to apportion opportunities between us, on the one hand, and NGP and its affiliates, on the other hand. In addition, NGP and its affiliates may dispose of oil and natural gas properties or other assets in the future without any obligation to offer us the opportunity to purchase any of those assets. As a result, our renouncing our interest and expectancy in any business opportunity that may be, from time to time, presented to NGP or its affiliates could adversely impact our business or prospects if attractive business opportunities are procured by such parties for their own benefit rather than for ours.
NGP is an established participant in the oil and natural gas industry and has access to resources greater than ours, which may make it more difficult for us to compete with NGP and its affiliates for commercial activities and potential acquisitions. We cannot assure you that any conflicts that may arise between us and our stockholders, on the one hand, and NGP or its affiliates, on the other hand, will be resolved in our favor. As a result, competition from NGP and its affiliates could adversely impact our results of operations.
49
We are a “controlled company” and, as a result, qualify for, and intend to rely on, exemptions from certain corporate governance requirements.
A group of stockholders that includes WildHorse Investment Holdings, Esquisto Investment Holdings, WildHorse Holdings, Esquisto Holdings, Acquisition Co. Holdings, NGP XI, NGP and certain of NGP’s affiliates (collectively, the “Sponsor Group”) beneficially control a majority of the combined voting power of all classes of our outstanding voting stock. As a result, we qualify as a “controlled company” within the meaning of the NYSE corporate governance standards. Under these rules, a company of which more than 50% of the voting power for the election of directors is held by an individual, group or another company is a “controlled company” and may elect not to comply with certain applicable corporate governance requirements, including the requirements that:
|
|
• |
a majority of the board of directors consist of independent directors; |
|
|
• |
the nominating and corporate governance committee be composed entirely of independent directors with a written charter addressing the committee’s purpose and responsibilities; |
|
|
• |
the compensation committee be composed entirely of independent directors with a written charter addressing the committee’s purpose and responsibilities; and |
|
|
• |
an annual performance evaluation of the nominating and corporate governance and compensation committees. |
We utilize the foregoing exemptions from the applicable corporate governance requirements. As a result, we do not have a majority of independent directors and do not have a compensation committee. Accordingly, you will not have the same protections afforded to stockholders of companies that are subject to such corporate governance requirements.
The price of our common stock may fluctuate significantly and you could lose all or part of your investment.
Volatility in the market price of our common stock may prevent you from being able to sell your common stock at or above the price you paid for your common stock. The market price for our common stock could fluctuate significantly for various reasons, including:
|
|
• |
our operating and financial performance and prospects; |
|
|
• |
changes in earnings estimates or recommendations by securities analysts who track our common stock or industry; |
|
|
• |
market and industry perception of our success, or lack thereof, in pursuing our growth strategy; and |
|
|
• |
sales of common stock by us, our stockholders (including the Sponsor Group), or members of our management team. |
In addition, the stock market has experienced significant price and volume fluctuations in recent years. This volatility has had a significant impact on the market price of securities issued by many companies, including companies in our industries. The changes frequently appear to occur without regard to the operating performance of the affected companies. Hence, the price of our common stock could fluctuate based upon factors that have little or nothing to do with us, and these fluctuations could materially reduce our share price.
We currently have no plans to pay regular dividends on our common stock, so you may not receive funds without selling your common stock.
We currently have no plans to pay regular dividends on our common stock. Any payment of dividends in the future will be at the discretion of our Board and will depend on, among other things, our earnings, financial condition and business opportunities, the restrictions in our debt agreements, and other considerations that our Board deems relevant. Accordingly, you may have to sell some or all of your common stock in order to generate cash flow from your investment.
Future sales of our common stock in the public market, or the perception that such sales may occur, could reduce our stock price, and any additional capital raised by us through the sale of equity or convertible securities may dilute your ownership in us.
We may sell additional shares of common stock in subsequent public offerings or otherwise, including to finance acquisitions. We may also issue convertible securities. We cannot predict the size of future issuances of our common stock or securities convertible into common stock, or the effect, if any, that future issuances and sales of our common stock will have on the market price of our common stock. Sales of substantial amounts of our common stock (including any shares issued in connection with an acquisition), or the perception that such sales could occur, may adversely affect prevailing market prices for our common stock.
Each of WildHorse Holdings, Esquisto Holdings, Acquisition Co. Holdings and NGP XI are party to a registration rights agreement, which requires us to effect the registration of its shares in certain circumstances.
50
We filed a registration statement with the SEC on Form S-8 providing for the registration of 9,512,500 shares of our common stock issued or reserved for issuance under our WildHorse Resource Development Corporation 2016 Long Term Incentive Plan. Subject to the satisfaction of vesting conditions and the expiration of lock-up agreements, shares registered under our registration statement on Form S-8 are available for resale immediately in the public market without restriction.
Our amended and restated certificate of incorporation and amended and restated bylaws, as well as Delaware law, contain provisions that could discourage acquisition bids or merger proposals, which may adversely affect the market price of our common stock and could deprive our investors of the opportunity to receive a premium for their shares.
Our amended and restated certificate of incorporation authorizes our board of directors, without stockholder approval, to issue preferred stock in one or more series, designate the number of shares constituting any series, and fix the rights, preferences, privileges and restrictions thereof, including dividend rights, voting rights, rights and terms of redemption, redemption price or prices and liquidation preferences of such series. If our board of directors elects to issue preferred stock, the terms of such stock could cause it to be more difficult for a third party to acquire us. In addition, some provisions of our amended and restated certificate of incorporation and amended and restated bylaws could make it more difficult for a third party to acquire control of us, even if the change of control would be beneficial to our stockholders. These provisions include:
|
|
• |
the Sponsor Group no longer collectively own or control the voting of more than 50% of our outstanding common stock: |
|
|
o |
dividing our board of directors into three classes of directors, with each class serving a staggered three-year term; |
|
|
o |
providing that all vacancies, including newly created directorships, may, except as otherwise required by law or, if applicable, subject to the rights of holders of a series of preferred stock, only be filled by the affirmative vote of a majority of directors then in office, even if less than a quorum (prior to such time, vacancies may also be filled by stockholders holding a majority of the outstanding shares); |
|
|
o |
permitting any action by stockholders to be taken only at an annual meeting or special meeting rather than by a written consent of the stockholders, subject to the rights of any series of preferred stock with respect to such rights; |
|
|
o |
permitting special meetings of our stockholders to be called only by our board of directors pursuant to a resolution adopted by the affirmative vote of a majority of the total number of authorized directors, whether or not there exist any vacancies in previously authorized directorships (prior to such time, a special meeting may also be called at the request of stockholders holding a majority of the outstanding shares entitled to vote); and |
|
|
o |
requiring the affirmative vote of the holders of at least 75% in voting power of all then outstanding common stock entitled to vote generally in the election of directors, voting together as a single class, to remove any or all of the directors from office at any time, and directors will be removable only for “cause;” |
|
|
• |
prohibiting cumulative voting in the election of directors; |
|
|
• |
establishing advance notice provisions for stockholder proposals and nominations for elections to the board of directors to be acted upon at meetings of stockholders; and |
|
|
• |
providing that the board of directors is expressly authorized to adopt, or to alter or repeal our bylaws. |
We have engaged in transactions with our affiliates and expect to do so in the future. The terms of such transactions and the resolution of any conflicts that may arise may not always be in our or our stockholders’ best interests.
We have engaged in transactions and expect to continue to engage in transactions with affiliated companies. The resolution of any conflicts that may arise in connection with any related party transactions that we have entered into with NGP, WildHorse Holdings, Esquisto Holdings, Acquisition Co. Holdings or their affiliates, including pricing, duration or other terms of service, may not always be in our or our stockholders’ best interests because NGP may have the ability to influence the outcome of these conflicts. For a discussion of potential conflicts, please read “—NGP has the ability to direct the voting of a majority of our common stock, and its interests may conflict with those of our other stockholders.”
We may issue preferred stock, the terms of which could adversely affect the voting power or value of our common stock.
Our amended and restated certificate of incorporation authorizes us to issue, without the approval of our stockholders, one or more classes or series of preferred stock having such designations, preferences, limitations and relative rights, including preferences over our common stock respecting dividends and distributions, as our board of directors may determine. The terms of one or more classes or series of preferred stock could adversely impact the voting power or value of our common stock. For example, we might grant holders of preferred stock the right to elect some number of our directors in all events or on the happening of specified events or
51
the right to veto specified transactions. Similarly, the repurchase or redemption rights or liquidation preferences we might assign to holders of preferred stock could affect the residual value of the common stock.
For as long as we are an emerging growth company, we will not be required to comply with certain reporting requirements, including those relating to accounting standards and disclosure about our executive compensation, that apply to other public companies.
We are classified as an “emerging growth company” under the JOBS Act. For as long as we are an emerging growth company, which may be up to five full fiscal years, unlike other public companies, we will not be required to, among other things: (i) provide an auditor’s attestation report on management’s assessment of the effectiveness of our system of internal control over financial reporting pursuant to Section 404(b) of the Sarbanes-Oxley Act; (ii) comply with any new requirements adopted by the PCAOB requiring mandatory audit firm rotation or a supplement to the auditor’s report in which the auditor would be required to provide additional information about the audit and the financial statements of the issuer; (iii) provide certain disclosures regarding executive compensation required of larger public companies; or (iv) hold nonbinding advisory votes on executive compensation. We will remain an emerging growth company for up to five years, although we will lose that status sooner if we have more than $1.0 billion of revenues in a fiscal year, have more than $700.0 million in market value of our common stock held by non-affiliates, or issue more than $1.0 billion of non-convertible debt over a three-year period.
To the extent that we rely on any of the exemptions available to emerging growth companies, you will receive less information about our executive compensation and internal control over financial reporting than issuers that are not emerging growth companies. If some investors find our common stock to be less attractive as a result, there may be a less active trading market for our common stock and our stock price may be more volatile.
The requirements of being a public company, including compliance with the reporting requirements of the Exchange Act and the requirements of the Sarbanes-Oxley Act, may strain our resources, increase our costs and distract management, and we may be unable to comply with these requirements in a timely or cost-effective manner.
As a public company, we are required to comply with new laws, regulations and requirements, certain corporate governance provisions of the Sarbanes-Oxley Act, related regulations of the SEC and the requirements of the NYSE, which we were not required to comply with as a private company. We expect efforts to comply with these statutes, regulations and requirements may occupy a significant amount of time of our board of directors and management and may significantly increase our costs and expenses. As a public company, we are required to:
|
|
• |
institute a more comprehensive compliance function; |
|
|
• |
comply with stock exchange rules; |
|
|
• |
continue to prepare and distribute periodic public reports in compliance with our obligations under the federal securities laws; |
|
|
• |
establish new internal policies, such as those relating to insider trading; and |
|
|
• |
involve and retain to a greater degree outside counsel and accountants in the above activities. |
Furthermore, while we generally must comply with Section 404 of the Sarbanes Oxley Act for our fiscal year ending December 31, 2017, we are not required to have our independent registered public accounting firm attest to the effectiveness of our internal controls until our first annual report subsequent to our ceasing to be an “emerging growth company” within the meaning of Section 2(a)(19) of the Securities Act. Accordingly, we may not be required to have our independent registered public accounting firm attest to the effectiveness of our internal controls until as late as our annual report for the fiscal year ending December 31, 2022. Once it is required to do so, our independent registered public accounting firm may issue a report that is adverse in the event it is not satisfied with the level at which our controls are documented, designed, operated or reviewed. Compliance with these requirements may strain our resources, increase our costs and distract management, and we may be unable to comply with these requirements in a timely or cost-effective manner.
In addition, being a public company subject to these rules and regulations makes it more difficult and more expensive for us to obtain director and officer liability insurance, and we may be required to accept reduced policy limits and coverage or incur substantially higher costs to obtain the same or similar coverage. As a result, it may be more difficult for us to attract and retain qualified individuals to serve on our board of directors or as executive officers. We are currently evaluating these rules, and we cannot predict or estimate the amount of additional costs we may incur or the timing of such costs.
52
Our amended and restated certificate of incorporation designates the Court of Chancery of the State of Delaware as the sole and exclusive forum for certain types of actions and proceedings that may be initiated by our stockholders, which could limit our stockholders’ ability to obtain a favorable judicial forum for disputes with us or our directors, officers, employees or agents.
Our amended and restated certificate of incorporation provides that, unless we consent in writing to the selection of an alternative forum, the Court of Chancery of the State of Delaware will, to the fullest extent permitted by applicable law, be the sole and exclusive forum for (i) any derivative action or proceeding brought on our behalf, (ii) any action asserting a claim of breach of a fiduciary duty owed by any of our directors, officers, employees or agents to us or our stockholders, (iii) any action asserting a claim arising pursuant to any provision of the Delaware General Corporation Law, our amended and restated certificate of incorporation or our bylaws, or (iv) any action asserting a claim against us that is governed by the internal affairs doctrine, in each such case subject to such Court of Chancery having personal jurisdiction over the indispensable parties named as defendants therein. Any person or entity purchasing or otherwise acquiring any interest in shares of our capital stock will be deemed to have notice of, and consented to, the provisions of our amended and restated certificate of incorporation described in the preceding sentence. This choice of forum provision may limit a stockholder’s ability to bring a claim in a judicial forum that it finds favorable for disputes with us or our directors, officers, employees or agents, which may discourage such lawsuits against us and such persons. Alternatively, if a court were to find these provisions of our amended and restated certificate of incorporation inapplicable to, or unenforceable in respect of, one or more of the specified types of actions or proceedings, we may incur additional costs associated with resolving such matters in other jurisdictions, which could adversely affect our business, financial condition or results of operations.
If we fail to develop or maintain an effective system of internal controls, we may not be able to accurately report our financial results or prevent fraud. As a result, current and potential stockholders could lose confidence in our financial reporting, which would harm our business and the trading price of our common stock.
Effective internal controls are necessary for us to provide reliable financial reports, prevent fraud and operate successfully as a public company. If we cannot provide reliable financial reports or prevent fraud, our reputation and operating results would be harmed. We cannot be certain that our efforts to develop and maintain our internal controls will be successful, that we will be able to maintain adequate controls over our financial processes and reporting in the future or that we will be able to comply with our obligations under Section 404 of the Sarbanes Oxley Act. Any failure to develop or maintain effective internal controls, or difficulties encountered in implementing or improving our internal controls, could harm our operating results or cause us to fail to meet our reporting obligations. Ineffective internal controls could also cause investors to lose confidence in our reported financial information, which may have a negative effect on the trading price of our common stock
ITEM 1B. UNRESOLVED STAFF COMMENTS
None.
Information regarding our properties is contained in Item 1. “Business” and Item 7. “Management’s Discussion and Analysis of Financial Condition and Results of Operations —Results of Operations” contained herein.
As part of our normal business activities, we may be named as defendants in litigation and legal proceedings, including those arising from regulatory and environmental matters. If we determine that a negative outcome is and the amount of loss is reasonably estimable, we accrue the estimated amount. We are not aware of any litigation, pending or threatened, that we believe will have a material adverse effect on our financial position, results of operations or cash flows. No amounts have been accrued at December 31, 2016.
ITEM 4. MINE SAFETY DISCLOSURES
Not applicable.
53
ITEM 5. MARKET FOR REGISTRANT’S COMMON EQUITY, RELATED STOCKHOLDER MATTERS AND ISSUER PURCHASES OF EQUITY SECURITIES
Market Information
Our common stock began trading on the NYSE under the symbol “WRD” on December 14, 2016. Prior to that, there was no public market for our common stock. As of March 16, 2017, we had approximately 93,987,541 shares of common stock outstanding and 3 stockholders of record. The following table sets forth, for the periods indicated, the reported high and low sale prices for our common stock on the NYSE.
|
|
|
Common Share Price Range |
|
|||||
|
|
|
High |
|
|
Low |
|
||
|
2016 |
|
|
|
|
|
|
|
|
|
4th Quarter (beginning December 14, 2016) |
|
$ |
15.06 |
|
|
$ |
14.40 |
|
|
3rd Quarter |
|
n/a |
|
|
n/a |
|
||
|
2nd Quarter |
|
n/a |
|
|
n/a |
|
||
|
1st Quarter |
|
n/a |
|
|
n/a |
|
||
Dividend Policy
Since our initial public offering, we have not declared any dividends and we do not anticipate declaring or providing any cash dividends to holders of our common stock in the foreseeable future. We currently intend to retain all future earnings, if any, for use in the operation of our business and to fund future growth. The decision whether to pay dividends in the future will be made by our Board in light of conditions then existing, including factors such as our financial condition, earnings, available cash, business opportunities, legal requirements, restrictions in our debt agreements, and other contracts and other factors our Board deems relevant.
Securities Authorized for Issuance Under Equity Compensation Plans
The following table summarizes information about our equity compensation plans as of December 31, 2016:
|
Plan Category |
|
Number of securities to be issued upon exercise of outstanding options, warrants and rights |
|
|
Weighted-average exercise price of outstanding options, warrants and rights |
|
|
Number of securities remaining available for future issuance under equity compensation plans |
|
|||
|
Equity compensation plans not approved by security holders (1) |
|
|
— |
|
|
$ |
— |
|
|
|
9,159,166 |
|
|
|
(1) |
The WildHorse Resource Development Corporation 2016 Long-Term Incentive Plan was adopted in November 2016 in connection with the completion of our initial public offering. |
Common Units Authorized for Issuance Under Equity Compensation Plan
See Item 12. “Security Ownership of Certain Beneficial Owners and Management and Related Stockholder Matters” for information regarding securities authorized for issuance under equity compensation plans.
Issuer Purchases of Equity Securities
During the three months ended December 31, 2016, there was no repurchases of our common shares.
Comparative Stock Performance
The following stock price performance graph is intended to allow review of stockholder returns, expressed in terms of the appreciation of the Company’s common stock relative to two broad-based stock performance indices. The information is included for historical comparative purposes only and should not be considered indicative of future stock performance. The stock performance graph and related information shall not be deemed “soliciting material” or to be “filed” with the SEC, nor shall information be
54
incorporated by reference into any future filing under the Securities Act or Exchange Act, except to the extent that the Company specifically incorporates it by reference into such filing.
The performance graph shown below compares the total return to stockholders on WRD’s common stock as compared to the total returns on the Standard and Poor’s 500 Index (“S&P 500 Index”) and the Standard and Poor’s 500 Oil and Gas Exploration and Production Select Index (“S&P Oil and Gas E&P Select Index”) from December 14, 2016 through December 31, 2016. The comparison was prepared based upon the following assumptions:
|
|
1. |
$100 was invested on December 14, 2016 in each of the following: common stock of WRD, the S&P 500 Index and the S&P Oil and Gas E&P Select Index. |
|
|
2. |
Dividends are reinvested. |
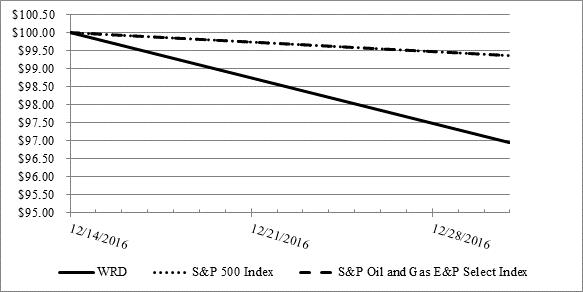
|
Investment |
|
December 14, 2016 |
|
|
December 31, 2016 |
|
||
|
WRD |
|
$ |
100.00 |
|
|
$ |
96.95 |
|
|
S&P 500 Index |
|
$ |
100.00 |
|
|
$ |
99.36 |
|
|
S&P Oil and Gas E&P Select Index |
|
$ |
100.00 |
|
|
$ |
99.36 |
|
ITEM 6. SELECTED FINANCIAL DATA
The following selected financial data should be read in conjunction with “Item 7. Management’s Discussion and Analysis of Financial Condition and Results of Operations” and “Item 8. Financial Statements and Supplementary Data,” both contained herein.
Basis of Presentation. The selected financial data of our predecessor was retrospectively recast due to common control considerations. Because WHR II, Esquisto and Acquisition Co. were under the common control of NGP, the sale and contribution of the respective ownership interests were accounted for as a combination of entities under common control, whereby the assets and liabilities sold and contributed were recorded based on historical cost. As such, the selected financial data presented below (i) (a) as of, and for the year ended, December 31, 2016, and (b) as of December 31, 2015, and for the period from February 17, 2015 (the inception of common control) to December 31, 2015, have been derived from the combined financial position and results attributable to our predecessor and Esquisto for periods prior to our initial public offering and (ii) (a) for the period from January 1, 2015 to February 16, 2015, and (b) as of, and for the year ended December 31, 2014, have been derived from the combined financial position and results attributable to our predecessor. Furthermore, the results of Acquisition Co. are reflected in the financial data presented herein beginning on December 19, 2016. For periods after the completion of our initial public offering, our consolidated financial statements include our accounts and those of our subsidiaries in which we have a controlling interest.
Comparability of the information reflected in selected financial data. The comparability of the results of operations among the periods presented is impacted by the following:
|
|
• |
combining the financial position and results of operations of Esquisto with the predecessor beginning February 17, 2015; |
55
|
|
• |
public company expenses incurred in connection with our initial public offering and the Corporate Reorganization; and |
|
|
• |
Esquisto’s third-party acquisition of certain oil and natural gas producing properties, undeveloped acreage and water assets located in the Eagle Ford in July 2015 for a purchase price of $103.0 million, net of customary post-closing adjustments. |
As a result of the factors listed above, the consolidated and combined historical results of operations and period-to-period comparisons of these results and certain financial data may not be comparable or indicative of future results.
|
|
|
For the Year Ended December 31, |
|
|||||||||
|
|
|
2016 |
|
|
2015 |
|
|
2014 |
|
|||
|
|
|
(In thousands, except per share data) |
|
|||||||||
|
Revenues: |
|
|
|
|
|
|
|
|
|
|
|
|
|
Oil sales |
|
$ |
75,938 |
|
|
$ |
42,971 |
|
|
$ |
2,780 |
|
|
Natural gas sales |
|
|
43,487 |
|
|
|
38,665 |
|
|
|
41,694 |
|
|
NGL sales |
|
|
5,786 |
|
|
|
4,295 |
|
|
|
989 |
|
|
Other income |
|
|
2,131 |
|
|
|
404 |
|
|
|
— |
|
|
Total revenues |
|
|
127,342 |
|
|
|
86,335 |
|
|
|
45,463 |
|
|
Operating expenses: |
|
|
|
|
|
|
|
|
|
|
|
|
|
Lease operating expenses |
|
|
12,320 |
|
|
|
14,053 |
|
|
|
9,428 |
|
|
Gathering, processing and transportation |
|
|
6,581 |
|
|
|
5,300 |
|
|
|
3,953 |
|
|
Gathering system operating expense |
|
|
99 |
|
|
|
914 |
|
|
|
— |
|
|
Taxes other than income tax |
|
|
6,814 |
|
|
|
5,510 |
|
|
|
2,584 |
|
|
Cost of oil sales |
|
|
— |
|
|
|
— |
|
|
|
687 |
|
|
Depreciation, depletion and amortization |
|
|
81,757 |
|
|
|
56,244 |
|
|
|
15,297 |
|
|
Impairment of proved oil and gas properties |
|
|
— |
|
|
|
9,312 |
|
|
|
24,721 |
|
|
General and administrative expenses |
|
|
23,973 |
|
|
|
15,903 |
|
|
|
5,838 |
|
|
Exploration expense |
|
|
12,026 |
|
|
|
18,299 |
|
|
|
1,597 |
|
|
Total operating expenses |
|
|
143,570 |
|
|
|
125,535 |
|
|
|
64,105 |
|
|
Income (loss) from operations |
|
|
(16,228 |
) |
|
|
(39,200 |
) |
|
|
(18,642 |
) |
|
Other income (expense): |
|
|
|
|
|
|
|
|
|
|
|
|
|
Interest expense |
|
|
(7,834 |
) |
|
|
(6,943 |
) |
|
|
(2,680 |
) |
|
Debt extinguishment costs |
|
|
(1,667 |
) |
|
|
— |
|
|
|
— |
|
|
Gain (loss) on derivative instruments |
|
|
(26,771 |
) |
|
|
13,854 |
|
|
|
6,514 |
|
|
Other income (expense) |
|
|
(151 |
) |
|
|
(147 |
) |
|
|
213 |
|
|
Total other income (expense) |
|
|
(36,423 |
) |
|
|
6,764 |
|
|
|
4,047 |
|
|
Income (loss) before income taxes |
|
|
(52,651 |
) |
|
|
(32,436 |
) |
|
|
(14,595 |
) |
|
Income tax benefit (expense) |
|
|
5,575 |
|
|
|
(604 |
) |
|
|
158 |
|
|
Net income (loss) |
|
$ |
(47,076 |
) |
|
$ |
(33,040 |
) |
|
$ |
(14,437 |
) |
|
Net income (loss) allocated to previous owners |
|
|
(2,681 |
) |
|
|
(3,085 |
) |
|
|
— |
|
|
Net income (loss) allocated to predecessor |
|
|
(33,998 |
) |
|
|
(29,955 |
) |
|
|
(14,437 |
) |
|
Net income (loss) available to WildHorse Resources |
|
$ |
(10,397 |
) |
|
$ |
— |
|
|
$ |
— |
|
|
Net income (loss) per common share: |
|
|
|
|
|
|
|
|
|
|
|
|
|
Basic and diluted |
|
$ |
(0.11 |
) |
|
n/a |
|
|
n/a |
|
||
|
Weighted-average common shares outstanding: |
|
|
|
|
|
|
|
|
|
|
|
|
|
Basic and diluted |
|
|
91,327 |
|
|
n/a |
|
|
n/a |
|
||
|
Cash Flow Data: |
|
|
|
|
|
|
|
|
|
|
|
|
|
Net cash provided by (used in) operating activities |
|
$ |
22,262 |
|
|
$ |
50,096 |
|
|
$ |
25,660 |
|
|
Net cash used in investing activities |
|
$ |
(567,545 |
) |
|
$ |
(443,639 |
) |
|
$ |
(128,967 |
) |
|
Net cash provided by financing activities |
|
$ |
505,272 |
|
|
$ |
424,481 |
|
|
$ |
114,589 |
|
|
Other Financial Data: |
|
|
|
|
|
|
|
|
|
|
|
|
|
Adjusted EBITDAX (1) |
|
$ |
84,317 |
|
|
$ |
55,858 |
|
|
$ |
21,277 |
|
|
Balance Sheet Data (at period end): |
|
|
|
|
|
|
|
|
|
|
|
|
|
Cash and cash equivalents |
|
$ |
3,115 |
|
|
$ |
43,126 |
|
|
$ |
12,188 |
|
|
Total assets |
|
$ |
1,442,281 |
|
|
$ |
966,365 |
|
|
$ |
335,722 |
|
|
Total liabilities |
|
$ |
434,393 |
|
|
$ |
317,676 |
|
|
$ |
156,731 |
|
|
Predecessor and Previous owner equity |
|
$ |
— |
|
|
$ |
648,689 |
|
|
$ |
178,992 |
|
|
Stockholders' equity |
|
$ |
1,007,888 |
|
|
n/a |
|
|
n/a |
|
||
|
Total liabilities and stockholders’ equity |
|
$ |
1,442,281 |
|
|
$ |
966,365 |
|
|
$ |
335,722 |
|
|
|
(1) |
Adjusted EBITDAX is a non-GAAP financial measure. For a definition of Adjusted EBITDAX and a reconciliation of Adjusted EBITDAX to net (loss) income, see “Item 7. Management’s Discussion and Analysis of Financial Condition and Results of Operations—Results of Operations—Adjusted EBITDAX.” |
56
ITEM 7. MANAGEMENT’S DISCUSSION AND ANALYSIS OF FINANCIAL CONDITION AND RESULTS OF OPERATIONS
Management’s Discussion and Analysis of Financial Condition and Results of Operations should be read in conjunction with the financial statements and related notes in “Item 8. Financial Statements and Supplementary Data” contained herein. The following discussion contains forward-looking statements that reflect our future plans, estimates, beliefs and expected performance. The forward-looking statements are dependent upon events, risks and uncertainties that may be outside our control. Our actual results could differ materially from those discussed in these forward-looking statements. Factors that could cause or contribute to such differences include, but are not limited to, market prices for oil, natural gas and NGLs, production volumes, estimates of proved reserves, capital expenditures, economic and competitive conditions, drilling results, regulatory changes and other uncertainties, as well as those factors discussed in “Risk Factors” contained in Part I—Item 1A of this Annual Report and “Cautionary Statement Regarding Forward-Looking Statements”. In light of these risks, uncertainties and assumptions, the forward-looking events discussed may not occur. We do not undertake any obligation to publicly update any forward-looking statements except as otherwise required by applicable law.
Overview
We were incorporated under the laws of the State of Delaware in August 2016 to become a holding company for the assets and operations of WHR II and Esquisto. With equity commitments from affiliates of NGP and its Management Members, WHR II was founded in June 2013 and Esquisto was founded in June 2014.
Contemporaneously with our initial public offering, (i) the owners of WHR II exchanged all of their interests in WHR II for equivalent interests in WildHorse Investment Holdings and the current owners of Esquisto exchanged all of their interests in Esquisto for equivalent interests in Esquisto Investment Holdings, (ii) WildHorse Investment Holdings contributed all of the interests in WHR II to WildHorse Holdings, Esquisto Investment Holdings contributed all of the interests in Esquisto to Esquisto Holdings and the former owner of Acquisition Co. contributed all of its interests in Acquisition Co. to Acquisition Co. Holdings, (iii) WildHorse Holdings, Esquisto Holdings and Acquisition Co. Holdings issued management incentive units to certain of our officers and employees as described in this Annual Report and (iv) WildHorse Holdings, Esquisto Holdings and Acquisition Co. Holdings contributed all of the interests in WHR II, Esquisto and Acquisition Co., respectively, to us in exchange for shares of our common stock. We refer to these reorganization transactions as the “Corporate Reorganization.” As a result of the Corporate Reorganization, WHR II, Esquisto and Acquisition Co. became direct, wholly owned subsidiaries of WildHorse Resource Development Corporation.
Outlook
Our financial position and future prospects, including our revenues, operating results, profitability, liquidity, future growth and the value of our assets, depend primarily on prevailing commodity prices. The oil and natural gas industry is cyclical and commodity prices are highly volatile. During 2015 and the first half of 2016, the global oil supply continued to outpace demand, resulting in a decline in realized prices for oil production. In general, this imbalance between supply and demand reflects the significant supply growth achieved in the United States as a result of shale drilling and oil production increases by certain other countries, including Russia and Saudi Arabia, as part of an effort to retain market share, combined with only modest demand growth in the United States and less-than-expected demand in other parts of the world, particularly in Europe and China. Starting in 2014 and continuing into 2016, commodity prices dropped significantly, with the West Texas Intermediate posted price declining from $108 per Bbl in June 2014 to approximately $26 per Bbl in January 2016 and the Henry Hub spot market price declining from over $8 per MMBtu in February 2014 to less than $2 per MMBtu in March 2016. NGL prices have also suffered significant declines. A combination of oversupply from production growth and weaker demand due to weak economic activity and increased efficiency has contributed to the falling prices.
The U.S. Energy Information Administration’s, or EIA’s, February 2017 Short-Term Energy Outlook forecasts that Brent crude oil prices will average $55 per Bbl in 2017 and $58 per Bbl in 2018. North Sea Brent crude oil spot prices averaged $55 per Bbl in January 2017; an increase of $24 per Bbl from the January 2016 average and the highest monthly average since July 2015. World crude oil supply grew an estimated 0.8 MMbbl/d and global oil inventory draws will average 0.1 MMbbl/d and 0.2 MMbbl/d in 2017 and 2018, respectively. Like Brent crude oil prices, WTI prices have increased. The EIA expects WTI crude oil prices to average $1 per Bbl lower than Brent in 2017.
The EIA expects that natural gas production will increase by 1.3 Bcf/d in 2017 compared to 2016. Production is expected to increase by an additional 4.1 Bcf/d in 2018. The EIA expects increased capacity for natural gas-fired electric generation, growing domestic natural gas consumption and new export capabilities will cause the Henry Hub natural gas spot price to rise from a projected average of $3.43 per MMBtu in 2017 to $3.70 per MMBtu in 2018.
57
We established a full year 2017 drilling and completion capital expenditure budget that is $450 million to $600 million. In our North Louisiana Acreage, we recommenced drilling by adding one rig in late 2016 and intend to add one additional drilling rig in 2017. In our Eagle Ford Acreage, we are currently running a five-rig program and intend to remain at five rigs in 2017. We expect to fund our 2017 development from cash flows from operations, borrowings under our revolving credit facility and from proceeds received from our 2025 Senior Notes offering. See “Part I, Item 1. Business—Recent Developments” for additional information regarding our 2025 Senior Notes.
Lower oil, natural gas and NGL prices not only reduce our revenues and cash flows, but also may limit the amount of oil, natural gas and NGLs that we can produce economically and therefore potentially lower our reserves. Lower commodity prices in the future could also result in impairments of our oil and natural gas properties and may also reduce the borrowing base under our revolving credit facility, which will be determined by the lenders, in their sole discretion, based upon projected revenues from our oil, natural gas and NGL properties and our commodity derivative contracts. The occurrence of any of the foregoing could materially and adversely affect our future business, financial condition, results of operations, operating cash flows, liquidity or ability to finance planned capital expenditures. Alternatively, higher oil, natural gas and NGL prices may result in significant non-cash fair value losses being incurred on our derivatives, which could cause us to experience net losses when oil and natural gas prices rise.
Sources of Our Revenues
Our revenues are derived from the sale of our oil and natural gas production, the sale of NGLs that are extracted from our natural gas during processing, and the gathering charge paid by certain third parties for their share of volumes that run through our gathering system. Production revenues are derived entirely from the continental United States. For the year ended December 31, 2016, we derived approximately 60% of our revenues from oil sales, 34% from natural gas sales, 5% from NGL sales and 2% from gathering charges.
Natural gas, NGL and oil prices are inherently volatile and are influenced by many factors outside our control. In order to reduce the impact of fluctuations in natural gas and oil prices on revenues, or to protect the economics of property acquisitions, we intend to periodically enter into derivative contracts with respect to a significant portion of estimated natural gas and oil production through various transactions that fix the future prices received. Our oil, natural gas and NGL revenues do not include the effects of derivatives.
Principal Components of Cost Structure
Costs associated with producing oil, natural gas and NGLs are substantial. Some of these costs vary with commodity prices, some trend with the type and volume of production, and others are a function of the number of wells we own. The sections below summarize the primary operating costs we typically incur.
|
|
• |
Lease Operating Expenses. Lease operating expenses (“LOE”) are the costs incurred in the operation of producing properties and workover costs. Expenses for utilities, direct labor, water injection and disposal, workover rigs and workover expenses, materials and supplies comprise the most significant portion of our LOE. Certain items, such as direct labor and materials and supplies, generally remain relatively fixed across broad production volume ranges, but can fluctuate depending on activities performed during a specific period. For instance, repairs to our pumping equipment or surface facilities result in increased LOE in periods during which they are performed. Certain of our operating cost components are variable and increase or decrease as the level of produced hydrocarbons and water increases or decreases. For example, we incur power costs in connection with various production-related activities, such as pumping to recover oil and natural gas and separation and treatment of water produced in connection with our oil and natural gas production. |
We monitor our operations to ensure that we are incurring LOE at an acceptable level. For example, we monitor our LOE per Boe to determine if any wells or properties should be shut in, recompleted or sold. This unit rate also allows us to monitor these costs in certain fields and geographic areas to identify trends and to benchmark against other producers. Although we strive to reduce our LOE, these expenses can increase or decrease on a per unit basis as a result of various factors as we operate our properties or make acquisitions and dispositions of properties. For example, we may increase field-level expenditures to optimize our operations, incurring higher expenses in one quarter relative to another, or we may acquire or dispose of properties that have different LOE per Boe. These initiatives would influence our overall operating cost and could cause fluctuations when comparing LOE on a period to period basis.
|
|
• |
Gathering, processing and transportation (“GP&T”). These are costs incurred to deliver production of our natural gas, NGLs and oil to the market. Cost levels of these expenses can vary based on the volume of natural gas, NGLs and oil produced as well as the cost of commodity processing. |
|
|
• |
Gathering System Operating Expense. Gathering system operating expenses include contract labor, water disposal, dehydration equipment rentals, chemical and facilities-related expenses and facility termination fees that are incurred in the operation of our North Louisiana gathering system. |
58
|
|
• |
Depreciation, Depletion and Amortization. Depreciation, depletion and amortization (“DD&A”) is the systematic expensing of the capitalized costs incurred to acquire and develop oil and natural gas properties. We use the successful efforts method of accounting for oil and natural gas activities and, as such, we capitalize all costs associated with our development and acquisition efforts and all successful exploration efforts, which are then allocated to each unit of production using the unit of production method. Please read “— Critical Accounting Policies and Estimates—Successful Efforts Method of Accounting for Oil and Natural Gas Activities” for further discussion. Our DD&A rate can fluctuate as a result of impairments, dispositions, finding and development costs and proved reserve volumes, which are all impacted by oil, natural gas and NGL prices. |
|
|
• |
Impairment Expense. We review our proved properties and unproved leasehold costs for impairment whenever events and changes in circumstances indicate that a decline in the recoverability of their carrying value may have occurred. Please read “—Critical Accounting Policies and Estimates—Impairment of Oil and Natural Gas Properties” for further discussion. |
|
|
• |
General and Administrative Expenses. General and administrative (“G&A”) expenses are costs incurred for overhead, including payroll and benefits for our corporate staff, costs of maintaining our headquarters, costs of managing our production and development operations, stock based compensation, public company expenses, IT expenses, audit and other fees for professional services, including legal compliance and acquisition-related expenses. |
|
|
• |
Exploration Expense. Exploration expense is geological and geophysical costs that include seismic surveying costs, costs of unsuccessful exploratory dry holes and lease abandonment and delay rentals. Exploration expense also includes rig standby and rig contract termination fees. |
|
|
• |
Incentive unit compensation expense. See “— Critical Accounting Policies and Estimates—Incentive Units,” contained herein for additional information. |
|
|
• |
Interest expense. We finance a portion of our working capital requirements and acquisitions with borrowings under revolving credit facilities and senior note issuances. As a result, we incur substantial interest expense that is affected by both fluctuations in interest rates and financing decisions. We expect to continue to incur significant interest expense as we continue to grow. Interest expense includes the amortization of debt issuance costs as well as the write-off of unamortized debt issuance costs. |
|
|
• |
Gain (loss) on derivative instruments. Net realized and unrealized gains on our derivatives are a function of fluctuations in the underlying commodity prices and the monthly settlement of the instruments. Given the volatility of commodity prices, it is not possible to predict future reported unrealized mark-to-market net gains or losses and the actual net gains or losses that will ultimately be realized upon settlement of the hedge positions in future years. If commodity prices at settlement are lower than the prices of the hedge positions, the hedges are expected to mitigate the otherwise negative effect on earnings of lower oil, natural gas and NGL prices. However, if commodity prices at settlement are higher than the prices of the hedge positions, the hedges are expected to dampen the otherwise positive effect on earnings of higher oil, natural gas and NGL prices and will, in this context, be viewed as having resulted in an opportunity cost. |
|
|
• |
Income tax expense. We are a corporation subject to federal and certain state income taxes. Prior to our initial public offering, we were primarily organized as pass-through entities for federal income tax purposes and were not subject to federal income taxes; however, one of our predecessor subsidiaries previously elected to be taxed as a corporation and was subject to federal and state income taxes. |
Critical Accounting Policies and Estimates
Use of Estimates in the Preparation of Financial Statements
Preparation of financial statements in conformity with GAAP requires management to make estimates and assumptions that affect reported amounts of assets and liabilities and disclosure of contingent assets and liabilities at the date of the financial statements, and the reported amounts of revenues and expenses during the reporting period. We base our estimates on historical
59
experience and various other assumptions that are believed to be reasonable under the circumstances, the results of which form the basis for making judgments about carrying values of assets and liabilities that are not readily apparent from other sources.
We evaluate the estimates and assumptions on a regular basis; however, actual results may differ from these estimates and assumptions used in the preparation of the financial statements. Significant estimates with regard to these financial statements include (1) the estimate of proved oil, gas and NGL reserves and related present value estimates of future net cash flows therefrom; (2) depreciation, depletion and amortization expense; (3) valuation of accounts receivable; (4) accrued capital expenditures and liabilities; (5) asset retirement obligations; (6) environmental remediation costs; (7) valuation of derivative instruments; (8) contingent liabilities and (9) impairment expense. Although management believes these estimates are reasonable, changes in facts and circumstances or discovery of new information may result in revised estimates, and such revisions could be material.
Successful Efforts Method of Accounting for Oil and Natural Gas Activities
We use the successful efforts method of accounting for natural gas and crude oil producing activities. Costs to acquire mineral interests in natural gas and crude oil properties are capitalized. Costs to drill and develop development wells and costs to drill and develop exploratory wells that find proved reserves are also capitalized. Costs to drill exploratory wells that do not find proved reserves, delay rentals and geological and geophysical costs are expensed.
Impairment of Oil and Natural Gas Properties
We acquire leases on acreage not associated with proved reserves or held by production with the expectation of ultimately assigning proved reserves and holding the leases with production. The costs of acquiring these leases, including primarily brokerage costs and amounts paid to lessors, are capitalized and excluded from current amortization pending evaluation. When proved reserves are assigned, the leasehold costs associated with those leases are depleted as producing oil and gas properties. Costs associated with leases not held by production are impaired when events and circumstances indicate that carrying value of the properties is not recoverable.
Capitalized costs of producing natural gas and crude oil properties and support equipment, net of estimated salvage values, are depleted by field using the units-of-production method. Well and well equipment and tangible property additions are depleted over proved developed reserves and leasehold costs are depleted over total proved reserves.
Proved oil and gas properties are reviewed for impairment when events and circumstances indicate a potential decline in the fair value of such properties below the carrying value, such as a downward revision of the reserve estimates or lower commodity prices. We estimate the undiscounted future cash flows expected in connection with the properties and compare such future cash flows to the carrying amounts of the properties to determine if the carrying amounts are recoverable. If the carrying value of the properties is determined to not be recoverable based on the undiscounted cash flows, an impairment charge is recognized by comparing the carrying value to the estimated fair value of the properties. The factors used to determine fair value include, but are not limited to, estimates of proved and probable reserves, future commodity prices, the timing of future production and capital expenditures and a discount rate commensurate with the risk reflective of the lives remaining for the respective oil and gas properties.
Oil and Natural Gas Reserve Quantities
The estimates of proved natural gas, crude oil and NGL reserves utilized in the preparation of the consolidated financial statements are estimated in accordance with guidelines established by the SEC and the Financial Accounting Standards Board (“FASB”), which require that reserve estimates be prepared under existing economic and operating conditions using a 12-month average price with no provision for price and cost escalations in future years except by contractual arrangements.
Our estimates of proved reserves are based on the quantities of oil, natural gas and NGLs, which, by analysis of geoscience and engineering data, can be estimated with reasonable certainty to be economically producible from a given date forward from known reservoirs under existing economic conditions, operating methods and government regulations prior to the time at which contracts providing the right to operate expire, unless evidence indicates that renewal is reasonably certain, regardless of whether deterministic or probabilistic methods are used for the estimation. Reserves and economic evaluation of all of our properties are prepared on a well-by-well basis. The accuracy of reserve estimates is a function of the:
|
|
• |
quality and quantity of available data; |
|
|
• |
interpretation of that data; |
|
|
• |
accuracy of various mandated economic assumptions; and |
|
|
• |
judgment of the independent reserve engineer. |
60
One of the most significant estimates we make is the estimate of oil, natural gas and NGL reserves. Oil, natural gas and NGL reserve estimates require significant judgments in the evaluation of all available geological, geophysical, engineering and economic data. The data for a given field may change substantially over time as a result of numerous factors including, but not limited to, additional development activity, production history, projected future production, economic assumptions relating to commodity prices, operating expenses, severance and other taxes, capital expenditures and remediation costs and these estimates are inherently uncertain. If estimates of proved reserves decline, our DD&A rate will increase, resulting in a decrease in net income. A decline in estimates of proved reserves could also cause us to perform an impairment analysis to determine if the carrying amount of oil and natural gas properties exceeds fair value and could result in an impairment charge, which would reduce earnings. We cannot predict what reserve revisions may be required in future periods.
We intend to have our independent reserve engineer audit our internally prepared reserve report as of December 31 for each year.
Depreciation, Depletion and Amortization
Our DD&A rate is dependent upon our estimates of total proved and proved developed reserves, which incorporate various assumptions and future projections. If our estimates of total proved or proved developed reserves decline, the rate at which we record DD&A expense increases, which in turn reduces our net income. Such a decline in reserves may result from lower commodity prices or other changes to reserve estimates, as discussed above, and we are unable to predict changes in reserve quantity estimates as such quantities are dependent on the success of our exploration and development program, as well as future economic conditions.
Derivative Instruments
We utilize commodity derivative instruments, including swaps and collars, to manage the price risk associated with the forecasted sale of our oil and natural gas production. A swap requires us to pay the counterparty if the settlement price exceeds the strike price and the same counterparty is required to pay us if the settlement price is less than the strike price. A collar requires us to pay the counterparty if the settlement price is above the ceiling price and requires the counterparty to pay us if the settlement price is below the floor price. The objective of our use of derivative financial instruments is to achieve more predictable cash flows in an environment of volatile oil, gas and NGL prices and to manage our exposure to commodity price risk. While the use of these derivative instruments limits the downside risk of adverse price movements, such use may also limit our ability to benefit from favorable price movements. We may, from time to time, add incremental derivatives to hedge additional production, restructure existing derivative contracts or enter into new transactions to modify the terms of current contracts in order to realize the current value of the our existing positions. We do not enter into derivative contracts for speculative purposes.
Our derivative instruments are not designated as hedges for accounting purposes. Accordingly, changes in fair value are recognized in our consolidated and combined statements of operations in the period of change. Gains and losses on derivatives and premiums paid for put options are included in cash flows from operating activities.
Our valuation estimate takes into consideration the counterparties’ credit worthiness, our credit worthiness, and the time value of money. The consideration of the factors results in an estimated exit-price for each derivative asset or liability under a market place participant’s view. We believe that this approach provides a reasonable, non-biased, verifiable, and consistent methodology for valuing commodity derivative instruments.
Accounting for Business Combinations
We account for all of our business combinations using the purchase method, which involves the use of significant judgment. Any excess or shortage of amounts assigned to assets and liabilities over or under the purchase price is recorded as a gain on bargain purchase or goodwill. The amount of goodwill or gain on bargain purchase recorded in any particular business combination can vary significantly depending upon the values attributed to assets acquired and liabilities assumed.
In estimating the fair values of assets acquired and liabilities assumed in a business combination, we make various assumptions. The most significant assumptions relate to the estimated fair values assigned to proved and unproved oil and gas properties. If sufficient market data is not available regarding the fair values of proved and unproved properties, we must prepare estimates. To estimate the fair values of these properties, we prepare estimates of oil, natural gas and NGL reserves. We estimate future prices to apply to the estimated reserves quantities acquired and estimate future operating and development costs to arrive at estimates of future net cash flows. For estimated proved reserves, the future net cash flows are discounted using a market-based weighted average cost of capital rate determined appropriate at the time of the acquisition. The market-based weighted average cost of capital rate is subjected to additional project-specific risking factors. To compensate for the inherent risk of estimating and valuing unproved reserves, when a discounted cash flow model is used, the discounted future net cash flows of probable and possible reserves are reduced by additional risk factors. In some instances, market comparable information of recent transactions is used to estimate fair value of unproved acreage.
61
Estimated fair values assigned to assets acquired can have a significant effect on results of operations in the future. A higher fair value assigned to a property results in higher DD&A expense, which results in lower net earnings. Fair values are based on estimates of future commodity prices, reserves quantities, operating expenses and development costs. This increases the likelihood of impairment if future commodity prices or reserves quantities are lower than those originally used to determine fair value, or if future operating expenses or development costs are higher than those originally used to determine fair value. Impairment would have no effect on cash flows but would result in a decrease in net income for the period in which the impairment is recorded.
Asset Retirement Obligations
Our asset retirement obligations (“ARO”) consist of estimated future costs associated with the plugging and abandonment of oil, natural gas and NGL wells, removal of equipment and facilities from leased acreage and land restoration in accordance with applicable local, state and federal laws. The fair value of an ARO liability is required to be recognized in the period in which it is incurred, with the associated asset retirement cost capitalized as part of the carrying cost of the oil and gas asset. The recognition of an ARO requires that management make numerous assumptions regarding such factors as the estimated probabilities, amounts and timing of settlements; the credit-adjusted risk-free discount rate to be used; inflation rates; and future advances in technology. In periods subsequent to the initial measurement of the ARO, we must recognize period-to-period changes in the liability resulting from the passage of time and revisions to either the timing or the amount of the original estimate of undiscounted cash flows. Increases in the ARO liability due to the passage of time, are recorded as accretion expense, which is a component of DD&A. The related capitalized cost, including revisions thereto, is charged to expense through DD&A over the life of the oil and gas property.
Revenue Recognition
Revenues from the sale of oil, natural gas and NGLs are recognized when the product is delivered at a fixed or determinable price, title has transferred, and collectability is reasonably assured and evidenced by a contract. We recognize revenues from the sale of oil, natural gas and NGLs using the sales method of accounting, whereby revenue is recorded based on our share of volume sold, regardless of whether we have taken our proportional share of volume produced. These differences result in gas imbalances. We record a liability to the extent there are not sufficient reserves to cover an over delivered gas imbalance. No receivables are recorded for those wells on which the Company has taken less than its proportionate share of production. We receive payment approximately one month after delivery for operated wells and up to three months after delivery for non-operated wells. At the end of each month, we estimate the amount of production delivered to purchasers and the price we will receive. Variances between our estimates and the actual amounts received are recorded in the month payment is received. A 10% change in our December 31, 2016, 2015 and 2014 revenue accrual would have impacted total operating revenues by approximately $1.7 million, $1.2 million and $0.8 million for the years ended December 31, 2016, 2015 and 2014, respectively.
Incentive Units
The governing documents of WHR II provided for the issuance of incentive units. WHR II granted incentive units to certain of its members who were key employees at the time of grant. Holders of incentive units would have been entitled to distributions ranging from 20% to 40% when declared, but only after cumulative distribution thresholds (payouts) had been achieved. Payouts were generally triggered after the recovery of specified members’ capital contributions plus a rate of return. The incentive units were being accounted for as liability-classified awards as achievement of the payout conditions required settlement of such awards by transferring cash to the incentive unit holder. Compensation cost was recognized only if the performance condition was probable of being satisfied at each reporting date. The payment likelihood related to the WHR II incentive units was not deemed probable for the year ended December 31, 2016, 2015 and 2014, respectively. As such, no compensation expense was recognized by our predecessor.
In connection with the Corporate Reorganization, the WHR II incentive units were transferred to WildHorse Investment Holdings in exchange for substantially similar incentive units in WildHorse Investment Holdings, which became responsible for making all payments, distributions and settlements relating to the exchanged incentive units. While any such payments, distributions and settlements will not involve any cash payments by us, we will recognize non-cash compensation expense within G&A expenses, which may be material, in the period in which the applicable performance conditions are probable of being satisfied. We will receive a deemed capital contribution with respect to such compensation expense.
In connection with the Corporate Reorganization, WildHorse Holdings, Esquisto Holdings and Acquisition Co. Holdings granted certain officers and employees awards of incentive units in WildHorse Holdings, Esquisto Holdings and Acquisition Co. Holdings. The WildHorse Holdings incentive units, Esquisto Holdings incentive units and Acquisition Co. Holdings incentive units will each vest in three equal annual installments beginning on the first anniversary of the applicable date of grant. The incentive units are entitled to a portion of future distributions by each of WildHorse Holdings, Esquisto Holdings and Acquisition Co. Holdings in excess of the value of our common stock held by each of WildHorse Holdings, Esquisto Holdings and Acquisition Co. Holdings based upon the initial public offering price of such common stock plus a 5% internal rate of return. WildHorse Holdings, Esquisto Holdings
62
and Acquisition Co. Holdings will be responsible for making all payments, distributions and settlements to all award recipients relating to the WildHorse Holdings incentive units, Esquisto Holdings incentive units and Acquisition Co. Holdings incentive units, respectively. While any such payments, distributions and settlements are not expected to involve any cash payment by us, we expect to recognize non-cash compensation expense within G&A expenses, which may be material, in the period in which the applicable performance conditions are probable of being satisfied. We will receive a deemed capital contribution with respect to such compensation expense.
Vesting of all incentive units is generally dependent upon an explicit service period, a fundamental change as defined in the respective governing document, and achievement of payout. All incentive units not vested are forfeited if an employee is no longer employed. All incentive units will be forfeited if a holder resigns whether the incentive units are vested or not. If the payouts have not yet occurred, then all incentive units, whether or not vested, will be forfeited automatically (unless extended).
Results of Operations
The selected financial data of our predecessor was retrospectively recast due to common control considerations. Because WHR II, Esquisto and Acquisition Co. were under the common control of NGP, the sale and contribution of the respective ownership interests were accounted for as a combination of entities under common control, whereby the assets and liabilities sold and contributed were recorded based on historical cost. As such, the results of operations presented below (i) (a) for the year ended December 31, 2016 and (b) for the period from February 17, 2015 (the inception of common control) to December 31, 2015 have been derived from the combined results attributable to our predecessor and Esquisto for periods prior to our initial public offering and (ii) (a) for the period from January 1, 2015 to February 16, 2015 and (b) for the year ended December 31, 2014 have been derived from the results attributable to our predecessor. Furthermore, the results of operations attributable to Acquisition Co. are reflected in the financial data presented herein beginning on December 19, 2016. For periods after the completion of our initial public offering, our consolidated financial statements include our accounts and those of our subsidiaries in which we have a controlling interest.
Factors Affecting the Comparability of the Combined Historical Financial Results
The comparability of the results of operations among the periods presented is impacted by the following significant transactions:
|
|
• |
combining the financial position and results of operations of Esquisto with the predecessor beginning February 17, 2015; |
|
|
• |
public company expenses incurred in connection with our initial public offering and the Corporate Reorganization; and |
|
|
• |
Esquisto’s third party acquisition of certain oil and natural gas producing properties, undeveloped acreage and water assets located in the Eagle Ford in July 2015 for a purchase price of $103.0 million, net of customary post-closing adjustments. |
As a result of the factors listed above, the combined historical results of operations and period-to-period comparisons of these results and certain financial data may not be comparable or indicative of future results.
63
The table below summarizes certain of the results of operations and period-to-period comparisons for the periods indicated.
|
|
|
For the Year Ended December 31, |
|
|||||||||
|
|
|
2016 |
|
|
2015 |
|
|
2014 |
|
|||
|
|
|
(In thousands, except per share data) |
|
|||||||||
|
Revenues: |
|
|
|
|
|
|
|
|
|
|
|
|
|
Oil sales |
|
$ |
75,938 |
|
|
$ |
42,971 |
|
|
$ |
2,780 |
|
|
Natural gas sales |
|
|
43,487 |
|
|
|
38,665 |
|
|
|
41,694 |
|
|
NGL sales |
|
|
5,786 |
|
|
|
4,295 |
|
|
|
989 |
|
|
Other income |
|
|
2,131 |
|
|
|
404 |
|
|
|
— |
|
|
Total revenues |
|
|
127,342 |
|
|
|
86,335 |
|
|
|
45,463 |
|
|
Operating expenses: |
|
|
|
|
|
|
|
|
|
|
|
|
|
Lease operating expenses |
|
|
12,320 |
|
|
|
14,053 |
|
|
|
9,428 |
|
|
Gathering, processing and transportation |
|
|
6,581 |
|
|
|
5,300 |
|
|
|
3,953 |
|
|
Gathering system operating expense |
|
|
99 |
|
|
|
914 |
|
|
|
— |
|
|
Taxes other than income tax |
|
|
6,814 |
|
|
|
5,510 |
|
|
|
2,584 |
|
|
Cost of oil sales |
|
|
— |
|
|
|
— |
|
|
|
687 |
|
|
Depreciation, depletion and amortization |
|
|
81,757 |
|
|
|
56,244 |
|
|
|
15,297 |
|
|
Impairment of proved oil and gas properties |
|
|
— |
|
|
|
9,312 |
|
|
|
24,721 |
|
|
General and administrative expenses |
|
|
23,973 |
|
|
|
15,903 |
|
|
|
5,838 |
|
|
Exploration expense |
|
|
12,026 |
|
|
|
18,299 |
|
|
|
1,597 |
|
|
Total operating expenses |
|
|
143,570 |
|
|
|
125,535 |
|
|
|
64,105 |
|
|
Income (loss) from operations |
|
|
(16,228 |
) |
|
|
(39,200 |
) |
|
|
(18,642 |
) |
|
Other income (expense): |
|
|
|
|
|
|
|
|
|
|
|
|
|
Interest expense |
|
|
(7,834 |
) |
|
|
(6,943 |
) |
|
|
(2,680 |
) |
|
Debt extinguishment costs |
|
|
(1,667 |
) |
|
|
— |
|
|
|
— |
|
|
Gain (loss) on derivative instruments |
|
|
(26,771 |
) |
|
|
13,854 |
|
|
|
6,514 |
|
|
Other income (expense) |
|
|
(151 |
) |
|
|
(147 |
) |
|
|
213 |
|
|
Total other income (expense) |
|
|
(36,423 |
) |
|
|
6,764 |
|
|
|
4,047 |
|
|
Income (loss) before income taxes |
|
|
(52,651 |
) |
|
|
(32,436 |
) |
|
|
(14,595 |
) |
|
Income tax benefit (expense) |
|
|
5,575 |
|
|
|
(604 |
) |
|
|
158 |
|
|
Net income (loss) |
|
|
(47,076 |
) |
|
|
(33,040 |
) |
|
|
(14,437 |
) |
|
Net income (loss) allocated to previous owners |
|
|
(2,681 |
) |
|
|
(3,085 |
) |
|
|
— |
|
|
Net income (loss) allocated to predecessor |
|
|
(33,998 |
) |
|
|
(29,955 |
) |
|
|
(14,437 |
) |
|
Net income (loss) available to WildHorse Resources |
|
$ |
(10,397 |
) |
|
$ |
— |
|
|
$ |
— |
|
|
Net income (loss) per common share: |
|
|
|
|
|
|
|
|
|
|
|
|
|
Basic and diluted |
|
$ |
(0.11 |
) |
|
n/a |
|
|
n/a |
|
||
|
Weighted-average common shares outstanding: |
|
|
|
|
|
|
|
|
|
|
|
|
|
Basic and diluted |
|
|
91,327 |
|
|
n/a |
|
|
n/a |
|
||
|
Oil and natural gas revenue: |
|
|
|
|
|
|
|
|
|
|
|
|
|
Natural gas |
|
$ |
43,487 |
|
|
$ |
38,665 |
|
|
$ |
41,694 |
|
|
Crude oil |
|
|
75,938 |
|
|
|
42,971 |
|
|
|
2,780 |
|
|
Natural gas liquids |
|
|
5,786 |
|
|
|
4,295 |
|
|
|
989 |
|
|
Total oil and natural gas revenue |
|
$ |
125,211 |
|
|
$ |
85,931 |
|
|
$ |
45,463 |
|
|
Production volumes: |
|
|
|
|
|
|
|
|
|
|
|
|
|
Natural gas (MMcf) |
|
|
17,820 |
|
|
|
14,847 |
|
|
|
9,388 |
|
|
Oil (MBbls) |
|
|
1,848 |
|
|
|
968 |
|
|
|
31 |
|
|
NGLs (MBbls) |
|
|
471 |
|
|
|
351 |
|
|
|
41 |
|
|
Total (MBoe) |
|
|
5,289 |
|
|
|
3,794 |
|
|
|
1,637 |
|
|
Average sales price: |
|
|
|
|
|
|
|
|
|
|
|
|
|
Natural gas (per Mcf) |
|
$ |
2.44 |
|
|
$ |
2.60 |
|
|
$ |
4.44 |
|
|
Oil (per Bbl) |
|
$ |
41.09 |
|
|
$ |
44.41 |
|
|
$ |
90.55 |
|
|
NGLs (per Bbl) |
|
$ |
12.28 |
|
|
$ |
12.22 |
|
|
$ |
23.89 |
|
|
Total (per Boe) |
|
$ |
23.67 |
|
|
$ |
22.65 |
|
|
$ |
27.78 |
|
|
Average production volumes: |
|
|
|
|
|
|
|
|
|
|
|
|
|
Natural gas (Mcf/d) |
|
|
48.7 |
|
|
|
40.7 |
|
|
|
25.7 |
|
|
Oil (Bbls/d) |
|
|
5.0 |
|
|
|
2.7 |
|
|
|
0.1 |
|
|
NGLs (Bbls/d) |
|
|
1.3 |
|
|
|
1.0 |
|
|
|
0.1 |
|
|
Average net production (Boe/d) |
|
|
14.5 |
|
|
|
10.4 |
|
|
|
4.5 |
|
|
Average unit costs per Boe: |
|
|
|
|
|
|
|
|
|
|
|
|
|
Lease operating expenses |
|
$ |
2.33 |
|
|
$ |
3.70 |
|
|
$ |
5.76 |
|
|
Gathering, processing and transportation |
|
$ |
1.24 |
|
|
$ |
1.40 |
|
|
$ |
2.42 |
|
|
Taxes other than income tax |
|
$ |
1.29 |
|
|
$ |
1.45 |
|
|
$ |
1.58 |
|
|
General and administrative expenses |
|
$ |
4.53 |
|
|
$ |
4.19 |
|
|
$ |
3.57 |
|
|
Depletion, depreciation and amortization |
|
$ |
15.46 |
|
|
$ |
14.82 |
|
|
$ |
9.35 |
|
64
Year Ended December 31, 2016 Compared to the Year Ended December 31, 2015
|
|
• |
Oil, natural gas and NGL revenues were $125.2 million for 2016 compared to $85.9 million for 2015, an increase of $39.3 million (approximately 46%). Production increased 1.5 MMBoe (approximately 40%) primarily due to increased production from drilling successful wells in the Eagle Ford. The average realized sales price increased $1.02 per Boe (approximately 5%) due to a higher percentage of oil in the production mix. A favorable oil production variance contributed to a $39.1 million increase in oil revenues offset by a $6.1 million decrease due to an unfavorable pricing variance. |
|
|
• |
LOE was $12.3 million and $14.1 million for 2016 and 2015, respectively. The decrease primarily is due to operational efficiencies, lower workover expense and lower service costs associated with industry-wide service cost decreases. On a per Boe basis, LOE was $2.33 and $3.70 for 2016 and 2015, respectively. The decrease was due to lower LOE and certain items, such as direct labor and materials and supplies, generally remaining relatively fixed across broad production volume ranges. |
|
|
• |
GP&T expenses were $6.6 million and $5.3 million for 2016 and 2015, respectively. The 24% increase in GP&T expenses is primarily attributable to an increase in production. On a per Boe basis, GP&T expenses were $1.24 and $1.40 for 2016 and 2015, respectively. The decrease is primarily due to an increase in production from drilling successful wells. |
|
|
• |
Taxes other than income tax were $6.8 million and $5.5 million for 2016 and 2015, respectively. The $1.3 million increase (approximately 24%) was primarily due to an increase in revenues associated with our oil and natural gas properties. On a per Boe basis, taxes other than income tax were $1.29 and $1.45 for 2016 and 2015, respectively. The 11% decrease was primarily due to severance tax exemptions on high cost horizontal wells. |
|
|
• |
DD&A expense for 2016 was $81.8 million compared to $56.2 million for 2015, a $25.6 million increase primarily due to an increase in production volumes related to drilling activities. Increased production volumes caused DD&A expense to increase by $22.2 million and the change in the DD&A rate between periods caused DD&A expense to increase by $3.4 million. |
|
|
• |
We did not record impairment expense in 2016 compared to $9.3 million for 2015. The 2015 impairments primarily related to certain non-core properties located in Texas and Louisiana. The estimated future cash flows expected from these properties were compared to their carrying values and determined to be unrecoverable primarily due to declining commodity prices. |
|
|
• |
G&A expenses were $24.0 million and $15.9 million for 2016 and 2015, respectively. Salaries and wages increased by $2.6 million primarily due to the successful completion of our initial public offering. Reduction in G&A reimbursements of $1.9 million associated with the termination of a management services agreement with a related party in February 2015 also contributed to the period-to-period increase in G&A expenses. We recorded approximately $1.0 million of initial public offering expenses during 2016. Esquisto recorded G&A expenses of $7.2 million during 2016 compared to $5.0 million from February 17, 2015 to December 31, 2015. During the year ended December 31, 2016, Esquisto accrued $4.0 million, as G&A expenses payable to its members compared to $3.6 million during the period from February 17, 2015 to December 31, 2015. Esquisto paid Petromax Operating Company, Inc. (“Petromax”), who was the operator of the majority of Esquisto’s wells, $1.3 million during the year ended December 31, 2016 and $0.9 million during the period from February 17, 2015 to December 31, 2015 for overhead charges on drilling and producing wells at market rates as set forth in joint operating agreements and in accordance with an operating agreement between Petromax and Esquisto. Esquisto also recorded $0.6 million of expenses related to our initial public offering during 2016. |
|
|
• |
Exploration expense was $12.0 million and $18.3 million for 2016 and 2015, respectively. The $6.3 million reduction in exploration expense was primarily due to a reduction in exploration dry hole costs of $7.2 million, a reduction in seismic acquisitions of $4.2 million, offset by $6.8 million in expenses associated with the early termination of a rig contract, which was laid down in March 2016 due to low commodity prices. |
|
|
• |
Interest expense was $7.8 million and $6.9 million for 2016 and 2015, respectively. The increase was due to an increase in the average debt outstanding. Interest is comprised of interest on our credit facilities and amortization of debt issue costs. |
|
|
• |
Debt extinguishment costs were $1.7 million in 2016 due to the write-off of unamortized debt issuance costs associated with the WHR II and Esquisto credit facilities that were terminated in connection with our initial public offering, Esquisto also retired and terminated their revolving credit facility and second lien in January 2016 in connection with the merger of Esquisto I and Esquisto II. There were no debt extinguishment costs in 2015. |
|
|
• |
Net losses on commodity derivatives of $26.8 million were recognized during 2016, of which $4.5 million was a realized gain and $31.3 million was an unrealized loss. During 2015, we recognized a $13.9 million gain on derivative instruments, of which $12.0 million was a realized gain and a $1.9 million was unrealized gain. |
65
|
|
the impact of pass-through entities and state income tax. The effective tax rate for 2015 differed from the federal statutory income tax rate primarily due the impact of pass-through entities and state income tax. |
Year Ended December 31, 2015 Compared to the Year Ended December 31, 2014
|
|
• |
Oil, natural gas and NGL revenues were $85.9 million for 2015 compared to $45.5 million for 2014, an increase of $40.4 million (approximately 88%). Production increased 2.2 MMBoe (approximately 132%) primarily due to combining the results of operations of Esquisto with our predecessor beginning February 17, 2015, third party acquisitions, and drilling activity. Oil, natural gas and NGL revenues attributable to Esquisto were $45.4 million from February 17, 2015 to December 31, 2015. The average realized sales price decreased $5.13 per Boe (approximately 19%) due to lower commodity prices. The favorable production variance contributed to an approximate $59.8 million increase in revenues and was offset by $19.4 million decrease due to the unfavorable pricing variances. |
|
|
• |
LOE was $14.1 million and $9.4 million for 2015 and 2014, respectively. The increase is primarily due to LOE associated with Esquisto’s July 2015 acquisition and increased water disposal charges related to our new wells. On a per Boe basis, LOE was $3.70 and $5.76 for 2015 and 2014, respectively. The decrease was primarily due to certain items, such as direct labor and materials and supplies, generally remaining relatively fixed across broad production volume ranges. |
|
|
• |
GP&T expenses were $5.3 million and $4.0 million for 2015 and 2014, respectively. The 33% increase was primarily due to an increase in production due to acquisitions and our drilling activities. On a per Boe basis, GP&T expenses were $1.40 and $2.41 for 2015 and 2016, respectively. The decrease is primarily due to an increase in production from acquisitions and drilling successful wells. |
|
|
• |
Taxes other than income tax were $5.5 million and $2.6 million for 2015 and 2014, respectively. The $2.9 million increase (approximately 113%) is primarily due to an increase in revenues associated with our oil and natural gas properties. On a per Boe basis, taxes other than income tax were $1.45 and $1.58 for 2015 and 2014, respectively. The 8% decrease was primarily due to severance tax exemptions on high cost horizontal wells. |
|
|
• |
DD&A expense for 2015 was $56.2 million compared to $15.3 million for 2014, a $40.9 million increase primarily due to combining the results of operations of Esquisto with our predecessor beginning February 17, 2015, increase in production volumes related to acquisitions, and drilling activities. DD&A expense attributable to Esquisto was $30.7 million from February 17, 2015 to December 31, 2015. Increased production volumes caused DD&A expense to increase by approximately $20.1 million and the change in the DD&A rate between periods caused DD&A expense to increase by approximately $20.8 million. |
|
|
• |
Impairment expense for 2015 was $9.3 million compared to $24.7 million for 2014. We impaired certain non-core properties in Texas and Louisiana. The estimated future cash flows expected from these properties were compared to their carrying values and determined to be unrecoverable primarily due to a decline in prices. |
|
|
• |
G&A expenses were $15.9 million and $5.8 million for 2015 and 2014, respectively. There was a reduction in G&A reimbursements of $4.3 million associated with the termination of a management services agreement with a related party in February 2015, a $1.2 million increase in salaries and wages, and a $0.7 million increase in rent expense. These increases were largely offset by a $2.1 million decrease in shared G&A costs billed to WHR II from an affiliate and $1.2 million decrease in acquisition related costs. Esquisto recorded G&A expenses of $5.0 million from February 17, 2015 to December 31, 2015. During this same period, Esquisto accrued $3.6 million, as G&A expenses payable to its members and paid Petromax $0.9 million for overhead charges on drilling and producing wells at market rates as set forth in joint operating agreements and in accordance with an operating agreement between Petromax and Esquisto. |
|
|
• |
Exploration expense was $18.3 million and $1.6 million for 2015 and 2014, respectively. Exploration expense for 2015 included $7.1 million of costs associated with drilling a dry well, $4.2 million of seismic surveying costs, $1.5 million of state lease delay rentals and a $4.5 million impairment of our unproved leasehold costs. |
|
|
• |
Interest expense was $6.9 million and $2.7 million for 2015 and 2016, respectively. The increase was due to an increase in the average debt outstanding. |
|
|
• |
Net gains on commodity derivatives of $13.9 million were recognized during 2015, of which $12.0 million was a realized gain in addition to an unrealized gain of $1.9 million. Net gains on commodity derivatives of $6.5 million were recognized during 2014, of which $2.7 million was a realized loss and $9.2 million was an unrealized gain. Net realized and unrealized gains on our derivatives are a function of fluctuations in the underlying commodity prices and the monthly settlement of the instruments. |
66
Adjusted EBITDAX
Adjusted EBITDAX is a supplemental non-GAAP financial performance measure that is used by management and external users of our financial statements, such as industry analysts, investors, lenders and rating agencies. We include in this Annual Report the non-GAAP financial measure Adjusted EBITDAX and provide our calculation of Adjusted EBITDAX. Adjusted EBITDAX is not a measure of net (loss) income as determined according to GAAP.
We define Adjusted EBITDAX as net income (loss):
Plus:
|
|
• |
Interest expense; |
|
|
• |
Income tax expense; |
|
|
• |
Depreciation, depletion and amortization (“DD&A”); |
|
|
• |
Exploration expense; |
|
|
• |
Impairment of proved oil and gas properties; |
|
|
• |
Loss on derivative instruments; |
|
|
• |
Cash settlements received on expired derivative instruments; |
|
|
• |
Stock-based compensation; |
|
|
• |
Incentive-based compensation expenses; |
|
|
• |
Acquisition related costs; |
|
|
• |
Debt extinguishment costs; |
|
|
• |
Loss on sale of properties; |
|
|
• |
Initial public offering costs; and |
|
|
• |
Other non-cash and non-routine operating items that we deem appropriate. |
Less:
|
|
• |
Interest income; |
|
|
• |
Income tax benefit; |
|
|
• |
Gain on derivative instruments; |
|
|
• |
Cash settlements paid on expired commodity derivative instruments; |
|
|
• |
Gain on sale of properties; and |
|
|
• |
Other non-cash and non-routine operating items that we deem appropriate. |
Management believes Adjusted EBITDAX is a useful performance measure because it allows them to more effectively evaluate our operating performance without regard to our financing methods or capital structure. We exclude the items listed above from net (loss) income in arriving at Adjusted EBITDAX because these amounts can vary substantially from company to company within our industry depending upon accounting methods and book values of assets, capital structures and the method by which the assets were acquired. Adjusted EBITDAX should not be considered as an alternative to, or more meaningful than, net (loss) income as determined in accordance with GAAP. Certain items excluded from Adjusted EBITDAX are significant components in understanding and assessing a company’s financial performance, such as a company’s cost of capital and tax structure, as well as the historic costs of depreciable assets, none of which are components of Adjusted EBITDAX. Our presentation of Adjusted EBITDAX should not be construed as an inference that our results will be unaffected by unusual or non-recurring items. Our computations of Adjusted EBITDAX may not be comparable to other similarly titled measures of other companies.
67
The following table presents a reconciliation of Adjusted EBITDAX to net (loss) income, our most directly comparable financial measure calculated and presented in accordance with GAAP.
|
|
|
For the Year Ended December 31, |
|
|||||||||
|
|
|
2016 |
|
|
2015 |
|
|
2014 |
|
|||
|
Adjusted EBITDAX reconciliation to net (loss) income: |
|
|
|
|
|
|
|
|
|
|
|
|
|
Net income (loss) |
|
$ |
(47,076 |
) |
|
$ |
(33,040 |
) |
|
$ |
(14,437 |
) |
|
Interest expense, net |
|
|
7,834 |
|
|
|
6,943 |
|
|
|
2,680 |
|
|
Income tax (benefit) expense |
|
|
(5,575 |
) |
|
|
604 |
|
|
|
(158 |
) |
|
Depreciation, depletion and amortization |
|
|
81,757 |
|
|
|
56,244 |
|
|
|
15,297 |
|
|
Exploration expense |
|
|
12,026 |
|
|
|
18,299 |
|
|
|
1,597 |
|
|
Impairment of proved oil and gas properties |
|
|
— |
|
|
|
9,312 |
|
|
|
24,721 |
|
|
(Gain) loss on derivative instruments |
|
|
26,771 |
|
|
|
(13,854 |
) |
|
|
(6,514 |
) |
|
Cash settlements received (paid) on derivative instruments |
|
|
4,975 |
|
|
|
11,517 |
|
|
|
(2,712 |
) |
|
Stock-based compensation |
|
|
68 |
|
|
|
— |
|
|
|
— |
|
|
Acquisition related costs |
|
|
553 |
|
|
|
593 |
|
|
|
1,450 |
|
|
(Gain) loss on sale of properties |
|
|
43 |
|
|
|
— |
|
|
|
— |
|
|
Debt extinguishment costs |
|
|
1,667 |
|
|
|
— |
|
|
|
— |
|
|
Initial public offering costs |
|
|
1,560 |
|
|
|
— |
|
|
|
— |
|
|
Non-cash liability amortization |
|
|
(286 |
) |
|
|
(760 |
) |
|
|
(647 |
) |
|
Total Adjusted EBITDAX |
|
$ |
84,317 |
|
|
$ |
55,858 |
|
|
$ |
21,277 |
|
Liquidity and Capital Resources
Our development and acquisition activities require us to make significant operating and capital expenditures. Our primary use of capital has been the acquisition and development of oil, natural gas and NGL properties and facilities. As we pursue reserve and production growth, we plan to monitor which capital resources, including equity and debt financings, are available to us to meet our future financial obligations, planned capital expenditure activities and liquidity requirements. Historically, WHR II’s and Esquisto’s primary sources of liquidity were capital contributions from their former owners, borrowings under their respective revolving credit facilities and second lien loans and cash generated by their operations.
Our future success in growing proved reserves and production will be highly dependent on the capital resources available to us. Our 2016 capital expenditures were $595.2 million, of which $581.8 million was allocated to Eagle Ford locations and $13.4 million to North Louisiana.
Based on our current oil and natural gas price expectations, we believe our cash flows provided by operating activities and availability under our revolving credit facility will provide us with the financial flexibility and wherewithal to meet our cash requirements, including normal operating needs, and pursue our currently planned 2017 development drilling activities. However, future cash flows are subject to a number of variables, including the level of our oil and natural gas production and the prices we receive for our oil and natural gas production, and significant additional capital expenditures will be required to more fully develop our properties and acquire additional properties. We cannot assure you that operations and other needed capital will be available on acceptable terms, or at all.
As of December 31, 2016, we had $3.1 million of cash and cash equivalents and $207.3 million of available borrowings under our revolving credit facility. As of December 31, 2016, we had a working capital deficit balance of $27.4 million, which includes a net liability balance of $14.0 million associated with our derivative instruments. As of December 31, 2016, the borrowing base under our revolving credit facility was $450.0 million and we had $242.8 million of outstanding borrowings. In connection with the February 2017 issuance of our 2025 Senior Notes, our borrowing base was automatically reduced to $362.5 million. The borrowing base under our revolving credit facility is subject to redetermination on at least a semi-annual basis based on an engineering report with respect to our estimated oil and natural gas reserves, which will take into account the prevailing oil and natural gas prices at such time, as adjusted for the impact of our commodity derivative contracts. Unanimous approval by the lenders is required for any increase to the borrowing base. The next borrowing base redetermination is scheduled for April 2017. A continuing decline in oil and natural gas prices could result in a reduction of our borrowing base under our revolving credit facility and could trigger mandatory principal repayments.
68
Our 2017 drilling and completion capital expenditure budget is $450.0 million to $600.0 million, from which we expect to drill 90 to 110 gross wells and complete 80 to 100 gross wells across our acreage. We expect to fund our capital expenditures with cash generated by operations, cash on hand, borrowings under our revolving credit facility and proceeds from our 2025 Senior Notes offering. The amount, timing and allocation of capital expenditures is largely discretionary and within our control, and our 2017 capital budget may be adjusted as business conditions warrant. Please see “Item 1A. Risk Factors — Risks Related to Our Business — Our development projects and acquisitions require substantial capital expenditures. We may be unable to obtain required capital or financing on satisfactory terms, which could lead to a decline in our ability to access or grow production and reserves.” Commodity prices declined significantly since June 2014 and have remained low thus far in 2017. If oil or natural gas prices remain at current levels or decline to levels below our acceptable levels, or costs increase to levels above our acceptable levels, we could choose to defer a significant portion of our budgeted capital expenditures until later periods to achieve the desired balance between sources and uses of liquidity and prioritize capital projects that we believe will have the highest expected rates of return and potential to generate near-term cash flow. We routinely monitor and adjust our capital expenditures in response to changes in commodity prices, availability of financing, drilling and acquisition costs, industry conditions, the timing of regulatory approvals, the availability of rigs, success or lack of success in drilling activities, contractual obligations, internally generated cash flow and other factors both within and outside our control. Any reduction in our capital expenditure budget could have the effect of delaying or limiting our development program, which would negatively impact our ability to grow production and could materially and adversely affect our future business, financial condition, results of operations or liquidity.
We intend to fund our 2017 capital expenditures and our cash requirements, including normal cash operating needs, debt service obligations and commitments and contingencies through December 31, 2017, with borrowings under our revolving credit facility, our operating cash flow, cash on hand and 2025 Senior Notes. However, to the extent that we consider market conditions favorable, we may access the capital markets to raise capital from time to time to fund acquisitions, pay down our revolving credit facility balance and for general working capital purposes.
We plan to continue our practice of entering into hedging arrangements to reduce the impact of commodity price volatility on our cash flow from operations. Under this strategy, we expect to maintain an active hedging program that seeks to reduce our exposure to commodity prices and protect our cash flow.
Debt Agreements
Revolving Credit Facility. Concurrently with the closing of our initial public offering, we, as borrower, and certain of our current and future subsidiaries, as guarantors, entered into a five-year, $1.0 billion senior secured revolving credit facility with an initial borrowing base of $450.0 million, which was reduced to $362.5 million in connection with the consummation of our 2025 Senior Notes offering in February 2017.
Our revolving credit facility is reserve-based, and thus our borrowing base is primarily based on the estimated value of our oil, NGL and natural gas properties and our commodity derivative contracts as determined by our lenders in their sole discretion consistent with their normal and customary oil and gas lending practices semi-annually, from time to time at our election in connection with material acquisitions, or no more frequently than twice in any fiscal year at the request of the Required Lenders or us, in each case based on engineering reports with respect to our estimated oil, NGL and natural gas reserves, and our commodity derivative contracts. Unanimous approval by the lenders is required for any increase to the borrowing base pursuant to a Redetermination, while only Required Lender approval is required to maintain or decrease the borrowing base pursuant to a Redetermination. The borrowing base will also automatically decrease upon the issuance of certain debt, including the issuance of senior notes, the sale or other disposition of certain assets and the early termination of certain swap agreements. In the future, we may be unable to access sufficient capital under our revolving credit facility as a result of (i) a decrease in our borrowing base due to a borrowing base redetermination or (ii) an unwillingness or inability on the part of our lenders to meet their funding obligations. For more information, please see “Item 1A. Risk Factors — Risks Related to Our Business—Any significant reduction in our borrowing base under our revolving credit facility as a result of the periodic borrowing base redeterminations or otherwise may negatively impact our ability to fund our operations.”
A decline in commodity prices could result in a redetermination that lowers our borrowing base and, in such case, we could be required to repay any indebtedness in excess of the borrowing base, or we could be required to pledge other oil and natural gas properties as additional collateral. If a redetermination of our borrowing base results in our borrowing base being less than our aggregate elected commitments, our aggregate elected commitments will be automatically reduced to the amount of such reduced borrowing base. We do not anticipate having any substantial unpledged properties, and we may not have the financial resources in the future to make any mandatory principal prepayments required under our revolving credit facility.
Borrowings under our revolving credit facility are secured by liens on substantially all of our properties, but in any event, not less than 85% (or 75% with respect to certain properties prior to February 2, 2017) of the total value, as determined by the administrative agent, of the proved reserves attributable to our oil and natural gas properties using a discount rate of 9%, all of our
69
equity interests in any future guarantor subsidiaries and all of our other assets including personal property but excluding equity interests in and assets of unrestricted subsidiaries.
Additionally, borrowings under our revolving credit facility will bear interest, at our option, at either the greatest of (x) the prime rate as determined by the administrative agent, (y) the federal funds effective rate plus 0.50%, and (z) the adjusted LIBOR for a one month interest period plus 1.0%, in each case, plus a margin that varies from 1.25% to 2.25% per annum according to the total commitments usage (which is the ratio of outstanding borrowings and letters of credit to the least of the total commitments, the borrowing base and the aggregate elected commitments then in effect), (ii) the adjusted LIBOR plus a margin that varies from 2.25% to 3.25% per annum according to the total commitment usage or (iii) the applicable LIBOR market index rate plus a margin that varies from 2.25% to 3.25% per annum according to the total commitment usage. The unused portion of the total commitments are subject to a commitment fee that varies from 0.375% to 0.50% per annum according to our total commitments usage.
Our revolving credit facility requires us to maintain (x) a ratio of total debt to EBITDAX (as defined under our revolving credit facility) of not more than 4.00 to 1.00 and (y) a ratio of current assets (including availability under the facility) to current liabilities of not less than 1.00 to 1.00.
Additionally, our revolving credit facility contains various covenants and restrictive provisions that, among other things, limit our ability to incur additional debt, guarantees or liens; consolidate, merge or transfer all or substantially all of our assets; make certain investments, acquisitions or other restricted payments; modify certain material agreements; engage in certain types of transactions with affiliates; dispose of assets; incur commodity hedges exceeding a certain percentage of our production; and prepay certain indebtedness.
Events of default under our revolving credit facility will include, but are not be limited to, failure to make payments when due, breach of any covenant continuing beyond any applicable cure period, default under any other material debt, change of control, bankruptcy or other insolvency event and certain material adverse effects on our business.
If we fail to perform our obligations under these and other covenants, the revolving credit commitments may be terminated and any outstanding indebtedness under our revolving credit facility, together with accrued interest, fees and other obligations under the credit agreement, could be declared immediately due and payable.
WHR II Revolving Credit Facility. We repaid and terminated WHR II’s prior revolving credit facility in connection with the completion of our initial public offering.
Esquisto Revolving Credit Facility. We repaid and terminated Esquisto’s prior revolving credit facility in connection with the completion of our initial public offering.
Esquisto Terminated Revolving Credit Facility and Second Lien Loan. Esquisto retired and terminated a prior revolving credit facility and second lien loan in January 2016 in connection with the merger of Esquisto I and Esquisto II.
See Note 9 under “Item 8. Financial Statements and Supplementary Data” for additional information regarding our revolving credit facility.
2025 Senior Notes
In February 2017, we completed a private placement of the 2025 Senior Notes. The 2025 Senior Notes, issued at 99.244% of par, mature on February 1, 2025 and are fully and unconditionally guaranteed on a joint and several basis by all of our existing and certain future subsidiaries (subject to customary release provisions). The 2025 Senior Notes are governed by an indenture dated as of February 1, 2017. The 2025 Senior Notes accrue interest at 6.875% per annum and payable semi-annually in arrears on February 1 and August 1 of each year. We used the net proceeds of that offering to repay the borrowings outstanding under our revolving credit facility and for general corporate purposes, including funding our 2017 capital expenditures.
See Note 9 under “Item 8. Financial Statements and Supplementary Data” for additional information regarding the 2025 Senior Notes.
70
Cash Flows from Operating, Investing and Financing Activities
The following table summarizes our cash flows from operating, investing and financing activities for the periods indicated. Our predecessor’s cash flows were retrospectively revised due to common control considerations. As such, the cash flows for 2016, 2015 and 2014 have been derived from the combined financial position and results attributable to the predecessor for periods prior to our initial public offering and for the previous owner for periods from the inception of common control (February 17, 2015) through our initial public offering. For periods after the completion of our initial public offering, our consolidated financial statements include our accounts and those of our subsidiaries. Because WHR II, Esquisto and Acquisition Co. Holdings were under the common control of NGP, the sale and contribution of the respective ownership interests was accounted for as a combination of entities under common control, whereby the assets and liabilities sold and contributed were recorded based on historical cost.
For information regarding the individual components of our cash flow amounts, see the Statements of Consolidated and Combined Cash Flows included under “Item 8. Financial Statements and Supplementary Data” contained herein.
|
|
|
For Year Ended December 31, |
|
|||||||||
|
|
|
2016 |
|
|
2015 |
|
|
2014 |
|
|||
|
|
|
(in thousands) |
|
|||||||||
|
Net cash provided by operating activities |
|
$ |
22,262 |
|
|
$ |
50,096 |
|
|
$ |
25,660 |
|
|
Net cash used in investing activities |
|
$ |
(567,545 |
) |
|
$ |
(443,639 |
) |
|
$ |
(128,967 |
) |
|
Net cash provided by financing activities |
|
$ |
505,272 |
|
|
$ |
424,481 |
|
|
$ |
114,589 |
|
Year Ended December 31, 2016 Compared to the Year Ended December 31, 2015
Operating Activities. Net cash provided by operating activities was $22.3 million for 2016, compared to $50.1 million of net cash provided by operating activities for 2015. Production increased 1.5 MMBoe (approximately 40%) and average realized sales prices increased to $23.67 per Boe for 2016 compared to $22.65 per Boe during 2015 as previously discussed above under “Results of Operations.” Higher G&A expenses also contributed to the period-to-period decrease in net cash provided by operating activities. Net cash provided by operating activities included $4.9 million of cash receipts on derivative instruments during 2016 compared to $11.5 million during 2015. There was a $50.7 million decrease in cash flow attributable to the timing of cash receipts and disbursements related to operating activities during 2016 compared to 2015.
Investing Activities. During 2016 and 2015, cash flows used in investing activities were $567.5 million and $443.6 million, respectively. Acquisitions of oil and gas properties were $436.1 million during 2016. We closed the Burleson North Acquisition in December 2016 for $389.8 million. Acquisitions of oil and gas properties were $165.8 million during 2015. In July 2015, Esquisto acquired oil and natural gas producing properties, undeveloped acreage and water assets for a total purchase price of $103.0 million. Additions to oil and gas properties were $125.8 million during 2016, of which $107.5 million was attributable to Esquisto’s drilling and completion activities in the Eagle Ford. Additions to oil and gas properties were $253.9 million during 2015, of which $130.0 million was attributable to Esquisto’s drilling and completion activities in the Eagle Ford and $123.9 million was attributable to our predecessor’s drilling and completion activities in North Louisiana.
Financing Activities. Net cash provided by financing activities during 2016 of $505.3 million was primarily attributable to $394.1 million in net proceeds from our initial public offering and capital contributions of $13.3 million and $97.0 million, respectively, from our predecessor and previous owner prior to our initial public offering. Net borrowings under our revolving credit facilities were $4.8 million during 2016. Amounts borrowed under our revolving credit facility were primarily incurred to repay the amounts outstanding under our predecessor and previous owner credit facilities in connection with the closing of our initial public offering. Amounts borrowed under our predecessor and previous owner credit facilities were primarily used for additions to oil and natural gas properties and working capital. Debt issuance costs were $3.6 million.
Net cash provided by financing activities of $424.5 million during 2015 was primarily attributable to capital contributions of $125.1 million and $208.4 million from our predecessor and previous owner, respectively. Net borrowings under our revolving credit facilities were $89.9 million during 2015. Amounts borrowed under our predecessor and previous owner credit facilities were primarily used for additions to oil and natural gas properties and working capital. Debt issuance costs were $0.9 million.
Year Ended December 31, 2015 Compared to the Year Ended December 31, 2014
Operating Activities. Net cash provided by operating activities was $50.1 million for 2015, compared to $25.7 million of net cash provided by operating activities for 2014. The change in operating cash flow was primarily the result of the significant decrease in commodity prices and higher G&A expense, largely offset by higher realized hedging gains, higher production and changes in working capital. Average realized sales prices decreased to $22.65 per Boe for 2015 compared to $27.78 per Boe during 2014 while production increased 2.2 MMBoe, or 132%, over the same time period as a result of acquisitions during 2015.
71
Investing Activities. During 2015 and 2014, cash flows used in investing activities were $443.6 million and $129.0 million, respectively. The increase for 2015 compared to the prior year is primarily due to $419.8 million in acquisitions and additions for 2015 compared to $128.7 million in additions for 2014.
Financing Activities. Net cash provided by financing activities of $424.5 million during 2015 was primarily attributable to capital contributions of $125.1 million and $208.4 million from our predecessor and previous owner, respectively. Net borrowings under our revolving credit facilities were $89.9 million during 2015. Amounts borrowed under our predecessor and previous owner credit facilities were primarily used for additions to oil and natural gas properties and working capital. Net cash provided by financing activities of $114.6 million during 2014 was primarily attributable to capital contributions of $97.5 million from our predecessor and net borrowings from WHR II’s revolving credit facility.
Contractual Obligations
In the table below, we set forth our contractual obligations as of December 31, 2016. The contractual obligations we will actually pay in future periods may vary from those reflected in the table because the estimates and assumptions used in creating the table are subjective.
|
|
|
|
|
|
|
Payment or Settlement due by Period |
|
|||||||||||||
|
Contractual Obligation |
|
Total |
|
|
2017 |
|
|
2018-2019 |
|
|
2020-2021 |
|
|
Thereafter |
|
|||||
|
|
|
|
|
|
|
(In thousands) |
|
|||||||||||||
|
Revolving credit facility (1) |
|
$ |
242,750 |
|
|
$ |
— |
|
|
$ |
— |
|
|
$ |
242,750 |
|
|
$ |
— |
|
|
Estimated interest payments (2) |
|
|
42,464 |
|
|
|
8,545 |
|
|
|
17,090 |
|
|
|
16,829 |
|
|
|
— |
|
|
Office lease |
|
|
5,630 |
|
|
|
1,235 |
|
|
|
2,541 |
|
|
|
1,854 |
|
|
|
— |
|
|
Gas transportation agreement (3) |
|
|
9,528 |
|
|
|
4,380 |
|
|
|
5,148 |
|
|
|
— |
|
|
|
— |
|
|
Compressor and equipment (4) |
|
|
1,599 |
|
|
|
1,599 |
|
|
|
— |
|
|
|
— |
|
|
|
— |
|
|
Right-of-way |
|
|
2,000 |
|
|
|
40 |
|
|
|
80 |
|
|
|
80 |
|
|
|
1,800 |
|
|
Total |
|
$ |
303,971 |
|
|
$ |
15,799 |
|
|
$ |
24,859 |
|
|
$ |
261,513 |
|
|
$ |
1,800 |
|
|
|
(1) |
As of December 31, 2016, we had $242.8 million outstanding under our revolving credit facility. This amount represents the scheduled future maturities of the principal amount outstanding. See Note 9 of the Notes to Consolidated and Combined Financial Statements included under Item 8 of this Annual Report for information regarding our revolving credit facility. |
|
|
(2) |
Estimated interest payments are based on the principal amount outstanding under our revolving credit facility at December 31, 2016. In calculating these amounts, we applied the weighted-average interest rate during 2016 associated with such debt. See Note 9 of the Notes to Consolidated and Combined Financial Statements included under Item 8 of this Annual Report for the weighted-average variable interest rate charged during 2016 under our revolving credit facility. |
|
|
(3) |
We were assigned a firm gas transportation service agreement with RIGS as a result of our predecessor’s property acquisition on August 8, 2013. Under the terms of the agreement, we are obligated to pay total daily transportation fees not to exceed $0.30 per MMBtu per day for quantities of 40,000 MMBtu per day until March 5, 2019. |
|
|
(4) |
Represents compressor rentals which are on month-to-month terms without any significant long-term contracts. |
Off–Balance Sheet Arrangements
As of December 31, 2016, we had no off–balance sheet arrangements.
Recently Issued Accounting Pronouncements
For a discussion of recent accounting pronouncements that will affect us, see Note 2 under “Item 8. Financial Statements and Supplementary Data” of this Annual Report.
72
ITEM 7A. QUANTITATIVE AND QUALITATIVE DISCLOSURES ABOUT MARKET RISK
We are exposed to market risk, including the effects of adverse changes in commodity prices and interest rates as described below. The primary objective of the following information is to provide quantitative and qualitative information about our potential exposure to market risks. The term “market risk” refers to the risk of loss arising from adverse changes in oil, natural gas and NGL prices and interest rates. The disclosures are not meant to be precise indicators of expected future losses but rather indicators of reasonably possible losses. All of our market risk sensitive instruments were entered into for purposes other than speculative trading.
Commodity Price Risk
Our major market risk exposure is in the pricing that we receive for our oil, natural gas and NGLs production. Pricing for oil, natural gas and NGLs has been volatile and unpredictable for several years, and we expect this volatility to continue in the future.
During the period from January 1, 2014 through January 1, 2017, the WTI spot price for oil has declined from a high of $107.95 per Bbl on June 20, 2014 to $26.19 per Bbl on February 11, 2016, and the Henry Hub spot price for natural gas has declined from a high of $8.15 per MMBtu on February 10, 2014 to a low of $1.49 per MMBtu on March 4, 2016. The prices we receive for our oil, natural gas and NGLs production depend on numerous factors beyond our control, some of which are discussed in “Item 1A. Risk Factors—Risks Related to Our Business—Oil, natural gas and NGL prices are volatile. A sustained decline in oil, natural gas and NGL prices could adversely affect our business, financial condition and results of operations and our ability to meet our capital expenditure obligations and financial commitments.”
Due to this volatility, we have historically used, and we expect to continue to use, commodity derivative instruments, such as collars, puts and swaps, to hedge price risk associated with a portion of our anticipated production. Our hedging instruments allow us to reduce, but not eliminate, the potential effects of the variability in cash flow from operations due to fluctuations in oil and natural gas prices and provide increased certainty of cash flows for our drilling program and debt service requirements. These instruments provide only partial price protection against declines in oil and natural gas prices and may partially limit our potential gains from future increases in prices. Our revolving credit facility contains various covenants and restrictive provisions which, among other things, limit our ability to enter into commodity price hedges exceeding a certain percentage of production.
Swaps. In a typical commodity swap agreement, we receive the difference between a fixed price per unit of production and a price based on an agreed upon published third-party index, if the index price is lower than the fixed price we receive the difference. If the index price is higher, we pay the difference. By entering into swap agreements, we effectively fix the price that we will receive in the future for the hedged production. Our swaps are settled in cash on a monthly basis as each month is due.
Collars. In a typical collar arrangement, we receive the excess, if any, of the contract floor price over the reference price, based on NYMEX or regional quoted prices, and pay the excess, if any, of the reference price over the contract ceiling price. Collars are typically exercised in cash on a monthly basis only when the reference price is outside of floor and ceiling prices (the collar), otherwise they expire.
Put options. In a typical put option, we receive the difference between the agreed upon strike price of the option and the price of the underlying commodity if market prices decline below the strike price. When put options are settled we would receive the difference between the strike price and market price less any deferred premiums associated with the put option contract. If commodity markets rise above the strike price, any losses incurred are limited to the deferred premium amount associated with the put option. Put options typically settle in cash on a monthly basis, otherwise they expire.
73
The following table summarizes our derivative contracts as of December 31, 2016 and the average prices at which the production will be hedged:
|
|
|
2017 |
|
|
2018 |
|
|
2019 |
|
|||
|
Natural Gas Derivative Contracts: |
|
|
|
|
|
|
|
|
|
|
|
|
|
Fixed price swap contracts: |
|
|
|
|
|
|
|
|
|
|
|
|
|
Volume (MMBtu) |
|
|
9,029,600 |
|
|
|
11,565,800 |
|
|
|
9,877,900 |
|
|
Weighted-average fixed price |
|
$ |
3.15 |
|
|
$ |
3.03 |
|
|
$ |
2.81 |
|
|
|
|
|
|
|
|
|
|
|
|
|
|
|
|
Collar contracts: |
|
|
|
|
|
|
|
|
|
|
|
|
|
Volume (MMBtu) |
|
|
5,520,000 |
|
|
|
— |
|
|
|
— |
|
|
Weighted-average floor price |
|
$ |
3.00 |
|
|
$ |
— |
|
|
$ |
— |
|
|
Weighted-average ceiling price |
|
$ |
3.36 |
|
|
$ |
— |
|
|
$ |
— |
|
|
|
|
|
|
|
|
|
|
|
|
|
|
|
|
Put options: |
|
|
|
|
|
|
|
|
|
|
|
|
|
Volume (MMBtu) |
|
|
1,068,350 |
|
|
|
— |
|
|
|
— |
|
|
Weighted-average floor price |
|
$ |
3.40 |
|
|
$ |
— |
|
|
$ |
— |
|
|
Weighted-average put premium |
|
$ |
(0.35 |
) |
|
$ |
— |
|
|
$ |
— |
|
|
|
|
|
|
|
|
|
|
|
|
|
|
|
|
Crude Oil Derivative Contracts: |
|
|
|
|
|
|
|
|
|
|
|
|
|
Fixed price swap contracts: |
|
|
|
|
|
|
|
|
|
|
|
|
|
Volume (Bbls) |
|
|
2,146,300 |
|
|
|
1,638,500 |
|
|
|
1,381,300 |
|
|
Weighted-average fixed price |
|
$ |
52.90 |
|
|
$ |
53.68 |
|
|
$ |
54.92 |
|
|
|
|
|
|
|
|
|
|
|
|
|
|
|
|
Collar contracts: |
|
|
|
|
|
|
|
|
|
|
|
|
|
Volume (Bbls) |
|
|
60,784 |
|
|
|
25,096 |
|
|
|
— |
|
|
Weighted-average floor price |
|
$ |
50.00 |
|
|
$ |
50.00 |
|
|
$ |
— |
|
|
Weighted-average ceiling price |
|
$ |
62.10 |
|
|
$ |
62.10 |
|
|
$ |
— |
|
|
|
|
|
|
|
|
|
|
|
|
|
|
|
|
Put options: |
|
|
|
|
|
|
|
|
|
|
|
|
|
Volume (MMBtu) |
|
|
636,400 |
|
|
|
— |
|
|
|
— |
|
|
Weighted-average floor price |
|
$ |
55.00 |
|
|
$ |
— |
|
|
$ |
— |
|
|
Weighted-average put premium |
|
$ |
(4.76 |
) |
|
$ |
— |
|
|
$ |
— |
|
Interest Rate Risk
At December 31, 2016, we had $242.8 million of debt outstanding, with a weighted average interest rate of 3.52%. Interest was calculated under the terms of our revolving credit facility based on choosing from two interest rates: (i) the Eurodollar rate, which is based on London Interbank Offered Rate (“LIBOR”), plus an additional margin, based on the percentage of the borrowing base being utilized, ranging from 1.50% to 2.50%; and (ii) the Alternate Base Rate, which is based on the highest of (a) the U.S. Prime rate, (b) the Federal Funds Effective Rate in effect plus 1/2 of 1% and (c) Adjusted LIBOR plus 1%, plus an additional margin, based on the percentage of the borrowing base being utilized, ranging from 0.50% to 1.50%. From the inception of the credit agreement, predominately all our debt outstanding was in the form of Eurodollar borrowings based on the Eurodollar rate.
Assuming no change in the amount outstanding, the impact on interest expense of a 1% increase or decrease in the assumed weighted average interest rate would be approximately $2.4 million per year. We do not currently have any derivative arrangements to protect against fluctuations in interest rates applicable to our outstanding indebtedness but may enter into such derivative arrangements in the future. To the extent we enter into any such interest rate derivative arrangement, we would subject to risk for financial loss. For more information, please see “Item 1A. Risk Factors—Risks Related to Our Business—Our derivative activities could result in financial losses or could reduce our earnings.”
Counterparty and Customer Credit Risk
Our derivative contracts expose us to credit risk in the event of nonperformance by counterparties. While we do not require counterparties to our derivative contracts to post collateral, we do evaluate the credit standing of such counterparties as we deem appropriate. The counterparties to our derivative contracts currently in place have investment grade ratings.
74
Our principal exposures to credit risk are through receivables resulting from joint interest receivables and receivables from the sale of our oil and natural gas production due to the concentration of our oil and natural gas receivables with several significant customers. The inability or failure of our significant customers to meet their obligations to us or their insolvency or liquidation may adversely affect our financial results. However, we believe the credit quality of our customers is high.
By using derivative instruments that are not traded on an exchange to hedge exposures to changes in commodity prices, we expose ourselves to the credit risk of our counterparties. Credit risk is the potential failure of the counterparty to perform under the terms of the contract. When the fair value of a contract is positive, the counterparty is expected to owe us, which creates the credit risk. To minimize the credit risk in derivative instruments, it is our policy to enter into contracts only with counterparties that are creditworthy financial institutions deemed by management as competent and competitive market-makers. The creditworthiness of our counterparties is subject to periodic review. As of December 31, 2016, our derivative contracts were with major financial institutions, all of which were also lenders under our revolving credit facility. While collateral is generally not required to be posted by counterparties, credit risk associated with these instruments is minimized by limiting exposure to any single counterparty and entering into derivative instruments only with creditworthy counterparties that are generally large financial institutions. Additionally, master netting agreements are used to mitigate risk of loss due to default with counterparties on derivative instruments. We have also entered into the International Swaps and Derivatives Association Master Agreements (“ISDA Agreements”) with each of our counterparties. The terms of the ISDA Agreements provide us and each of our counterparties with rights of set-off upon the occurrence of defined acts of default by either us or our counterparty to a derivative, whereby the party not in default may set-off all liabilities owed to the defaulting party against all net derivative asset receivables from the defaulting party. At December 31, 2016, we had net derivative liabilities of $22.2 million. As such, had certain counterparties failed completely to perform according to the terms of their existing contracts, we would not have been able to exercise our right to offset against amounts outstanding under our revolving credit facility at December 31, 2016 since we were not in a net asset position. See Note 9 under “Item 8. Financial Statements and Supplementary Data” for additional information regarding our revolving credit facility.
We are also subject to credit risk due to the concentration of our natural gas and oil receivables with several significant customers. We do not require our customers to post collateral, and the inability of our significant customers to meet their obligations to us or their insolvency or liquidation may adversely affect our financial results.
Joint operations receivables arise from billings to entities that own partial interests in the wells we operate. These entities participate in our wells primarily based on their ownership in leases on which we intend to drill. We have little ability to control whether these entities will participate in our wells.
ITEM 8. FINANCIAL STATEMENTS AND SUPPLEMENTARY DATA
Our Consolidated and Combined Financial Statements, together with the report of our independent registered public accounting firm begin on page F-1 of this annual report.
ITEM 9. CHANGES IN AND DISAGREEMENTS WITH ACCOUNTANTS ON ACCOUNTING AND FINANCIAL DISCLOSURE
None.
ITEM 9A. CONTROLS AND PROCEDURES
Evaluation of Disclosure Controls and Procedures.
As required by Rules 13a-15(b) and 15d-15(b) of the Exchange Act, we have evaluated, under the supervision and with the participation of our management, including the principal executive officer and principal financial officer, the effectiveness of the design and operation of our disclosure controls and procedures (as defined in Rules 13a-15(e) and 15d-15(e) and under the Exchange Act) as of the end of the period covered by this annual report. Our disclosure controls and procedures are designed to provide reasonable assurance that the information required to be disclosed by us in reports that we file under the Exchange Act is accumulated and communicated to our management, including the principal executive officer and principal financial officer, as appropriate, to allow timely decisions regarding required disclosure and is recorded, processed, summarized and reported within the time periods specified in the rules and forms of the SEC. Based upon the evaluation, the principal executive officer and principal financial officer have concluded that our disclosure controls and procedures were effective at the reasonable assurance level as of December 31, 2016.
75
Management’s Report on Internal Control Over Financial Reporting
This Annual Report is not required to include a report of management’s assessment regarding internal control over financial reporting or an attestation report of our independent registered public accounting firm due to both a transition period established by rules of the SEC for newly public companies and our status as an emerging growth company. See “Item 1A. Risk Factors—Risks Related to Our Common Stock,” for additional information regarding our emerging growth company status.
Changes in Internal Controls Over Financial Reporting
No changes in our internal control over financial reporting occurred during the quarter ended December 31, 2016 that have materially affected, or are reasonably likely to materially affect, our internal control over financial reporting.
None.
76
ITEM 10. DIRECTORS, EXECUTIVE OFFICERS AND CORPORATE GOVERNANCE
See “Directors,” “Corporate Governance Matters,” “Executive Officers,” “Security Ownership of Certain Beneficial Owners and Management,” and “Section 16(a) Beneficial Ownership Reporting Compliance” in the proxy statement relating to the Annual Meeting of Stockholders of WildHorse Resource Development Corporation (the “Proxy Statement”) to be held May 18, 2017, each of which is incorporated herein by reference.
The Company’s Code of Business Conduct and Ethics and the Code of Ethics for Senior Financial Officers (collectively, the “Code of Ethics”) can be found on the Company’s website located at http://www.wildhorserd.com. Any stockholder may request a printed copy of the Code of Ethics by submitting a written request to the Company’s Corporate Secretary. If the Company amends the Code of Ethics or grants a waiver, including an implicit waiver, from the Code of Ethics, the Company will disclose the information on its website. The waiver information will remain on the website for at least 12 months after the initial disclosure of such waiver.
ITEM 11. EXECUTIVE COMPENSATION
See “Directors,” “Corporate Governance Matters,” “Director Compensation in 2016” and “Executive Compensation” in the Proxy Statement, each of which is incorporated herein by reference.
ITEM 12. SECURITY OWNERSHIP OF CERTAIN BENEFICIAL OWNERS AND MANAGEMENT AND RELATED STOCKHOLDER MATTERS
See “Security Ownership of Certain Beneficial Owners and Management” in the Proxy Statement and “Securities Authorized for Issuance under Equity Compensation Plans” under Item 5 of this Form 10-K, which are incorporated herein by reference.
ITEM 13. CERTAIN RELATIONSHIPS AND RELATED TRANSACTIONS, AND DIRECTOR INDEPENDENCE
See “Certain Relationships and Related Party Transactions” in the Proxy Statement, which is incorporated herein by reference.
ITEM 14. PRINCIPAL ACCOUNTING FEES AND SERVICES
See “Proposal 2—Ratification of Appointment of Independent Registered Public Accounting Firm” in the Proxy Statement, which is incorporated herein by reference.
77
Pursuant to the requirements of the Securities Exchange Act of 1934, the registrant has duly caused this Annual Report to be signed on its behalf by the undersigned, thereunto duly authorized.
|
|
|
|
|
WildHorse Resource Development Corporation |
||
|
|
|
|
|
(Registrant) |
||
|
|
|
|
|
|
|
|
|
Date: |
|
March 31, 2017 |
|
By: |
|
/s/ Andrew J. Cozby |
|
|
|
|
|
Name: |
|
Andrew J. Cozby |
|
|
|
|
|
Title: |
|
Executive Vice President and Chief Financial Officer |
Pursuant to the requirements of the Securities Exchange Act of 1934, this Annual Report has been signed below by the following persons on behalf of the registrant and in the capacities indicated.
|
Name |
|
Title (Position with WildHorse Resource Development Corporation) |
|
Date |
|
|
|
|
|
|
|
/s/ Jay C. Graham |
|
Chief Executive Officer and Chairman |
|
March 31, 2017 |
|
Jay C. Graham |
|
(Principal Executive Officer) |
|
|
|
|
|
|
|
|
|
/s/ Anthony Bahr |
|
President and Director |
|
March 31, 2017 |
|
Anthony Bahr |
|
|
|
|
|
|
|
|
|
|
|
/s/ Andrew J. Cozby |
|
Executive Vice President and Chief Financial Officer |
|
March 31, 2017 |
|
Andrew J. Cozby |
|
(Principal Financial Officer) |
|
|
|
|
|
|
|
|
|
/s/ Terence Lynch |
|
Senior Vice President and Chief Accounting Officer |
|
March 31, 2017 |
|
Terence Lynch |
|
(Principal Accounting Officer) |
|
|
|
|
|
|
|
|
|
/s/ Richard D. Brannon |
|
Director |
|
March 31, 2017 |
|
Richard D. Brannon |
|
|
|
|
|
|
|
|
|
|
|
/s/ Jonathan M. Clarkson |
|
Director |
|
March 31, 2017 |
|
Jonathan M. Clarkson |
|
|
|
|
|
|
|
|
|
|
|
/s/ Scott A. Gieselman |
|
Director |
|
March 31, 2017 |
|
Scott A. Gieselman |
|
|
|
|
|
|
|
|
|
|
|
/s/ David W. Hayes |
|
Director |
|
March 31, 2017 |
|
David W. Hayes |
|
|
|
|
|
|
|
|
|
|
|
/s/ Grant E. Sims |
|
Director |
|
March 31, 2017 |
|
Grant E. Sims |
|
|
|
|
|
|
|
|
|
|
|
/s/ Tony R. Weber |
|
Director |
|
March 31, 2017 |
|
Tony R. Weber |
|
|
|
|
78
ITEM 15. EXHIBITS AND FINANCIAL STATEMENT SCHEDULES
(a)(1) Financial Statements
Our Consolidated and Combined Financial Statements are included under Part II, Item 8 of the annual report. For a listing of these statements and accompanying footnotes, see “Index to Financial Statements” Page F-1 of this Annual Report.
(a)(2) Financial Statement Schedules
All schedules have been omitted because they are either not applicable, not required or the information called for therein appears in the consolidated and combined financial statements or notes thereto.
(a)(3) Exhibits
The exhibits listed on the accompanying Exhibit Index are filed or incorporated by reference as part of this Annual Report, and such Exhibit Index is incorporated herein by reference.
79
ITEM 8. FINANCIAL STATEMENTS AND SUPPLEMENTARY DATA
WILDHORSE RESOURCE DEVELOPMENT CORPORATION
INDEX TO FINANCIAL STATEMENTS
|
|
|
Page No. |
|
|
F – 2 |
|
|
Consolidated and Combined Balance Sheets as of December 31, 2016 and 2015 |
|
F – 4 |
|
|
F – 5 |
|
|
|
F – 6 |
|
|
Statements of Consolidated and Combined Equity for the Years Ended December 31, 2016, 2015, and 2014 |
|
F – 7 |
|
|
F – 8 |
|
|
|
F – 8 |
|
|
|
F – 9 |
|
|
|
F – 15 |
|
|
|
F – 17 |
|
|
|
F – 18 |
|
|
|
F – 20 |
|
|
|
F – 21 |
|
|
|
F – 21 |
|
|
|
F – 21 |
|
|
|
F – 23 |
|
|
|
F – 25 |
|
|
|
F – 25 |
|
|
|
F – 25 |
|
|
|
F – 26 |
|
|
|
F –29 |
|
|
|
F - 30 |
|
|
|
F - 31 |
|
|
|
F - 32 |
|
|
|
F - 33 |
|
|
|
F - 37 |
F - 1
REPORT OF INDEPENDENT REGISTERED PUBLIC ACCOUNTING FIRM
The Board of Directors and Stockholders
WildHorse Resource Development Corporation:
We have audited the accompanying consolidated balance sheet of WildHorse Resource Development Corporation and subsidiaries as of December 31, 2016, the consolidated and combined balance sheet of WildHorse Resource Development Corporation as of December 31, 2015, and the related consolidated and combined statements of operations, cash flows, and changes in equity for each of the years in the three-year period ended December 31, 2016. These consolidated and combined financial statements are the responsibility of the Company’s management. Our responsibility is to express an opinion on these consolidated and combined financial statements based on our audits. We did not audit the financial statements of Esquisto Resources II, LLC, a wholly owned subsidiary, for the period from February 17, 2015 to December 31, 2015. Esquisto Resources II, LLC’s financial statements reflect total assets constituting 56 percent and total revenues constituting 53 percent in 2015, of the related combined totals. Those statements were audited by other auditors whose report has been furnished to us, and our opinion, insofar as it relates to the amounts included for Esquisto Resources II, LLC for the period from February 17, 2015 to December 31, 2015, is based solely on the report of the other auditors.
We conducted our audits in accordance with the standards of the Public Company Accounting Oversight Board (United States). Those standards require that we plan and perform the audit to obtain reasonable assurance about whether the financial statements are free of material misstatement. An audit includes examining, on a test basis, evidence supporting the amounts and disclosures in the financial statements. An audit also includes assessing the accounting principles used and significant estimates made by management, as well as evaluating the overall financial statement presentation. We believe that our audits and the report of the other auditors provide a reasonable basis for our opinion.
In our opinion, based on our audits and the report of the other auditors, the consolidated and combined financial statements referred to above present fairly, in all material respects, the financial position of WildHorse Resource Development Corporation and subsidiaries as of December 31, 2016 and 2015, and the results of their operations and their cash flows for each of the years in the three‑year period ended December 31, 2016, in conformity with U.S. generally accepted accounting principles.
As discussed in Note 1 to the consolidated and combined financial statements, the balance sheet as of December 31, 2015, and the related statements of operations, cash flows, and changes in equity for the periods from inception of common control (February 17, 2015) through the initial public offering, have been prepared on a combined basis of accounting.
/s/ KPMG LLP
Houston, Texas
March 31, 2017
F - 2
Report of Independent Registered Public Accounting Firm
The Board of Directors and Shareholders of
WildHorse Resource Development Corporation
We have audited the accompanying consolidated balance sheet of Esquisto Resources II, LLC and Subsidiaries (the Company) as of December 31, 2015, and the related consolidated statement of operations, changes in members’ equity, and cash flows for the period from February 17, 2015 to December 31, 2015 (not presented separately herein). These financial statements are the responsibility of the Company’s management. Our responsibility is to express an opinion on these financial statements based on our audit.
We conducted our audit in accordance with the standards of the Public Company Accounting Oversight Board (United States). Those standards require that we plan and perform the audit to obtain reasonable assurance about whether the financial statements are free of material misstatement. We were not engaged to perform an audit of the Company’s internal control over financial reporting. Our audits included consideration of internal control over financial reporting as a basis for designing audit procedures that are appropriate in the circumstances, but not for the purpose of expressing an opinion on the effectiveness of the Company’s internal control over financial reporting. Accordingly, we express no such opinion. An audit also includes examining, on a test basis, evidence supporting the amounts and disclosures in the financial statements, assessing the accounting principles used and significant estimates made by management, and evaluating the overall financial statement presentation. We believe that our audit provides a reasonable basis for our opinion.
In our opinion, the financial statements referred to above present fairly, in all material respects, the consolidated financial position of Esquisto Resources II, LLC and Subsidiaries at December 31, 2015, and the consolidated results of their operations and their cash flows for the period from February 17, 2015 to December 31, 2015, in conformity with U.S. generally accepted accounting principles.
/s/ Ernst &Young LLP
Dallas, Texas
March 28, 2017
F - 3
WILDHORSE RESOURCE DEVELOPMENT CORPORATION
CONSOLIDATED AND COMBINED BALANCE SHEETS
(In thousands, except outstanding shares)
|
|
|
December 31, |
|
|
December 31, |
|
||
|
|
|
2016 |
|
|
2015 |
|
||
|
ASSETS |
|
|
|
|
|
|
|
|
|
Current Assets: |
|
|
|
|
|
|
|
|
|
Cash and cash equivalents |
|
$ |
3,115 |
|
|
$ |
43,126 |
|
|
Accounts receivable, net |
|
|
26,428 |
|
|
|
13,737 |
|
|
Short-term derivative instruments |
|
|
— |
|
|
|
7,076 |
|
|
Prepaid expenses and other current assets |
|
|
1,633 |
|
|
|
2,830 |
|
|
Total current assets |
|
|
31,176 |
|
|
|
66,769 |
|
|
Property and equipment: |
|
|
|
|
|
|
|
|
|
Oil and gas properties |
|
|
1,573,848 |
|
|
|
983,972 |
|
|
Other property and equipment |
|
|
34,344 |
|
|
|
30,609 |
|
|
Accumulated depreciation, depletion and amortization |
|
|
(200,293 |
) |
|
|
(118,943 |
) |
|
Total property and equipment, net |
|
|
1,407,899 |
|
|
|
895,638 |
|
|
Other noncurrent assets: |
|
|
|
|
|
|
|
|
|
Restricted cash |
|
|
886 |
|
|
|
551 |
|
|
Long-term derivative instruments |
|
|
— |
|
|
|
2,440 |
|
|
Debt issuance costs |
|
|
2,320 |
|
|
|
967 |
|
|
Total assets |
|
$ |
1,442,281 |
|
|
$ |
966,365 |
|
|
LIABILITIES AND EQUITY |
|
|
|
|
|
|
|
|
|
Current liabilities: |
|
|
|
|
|
|
|
|
|
Accounts payable |
|
$ |
21,014 |
|
|
$ |
34,843 |
|
|
Accrued liabilities |
|
|
23,371 |
|
|
|
28,782 |
|
|
Short-term derivative instruments |
|
|
14,087 |
|
|
|
— |
|
|
Asset retirement obligations |
|
|
90 |
|
|
|
90 |
|
|
Total current liabilities |
|
|
58,562 |
|
|
|
63,715 |
|
|
Noncurrent liabilities: |
|
|
|
|
|
|
|
|
|
Long-term debt |
|
|
242,750 |
|
|
|
237,857 |
|
|
Asset retirement obligations |
|
|
10,943 |
|
|
|
6,930 |
|
|
Notes payable to members (Note 14) |
|
|
— |
|
|
|
6,438 |
|
|
Deferred tax liabilities |
|
|
112,552 |
|
|
|
852 |
|
|
Long-term derivative instruments |
|
|
8,091 |
|
|
|
— |
|
|
Other noncurrent liabilities |
|
|
1,495 |
|
|
|
1,884 |
|
|
Total noncurrent liabilities |
|
|
375,831 |
|
|
|
253,961 |
|
|
Total liabilities |
|
|
434,393 |
|
|
|
317,676 |
|
|
Commitments and contingencies |
|
|
|
|
|
|
|
|
|
Equity: |
|
|
|
|
|
|
|
|
|
Stockholders’ equity: |
|
|
|
|
|
|
|
|
|
Preferred stock, $0.01 par value: 50,000,000 shares authorized; no shares issued and outstanding |
|
|
— |
|
|
|
— |
|
|
Common stock, $0.01 par value 500,000,000 shares authorized; 91,680,441 shares issued and outstanding at December 31, 2016 |
|
|
917 |
|
|
|
— |
|
|
Additional paid-in capital |
|
|
1,017,368 |
|
|
|
— |
|
|
Accumulated earnings (deficit) |
|
|
(10,397 |
) |
|
|
— |
|
|
Total stockholders’ equity |
|
|
1,007,888 |
|
|
|
— |
|
|
Predecessor |
|
|
— |
|
|
|
274,133 |
|
|
Previous owner |
|
|
— |
|
|
|
374,556 |
|
|
Total equity |
|
|
1,007,888 |
|
|
|
648,689 |
|
|
Total liabilities and equity |
|
|
1,442,281 |
|
|
|
966,365 |
|
See Accompanying Notes to Consolidated and Combined Financial Statements
F - 4
WILDHORSE RESOURCE DEVELOPMENT CORPORATION
STATEMENTS OF CONSOLIDATED AND COMBINED OPERATIONS
(In thousands, except per share amounts)
|
|
|
For Year Ended December 31, |
|
|||||||||
|
|
|
2016 |
|
|
2015 |
|
|
2014 |
|
|||
|
Revenues: |
|
|
|
|
|
|
|
|
|
|
|
|
|
Oil sales |
|
$ |
75,938 |
|
|
$ |
42,971 |
|
|
$ |
2,780 |
|
|
Natural gas sales |
|
|
43,487 |
|
|
|
38,665 |
|
|
|
41,694 |
|
|
NGL sales |
|
|
5,786 |
|
|
|
4,295 |
|
|
|
989 |
|
|
Other income |
|
|
2,131 |
|
|
|
404 |
|
|
|
— |
|
|
Total operating revenues |
|
|
127,342 |
|
|
|
86,335 |
|
|
|
45,463 |
|
|
Operating expenses: |
|
|
|
|
|
|
|
|
|
|
|
|
|
Lease operating expenses |
|
|
12,320 |
|
|
|
14,053 |
|
|
|
9,428 |
|
|
Gathering, processing and transportation |
|
|
6,581 |
|
|
|
5,300 |
|
|
|
3,953 |
|
|
Gathering system operating expense |
|
|
99 |
|
|
|
914 |
|
|
|
— |
|
|
Taxes other than income tax |
|
|
6,814 |
|
|
|
5,510 |
|
|
|
2,584 |
|
|
Cost of oil sales |
|
|
— |
|
|
|
— |
|
|
|
687 |
|
|
Depreciation, depletion and amortization |
|
|
81,757 |
|
|
|
56,244 |
|
|
|
15,297 |
|
|
Impairment of proved oil and gas properties |
|
|
— |
|
|
|
9,312 |
|
|
|
24,721 |
|
|
General and administrative |
|
|
23,973 |
|
|
|
15,903 |
|
|
|
5,838 |
|
|
Exploration expense |
|
|
12,026 |
|
|
|
18,299 |
|
|
|
1,597 |
|
|
Total operating expense |
|
|
143,570 |
|
|
|
125,535 |
|
|
|
64,105 |
|
|
Income (loss) from operations |
|
|
(16,228 |
) |
|
|
(39,200 |
) |
|
|
(18,642 |
) |
|
Other income (expense): |
|
|
|
|
|
|
|
|
|
|
|
|
|
Interest expense, net |
|
|
(7,834 |
) |
|
|
(6,943 |
) |
|
|
(2,680 |
) |
|
Debt extinguishment costs |
|
|
(1,667 |
) |
|
|
— |
|
|
|
— |
|
|
Gain (loss) on derivative instruments |
|
|
(26,771 |
) |
|
|
13,854 |
|
|
|
6,514 |
|
|
Other income (expense) |
|
|
(151 |
) |
|
|
(147 |
) |
|
|
213 |
|
|
Total other income (expense) |
|
|
(36,423 |
) |
|
|
6,764 |
|
|
|
4,047 |
|
|
Income (loss) before income taxes |
|
|
(52,651 |
) |
|
|
(32,436 |
) |
|
|
(14,595 |
) |
|
Income tax benefit (expense) |
|
|
5,575 |
|
|
|
(604 |
) |
|
|
158 |
|
|
Net income (loss) |
|
|
(47,076 |
) |
|
|
(33,040 |
) |
|
|
(14,437 |
) |
|
Net income (loss) attributable to previous owners |
|
|
(2,681 |
) |
|
|
(3,085 |
) |
|
|
— |
|
|
Net income (loss) attributable to predecessor |
|
|
(33,998 |
) |
|
|
(29,955 |
) |
|
|
(14,437 |
) |
|
Net income (loss) available to WildHorse Resources |
|
$ |
(10,397 |
) |
|
$ |
— |
|
|
$ |
— |
|
|
Earnings per common share: |
|
|
|
|
|
|
|
|
|
|
|
|
|
Basic |
|
$ |
(0.11 |
) |
|
n/a |
|
|
n/a |
|
||
|
Diluted |
|
$ |
(0.11 |
) |
|
n/a |
|
|
n/a |
|
||
|
Weighted-average common shares outstanding: |
|
|
|
|
|
|
|
|
|
|
|
|
|
Basic |
|
|
91,327 |
|
|
n/a |
|
|
n/a |
|
||
|
Diluted |
|
|
91,327 |
|
|
n/a |
|
|
n/a |
|
||
See Accompanying Notes to Consolidated and Combined Financial Statements
F - 5
WILDHORSE RESOURCE DEVELOPMENT CORPORATION
STATEMENTS OF CONSOLIDATED AND COMBINED CASH FLOWS
(In thousands)
|
|
|
For Year Ended December 31, |
|
|||||||||
|
|
|
2016 |
|
|
2015 |
|
|
2014 |
|
|||
|
Cash flows from operating activities: |
|
|
|
|
|
|
|
|
|
|
|
|
|
Net loss |
|
$ |
(47,076 |
) |
|
$ |
(33,040 |
) |
|
$ |
(14,437 |
) |
|
Adjustments to reconcile net income (loss) to net cash provided by operating activities: |
|
|
|
|
|
|
|
|
|
|
|
|
|
Depreciation, depletion and amortization |
|
|
81,350 |
|
|
|
55,890 |
|
|
|
14,988 |
|
|
Accretion of asset retirement obligations |
|
|
407 |
|
|
|
354 |
|
|
|
309 |
|
|
Impairment of proved oil and gas properties |
|
|
— |
|
|
|
9,312 |
|
|
|
24,721 |
|
|
Dry hole expense and impairments of unproved properties |
|
|
3,051 |
|
|
|
11,780 |
|
|
|
208 |
|
|
Amortization of debt issuance cost |
|
|
479 |
|
|
|
711 |
|
|
|
— |
|
|
(Gain) loss on derivative instruments |
|
|
26,771 |
|
|
|
(13,854 |
) |
|
|
(6,514 |
) |
|
Cash settlements on derivative instruments |
|
|
4,975 |
|
|
|
11,517 |
|
|
|
(2,712 |
) |
|
Deferred income tax expense (benefit) |
|
|
(5,575 |
) |
|
|
604 |
|
|
|
(189 |
) |
|
Debt extinguishment expense |
|
|
1,667 |
|
|
|
— |
|
|
|
— |
|
|
Amortization of equity awards |
|
|
68 |
|
|
|
— |
|
|
|
— |
|
|
Gain (loss) on sale of properties |
|
|
43 |
|
|
|
— |
|
|
|
— |
|
|
Changes in operating assets and liabilities |
|
|
|
|
|
|
|
|
|
|
|
|
|
Decrease (increase) in accounts receivable |
|
|
(16,300 |
) |
|
|
15,421 |
|
|
|
(19,416 |
) |
|
Decrease (increase) in prepaid expenses |
|
|
(448 |
) |
|
|
165 |
|
|
|
(336 |
) |
|
Decrease (increase) in inventories |
|
|
— |
|
|
|
108 |
|
|
|
450 |
|
|
(Decrease) increase in accounts payable and accrued liabilities |
|
|
(27,150 |
) |
|
|
(8,872 |
) |
|
|
28,588 |
|
|
Net cash flow provided by (used in) operating activities |
|
|
22,262 |
|
|
|
50,096 |
|
|
|
25,660 |
|
|
Cash flows from investing activities: |
|
|
|
|
|
|
|
|
|
|
|
|
|
Acquisitions of oil and gas properties |
|
|
(436,072 |
) |
|
|
(165,836 |
) |
|
|
— |
|
|
Additions to oil and gas properties |
|
|
(125,837 |
) |
|
|
(253,922 |
) |
|
|
(128,667 |
) |
|
Additions to and acquisitions of other property and equipment |
|
|
(5,403 |
) |
|
|
(23,653 |
) |
|
|
(300 |
) |
|
Sales of other property and equipment |
|
|
102 |
|
|
|
22 |
|
|
|
— |
|
|
Change in restricted cash |
|
|
(335 |
) |
|
|
(250 |
) |
|
|
— |
|
|
Net cash used in investing activities |
|
|
(567,545 |
) |
|
|
(443,639 |
) |
|
|
(128,967 |
) |
|
Cash flows from financing activities: |
|
|
|
|
|
|
|
|
|
|
|
|
|
Advances on revolving credit facilities |
|
|
383,450 |
|
|
|
153,400 |
|
|
|
67,400 |
|
|
Payments on revolving credit facilities |
|
|
(378,700 |
) |
|
|
(63,500 |
) |
|
|
(50,300 |
) |
|
Debt issuance cost |
|
|
(3,607 |
) |
|
|
(875 |
) |
|
|
(57 |
) |
|
Termination of second lien |
|
|
(225 |
) |
|
|
— |
|
|
|
— |
|
|
Proceeds from initial public offering |
|
|
412,500 |
|
|
|
— |
|
|
|
— |
|
|
Cost incurred in conjunction with initial public offering |
|
|
(18,426 |
) |
|
|
— |
|
|
|
— |
|
|
Predecessor contributions |
|
|
13,280 |
|
|
|
125,098 |
|
|
|
97,546 |
|
|
Previous owner contributions |
|
|
97,000 |
|
|
|
208,376 |
|
|
|
— |
|
|
Contributions from previous owners at inception of common control |
|
|
— |
|
|
|
1,982 |
|
|
|
— |
|
|
Net cash provided by financing activities |
|
|
505,272 |
|
|
|
424,481 |
|
|
|
114,589 |
|
|
Net change in cash and cash equivalents |
|
|
(40,011 |
) |
|
|
30,938 |
|
|
|
11,282 |
|
|
Cash and cash equivalents, beginning of period |
|
|
43,126 |
|
|
|
12,188 |
|
|
|
906 |
|
|
Cash and cash equivalents, end of period |
|
$ |
3,115 |
|
|
$ |
43,126 |
|
|
$ |
12,188 |
|
See Accompanying Notes to Consolidated and Combined Financial Statements
F - 6
WILDHORSE RESOURCE DEVELOPMENT CORPORATION
CONSOLIDATED AND COMBINED STATEMENT OF CHANGES IN EQUITY
(In thousands)
|
|
|
Stockholders’ Equity |
|
|
|
|
|
|
||||||||||||||||
|
|
|
Common Stock |
|
|
Additional Paid in Capital |
|
|
Accumulated Earnings (deficit) |
|
|
Predecessor |
|
|
Previous Owner |
|
|
Total |
|
||||||
|
Balance, December 31, 2013 |
|
$ |
— |
|
|
$ |
— |
|
|
$ |
— |
|
|
$ |
95,882 |
|
|
$ |
— |
|
|
$ |
95,882 |
|
|
Capital contributions |
|
|
— |
|
|
|
— |
|
|
|
— |
|
|
|
89,437 |
|
|
|
— |
|
|
|
89,437 |
|
|
Notes receivable from members, net |
|
|
— |
|
|
|
— |
|
|
|
— |
|
|
|
8,109 |
|
|
|
— |
|
|
|
8,109 |
|
|
Net income (loss) |
|
|
— |
|
|
|
— |
|
|
|
— |
|
|
|
(14,437 |
) |
|
|
— |
|
|
|
(14,437 |
) |
|
December 31, 2014 |
|
$ |
— |
|
|
$ |
— |
|
|
$ |
— |
|
|
$ |
178,991 |
|
|
$ |
— |
|
|
$ |
178,991 |
|
|
Balance at inception of common control (February 17, 2015) |
|
|
— |
|
|
|
— |
|
|
|
— |
|
|
|
— |
|
|
|
86,478 |
|
|
|
86,478 |
|
|
Capital contributions |
|
|
— |
|
|
|
— |
|
|
|
— |
|
|
|
125,850 |
|
|
|
208,376 |
|
|
|
334,226 |
|
|
Property contributions |
|
|
— |
|
|
|
— |
|
|
|
— |
|
|
|
— |
|
|
|
40,116 |
|
|
|
40,116 |
|
|
Common control step up in basis (Note 10) |
|
|
— |
|
|
|
— |
|
|
|
— |
|
|
|
— |
|
|
|
42,671 |
|
|
|
42,671 |
|
|
Notes receivable from members, net |
|
|
— |
|
|
|
— |
|
|
|
— |
|
|
|
(753 |
) |
|
|
— |
|
|
|
(753 |
) |
|
Net income (loss) |
|
|
— |
|
|
|
— |
|
|
|
— |
|
|
|
(29,955 |
) |
|
|
(3,085 |
) |
|
|
(33,040 |
) |
|
December 31, 2015 |
|
|
— |
|
|
|
— |
|
|
|
— |
|
|
|
274,133 |
|
|
|
374,556 |
|
|
|
648,689 |
|
|
Capital contributions |
|
|
— |
|
|
|
— |
|
|
|
— |
|
|
|
10,837 |
|
|
|
97,000 |
|
|
|
107,837 |
|
|
Property contributions |
|
|
— |
|
|
|
— |
|
|
|
— |
|
|
|
— |
|
|
|
329 |
|
|
|
329 |
|
|
Net income (loss) |
|
|
— |
|
|
|
— |
|
|
|
(10,397 |
) |
|
|
(33,998 |
) |
|
|
(2,681 |
) |
|
|
(47,076 |
) |
|
Proceeds from public offering |
|
|
275 |
|
|
|
412,225 |
|
|
|
— |
|
|
|
— |
|
|
|
— |
|
|
|
412,500 |
|
|
Costs incurred in connection with initial public offering |
|
|
— |
|
|
|
(19,252 |
) |
|
|
— |
|
|
|
— |
|
|
|
— |
|
|
|
(19,252 |
) |
|
Notes receivable from members |
|
|
— |
|
|
|
— |
|
|
|
— |
|
|
|
(132 |
) |
|
|
— |
|
|
|
(132 |
) |
|
Dissolution of notes receivable from members |
|
|
— |
|
|
|
— |
|
|
|
— |
|
|
|
2,575 |
|
|
|
— |
|
|
|
2,575 |
|
|
Amortization of equity awards |
|
|
4 |
|
|
|
64 |
|
|
|
— |
|
|
|
— |
|
|
|
— |
|
|
|
68 |
|
|
Issuance of shares in connection with Corporate Reorganization |
|
|
625 |
|
|
|
721,994 |
|
|
|
— |
|
|
|
(253,415 |
) |
|
|
(469,204 |
) |
|
|
— |
|
|
Issuance of shares in connection with acquisition of properties |
|
|
13 |
|
|
|
19,613 |
|
|
|
— |
|
|
|
— |
|
|
|
— |
|
|
|
19,626 |
|
|
Tax related effects in connection with Corporate Reorganization and initial public offering |
|
|
— |
|
|
|
(117,276 |
) |
|
|
— |
|
|
|
— |
|
|
|
— |
|
|
|
(117,276 |
) |
|
December 31, 2016 |
|
|
917 |
|
|
|
1,017,368 |
|
|
|
(10,397 |
) |
|
|
— |
|
|
|
— |
|
|
|
1,007,888 |
|
See Accompanying Notes to Consolidated and Combined Financial Statements
F - 7
WILDHORSE RESOURCE DEVELOPMENT CORPORATION
NOTES TO CONSOLIDATED AND COMBINED FINANCIAL STATEMENTS
Note 1. Organization and Basis of Presentation
WildHorse Resource Development Corporation (the “Company”) is a publicly traded Delaware corporation, the common shares of which are listed on the New York Stock Exchange (“NYSE”) under the symbol “WRD.” Unless the context requires otherwise, references to “we,” “us,” “our,” “WRD,” or “the Company” are intended to mean the business and operations of WildHorse Resource Development Corporation and its consolidated subsidiaries.
Reference to “WHR II” or our “predecessor” refers to WildHorse Resources II, LLC, together with its consolidated subsidiaries. Reference to “Esquisto I” refers to Esquisto Resources, LLC. Reference to “Esquisto II” refers to Esquisto Resources II, LLC. Reference to “Esquisto Merger” refers to the merger of Esquisto I with and into Esquisto II on January 12, 2016. Reference to “Esquisto” refers (i) for the period beginning February 17, 2015 (date of common control) through January 11, 2016, to Esquisto I and Esquisto II on a combined basis and (ii) for the period beginning January 12, 2016 through the completion of our public offering on December 19, 2016, to Esquisto II. Reference to “Acquisition Co.” refers to WHE AcqCo., LLC, an entity that was formed to acquire the Burleson North assets (see Note 3). Reference “WildHorse Investment Holdings” refers to WildHorse Investment Holdings, LLC. Reference to “Previous owner” refers to both Esquisto and Acquisition Co.. Reference to “Esquisto Investment Holdings” refers to Esquisto Investment Holdings, LLC. Reference to “WildHorse Holdings” refers to WHR Holdings, LLC. Reference to “Esquisto Holdings” refers to Esquisto Holdings, LLC. Reference to “Acquisition Co. Holdings” refers to WHE AcqCo Holdings, LLC. Reference to “NGP” refers to Natural Gas Partners, a family of private equity investment funds organized to make direct equity investments in the energy industry, including the funds invested in WHR II, Esquisto and Acquisition Co.
The Company was formed in August 2016 to serve as a holding company for the assets of WHR II and Esquisto. We did not have any operations until we completed our initial public offering on December 19, 2016. In connection with our initial public offering and Corporate Reorganization (defined below), our accounting predecessor, WHR II was contributed to us. In addition to WHR II, we received Esquisto and Acquisition Co. We are an independent oil and natural gas company focused on the acquisition, exploitation, development and production of oil, natural gas and NGL resources.
Initial Public Offering and Corporate Reorganization
The Company issued and sold to the public in its initial public offering 27,500,000 shares of common stock. The gross proceeds from the sale of the common stock were $412.5 million, net of underwriting discounts of $14.1 million and other offering costs of $5.0 million. The net proceeds from our initial public offering were $393.4 million. Debt issuance costs of $2.9 million related to the establishment of the Company’s revolving credit facility were also incurred in conjunction with our initial public offering.
Contemporaneously with our initial public offering, (i) the owners of WHR II exchanged all of their interests in WHR II for equivalent interests in WildHorse Investment Holdings and the owners of Esquisto exchanged all of their interests in Esquisto for equivalent interests in Esquisto Investment Holdings, (ii) WildHorse Investment Holdings contributed all of the interests in WHR II to WildHorse Holdings, Esquisto Investment Holdings contributed all of the interests in Esquisto to Esquisto Holdings and the owner of Acquisition Co. contributed all of its interests in Acquisition Co. to Acquisition Co. Holdings and (iii) WildHorse Holdings, Esquisto Holdings and Acquisition Co. Holdings contributed all of the interests in WHR II, Esquisto and Acquisition Co., respectively, to us in exchange for shares of our common stock. We refer to these reorganization transactions as the “Corporate Reorganization.” As a result of the Corporate Reorganization, WHR II, Esquisto and Acquisition Co. became direct, wholly owned subsidiaries of WildHorse Resource Development Corporation. WHR II has two wholly owned subsidiaries – WildHorse Resources Management Company, LLC (“WHRM”) and Oakfield Energy LLC (“Oakfield”). Esquisto has two wholly owned subsidiaries – Petromax E&P Burleson, LLC and Burleson Water Resources, LLC. WHRM is the named operator for all oil and gas properties owned by us.
Basis of Presentation
Our predecessor’s financial statements were retrospectively recast due to common control considerations. Because WHR II, Esquisto and Acquisition Co. were under the common control of NGP, the sale and contribution of the respective ownership interests were accounted for as a combination of entities under common control, whereby the assets and liabilities sold and contributed were recorded based on historical cost. As such, the financial statements included herein (i) (a) as of, and for the year ended, December 31, 2016, and (b) as of December 31, 2015, and for the period from February 17, 2015 (the inception of common control) to December 31, 2015, have been derived from the combined financial position and results attributable to our predecessor and Esquisto for periods prior to our initial public offering and (ii) (a) for the period from January 1, 2015 to February 16, 2015 and (b) for the year ended December 31, 2014, have been derived from the results attributable to our predecessor. Furthermore, the results of Acquisition Co. are reflected in the financial statements presented herein beginning on December 19, 2016. For periods after the completion of our initial public offering, our consolidated financial statements include our accounts and those of our subsidiaries in which we have a controlling interest.
F - 8
WILDHORSE RESOURCE DEVELOPMENT CORPORATION
NOTES TO CONSOLIDATED AND COMBINED FINANCIAL STATEMENTS
Certain amounts in the prior year financial statements have been reclassified to conform to current presentation. Gathering, processing, and transportation costs were previously accounted for as revenue deductions and are now being presented as costs and expenses on our statements of operations on a separate line item. Oakfield drip condensate was reclassified from oil to other income.
All material intercompany transactions and balances have been eliminated in preparation of our consolidated and combined financial statements. The accompanying consolidated and combined financial statements have been prepared in accordance with accounting principles generally accepted in the United States of America (“GAAP”).
Note 2. Summary of Significant Accounting Policies
Use of Estimates in the Preparation of Financial Statements
Preparation of financial statements in conformity with GAAP requires management to make estimates and assumptions that affect reported amounts of assets and liabilities and disclosure of contingent assets and liabilities at the date of the financial statements, and the reported amounts of revenues and expenses during the reporting period. We base our estimates on historical experience and various other assumptions that are believed to be reasonable under the circumstances, the results of which form the basis for making judgments about carrying values of assets and liabilities that are not readily apparent from other sources. We evaluate the estimates and assumptions on a regular basis; however, actual results may differ from these estimates and assumptions used in the preparation of the financial statements. Significant estimates with regard to these financial statements include (1) the estimate of proved oil and gas reserves and related present value estimates of future net cash flows therefrom; (2) depreciation, depletion and amortization expense; (3) valuation of accounts receivable; (4) accrued capital expenditures and liabilities; (5) asset retirement obligations; (6) environmental remediation costs; (7) valuation of derivative instruments; (8) contingent liabilities and (9) impairment expense. Although management believes these estimates are reasonable, changes in facts and circumstances or discovery of new information may result in revised estimates, and such revisions could be material.
Cash and Cash Equivalents
We consider all highly liquid investment instruments purchased with original maturities of three months or less to be cash equivalents for purposes of the Consolidated and Combined Statements of Cash Flows and other statements. These investments are carried at cost, which approximates fair value. In case a book overdraft exists at the end of a period, we reclassify the negative cash amount to accounts payable.
Restricted Cash
Restricted cash consists of certificates of deposit in place to collateralize letters of credit. The letters of credit are required as part of normal business operations. The certificates of deposit will be in place for a period greater than 12 months and are considered noncurrent.
Oil and Gas Properties
We use the successful efforts method of accounting for natural gas and crude oil producing activities. Costs to acquire mineral interests in natural gas and crude oil properties are capitalized. Costs to drill and develop development wells and costs to drill and develop exploratory wells that find proved reserves are also capitalized. Costs to drill exploratory wells that do not find proved reserves, delay rentals and geological and geophysical costs are expensed.
The following table reflects the net changes in capitalized exploratory well costs for the periods indicated:
|
|
|
For Year Ended December 31, |
|
|||||||||
|
|
|
2016 |
|
|
2015 |
|
|
2014 |
|
|||
|
Balance, beginning of period |
|
$ |
15,198 |
|
|
$ |
11,134 |
|
|
$ |
— |
|
|
Balance at inception of common control |
|
|
— |
|
|
|
6,385 |
|
|
|
— |
|
|
Additions to capitalized exploratory well costs pending the determination of proved reserves |
|
|
60,847 |
|
|
|
96,726 |
|
|
|
11,134 |
|
|
Reclassifications to wells, facilities and equipment based on the determination of proved reserves |
|
|
(68,981 |
) |
|
|
(93,052 |
) |
|
|
— |
|
|
Capitalized exploratory well costs charged to expense |
|
|
— |
|
|
|
(5,995 |
) |
|
|
— |
|
|
Balance, end of period |
|
$ |
7,064 |
|
|
$ |
15,198 |
|
|
$ |
11,134 |
|
F - 9
WILDHORSE RESOURCE DEVELOPMENT CORPORATION
NOTES TO CONSOLIDATED AND COMBINED FINANCIAL STATEMENTS
We acquire leases on acreage not associated with proved reserves or held by production with the expectation of ultimately assigning proved reserves and holding the leases with production. The costs of acquiring these leases, including primarily brokerage costs and amounts paid to lessors, are capitalized and excluded from current amortization pending evaluation. When proved reserves are assigned, the leasehold costs associated with those leases are depleted as producing oil and gas properties. Costs associated with leases not held by production are impaired when events and circumstances indicate that carrying value of the properties is not recoverable. We recorded impairment of $3.0 million and $1.2 million as exploration expense for unproved oil and gas properties for the year ended December 31, 2016 and 2015, respectively. We had no leasehold impairment expense for the year ended December 31, 2014.
Capitalized costs of producing natural gas and crude oil properties and support equipment, net of estimated salvage values, are depleted by field using the units-of-production method. Well and well equipment and tangible property additions are depleted over proved developed reserves and leasehold costs are depleted over total proved reserves.
Proved oil and gas properties are reviewed for impairment when events and circumstances indicate a potential decline in the fair value of such properties below the carrying value, such as a downward revision of the reserve estimates or lower commodity prices. We estimate the undiscounted future cash flows expected in connection with the properties and compare such future cash flows to the carrying amounts of the properties to determine if the carrying amounts are recoverable. If the carrying value of the properties is determined to not be recoverable based on the undiscounted cash flows, an impairment charge is recognized by comparing the carrying value to the estimated fair value of the properties. The factors used to determine fair value include, but are not limited to, estimates of proved and probable reserves, future commodity prices, the timing of future production and capital expenditures and a discount rate commensurate with the risk reflective of the lives remaining for the respective oil and gas properties. We recorded impairment expense of $9.3 million and $24.7 million to proved oil and gas properties for the year ended December 31, 2015 and 2014, respectively. The impairment resulted from lower projected oil and gas prices and a drop in projected remaining reserves in East Texas and our non-core fields.
Oil and Gas Reserves
The estimates of proved natural gas, crude oil and natural gas liquids reserves utilized in the preparation of the financial statements are estimated in accordance with guidelines established by the Securities and Exchange Commission (“SEC”) and the Financial Accounting Standards Board (“FASB”), which require that reserve estimates be prepared under existing economic and operating conditions using a 12-month average price with no provision for price and cost escalations in future years except by contractual arrangements. Proved reserves are, with respect to WHR II, prepared by WHR II and audited by Cawley, Gillespie & Associates, Inc. (“Cawley”), its independent reserve engineer. With respect to Esquisto, the proved reserves were prepared by Cawley, its independent reserve engineer, for 2015. Esquisto’s proved reserves for 2016 were internally prepared and audited by Cawley.
We emphasize that reserve estimates are inherently imprecise. Accordingly, the estimates are expected to change as more current information becomes available. It is possible that, because of changes in market conditions or the inherent imprecision of these reserve estimates, the estimates of future cash inflows, future gross revenues, the amount of natural gas, crude oil and natural gas liquids reserves, the remaining estimated lives of the natural gas and crude oil properties, or any combination of the above may be increased or reduced. See Note 19—“Supplemental Oil and Gas Information (Unaudited)” for further information.
Gathering System
In 2015, our Oakfield subsidiary constructed and began operating a 15.2 mile 16” natural gas gathering system in order to provide sufficient, cost effective access to major markets for our existing and expected future production from new horizontal wells in North Louisiana. The wells are charged a fee for gathering services based on their throughput volumes and gas quality. In 2016, only wells operated by us were connected to the system. We are depreciating the Oakfield gathering assets on a straight-line basis over the current expected reserve life of wells connected to the system.
Other Property and Equipment
Other property and equipment includes our natural gas gathering system, leasehold improvements, office furniture, automobiles, computer equipment, software, pipelines, office buildings and land. Other property and equipment is depreciated using a straight-line method over the expected useful lives of the respective assets. Leasehold improvements are amortized over the remaining term of the lease and land is not depreciated or amortized.
F - 10
WILDHORSE RESOURCE DEVELOPMENT CORPORATION
NOTES TO CONSOLIDATED AND COMBINED FINANCIAL STATEMENTS
We capitalize interest costs to oil and gas properties on expenditures made in connection with certain projects such as drilling and completion of new oil and natural gas wells and major facility installations. Interest is capitalized only for the period that such activities are in progress. Interest is capitalized using a weighted average interest rate based on our outstanding borrowings. For the year ended December 31, 2016, 2015 and 2014, we recorded $0.1 million, $0.8 million $0.2 million in capitalized interest, respectively.
Properties Acquired in Business Combinations
Assets and liabilities acquired in a business combination are required to be recorded at fair value. If sufficient market data is not available, we determine the fair values of proved and unproved properties acquired in transactions accounted for as business combinations by preparing our own estimates of crude oil and natural gas reserves. To compensate for the inherent risk of estimating and valuing unproved reserves, discounted future net cash flows of probable and possible reserves are reduced by additional risk-weighting factors. See Note 3—“Acquisitions and Divestitures.”
Asset Retirement Obligations
We recognize a liability equal to the fair value of the estimated cost to plug and abandon our natural gas and crude oil wells and associated equipment. The liability and the associated increase in the related long-lived asset are recorded in the period in which the related assets are placed in service or acquired. The liability is accreted to its expected future cost each period and the capitalized cost is depleted using the units-of-production method of the related asset. The accretion expense is included in depreciation, depletion and amortization expense.
The fair value of the estimated cost is based on historical experience, managements’ expertise and third-party proposals for plugging and abandoning wells. The estimated remaining lives of the wells is based on reserve life estimates and federal and state regulatory requirements. At the time the related long-lived asset is placed in service, the estimated cost is adjusted for inflation based on the remaining life, then discounted using a credit-adjusted risk-free rate to determine the fair value.
Revisions to the liability could occur due to changes in estimates of plugging and abandonment costs, including non-operated plug and abandonment expense, changes in the remaining lives of the wells, or if federal or state regulators enact new plugging and abandonment requirements. At the time of abandonment, we recognize a gain or loss on abandonment to the extent that actual costs do not equal the estimated costs.
Environmental Costs
As an owner or lessee and operator of oil and gas properties, we are subject to various federal, state and local laws and regulations relating to discharge of materials into, and protection of, the environment. Environmental expenditures that relate to an existing condition caused by past operations and that do not have future economic benefit are expensed. Liabilities related to future costs are recorded on an undiscounted basis when environmental assessments and/or remediation activities are probable and the costs can be reasonably estimated.
Revenue Recognition and Oil and Gas Imbalances
Revenues from the sale of oil, natural gas and NGLs are recognized when the product is delivered at a fixed or determinable price, title has transferred, and collectability is reasonably assured and evidenced by a contract. We recognize revenues from the sale of oil, natural gas and NGLs using the sales method of accounting, whereby revenue is recorded based on our share of volume sold, regardless of whether we have taken our proportional share of volume produced. These differences result in gas imbalances. We record a liability to the extent there are not sufficient reserves to cover an over delivered gas imbalance. No receivables are recorded for those wells on which the Company has taken less than its proportionate share of production. We receive payment approximately one month after delivery for operated wells and up to three months after delivery for non-operated wells. At the end of each month, we estimate the amount of production delivered to purchasers and the price we will receive. Variances between our estimates and the actual amounts received are recorded in the month payment is received. No receivables are recorded for those wells on which we have taken less than our proportionate share of production.
Incentive Units
For details regarding incentive units issued by our predecessor, please see “Note 13. Incentive Units.”
F - 11
WILDHORSE RESOURCE DEVELOPMENT CORPORATION
NOTES TO CONSOLIDATED AND COMBINED FINANCIAL STATEMENTS
We grant credit to creditworthy independent and major natural gas and crude oil marketing companies for the sale of crude oil, natural gas and natural gas liquids. In addition, we grant credit to our oil and gas working interest partners. Receivables from our working interest partners are generally secured by the underlying ownership interests in the properties.
Accounts receivable balances primarily relate to joint interest billings and oil and gas sales, net of our interest. The accounts receivable balance generally includes two months of accrued revenues for operated properties and three months of accrued revenues for non-operated properties net of any collections related to those periods. The accounts receivable balance also includes other miscellaneous balances.
Accounts receivable are recorded at the amount we expect to collect. We use the specific identification method of providing allowances for doubtful accounts. We recorded a provision for uncollectible accounts of $0.1 million at both December 31, 2016 and 2015.
Derivative Instruments
We periodically enter into derivative contracts to manage our exposure to commodity price risk. These derivative contracts, which are placed with major financial institutions that we believe have minimal credit risks, take the form of variable to fixed price swaps collars and puts. The natural gas reference price, upon which the commodity derivative contracts are based, reflects market indices that have a high degree of historical correlation with actual prices received for natural gas sales.
All derivative instruments are recorded on the balance sheet as either an asset or liability measured at fair value. Derivative instruments are netted when the right to net exists under a master netting agreement, future liabilities and assets correspond to the same commodity type and future cash flows have the same balance sheet current or non-current classification. Changes in fair value are recognized currently in earnings. Realized and unrealized gains and losses from our oil, gas and natural gas liquids derivatives are recorded as a component of “Other income (expense)” on our Statements of Consolidated and Combined Operations. We compute the fair value of the unrealized gains and losses of our derivative instruments using forward prices and dealer quotes provided by a third party.
Lease Expenses
We record escalating lease expenses for our corporate office over the life of the lease on a straight-line basis.
Debt Issuance Costs
Debt issuance costs associated with line-of-credit arrangements, including arrangements with no outstanding borrowings, are classified as an asset, and amortized over the term of the arrangements. Debt issuance costs related to term loans and senior notes are presented as a direct deduction from the carrying amount of the associated debt liability and amortized over the term of the associated debt using the effective yield method.
Fair Value Measurements
Accounting guidance for fair value measurements establishes a fair value hierarchy, which prioritizes the inputs to valuation techniques used to measure fair value into three levels. The fair value hierarchy gives the highest priority to quoted market prices (unadjusted) in active markets for identical assets or liabilities (Level 1) and the lowest priority to unobservable inputs (Level 3). Level 2 inputs are inputs, other than quoted prices included within Level 1, which are observable for the asset or liability, either directly or indirectly. We use Level 1 inputs when available as Level 1 inputs generally provide the most reliable evidence of fair value. See Note 4—“Fair Value Measurements of Financial Instruments.”
Income Taxes
We are a corporation subject to federal and certain state income taxes. Prior to our initial public offering, we were primarily organized as pass-through entities for federal income tax purposes and were not subject to federal income taxes.
We use the asset and liability method of accounting for income taxes, under which deferred tax assets and liabilities are recognized for the future tax consequences of (1) temporary differences between the tax basis in assets and liabilities and their reported amounts in the financial statements and (2) operating loss and tax credit carry forwards. Deferred income tax assets and liabilities are based on enacted tax rates applicable to the future period when those temporary differences are expected to be recovered
F - 12
WILDHORSE RESOURCE DEVELOPMENT CORPORATION
NOTES TO CONSOLIDATED AND COMBINED FINANCIAL STATEMENTS
or settled. Deferred tax assets are reduced by a valuation allowance if, based on the weight of available evidence, it is more likely than not that some portion or all of deferred tax assets will not be realized. We recognize interest and penalties accrued to unrecognized tax benefits in other income (expense) in our Consolidated and Combined Statement of Operations.
We recognize a tax benefit from an uncertain tax position when it is more likely than not that the position will be sustained upon examination, based on the technical merits of the position. The tax benefit recorded is equal to the largest amount that is greater than 50% likely to be realized through effective settlement with a taxing authority.
Commitments and Contingencies
Accruals for loss contingencies arising from claims, assessments, litigation, environmental and other sources are recorded when it is probable that a liability has been incurred and the amount can be reasonably estimated. These accruals are adjusted as additional information becomes available or circumstances change.
Supplemental Cash Flow Information
Supplement cash flow for the periods presented:
|
|
|
For Year Ended December 31, |
|
|||||||||
|
|
|
2016 |
|
|
2015 |
|
|
2014 |
|
|||
|
Supplemental cash flows: |
|
|
|
|
|
|
|
|
|
|
|
|
|
Cash paid for interest |
|
$ |
7,152 |
|
|
$ |
7,253 |
|
|
$ |
2,515 |
|
|
Noncash investing activities: |
|
|
|
|
|
|
|
|
|
|
|
|
|
(Decrease) increase in capital expenditures in accounts payables and accrued liabilities |
|
|
(4,492 |
) |
|
|
349 |
|
|
|
5,530 |
|
New Accounting Standards
Definition of a Business. In January 2017, the FASB issued an accounting standards update to clarify the definition of a business. The definition of a business affects many areas of accounting including acquisitions, disposals, goodwill, and consolidation. The amendments are intended to help companies and other organizations evaluate whether transactions should be accounted for as acquisitions (or disposals) of assets or businesses. The amendments provide a more robust framework to use in determining when a set of assets and activities is a business. The amendments are effective for annual periods beginning after December 15, 2017, including interim periods within those periods. Early adoption is permitted and the guidance is to be applied on a prospective basis to purchases or disposals of a business or an asset. The Company is currently evaluating the impact of this standard on its consolidated financial statements.
Statement of Cash Flows – Restricted Cash a consensus of the FASB Emerging Issues Task Force. In November 2016, the FASB issued an accounting standards update to clarify the guidance on the classification and presentation of restricted cash in the statement of cash flows. The changes in restricted cash and restricted cash equivalents that result from the transfers between cash, cash equivalents, and restricted cash and restricted cash equivalents should not be presented as cash flow activities in the statement of cash flows. The new guidance is effective for reporting periods beginning after December 15, 2017 and interim periods within those fiscal years. Early adoption is permitted, including adoption in an interim period. The new guidance requires transition under a retrospective approach for each period presented. The Company is currently assessing the impact the adoption of this new guidance will have on our consolidated financial statements and related disclosures.
Statement of Cash Flows – Classification of Certain Cash Receipts and Cash Payments. In August 2016, the FASB issued an accounting standards update to address eight specific cash flow issues with the objective of reducing the current and potential future diversity in practice. The new guidance is effective for reporting periods beginning after December 15, 2017 and interim periods within those fiscal years. Early adoption is permitted, including adoption in an interim period. The new guidance requires transition under a retrospective approach for each period presented. If it is impracticable to apply the amendments retrospectively for some of the issues, the amendments for those issues would be applied prospectively as of the earliest date practicable. The Company is currently assessing the impact the adoption of this new guidance will have on our consolidated financial statements and related disclosures.
Improvements to Employee Share-Based Payment Accounting. In March 2016, the FASB issued an accounting standards update to simplify the guidance on employee share-based payment accounting. The update involves several aspects of accounting for share-based payment transactions, including the income tax consequences, classification of awards as either equity or liabilities, and classification in the statement of cash flows. Entities will no longer record excess tax benefits and certain tax deficiencies in equity.
F - 13
WILDHORSE RESOURCE DEVELOPMENT CORPORATION
NOTES TO CONSOLIDATED AND COMBINED FINANCIAL STATEMENTS
Instead, they will record all excess tax benefits and tax deficiencies as income tax expense or benefit in the income statement. In addition, the new guidance eliminates the requirement that excess tax benefits be realized before entities can recognize them and requires entities to present excess tax benefits as an operating activity on the statement of cash flows rather than as a financing activity. Furthermore, the new guidance will increase the amount an employer can withhold to cover income taxes on awards and still qualify for the exception to liability classification for shares used to satisfy the employer’s statutory income tax withholding obligation. The new guidance requires an entity to classify the cash paid to a tax authority when shares are withheld to satisfy its statutory income tax withholding obligation as a financing activity on the statement of cash flows. In addition, entities will now have to elect whether to account for forfeitures on share-based payments by: (i) recognizing forfeitures of awards as they occur or (ii) estimating the number of awards expected to be forfeited and adjusting the estimate when it is likely to change, as is currently required. For the amendments that change the recognition and measurement of share-based payment awards, the new guidance requires transition under a modified retrospective approach, with a cumulative-effect adjustment made to retained earnings as of the beginning of the fiscal period in which the guidance is adopted. Prospective application is required for the accounting for excess tax benefits and tax deficiencies. This new standard will be effective for annual periods beginning after December 15, 2016. Early adoption is permitted. The Company adopted this guidance as of January 1, 2017 and it did not have a material impact on our consolidated financial statements. We elected to account for forfeitures on share-based payments by recognizing forfeitures of awards as they occur.
Leases. In February 2016, the FASB issued a revision to its lease accounting guidance. The FASB retained a dual model, requiring leases to be classified as either direct financing or operating leases. The classification will be based on criteria that are similar to the current lease accounting treatment. The revised guidance requires lessees to recognize a right-of-use asset and lease liability for all leasing transactions regardless of classification. For leases with a term of 12 months or less, a lessee is permitted to make an accounting policy election by class of underlying asset not to recognize lease assets and lease liabilities. If a lessee makes this election, it should recognize lease expense for such leases generally on a straight-line basis over the lease term. The amendments are effective for financial statements issued for annual periods beginning after December 15, 2018 and interim periods within those fiscal years. Early adoption is permitted for all entities as of the beginning of an interim or annual reporting period. The revised guidance must be adopted using a modified retrospective transition and provides for certain practical expedients.
Transition will require application of the new guidance at the beginning of the earliest comparative period presented. We are currently evaluating the standard and the impact on our financial statements and related footnote disclosures.
Balance Sheet Classification of Deferred Taxes. In November 2015, the FASB issued an accounting standards update that requires entities with a classified balance sheet to present all deferred tax assets and liabilities as noncurrent. The current requirement that deferred tax assets and liabilities of a tax-paying component of an entity be offset and presented as a single amount is not affected by the amendment. The amendments are effective for financial statements issued for annual periods beginning after December 15, 2016, and interim periods within those annual periods. Early adoption is permitted for all entities as of the beginning of an interim or annual reporting period. The amendments may be applied either prospectively to all deferred tax assets and liabilities or retrospectively to all periods presented. We early adopted this guidance and it did not have a material impact on our financial statements and related disclosures.
Simplifying the Accounting for Measurement-Period Adjustments. In September 2015, the FASB issued an accounting standards update that eliminates the requirement that an acquirer in a business combination account for measurement-period adjustments retrospectively. Instead, an acquirer will recognize a measurement-period adjustment during the period in which it determines the amount of the adjustment. Disclosure of the effect on earnings of any amounts an acquirer would have recorded in previous periods if the accounting had been completed at the acquisition date is required. The disclosure is required for each affected income statement line item, and may be presented separately on the face of the income statement or in the notes to the financial statements. The new guidance should be applied prospectively to adjustments to provisional amounts that occur after the effective date and is effective for fiscal years beginning after December 15, 2015, and interim periods within those fiscal years. The impact of adopting this guidance was not material to our financial statements and related disclosures.
Presentation of Debt Issuance Cost. In April 2015, the FASB issued an accounting standards update that requires debt issuance costs related to a recognized debt liability to be presented in the balance sheet as a direct deduction from the carrying value of that debt liability, consistent with debt discounts. The guidance is effective retrospectively for fiscal years, and interim periods within those years, beginning after December 15, 2015. In August 2015, the FASB issued an accounting standards update that incorporates SEC guidance clarifying that the SEC would not object to debt issuance costs related to line-of-credit arrangements being deferred and presented as an asset that is subsequently amortized over the term of the line-of-credit arrangement, regardless of whether there are any outstanding borrowings on the line-of-credit arrangement. The impact of adopting this guidance was not material to our financial statements and related disclosures.
F - 14
WILDHORSE RESOURCE DEVELOPMENT CORPORATION
NOTES TO CONSOLIDATED AND COMBINED FINANCIAL STATEMENTS
Revenue from Contracts with Customers. In May 2014, the FASB issued a comprehensive new revenue recognition standard for contracts with customers that will supersede most current revenue recognition guidance, including industry-specific guidance. The core principle of this standard is that an entity should recognize revenue to depict the transfer of promised goods or services to customers in an amount that reflects the consideration to which the entity expects to be entitled in exchange for those goods or services. To achieve this core principle, the standard provides a five-step analysis of transactions to determine when and how revenue is recognized. In August 2015, the FASB issued an accounting standards update that formally delayed the effective date of its new revenue recognition standard. The new standard is now effective for fiscal years, and interim periods within those years, beginning after December 15, 2017. Early adoption is permitted for fiscal years, and interim periods within those years, beginning after December 15, 2016. The standard permits the use of either the retrospective or cumulative effect transition method. This guidance will be applicable to us beginning on January 1, 2018. We are currently assessing the impact that adopting this new accounting guidance will have on our consolidated financial statements and footnote disclosures, if any.
Other accounting standards that have been issued by the FASB or other standards-setting bodies are not expected to have a material impact on our consolidated financial statements and footnote disclosures.
Note 3. Acquisitions and Divestitures
We account for third-party acquisitions under the acquisition method. The assets acquired and the liabilities assumed have been measured at fair value based on various estimates. These estimates are based on key assumptions related to the business combination, including reviews of publicly disclosed information for other acquisitions in the industry, historical experience of the companies, data that was available through the public domain and due diligence reviews of the acquiree businesses. Acquisition-related transaction costs and acquisition-related restructuring charges are not included as components of consideration transferred but are accounted for as expenses in the period in which the costs are incurred.
Acquisition-related costs
Acquisition-related costs for both related party and third party transactions are included in general and administrative expenses in the accompanying statements of operations for the periods indicated below (in thousands):
|
For the Year Ended December 31, |
|
|||||||||
|
2016 |
|
|
2015 |
|
|
2014 |
|
|||
|
$ |
553 |
|
|
$ |
593 |
|
|
$ |
1,450 |
|
2016 Acquisitions
Burleson North Acquisition. On December 19, 2016, in connection with our initial public offering, we completed an acquisition of approximately 158,000 net acres of oil and gas properties adjacent to our existing Eagle Ford acreage at an aggregate purchase price of $389.8 million in cash (the “Burleson North Acquisition”), after preliminary customary post-closing adjustments. We allocated $163.8 million of the purchase price to unproved oil and natural gas properties. Revenues of $2.0 million were recorded in the statement of operations and generated a loss of approximately $0.4 million subsequent to the closing date.
The following table summarizes the preliminary fair value assessment of the assets acquired and liabilities assumed as of the acquisition date (in thousands):
|
|
|
Preliminary Purchase Price |
|
|
|
Oil and gas properties |
|
$ |
396,481 |
|
|
Other property and equipment |
|
|
478 |
|
|
Accounts receivable |
|
|
3,160 |
|
|
Asset retirement obligations |
|
|
(3,101 |
) |
|
Accrued liabilities |
|
|
(7,206 |
) |
|
Total identifiable net assets |
|
$ |
389,812 |
|
Rosewood Acquisition. On December 19, 2016, we acquired from certain third parties approximately 7,500 net acres, consisting primarily of additional working interests in our Eagle Ford Acreage in Lee County (the “Rosewood Acquisition”). The closing of the acquisition occurred contemporaneously with the closing of our initial public offering, and we issued 1,308,427 shares to such third
F - 15
WILDHORSE RESOURCE DEVELOPMENT CORPORATION
NOTES TO CONSOLIDATED AND COMBINED FINANCIAL STATEMENTS
parties as consideration. We allocated $18.3 million of the purchase price to unproved oil and natural gas properties with the remainder allocated to proved oil and natural gas properties.
November Acquisition. On November 8, 2016, Esquisto acquired from certain third parties approximately 4,900 net acres and nine producing wells in Burleson County for approximately $30.0 million (the “November Acquisition”), of which $29.4 million of the purchase price was allocated to unproved oil and natural gas properties with the remainder allocated to proved oil and natural gas properties.
The following table summarizes the fair value assessment of the assets acquired and liabilities assumed as of the acquisition date for the November Acquisition and Rosewood Acquisition (in thousands):
|
|
|
Rosewood Acquisition |
|
|
November Acquisition |
|
||
|
Oil and gas properties |
|
|
19,626 |
|
|
|
29,973 |
|
The following unaudited pro forma combined results of operations are provided for the years ended December 31, 2016 and 2015 as though the Burleson North Acquisition had been completed on January 1, 2015. The unaudited pro forma financial information was derived from the historical combined statements of operations of the Company, the predecessor and previous owners and adjusted to include: (i) the revenues and direct operating expenses associated with oil and gas properties acquired and (ii) depletion expense applied to the adjusted basis of the properties acquired. The unaudited pro forma financial information does not purport to be indicative of results of operations that would have occurred had the transaction occurred on the basis assumed above, nor is such information indicative of expected future results of operations.
|
|
|
For Year Ended December 31, |
|
|||||
|
|
|
2016 |
|
|
2015 |
|
||
|
Revenues |
|
$ |
176,082 |
|
|
$ |
172,044 |
|
|
Net income (loss) |
|
|
(34,894 |
) |
|
|
(83,894 |
) |
|
Basic and diluted earnings per unit |
|
n/a |
|
|
n/a |
|
||
2015 Acquisitions
Comstock Acquisition. In July 2015, Esquisto acquired oil and natural gas producing properties, undeveloped acreage and water assets from a wholly owned subsidiary of Comstock Resources, Inc. for a total purchase price of $103.0 million, net of customary post-closing adjustments.
The following table summarizes the fair value assessment of the assets acquired and liabilities assumed as of the acquisition date (in thousands):
|
|
|
Comstock Acquisition |
|
|
|
Oil and gas properties |
|
$ |
102,628 |
|
|
Other property and equipment |
|
|
500 |
|
|
Asset retirement obligations |
|
|
(112 |
) |
|
Total identifiable net assets |
|
$ |
103,016 |
|
2014 Acquisitions
On February 7, 2014, the predecessor acquired certain oil and gas properties in east Texas for cash consideration of $16.0 million, net of customary post-closing adjustments. The purchase price was primarily allocated to oil and gas properties.
On June 3, 2014, the predecessor acquired oil and gas producing properties and leases in north Louisiana for cash consideration of $37.1 million, net of customary post-closing adjustments. Assumed liabilities included suspended amounts payable to royalty and other working interest owners. The purchase price was primarily allocated to oil and gas properties.
On October 13, 2014, the predecessor acquired oil and gas producing properties and leases in north Louisiana for cash consideration of $12.8 million, net of customary post-closing adjustments. Assumed liabilities include suspended amounts payable to royalty and other working interest owners. The purchase price was primarily allocated to oil and gas properties.
F - 16
WILDHORSE RESOURCE DEVELOPMENT CORPORATION
NOTES TO CONSOLIDATED AND COMBINED FINANCIAL STATEMENTS
Note 4. Fair Value Measurements of Financial Instruments
Fair value is defined as the price that would be received to sell an asset or paid to transfer a liability in an orderly transaction between market participants at a specified measurement date. Fair value estimates are based on either (i) actual market data or (ii) assumptions that other market participants would use in pricing an asset or liability, including estimates of risk. A three-tier hierarchy has been established that classifies fair value amounts recognized or disclosed in the financial statements. The hierarchy considers fair value amounts based on observable inputs (Levels 1 and 2) to be more reliable and predictable than those based primarily on unobservable inputs (Level 3). The characteristics of fair value amounts classified within each level of the hierarchy are described as follows:
Level 1 — Unadjusted quoted prices in active markets that are accessible at the measurement date for identical, unrestricted assets or liabilities. An active market is one in which transactions for the assets or liabilities occur in sufficient frequency and volume to provide pricing information on an ongoing basis.
Level 2 — Quoted prices in markets that are not active, or inputs that are observable, either directly or indirectly, for substantially the full term of the asset or liability. Substantially all of these inputs are observable in the marketplace throughout the full term of the derivative instrument, can be derived from observable data, or are supported by observable levels at which transactions are executed in the marketplace. At December 31, 2016 and 2015, all of the derivative instruments reflected on the accompanying balance sheets were considered Level 2.
Level 3 — Measure based on prices or valuation models that require inputs that are both significant to the fair value measurement and are less observable from objective sources (i.e., supported by little or no market activity).
Assets and Liabilities Measured at Fair Value on a Recurring Basis
The carrying values of cash and cash equivalents, restricted cash, accounts receivables, accounts payables (including accrued liabilities) and amounts outstanding under long-term debt agreements with variable rates included in the accompanying balance sheets approximated fair value at December 31, 2016 and December 31, 2015. The fair value estimates are based upon observable market data and are classified within Level 2 of the fair value hierarchy. These assets and liabilities are not presented in the following tables.
The fair market values of the derivative financial instruments reflected on the balance sheets as of December 31, 2016 and December 31, 2015 were based on estimated forward commodity prices (including nonperformance risk). Nonperformance risk is the risk that the obligation related to the derivative instrument will not be fulfilled. Financial assets and liabilities are classified based on the lowest level of input that is significant to the fair value measurement in its entirety. The significance of a particular input to the fair value measurement requires judgment, and may affect the valuation of the fair value of assets and liabilities and their placement within the fair value hierarchy levels.
The following table presents the derivative assets and liabilities that are measured at fair value on a recurring basis at December 31, 2016 and December 31, 2015 for each of the fair value hierarchy levels:
|
|
|
Fair Value Measurements at December 31, 2016 Using |
|
|||||||||||||
|
|
|
Quoted Prices in Active Market (Level 1) |
|
|
Significant Other Observable Inputs (Level 2) |
|
|
Significant Unobservable Inputs (Level 3) |
|
|
Fair Value |
|
||||
|
|
|
(In thousands) |
|
|||||||||||||
|
Assets: |
|
|
|
|
|
|
|
|
|
|
|
|
|
|
|
|
|
Commodity derivatives |
|
$ |
— |
|
|
$ |
7 |
|
|
$ |
— |
|
|
$ |
— |
|
|
|
|
|
|
|
|
|
|
|
|
|
|
|
|
|
|
|
|
Liabilities: |
|
|
|
|
|
|
|
|
|
|
|
|
|
|
|
|
|
Commodity derivatives |
|
$ |
— |
|
|
$ |
22,185 |
|
|
$ |
— |
|
|
$ |
22,185 |
|
F - 17
WILDHORSE RESOURCE DEVELOPMENT CORPORATION
NOTES TO CONSOLIDATED AND COMBINED FINANCIAL STATEMENTS
|
|
|
Fair Value Measurements at December 31, 2015 Using |
|
|||||||||||||
|
|
|
Quoted Prices in Active Market (Level 1) |
|
|
Significant Other Observable Inputs (Level 2) |
|
|
Significant Unobservable Inputs (Level 3) |
|
|
Fair Value |
|
||||
|
|
|
(In thousands) |
|
|||||||||||||
|
Assets: |
|
|
|
|
|
|
|
|
|
|
|
|
|
|
|
|
|
Commodity derivatives |
|
$ |
— |
|
|
$ |
9,764 |
|
|
$ |
— |
|
|
$ |
9,764 |
|
|
|
|
|
|
|
|
|
|
|
|
|
|
|
|
|
|
|
|
Liabilities: |
|
|
|
|
|
|
|
|
|
|
|
|
|
|
|
|
|
Commodity derivatives |
|
$ |
— |
|
|
$ |
248 |
|
|
$ |
— |
|
|
$ |
248 |
|
Assets and Liabilities Measured at Fair Value on a Nonrecurring Basis
Certain assets and liabilities are reported at fair value on a nonrecurring basis as reflected on the balance sheets. The following methods and assumptions are used to estimate the fair values:
|
|
• |
The fair value of asset retirement obligations (“AROs”) is based on discounted cash flow projections using numerous estimates, assumptions, and judgments regarding such factors as the existence of a legal obligation for an ARO; amounts and timing of settlements; the credit-adjusted risk-free rate; and inflation rates. See Note 8 for a summary of changes in AROs. |
|
|
• |
If sufficient market data is not available, the determination of the fair values of proved and unproved properties acquired in transactions accounted for as business combinations are prepared by utilizing estimates of discounted cash flow projections. The factors to determine fair value include, but are not limited to, estimates of: (i) economic reserves; (ii) future operating and development costs; (iii) future commodity prices; and (iv) a market-based weighted average cost of capital. To compensate for the inherent risk of estimating and valuing unproved properties, the discounted future net revenues of probable and possible reserves are reduced by additional risk-weighting factors. The fair value of supporting equipment, such as plant assets, acquired in transactions accounted for as business combinations are commonly estimated using the depreciated replacement cost approach. |
|
|
• |
Proved oil and natural gas properties are reviewed for impairment when events and circumstances indicate the carrying value of such properties may not be recoverable. The factors used to determine fair value include, but are not limited to, estimates of proved reserves, future commodity prices, the timing of future production and capital expenditures and a discount rate commensurate with the risk reflective of the lives remaining for the respective oil and gas properties. |
|
|
▪ |
During the years ended December 31, 2015 and 2014, we recognized $9.3 million and $24.7 million, respectively, of impairments. The impairments primarily related to certain properties located in East Texas and our non-core fields. The estimated future cash flows expected from these properties were compared to their carrying values and determined to be unrecoverable primarily due to declining commodity prices. We did not record impairments for the year ended December 31, 2016. |
Note 5. Risk Management and Derivative and Other Financial Instruments
We have entered into certain derivative arrangements with respect to portions of our oil and natural gas production to reduce our sensitivity to volatile commodity prices. None of our derivative instruments are designated as cash flow hedges. We believe that these derivative arrangements, although not free of risk, allow us to achieve more predictable cash flows and to reduce exposure to commodity price fluctuations. However, derivative arrangements limit the benefit of increases in the prices of oil and natural gas sales. Moreover, our derivative arrangements apply only to a portion of our production and provide only partial protection against declines in commodity prices. Such arrangements may expose us to risk of financial loss in certain circumstances. We continuously reevaluate our risk management program in light of changes in production, market conditions, commodity price forecasts, capital spending, interest rate forecasts and debt service requirements.
F - 18
WILDHORSE RESOURCE DEVELOPMENT CORPORATION
NOTES TO CONSOLIDATED AND COMBINED FINANCIAL STATEMENTS
We have fixed price commodity swaps, collars and deferred purchased puts to accomplish our hedging strategy. Collars consist of a sold call and a purchased put that establishes a ceiling and floor price for expected future oil and natural gas sales. Derivative instruments are netted when the right to net exists under a master netting agreement, future liabilities and assets correspond to the same commodity type and future cash flows have the same balance sheet current or non-current classification. We have exposure to financial institutions in the form of derivative transactions. These transactions are with counterparties in the financial services industry, specifically with members of our bank group. These transactions could expose us to credit risk in the event of default of our counterparties. We have master netting agreements for our derivative transactions with our counterparties and although we do not require collateral, we believe our counterparty risk is low because of the credit worthiness of our counterparties. See Note 4—“Fair Value Measurements of Financial Instruments” for further information.
The following derivative contracts were in place at December 31, 2016:
|
|
|
2017 |
|
|
2018 |
|
|
2019 |
|
|||
|
Natural Gas Derivative Contracts: |
|
|
|
|
|
|
|
|
|
|
|
|
|
Fixed price swap contracts: |
|
|
|
|
|
|
|
|
|
|
|
|
|
Volume (MMBtu) |
|
|
9,029,600 |
|
|
|
11,565,800 |
|
|
|
9,877,900 |
|
|
Weighted-average fixed price |
|
$ |
3.15 |
|
|
$ |
3.03 |
|
|
$ |
2.81 |
|
|
|
|
|
|
|
|
|
|
|
|
|
|
|
|
Collar contracts: |
|
|
|
|
|
|
|
|
|
|
|
|
|
Volume (MMBtu) |
|
|
5,520,000 |
|
|
|
— |
|
|
|
— |
|
|
Weighted-average floor price |
|
$ |
3.00 |
|
|
$ |
— |
|
|
$ |
— |
|
|
Weighted-average ceiling price |
|
$ |
3.36 |
|
|
$ |
— |
|
|
$ |
— |
|
|
|
|
|
|
|
|
|
|
|
|
|
|
|
|
Put options: |
|
|
|
|
|
|
|
|
|
|
|
|
|
Volume (MMBtu) |
|
|
1,068,350 |
|
|
|
— |
|
|
|
— |
|
|
Weighted-average floor price |
|
$ |
3.40 |
|
|
$ |
— |
|
|
$ |
— |
|
|
Weighted-average put premium |
|
$ |
(0.35 |
) |
|
$ |
— |
|
|
$ |
— |
|
|
|
|
|
|
|
|
|
|
|
|
|
|
|
|
Crude Oil Derivative Contracts: |
|
|
|
|
|
|
|
|
|
|
|
|
|
Fixed price swap contracts: |
|
|
|
|
|
|
|
|
|
|
|
|
|
Volume (Bbls) |
|
|
2,146,300 |
|
|
|
1,638,500 |
|
|
|
1,381,300 |
|
|
Weighted-average fixed price |
|
$ |
52.90 |
|
|
$ |
53.68 |
|
|
$ |
54.92 |
|
|
|
|
|
|
|
|
|
|
|
|
|
|
|
|
Collar contracts: |
|
|
|
|
|
|
|
|
|
|
|
|
|
Volume (Bbls) |
|
|
60,784 |
|
|
|
25,096 |
|
|
|
— |
|
|
Weighted-average floor price |
|
$ |
50.00 |
|
|
$ |
50.00 |
|
|
$ |
— |
|
|
Weighted-average ceiling price |
|
$ |
62.10 |
|
|
$ |
62.10 |
|
|
$ |
— |
|
|
|
|
|
|
|
|
|
|
|
|
|
|
|
|
Put options: |
|
|
|
|
|
|
|
|
|
|
|
|
|
Volume (Bbls) |
|
|
636,400 |
|
|
|
— |
|
|
|
— |
|
|
Weighted-average floor price |
|
$ |
55.00 |
|
|
$ |
— |
|
|
$ |
— |
|
|
Weighted-average put premium |
|
$ |
(4.76 |
) |
|
$ |
— |
|
|
$ |
— |
|
F - 19
WILDHORSE RESOURCE DEVELOPMENT CORPORATION
NOTES TO CONSOLIDATED AND COMBINED FINANCIAL STATEMENTS
The following table summarizes both: (i) the gross fair value of derivative instruments by the appropriate balance sheet classification even when the derivative instruments are subject to netting arrangements and qualify for net presentation in the balance sheet and (ii) the net recorded fair value as reflected on the balance sheet at December 31, 2016 and 2015. There was no cash collateral received or pledged associated with our derivative instruments since the counterparties to our derivative contracts are lenders under our collective credit agreements.
|
|
|
|
|
Asset Derivatives |
|
|
Liability Derivatives |
|
||||||||||
|
Type |
|
Balance Sheet Location |
|
2016 |
|
|
2015 |
|
|
2016 |
|
|
2015 |
|
||||
|
Commodity contracts |
|
Short-term derivative instruments |
|
$ |
4 |
|
|
$ |
7,108 |
|
|
$ |
14,091 |
|
|
$ |
32 |
|
|
Netting arrangements |
|
Short-term derivative instruments |
|
|
(4 |
) |
|
|
(32 |
) |
|
|
(4 |
) |
|
|
(32 |
) |
|
Net recorded fair value |
|
|
|
$ |
— |
|
|
$ |
7,076 |
|
|
$ |
14,087 |
|
|
$ |
— |
|
|
|
|
|
|
|
|
|
|
|
|
|
|
|
|
|
|
|
|
|
|
Commodity contacts |
|
Long-term derivative instruments |
|
$ |
3 |
|
|
$ |
2,656 |
|
|
$ |
8,094 |
|
|
$ |
216 |
|
|
Netting arrangements |
|
Long-term derivative instruments |
|
|
(3 |
) |
|
|
(216 |
) |
|
|
(3 |
) |
|
|
(216 |
) |
|
Net recorded fair value |
|
|
|
$ |
— |
|
|
$ |
2,440 |
|
|
$ |
8,091 |
|
|
$ |
— |
|
(Gains) & Losses on Derivatives
All gains and losses, including changes in the derivative instruments’ fair values, are included as a component of “Other income (expense)” in the Statements of Combined and Consolidated Financial Statements. The following table details the gains and losses related to derivative instruments for the years ending December 31, 2016, 2015 and 2014:
|
|
|
Statements of |
|
For the Year Ended December 31, |
|
|||||||||
|
|
|
Operations Location |
|
2016 |
|
|
2015 |
|
|
2014 |
|
|||
|
Commodity derivative contracts |
|
(Gain) loss on commodity derivatives |
|
$ |
26,771 |
|
|
$ |
(13,854 |
) |
|
$ |
(6,514 |
) |
Accounts receivable consist of the following:
|
|
|
At December 31, |
|
|||||
|
|
|
2016 |
|
|
2015 |
|
||
|
Oil, gas and NGL sales |
|
$ |
13,390 |
|
|
$ |
9,412 |
|
|
Joint interest billings |
|
|
7,898 |
|
|
|
3,455 |
|
|
Severance tax |
|
|
392 |
|
|
|
531 |
|
|
Other current receivables (1) |
|
|
4,848 |
|
|
|
389 |
|
|
Allowance for doubtful accounts |
|
|
(100 |
) |
|
|
(50 |
) |
|
Total |
|
$ |
26,428 |
|
|
$ |
13,737 |
|
|
|
(1) |
Primarily relates to a receivable related to our North Burleson Acquisition. |
The following table presents our allowance for doubtful accounts activity for the periods indicated:
|
|
|
For the Year Ended December 31, |
|
|||||||||
|
|
|
2016 |
|
|
2015 |
|
|
2014 |
|
|||
|
Balance at beginning of period |
|
$ |
50 |
|
|
$ |
— |
|
|
$ |
— |
|
|
Charged to costs and expenses |
|
|
50 |
|
|
|
50 |
|
|
|
— |
|
|
Balance at end of period |
|
$ |
100 |
|
|
$ |
50 |
|
|
$ |
— |
|
F - 20
WILDHORSE RESOURCE DEVELOPMENT CORPORATION
NOTES TO CONSOLIDATED AND COMBINED FINANCIAL STATEMENTS
Accrued liabilities consist of the following:
|
|
|
At December 31, |
|
|||||
|
|
|
2016 |
|
|
2015 |
|
||
|
Capital expenditures |
|
$ |
17,934 |
|
|
$ |
26,105 |
|
|
Deferred rent |
|
|
386 |
|
|
|
363 |
|
|
Lease operating expense |
|
|
2,608 |
|
|
|
1,459 |
|
|
General and administrative |
|
|
1,471 |
|
|
|
242 |
|
|
Severance and ad valorem taxes |
|
|
194 |
|
|
|
415 |
|
|
Interest expense |
|
|
346 |
|
|
|
192 |
|
|
Other accrued liabilities |
|
|
432 |
|
|
|
6 |
|
|
Total |
|
$ |
23,371 |
|
|
$ |
28,782 |
|
Note 8. Asset Retirement Obligations
The following table presents the changes in the asset retirement obligations for the years ended December 31, 2016, 2015 and 2014:
|
|
|
For the Year Ended December 31, |
|
|||||||||
|
|
|
2016 |
|
|
2015 |
|
|
2014 |
|
|||
|
Asset retirement obligations at beginning of period |
|
$ |
7,020 |
|
|
$ |
5,935 |
|
|
$ |
4,991 |
|
|
Balance at inception of common control (February 17, 2015) |
|
|
— |
|
|
|
37 |
|
|
|
— |
|
|
Accretion expense |
|
|
407 |
|
|
|
354 |
|
|
|
309 |
|
|
Liabilities incurred |
|
|
3,723 |
|
|
|
686 |
|
|
|
676 |
|
|
Liabilities settled |
|
|
(5 |
) |
|
|
(8 |
) |
|
|
— |
|
|
Revisions |
|
|
(112 |
) |
|
|
16 |
|
|
|
(41 |
) |
|
Asset retirement obligations at end of period |
|
|
11,033 |
|
|
|
7,020 |
|
|
|
5,935 |
|
|
Less: current portion |
|
|
90 |
|
|
|
90 |
|
|
|
90 |
|
|
Asset retirement obligations – long-term |
|
$ |
10,943 |
|
|
$ |
6,930 |
|
|
$ |
5,845 |
|
Our debt obligations consisted of the following at the dates indicated:
|
|
|
For the Year Ended December 31, |
|
|||||
|
Credit Facility |
|
2016 |
|
|
2015 |
|
||
|
WRD revolving credit facility |
|
$ |
242,750 |
|
|
$ |
— |
|
|
WHR II revolving credit facility terminated December 2016 |
|
|
— |
|
|
|
118,000 |
|
|
Esquisto - revolving credit facility terminated December 2016 |
|
|
— |
|
|
|
50,000 |
|
|
Esquisto - revolving credit facility terminated January 2016 |
|
|
— |
|
|
|
40,000 |
|
|
Esquisto - second lien terminated in January 2016 |
|
|
— |
|
|
|
30,000 |
|
|
Unamortized debt issuance costs - second lien |
|
|
— |
|
|
|
(143 |
) |
|
Total long-term debt |
|
$ |
242,750 |
|
|
$ |
237,857 |
|
Revolving Credit Facility
On December 19, 2016 after the closing of our initial public offering, we, as borrower, and certain of our current and future subsidiaries, as guarantors, entered into a five-year, $1.0 billion senior secured revolving credit facility, which had an initial borrowing base of $450.0 million but was automatically reduced to $362.5 million in connection with the consummation of our 2025 Senior Notes (defined below) offering on February 1, 2017.
Our revolving credit facility is reserve-based, and thus our borrowing base is primarily based on the estimated value of our oil and natural gas properties and our commodity derivative contracts as determined by our lenders in their sole discretion consistent with
F - 21
WILDHORSE RESOURCE DEVELOPMENT CORPORATION
NOTES TO CONSOLIDATED AND COMBINED FINANCIAL STATEMENTS
their normal and customary oil and gas lending practices semi-annually (in the case of scheduled redeterminations), from time to time at our election in connection with material acquisitions, or no more frequently than twice in any fiscal year at the request of the required lenders or us (in the case of interim redeterminations), in each case based on engineering reports with respect to our estimated oil, NGL and natural gas reserves, and our commodity derivative contracts. Unanimous approval by the lenders is required for any increase to the borrowing base pursuant to a redetermination, while only required lender approval is required to maintain or decrease the borrowing base pursuant to a redetermination. The borrowing base will also automatically decrease upon the issuance of certain debt, including notes, the sale or other disposition of certain assets and the early termination of certain swap agreements. In the future, we may be unable to access sufficient capital under our revolving credit facility as a result of (i) a decrease in our borrowing base due to a borrowing base redetermination or (ii) an unwillingness or inability on the part of our lenders to meet their funding obligations.
A decline in commodity prices could result in a redetermination that lowers our borrowing base and, in such case, we could be required to repay any indebtedness in excess of the borrowing base, or we could be required to pledge other oil and natural gas properties as additional collateral. If a redetermination of our borrowing base results in our borrowing base being less than our aggregate elected commitments, our aggregate elected commitments will be automatically reduced to the amount of such reduced borrowing base. We do not anticipate having any substantial unpledged properties, and we may not have the financial resources in the future to make any mandatory principal prepayments required under our revolving credit facility.
Borrowings under our revolving credit facility are secured by liens on substantially all of our properties, but in any event, not less than 85% (or 75% with respect to certain properties prior to February 2, 2017) of the total value, as determined by the administrative agent, of the proved reserves attributable to our oil and natural gas properties using a discount rate of 9%, all of our equity interests in any future guarantor subsidiaries and all of our other assets including personal property but excluding equity interests in and assets of unrestricted subsidiaries.
Additionally, borrowings under our revolving credit facility will bear interest, at our option, at either (i) the greatest of (x) the prime rate as determined by the administrative agent, (y) the federal funds effective rate plus 0.50%, and (z) the adjusted LIBOR for a one month interest period plus 1.0%, in each case, plus a margin that varies from 1.25% to 2.25% per annum according to the total commitments usage (which is the ratio of outstanding borrowings and letters of credit to the least of the total commitments, the borrowing base and the aggregate elected commitments then in effect), (ii) the adjusted LIBOR plus a margin that varies from 2.25% to 3.25% per annum according to the total commitment usage or (iii) the applicable LIBOR market index rate plus a margin that varies from 2.25% to 3.25% per annum according to the total commitment usage. The unused portion of the total commitments are subject to a commitment fee that varies from 0.375% to 0.50% per annum according to our total commitments usage.
Our revolving credit facility requires us to maintain (x) a ratio of total debt to EBITDAX (as defined under our revolving credit facility) of not more than 4.00 to 1.00 and (y) a ratio of current assets (including availability under the facility) to current liabilities of not less than 1.00 to 1.00.
Additionally, our revolving credit facility contains various covenants and restrictive provisions that, among other things, limit our ability to incur additional debt, guarantees or liens; consolidate, merge or transfer all or substantially all of our assets; make certain investments, acquisitions or other restricted payments; modify certain material agreements; engage in certain types of transactions with affiliates; dispose of assets; incur commodity hedges exceeding a certain percentage of our production; and prepay certain indebtedness.
Events of default under our revolving credit facility will include, but are not limited to, failure to make payments when due, breach of any covenant continuing beyond any applicable cure period, default under any other material debt, change of control, bankruptcy or other insolvency event and certain material adverse effects on our business.
If we fail to perform our obligations under these and other covenants, the revolving credit commitments may be terminated and any outstanding indebtedness under our revolving credit facility, together with accrued interest, fees and other obligations under the credit agreement, could be declared immediately due and payable.
WHR II Revolving Credit Facility
We repaid and terminated WHR II’s prior revolving credit facility in connection with the completion of our initial public offering.
Esquisto Revolving Credit Facility
We repaid and terminated Esquisto’s prior revolving credit facility in connection with the completion of our initial public offering.
F - 22
WILDHORSE RESOURCE DEVELOPMENT CORPORATION
NOTES TO CONSOLIDATED AND COMBINED FINANCIAL STATEMENTS
Esquisto Terminated Revolving Credit Facility and Second Lien Loan.
Esquisto retired and terminated one of their revolving credit facilities and second lien loan in January 2016 in connection with the merger of Esquisto I and Esquisto II.
2025 Senior Notes
Subsequent Event. On February 1, 2017, we completed a private placement of $350.0 million aggregate principal amount of 6.875% senior unsecured notes due 2025 (the “2025 Senior Notes”). The 2025 Senior Notes are fully and unconditionally guaranteed on a joint and several basis by all of our existing and certain future subsidiaries. The consummation of our 2025 Senior Notes offering automatically reduced the borrowing base of our revolving credit facility by $87.5 million. See Note 20 for additional information regarding the 2025 Senior Notes.
Weighted-Average Interest Rates
The following table presents the weighted-average interest rates paid on our consolidated and combined variable-rate debt obligations for the periods presented:
|
|
|
For the Year Ended December 31, |
|
|||||||||
|
Credit Facility |
|
2016 |
|
|
2015 |
|
|
2014 |
|
|||
|
WRD revolving credit facility |
|
|
3.52 |
% |
|
n/a |
|
|
n/a |
|
||
|
WHR II revolving credit facility terminated December 2016 |
|
n/a |
|
|
|
2.60 |
% |
|
|
2.40 |
% |
|
|
Esquisto - revolving credit facility terminated December 2016 |
|
n/a |
|
|
|
3.13 |
% |
|
n/a |
|
||
|
Esquisto - revolving credit facility terminated January 2016 |
|
n/a |
|
|
|
2.97 |
% |
|
n/a |
|
||
|
Esquisto - Second lien terminated in January 2016 |
|
n/a |
|
|
|
9.25 |
% |
|
n/a |
|
||
Unamortized Deferred Financing Costs
Unamortized deferred financing costs associated with our consolidated and combined debt obligations were as follows at the dates indicated (dollars in thousands):
|
|
|
At December 31, |
|
|||||
|
|
|
2016 |
|
|
2015 |
|
||
|
WRD revolving credit facility |
|
$ |
2,904 |
|
|
n/a |
|
|
|
WHR II revolving credit facility terminated December 2016 |
|
n/a |
|
|
|
581 |
|
|
|
Esquisto - revolving credit facility terminated December 2016 |
|
n/a |
|
|
|
494 |
|
|
|
Esquisto - second lien terminated in January 2016 |
|
n/a |
|
|
|
143 |
|
|
|
|
|
$ |
2,904 |
|
|
$ |
1,218 |
|
Common Stock
The Company’s authorized capital stock includes 500,000,000 shares of common stock, $0.01 par value per share. The following is a summary of the changes in our common shares issued for the year ended December 31, 2016:
|
Balance, January 1, 2016 |
|
|
— |
|
|
Shares of common stock issued in connection with Corporate Reorganization |
|
|
62,518,680 |
|
|
Shares of common stock issued in initial public offering |
|
|
27,500,000 |
|
|
Shares of common stock issued in connection with Rosewood Acquisition |
|
|
1,308,427 |
|
|
Restricted common shares issued |
|
|
353,334 |
|
|
Balance, December 31, 2016 |
|
|
91,680,441 |
|
See Note 12 for additional information regarding restricted common shares that were granted in connection with our initial public offering. Restricted shares of common stock are considered issued and outstanding on the grant date of restricted stock award.
F - 23
WILDHORSE RESOURCE DEVELOPMENT CORPORATION
NOTES TO CONSOLIDATED AND COMBINED FINANCIAL STATEMENTS
Our amended and restated certificate of incorporation will authorize our board of directors, subject to any limitations prescribed by law, without further stockholder approval, to establish and to issue from time to time one or more classes or series of preferred stock, par value $0.01 per share, covering up to an aggregate of 50,000,000 shares of preferred stock. Each class or series of preferred stock will have the powers, preferences, rights, qualifications, limitations and restrictions determined by the board of directors, which may include, among others, dividend rights, liquidation preferences, voting rights, conversion rights, preemptive rights and redemption rights. Except as provided by law or in a preferred stock designation, the holders of preferred stock will not be entitled to vote at or receive notice of any meeting of stockholders. There are no shares issued and outstanding as of December 31, 2016.
Dividend Policy
We do not anticipate declaring or paying any cash dividends to holders of our common stock in the foreseeable future. We currently intend to retain future earnings, if any, to finance our operations and the growth of our business. Our future dividend policy is within the discretion of our board of directors and will depend upon then-existing conditions, including our results of operations, financial condition, capital requirements, investment opportunities, statutory restrictions on our ability to pay dividends and other factors our board of directors may deem relevant. In addition, our revolving credit facility places restrictions on our ability to pay cash dividends.
Predecessor Equity
The predecessor received capital contributions of $10.8 million, $125.9 million and $89.4 million from its members during the year ended December 31, 2016, 2015 and 2014, respectively. Promissory note advances were available to management to fund future capital commitments and carried an interest rate of 2.5%.
The table below summarizes advances and payments of the promissory note advances for the years ended December 31, 2016, 2015 and 2014:
|
|
|
Principal |
|
|
Interest |
|
|
Total |
|
|||
|
Balance, December 31, 2013 |
|
$ |
9,702 |
|
|
$ |
97 |
|
|
$ |
9,799 |
|
|
Advances |
|
|
9,403 |
|
|
|
— |
|
|
|
9,403 |
|
|
Payments |
|
|
(17,454 |
) |
|
|
(303 |
) |
|
|
(17,757 |
) |
|
Accrued Interest |
|
|
— |
|
|
|
245 |
|
|
|
245 |
|
|
Balance, December 31, 2014 |
|
|
1,651 |
|
|
|
39 |
|
|
|
1,690 |
|
|
Advances |
|
|
1,096 |
|
|
|
— |
|
|
|
1,096 |
|
|
Payments |
|
|
(380 |
) |
|
|
(13 |
) |
|
|
(393 |
) |
|
Accrued Interest |
|
|
— |
|
|
|
50 |
|
|
|
50 |
|
|
Balance, December 31, 2015 |
|
|
2,367 |
|
|
|
76 |
|
|
|
2,443 |
|
|
Advances |
|
|
101 |
|
|
|
— |
|
|
|
101 |
|
|
Payments |
|
|
(20 |
) |
|
|
— |
|
|
|
(20 |
) |
|
Accrued Interest |
|
|
— |
|
|
|
51 |
|
|
|
51 |
|
|
Dissolution |
|
|
(2,448 |
) |
|
|
(127 |
) |
|
|
(2,575 |
) |
|
Balance, December 31, 2016 |
|
$ |
— |
|
|
$ |
— |
|
|
$ |
— |
|
On November, 9, 2016, the management members conveyed to the predecessor certain ownership interests in the predecessor in exchange for the discharge in full and the termination of all the promissory note advances then outstanding. The promissory note advances and the related accrued interest receivable are presented in the balance sheet as a deduction from predecessor equity.
Previous Owner Equity
The previous owner’s received capital contributions of $97.0 million and $208.4 million from its members during the year ended December 31, 2016 and for the period of February 17, 2015 to December 31, 2015, respectively. During the period from February 17, 2015 to December 31, 2015, Esquisto received property contributions of $40.1 million from its members that primarily consisted of developed and undeveloped properties in the East Texas Eagle Ford, Austin Chalk and Pecan Gap formations in Lee County, Washington County and Brazos County, Texas. On February 17, 2015, NGP acquired a controlling interest in Esquisto from an Esquisto member not affiliated with NGP. NGP’s basis exceeded the net book value by $16.1 million associated with this
F - 24
WILDHORSE RESOURCE DEVELOPMENT CORPORATION
NOTES TO CONSOLIDATED AND COMBINED FINANCIAL STATEMENTS
transaction. In May 2015, NGP acquired additional interests in Esquisto from another Esquisto member not affiliated with NGP. NGP’s basis exceeded the net book value by $26.6 million associated with this transaction. As a result of the Corporate Reorganization (as discussed in Note 1) and common control accounting, Esquisto’s net assets were recorded at NGP’s historical cost basis.
The following sets forth the calculation of earnings (loss) per share, or EPS, for the year ending December 31, 2016 (in thousands, except per share amounts):
|
Numerator: |
|
|
|
|
|
Net income (loss) available to WildHorse Resources |
|
$ |
(10,397 |
) |
|
Denominator: |
|
|
|
|
|
Weighted-average common shares outstanding (in thousands) (1) |
|
|
91,327 |
|
|
Basic EPS |
|
$ |
(0.11 |
) |
|
Diluted EPS (1) |
|
$ |
(0.11 |
) |
|
|
(1) |
The Company determines the more dilutive of either the two-class method or the treasury stock method for diluted EPS. The two-class method was more dilutive for the year ended December 31, 2016. For the year ended December 31, 2016, 363 restricted shares were excluded from the calculation of diluted earnings per share due to their antidilutive effect as we were in a loss position. |
Note 12. Long Term Incentive Plans
In connection with the initial public offering, our Board adopted the 2016 Long-Term Incentive Plan (or “2016 LTIP”). The 2016 LTIP, authorizes the issuance of 9,512,500 shares of our common stock. As of December 31, 2016, we had granted 353,334 restricted shares to certain officers and directors.
The following table summarizes information regarding restricted common share awards granted under the 2016 LTIP for the periods presented:
|
|
|
Number of Shares |
|
|
Weighted-Average Grant Date Fair Value per Share (1) |
|
||
|
Restricted common shares outstanding at January 1, 2016 |
|
$ |
— |
|
|
$ |
— |
|
|
Granted (2) |
|
|
353,334 |
|
|
$ |
14.50 |
|
|
Restricted common shares outstanding at December 31, 2016 |
|
$ |
353,334 |
|
|
$ |
14.50 |
|
|
|
(1) |
Determined by dividing the aggregate grant date fair value of shares subject to granted awards by the number of awards. |
|
|
(2) |
The aggregate grant date fair value of restricted common share awards granted in 2016 was $5.1 million based on grant date market price of $14.50 per share. |
For the year ended December 31, 2016, we recorded $0.1 million of recognized compensation expense associated with these awards. Unrecognized compensation cost associated with the restricted common share awards was an aggregate of $5.0 million at December 31, 2016. We expect to recognize the unrecognized compensation cost for these awards over a weighted-average period of 2.86 years.
The governing documents of WHR II provided for the issuance of incentive units. WHR II granted incentive units to certain of its members who were key employees at the time of grant. Holders of incentive units would have been entitled to distributions ranging from 20% to 40% when declared, but only after cumulative distribution thresholds (payouts) had been achieved. Payouts were generally triggered after the recovery of specified members’ capital contributions plus a rate of return. The incentive units were being accounted for as liability-classified awards as achievement of the payout conditions required settlement of such awards by transferring cash to the incentive unit holder. Compensation cost was recognized only if the performance condition was probable of being satisfied
F - 25
WILDHORSE RESOURCE DEVELOPMENT CORPORATION
NOTES TO CONSOLIDATED AND COMBINED FINANCIAL STATEMENTS
at each reporting date. The payment likelihood related to the WHR II incentive units was not deemed probable for the year ended December 31, 2016, 2015 and 2014, respectively. As such, no compensation expense was recognized by our predecessor.
In connection with the Corporate Reorganization, the WHR II incentive units were transferred to WildHorse Investment Holdings in exchange for substantially similar incentive units in WildHorse Investment Holdings, who became responsible for making all payments, distributions and settlements relating to the exchanged incentive units. While any such payments, distributions and settlements will not involve any cash payments by us, we will recognize non-cash compensation expense within general and administrative expenses, which may be material, in the period in which the applicable performance conditions are probable of being satisfied. We will receive a deemed capital contribution with respect to such compensation expense.
In connection with the Corporate Reorganization, WildHorse Holdings, Esquisto Holdings and Acquisition Co. Holdings granted certain officers and employees awards of incentive units in WildHorse Holdings, Esquisto Holdings and Acquisition Co. Holdings. The WildHorse Holdings incentive units, Esquisto Holdings incentive units and Acquisition Co. Holdings incentive units will each vest in three equal annual installments beginning on the first anniversary of the applicable date of grant. The incentive units are entitled to a portion of future distributions by each of WildHorse Holdings, Esquisto Holdings and Acquisition Co. Holdings in excess of the value of our common stock held by each of WildHorse Holdings, Esquisto Holdings and Acquisition Co. Holdings based upon the initial public offering price of such common stock plus a 5% internal rate of return. WildHorse Holdings, Esquisto Holdings and Acquisition Co. Holdings will be responsible for making all payments, distributions and settlements to all award recipients relating to the WildHorse Holdings incentive units, Esquisto Holdings incentive units and Acquisition Co. Holdings incentive units, respectively. While any such payments, distributions and settlements are not expected to involve any cash payment by us, we expect to recognize non-cash compensation expense within general and administrative expenses, which may be material, in the period in which the applicable performance conditions are probable of being satisfied. We will record a deemed capital contribution with respect to such compensation expense.
Vesting of all incentive units is generally dependent upon an explicit service period, a fundamental change as defined in the respective governing document, and achievement of payout. All incentive units not vested are forfeited if an employee is no longer employed. All incentive units will be forfeited if a holder resigns whether the incentive units are vested or not. If the payouts have not yet occurred, then all incentive units, whether or not vested, will be forfeited automatically (unless extended).
Note 14. Related Party Transactions
Corporate Reorganization
As described in Note 1, in connection with our initial public offering, we completed certain reorganization transactions pursuant to which we acquired all of the interests in WHR II, Esquisto and Acquisition Co. owned by WildHorse Holdings, Esquisto Holdings and Acquisition Co. Holdings, respectively, in exchange for 21,200,084 shares, 38,755,330 shares and 2,563,266 shares, respectively, of our common stock.
Board of Directors and Executive Officer Relationships
Mr. Grant E. Sims has served as a member of our board of directors since February 2017. Mr. Sims has served as a director and Chief Executive Officer of the general partner of Genesis Energy Partners, L.P. (“Genesis”) since August 2006 and Chairman of the Board of the general partner since October 2012. Genesis is one of our purchasers of hydrocarbons and other liquids. During the fiscal year ended December 31, 2016, we received $2.8 million from Genesis. In addition, Mr. Richard D. Brannon’s son who had been an employee of a CH4 Energy entity (an NGP affiliated company), joined the Company as a non-officer employee in connection with our initial public offering in December 2016. Mr. Brannon’s son received total compensation from us in 2016 of less than $0.1 million.
Our chief executive officer’s sister-in-law is a non-officer employee of the Company and received total compensation from us of approximately $0.1 million for each of the years ended December 31, 2016, 2015, and 2014, respectively.
NGP Affiliated Companies
Highmark Energy Operating, LLC. During the year ended December 31, 2016, 2015 and 2014, we received net payments of $0.2 million, $0.4 million and $0.1 million, respectively, from Highmark Energy Operating, LLC, a NGP affiliated company, for non-operated working interests in oil and gas properties we operate.
Cretic Energy Services, LLC. During the year ended December 31, 2016, 2015 and 2014, we made payments of $0.4 million, $1.0 million and $6.5 million, respectively, to Cretic Energy Services, LLC, a NGP affiliated company, for services related to our drilling and completion activities.
F - 26
WILDHORSE RESOURCE DEVELOPMENT CORPORATION
NOTES TO CONSOLIDATED AND COMBINED FINANCIAL STATEMENTS
Multi-Shot, LLC. During the year ended December 31, 2015 and 2014, we made payments of $0.1 million and $0.1 million, respectively, to Multi-Shot, LLC, a NGP affiliated company, for services related to our drilling and completion activities.
PennTex Midstream Partners, LP. During the year ended December 31, 2016, we made net payments of $0.2 million to PennTex Midstream Partners, LP (“PennTex”), a NGP affiliated company, for the gathering, processing and transportation of natural gas and NGLs. During the year ended December 31, 2015 and 2014, we received net payments of $0.1 million and $0.1 million, respectively. Energy Transfer Partners, L.P. acquired ownership in the general partner of PennTex on November 1, 2016. PennTex became a controlled subsidiary of Energy Transfer Partners, L.P. effective November 1, 2016. As such, as of the date of these financial statements, PennTex was no longer a related party.
Promissory Notes. WHR II issued promissory notes in favor of certain members of WHR II’s management to fund future capital commitments These promissory notes have been repaid and terminated. See Note 10 for additional information.
WildHorse Resources, LLC. WHR II and WildHorse Resources, LLC (“WHR”), an entity formerly under common control with WHR II, entered into a management services agreement in August 2013 pursuant to which WHR provided certain administrative and land services to WHR II. As operator, WHR received operated and non-operated revenues on behalf of WHR II and billed and received joint interest billings. In addition, WHR paid for lease operating expenses and drilling costs on behalf of WHR II. On August 8, 2013, an asset and cost sharing agreement between WHR and WHR II was executed. As part of the agreement, shared WHR costs were allocated between WHR and WHR II in accordance with a sharing ratio. The sharing ratio was based on the previous quarter’s capital expenditures and number of operated wells. Company specific costs were billed directly to the appropriate entity. As a result of these agreements, WHR II made net payments of $5.0 million to WHR in 2014.
A management services agreement was executed on August 8, 2013, where WHRM began providing general, administrative and employee services to WHR II as well as WHR. WHRM shared costs were also subject to the same sharing ratio as the asset and cost sharing agreement between WHR and WHR II. As a result of this agreement, we made net payments of $6.0 million to WHRM in 2014.
On June 18, 2014, (i) the management agreement and the asset cost sharing agreement were terminated, (ii) WHR II purchased WHRM from WHR for $0.2 million and (iii) WHR II, through WHRM, began providing accounting and operating transition services to WHR, including administrative and land services, pursuant to the management services agreement. As a result of the management services agreement, WHR II made $57.6 million in net payments to WHR in 2015 but received net payments of $53.0 million from WHR and its affiliates in 2014. WHR II was owed $1.6 million, net, as of December 31, 2015. On February 25, 2015, the management services agreement was terminated effective March 1, 2015.
During the year ended December 31, 2016, we paid net payments of $0.1 million to WHR’s parent company for non-operated working interests in oil and gas properties we operate. WHR ceased being a related party in September 2016 when its parent company was acquired by a third party.
NGP X US Holdings LP. Our predecessor paid NGP X US Holdings LP. (“NGP X”) $0.1 million during each year ended December 31, 2016, 2015, and 2014 for director fees. In addition, we reimbursed NGP X $0.8 million for certain of our initial public offering related expenses during the year ended December 31, 2016.
Previous Owner Related Party Transactions
Notes payable to members. During the period from February 17, 2015 to December 31, 2015, Esquisto accrued $3.6 million, as general and administrative expenses payable to its members. Esquisto owed $6.4 million as of December 31, 2015, to its members for general and administrative expenses incurred on its behalf. During the year ended December 31, 2016, Esquisto accrued $4.0 million, as general and administrative expenses payable to its members.
These notes were payable to members by December 31, 2022 and bore interest after a year at the Applicable Federal Rate compounded annually paid at maturity. In connection with our initial public offering, the Esquisto notes payable to its members were paid off. Certain CH4 Energy entities received $3.6 million. These CH4 Energy entities are NGP affiliated companies and Mr. Brannon is President of these entities. Garland Exploration, LLC and Crossing Rocks Energy, LLC (“Crossing Rocks”) received $5.5 million and $1.3 million, respectively. These entities are also NGP affiliated companies.
Services provided by member. Esquisto paid Calbri Energy, Inc. (“Calbri”), a less than 1% former owner, $0.4 million for the period from February 17, 2015 to December 31, 2015, for completion consulting services. During the year ended December 31, 2016, Esquisto paid Calbri $0.4 million for completion consulting services.
Operator. Esquisto paid Petromax Operating Company, Inc. (“Petromax”), who was the operator of the majority of Esquisto’s wells, $1.3 million during the year ended December 31, 2016 and $0.9 million during the period from February 17, 2015 to December 31, 2015 for overhead charges on drilling and producing wells at market rates as set forth in joint operating agreements and in
F - 27
WILDHORSE RESOURCE DEVELOPMENT CORPORATION
NOTES TO CONSOLIDATED AND COMBINED FINANCIAL STATEMENTS
accordance with an operating agreement between Petromax and Esquisto. Petromax is owned 33.3% by Mike Hoover, the former Chief Operating Officer of Esquisto, who also indirectly owned one of the former members of Esquisto.
Related Party Agreements
Registration Rights Agreement. In connection with the closing of our initial public offering, we entered into a registration rights agreement with WildHorse Holdings, Esquisto Holdings and Acquisition Co. Holdings. Pursuant to the registration rights agreement, we have agreed to register the sale of shares of our common stock under certain circumstances.
Demand Rights. At any time after the 180 day lock-up period, related to our initial public offering and subject to the limitations set forth below, each of the holders (or its permitted transferees) have the right to require us by written notice to prepare and file a registration statement registering the offer and sale of a certain number of its shares of our common stock. Generally, we are required to provide notice of the request to certain other holders of our common stock who may, in certain circumstances, participate in the registration. Subject to certain exceptions, we will not be obligated to effect a demand registration within 90 days after the closing of any underwritten offering of shares of our common stock. Further, we are not obligated to effect more than a total of four demand registrations for each of WildHorse Holdings, Esquisto Holdings and Acquisition Co. Holdings.
We are also not obligated to effect any demand registration in which the anticipated aggregate offering price for our common stock included in such offering is less than $30 million. Once we are eligible to effect a registration on Form S-3, any such demand registration may be for a shelf registration statement. We will be required to use reasonable best efforts to maintain the effectiveness of any such registration statement until the earlier of (i) 180 days (or two years in the case of a shelf registration statement) after the effective date thereof or (ii) the date on which all shares covered by such registration statement have been sold (subject to certain extensions).
In addition, each of the holders (or its permitted transferees) have the right to require us, subject to certain limitations, to effect a distribution of any or all of its shares of our common stock by means of an underwritten offering. In general, any demand for an underwritten offering (other than the first requested underwritten offering made in respect of a prior demand registration and other than a requested underwritten offering made concurrently with a demand registration) shall constitute a demand request subject to the limitations set forth above.
Piggyback Rights. Subject to certain exceptions, if at any time we propose to register an offering of common stock or conduct an underwritten offering, whether or not for our own account, then we must notify each holder, NGP XI US Holdings, L.P. (“NGP XI”), Mr. Graham and Mr. Bahr (or its permitted transferees) of such proposal to allow them to include a specified number of their shares of our common stock in that registration statement or underwritten offering, as applicable.
Stockholders’ Agreement. In connection with our initial public offering, we entered into a stockholders’ agreement with WildHorse Holdings, Esquisto Holdings, and Acquisition Co. Holdings. Among other things, the stockholders’ agreement provides the right to designate nominees to our board of directors as follows:
|
|
• |
so long as WildHorse Holdings, Esquisto Holdings, Acquisition Co. Holdings and their affiliates, including NGP XI, collectively own greater than 50% of our common stock, WildHorse Holdings and Esquisto Holdings can each nominate up to three nominees to our board of directors; |
|
|
• |
so long as WildHorse Holdings, Esquisto Holdings, Acquisition Co. Holdings and their affiliates, including NGP XI, collectively own at least 35% of our common stock but less than 50% of our common stock, WildHorse Holdings and Esquisto Holdings can each nominate two nominees to our board of directors; |
|
|
• |
so long as WildHorse Holdings, Esquisto Holdings, Acquisition Co. Holdings and their affiliates, including NGP XI, collectively own at least 15% of our common stock but less than 35% of our common stock, WildHorse Holdings and Esquisto Holdings can each nominate one nominee to our board of directors and can nominate a third nominee by agreement between them; |
|
|
• |
so long as WildHorse Holdings, Esquisto Holdings, Acquisition Co. Holdings and their affiliates, including NGP XI, collectively own at least 5% of our common stock but less than 15% of our common stock, WildHorse Holdings and Esquisto Holdings can each nominate one nominee to our board of directors; and |
|
|
• |
once WildHorse Holdings, Esquisto Holdings, Acquisition Co. Holdings and their affiliates, including NGP XI, collectively own less 5% of our common stock, WildHorse Holdings and Esquisto Holdings will not have any board designation rights. |
Pursuant to the stockholders’ agreement we are required to take all necessary actions, to the fullest extent permitted by applicable law (including with respect to any fiduciary duties under Delaware law), to cause the election of the nominees designated by WildHorse Holdings and Esquisto Holdings.
F - 28
WILDHORSE RESOURCE DEVELOPMENT CORPORATION
NOTES TO CONSOLIDATED AND COMBINED FINANCIAL STATEMENTS
In addition, the stockholders’ agreement provides that for so long as WildHorse Holdings, Esquisto Holdings, Acquisition Co. Holdings and their affiliates, including NGP XI, own at least 15% of the outstanding shares of our common stock, WildHorse Holdings and Esquisto Holdings will have the right to cause any committee of our board of directors to include in its membership at least one director designated by WildHorse Holdings or Esquisto Holdings, except to the extent that such membership would violate applicable securities laws or stock exchange rules. The rights granted to WildHorse Holdings and Esquisto Holdings to designate directors are additive to and not intended to limit in any way the rights that WildHorse Holdings, Esquisto Holdings, Acquisition Co. or any of their affiliates, including NGP XI, may have to nominate, elect or remove our directors under our certificate of incorporation, bylaws or the Delaware General Corporation Law.
Transaction Services Agreement. Upon the closing of our initial public offering, we entered into a transition services agreement with CH4 Energy IV, LLC, PetroMax and Crossing Rocks (collectively, the “Service Providers”), pursuant to which the Service Providers will provide certain engineering, land, operating and financial services to us for six months relating to our Eagle Ford Acreage. In exchange for such services, we will pay a monthly management fee to the Service Providers.
The Service Providers do not have a termination right under the transition services agreement. We may terminate the transition services agreement at any time by providing written notice to the Service Providers. The transition services agreement may only be assigned by a party with each other party’s consent. NGP and certain former management members of Esquisto own the Service Providers.
Our chief executive officer has been identified as our chief operating decision maker (“CODM”). We have identified two operating segments – the Eagle Ford and North Louisiana – that have been aggregated into one reportable segment that is engaged in the acquisition, exploitation, development and production of oil, natural gas and NGL resources in the United States. Our reportable segment includes midstream operations that primarily support the Company’s oil and gas producing activities. There are no differences between reportable segment revenues and consolidated revenues. Furthermore, all of our revenues are from external customers. The Company uses Adjusted EBITDAX as its measure of profit or loss to assess performance and allocate resources. Information regarding assets by reportable segment is not presented because it is not reviewed by the CODM.
The following table presents a reconciliation of net income (loss) to Adjusted EBITDAX:
|
|
|
For the Year Ended December 31, |
|
|||||||||
|
|
|
2016 |
|
|
2015 |
|
|
2014 |
|
|||
|
Adjusted EBITDAX reconciliation to net (loss) income: |
|
|
|
|
|
|
|
|
|
|
|
|
|
Net income (loss) |
|
$ |
(47,076 |
) |
|
$ |
(33,040 |
) |
|
$ |
(14,437 |
) |
|
Interest expense, net |
|
|
7,834 |
|
|
|
6,943 |
|
|
|
2,680 |
|
|
Income tax (benefit) expense |
|
|
(5,575 |
) |
|
|
604 |
|
|
|
(158 |
) |
|
Depreciation, depletion and amortization |
|
|
81,757 |
|
|
|
56,244 |
|
|
|
15,297 |
|
|
Exploration expense |
|
|
12,026 |
|
|
|
18,299 |
|
|
|
1,597 |
|
|
Impairment of proved oil and gas properties |
|
|
— |
|
|
|
9,312 |
|
|
|
24,721 |
|
|
(Gain) loss on derivative instruments |
|
|
26,771 |
|
|
|
(13,854 |
) |
|
|
(6,514 |
) |
|
Cash settlements received (paid) on derivative instruments |
|
|
4,975 |
|
|
|
11,517 |
|
|
|
(2,712 |
) |
|
Stock-based compensation |
|
|
68 |
|
|
|
— |
|
|
|
— |
|
|
Acquisition related costs |
|
|
553 |
|
|
|
593 |
|
|
|
1,450 |
|
|
(Gain) loss on sale of properties |
|
|
43 |
|
|
|
— |
|
|
|
— |
|
|
Debt extinguishment costs |
|
|
1,667 |
|
|
|
— |
|
|
|
— |
|
|
Initial public offering costs |
|
|
1,560 |
|
|
|
— |
|
|
|
— |
|
|
Non-cash liability amortization |
|
|
(286 |
) |
|
|
(760 |
) |
|
|
(647 |
) |
|
Total Adjusted EBITDAX |
|
$ |
84,317 |
|
|
$ |
55,858 |
|
|
$ |
21,277 |
|
F - 29
WILDHORSE RESOURCE DEVELOPMENT CORPORATION
NOTES TO CONSOLIDATED AND COMBINED FINANCIAL STATEMENTS
|
Major Customers |
|
For the Year Ended December 31, |
|
|||||||||
|
|
|
2016 |
|
|
2015 |
|
|
2014 |
|
|||
|
Energy Transfer Equity, L.P. and subsidiaries |
|
|
63% |
|
|
|
36% |
|
|
|
10% |
|
|
Royal Dutch Shell plc and subsidiaries |
|
|
12% |
|
|
|
20% |
|
|
|
41% |
|
|
Cima Energy LTD |
|
|
15% |
|
|
|
16% |
|
|
n/a |
|
|
|
BP Corporation North America |
|
n/a |
|
|
n/a |
|
|
|
31% |
|
||
The components of income tax benefit (expense) are as follows:
|
|
|
For the Year Ended December 31, |
|
|||||||||
|
|
|
2016 |
|
|
2015 |
|
|
2014 |
|
|||
|
Current income taxes: |
|
|
|
|
|
|
|
|
|
|
|
|
|
Federal |
|
$ |
— |
|
|
$ |
— |
|
|
$ |
(31 |
) |
|
State |
|
|
— |
|
|
|
— |
|
|
|
— |
|
|
Total income tax benefit (expense) |
|
|
— |
|
|
|
— |
|
|
|
(31 |
) |
|
Deferred income taxes: |
|
|
|
|
|
|
|
|
|
|
|
|
|
Federal |
|
|
5,737 |
|
|
|
77 |
|
|
|
156 |
|
|
State |
|
|
(162 |
) |
|
|
(681 |
) |
|
|
33 |
|
|
Total deferred income tax benefit (expense) |
|
|
5,575 |
|
|
|
(604 |
) |
|
|
189 |
|
|
Total income tax benefit (expense) |
|
$ |
5,575 |
|
|
$ |
(604 |
) |
|
$ |
158 |
|
The actual income tax benefit (expense) differs from the expected amount computed by applying the federal statutory corporate tax rate of 35% as follows:
|
|
|
For the Year Ended December 31, |
|
|||||||||
|
|
|
2016 |
|
|
2015 |
|
|
2014 |
|
|||
|
Expected tax benefit (expense) ad federal statutory rate |
|
$ |
18,428 |
|
|
$ |
11,353 |
|
|
$ |
5,108 |
|
|
State income tax benefit (expense), net of federal benefit |
|
|
(105 |
) |
|
|
(680 |
) |
|
|
32 |
|
|
Pass-through entities (1) |
|
|
(12,499 |
) |
|
|
(11,315 |
) |
|
|
(5,010 |
) |
|
Valuation allowance |
|
|
(234 |
) |
|
|
— |
|
|
|
— |
|
|
Other |
|
|
(15 |
) |
|
|
38 |
|
|
|
28 |
|
|
Total income tax benefit (expense) |
|
$ |
5,575 |
|
|
$ |
(604 |
) |
|
$ |
158 |
|
|
|
(1) |
Our predecessor was a pass-through entity for federal income tax purposes. |
F - 30
WILDHORSE RESOURCE DEVELOPMENT CORPORATION
NOTES TO CONSOLIDATED AND COMBINED FINANCIAL STATEMENTS
The components of net deferred income tax liabilities are as follows:
|
|
|
For the Year Ended December 31, |
|
|||||
|
|
|
2016 |
|
|
2015 |
|
||
|
Deferred income tax assets: |
|
|
|
|
|
|
|
|
|
Tax carryovers |
|
$ |
2,597 |
|
|
$ |
60 |
|
|
Asset retirement obligation |
|
|
4,083 |
|
|
|
8 |
|
|
Derivatives |
|
|
8,184 |
|
|
|
— |
|
|
Other |
|
|
870 |
|
|
|
— |
|
|
Total deferred income tax assets |
|
|
15,734 |
|
|
|
68 |
|
|
Valuation allowance |
|
|
232 |
|
|
|
— |
|
|
Net deferred income tax assets |
|
|
15,502 |
|
|
|
68 |
|
|
|
|
|
|
|
|
|
|
|
|
Deferred income tax liabilities: |
|
|
|
|
|
|
|
|
|
Property, plant and equipment |
|
|
127,835 |
|
|
|
882 |
|
|
Derivatives |
|
|
— |
|
|
|
25 |
|
|
Other |
|
|
219 |
|
|
|
13 |
|
|
Total deferred income tax liabilities |
|
|
128,054 |
|
|
|
920 |
|
|
Net deferred income tax liabilities |
|
$ |
112,552 |
|
|
$ |
852 |
|
The Company recorded a deferred tax liability of approximately $117.3 million through stockholders’ equity in connection with its initial public offering and the related restructuring transactions. The tax basis of its assets and liabilities was unchanged as a result of its initial public offering and the related restructuring transactions, which is reported as a transaction among stockholders for financial reporting purposes.
Uncertain Income Tax Position. The Company must recognize the tax effects of any uncertain tax positions it may adopt, if the position taken by us is more likely than not sustainable based on its technical merits. For those benefits to be recognized, an income tax position must be more-likely-than-not to be sustained upon examination by taxing authorities. The Company had no unrecognized tax benefits as of December 31, 2016 and expects no significant change to the unrecognized tax benefits over the next twelve months ending December 31, 2017.
Tax Audits and Settlements. Generally, the Company's income tax years 2013 through 2016 remain open and subject to examination by Federal tax authorities or the tax authorities in Louisiana and Texas and certain other small state taxing jurisdictions where the Company conducts operations. In certain jurisdictions the Company operates through more than one legal entity, each of which may have different open years subject to examination.
Tax Attribute Carryforwards and Valuation Allowance. As of December 31, 2016, the Company had federal net operating loss carryforwards of approximately $6.5 million, which would expire in 2036. The Company also had state tax carryforwards of approximately $2.0 million, which would expire in 2036. A valuation allowance of $0.2 million was established on pre-contribution tax attributes based upon management’s evaluation that the attributes will not be fully realized.
Note 17. Commitments and Contingencies
Litigation & Environmental
We are party to various ongoing and threatened legal actions relating to our entitled ownership interests in certain properties. We evaluate the merits of existing and potential claims and accrue a liability for any that meet the recognition criteria and can be reasonably estimated. We did not recognize any liability as of December 31, 2016 and 2015. Our estimates are based on information known about the matters and the input of attorneys experienced in contesting, litigating, and settling similar matters. Actual amounts could differ from our estimates and other claims could be asserted.
From time to time, we could be liable for environmental claims arising in the ordinary course of business. At December 31, 2016 and 2015, no environmental obligations were recognized.
F - 31
WILDHORSE RESOURCE DEVELOPMENT CORPORATION
NOTES TO CONSOLIDATED AND COMBINED FINANCIAL STATEMENTS
WHR II was assigned a firm gas transportation service agreement with Regency Intrastate Gas LLC (the “Transporter”) as a result of our property acquisition on August 8, 2013. Under the terms of the agreement, we are obligated to pay total daily transportation fees not to exceed $0.30 per MMBtu per day for quantities of 40,000 MMBtu per day to the Transporter until March 5, 2019.
Our minimum commitments to the Transporter as of December 31, 2016 is as follows (in thousands):
|
2017 |
|
|
2018 |
|
|
2019 |
|
|||
|
$ |
4,380 |
|
|
$ |
4,380 |
|
|
$ |
768 |
|
Lease Obligations
We currently lease corporate office space through May 31, 2021. Total general and administrative rent expense for the year ended December 31, 2016, 2015 and 2014 was $0.9 million, $0.8 million and $0.4 million, respectively. WHRM entered into the office lease agreement in 2013 that has escalating payments between July 2014 and May 2021. The average annual lease payment is $1.2 million over the life of the lease.
We have entered into drilling services agreements with varying terms. We have entered into compressor and equipment rental agreements with various terms. The compressor and equipment rental agreements expire at various times with the latest expiring in March 2017. Most of these agreements contain 30 day termination clauses. Total compressor and equipment rental expense incurred in 2016, 2015 and 2014 was $0.6 million, $1.0 million and $0.7 million, respectively.
The table below reflects our minimum commitments as of December 31, 2016:
|
|
|
2017 |
|
|
2018 |
|
|
2019 |
|
|
2020 |
|
|
Thereafter |
|
|||||
|
Office Lease |
|
$ |
1,235 |
|
|
$ |
1,259 |
|
|
$ |
1,282 |
|
|
$ |
1,306 |
|
|
$ |
548 |
|
|
Compressor and Equipment |
|
|
1,599 |
|
|
|
— |
|
|
|
— |
|
|
|
— |
|
|
|
— |
|
|
Total |
|
$ |
2,834 |
|
|
$ |
1,259 |
|
|
$ |
1,282 |
|
|
$ |
1,306 |
|
|
$ |
548 |
|
Note 18. Quarterly Financial Information (Unaudited)
The following tables present selected quarterly financial data for the periods indicated. Earnings per share are computed independently for each of the quarters presented and the sum of the quarterly earnings per share may not necessarily equal the total for the year.
|
|
|
First Quarter |
|
|
Second Quarter |
|
|
Third Quarter |
|
|
Fourth Quarter |
|
||||
|
For the Year Ended December 31, 2016 |
|
|
|
|
|
|
|
|
|
|
|
|
|
|
|
|
|
Revenues |
|
$ |
25,127 |
|
|
$ |
29,715 |
|
|
$ |
33,239 |
|
|
$ |
39,261 |
|
|
Operating income (loss) |
|
|
(15,005 |
) |
|
|
(704 |
) |
|
|
1,457 |
|
|
|
(1,976 |
) |
|
Net income (loss) |
|
|
(14,216 |
) |
|
|
(18,281 |
) |
|
|
3,057 |
|
|
|
(17,636 |
) |
|
Net income (loss) allocated to predecessor |
|
|
(11,699 |
) |
|
|
(13,016 |
) |
|
|
(2,104 |
) |
|
|
(7,179 |
) |
|
Net income (loss) allocated to previous owner |
|
|
(2,517 |
) |
|
|
(5,265 |
) |
|
|
5,161 |
|
|
|
(60 |
) |
|
Net income (loss) available to common stockholders |
|
n/a |
|
|
n/a |
|
|
n/a |
|
|
|
(10,397 |
) |
|||
|
Basic earnings per share |
|
n/a |
|
|
n/a |
|
|
n/a |
|
|
$ |
(0.11 |
) |
|||
|
Diluted earnings per share |
|
n/a |
|
|
n/a |
|
|
n/a |
|
|
$ |
(0.11 |
) |
|||
|
For the Year Ended December 31, 2015 |
|
|
|
|
|
|
|
|
|
|
|
|
|
|
|
|
|
Revenues |
|
$ |
11,472 |
|
|
$ |
21,238 |
|
|
$ |
25,416 |
|
|
$ |
28,209 |
|
|
Operating income (loss) |
|
|
(5,334 |
) |
|
|
(16,502 |
) |
|
|
(7,501 |
) |
|
|
(9,863 |
) |
|
Net income (loss) |
|
|
(4,217 |
) |
|
|
(18,649 |
) |
|
|
(4,712 |
) |
|
|
(5,462 |
) |
|
Net income (loss) allocated to predecessor |
|
|
(2,653 |
) |
|
|
(18,396 |
) |
|
|
(4,041 |
) |
|
|
(4,865 |
) |
|
Net income (loss) allocated to previous owner |
|
|
(1,564 |
) |
|
|
(253 |
) |
|
|
(671 |
) |
|
|
(597 |
) |
F - 32
WILDHORSE RESOURCE DEVELOPMENT CORPORATION
NOTES TO CONSOLIDATED AND COMBINED FINANCIAL STATEMENTS
Note 19. Supplemental Oil and Gas Information (Unaudited)
Oil and Natural Gas Reserves
Users of this information should be aware that the process of estimating quantities of “proved” and “proved developed” oil and natural gas reserves is very complex, requiring significant subjective decisions in the evaluation of all available geological, engineering and economic data for each reservoir. The data for a given reservoir may also change substantially over time as a result of numerous factors including, but not limited to, additional development activity, evolving production history and continual reassessment of the viability of production under varying economic conditions. As a result, revisions to existing reserve estimates may occur from time to time. Although every reasonable effort is made to ensure reserve estimates reported represent the most accurate assessments possible, the subjective decisions and variances in available data for various reservoirs make these estimates generally less precise than other estimates included in the financial statement disclosures.
Proved reserves are those quantities of oil and natural gas that by analysis of geoscience and engineering data can be estimated with reasonable certainty to be economically producible — from a given date forward, from known reservoirs, and under existing economic conditions, operating methods and government regulations — prior to the time at which contracts providing the right to operate expire, unless evidence indicates that renewal is reasonably certain, regardless of whether deterministic or probabilistic methods are used for the estimation. The project to extract the hydrocarbons must have commenced or the operator must be reasonably certain that it will commence the project within a reasonable time.
Proved reserves are, with respect to WHR II, prepared by WHR II and audited by Cawley, its independent reserve engineer. With respect to Esquisto, the proved reserves were prepared by Cawley, its independent reserve engineer, for 2015. Esquisto’s proved reserves for 2016 were internally prepared and audited by Cawley. All proved reserves are located in the United States and all prices are held constant in accordance with SEC rules.
|
|
|
For the Year Ended December 31, |
|
|||||||||
|
|
|
2016 |
|
|
2015 |
|
|
2014 |
|
|||
|
Oil ($/Bbl) |
|
|
|
|
|
|
|
|
|
|
|
|
|
West Texas Intermediate (1) |
|
$ |
42.75 |
|
|
$ |
46.79 |
|
|
$ |
91.48 |
|
|
NGL ($/Bbl) |
|
|
|
|
|
|
|
|
|
|
|
|
|
West Texas Intermediate (1) |
|
$ |
42.75 |
|
|
$ |
46.79 |
|
|
$ |
91.48 |
|
|
Natural Gas ($/Mmbtu) |
|
|
|
|
|
|
|
|
|
|
|
|
|
Henry Hub (2) |
|
$ |
2.48 |
|
|
$ |
2.59 |
|
|
$ |
4.35 |
|
|
|
(1) |
The unweighted average West Texas Intermediate price was adjusted by lease for quality, transportation fees, and a regional price differential. |
|
|
(2) |
The unweighted average Henry Hub price was adjusted by lease for energy content, compression charges, transportation fees, and regional price differentials. |
F - 33
WILDHORSE RESOURCE DEVELOPMENT CORPORATION
NOTES TO CONSOLIDATED AND COMBINED FINANCIAL STATEMENTS
The following tables set forth estimates of the net reserves as of December 31, 2016, 2015 and 2014, respectively:
|
|
|
For the Year Ended December 31, 2016 |
|
|||||||||||||
|
|
|
Oil (MBbls) |
|
|
Gas (MMcf) |
|
|
NGL (MBbls) |
|
|
Equivalent (MBoe) |
|
||||
|
Proved developed and undeveloped reserves: |
|
|
|
|
|
|
|
|
|
|
|
|
|
|
|
|
|
Beginning of the year |
|
|
36,650 |
|
|
|
344,959 |
|
|
|
8,897 |
|
|
|
103,040 |
|
|
Extensions, discoveries and additions |
|
|
18,870 |
|
|
|
32,782 |
|
|
|
2,606 |
|
|
|
26,940 |
|
|
Purchase of minerals in place |
|
|
26,835 |
|
|
|
13,545 |
|
|
|
1,823 |
|
|
|
30,916 |
|
|
Production |
|
|
(1,848 |
) |
|
|
(17,820 |
) |
|
|
(471 |
) |
|
|
(5,289 |
) |
|
Revision of previous estimates |
|
|
6,940 |
|
|
|
(48,364 |
) |
|
|
(1,981 |
) |
|
|
(3,102 |
) |
|
End of year |
|
|
87,447 |
|
|
|
325,102 |
|
|
|
10,874 |
|
|
|
152,505 |
|
|
Proved developed reserves: |
|
|
|
|
|
|
|
|
|
|
|
|
|
|
|
|
|
Beginning of year |
|
|
7,503 |
|
|
|
142,990 |
|
|
|
2,235 |
|
|
|
33,570 |
|
|
End of year |
|
|
19,192 |
|
|
|
145,880 |
|
|
|
3,765 |
|
|
|
47,270 |
|
|
Proved undeveloped reserves: |
|
|
|
|
|
|
|
|
|
|
|
|
|
|
|
|
|
Beginning of year |
|
|
29,147 |
|
|
|
201,969 |
|
|
|
6,662 |
|
|
|
69,470 |
|
|
End of year |
|
|
68,255 |
|
|
|
179,222 |
|
|
|
7,109 |
|
|
|
105,235 |
|
|
|
|
For the Year Ended December 31, 2015 |
|
|||||||||||||
|
|
|
Oil (MBbls) |
|
|
Gas (MMcf) |
|
|
NGL (MBbls) |
|
|
Equivalent (MBoe) |
|
||||
|
Proved developed and undeveloped reserves: |
|
|
|
|
|
|
|
|
|
|
|
|
|
|
|
|
|
Beginning of the year |
|
|
222 |
|
|
|
249,787 |
|
|
|
324 |
|
|
|
42,177 |
|
|
Balance at inception of common control (February 17, 2015) |
|
|
7,400 |
|
|
|
6,183 |
|
|
|
1,637 |
|
|
|
10,068 |
|
|
Extensions, discoveries and additions |
|
|
27,598 |
|
|
|
143,338 |
|
|
|
5,976 |
|
|
|
57,464 |
|
|
Purchase of minerals in place |
|
|
1,972 |
|
|
|
4,296 |
|
|
|
710 |
|
|
|
3,398 |
|
|
Production |
|
|
(968 |
) |
|
|
(14,847 |
) |
|
|
(351 |
) |
|
|
(3,794 |
) |
|
Revision of previous estimates |
|
|
426 |
|
|
|
(43,798 |
) |
|
|
601 |
|
|
|
(6,273 |
) |
|
End of year |
|
|
36,650 |
|
|
|
344,959 |
|
|
|
8,897 |
|
|
|
103,040 |
|
|
Proved developed reserves: |
|
|
|
|
|
|
|
|
|
|
|
|
|
|
|
|
|
Beginning of year |
|
|
222 |
|
|
|
122,780 |
|
|
|
324 |
|
|
|
21,009 |
|
|
End of year |
|
|
7,503 |
|
|
|
142,990 |
|
|
|
2,235 |
|
|
|
33,570 |
|
|
Proved undeveloped reserves: |
|
|
|
|
|
|
|
|
|
|
|
|
|
|
|
|
|
Beginning of year |
|
|
— |
|
|
|
127,007 |
|
|
|
— |
|
|
|
21,168 |
|
|
End of year |
|
|
29,147 |
|
|
|
201,969 |
|
|
|
6,662 |
|
|
|
69,470 |
|
|
|
|
For the Year Ended December 31, 2014 |
|
|||||||||||||
|
|
|
Oil (MBbls) |
|
|
Gas (MMcf) |
|
|
NGL (MBbls) |
|
|
Equivalent (MBoe) |
|
||||
|
Proved developed and undeveloped reserves: |
|
|
|
|
|
|
|
|
|
|
|
|
|
|
|
|
|
Beginning of the year |
|
|
175 |
|
|
|
210,293 |
|
|
|
— |
|
|
|
35,224 |
|
|
Extensions and discoveries |
|
|
63 |
|
|
|
4,318 |
|
|
|
573 |
|
|
|
1,356 |
|
|
Purchase of minerals in place |
|
|
17 |
|
|
|
13,684 |
|
|
|
— |
|
|
|
2,298 |
|
|
Production |
|
|
(31 |
) |
|
|
(9,388 |
) |
|
|
(41 |
) |
|
|
(1,637 |
) |
|
Revision of previous estimates |
|
|
(2 |
) |
|
|
30,880 |
|
|
|
(208 |
) |
|
|
4,936 |
|
|
End of year |
|
|
222 |
|
|
|
249,787 |
|
|
|
324 |
|
|
|
42,177 |
|
|
Proved developed reserves: |
|
|
|
|
|
|
|
|
|
|
|
|
|
|
|
|
|
Beginning of year |
|
|
175 |
|
|
|
97,734 |
|
|
|
— |
|
|
|
16,464 |
|
|
End of year |
|
|
222 |
|
|
|
122,780 |
|
|
|
324 |
|
|
|
21,009 |
|
|
Proved undeveloped reserves: |
|
|
|
|
|
|
|
|
|
|
|
|
|
|
|
|
|
Beginning of year |
|
|
— |
|
|
|
112,559 |
|
|
|
— |
|
|
|
18,760 |
|
|
End of year |
|
|
— |
|
|
|
127,007 |
|
|
|
— |
|
|
|
21,168 |
|
F - 34
WILDHORSE RESOURCE DEVELOPMENT CORPORATION
NOTES TO CONSOLIDATED AND COMBINED FINANCIAL STATEMENTS
Noteworthy amounts included in the categories of proved reserve changes in the above tables include:
|
|
• |
During 2016, extensions, discoveries and additions increased proved reserves by 4,131 MBoe and 22,809 MBoe related to drilling in the RCT field in Louisiana and Eagle Ford, respectively. |
|
|
• |
During 2016, purchase of minerals in place of 30,916 MBoe was primarily attributable to the Burleson North Acquisition. |
|
|
• |
During 2016, we had downward revisions of proved reserves of 3,102 MBoe, of which 711 MBoe related to commodity price changes and 2,391 MBoe was performance related. |
|
|
• |
During 2015, extensions, discoveries and additions increased proved reserves by 20,881 MBoe related to drilling in the RCT field in Louisiana by our predecessor. For the period from February 17, 2015 to December 31, 2015, extensions and discoveries increased proved reserves by 36,583 MBoe related to drilling in the Eagle Ford horizons in Burleson County, Texas by the previous owner. |
|
|
• |
For the period from February 17, 2015 to December 31, 2015, purchase of minerals in place by the previous owner of 3,398 MBoe was primarily attributable to the producing wells acquired from a subsidiary of Comstock Resources, Inc. in July 2015. |
|
|
• |
During 2015, our predecessor had downward revisions of proved reserves of 7,450 MBoe, of which 3,410 MBoe related to commodity price changes and 4,040 MBoe related to downward revisions resulting from technical changes. For the period from February 17, 2015 to December 31, 2015, revisions of previous estimates attributable to the previous owner were primarily due to operational efficiencies gained through increased experience in the Eagle Ford area (increase of approximately 1,315 MBoe) partially offset by decreased commodity prices which decreased the useful lives of the wells, decreasing ultimate reserves recovered (decrease of approximately 139 MBoe). |
|
|
• |
During 2014, extensions, discoveries and additions increased proved reserves by 1,356 MBoe related to drilling two horizontal wells in East Texas by our predecessor. |
|
|
• |
During 2014, our predecessor acquired 2,298 MBoe of proved reserves, of which 1,888 MBoe was for non-core properties acquired in East Texas and 410 MBoe was a result of leaseholds acquired in the RCT field in Louisiana. |
|
|
• |
During 2014, our predecessor had upward performance revisions to total proved reserves of 4,937 MBoe, of which 3,043 MBoe related to gas processing, 1,405 MBoe related to lease operating expense reductions and 517 MBoe related to changes in commodity prices, partially offset by a reduction of 28 MBoe due to changes in ownership interest. |
See Note 3 for additional information on acquisitions and divestitures.
A variety of methodologies are used to determine our proved reserve estimates. The principal methodologies employed are reservoir simulation, decline curve analysis, volumetric, material balance, advance production type curve matching, petro-physics/log analysis and analogy. Some combination of these methods is used to determine reserve estimates in substantially all of our fields.
Standardized Measure of Discounted Future Net Cash Flows from Proved Reserves
As required by the FASB and SEC, the standardized measure of discounted future net cash flows presented below is computed by applying first-day-of-the-month average prices, year-end costs and legislated tax rates and a discount factor of 10 percent to proved reserves. We do not believe the standardized measure provides a reliable estimate of the Company’s expected future cash flows to be obtained from the development and production of its oil and gas properties or of the value of its proved oil and gas reserves. The standardized measure is prepared on the basis of certain prescribed assumptions including first-day-of-the-month average prices, which represent discrete points in time and therefore may cause significant variability in cash flows from year to year as prices change.
F - 35
WILDHORSE RESOURCE DEVELOPMENT CORPORATION
NOTES TO CONSOLIDATED AND COMBINED FINANCIAL STATEMENTS
The standardized measure of discounted future net cash flows is as follows:
|
|
|
For the Year Ended December 31, |
|
|||||||||
|
|
|
2016 |
|
|
2015 |
|
|
2014 |
|
|||
|
Future cash inflows |
|
$ |
4,434,117 |
|
|
$ |
2,851,021 |
|
|
$ |
1,167,732 |
|
|
Future production costs |
|
|
(1,220,067 |
) |
|
|
(866,253 |
) |
|
|
(420,781 |
) |
|
Future development costs |
|
|
(1,146,632 |
) |
|
|
(741,798 |
) |
|
|
(147,809 |
) |
|
Future income tax expense |
|
|
(442,285 |
) |
|
|
(216 |
) |
|
|
(563 |
) |
|
Future net cash flows for estimated timing of cash flows |
|
|
1,625,133 |
|
|
|
1,242,754 |
|
|
|
598,579 |
|
|
10% annual discount for estimated timing of cash flows |
|
|
(1,082,092 |
) |
|
|
(790,824 |
) |
|
|
(368,680 |
) |
|
Standardized measure of discounted future net cash flows |
|
$ |
543,041 |
|
|
$ |
451,930 |
|
|
$ |
229,899 |
|
Changes in Standardized Measure of Discounted Future Net Cash Flows Relating to Proved Reserves
The following is a summary of the changes in the standardized measure of discounted future net cash flows for the proved oil and natural gas reserves during each of the years in the three year period ended December 31, 2016:
|
|
|
For the Year Ended December 31, |
|
|||||||||
|
|
|
2016 |
|
|
2015 |
|
|
2014 |
|
|||
|
Beginning of year |
|
$ |
451,930 |
|
|
$ |
229,899 |
|
|
$ |
165,181 |
|
|
Balance at inception of common control (February 17, 2015) |
|
|
— |
|
|
|
215,544 |
|
|
|
— |
|
|
Sale of oil and natural gas produced, net of production costs |
|
|
(104,596 |
) |
|
|
(60,640 |
) |
|
|
(29,498 |
) |
|
Purchase of minerals in place |
|
|
188,317 |
|
|
|
69,258 |
|
|
|
14,587 |
|
|
Extensions and discoveries |
|
|
168,796 |
|
|
|
261,728 |
|
|
|
20,195 |
|
|
Changes in income taxes, net |
|
|
(206,817 |
) |
|
|
171 |
|
|
|
(266 |
) |
|
Changes in prices and costs |
|
|
(57,034 |
) |
|
|
(193,130 |
) |
|
|
19,683 |
|
|
Previously estimated development costs incurred |
|
|
15,067 |
|
|
|
— |
|
|
|
190 |
|
|
Net changes in future development costs |
|
|
11,985 |
|
|
|
1,646 |
|
|
|
(3,194 |
) |
|
Revisions of previous quantities |
|
|
3,943 |
|
|
|
9,827 |
|
|
|
26,945 |
|
|
Accretion of discount |
|
|
103,000 |
|
|
|
41,859 |
|
|
|
16,522 |
|
|
Change in production rates and other |
|
|
(31,550 |
) |
|
|
(124,232 |
) |
|
|
(446 |
) |
|
End of year |
|
$ |
543,041 |
|
|
$ |
451,930 |
|
|
$ |
229,899 |
|
Capitalized Costs Relating to Oil and Natural Gas Producing Activities
The total amount of capitalized costs relating to oil and natural gas producing activities and the total amount of related accumulated depreciation, depletion and amortization is as follows at the dates indicated.
|
|
|
For the Year Ended December 31, |
|
|||||||||
|
|
|
2016 |
|
|
2015 |
|
|
2014 |
|
|||
|
Evaluated oil and natural gas properties |
|
$ |
1,144,857 |
|
|
$ |
732,479 |
|
|
$ |
247,482 |
|
|
Unevaluated oil and natural gas properties |
|
|
428,991 |
|
|
|
251,493 |
|
|
|
80,058 |
|
|
Accumulated depletion, depreciation and amortization |
|
|
(196,567 |
) |
|
|
(117,030 |
) |
|
|
(43,539 |
) |
|
Total |
|
$ |
1,377,281 |
|
|
$ |
866,942 |
|
|
$ |
284,001 |
|
F - 36
WILDHORSE RESOURCE DEVELOPMENT CORPORATION
NOTES TO CONSOLIDATED AND COMBINED FINANCIAL STATEMENTS
Costs Incurred in Oil and Natural Gas Property Acquisition, Exploration and Development Activities
Costs incurred in property acquisition, exploration and development activities were as follows for the periods indicated:
|
|
|
For the Year Ended December 31, |
|
|||||||||
|
|
|
2016 |
|
|
2015 |
|
|
2014 |
|
|||
|
Property acquisition costs, proved |
|
$ |
230,910 |
|
|
$ |
92,010 |
|
|
$ |
21,337 |
|
|
Property acquisition costs, unproved |
|
|
235,652 |
|
|
|
176,832 |
|
|
|
69,729 |
|
|
Exploration and extension well costs |
|
|
72,875 |
|
|
|
132,138 |
|
|
|
12,731 |
|
|
Development |
|
|
63,006 |
|
|
|
107,651 |
|
|
|
28,253 |
|
|
Total |
|
$ |
602,443 |
|
|
$ |
508,631 |
|
|
$ |
132,050 |
|
Eagle Ford Acquisitions
In February 2017, we announced multiple transactions to acquire certain oil and natural gas producing and non-producing properties from third-parties in Burleson County, TX for an aggregate price of approximately $15.6 million, subject to customary post-closing adjustments. One transaction closed in February 2017 and the remaining transactions are expected to close in April 2017.
2025 Senior Notes Offering
On February 1, 2017, we completed our private placement of $350 million in aggregate principal amount of our 6.875% Senior Notes due 2025. The 2025 Senior Notes were issued at a price of 99.244% of par and resulted in net proceeds of approximately $340.4 million. The 2025 Senior Notes will mature on February 1, 2025 and interest is payable on February 1 and August 1 of each year. We intend to use the net proceeds from the 2025 Senior Notes offering to repay borrowings outstanding under our revolving credit facility and for general corporate purposes.
We may redeem all or any part of the 2025 Senior Notes at a “make-whole” redemption price, plus accrued and unpaid interest, at any time before February 1, 2020. We may also redeem up to 35% of the aggregate principal amount of the 2025 Senior Notes prior to February 1, 2020 in an amount not greater than that net cash proceeds from one or more equity offerings at a redemption price of 106.875% of the principal amount of the Notes, plus accrued and unpaid interest.
Registration Rights Agreement
In connection with the issuance and sale of the 2025 Senior Notes, the Company and our subsidiary guarantors entered into a registration rights agreement (the “Registration Rights Agreement”) with a representative of the initial purchasers of the 2025 Senior Notes, dated February 1, 2017. Pursuant to the Registration Rights Agreement, we agreed to file a registration statement with the SEC so that holders of the 2025 Senior Notes can exchange the 2025 Senior Notes for registered notes that have substantially identical terms. In addition, we have agreed to exchange the guarantees related to the 2025 Senior Notes for registered guarantees having substantially the same terms as the original guarantees. The Company and the Guarantors will use commercially reasonable best efforts to cause the exchange to be consummated within 365 days after the issuance of the Notes. The Company and the Guarantors are required to pay additional interest if they fail to comply with their obligations to register the Notes within the specified time periods.
Option Exercise
On January 17, 2017, we also issued and sold 2,297,100 shares of our common stock at an offering price of $15.00 per share pursuant to the partial exercise of the underwriters’ over-allotment option associated with our initial public offering the “Option Exercise”). We received net proceeds of $32.6 million from the Option Exercise, all of which was used to repay outstanding borrowings under our revolving credit facility.
F - 37
|
Exhibit Number |
|
Description |
|
|
|
|
|
2.1 |
|
Master Contribution Agreement, dated December 12, 2016, by and among WildHorse Resource Development Corporation and the other parties named therein (incorporated by reference to Exhibit 2.1 to the Company’s Form 8-K filed on December 16, 2016). |
|
|
|
|
|
3.1 |
|
Amended and Restated Certification of Incorporation of WildHorse Resource Development Corporation (incorporated by reference to Exhibit 3.1 to the Company’s Form 8-K filed on December 19, 2016). |
|
|
|
|
|
3.2 |
|
Amended and Restated Bylaws of WildHorse Resource Development Corporation, effective December 19, 2016 (incorporated by reference to Exhibit 3.1 to the Company’s Form 8-K filed on December 19, 2016). |
|
|
|
|
|
4.1 |
|
Indenture, dated as of February 1, 2017, by and among WildHorse Resource Development Corporation, the subsidiary guarantors named therein and U.S. Bank National Association, as Trustee (incorporated by reference to Exhibit 4.1 to the Company’s Form 8-K filed on February 1, 2017). |
|
|
|
|
|
4.2 |
|
Form of 6.875% Senior Note due 2025 (incorporated by reference to Exhibit 4.2 to the Company’s Form 8-K filed on February 1, 2017). |
|
|
|
|
|
4.3 |
|
Registration Rights Agreement, dated as of February 1, 2017, by and among WildHorse Resource Development Corporation, the subsidiary guarantors named therein and Wells Fargo Securities, LLC, as representative of the initial purchasers named therein (incorporated by reference to Exhibit 4.3 to the Company’s Form 8-K filed on February 1, 2017). |
|
|
|
|
|
10.1 |
|
Registration Rights Agreement, dated as of December 19, 2016, by and among WildHorse Resource Development Corporation and the stockholders named therein (incorporated by reference to Exhibit 10.1 to the Company’s Form 8-K filed on December 19, 2016). |
|
|
|
|
|
10.2 |
|
Stockholders’ Agreement, dated as of December 19, 2016, by and among WildHorse Resource Development Corporation and the stockholders named therein (incorporated by reference to Exhibit 10.2 to the Company’s Form 8-K filed on December 19, 2016). |
|
|
|
|
|
10.3 |
|
Credit Agreement, dated December 19, 2016, by and among WildHorse Resource Development Corporation, as Borrower, Wells Fargo Bank, National Association, as Administrative Agent, BMO Harris Bank, N.A., as Syndication Agent, the Lenders party thereto and the other parties party thereto (incorporated by reference to Exhibit 10.3 to the Company’s Form 8-K filed on December 19, 2016). |
|
|
|
|
|
10.4 |
|
Transition Services Agreement, dated as of December 19, 2016, by and among WildHorse Resource Development Corporation, CH4 Energy IV, LLC, PetroMax Operating Co., Inc. and Crossing Rocks Energy, LLC (incorporated by reference to Exhibit 10.4 to the Company’s Form 8-K filed on December 19, 2016). |
|
|
|
|
|
10.5 |
|
Amended and Restated Limited Liability Company Agreement of WHR Holdings, LLC (incorporated by reference to Exhibit 10.5 to the Company’s Form 8-K filed on December 19, 2016). |
|
|
|
|
|
10.6 |
|
Amended and Restated Limited Liability Company Agreement of WildHorse Investment Holdings, LLC (incorporated by reference to Exhibit 10.6 to the Company’s Form 8-K filed on December 19, 2016). |
|
|
|
|
|
10.7 |
|
Amended and Restated Limited Liability Company Agreement of Esquisto Investment Holdings, LLC (incorporated by reference to Exhibit 10.7 to the Company’s Form 8-K filed on December 19, 2016). |
|
|
|
|
|
10.8 |
|
Amended and Restated Limited Liability Company Agreement of WHE AcqCo. Holdings, LLC (incorporated by reference to Exhibit 10.8 to the Company’s Form 8-K filed on December 19, 2016). |
|
|
|
|
|
10.9# |
|
WildHorse Resource Development Corporation 2016 Long-Term Incentive Plan (incorporated by reference to Exhibit 10.1 to the Company’s Form 8-K filed on December 16, 2016). |
|
|
|
|
|
10.10# |
|
Form of Restricted Stock Agreement (incorporated by reference to Exhibit 10.6 to the Company’s Form S-1 Registration Statement (File No. 333-214569) filed on November 23, 2016). |
|
|
|
|
|
10.11# |
|
WildHorse Resource Development Corporation Executive Change in Control and Severance Benefit Plan (incorporated by reference to Exhibit 10.3 to the Company’s Form 8-K filed on December 16, 2016). |
|
|
|
|
|
|
|
|
|
Exhibit Number |
|
Description |
|
|
Indemnification Agreement, dated as of December 13, 2016, by and between WildHorse Resource Development Corporation and Jay C. Graham (incorporated by reference to Exhibit 10.4 to the Company’s Form 8-K filed on December 16, 2016). |
|
|
|
|
|
|
10.13# |
|
Indemnification Agreement, dated as of December 13, 2016, by and between WildHorse Resource Development Corporation and Anthony Bahr (incorporated by reference to Exhibit 10.5 to the Company’s Form 8-K filed on December 16, 2016). |
|
|
|
|
|
10.14# |
|
Indemnification Agreement, dated as of December 13, 2016, by and between WildHorse Resource Development Corporation and Andrew J. Cozby (incorporated by reference to Exhibit 10.6 to the Company’s Form 8-K filed on December 16, 2016). |
|
|
|
|
|
10.15# |
|
Indemnification Agreement, dated as of December 13, 2016, by and between WildHorse Resource Development Corporation and Steve Habachy (incorporated by reference to Exhibit 10.7 to the Company’s Form 8-K filed on December 16, 2016). |
|
|
|
|
|
10.16# |
|
Indemnification Agreement, dated as of December 13, 2016, by and between WildHorse Resource Development Corporation and Kyle N. Roane (incorporated by reference to Exhibit 10.8 to the Company’s Form 8-K filed on December 16, 2016). |
|
|
|
|
|
10.17# |
|
Indemnification Agreement, dated as of December 13, 2016, by and between WildHorse Resource Development Corporation and Richard D. Brannon (incorporated by reference to Exhibit 10.9 to the Company’s Form 8-K filed on December 16, 2016). |
|
|
|
|
|
10.18# |
|
Indemnification Agreement, dated as of December 13, 2016, by and between WildHorse Resource Development Corporation and Scott A. Gieselman (incorporated by reference to Exhibit 10.10 to the Company’s Form 8-K filed on December 16, 2016). |
|
|
|
|
|
10.19# |
|
Indemnification Agreement, dated as of December 13, 2016, by and between WildHorse Resource Development Corporation and David W. Hayes (incorporated by reference to Exhibit 10.11 to the Company’s Form 8-K filed on December 16, 2016). |
|
|
|
|
|
10.20# |
|
Indemnification Agreement, dated as of December 13, 2016, by and between WildHorse Resource Development Corporation and Tony R. Weber (incorporated by reference to Exhibit 10.12 to the Company’s Form 8-K filed on December 16, 2016). |
|
|
|
|
|
10.21# |
|
Indemnification Agreement, dated as of December 13, 2016, by and between WildHorse Resource Development Corporation and Jonathan M. Clarkson (incorporated by reference to Exhibit 10.13 to the Company’s Form 8-K filed on December 16, 2016). |
|
|
|
|
|
10.22# |
|
Indemnification Agreement, dated as of February 10, 2017, by and between WildHorse Resource Development Corporation and Grant E. Sims (incorporated by reference to Exhibit 10.2 to the Company’s Form 8-K filed on February 14, 2017). |
|
|
|
|
|
21.1* |
|
Subsidiaries of WildHorse Resource Development Corporation. |
|
|
|
|
|
23.1* |
|
Consent of KPMG LLP, an independent registered public accounting firm. |
|
|
|
|
|
23.2* |
|
Consent of Ernst & Young LLP, an independent registered public accounting firm. |
|
|
|
|
|
23.3* |
|
Consent of Cawley, Gillespie and Associates, Inc. |
|
|
|
|
|
31.1* |
|
Certification of Chief Executive Officer Pursuant to Rule 13a-14(a)/15d-14(a) of the Securities Exchange Act of 1934. |
|
|
|
|
|
31.2* |
|
Certification of Chief Executive Officer Pursuant to Rule 13a-14(a)/15d-14(a) of the Securities Exchange Act of 1934. |
|
|
|
|
|
32.1* |
|
Certifications of Chief Executive Officer and Chief Financial Officer pursuant to 18. U.S.C. Section 1350, as adopted pursuant to Section 906 of the Sarbanes-Oxley Act of 2002. |
|
|
|
|
|
|
|
|
|
|
|
|
|
|
|
|
|
Exhibit Number |
|
Description |
|
|
Report of Cawley, Gillespie and Associates, Inc. |
|
|
|
|
|
|
99.2* |
|
Report of Cawley, Gillespie and Associates, Inc. |
|
* |
Filed or furnished as an exhibit to this Annual Report on Form 10-K. |
|
# |
Management contract or compensatory plan or arrangement. |