Attached files
| file | filename |
|---|---|
| EX-32 - EX-32 - RETRACTABLE TECHNOLOGIES INC | a17-1155_1ex32.htm |
| EX-31.2 - EX-31.2 - RETRACTABLE TECHNOLOGIES INC | a17-1155_1ex31d2.htm |
| EX-31.1 - EX-31.1 - RETRACTABLE TECHNOLOGIES INC | a17-1155_1ex31d1.htm |
| EX-23 - EX-23 - RETRACTABLE TECHNOLOGIES INC | a17-1155_1ex23.htm |
UNITED STATES
SECURITIES AND EXCHANGE COMMISSION
Washington, D.C. 20549
FORM 10-K
(Mark One)
x ANNUAL REPORT PURSUANT TO SECTION 13 OR 15(d) OF THE SECURITIES EXCHANGE ACT![]() OF 1934
OF 1934
For the fiscal year ended December 31, 2016
or
o TRANSITION REPORT PURSUANT TO SECTION 13 OR 15(d) OF THE SECURITIES EXCHANGE ACT OF 1934
For the transition period from to
Commission file number 001-16465
Retractable Technologies, Inc.
(Exact name of registrant as specified in its charter)
|
Texas |
|
75-2599762 |
|
(State or other jurisdiction of |
|
(I.R.S. Employer |
|
|
|
|
|
511 Lobo Lane |
|
|
|
Little Elm, Texas |
|
75068-5295 |
|
(Address of principal executive offices) |
|
(Zip Code) |
972-294-1010
Registrant’s telephone number, including area code
Securities registered pursuant to Section 12(b) of the Act:
|
Title of each class |
|
Name of each exchange on which registered |
|
Common |
|
NYSE MKT LLC |
Securities registered pursuant to Section 12(g) of the Act:
Preferred Stock
(Title of class)
Indicate by check mark if the registrant is a well-known seasoned issuer, as defined in Rule 405 of the Securities Act. Yes o No x
Indicate by check mark if the registrant is not required to file reports pursuant to Section 13 or Section 15(d) of the Act. Yes o No x
Indicate by check mark whether the registrant (1) has filed all reports required to be filed by Section 13 or 15(d) of the Securities Exchange Act of 1934 during the preceding 12 months (or for such shorter period that the registrant was required to file such reports), and (2) has been subject to such filing requirements for the past 90 days. Yes x No o
Indicate by check mark whether the registrant has submitted electronically and posted on its corporate Web site, if any, every Interactive Data File required to be submitted and posted pursuant to Rule 405 of Regulation S-T (§232.405 of this chapter) during the preceding 12 months (or for such shorter period that the registrant was required to submit and post such files). Yes x No o
Indicate by check mark if disclosure of delinquent filers pursuant to Item 405 of Regulation S-K (§229.405 of this chapter) is not contained herein, and will not be contained, to the best of registrant’s knowledge, in definitive proxy or information statements incorporated by reference in Part III of this Form 10-K or any amendment to this Form 10-K. x
Indicate by check mark whether the registrant is a large accelerated filer, an accelerated filer, a non-accelerated filer, or a smaller reporting company. See the definitions of “large accelerated filer,” “accelerated filer,” and “smaller reporting company” in Rule 12b-2 of the Exchange Act:
|
Large accelerated filer o |
|
Accelerated filer o |
|
Non-accelerated filer o (Do not check if a smaller reporting company) |
|
Smaller reporting company x |
Indicate by check mark whether the registrant is a shell company (as defined in Rule 12b-2 of the Act). Yes o No x
State the aggregate market value of the voting and non-voting common equity held by non-affiliates computed by reference to the price at which the common equity was last sold, or the average bid and asked price of such common equity, as of the last business day of the registrant’s most recently completed second fiscal quarter. The aggregate market value of the common equity held by non-affiliates as of June 30, 2016, was $35,012,406, assuming a closing price of $2.52 and outstanding shares held by non-affiliates of 13,893,812.
APPLICABLE ONLY TO REGISTRANTS INVOLVED IN BANKRUPTCY
PROCEEDINGS DURING THE PRECEDING FIVE YEARS:
Indicate by check mark whether the registrant has filed all documents and reports required to be filed by Section 12, 13, or 15(d) of the Securities Exchange Act of 1934 subsequent to the distribution of securities under a plan confirmed by a court. Yes o No o
(APPLICABLE ONLY TO CORPORATE REGISTRANTS)
Indicate the number of shares outstanding of each of the registrant’s classes of common stock, as of the latest practicable date. As of March 1, 2017, there were 31,666,454 shares of our Common Stock outstanding.
DOCUMENTS INCORPORATED BY REFERENCE
List hereunder the following documents if incorporated by reference and the Part of the Form 10-K (e.g., Part I, Part II, etc.) into which the document is incorporated: (1) Any annual report to security holders; (2) Any proxy or information statement; and (3) Any prospectus filed pursuant to Rule 424(b) or (c) under the Securities Act of 1933. The listed documents should be clearly described for identification purposes (e.g., annual report to security holders for fiscal year ended December 24, 1980).
None except exhibits.
RETRACTABLE TECHNOLOGIES, INC.
FORM 10-K
For the Fiscal Year Ended December 31, 2016
FORWARD-LOOKING STATEMENT WARNING
Certain statements included by reference in this filing containing the words “could,” “may,” “believes,” “anticipates,” “intends,” “expects,” and similar such words constitute forward-looking statements within the meaning of the Private Securities Litigation Reform Act. Any forward-looking statements involve known and unknown risks, uncertainties, and other factors that may cause our actual results, performance, or achievements to be materially different from any future results, performance, or achievements expressed or implied by such forward-looking statements. Such factors include, among others, our ability to maintain liquidity, our maintenance of patent protection, the impact of current and future Court decisions regarding current litigation, our ability to maintain favorable third party manufacturing and supplier arrangements and relationships, foreign trade risk, our ability to quickly increase capacity in response to an increase in demand, our ability to access the market, our ability to maintain or lower production costs, our ability to continue to finance research and development as well as operations and expansion of production, the impact of larger market players, specifically Becton, Dickinson and Company (“BD”), in providing devices to the safety market, and other factors referenced in Item 1A. Risk Factors. Given these uncertainties, undue reliance should not be placed on forward-looking statements.
DESCRIPTION OF BUSINESS
General Development of Business
On May 9, 1994, our company was incorporated in Texas to design, develop, manufacture, and market innovative patented safety medical products for the healthcare industry. Our goal is to become a leading provider of safety medical products. Advantages of our safety products include protection from needlestick injuries, prevention of cross contamination through reuse, and reduction of disposal and other associated costs.
We have designed, developed, and currently market the VanishPoint® and Patient Safe® products. The VanishPoint® products are designed specifically to prevent needlestick injuries and to prevent reuse. The patented designs permit the automated retraction of the needle directly from the patient after completion of the procedure.
Our VanishPoint® safety products currently consist of tuberculin, insulin, and allergy antigen VanishPoint® syringes; 0.5mL, 1 mL, 2mL, 3mL, 5mL, and 10mL VanishPoint® syringes; and the VanishPoint® autodisable syringe.
We also sell the VanishPoint® IV catheter; the VanishPoint® blood collection tube holder; and the VanishPoint® blood collection set.
The Patient Safe® syringe embodies a unique patented design and protects patients by reducing the risk of bloodstream infections associated with catheter hub contamination. Our Patient Safe® products currently consist of 3mL, 5mL, 10mL, 20mL, 30mL, 60mL syringes and the Patient Safe® Luer cap.
In the second quarter of 2016, we began selling a new product, the EasyPoint® needle. The EasyPoint® is a retractable needle that can be used with Luer lock syringes, Luer slip syringes, and prefilled syringes to give injections. The EasyPoint® needle can also be used to aspirate fluids and collect blood. According to a December 2016 press release from Zion Market Research, prefilled syringes play an important role in the injectable drug delivery devices market and the compound annual growth rate is expected to be approximately 9.5% between 2016 and 2021. The global market size for prefilled syringes was approximately 4.1 billion units ($3.5 billion) in 2015.
We currently have under development additional safety products that add to or build upon our current product line offering. These products include: retractable needles and syringes, glass syringes, dental syringes, IV catheter introducers, and blood collection sets.
Our products have been and continue to be distributed nationally through numerous distributors. However, we have been blocked from access to the market by the practices engaged in by BD which dominates our market. We initiated a lawsuit in 2007 against BD. As previously reported, on December 2, 2016, the Fifth Circuit Court of Appeals overturned a district court judgment that had previously awarded us $340 million in antitrust damages from BD, but affirmed a finding of false advertising liability against BD and remanded the case to the Eastern District of Texas for a redetermination as to the amount of damages to which we are entitled. Although the result of the damages redetermination is unknown, our stock price materially declined following the entry of the Fifth Circuit’s opinion. The Eastern District of Texas trial date is May 11, 2017. Our petition for certiorari to the U.S. Supreme Court was denied on March 20, 2017.
We have taken steps to reduce our future litigation expenses and expect such expenses to be significantly less in 2017.
We reevaluated several compensation strategies in late 2016 and early 2017. See Compensation Discussion and Analysis. We also approved three of our executive officers to purchase shares directly from the Company. Thomas J. Shaw exercised a portion of such right on January 12, 2017, buying two million shares at market price for an aggregate purchase price of $1.78 million.
In April of 2016, Mr. Shaw exercised an option for one million shares for an aggregate exercise price of $810 thousand. Another director exercised a portion of a stock option for an aggregate exercise price of $16 thousand in March of 2016 and $12 thousand in March of 2015.
We continue to attempt to gain access to the market through our sales efforts, our innovative technology, introduction of new products, and, when necessary, litigation.
The Consolidated Appropriations Act, 2016 (Pub. L. 114-113), signed into law on December 18, 2015, includes a two year moratorium on the 2.3% medical device excise tax imposed by Internal Revenue Code section 4191. Thus, the medical device excise tax was suspended beginning on January 1, 2016 and ending on December 31, 2017. The impact of this tax was $360,000 in 2015 and $856,000 in 2014.
In 2014, the Company took steps to decrease non-litigation legal costs by approximately $1.1 million. In 2014 and 2015, the Company reduced its workforce to further cut costs. In the future, if such cost cutting measures prove insufficient, we may reduce other operating expenses, reduce the workforce, reduce the salaries of officers as well as other employees, and/or defer royalty payments. The Company instituted two percent raises for most non-executive employees in early 2016 and engaged in other compensation increases for executive officers in late 2016 and early 2017. See Compensation Discussion and Analysis.
We exchanged 728,000 shares of Common Stock for 200,000 shares of our Series IV Class B Convertible Preferred Stock as of November 30, 2015, pursuant to an agreement with a shareholder. Such shareholder agreed to waive all unpaid dividends in arrears associated with the tendered preferred stock, equaling $3,094,795. Future dividend requirements of $200,000 per year are avoided as a result of this transaction.
Financial Information
Please see the financial statements in Item 8. Financial Statements and Supplementary Data for information about our revenues, profits, and losses for the last three years and total assets, liabilities, and stockholder equity for the last two years.
Principal Products
Our products, with Notice of Substantial Equivalence to the U.S. Food and Drug Administration (“FDA”) and which are currently sold, include the 1mL tuberculin; insulin syringes; allergy antigen VanishPoint® syringes; 0.5mL, 2mL, 3mL, 5mL, and 10mL VanishPoint® syringes; EasyPoint® needle, the VanishPoint® blood collection tube holder; the VanishPoint® IV safety catheter; small diameter tube adapter; the allergy tray; the Patient Safe® syringes; the Patient Safe® Luer Cap; and the VanishPoint® Blood Collection Set. We are also selling VanishPoint® autodisable syringes in the international market in addition to our other products.
Syringe sales comprised 97.3%, 98.2%, and 93.0% of revenues in 2014, 2015, and 2016, respectively. EasyPoint® needles, which were introduced in the second quarter of 2016, made up 4.5% of revenues in 2016.
Principal Markets
Our products are sold to and used by healthcare providers primarily in the U.S. (with 11.8% of revenues in 2016 generated from sales outside the U.S.) which include, but are not limited to, acute care hospitals, alternate care facilities, doctors’ offices, clinics, emergency centers, surgical centers, long-term care facilities, Veterans Administration facilities, military organizations, public health facilities, and prisons.
The need to change to safety devices is due to the risk that is carried with each needlestick injury which includes the potential transmission of over 20 bloodborne pathogens, including the human immunodeficiency virus (“HIV,” which causes AIDS), hepatitis B, and hepatitis C. Because of the occupational and public health hazards posed by conventional disposable syringes, public health policy makers, domestic organizations, and government agencies have been involved in the effort to get more effective safety needle products to healthcare workers. Federal legislation was signed into law on November 6, 2000, by former President William Jefferson Clinton. This legislation, which became effective for most states on April 12, 2001, requires safety needle products be used for the vast majority of procedures. However, even with this requirement, some hospitals are neglecting to follow the law intended to protect healthcare workers.
A healthcare journal (AOHP Journal) published an article in 2013 indicating that over 320,000 needlestick injuries occur every year in the United States.
Methods of Marketing and Distribution
Under the current supply chain system in the U.S. acute care market, the vast majority of decisions relating to the contracting for and purchasing of medical supplies are made by the representatives of group purchasing organizations (“GPOs”) and purchasing representatives rather than the end-users of the product (nurses, doctors, and testing personnel). The GPOs and larger manufacturers often enter into contracts which can prohibit or limit entry in the marketplace by competitors.
We distribute our products throughout the U.S. through general line and specialty distributors. We also use international distributors. We have developed a national direct marketing network in order to market our products to health care customers and their purchaser representatives. Our marketers make contact with all of the departments that affect the decision-making process for safety products, including the purchasing agents. They call on acute care and alternate care sites and speak directly with the decision-makers of these facilities. We employ trained sales representatives and clinicians, including nurses and/or medical technologists that educate healthcare providers and healthcare workers on the use of safety devices through on-site clinical training, exhibits at related tradeshows, and publications of relevant articles in trade journals and magazines. These employees provide clinical support to customers. In addition to marketing our products, the network demonstrates the safety and cost effectiveness of our products to customers.
In the needle and syringe market, the market share leader, BD, has utilized conduct which we believe has restricted the entry of VanishPoint® syringes into the market. Other products manufactured by us that are being denied market access as a result of BD’s actions include the IV safety catheters and Patient Safe® syringes.
We have numerous agreements with organizations for the distribution of our products in foreign markets. In Canada, the provinces of Alberta, British Columbia, Manitoba, Nova Scotia, Ontario, and Saskatchewan have passed laws or regulations regarding healthcare worker safety and the use of safe needle products. The European Union has issued Directive 2010/32/EU regarding safe procedures and the use of safe needle products to prevent needlestick injuries. Peru’s vaccination manual mandates that all syringes used in that country’s national vaccination program must be retractable syringes. Brazil has also initiated a regulation requiring the use of safe needle products to prevent needlestick injuries. Except for Victoria and Western Australia, all of the states and territories of Australia have guidelines or directives regarding the prevention of needlestick injuries.
Key components of our strategy to increase our market share are to: (a) defeat unfair practices through litigation; (b) focus on methods of upgrading our manufacturing capability and efficiency in order to enable us to reduce costs and improve profit margins; (c) continue marketing emphasis in the U.S.; (d) continue to add Veterans Administration facilities, health departments, emergency medical services, federal prisons, long-term care, home healthcare facilities, and retail pharmacies as customers; (e) educate healthcare providers, insurers, healthcare workers, government agencies, government officials, and the general public on the reduction of risk and the cost effectiveness afforded by our products; (f) market product through GPO contracts and supply Integrated Delivery Networks where possible; (g) consider possibilities for future licensing agreements and joint venture agreements for the manufacture and distribution of safety products in the U.S. and abroad; (h) introduce new products; and (i) increase international sales.
Status of Publicly Announced New Products
We have applied for patent protection and are in the process of developing additional safety medical products.
EasyPoint® needles, which were introduced in the second quarter of 2016, made up 4.5% of revenues in 2016. Our application for a CE mark is under review by bsi.
Sources and Availability of Raw Materials
We purchase most of our product components from single suppliers, including needle adhesives and packaging materials. There are multiple sources of these materials. We own the printing plates that are used to print artwork on packaging materials and the molds that are used to manufacture the plastic components of our products in the U.S. Our current suppliers include AMCOR, Bemis Healthcare Packaging Inc., Caraustar, Channel Prime Alliance, Exacto, Interwire, KovacMed, Plastic Ingenuity, and Polyone.
Patents, Trademarks, Licenses, and Proprietary Rights
Soon after the Company was formed in May 1994, in recognition of the preexisting technology, intellectual property rights, products, inventive knowhow and ongoing research and development projects (the “Core Technology”) that were brought into the Company by Thomas J. Shaw as its founder and CEO, the Company and Mr. Shaw entered into a Technology License Agreement dated June 23, 1995, which was subsequently amended July 3, 2008, and again to its present form September 7, 2012.
As amended, the Technology License Agreement encompasses the Core Technology, all technology and knowhow arising out of the Core Technology that has been developed since its inception, all related future improvements, and all the related domestic and foreign patents and patent applications naming Mr. Shaw as an inventor. The knowhow component is broadly defined to include both technical and valuable proprietary business information. Under the Technology License Agreement, Mr. Shaw has granted the Company an exclusive worldwide license in the inventions and under his related patent rights to manufacture, market, sell and distribute the licensed technology and improvements that perform the same function in a better or more economical way. The Company has the right to grant sublicenses and assign the Technology License Agreement subject to Mr. Shaw’s approval. The term of the Technology License Agreement is coextensive with the life of the patent rights that are subject to it.
In return for the rights granted, the Company paid Mr. Shaw an initial licensing fee and pays a continuing 5% royalty on gross sales, as well as the costs of obtaining and maintaining the patents subject to the license. The Company has reserved the right to control patent prosecution and the right not to pursue or maintain any patent or patent application, in which case the rights in any non-elected technology revert to Mr. Shaw and are excluded from the license. The Technology License Agreement also acknowledges a march-in right held by the U.S. government as a result of federal funding that was provided under Small Business Innovation Research grants made during the early development of what later became the Company’s VanishPoint® product line.
The Company holds exclusive rights under domestic and foreign patents and has pending applications related to the technology embodied in products that are currently marketed. The Company also holds rights related
to new products under development. The patents exclusively licensed by the Company have varying remaining terms and expiration dates. While patents covering some features of the VanishPoint® syringes have recently expired, another patent with a later expiration date will continue to provide patent coverage for VanishPoint® syringes until 2020.
The Company has also registered the following trade names and trademarks: VanishPoint®, EasyPoint®, Patient Safe®, VanishPoint® logos, RT with a circle mark, the Spiral Logo used in packaging VanishPoint® products, the color coded spots on the ends of our VanishPoint® syringes and others. The Company has also obtained federal trademark protection for the slogan “The New Standard for Safety.” The Company has trademarked the slogan “We Make Safety Safe” and is awaiting registration for it.
We are involved in patent litigation detailed in Item 3. Legal Proceedings. We have decided, on the advice of patent counsel, not to purchase patent insurance because it would require inappropriate disclosure of information that is currently proprietary and confidential.
Seasonality
Historically, unit sales have increased in the latter part of the year due, in part, to the demand for syringes during the flu season.
Working Capital Practices
Cash and cash equivalents include unrestricted cash, money market accounts, and investments with original maturities of three months or less.
We record trade receivables when revenue is recognized. No product has been consigned to customers. Our allowance for doubtful accounts is primarily determined by review of specific trade receivables. Those accounts that are doubtful of collection are included in the allowance. This provision is reviewed to determine the adequacy of the allowance for doubtful accounts. Trade receivables are charged off when there is certainty as to their being uncollectible. Trade receivables are considered delinquent when payment has not been made within contract terms.
Inventories are valued at the lower of cost or market, with cost being determined using actual average cost. The Company compares the average cost to the market price and records the lower value. Management considers such factors as the amount of inventory on hand and in the distribution channel, estimated time to sell such inventory, the shelf life of inventory, and current market conditions when determining excess or obsolete inventories. A reserve is established for any excess or obsolete inventories or they may be written off.
Receivables are established for federal and state taxes where we have determined we are entitled to a refund for overpayments of estimated taxes or loss carrybacks.
Accounts payable and other short-term liabilities include amounts that we believe we have an obligation for at the end of year. These include charges for goods or services received in 2016 but not billed to us at the end of the year. It also includes estimates of potential liabilities such as rebates and other fees.
Our domestic return policy is set forth in our standard Distribution Agreement. This policy provides that a customer may return incorrect shipments within 10 days following arrival at the distributor’s facility. In all such cases the distributor must obtain an authorization code from us and affix the code to the returned product. We will not accept returned goods without a returned goods authorization number. We may refund the customer’s money or replace the product.
Our domestic return policy also generally provides that a customer may return product that is overstocked. Overstocking returns are limited to two times in each 12 month period up to 1% of distributor’s total purchase of products for the prior 12 month period upon the following terms: i) an “overstocked” product is that portion of distributor’s inventory of the product which exceeds distributor’s sales volume for the product during the preceding four months; ii) distributor must not have taken delivery of the product which is overstocked during the preceding
four months; iii) overstocked product held by distributor in excess of 12 months from the date of original invoice will not be eligible for return; iv) the product must have an expiration date of at least 12 months from the date of return; v) the overstocked product must be returned to us in our saleable case cartons which are unopened and untampered, with no broken or re-taped seals; vi) distributor will be granted a credit which may be used only to purchase other products from us, the credit to be in the amount of the invoice price of the returned product less a 10% restocking fee which will be assessed against distributor’s subsequent purchase of product; vii) distributor must obtain an authorization code from our distribution department and affix the code to the returned product; and viii) distributor shall bear the cost of shipping the returned products to us. All product overstocks and returns are subject to inspection and acceptance by us.
Our international contracts generally do not provide for any returns.
Dependence on Major Customers
One customer accounted for an aggregate of 31.4% of our revenue in 2016. We have numerous other customers and distributors that sell our products in the U.S. and internationally.
Backlog Orders
Order backlog is not material to our business inasmuch as orders for our products generally are received and filled on a current basis, except for items temporarily out of stock.
Government Funding of Research and Right to License
Thomas J. Shaw received grants from the federal government for his initial 1991 version of a safety syringe, which may give the federal government the right to allow others to manufacture that syringe. However, we believe the government has no right to allow others to manufacture the current version of the VanishPoint® syringe.
Government Approval and Government Regulations
For all products manufactured for sale in the domestic market, we have given notice of intent to market to the FDA, and the devices were shown to be substantially equivalent to the predicate devices for the stated intended use.
For all products manufactured for sale in the domestic market and foreign market, we hold a Quality Management System certification to ISO 13485. We also have approval to label products for sale into European Union countries with a CE mark. Both of these certifications are issued by our notified body, bsi, and are reviewed annually.
We will continue to comply with applicable regulations of all countries in which our products are registered for sale.
We cannot anticipate changes in trade policy from the current administration.
Competitive Conditions
Our products are sold to and used by healthcare providers primarily in the U.S. (with 11.8% of revenues in 2016 generated from sales outside the U.S.) which include, but are not limited to, acute care hospitals, alternate care facilities, doctors’ offices, clinics, emergency centers, surgical centers, long-term care facilities, Veterans Administration facilities, military organizations, public health facilities, and prisons.
We compete primarily on the basis of healthcare worker and patient safety, product performance, and quality. We believe our competitive advantages include, but are not limited to, our leadership in quality and innovation. We believe our products continue to be the most effective safety devices in today’s market. Our syringe products include passive safety activation, require less disposal space, and are activated while in the patient, reducing exposure to the contaminated needle. Our price per unit is competitive or even lower than the competition
once all the costs incurred during the life cycle of a syringe are considered. Such life cycle costs include disposal costs, testing and treatment costs for needlestick injuries, and treatment for contracted illnesses resulting from needlestick injuries.
Major domestic competitors include BD and Medtronic Minimally Invasive Therapies (“Medtronic,” formerly known as Covidien). Terumo Medical Corp., Smiths Medical, and B Braun are additional competitors with smaller market shares.
Founded in 1897, BD is headquartered in New Jersey. BD’s medical segment safety-engineered device sales accounted for approximately 15.4% of BD’s total 2016 sales. BD’s classification of medical segment safety-engineered devices include the Safety-Lok™ syringe, which features a tubular plastic sheath that must be manually slid over the needle after removal from the patient, and the SafetyGlide™ hypodermic needle which utilizes a manually activated hinged lever to cover the needle tip after removal from the patient. BD markets the SafetyGlide™ blood collection set that has a manually activated cover designed to extend over the needle after use. The BD Eclipse™ safety blood collection needle and hypodermic needle is also designed to manually cover the needle after removal from the patient. BD manufactures the Integra™ 3mL retracting needle and syringe product, as well as a spring activated Vacutainer® Passive Shielding Blood Collection Needle and spring activated retracting Vacutainer® blood collection set. BD’s “Vacutainer®” brand name is commonly used as industry jargon to refer to blood collection products in general.
Medtronic offers the Monoject® safety syringe, which, like the BD SafetyLok™, requires the use of two hands to manually extend the tubular plastic shield to cover the needle after removal from the patient. Medtronic also markets the Magellan™ needle, similar to BD’s SafetyGlide™ needle, which has a manually activated hinged lever to cover the needle tip after removal from the patient.
Many of BD’s and Medtronic’s products result in exposure to the contaminated needle or allow for needle removal and potential syringe reuse.
In contrast, VanishPoint® syringes can be used without significant changes in injection technique. The automated needle retraction is activated when the plunger handle is fully depressed, in conjunction with the delivery of the complete medication dose, while the needle is still in the patient. This pre-removal activation virtually eliminates exposure to the contaminated needle, reducing the risk of needlestick injuries. Activation is easily accomplished in one step, using one hand. Upon activation of the retraction mechanism, VanishPoint® syringes are rendered unusable, reducing the risk of disposal-related injuries or reuse.
EasyPoint® retractable needles offer unique safety benefits not found in other commercially available safety needles. Manually activated safety needles, such as BD’s SafetyGlide™ and Eclipse™ needles, and Medtronics’ Magellan™ needle, must be removed from the patient, exposing the contaminated needle prior to activation of the manual safety mechanism. EasyPoint® needles allow for activation of the automated retraction mechanism while the needle is still in the patient, reducing exposure to the contaminated needle and effectively reducing the risk of needlestick injuries. BD’s Integra™ needle allows for retraction from the patient but must be used in conjunction with a BD Integra™ 3mL syringe. The Integra™ needle does not have a luer fitting, making it incompatible with commonly used luer-fitting syringes and pre-filled syringes. In addition, the safety feature of the Integra™ needle/syringe combination can only be activated when the plunger handle is fully depressed and the contents have been expelled. EasyPoint® retractable needles are compatible with luer-fitting syringes, including pre-filled syringes. In addition, EasyPoint® retractable needles may be activated with fluid in the syringe, making it applicable for aspiration procedures such as blood collection.
Our safety needle products have several advantages over non-retracting safety needles, including, but not limited to: pre-removal activation; needle retraction; integrated safety mechanism; reuse prevention; ease of use; disposal safety and efficiency; and minimal training.
BD and Medtronic have controlling U.S. market share; greater financial resources; larger and more established sales, marketing, and distribution organizations; and greater market influence, including long-term and/or exclusive contracts. Additionally, BD may be able to use its resources to improve its products through research or acquisitions or develop new products, which may compete with our products.
Several factors could materially and beneficially affect the marketability of our products. Demand could be increased by existing legislation and other legislative and investigative efforts. Licensing agreements could provide entry into new markets and generate additional revenue. Further, outsourcing arrangements could increase our manufacturing capacity with little or no capital outlay and provide a competitive cost.
Our competitive position is weakened by the method that providers use for making purchasing decisions and the fact that our initial price per unit for our safety needle products may be higher than some of the less effective safety needle products that are on the market.
Research and Development
We spent $572,000; $608,000; and $617,000 in 2016, 2015, and 2014, respectively, on research and development. Costs in 2016 were primarily for employee compensation and validation and engineering samples. Our ongoing research and development activities are performed by an internal research and development staff and includes developing process improvements for current and future automated machines. Our limited access to the market has slowed the introduction of products.
Environmental Compliance
We believe that we do not incur material costs in connection with compliance with environmental laws. We are considered a Conditionally Exempt Small Quantity Generator because we generate less than 100 kilograms (220 lbs.) of hazardous waste per month. Therefore, we are exempt from the reporting requirements set forth by the Texas Commission on Environmental Quality. The waste that is generated at our facility is primarily made up of flammable liquids and paint-related waste and is sent for fuel blending by Safety Kleen. This fuel blending process completely destroys our waste and satisfies our “cradle-to-grave” responsibility.
Other nonhazardous production waste includes clean polypropylene regrind, paper, and corrugated material that is recycled. All other nonhazardous waste produced is considered municipal solid waste and sent to a sanitary landfill by CWD.
We also produce small amounts of regulated biohazardous waste from contaminated sharps and laboratory wastes. This waste is sent for incineration by Stericycle.
Employees
As of March 1, 2017, we had 135 employees. 133 of such employees were full time employees.
Financial Information about Geographic Areas
We have minimal long-lived assets in foreign countries. Shipments to international customers generally require a prepayment either by wire transfer or an irrevocable confirmed letter of credit. We do extend credit to international customers on some occasions depending upon certain criteria, including, but not limited to, the credit worthiness of the customer, the stability of the country, banking restrictions, and the size of the order. All transactions are in U.S. currency. If customers designate a specific destination for its order, we attribute sales to countries based on the destination of shipment.
|
|
|
2016 |
|
2015 |
|
2014 |
| |||
|
U.S. sales |
|
$ |
26,308,246 |
|
$ |
23,029,976 |
|
$ |
27,649,974 |
|
|
North and South America sales (excluding U.S.) |
|
2,741,518 |
|
5,668,785 |
|
5,651,426 |
| |||
|
Other international sales |
|
776,872 |
|
853,439 |
|
1,219,230 |
| |||
|
Total sales |
|
$ |
29,826,636 |
|
$ |
29,552,200 |
|
$ |
34,520,630 |
|
|
|
|
|
|
|
|
|
| |||
|
Long-lived assets |
|
|
|
|
|
|
| |||
|
U.S. |
|
$ |
11,930,293 |
|
$ |
11,282,192 |
|
$ |
10,642,859 |
|
|
International |
|
$ |
161,744 |
|
$ |
185,869 |
|
$ |
209,994 |
|
Most large international sales of VanishPoint® products are filled by production from Chinese manufacturers. In the event that we become unable to purchase such product from our Chinese manufacturers, we would need to find an alternate manufacturer for the blood collection set, IV catheter, Patient Safe® syringe, 0.5mL insulin syringe, 0.5mL autodisable syringe, and 2mL, 5mL, and 10mL syringes and we would increase domestic production for the 1mL and 3mL syringes.
We do not maintain patent or trademark protection in all foreign countries, but, where possible, have taken steps to protect our patents and trademarks in those countries where we routinely conduct a material amount of business. Our lack of patent and trademark protection, particularly in certain foreign countries, heightens the risk that our designs may be copied by a competitor.
We cannot anticipate changes in trade policy from the current administration.
Available Information
We make available, free of charge on our website (www.retractable.com), our Form 10-K Annual Report and Form 10-Q Quarterly reports and current reports on Form 8-K (and any amendments to such reports) as soon as reasonably practical after such reports are filed.
We could be subject to complex and costly regulatory activities. Our business could suffer if we or our suppliers encounter manufacturing problems. We could be subject to risks associated with doing business outside of the U.S. Current or worsening economic conditions may adversely affect our business and financial condition.
You should carefully consider the following material risks facing us. If any of these risks occur, our business, results of operations, or financial condition could be materially affected.
We Compete in a Marketplace Dominated by BD
We operate in an environment that is dominated by BD, the major syringe manufacturer in the U.S. We initiated a lawsuit in 2007 against BD. The suit was for patent infringement, antitrust practices, and false advertising. The court severed the patent claims from the other claims. The antitrust and false advertising claims resulted in a final judgment for $352 million plus prejudgment and post-judgment interest at the district court level, but on December 2, 2016, the Fifth Circuit Court of Appeals overturned the antitrust damages. The finding of false advertising liability was affirmed and the case was remanded to the Eastern District of Texas for a redetermination as to the amount of damages to which we are entitled. The Eastern District of Texas trial date is May 11, 2017. Our petition for certiorari to the U.S. Supreme Court was denied on March 20, 2017.
Although we have made limited progress in some areas, such as the alternate care and some international markets, our volumes are not as high as they should be given the nature and quality of our products and the federal and state legislation requiring the use of safe needle devices. We believe this is due to BD’s activities, despite our litigation efforts described briefly above.
We Have Generally Been Unable to Gain Sufficient Market Access to Achieve Profitable Operations
We have a history of incurring net operating losses. We may experience operating losses in the future. If we are unable to gain sufficient market access and market share, we may be unable to continue to finance research and development as well as support operations and expansion of production.
We Are Dependent on Our Aging Patent Protection
Our main competitive strength is our technology. We are dependent on patent rights, and if the patent rights are invalidated or circumvented, our business would be adversely affected. Patent protection is considered, in the aggregate, to be of material importance in the design, development, and marketing of products.
The Company holds exclusive rights under domestic and foreign patents and has pending applications related to the technology embodied in products that are currently marketed. The Company also holds rights related to new products under development. The patents exclusively licensed by the Company have varying remaining terms and expiration dates. While patents covering some features of the VanishPoint® syringes have recently expired, another patent with a later expiration date will continue to provide patent coverage for VanishPoint® syringes until 2020.
VanishPoint® syringes comprised 93.0% of our sales in 2016. When the patents expire and we lose market exclusivity in 2020, we may experience a significant and rapid loss of sales from VanishPoint® syringes, which could have a material adverse effect on our business.
Patent life may be extended, not through the original patents, but through related improvements. As our technology ages (and the associated patent life expires), our competitive position in the marketplace could weaken. The patent protection may decrease and make us vulnerable to other competitors utilizing our technology.
We do not maintain patent or trademark protection in all foreign countries, but, where possible, have taken steps to protect our patents and trademarks in those countries where we routinely conduct a material amount of business. Our lack of patent and trademark protection, particularly in certain foreign countries, heightens the risk that our designs may be copied by a competitor.
Our Patents Are Subject to Litigation
We have been sued by BD and MDC Investment Holdings, Inc. for patent infringement. This case has been administratively closed until our case against BD is resolved. Patent litigation and challenges involving our patents are costly and unpredictable and may deprive us of market exclusivity for a patented product or, in some cases, third party patents may prevent us from marketing and selling a product in a particular geographic area.
We Are Vulnerable to New Technologies
Because we have a narrow focus on particular product lines and technology (currently, predominantly retractable needle products), we are vulnerable to the development of superior competing products and to changes in technology which could eliminate or reduce the need for our products. If a superior technology is created, the demand for our products could greatly diminish.
Our Competitors Have Greater Resources
Our competitors have greater financial resources, larger and more established sales and marketing and distribution organizations, and greater market influence, including long-term contracts. These competitors may be able to use these resources to improve their products through research and acquisitions or develop new products, which may compete more effectively with our products. If our competitors choose to use their resources to create products superior to ours, we may be unable to sell our products and our ability to continue operations would be weakened.
The Majority of Our Sales Are Filled Using Third Party Manufacturers
Most international sales, as well as a substantial portion of domestic sales, are filled by production from Chinese manufacturers. In the event that we become unable to purchase such product from our Chinese manufacturers, we would need to find an alternate manufacturer for the blood collection set, IV catheter, Patient Safe® syringe, 0.5mL insulin syringe, 0.5mL autodisable syringe, and 2mL, 5mL, and 10mL syringes and we would increase domestic production for the 1mL and 3mL syringes. Even with increased domestic production, we may not be able to avoid a disruption in supply. In 2016, the 1mL and 3mL syringes made up 86.0% of our unit sales and 85.2% of our revenues. We have a strong relationship with our Chinese manufacturers and we communicate with them frequently.
Fluctuations in Supplies of Inventory Could Temporarily Increase Costs
Fluctuations in the cost and availability of raw materials and inventory and the ability to maintain favorable third party manufacturing arrangements and relationships could result in the need to manufacture all of our products in the U.S. This could temporarily increase unit costs as we ramp up domestic production.
We Are Controlled by One Shareholder
Thomas J. Shaw, our President and Chief Executive Officer, has investment or voting power over a total of 51.6% of the outstanding Common Stock. He has the right to buy one million additional shares (3.1%) pursuant to private stock sales from the Company. Mr. Shaw therefore has the ability to direct our operations and financial affairs and to substantially influence the election of members of our Board of Directors. His interests may not always coincide with the Company’s interests or the interests of other stockholders. This concentration of ownership, for example, may have the effect of delaying, deferring, or preventing a change in control, impeding a merger, consolidation, takeover, or other business combination involving us, or discouraging a potential acquirer from making a tender offer or otherwise attempting to obtain control of us, which in turn could materially adversely affect the market price of our Common Stock. Mr. Shaw’s rights under the Technology License Agreement, as the owner of the technology we produce, present similar conflicts of interest.
Current Economic Conditions May Decrease Collectability of Accounts
Although we believe that we have granted credit to credit-worthy firms, current economic conditions may affect the timing and/or collectability of some accounts.
We Face Inherent Product Liability Risks
As a manufacturer and provider of safety needle products, we face an inherent business risk of exposure to product liability claims. If a product liability claim is made and damages are in excess of our product liability coverage, our competitive position could be weakened by the amount of money we could be required to pay to compensate those injured by our products. In the event of a recall, we have recall insurance.
Our business may be affected by changes in the health care regulatory environment
In the U.S. and internationally, government authorities may enact changes in regulatory requirements, reform existing reimbursement programs, and/or make changes to patient access to health care, all of which could adversely affect the demand for our products and/or put downward pressure on our prices. In the U.S., significant debate surrounds the repeal and/or replacement of the Affordable Care Act. Future health care rulemaking could affect our business. We cannot predict the timing or impact of any future rulemaking or changes in the law.
International operations may be affected by legislation
We are subject to risks associated with our international operations. In 2016, we used Chinese manufacturers to produce 78.4% of our products. Trade protection measures and/or changes to import or export requirements could adversely impact our operations. We cannot predict changes in U.S. foreign trade policy, but some trade protection measures have been recently discussed by the current administration. Additionally, we derive 11.8% of our revenues from international sales. International sales, particularly in emerging market countries, are further subject to a variety of regulatory, economic, and political risks as well.
Our new products may not replace lost VanishPoint® sales after 2020
Patent coverage for VanishPoint® syringes will expire in 2020. Following the patent expiration, expected declines in sales of VanishPoint® syringes, which currently comprise 93.0% of our revenues, means that our future success is dependent on new products. We have engaged in research and development for many years to develop other commercially successful products. Often, new products take a number of years to develop and sales of a new
product may be disappointing. Based on industry-wide trends, we anticipate that demand may increase for one of our newer products, the EasyPoint® needle, but sales in 2016 for this product were only 4.5% of our total revenues.
Item 1B. Unresolved Staff Comments.
Not applicable and none.
Our headquarters is located at 511 Lobo Lane, on 35 acres, which we own, overlooking Lake Lewisville in Little Elm, Texas. The headquarters is in good condition and houses our administrative offices and manufacturing facility. The manufacturing facility produced approximately 21.6% of the units that were manufactured in 2016. In the event that we become unable to purchase product from our Chinese manufacturers, we would need to find an alternate manufacturer for the blood collection set, IV catheter, Patient Safe® syringe, 0.5mL insulin syringe, 0.5mL autodisable syringe, and 2mL, 5mL, and 10mL syringes and we would increase domestic production for the 1mL and 3mL syringes. The 5mL and 10mL syringes are sold principally in the international market. In 2016, we used approximately 18.0% of our current U.S. productive capacity.
A loan in the original principal amount of $4,210,000 is secured by our land and buildings. See Note 7 to our financial statements for more information.
In the opinion of Management, the property and equipment are suitable for their intended use and are adequately covered by an insurance policy.
In May 2010, our and Mr. Shaw’s suit against BD in the U.S. District Court for the Eastern District of Texas, Marshall Division alleging violations of antitrust acts, false advertising, product disparagement, tortious interference, and unfair competition was reopened. The trial commenced on September 9, 2013, in the U.S. District Court for the Eastern District of Texas, Tyler Division, and the jury found that BD illegally engaged in anticompetitive conduct with the intent to acquire or maintain monopoly power in the safety syringe market and engaged in false advertising under the Lanham Act. The jury awarded us $113,508,014 in damages, which was trebled pursuant to statute. The Court granted injunctive relief to take effect January 15, 2015. In doing so, the Court found that BD’s business practices limited innovation, including false advertisements that suppressed sales of the VanishPoint®. The specific injunctive relief includes: (1) enjoining BD’s use of “World’s Sharpest Needle” or any similar assertion of superior sharpness; (2) requiring notification to all customers who purchased BD syringe products from July 2, 2004, to date that BD wrongfully claimed that its syringe needles were sharper and that its statement that it had “data on file” was false and misleading; (3) requiring notification to employees, customers, distributors, GPOs, and government agencies that the deadspace of the VanishPoint® has been within ISO standards since 2004 and that BD overstated the deadspace of the VanishPoint® to represent that it was higher than some of BD’s syringes when it was actually less, and that BD’s statement that it had “data on file” was false and misleading, and, in addition, posting this notice on its website for a period of three years; (4) enjoining BD from advertising that its syringe products save medication as compared to VanishPoint® products for a period of three years; (5) requiring notification to all employees, customers, distributors, GPOs, and government agencies that BD’s website, cost calculator, printed materials, and oral representations alleging BD’s syringes save medication as compared to the VanishPoint® were based on false and inaccurate measurement of the VanishPoint®, and, in addition, posting this notice on its website for a period of three years; and (6) requiring the implementation of a comprehensive training program for BD employees and distributors that specifically instructs them not to use old marketing materials and not to make false representations regarding VanishPoint® syringes. Final judgment was entered on January 15, 2015, awarding us $340,524,042 in damages and $11,722,823 in attorneys’ fees, as well as granting injunctive relief consistent with the orders as indicated above. The parties stipulated that the amount of litigation costs recoverable by us is $295,000. On January 14, 2015, the District Court stayed the portion of the injunctive relief that requires BD to notify end-user customers but also ordered BD to comply with internal correction activities as well as mandatory disclosures as set out above to its employees, customers, distributors and Group Purchasing Organizations. BD filed an appeal of that ruling with the 5th Circuit Court of Appeals and that appeal was denied on February 3, 2015. On February 12, 2015, BD filed a motion to amend the judgment directed most specifically to the
issue of award of prejudgment interest. On April 23, 2015, the Court entered an Amended Final Judgment that removed prejudgment interest but kept all other monetary and injunctive relief the same as was granted in the original Final Judgment. BD filed its brief in the appeal on July 20, 2015. Oral argument occurred on Monday, February 29, 2016. On December 2, 2016, the 5th Circuit Court of Appeals overturned the antitrust damages. The finding of false advertising liability was affirmed and the case was remanded to the Eastern District of Texas for a redetermination as to the amount of damages to which we are entitled. The Eastern District of Texas trial date is May 11, 2017. Our petition for certiorari to the U.S. Supreme Court was denied on March 20, 2017.
In September 2007, BD and MDC Investment Holdings, Inc. (“MDC”) sued us in the United States District Court for the Eastern District of Texas, Texarkana Division, initially alleging that we are infringing two U.S. patents of MDC (6,179,812 and 7,090,656) that are licensed to BD. BD and MDC seek injunctive relief and unspecified damages. We counterclaimed for declarations of non-infringement, invalidity, and unenforceability of the asserted patents. The plaintiffs subsequently dropped allegations with regard to patent no. 7,090,656 and we subsequently dropped our counterclaims for unenforceability of the asserted patents. On June 30, 2015, the Court ordered that further proceedings in this matter be stayed and that this case remain administratively closed until resolution of all appeals in the case detailed in the preceding paragraph. The case remains stayed as a result of the ongoing proceedings regarding the Lanham Act claims in the separate proceeding described above.
Item 4. Mine Safety Disclosures.
Not applicable.
Item 5. Market for Registrant’s Common Equity, Related Stockholder Matters, and Issuer Purchases of Equity Securities.
MARKET INFORMATION
Our Common Stock has been listed on the NYSE MKT (or its predecessor entities) under the symbol “RVP” since May 4, 2001. Our closing price on March 1, 2017, was $1.04 per share. Shown below are the high and low sales prices of our Common Stock as reported by the NYSE MKT for each quarter of the last two fiscal years:
|
2016 |
|
High |
|
Low |
| ||
|
Fourth Quarter |
|
$ |
2.74 |
|
$ |
0.88 |
|
|
Third Quarter |
|
$ |
2.79 |
|
$ |
2.10 |
|
|
Second Quarter |
|
$ |
2.90 |
|
$ |
2.13 |
|
|
First Quarter |
|
$ |
3.15 |
|
$ |
2.10 |
|
|
2015 |
|
High |
|
Low |
| ||
|
Fourth Quarter |
|
$ |
3.85 |
|
$ |
2.77 |
|
|
Third Quarter |
|
$ |
4.34 |
|
$ |
3.60 |
|
|
Second Quarter |
|
$ |
4.55 |
|
$ |
3.73 |
|
|
First Quarter |
|
$ |
5.70 |
|
$ |
3.80 |
|
SHAREHOLDERS
As of March 1, 2017, there were 31,666,454 shares of Common Stock held by 204 shareholders of record not including shareholders who beneficially own Common Stock held in nominee or “street name.”
DIVIDENDS
We have not ever declared or paid any dividends on the Common Stock. We have no current plans to pay any cash dividends on the Common Stock. We intend to retain all earnings, except those required to be paid to the holders of the Preferred Stock as resources allow, to support operations and future growth. Dividends on Common
Stock cannot be paid so long as preferred dividends are unpaid. As of December 31, 2016, there was an aggregate of $10.8 million in preferred dividends in arrears. As of December 31, 2015, there was an aggregate of $10.3 million in preferred dividends in arrears.
EQUITY COMPENSATION PLAN INFORMATION
See Item 12. Security Ownership of Certain Beneficial Owners and Management and Related Stockholder Matters for a chart describing compensation plans under which equity securities are authorized.
STOCK PERFORMANCE GRAPH
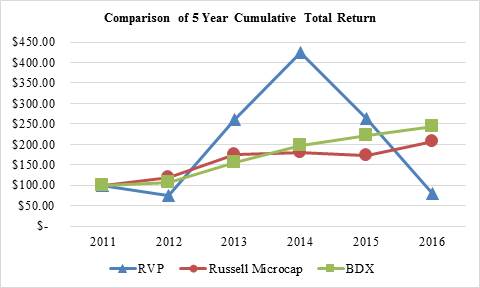
The following graph compares the cumulative total return for our Common Stock from December 31, 2011 to December 31, 2016, to the total returns for the Russell Microcap® and Becton, Dickinson and Company (or “BDX”), a peer issuer. The graph assumes an investment of $100 in the aforementioned equities as of December 31, 2011, and that all dividends are reinvested.
RECENT SALES OF UNREGISTERED SECURITIES
No unregistered securities were sold during the period covered by this report.
PURCHASES OF EQUITY SECURITIES BY THE ISSUER AND AFFILIATED PURCHASERS
There were no repurchases during the period covered by this report.
Item 6. Selected Financial Data.
The following selected financial data is qualified by reference to, and should be read in conjunction with, our audited financial statements and the notes to those statements and Management’s Discussion and Analysis of Financial Condition and Results of Operations appearing elsewhere herein. The selected Statements of Operations data presented below for the years ended December 31, 2013 and 2012 and the Balance Sheet data as of December 31, 2014, 2013, and 2012 have been derived from our audited financial statements, which are not included herein.
(In thousands except for earnings per share, shares, and percentages)
|
|
|
As of and for the Years Ended December 31, |
| |||||||||||||
|
|
|
2016 |
|
2015 |
|
2014 |
|
2013 |
|
2012 |
| |||||
|
Sales, net |
|
$ |
29,827 |
|
$ |
29,552 |
|
$ |
34,521 |
|
$ |
30,785 |
|
$ |
33,644 |
|
|
Cost of sales |
|
19,485 |
|
18,987 |
|
22,499 |
|
20,475 |
|
22,468 |
| |||||
|
Gross profit |
|
10,342 |
|
10,565 |
|
12,022 |
|
10,310 |
|
11,176 |
| |||||
|
Total operating expenses |
|
13,849 |
|
13,773 |
|
14,180 |
|
16,241 |
|
15,115 |
| |||||
|
Loss from operations |
|
(3,507 |
) |
(3,208 |
) |
(2,158 |
) |
(5,931 |
) |
(3,939 |
) | |||||
|
Interest income |
|
26 |
|
25 |
|
34 |
|
39 |
|
47 |
| |||||
|
Interest expense, net |
|
(213 |
) |
(220 |
) |
(223 |
) |
(231 |
) |
(231 |
) | |||||
|
Litigation proceeds |
|
— |
|
7,725 |
|
— |
|
— |
|
— |
| |||||
|
Income (loss) before income taxes |
|
(3,694 |
) |
4,322 |
|
(2,347 |
) |
(6,123 |
) |
(4,123 |
) | |||||
|
Provision (benefit) for income taxes |
|
1 |
|
8 |
|
8 |
|
91 |
|
10 |
| |||||
|
Net income (loss) |
|
(3,695 |
) |
4,314 |
|
(2,355 |
) |
(6,214 |
) |
(4,133 |
) | |||||
|
Deemed capital contribution on extinguishment of preferred stock |
|
— |
|
2,306 |
|
— |
|
— |
|
— |
| |||||
|
Preferred Stock dividend requirements |
|
(705 |
) |
(709 |
) |
(915 |
) |
(916 |
) |
(918 |
) | |||||
|
Income (loss) applicable to common shareholders |
|
$ |
(4,400 |
) |
$ |
5,911 |
|
$ |
(3,270 |
) |
$ |
(7,130 |
) |
$ |
(5,051 |
) |
|
Earnings (loss) per share — basic |
|
$ |
(0.15 |
) |
$ |
0.21 |
|
$ |
(0.12 |
) |
$ |
(0.26 |
) |
$ |
(0.19 |
) |
|
Earnings (loss) per share — diluted |
|
$ |
(0.15 |
) |
$ |
0.20 |
|
$ |
(0.12 |
) |
$ |
(0.26 |
) |
$ |
(0.19 |
) |
|
Weighted average shares outstanding — basic |
|
29,354,437 |
|
27,822,593 |
|
27,375,450 |
|
26,999,698 |
|
26,219,728 |
| |||||
|
|
|
|
|
|
|
|
|
|
|
|
| |||||
|
Weighted average shares outstanding — diluted |
|
29,354,437 |
|
29,481,294 |
|
27,375,450 |
|
26,999,698 |
|
26,219,728 |
| |||||
|
|
|
|
|
|
|
|
|
|
|
|
| |||||
|
Current assets |
|
$ |
26,677 |
|
$ |
30,811 |
|
$ |
33,983 |
|
$ |
37,660 |
|
$ |
35,194 |
|
|
Current liabilities |
|
$ |
7,172 |
|
$ |
8,096 |
|
$ |
15,100 |
|
$ |
16,621 |
|
$ |
8,077 |
|
|
Property, plant, and equipment, net |
|
$ |
12,092 |
|
$ |
11,468 |
|
$ |
10,853 |
|
$ |
10,910 |
|
$ |
11,900 |
|
|
Total assets |
|
$ |
38,779 |
|
$ |
42,294 |
|
$ |
45,106 |
|
$ |
48,850 |
|
$ |
47,385 |
|
|
Long-term debt, net of current maturities |
|
$ |
3,498 |
|
$ |
3,417 |
|
$ |
3,425 |
|
$ |
3,577 |
|
$ |
3,826 |
|
|
Stockholders’ equity |
|
$ |
28,108 |
|
$ |
30,781 |
|
$ |
26,581 |
|
$ |
28,653 |
|
$ |
35,482 |
|
|
Redeemable Preferred Stock (in shares) |
|
781,445 |
|
781,445 |
|
987,445 |
|
994,945 |
|
1,001,552 |
| |||||
|
Capital leases |
|
— |
|
— |
|
— |
|
— |
|
— |
| |||||
|
Cash dividends per common share |
|
$ |
— |
|
$ |
— |
|
$ |
— |
|
$ |
— |
|
$ |
— |
|
|
Gross profit margin |
|
34.7 |
% |
35.8 |
% |
34.8 |
% |
33.5 |
% |
33.2 |
% | |||||
Events that could affect the trends indicated above include changes in manufacturing costs, changing average sales prices, changing raw material cost, the gaining of market access, protection of our patents, foreign currency exchange rates, the Medical Device Excise Tax, the impact of flu season requirements, new or changing regulations, and new products. As our products are made from petroleum products, the changing cost of oil and transportation may have an impact on our costs to the extent increases may not be recoverable through price
increases of our products and reductions in oil prices may not quickly affect petroleum product prices. Our purchase of 200,000 shares of our Preferred Stock in 2015 reduced Preferred Stock Dividend Requirements. The receipt of $7,724,826 from BD pursuant to litigation affects both the current assets and current liabilities in 2013 and 2014. The recognition of the $7,724,826 in the second quarter of 2015 had a significant impact on 2015 income. The introduction of the Medical Device Excise Tax in 2013 affects comparability between 2013 and prior years. The Medical Device Excise Tax was suspended for two years beginning January 1, 2016. In 2014, we took steps to decrease our non-litigation legal costs by approximately $1.1 million. Additionally, in 2014, we reduced our workforce by 13.7% in an effort to cut costs. Any recovery from BD in our lawsuit against them, if received, could materially affect our future financial condition. Future legal expenses are expected to be lower in 2017 due to an anticipated reduction in litigation fees. Some increases in compensation were instituted in 2016 and 2017, both for existing employees and new hires.
Item 7. Management’s Discussion and Analysis of Financial Condition and Results of Operation.
FORWARD-LOOKING STATEMENT WARNING
Certain statements included by reference in this filing containing the words “could,” “may,” “believes,” “anticipates,” “intends,” “expects,” and similar such words constitute forward-looking statements within the meaning of the Private Securities Litigation Reform Act. Any forward-looking statements involve known and unknown risks, uncertainties, and other factors that may cause our actual results, performance, or achievements to be materially different from any future results, performance, or achievements expressed or implied by such forward-looking statements. Such factors include, among others, our ability to maintain liquidity, our maintenance of patent protection, the impact of current and future Court decisions regarding current litigation, our ability to maintain favorable third party manufacturing and supplier arrangements and relationships, foreign trade risk, our ability to quickly increase capacity in response to an increase in demand, our ability to access the market, our ability to maintain or lower production costs, our ability to continue to finance research and development as well as operations and expansion of production, the impact of larger market players, specifically BD, in providing devices to the safety market, and other factors referenced in Item 1A. Risk Factors. Given these uncertainties, undue reliance should not be placed on forward-looking statements.
Overview
We have been manufacturing and marketing our products since 1997. Safety syringes comprised 93.0% of our sales in 2016. We also manufacture and market the blood collection tube holder, IV safety catheter, and VanishPoint® Blood Collection Set. We currently provide other safety medical products in addition to safety products utilizing retractable technology. One such product is the Patient Safe® syringe, which is uniquely designed to reduce the risk of bloodstream infections associated with catheter hub contamination.
In the second quarter of 2016, we began selling a new product, the EasyPoint® needle. EasyPoint® needles made up 4.5% of revenues in 2016. The EasyPoint® is a retractable needle that can be used with Luer lock syringes, Luer slip syringes, and prefilled syringes to give injections. The EasyPoint® needle can also be used to aspirate fluids and collect blood. According to a December 2016 press release from Zion Market Research, prefilled syringes play an important role in the injectable drug delivery devices market and the compound annual growth rate is expected to be approximately 9.5% between 2016 and 2021. The global market size for prefilled syringes was approximately 4.1 billion units ($3.5 billion) in 2015. A March 2016 article published in Medical Design Technology details the benefits of the EasyPoint® needle as well as the existing VanishPoint® syringe. The article states, “for the first time, clinicians will be able to change needles and have the safety of automated needle retraction.” The article is available on the Resource Center link on our website at www.retractable.com.
Historically, unit sales have increased in the latter part of the year due, in part, to the demand for syringes during the flu season.
Our products have been and continue to be distributed nationally and internationally through numerous distributors. Although we have made limited progress in some areas, such as the alternate care market, our volumes are not as high as they should be given the nature and quality of our products and the federal and state legislation
requiring the use of safe needle devices. The alternate care market is composed of facilities that provide long-term nursing and out-patient surgery, emergency care, physician services, health clinics, and retail pharmacies.
We continue to pursue various strategies to have better access to the hospital market, as well as other markets, including attempting to gain access to the market through our sales efforts, our innovative technology, introduction of new products, and, when necessary, litigation.
We have reported in the past that our progress is limited principally due to the practices engaged in by BD, the dominant maker and seller of disposable syringes. We initiated a lawsuit in 2007 against BD. As previously reported, on December 2, 2016, the Fifth Circuit Court of Appeals overturned a district court judgment that had previously awarded us $340 million in antitrust damages from BD, but affirmed a finding of false advertising liability against BD and remanded the case to the Eastern District of Texas for a redetermination as to the amount of damages to which we are entitled. The Eastern District of Texas trial date is May 11, 2017. Our petition for certiorari to the U.S. Supreme Court was denied on March 20, 2017.
We have taken steps to reduce our future litigation expenses and expect such expenses to be significantly less in 2017.
In 2014, the Company took steps to decrease non-litigation legal costs by approximately $1.1 million. In 2014 and 2015, the Company reduced its workforce to further cut costs. In the future, if such cost cutting measures prove insufficient, we may reduce other operating expenses, reduce the workforce, reduce the salaries of officers as well as other employees, and/or defer royalty payments. Some increases in compensation were made in 2016 and 2017.
The Consolidated Appropriations Act, 2016 (Pub. L. 114-113), signed into law on December 18, 2015, includes a two year moratorium on the 2.3% medical device excise tax imposed by Internal Revenue Code section 4191. Thus, the medical device excise tax was suspended beginning on January 1, 2016 and ending on December 31, 2017. The impact of this tax was $360,000 in 2015.
We reevaluated several compensation strategies in late 2016 and early 2017. See Compensation Discussion and Analysis. We also approved three of our executive officers to purchase shares directly from the Company. Thomas J. Shaw exercised a portion of such right on January 12, 2017, buying two million shares at market price for an aggregate purchase price of $1.78 million. In April 2016, Mr. Shaw exercised an option for one million shares for an aggregate exercise price of $810,000.
We exchanged 728 thousand shares of our Common Stock for 200 thousand shares of our Series IV Class B Convertible Preferred Stock as of November 30, 2015 pursuant to an agreement with a shareholder. Such shareholder agreed to waive all unpaid dividends in arrears associated with the tendered preferred stock, equaling $3.1 million. Future dividend requirements of $200 thousand per year are avoided as a result of this transaction.
Product purchases from our Chinese manufacturers have enabled us to increase manufacturing capacity with little capital outlay and have provided a competitive manufacturing cost. In 2016, our primary Chinese manufacturer produced approximately 86.3% of our VanishPoint® syringes. In the event that we become unable to purchase products from our Chinese manufacturers, we would need to find an alternate manufacturer for the blood collection set, IV catheter, Patient Safe® syringe, 0.5mL insulin syringe, 0.5mL autodisable syringe, and 2mL, 5mL, and 10mL syringes and we would increase domestic production for the 1mL and 3mL syringes.
In 1995, we entered into a license agreement with Thomas J. Shaw for the exclusive right to manufacture, market, and distribute products utilizing automated retraction technology. This technology is the subject of various patents and patent applications owned by Mr. Shaw. The license agreement generally provides for quarterly payments of a 5% royalty fee on gross sales.
With increased volumes, our manufacturing unit costs have generally tended to decline. Factors that could affect our unit costs include increases in costs by third party manufacturers, changing production volumes, costs of petroleum products, and transportation costs. Increases in such costs may not be recoverable through price increases of our products.
RESULTS OF OPERATIONS
The following discussion contains trend information and other forward-looking statements that involve a number of risks and uncertainties. Our actual future results could differ materially from our historical results of operations and those discussed in the forward-looking statements. All period references are to our fiscal years ended December 2016, 2015, or 2014. Dollar amounts have been rounded for ease of reading.
Comparison of Year Ended
December 31, 2016 and Year Ended December 31, 2015
Domestic sales accounted for 88.2% and 77.9% of the revenues in 2016 and 2015, respectively. Domestic revenues increased 14.2% principally due to sales of our 1 mL syringe and EasyPoint® needles. Domestic unit sales increased 15.6%. Domestic unit sales were 83.3% of total unit sales for 2016. International revenues decreased from $6.5 million in 2015 to $3.5 million in 2016, primarily due to fluctuation in the timing of orders. Overall unit sales decreased 7.0%. Our international orders may be subject to significant fluctuation over time. Such orders may fluctuate due to health initiatives at various times as well as economic conditions.
Cost of manufactured product increased $448 thousand principally due to higher manufacturing costs. Royalty expense increased $50 thousand due to increased gross sales. Gross profit margins decreased from 35.8% in 2015 to 34.7% in 2016.
Operating expenses increased 0.6% from the prior year due to an impairment charge of $456 thousand, stock option expense, consulting costs, and 401(k) plan matching expense. The impairment charge of $456 thousand was related to Patient Safe® assembly equipment. These expenses were largely offset by decreases in the Medical Device Excise tax of $360 thousand, severance pay, professional fees, and bonus pay.
A non-recurring recognition of $7,724,826 received from BD in the second quarter of 2015 pursuant to a patent infringement case had a significant impact on 2015 income. Recognizing this payment also significantly decreased 2015 current liabilities on the Balance Sheets.
In 2015, earnings per share was positively affected by our acquisition of 200,000 shares of IV Class B convertible preferred stock. Under the guidelines of ASC 260-10-S99-2, Effect on the Calculation of Earnings per Share for the Redemption or Induced Conversion of Preferred Stock, we reflected the gain on extinguishment of this preferred stock in net income per common stockholder used to calculate earnings per share. This accounting treatment had the effect of increasing the income applicable to common shareholders by $2.3 million in 2015 which had a material effect on the determination of earnings per share for that year.
The loss from operations was $3.2 million in 2015 compared to an operating loss of $3.6 million in 2016.
Cash flow from operations was a negative $795 thousand for 2016 due to our Net loss, mitigated by noncash expense consisting principally of Depreciation, Impairment of assets, Share based compensation, and reduced working capital.
Comparison of Year Ended
December 31, 2015 and Year Ended December 31, 2014
Domestic sales accounted for 77.9% and 80.1% of the revenues in 2015 and 2014, respectively. Domestic revenues decreased 16.7% principally due to reduced flu demand. Domestic unit sales decreased 17.6%. Domestic unit sales were 67.0% of total unit sales for 2015. International revenues decreased from $6.9 million in 2014 to $6.5 million in 2015, primarily due to more restrictive qualification requirements by the Company. Overall unit sales decreased 11.9%. Our international orders may be subject to significant fluctuation over time. Such orders may fluctuate due to health initiatives at various times as well as economic conditions.
Cost of manufactured product decreased $3.3 million principally due to lower volumes. Royalty expense decreased $251 thousand due to decreased gross sales. Gross profit margins increased from 34.8% in 2014 to 35.8% in 2015.
Operating expenses decreased 2.9% from the prior year due to decreased Medical Device Excise Taxes attributable to refunds, lower compensation costs, and lower travel and entertainment costs.
A non-recurring recognition of $7,724,826 received from BD in the second quarter of 2015 pursuant to a patent infringement case had a significant impact on 2015 income. Recognizing this payment also significantly decreased 2015 current liabilities on the Balance Sheets.
The loss from operations was $3.2 million in 2015 compared to an operating loss of $2.2 million in 2014.
Earnings per share were positively affected by our acquisition of 200,000 shares of IV Class B convertible preferred stock. Under the guidelines of ASC 260-10-S99-2, Effect on the Calculation of Earnings per Share for the Redemption or Induced Conversion of Preferred Stock, we reflected the gain on extinguishment of this preferred stock in net income per common stockholder used to calculate earnings per share.
Cash flow from operations was a negative $3.3 million for 2015 due primarily to the loss from operations and changes in working capital, namely increased inventories and other current assets, mitigated by a decrease in Accounts receivable and an increase in Accounts payable.
LIQUIDITY AND CAPITAL RESOURCES
At the present time, Management does not intend to publicly raise equity capital. Due to the funds received from prior litigation, we have sufficient cash reserves and intend to rely on operations, cash reserves, and debt financing, when available, as the primary ongoing sources of cash. Our ability to obtain additional funds through loans is uncertain. We cannot predict any recovery of damages in our litigation against BD at this time. The ultimate outcome of this suit could have a material effect on our financial condition.
Historical Sources of Liquidity
We have historically funded operations primarily from the proceeds from revenues, private placements, litigation settlements, and loans.
Internal Sources of Liquidity
Margins and Market Access
To routinely achieve positive or break even quarters, we need increased access to hospital markets which has been difficult to obtain. We will continue to attempt to gain access to the market through our sales efforts, innovative technology, the introduction of new products, and, when necessary, litigation.
We continue to focus on methods of upgrading our manufacturing capability and efficiency in order to reduce costs.
Fluctuations in the cost and availability of raw materials and inventory and our ability to maintain favorable manufacturing arrangements and relationships could result in the need to manufacture all (as opposed to 21.6%) of our products in the U.S. This could temporarily increase unit costs as we ramp up domestic production.
The mix of domestic and international sales affects the average sales price of our products. Generally, the higher the ratio of domestic sales to international sales, the higher the average sales price will be. Typically, large international sales of VanishPoint® products are shipped directly from China to the customer. Purchases of product manufactured in China usually decrease the average cost of manufacture for all units. The number of units produced by us versus manufactured in China can have a significant effect on the carrying costs of inventory as well as Cost of sales. We will continue to evaluate the appropriate mix of products manufactured domestically and those manufactured in China to achieve economic benefits as well as to maintain our domestic manufacturing capability.
Fluctuations in the cost of oil (since our products are petroleum based) and transportation and the volume of units purchased from our Chinese manufacturers may have an impact on the unit costs of our product. Increases in such costs may not be recoverable through price increases of our products. Reductions in oil prices may not quickly affect petroleum product prices.
Seasonality
Historically, unit sales have increased during the flu season.
Cash Requirements
Due to funds received from prior litigation, we have sufficient cash reserves and intend to rely on operations, cash reserves, and debt financing, when available, as the primary ongoing sources of cash. We have taken steps to decrease our non-litigation legal costs and we continue to evaluate these costs. Additionally, in 2014 and 2015, we reduced our workforce. We have also taken steps to reduce our future litigation expenses and expect such expenses to be significantly lower in 2017. In the future, if such cost cutting measures prove insufficient, we may reduce the number of units being produced, reduce the workforce, reduce the salaries of officers and other employees, and/or defer royalty payments. Some increases in compensation were made in 2016 and 2017.
External Sources of Liquidity
We have obtained several loans since our inception, which have, together with the proceeds from the sales of equities and litigation efforts, enabled us to pursue development and production of our products. Our ability to obtain additional funds through loans is uncertain. Due to the current market price of our Common Stock, it is unlikely we would choose to raise funds by the public sale of equity. We have approved three of our executive officers to engage in private purchases of stock at market prices. Mr. Shaw exercised a portion of his purchase right on January 12, 2017, buying two million shares at market price for an aggregate purchase price of $1.78 million.
Capital Resources
In 2016, we purchased additional equipment for manufacturing for approximately $1.9 million. Most of this expenditure was specifically for the manufacture of the EasyPoint® needle, with the remainder being for molding machines which may be utilized for any of our molds.
OFF-BALANCE SHEET ARRANGEMENTS
None.
CONTRACTUAL OBLIGATIONS
Contractual Obligations and Commercial Commitments
The following chart summarizes our material obligations and commitments to make future payments under contracts for long-term debt as of December 31, 2016:
|
|
|
Payments Due by Period |
| |||||||||||||
|
|
|
Total |
|
Less |
|
1-3 |
|
3-5 |
|
More |
| |||||
|
Contractual Obligations |
|
|
|
|
|
|
|
|
|
|
| |||||
|
Long-term debt |
|
$ |
3,928,637 |
|
$ |
430,393 |
|
$ |
3,498,244 |
|
$ |
— |
|
$ |
— |
|
|
Operating leases |
|
322,195 |
|
77,015 |
|
245,180 |
|
— |
|
— |
| |||||
|
Total |
|
$ |
4,250,832 |
|
$ |
507,408 |
|
$ |
3,743,424 |
|
$ |
— |
|
$ |
— |
|
Item 7A. Quantitative and Qualitative Disclosures About Market Risk.
We believe that our market risk exposures regarding our cash and cash equivalents are immaterial as we do not have instruments for trading purposes. Additionally, reasonable, possible near-term changes in market rates or prices will not result in material changes in near-term earnings.
Item 8. Financial Statements and Supplementary Data.
RETRACTABLE TECHNOLOGIES, INC.
FINANCIAL STATEMENTS AND
REPORT OF INDEPENDENT REGISTERED PUBLIC ACCOUNTING FIRM
DECEMBER 31, 2016 AND 2015
RETRACTABLE TECHNOLOGIES, INC.
INDEX TO FINANCIAL STATEMENTS
|
|
Page |
|
|
|
|
F-3 | |
|
|
|
|
Financial Statements: |
|
|
|
|
|
F-4 | |
|
|
|
|
Statements of Operations for the years ended December 31, 2016, 2015, and 2014 |
F-5 |
|
|
|
|
Statements of Changes in Stockholders’ Equity for the years ended December 31, 2016, 2015, and 2014 |
F-6 |
|
|
|
|
Statements of Cash Flows for the years ended December 31, 2016, 2015, and 2014 |
F-8 |
|
|
|
|
F-9 | |
|
|
|
|
F-26 | |
|
|
|
|
Financial Statement Schedule: |
|
|
|
|
|
43 |
REPORT OF INDEPENDENT REGISTERED PUBLIC ACCOUNTING FIRM
To the Board of Directors and Stockholders
of Retractable Technologies, Inc.
We have audited the accompanying balance sheets of Retractable Technologies, Inc. as of December 31, 2016, and 2015, and the related statements of operations, changes in stockholders’ equity, and cash flows for each of the three years in the period ended December 31, 2016. Our audits also included the financial statement schedule of Retractable Technologies, Inc., listed in Item 15(a). These financial statements and financial statement schedule are the responsibility of the Company’s management. Our responsibility is to express an opinion on these financial statements and schedule based on our audits.
We conducted our audits in accordance with the standards of the Public Company Accounting Oversight Board (United States). Those standards require that we plan and perform the audit to obtain reasonable assurance about whether the financial statements are free of material misstatement. The Company is not required to have, nor were we engaged to perform an audit of its internal control over financial reporting. Our audits included consideration of internal control over financial reporting as a basis for designing audit procedures that are appropriate in the circumstances, but not for the purpose of expressing an opinion on the effectiveness of the Company’s internal control over financial reporting. Accordingly, we express no such opinion. An audit also includes examining, on a test basis, evidence supporting the amounts and disclosures in the financial statements, assessing the accounting principles used and significant estimates made by management, as well as evaluating the overall financial statement presentation. We believe that our audits provide a reasonable basis for our opinion.
In our opinion, the financial statements referred to above present fairly, in all material respects, the financial position of Retractable Technologies, Inc. as of December 31, 2016, and 2015, and the results of its operations and its cash flows for each of the three years in the period ended December 31, 2016, in conformity with accounting principles generally accepted in the United States of America. Also, in our opinion, such financial statement schedule, when considered in relation to the basic financial statements taken as a whole, presents fairly, in all material respects, the information set forth therein.
|
/s/ Moss Adams LLP |
|
|
|
|
Dallas, Texas
March 31, 2017
RETRACTABLE TECHNOLOGIES, INC.
|
|
|
December 31, |
| ||||
|
|
|
2016 |
|
2015 |
| ||
|
ASSETS |
|
|
|
|
| ||
|
Current assets: |
|
|
|
|
| ||
|
Cash and cash equivalents |
|
$ |
16,199,043 |
|
$ |
18,045,044 |
|
|
Accounts receivable, net of allowance for doubtful accounts of $1,731,985 and $1,795,481, respectively |
|
3,267,838 |
|
4,900,997 |
| ||
|
Inventories, net |
|
7,017,224 |
|
6,296,625 |
| ||
|
Other current assets |
|
192,548 |
|
1,568,032 |
| ||
|
Total current assets |
|
26,676,653 |
|
30,810,698 |
| ||
|
|
|
|
|
|
| ||
|
Property, plant, and equipment, net |
|
12,092,037 |
|
11,468,061 |
| ||
|
Other assets |
|
10,289 |
|
15,326 |
| ||
|
Total assets |
|
$ |
38,778,979 |
|
$ |
42,294,085 |
|
|
|
|
|
|
|
| ||
|
LIABILITIES AND STOCKHOLDERS’ EQUITY |
|
|
|
|
| ||
|
Current liabilities: |
|
|
|
|
| ||
|
Accounts payable |
|
$ |
4,471,756 |
|
$ |
5,697,518 |
|
|
Current portion of long-term debt |
|
430,393 |
|
249,349 |
| ||
|
Accrued compensation |
|
536,456 |
|
763,576 |
| ||
|
Dividends payable |
|
55,113 |
|
55,414 |
| ||
|
Accrued royalties to shareholder |
|
659,443 |
|
631,145 |
| ||
|
Other accrued liabilities |
|
1,008,699 |
|
690,535 |
| ||
|
Income taxes payable |
|
10,584 |
|
8,176 |
| ||
|
Total current liabilities |
|
7,172,444 |
|
8,095,713 |
| ||
|
|
|
|
|
|
| ||
|
Long-term debt, net of current maturities |
|
3,498,244 |
|
3,417,471 |
| ||
|
Total liabilities |
|
10,670,688 |
|
11,513,184 |
| ||
|
|
|
|
|
|
| ||
|
Commitments and contingencies – See Note 8 |
|
|
|
|
| ||
|
|
|
|
|
|
| ||
|
Stockholders’ equity: |
|
|
|
|
| ||
|
Preferred Stock, $1 par value: |
|
|
|
|
| ||
|
Class B; authorized: 5,000,000 shares |
|
|
|
|
| ||
|
Series I, Class B; outstanding: 98,500 shares (liquidation preference of $615,625) |
|
98,500 |
|
98,500 |
| ||
|
Series II, Class B; outstanding: 171,200 shares (liquidation preference of $2,140,000) |
|
171,200 |
|
171,200 |
| ||
|
Series III, Class B; outstanding: 129,245 shares (liquidation preference of $1,615,563) |
|
129,245 |
|
129,245 |
| ||
|
Series IV, Class B; outstanding: 342,500 shares (liquidation preference of $3,767,500) |
|
342,500 |
|
342,500 |
| ||
|
Series V, Class B; outstanding: 40,000 (liquidation preference of $176,000) |
|
40,000 |
|
40,000 |
| ||
|
Common Stock, no par value; authorized: 100,000,000 shares; outstanding: 29,666,454 and 28,619,874 shares, respectively |
|
— |
|
— |
| ||
|
Additional paid-in capital |
|
59,290,333 |
|
58,268,036 |
| ||
|
Accumulated deficit |
|
(31,963,487 |
) |
(28,268,580 |
) | ||
|
Total stockholders’ equity |
|
28,108,291 |
|
30,780,901 |
| ||
|
Total liabilities and stockholders’ equity |
|
$ |
38,778,979 |
|
$ |
42,294,085 |
|
See accompanying notes to financial statements
RETRACTABLE TECHNOLOGIES, INC.
|
|
|
Years Ended December 31, |
| |||||||
|
|
|
2016 |
|
2015 |
|
2014 |
| |||
|
Sales, net |
|
$ |
29,826,636 |
|
$ |
29,552,200 |
|
$ |
34,520,630 |
|
|
Cost of Sales |
|
|
|
|
|
|
| |||
|
Costs of manufactured product |
|
16,957,073 |
|
16,509,446 |
|
19,770,226 |
| |||
|
Royalty expense to shareholders |
|
2,527,508 |
|
2,477,583 |
|
2,728,701 |
| |||
|
Total cost of sales |
|
19,484,581 |
|
18,987,029 |
|
22,498,927 |
| |||
|
Gross profit |
|
10,342,055 |
|
10,565,171 |
|
12,021,703 |
| |||
|
|
|
|
|
|
|
|
| |||
|
Operating expenses: |
|
|
|
|
|
|
| |||
|
Sales and marketing |
|
4,025,786 |
|
3,837,491 |
|
3,967,081 |
| |||
|
Research and development |
|
571,842 |
|
607,527 |
|
616,784 |
| |||
|
General and administrative |
|
8,795,310 |
|
9,328,029 |
|
9,595,399 |
| |||
|
Impairment of assets |
|
456,119 |
|
— |
|
— |
| |||
|
Total operating expenses |
|
13,849,057 |
|
13,773,047 |
|
14,179,264 |
| |||
|
Loss from operations |
|
(3,507,002 |
) |
(3,207,876 |
) |
(2,157,561 |
) | |||
|
|
|
|
|
|
|
|
| |||
|
Litigation proceeds |
|
— |
|
7,724,826 |
|
— |
| |||
|
|
|
|
|
|
|
|
| |||
|
Interest and other income |
|
26,522 |
|
24,917 |
|
33,941 |
| |||
|
Interest expense, net |
|
(213,295 |
) |
(219,672 |
) |
(222,808 |
) | |||
|
Income (loss) before income taxes |
|
(3,693,775 |
) |
4,322,195 |
|
(2,346,428 |
) | |||
|
Provision for income taxes |
|
1,132 |
|
7,877 |
|
8,177 |
| |||
|
Net income (loss) |
|
(3,694,907 |
) |
4,314,318 |
|
(2,354,605 |
) | |||
|
Preferred Stock dividend requirements |
|
(704,996 |
) |
(709,351 |
) |
(915,225 |
) | |||
|
Deemed capital contribution on extinguishment of preferred stock |
|
— |
|
2,305,678 |
|
— |
| |||
|
Income (loss) applicable to common shareholders |
|
$ |
(4,399,903 |
) |
$ |
5,910,645 |
|
$ |
(3,269,830 |
) |
|
|
|
|
|
|
|
|
| |||
|
Basic earnings (loss) per share |
|
$ |
(0.15 |
) |
$ |
0.21 |
|
$ |
(0.12 |
) |
|
|
|
|
|
|
|
|
| |||
|
Diluted earnings (loss) per share |
|
$ |
(0.15 |
) |
$ |
0.20 |
|
$ |
(0.12 |
) |
|
|
|
|
|
|
|
|
| |||
|
Weighted average common shares outstanding: |
|
|
|
|
|
|
| |||
|
Basic |
|
29,354,437 |
|
27,822,593 |
|
27,375,450 |
| |||
|
Diluted |
|
29,354,437 |
|
29,481,294 |
|
27,375,450 |
| |||
See accompanying notes to financial statements
RETRACTABLE TECHNOLOGIES, INC.
STATEMENTS OF CHANGES IN STOCKHOLDERS’ EQUITY
|
|
|
Series I Class B |
|
Series II Class B |
|
Series III Class B |
|
Series IV Class B |
|
Series V Class B |
|
Common |
| ||||||||||||||||||
|
|
|
Shares |
|
Amount |
|
Shares |
|
Amount |
|
Shares |
|
Amount |
|
Shares |
|
Amount |
|
Shares |
|
Amount |
|
Shares |
|
Amount |
| ||||||
|
Balance as of December 31, 2013 |
|
103,500 |
|
$ |
103,500 |
|
178,700 |
|
$ |
178,700 |
|
130,245 |
|
$ |
130,245 |
|
542,500 |
|
$ |
542,500 |
|
40,000 |
|
$ |
40,000 |
|
27,187,702 |
|
$ |
— |
|
|
|
|
|
|
|
|
|
|
|
|
|
|
|
|
|
|
|
|
|
|
|
|
|
|
|
| ||||||
|
Conversion of Preferred Stock into Common Stock |
|
(5,000 |
) |
(5,000 |
) |
(2,500 |
) |
(2,500 |
) |
— |
|
— |
|
— |
|
— |
|
— |
|
— |
|
7,500 |
|
— |
| ||||||
|
|
|
|
|
|
|
|
|
|
|
|
|
|
|
|
|
|
|
|
|
|
|
|
|
|
| ||||||
|
Stock options exercised |
|
— |
|
— |
|
— |
|
— |
|
— |
|
— |
|
— |
|
— |
|
— |
|
— |
|
418,195 |
|
— |
| ||||||
|
|
|
|
|
|
|
|
|
|
|
|
|
|
|
|
|
|
|
|
|
|
|
|
|
|
| ||||||
|
Dividends |
|
— |
|
— |
|
— |
|
— |
|
— |
|
— |
|
— |
|
— |
|
— |
|
— |
|
— |
|
— |
| ||||||
|
|
|
|
|
|
|
|
|
|
|
|
|
|
|
|
|
|
|
|
|
|
|
|
|
|
| ||||||
|
Net loss |
|
— |
|
— |
|
— |
|
— |
|
— |
|
— |
|
— |
|
— |
|
— |
|
— |
|
— |
|
— |
| ||||||
|
|
|
|
|
|
|
|
|
|
|
|
|
|
|
|
|
|
|
|
|
|
|
|
|
|
| ||||||
|
Balance as of December 31, 2014 |
|
98,500 |
|
98,500 |
|
176,200 |
|
176,200 |
|
130,245 |
|
130,245 |
|
542,500 |
|
542,500 |
|
40,000 |
|
40,000 |
|
27,613,397 |
|
— |
| ||||||
|
|
|
|
|
|
|
|
|
|
|
|
|
|
|
|
|
|
|
|
|
|
|
|
|
|
| ||||||
|
Conversion of Preferred Stock into Common Stock |
|
— |
|
— |
|
(5,000 |
) |
(5,000 |
) |
(1,000 |
) |
(1,000 |
) |
(200,000 |
) |
(200,000 |
) |
— |
|
— |
|
206,000 |
|
— |
| ||||||
|
|
|
|
|
|
|
|
|
|
|
|
|
|
|
|
|
|
|
|
|
|
|
|
|
|
| ||||||
|
Stock options exercised |
|
— |
|
— |
|
— |
|
— |
|
— |
|
— |
|
— |
|
— |
|
— |
|
— |
|
272,477 |
|
— |
| ||||||
|
|
|
|
|
|
|
|
|
|
|
|
|
|
|
|
|
|
|
|
|
|
|
|
|
|
| ||||||
|
Issuance of new Common Stock |
|
— |
|
— |
|
— |
|
— |
|
— |
|
— |
|
— |
|
— |
|
— |
|
— |
|
528,000 |
|
— |
| ||||||
|
|
|
|
|
|
|
|
|
|
|
|
|
|
|
|
|
|
|
|
|
|
|
|
|
|
| ||||||
|
Registration of new shares |
|
— |
|
— |
|
— |
|
— |
|
— |
|
— |
|
— |
|
— |
|
— |
|
— |
|
— |
|
— |
| ||||||
|
|
|
|
|
|
|
|
|
|
|
|
|
|
|
|
|
|
|
|
|
|
|
|
|
|
| ||||||
|
Retirement of treasury stock |
|
— |
|
— |
|
— |
|
— |
|
— |
|
— |
|
— |
|
— |
|
— |
|
— |
|
— |
|
— |
| ||||||
|
|
|
|
|
|
|
|
|
|
|
|
|
|
|
|
|
|
|
|
|
|
|
|
|
|
| ||||||
|
Dividends |
|
— |
|
— |
|
— |
|
— |
|
— |
|
— |
|
— |
|
— |
|
— |
|
— |
|
— |
|
— |
| ||||||
|
|
|
|
|
|
|
|
|
|
|
|
|
|
|
|
|
|
|
|
|
|
|
|
|
|
| ||||||
|
Net income |
|
— |
|
— |
|
— |
|
— |
|
— |
|
— |
|
— |
|
— |
|
— |
|
— |
|
— |
|
— |
| ||||||
|
|
|
|
|
|
|
|
|
|
|
|
|
|
|
|
|
|
|
|
|
|
|
|
|
|
| ||||||
|
Balance as of December 31, 2015 |
|
98,500 |
|
98,500 |
|
171,200 |
|
171,200 |
|
129,245 |
|
129,245 |
|
342,500 |
|
342,500 |
|
40,000 |
|
40,000 |
|
28,619,874 |
|
— |
| ||||||
|
|
|
|
|
|
|
|
|
|
|
|
|
|
|
|
|
|
|
|
|
|
|
|
|
|
| ||||||
|
Stock options exercised |
|
— |
|
— |
|
— |
|
— |
|
— |
|
— |
|
— |
|
— |
|
— |
|
— |
|
1,046,580 |
|
— |
| ||||||
|
|
|
|
|
|
|
|
|
|
|
|
|
|
|
|
|
|
|
|
|
|
|
|
|
|
| ||||||
|
Dividends |
|
— |
|
— |
|
— |
|
— |
|
— |
|
— |
|
— |
|
— |
|
— |
|
— |
|
— |
|
— |
| ||||||
|
|
|
|
|
|
|
|
|
|
|
|
|
|
|
|
|
|
|
|
|
|
|
|
|
|
| ||||||
|
Stock option compensation |
|
— |
|
— |
|
— |
|
— |
|
— |
|
— |
|
— |
|
— |
|
— |
|
— |
|
— |
|
— |
| ||||||
|
|
|
|
|
|
|
|
|
|
|
|
|
|
|
|
|
|
|
|
|
|
|
|
|
|
| ||||||
|
Net loss |
|
— |
|
— |
|
— |
|
— |
|
— |
|
— |
|
— |
|
— |
|
— |
|
— |
|
— |
|
— |
| ||||||
|
|
|
|
|
|
|
|
|
|
|
|
|
|
|
|
|
|
|
|
|
|
|
|
|
|
| ||||||
|
Balance as of December 31, 2016 |
|
98,500 |
|
$ |
98,500 |
|
171,200 |
|
$ |
171,200 |
|
129,245 |
|
$ |
129,245 |
|
342,500 |
|
$ |
342,500 |
|
40,000 |
|
$ |
40,000 |
|
29,666,454 |
|
$ |
— |
|
See accompanying notes to financial statements
RETRACTABLE TECHNOLOGIES, INC.
STATEMENTS OF CHANGES IN STOCKHOLDERS’ EQUITY
|
|
|
Additional |
|
Accumulated |
|
Treasury |
|
Total |
| ||||
|
|
|
|
|
|
|
|
|
|
| ||||
|
Balance as of December 31, 2013 |
|
$ |
58,983,166 |
|
$ |
(30,228,293 |
) |
$ |
(1,096,609 |
) |
$ |
28,653,209 |
|
|
|
|
|
|
|
|
|
|
|
| ||||
|
Conversion of Preferred Stock into Common Stock |
|
7,500 |
|
— |
|
— |
|
— |
| ||||
|
|
|
|
|
|
|
|
|
|
| ||||
|
Stock options exercised |
|
398,328 |
|
— |
|
— |
|
398,328 |
| ||||
|
|
|
|
|
|
|
|
|
|
| ||||
|
Dividends |
|
(115,225 |
) |
— |
|
— |
|
(115,225 |
) | ||||
|
|
|
|
|
|
|
|
|
|
| ||||
|
Net loss |
|
— |
|
(2,354,605 |
) |
— |
|
(2,354,605 |
) | ||||
|
|
|
|
|
|
|
|
|
|
| ||||
|
Balance as of December 31, 2014 |
|
59,273,769 |
|
(32,582,898 |
) |
(1,096,609 |
) |
26,581,707 |
| ||||
|
|
|
|
|
|
|
|
|
|
| ||||
|
Conversion of Preferred Stock into Common Stock |
|
206,000 |
|
— |
|
— |
|
— |
| ||||
|
|
|
|
|
|
|
|
|
|
| ||||
|
Stock options exercised |
|
283,933 |
|
— |
|
— |
|
283,933 |
| ||||
|
|
|
|
|
|
|
|
|
|
| ||||
|
Issuance of new Common Stock |
|
— |
|
— |
|
— |
|
— |
| ||||
|
|
|
|
|
|
|
|
|
|
| ||||
|
Registration of new shares |
|
(60,101 |
) |
— |
|
— |
|
(60,101 |
) | ||||
|
|
|
|
|
|
|
|
|
|
| ||||
|
Retirement of treasury stock |
|
(1,096,609 |
) |
— |
|
1,096,609 |
|
— |
| ||||
|
|
|
|
|
|
|
|
|
|
| ||||
|
Dividends |
|
(338,956 |
) |
— |
|
— |
|
(338,956 |
) | ||||
|
|
|
|
|
|
|
|
|
|
| ||||
|
Net income |
|
— |
|
4,314,318 |
|
— |
|
4,314,318 |
| ||||
|
|
|
|
|
|
|
|
|
|
| ||||
|
Balance as of December 31, 2015 |
|
58,268,036 |
|
(28,268,580 |
) |
— |
|
30,780,901 |
| ||||
|
|
|
|
|
|
|
|
|
|
| ||||
|
Stock options exercised |
|
855,021 |
|
— |
|
— |
|
855,021 |
| ||||
|
|
|
|
|
|
|
|
|
|
| ||||
|
Dividends |
|
(220,450 |
) |
— |
|
— |
|
(220,450 |
) | ||||
|
|
|
|
|
|
|
|
|
|
| ||||
|
Stock option compensation |
|
387,726 |
|
— |
|
— |
|
387,726 |
| ||||
|
|
|
|
|
|
|
|
|
|
| ||||
|
Net loss |
|
— |
|
(3,694,907 |
) |
— |
|
(3,694,907 |
) | ||||
|
|
|
|
|
|
|
|
|
|
| ||||
|
Balance as of December 31, 2016 |
|
$ |
59,290,333 |
|
$ |
(31,963,487 |
) |
$ |
— |
|
$ |
28,108,291 |
|
See accompanying notes to financial statements
RETRACTABLE TECHNOLOGIES, INC.
|
|
|
Years Ended December 31, |
| |||||||
|
|
|
2016 |
|
2015 |
|
2014 |
| |||
|
Cash flows from operating activities: |
|
|
|
|
|
|
| |||
|
Net income (loss) |
|
$ |
(3,694,907 |
) |
$ |
4,314,318 |
|
$ |
(2,354,605 |
) |
|
Adjustments to reconcile net income (loss) to net cash provided (used) by operating activities: |
|
|
|
|
|
|
| |||
|
Depreciation and amortization |
|
872,868 |
|
858,391 |
|
1,074,520 |
| |||
|
Share based compensation |
|
387,726 |
|
— |
|
— |
| |||
|
Inventories reserve |
|
176,424 |
|
— |
|
— |
| |||
|
Provision for doubtful accounts |
|
92,000 |
|
116,395 |
|
27,300 |
| |||
|
Impairment of assets |
|
456,119 |
|
— |
|
— |
| |||
|
(Increase) decrease in assets: |
|
|
|
|
|
|
| |||
|
Inventories |
|
(897,023 |
) |
(1,633,077 |
) |
1,072,041 |
| |||
|
Accounts receivable |
|
1,541,159 |
|
624,699 |
|
(2,192,673 |
) | |||
|
Other current assets |
|
1,375,484 |
|
(373,977 |
) |
(128,414 |
) | |||
|
Other assets |
|
(750 |
) |
— |
|
— |
| |||
|
Increase (decrease) in liabilities: |
|
|
|
|
|
|
| |||
|
Accounts payable |
|
(1,225,762 |
) |
554,722 |
|
35,018 |
| |||
|
Litigation proceeds subject to stipulation |
|
— |
|
(7,724,826 |
) |
— |
| |||
|
Other accrued liabilities |
|
119,342 |
|
11,312 |
|
(1,318,327 |
) | |||
|
Income taxes payable |
|
2,408 |
|
(114 |
) |
(82,682 |
) | |||
|
Net cash used by operating activities |
|
(794,912 |
) |
(3,252,157 |
) |
(3,867,822 |
) | |||
|
|
|
|
|
|
|
|
| |||
|
Cash flows from investing activities: |
|
|
|
|
|
|
| |||
|
Purchase of property, plant, and equipment |
|
(1,947,172 |
) |
(1,465,010 |
) |
(1,007,933 |
) | |||
|
Changes in restricted cash |
|
— |
|
600,897 |
|
(600,897 |
) | |||
|
Net cash used by investing activities |
|
(1,947,172 |
) |
(864,113 |
) |
(1,608,830 |
) | |||
|
|
|
|
|
|
|
|
| |||
|
Cash flows from financing activities: |
|
|
|
|
|
|
| |||
|
Repayments of long-term debt and notes payable |
|
(263,200 |
) |
(184,447 |
) |
(249,220 |
) | |||
|
Proceeds from long-term debt |
|
525,017 |
|
276,495 |
|
— |
| |||
|
Proceeds from the exercise of stock options |
|
855,021 |
|
283,933 |
|
398,328 |
| |||
|
Stock registration fees |
|
— |
|
(60,101 |
) |
— |
| |||
|
Payment of Preferred Stock dividends |
|
(220,755 |
) |
(283,543 |
) |
(172,838 |
) | |||
|
Net cash provided (used) by financing activities |
|
896,083 |
|
32,337 |
|
(23,730 |
) | |||
|
|
|
|
|
|
|
|
| |||
|
Net decrease in cash and cash equivalents |
|
(1,846,001 |
) |
(4,083,933 |
) |
(5,500,382 |
) | |||
|
Cash and cash equivalents at: |
|
|
|
|
|
|
| |||
|
Beginning of period |
|
18,045,044 |
|
22,128,977 |
|
27,629,359 |
| |||
|
End of period |
|
$ |
16,199,043 |
|
$ |
18,045,044 |
|
$ |
22,128,977 |
|
|
|
|
|
|
|
|
|
| |||
|
Supplemental schedule of cash flow information: |
|
|
|
|
|
|
| |||
|
Interest paid |
|
$ |
213,295 |
|
$ |
219,672 |
|
$ |
222,808 |
|
|
Income taxes paid |
|
$ |
2,000 |
|
$ |
3,700 |
|
$ |
94,332 |
|
|
|
|
|
|
|
|
|
| |||
|
Supplemental schedule of noncash investing and financing activities: |
|
|
|
|
|
|
| |||
|
Preferred dividends declared, not paid |
|
$ |
55,113 |
|
$ |
55,414 |
|
$ |
— |
|
See accompanying notes to financial statements
1. BUSINESS OF THE COMPANY AND BASIS OF PRESENTATION
Business of the Company
Retractable Technologies, Inc. (the “Company”) was incorporated in Texas on May 9, 1994, and designs, develops, manufactures, and markets safety syringes and other safety medical products for the healthcare profession. The Company began to develop its manufacturing operations in 1995. The Company’s manufacturing and administrative facilities are located in Little Elm, Texas. The Company’s products are the VanishPoint® 0.5mL insulin syringe; 1mL tuberculin, insulin, and allergy antigen syringes; 0.5mL, 1mL, 2mL, 3mL, 5mL, and 10mL syringes; the small diameter tube adapter; the blood collection tube holder; the allergy tray; the IV safety catheter; the Patient Safe® syringes; the Patient Safe® Luer Cap; the VanishPoint® Blood Collection Set; and the EasyPoint® needle. The Company also sells VanishPoint® autodisable syringes in the international market in addition to the Company’s other products.
2. SUMMARY OF SIGNIFICANT ACCOUNTING POLICIES
Accounting estimates
The preparation of financial statements in conformity with U.S. generally accepted accounting principles (“GAAP”) requires Management to make estimates and assumptions that affect the reported amounts of assets and liabilities and disclosure of contingent assets and liabilities at the date of the financial statements and the reported amounts of revenues and expenses during the reporting period. Actual results could differ significantly from those estimates.
Cash and cash equivalents
For purposes of reporting cash flows, cash and cash equivalents include cash, money market accounts, and investments with original maturities of three months or less.
Accounts receivable
The Company records trade receivables when revenue is recognized. No product has been consigned to customers. The Company’s allowance for doubtful accounts is primarily determined by review of specific trade receivables. Those accounts that are doubtful of collection are included in the allowance. This provision is reviewed to determine the adequacy of the allowance for doubtful accounts. Trade receivables are charged off when there is certainty as to their being uncollectible. Trade receivables are considered delinquent when payment has not been made within contract terms.
The Company requires certain customers to make a prepayment prior to beginning production or shipment of their order. Customers may apply such prepayments to their outstanding invoices or pay the invoice and continue to carry forward the deposit for future orders. Such amounts are included in Other accrued liabilities on the Balance Sheets and are shown in Note 6, Other Accrued Liabilities.
The Company records an allowance for estimated returns as a reduction to Accounts receivable and Gross sales. Historically, returns have been immaterial.
Inventories
Inventories are valued at the lower of cost or market, with cost being determined using actual average cost. The Company compares the average cost to the market price and records the lower value. Management considers such factors as the amount of inventory on hand and in the distribution channel, estimated time to sell such inventory, the shelf life of inventory, and current market conditions when determining excess or obsolete inventories. A reserve is established for any excess or obsolete inventories or they may be written off.
Property, plant, and equipment
Property, plant, and equipment are stated at cost. Expenditures for maintenance and repairs are charged to operations as incurred. Cost includes major expenditures for improvements and replacements which extend useful lives or increase capacity and interest cost associated with significant capital additions. Gains or losses from property disposals are included in income.
Depreciation and amortization are calculated using the straight-line method over the following useful lives:
|
Production equipment |
|
3 to 13 years |
|
|
Office furniture and equipment |
|
3 to 10 years |
|
|
Buildings |
|
39 years |
|
|
Building improvements |
|
15 years |
|
|
Automobiles |
|
7 years |
|
Long-lived assets
The Company assesses the recoverability of long-lived assets using an assessment of the estimated undiscounted future cash flows related to such assets. In the event that assets are found to be carried at amounts which are in excess of estimated gross future cash flows, the assets will be adjusted for impairment to a level commensurate with fair value determined using a discounted cash flow analysis of the underlying assets.
During 2016, the Company recognized an impairment charge of $456,119 associated with its Patient Safe® production equipment. The Company determined it was more cost effective to outsource this production through an overseas manufacturer, and thus the Company’s Patient Safe® production equipment has been taken out of service. Minimal cash flows are expected to be generated by this equipment. Accordingly, the Company reduced the carrying value of the Patient Safe® production equipment to an estimated fair value of zero.
The Company’s remaining property, plant, and equipment primarily consists of buildings, land, assembly equipment for syringes, blood collection tube holders, and EasyPoint® needles, as well as molding machines, molds, office equipment, furniture, and fixtures.
The Company’s property, plant, and equipment primarily consist of buildings, land, assembly equipment, molding machines, molds, office equipment, furniture, and fixtures.
Intangible assets — correction of errors
The Balance Sheet as of December 31, 2015 as well as the Statements of Changes in Stockholders’ Equity for the years ended December 31, 2013, 2014 and 2015 have been revised to reflect a correction of errors that occurred in the 2007 and 2008 financial statements. The errors were due to capitalizing certain legal costs related to patents under the Company’s exclusive license agreement with the Chief Executive Officer that should have been expensed in accordance with the Company’s capitalization policy. The errors were immaterial to the Company’s previously filed financial statements. However, the cumulative effect of correcting the errors was determined by the Company to be material to the Statement of Operations for the year ended December 31, 2016. Accordingly, only the Balance Sheet and Statements of Changes in Stockholders’ Equity as of December 31, 2015, have been revised for comparative purposes. The effect on the 2015 Balance Sheet is to reduce Intangible and Other Assets by $246,779, and to increase the Accumulated deficit by $246,779. The opening balances of Accumulated deficit included in the Statements of Changes in Stockholder’s Equity have also been revised to reflect the correction of the errors for all years presented. The correction of the errors did not impact the Statement of Operations or the Statement of Cash Flows for all of the periods presented.
Financial instruments
The Company estimates the fair value of financial instruments through the use of public market prices, quotes from financial institutions, and other available information. Judgment is required in interpreting data to develop estimates of market value and, accordingly, amounts are not necessarily indicative of the amounts that could be realized in a current market exchange. Short-term financial instruments, including cash and cash equivalents, accounts receivable, accounts payable, and other liabilities, consist primarily of instruments without extended maturities, the fair value of which, based on Management’s estimates, equals their recorded values. The fair value of long-term liabilities, based on Management’s estimates, approximates their reported values.
Concentration risks
The Company’s financial instruments exposed to concentrations of credit risk consist primarily of cash, cash equivalents, and accounts receivable. Cash balances, some of which exceed federally insured limits, are maintained in financial institutions; however, Management believes the institutions are of high credit quality. The majority of accounts receivable are due from companies which are well-established entities. As a consequence, Management considers any exposure from concentrations of credit risks to be limited.
The following table reflects our significant customers in 2016, 2015, and 2014:
|
|
|
Years Ended December 31, |
| |||||||
|
|
|
2016 |
|
2015 |
|
2014 |
| |||
|
Number of significant customers |
|
1 |
|
2 |
|
3 |
| |||
|
Aggregate dollar amount of net sales to significant customers |
|
$ |
9.4 million |
|
$ |
13.5 million |
|
$ |
16.5 million |
|
|
Percentage of net sales to significant customers |
|
31.4 |
% |
45.7 |
% |
47.9 |
% | |||
The Company decreased its allowance for doubtful accounts by approximately $63 thousand in 2016.
The Company manufactures syringes in Little Elm, Texas as well as utilizing manufacturers in China. The Company purchases most of its product components from single suppliers, including needle adhesives and packaging materials. There are multiple sources of these materials. The Company obtained roughly 86.3% of its VanishPoint® syringes in 2016 from its primary Chinese manufacturer. Purchases from this Chinese manufacturer aggregated 77.7% and 73.1% of VanishPoint® finished products in 2015 and 2014, respectively. In the event that the Company becomes unable to purchase products from its Chinese manufacturers, the Company would need to find an alternate manufacturer for its blood collection set, IV catheter, Patient Safe® syringe, 0.5mL insulin syringe, 0.5mL autodisable syringe, and 2mL, 5mL, and 10mL syringes and would increase domestic production for the 1mL and 3mL syringes.
Revenue recognition
Revenue is recognized for sales when title and risk of ownership passes to the customer, generally upon shipment. Under certain contracts, revenue is recorded on the basis of sales price to distributors, less contractual pricing allowances. Contractual pricing allowances consist of: (i) rebates granted to distributors who provide tracking reports which show, among other things, the facility that purchased the products, and (ii) a provision for estimated contractual pricing allowances for products for which the Company has not received tracking reports. Rebates are recorded when issued and are applied against the customer’s receivable balance. Distributors receive a rebate for the difference between the Wholesale Acquisition Cost and the appropriate contract price as reflected on a tracking report provided by the distributor to the Company. If product is sold by a distributor to an entity that has no contract, there is a standard rebate (lower than a contracted rebate) given to the distributor. One of the purposes of the rebate is to encourage distributors to submit tracking reports to the Company. The provision for contractual pricing allowances is reviewed at the end of each quarter and adjusted for changes in levels of products for which there is no tracking report. Additionally, if it becomes clear that tracking reports will not be provided by individual distributors, the provision is further adjusted. The estimated contractual allowance is included in Accounts payable in the Balance Sheets and deducted from revenues in the Statements of Operations. Accounts payable included estimated contractual allowances for $3,591,534 and $3,733,199 as of December 31, 2016 and 2015, respectively. The terms and conditions of contractual pricing allowances are governed by contracts between the Company and its distributors. Revenue for shipments directly to end-users is recognized when title and risk of ownership pass from the Company. Any product shipped or distributed for evaluation purposes is expensed.
Certain distributors have taken rebates to which they are not entitled, such as utilizing a rebate for products not purchased directly from the Company. Major customers said they have ceased the practices resulting in claiming non-contractual rebates. Rebates can only be claimed on purchases made directly from the Company. The Company has established a reserve for the collectability of these non-contractual rebate amounts. The expense for the reserve is recorded in Operating expense, General and administrative. The reserve for such non-contractual deductions is included in the allowance for doubtful accounts. There has been no change to the reserve for contractual rebates in the periods currently presented.
The Company’s domestic return policy is set forth in its standard Distribution Agreement. This policy provides that a customer may return incorrect shipments within 10 days following arrival at the distributor’s facility. In all such cases, the distributor must obtain an authorization code from the Company and affix the code to the returned product. The Company will not accept returned goods without a returned goods authorization number. The Company may refund the customer’s money or replace the product.
The Company’s domestic return policy also generally provides that a customer may return product that is overstocked. Overstocking returns are limited to two times in each 12-month period up to 1% of distributor’s total purchase of products for the prior 12-month period. All product overstocks and returns are subject to inspection and acceptance by the Company.
The Company’s international distribution agreements generally do not provide for any returns.
Litigation proceeds
Proceeds from litigation are recognized when realizable. Generally, realization is not reasonably assured and expected until proceeds are collected.
On September 30, 2013, the Company received payment of $7,724,826 (the “Judgment Amount”) from Becton, Dickinson and Company (“BD”) pursuant to a stipulation in the patent infringement case Retractable Technologies, Inc. and Thomas Shaw v. Becton Dickinson and Company, Civil Action No. 2:07-cv-250, in the U.S. District Court for the Eastern District of Texas, Marshall Division. The Judgment Amount was included as income in the second quarter of 2015 due to the conclusion of the case and related appeals. Prior to the second quarter of 2015, the Judgment Amount had been shown as a liability on the balance sheet since the Company was paid the Judgment Amount and the litigation did not come to a final conclusion until the second quarter of 2015.
Income taxes
The Company evaluates tax positions taken or expected to be taken in a tax return for recognition in the financial statements based on whether it is “more-likely-than-not” that a tax position will be sustained based upon the technical merits of the position. Measurement of the tax position is based upon the largest amount of benefit that is greater than 50% likely of being realized upon ultimate settlement.
The Company provides for deferred income taxes through utilizing an asset and liability approach for financial accounting and reporting based on the tax effects of differences between the financial statement and tax bases of assets and liabilities, based on enacted rates expected to be in effect when such differences reverse in future periods. Deferred tax assets are periodically reviewed for realizability. The Company utilized some of its net operating loss carry forwards in 2013 and paid Alternative Minimum Tax on its taxable income. The Company has established a valuation allowance for its net deferred tax asset as future taxable income cannot be reasonably assured. Penalties and interest related to income tax are classified as General and administrative expense and Interest expense, respectively, in the Statements of Operations.
Earnings per share
The Company computes basic earnings per share (“EPS”) by dividing net earnings for the period (adjusted for any cumulative dividends for the period) by the weighted average number of common shares outstanding during the period. Diluted EPS includes the determinants of basic EPS and, in addition, reflects the dilutive effect, if any, of the common stock deliverable pursuant to stock options or common stock issuable upon the conversion of convertible preferred stock. The calculation of diluted EPS excluded 1,774,520 shares of Common Stock underlying issued and outstanding stock options at December 31, 2014 as their effect was antidilutive. The calculation of diluted EPS excluded 783,730 shares of Common Stock underlying issued and outstanding stock options at December 31, 2016 as their effect was antidilutive. The potential dilution, if any, is shown on the following schedule:
|
|
|
Years Ended December 31, |
| |||||||
|
|
|
2016 |
|
2015 |
|
2014 |
| |||
|
Net income (loss) |
|
$ |
(3,694,907 |
) |
$ |
4,314,318 |
|
$ |
(2,354,605 |
) |
|
Preferred dividend requirements |
|
(704,996 |
) |
(709,351 |
) |
(915,225 |
) | |||
|
Deemed capital contribution on extinguishment of preferred stock |
|
— |
|
2,305,678 |
|
— |
| |||
|
Income (loss) applicable to common shareholders after assumed conversions |
|
$ |
(4,399,903 |
) |
$ |
5,910,645 |
|
$ |
(3,269,830 |
) |
|
Average common shares outstanding |
|
29,354,437 |
|
27,822,593 |
|
27,375,450 |
| |||
|
Average common and common equivalent shares outstanding - assuming dilution |
|
29,354,437 |
|
29,481,294 |
|
27,375,450 |
| |||
|
Basic earnings (loss) per share |
|
$ |
(0.15 |
) |
$ |
0.21 |
|
$ |
(0.12 |
) |
|
Diluted earnings (loss) per share |
|
$ |
(0.15 |
) |
$ |
0.20 |
|
$ |
(0.12 |
) |
The Financial Accounting Standards Board Accounting Standards Codification 260-10-S99-2, Effect on the Calculation of Earnings per Share for the Redemption or Induced Conversion of Preferred Stock, requires the gain or loss on extinguishment of equity-classified preferred stock to be included in net income per common stockholder used to calculate earnings per share (similar to the treatment of dividends paid on preferred stock). The difference between (1) the fair value of the consideration transferred to the holders of the preferred stock and (2) the carrying amount of the preferred stock (net of issuance costs) is subtracted from (or added to) net income to arrive at income available to common stockholders in the calculation of earnings per share.
The Company has determined to apply this guidance to its accounting treatment of the preferred stock transaction described in Note 19. From a legal standpoint, the transaction was neither a redemption nor conversion pursuant of the terms of the Certificate of Designation, Preferences, Rights and Limitations of the Series IV Class B Convertible Preferred Stock.
Shipping and handling costs
The Company classifies shipping and handling costs as part of Cost of sales in the Statements of Operations.
Research and development costs
Research and development costs are expensed as incurred.
Share-based compensation
The Company’s share-based payments are accounted for using the fair value method. The Company records share-based compensation expense on a straight-line basis over the requisite service period. The Company incurred the following share-based compensation costs:
|
|
|
Years Ended December 31, |
| |||||||
|
|
|
2016 |
|
2015 |
|
2014 |
| |||
|
Cost of sales |
|
$ |
141,782 |
|
$ |
— |
|
$ |
— |
|
|
Sales and marketing |
|
77,583 |
|
— |
|
— |
| |||
|
Research and development |
|
23,623 |
|
— |
|
— |
| |||
|
General and administrative |
|
144,738 |
|
— |
|
— |
| |||
|
|
|
$ |
387,726 |
|
$ |
— |
|
$ |
— |
|
Options awarded to employees in 2016 were amortized over twelve months. The Company amortized four month’s expense for options granted in September 2016. Non-employee Directors’ option expense was all expensed in the fourth quarter of 2016.
The Company early adopted FASB Accounting Standards Update (“ASU”) 2016-09, “Compensation - Stock Compensation (Topic 718): Improvements to Employee Share-Based Payment Accounting” for its annual period ended December 31, 2016. This ASU addresses several aspects of the accounting for share-based compensation transactions including: (a) income tax consequences when awards vest or are settled, (b) classification of awards as either equity or liabilities, (c) a policy election to account for forfeitures as they occur rather than on an estimated basis and (d) classification of excess tax impacts on the statement of cash flows.
As a result of adoption, excess tax benefits in 2016 resulting from the exercise of non-qualified stock options were recognized in the income tax provision rather than in additional-paid-in capital. As there were previously no excess income tax benefits recognized in additional-paid-in capital or other material changes to the Company’s accounting for share based compensation resulting from adoption of this ASU, no cumulative effect adjustments were required.
Recent pronouncements
In November 2016, the FASB issued Accounting Standards Update (“ASU”) 2016-18, “Statement of Cash Flows (Topic 230): Restricted Cash”. These amendments require that a statement of cash flows explain the change during the period in the total of cash, cash equivalents, and amounts generally described as restricted cash or restricted cash equivalents. As a result, amounts generally described as restricted cash and restricted cash equivalents should be included with cash and cash equivalents when reconciling the beginning-of-period and end-of-period total amounts shown on the statement of cash flows. The amendments do not provide a definition of restricted cash or restricted cash equivalents. The updated guidance is effective for the Company’s quarter ending March 31, 2018, with early adoption permitted. The Company is currently assessing the impact that adoption of this guidance will have on its financial statements and related disclosures.
In June 2016, the Financial Accounting Standards Board (“FASB”) issued Accounting Standards Update (“ASU”) 2016-13, “Financial Instruments —Credit Losses (Topic 326): Measurement of Credit Losses on
Financial Instruments”. Among other things, these amendments require the measurement of all expected credit losses for financial assets held at the reporting date based on historical experience, current conditions, and reasonable and supportable forecasts. Many of the loss estimation techniques applied today will still be permitted, although the inputs to those techniques will change to reflect the full amount of expected credit losses. This ASU is effective for the Company’s quarter ending March 31, 2020 with early application permitted for the Company’s quarter ending March 31, 2019. The Company is currently assessing the impact that adoption of this guidance will have on its financial statements and related disclosures.
In February 2016, the FASB issued ASU No. 2016-02, Leases (topic 842). Under the new ASU, lessees will be required to recognize the following for all leases (with the exception of short-term leases) at the commencement date: (1) a lease liability, which is a lessee’s obligation to make lease payments arising from a lease, measured on a discounted basis; and (2) a right-of-use asset, which is an asset that represents the lessee’s right to use, or control the use of, a specified asset for the lease term. Under the new guidance lessor accounting is largely unchanged. The new lease guidance simplified the accounting for sale and leaseback transactions primarily because lessees must recognize lease assets and lease liabilities. Lessees (for capital and operating leases) and lessors (for sales-type, direct financing, and operating leases) must apply a modified retrospective transition approach for leases existing at, or entered into after, the beginning of the earliest comparative period presented in the financial statements. The modified retrospective approach would not require any transition accounting for leases that expired before the earliest comparative period presented. This ASU is effective for the Company’s quarter ending March 31, 2019, with early adoption permitted. The Company is currently evaluating the impact of this standard.
In July 2015, the FASB issued ASU No. 2015-11, “Inventory (Topic 330) Simplifying the Measurement of Inventory,” which is part of the FASB’s Simplification Initiative. Inventory, including inventory measured at average cost, would be valued at the lower of cost or net realizable value. Net realizable value is the estimated selling prices in the ordinary course of business, less reasonably predictable costs of completion, disposal, and transportation. ASU 2015-11 is effective for the Company’s annual periods and interim periods within those annual periods beginning January 1, 2017. Amendments in this ASU should be applied prospectively with earlier application permitted at the beginning of an interim or annual reporting period. The Company is currently assessing the potential impact of this ASU on its financial statements.
In May 2014, FASB issued ASU No. 2014-09, “Revenue from Contracts with Customers”, which provides guidance for revenue recognition. This ASU’s core principle is that a company will recognize revenue when it transfers promised goods or services to customers in an amount that reflects consideration to which the company expects to be entitled in exchange for those goods or services. This ASU also requires additional disclosure about the nature, amount, timing and uncertainty of revenue and cash flows arising from customer contracts, including significant judgments and changes in judgments, and assets recognized from costs incurred to obtain or fulfill a contract. ASU No. 2014-09 allows for either full retrospective or modified retrospective adoption. In July 2015, the FASB voted to delay the effective date of this ASU by one year. The ASU will now be effective commencing with the Company’s quarter ending March 31, 2018. Early adoption of this ASU is allowed no sooner than the original effective date. The Company is currently assessing the potential impact of this ASU on its financial statements.
3. INVENTORIES
Inventories consist of the following:
|
|
|
Year Ended December 31, |
| ||||
|
|
|
2016 |
|
2015 |
| ||
|
Raw materials |
|
$ |
1,303,278 |
|
$ |
1,664,241 |
|
|
Finished goods |
|
6,309,469 |
|
5,313,779 |
| ||
|
|
|
7,612,747 |
|
6,978,020 |
| ||
|
Inventory reserve |
|
(595,523 |
) |
(681,395 |
) | ||
|
|
|
$ |
7,017,224 |
|
$ |
6,296,625 |
|
4. PROPERTY, PLANT, AND EQUIPMENT
Property, plant, and equipment consist of the following:
|
|
|
December 31, |
| ||||
|
|
|
2016 |
|
2015 |
| ||
|
|
|
|
|
|
| ||
|
Land |
|
$ |
261,893 |
|
$ |
261,893 |
|
|
Buildings and building improvements |
|
11,561,320 |
|
11,485,797 |
| ||
|
Production equipment |
|
17,762,025 |
|
15,648,515 |
| ||
|
Office furniture and equipment |
|
3,415,985 |
|
3,316,390 |
| ||
|
Construction in progress |
|
1,941,687 |
|
2,739,260 |
| ||
|
Automobiles |
|
102,321 |
|
102,321 |
| ||
|
|
|
35,045,231 |
|
33,554,176 |
| ||
|
Accumulated depreciation |
|
(22,953,194 |
) |
(22,086,115 |
) | ||
|
|
|
$ |
12,092,037 |
|
$ |
11,468,061 |
|
Depreciation expense for the years ended December 31, 2016, 2015, and 2014 was $867,080; $849,804; and $1,065,248, respectively.
5. LICENSE AGREEMENT
In 1995, the Company entered into a license agreement with the Chief Executive Officer of the Company for the exclusive right to manufacture, market, and distribute products utilizing automated retraction technology, which agreement has been amended twice. This technology is the subject of various patents and patent applications owned by such officer of the Company. The initial licensing fee of $500,000 was amortized over 17 years. The license agreement also provides for quarterly payments of a 5% royalty fee on gross sales. The royalty fee expense is recognized in the period in which it is earned. Royalty fees of $2,527,508; $2,477,583; and $2,728,701 are included in Cost of sales for the years ended December 31, 2016, 2015, and 2014, respectively. Royalties payable under this agreement aggregated $659,443 and $631,145 at December 31, 2016, and 2015, respectively. Gross sales upon which royalties are based were $50,550,165; $49,551,660; and $54,574,020 for 2016, 2015, and 2014, respectively.
6. OTHER ACCRUED LIABILITIES
Other accrued liabilities consist of the following:
|
|
|
December 31, |
| ||||
|
|
|
2016 |
|
2015 |
| ||
|
Prepayments from customers |
|
$ |
692,922 |
|
$ |
395,396 |
|
|
Accrued professional fees |
|
266,747 |
|
274,252 |
| ||
|
Other accrued expenses |
|
49,030 |
|
20,887 |
| ||
|
|
|
$ |
1,008,699 |
|
$ |
690,535 |
|
7. LONG-TERM DEBT
Long-term debt consists of the following:
|
|
|
December 31, |
| ||||
|
|
|
2016 |
|
2015 |
| ||
|
Loan from American First National Bank. It has a 20 year amortization and 10 year maturity from December 10, 2009. The loan provided funding for the expansion of the warehouse, additional office space, and a new Controlled Environment. The loan is secured by the Company’s land and buildings. The interest rate is 5.968%. |
|
$ |
3,269,397 |
|
$ |
3,426,926 |
|
|
|
|
|
|
|
| ||
|
Note payable to Deutsche Leasing USA, Inc. The interest rate is 3.69%. The original amount of the note was $276,495 with a 36 month maturity ending in July 2018. Beginning August 2015, the loan became payable in equal installments of principal and interest of approximately $8,100. Collateralized by molding machines and ancillary equipment. |
|
149,727 |
|
239,894 |
| ||
|
|
|
|
|
|
| ||
|
Note payable to Deutsche Leasing USA, Inc. The interest rate is 4.25%. The original amount of the note was $525,017 with a 36 month maturity ending in November 2019. Beginning December 2016, the loan became payable in equal installments of principal and interest of approximately $15,500. Collateralized by molding machines and ancillary equipment. |
|
509,513 |
|
— |
| ||
|
|
|
3,928,637 |
|
3,666,820 |
| ||
|
|
|
|
|
|
| ||
|
Less: current portion |
|
(430,393 |
) |
(249,349 |
) | ||
|
|
|
$ |
3,498,244 |
|
$ |
3,417,471 |
|
The fair value of long-term liabilities, based on Management’s estimates, approximates their reported values.
The aggregate maturities of long-term debt as of December 31, 2016, are as follows:
|
2017 |
|
$ |
430,393 |
|
|
2018 |
|
410,949 |
| |
|
2019 |
|
3,087,295 |
| |
|
|
|
$ |
3,928,637 |
|
8. COMMITMENTS AND CONTINGENCIES
In May 2010, the Company and an officer’s suit against Becton, Dickinson and Company (“BD”) in the U.S. District Court for the Eastern District of Texas, Marshall Division alleging violations of antitrust acts, false advertising, product disparagement, tortious interference, and unfair competition was reopened. The trial commenced on September 9, 2013, in the U.S. District Court for the Eastern District of Texas, Tyler Division, and the jury found that BD illegally engaged in anticompetitive conduct with the intent to acquire or maintain monopoly power in the safety syringe market and engaged in false advertising under the Lanham Act. The jury awarded the Company $113,508,014 in damages, which was trebled pursuant to statute. The Court granted injunctive relief to take effect January 15, 2015. In doing so, the Court found that BD’s business practices limited innovation, including false advertisements that suppressed sales of the VanishPoint®. The specific injunctive relief includes: (1) enjoining BD’s use of “World’s Sharpest Needle” or any similar assertion of superior sharpness; (2) requiring notification to all customers who purchased BD syringe products from July 2, 2004 to date that BD wrongfully claimed that its syringe needles were sharper and that its statement that it had “data on file” was false and misleading; (3) requiring notification to employees, customers, distributors, GPOs, and government agencies that the deadspace of the VanishPoint® has been within ISO standards since 2004 and that BD overstated the deadspace of the VanishPoint® to represent that it was higher than some of BD’s syringes when it was actually less, and that BD’s statement that it had “data on file” was false and misleading, and, in addition, posting this notice on its website for a period of three years; (4) enjoining BD from advertising that its syringe products save medication as
compared to VanishPoint® products for a period of three years; (5) requiring notification to all employees, customers, distributors, GPOs, and government agencies that BD’s website, cost calculator, printed materials, and oral representations alleging BD’s syringes save medication as compared to the VanishPoint® were based on false and inaccurate measurement of the VanishPoint®, and, in addition, posting this notice on its website for a period of three years; and (6) requiring the implementation of a comprehensive training program for BD employees and distributors that specifically instructs them not to use old marketing materials and not to make false representations regarding VanishPoint® syringes. Final judgment was entered on January 15, 2015, awarding the Company $340,524,042 in damages and $11,722,823 in attorneys’ fees, as well as granting injunctive relief consistent with the orders as indicated above. The parties stipulated that the amount of litigation costs recoverable by the Company is $295,000. On January 14, 2015, the District Court stayed the portion of the injunctive relief that requires BD to notify end-user customers but also ordered BD to comply with internal correction activities as well as mandatory disclosures as set out above to its employees, customers, distributors and Group Purchasing Organizations. BD filed an appeal of that ruling with the 5th Circuit Court of Appeals and that appeal was denied on February 3, 2015. On February 12, 2015, BD filed a motion to amend the judgment directed most specifically to the issue of award of prejudgment interest. On April 23, 2015, the Court entered an Amended Final Judgment that removed prejudgment interest but kept all other monetary and injunctive relief the same as was granted in the original Final Judgment. BD filed its brief in the appeal on July 20, 2015. Oral argument occurred on Monday, February 29, 2016. On December 2, 2016, the 5th Circuit Court of Appeals overturned the antitrust damages. The finding of false advertising liability was affirmed and the case was remanded to the Eastern District of Texas for a redetermination as to the amount of damages to which the Company is entitled. The Eastern District of Texas trial date is May 11, 2017. The Company’s petition for certiorari to the U.S. Supreme Court was denied on March 20, 2017.
In September 2007, BD and MDC Investment Holdings, Inc. (“MDC”) sued the Company in the United States District Court for the Eastern District of Texas, Texarkana Division, initially alleging that the Company is infringing two U.S. patents of MDC (6,179,812 and 7,090,656) that are licensed to BD. BD and MDC seek injunctive relief and unspecified damages. The Company counterclaimed for declarations of non-infringement, invalidity, and unenforceability of the asserted patents. The plaintiffs subsequently dropped allegations with regard to patent no. 7,090,656 and the Company subsequently dropped its counterclaims for unenforceability of the asserted patents. On June 30, 2015, the Court ordered that further proceedings in this matter be stayed and that this case remain administratively closed until resolution of all appeals in the case detailed in the preceding paragraph. The case remains stayed as a result of the ongoing proceedings regarding the Lanham Act claims in the separate proceeding described above.
Operating Leases
In 2010, the Company entered into a non-cancellable operating lease for additional office space. Rent expense under this lease for the years ended December 31, 2016, 2015, and 2014 was $74,772; $64,683; and $62,813, respectively. The Company renewed the lease in 2015. Future annual minimum rental payments as of December 31, 2016, are presented below:
|
2017 |
|
$ |
77,015 |
|
|
2018 |
|
79,331 |
| |
|
2019 |
|
81,694 |
| |
|
2020 |
|
84,155 |
| |
|
Total |
|
$ |
322,195 |
|
9. INCOME TAXES
The provision for income taxes consists of the following:
|
|
|
For the Years Ended December 31, |
| |||||||
|
|
|
2016 |
|
2015 |
|
2014 |
| |||
|
Current tax provision |
|
|
|
|
|
|
| |||
|
Federal |
|
$ |
— |
|
$ |
— |
|
$ |
— |
|
|
State |
|
1,132 |
|
7,877 |
|
8,177 |
| |||
|
Total current provision |
|
1,132 |
|
7,877 |
|
8,177 |
| |||
|
|
|
|
|
|
|
|
| |||
|
Deferred tax provision |
|
|
|
|
|
|
| |||
|
Federal |
|
— |
|
— |
|
— |
| |||
|
State |
|
— |
|
— |
|
— |
| |||
|
Total deferred tax provision |
|
— |
|
— |
|
— |
| |||
|
Total income tax provision |
|
$ |
1,132 |
|
$ |
7,877 |
|
$ |
8,177 |
|
The Company has $20.2 million in tax benefits attributable to net operating losses for federal tax purposes. The loss carry forwards will begin to expire in 2028 for federal tax purposes and began to expire for state tax purposes in 2013. The Company also has credits for alternative minimum taxes (“AMT”) paid of $202 thousand that are available to offset future federal income taxes, excluding AMT. Such credits do not expire.
Deferred taxes are provided for those items reported in different periods for income tax and financial reporting purposes. The tax effects of temporary differences that give rise to significant portions of the deferred tax assets and liabilities are presented below:
|
|
|
December 31, |
| ||||
|
|
|
2016 |
|
2015 |
| ||
|
Deferred tax assets |
|
|
|
|
| ||
|
Net operating loss carry forwards |
|
$ |
7,651,971 |
|
$ |
5,979,717 |
|
|
Credit for alternative minimum tax paid |
|
201,773 |
|
201,773 |
| ||
|
Accrued expenses and reserves |
|
1,348,032 |
|
1,383,461 |
| ||
|
Employee stock option expense |
|
117,613 |
|
303,465 |
| ||
|
Nonemployee stock option expense |
|
12,770 |
|
12,770 |
| ||
|
Inventory |
|
361,437 |
|
356,170 |
| ||
|
Impairment |
|
172,983 |
|
— |
| ||
|
Deferred tax assets |
|
9,866,579 |
|
8,237,356 |
| ||
|
Deferred tax liabilities |
|
|
|
|
| ||
|
Property and equipment |
|
(669,246 |
) |
(485,384 |
) | ||
|
Deferred tax liabilities |
|
(669,246 |
) |
(485,384 |
) | ||
|
Net deferred assets |
|
9,197,333 |
|
7,751,972 |
| ||
|
Valuation allowance |
|
(9,197,333 |
) |
(7,751,972 |
) | ||
|
Net deferred tax assets |
|
$ |
— |
|
$ |
— |
|
The valuation allowance increased $1,445,361 for 2016. The valuation allowance decreased $1,633,485 for 2015.
A reconciliation of income taxes based on the federal statutory rate and the effective income tax rate is summarized as follows:
|
|
|
December 31, |
| ||||
|
|
|
2016 |
|
2015 |
|
2014 |
|
|
Income tax at the federal statutory rate |
|
35.0 |
% |
35.0 |
% |
35.0 |
% |
|
State tax, net of federal tax |
|
2.9 |
|
2.9 |
|
2.9 |
|
|
Change in valuation allowance |
|
(39.1 |
) |
(37.8 |
) |
(34.3 |
) |
|
Permanent differences |
|
4.7 |
|
0.7 |
|
(0.7 |
) |
|
Other |
|
(3.5 |
) |
(0.6 |
) |
(3.2 |
) |
|
Effective tax rate |
|
0.0 |
% |
0.2 |
% |
(0.3 |
)% |
The Company files income tax returns in the U.S. federal jurisdiction and in various state and local jurisdictions. The Company’s federal income tax returns for all tax years ended on or after December 31, 2013, remain subject to examination by the Internal Revenue Service. The Company’s state and local income
tax returns are subject to examination by the respective state and local authorities over various statutes of limitations, most ranging from three to five years from the date of filing.
10. STOCK OPTION GRANTS
On September 9, 2016, the Compensation and Benefits Committee approved grants of incentive stock options to the Company’s employees under the First Amended 2008 Stock Option Plan with exercise prices at fair market value ($2.75 per share), a ten-year term, and one-year vesting period, except to the extent that such vesting period would violate the First Amended 2008 Stock Option Plan. In total, once vested, the stock options will be exercisable into 500,400 shares of Common Stock. The value of an option for the purchase of one underlying common share is valued at $1.783, using the Black Scholes Option Pricing Model using a risk-free rate of 1.51%, a volatility factor of 67.1%, and a 7.1 year expected life.
On December 27, 2016, the Compensation and Benefits Committee approved grants of stock options to the Company’s chief financial officer, general counsel, and all three independent directors for 50,000 shares each with ten-year terms under the First Amended 2008 Stock Option Plan with exercise prices at fair market value ($1.05 per share). The executive officers’ options vest in one year and the independent directors’ options vest immediately. The value of an option for the purchase of one underlying common share is valued at $0.728, using the Black Scholes Option Pricing Model using a risk-free rate of 2.37%, a volatility factor of 72.5%, and a 7.1 year expected life.
11. DIVIDENDS
The Board declared and the Company paid dividends to Series I and Series II Class B Preferred Stockholders in the amounts of $12,938 and $44,675, respectively, in each of the first two quarters of 2014. The Board declared and the Company paid dividends to Series I and Series II Class B Preferred Shareholders in the following amounts: $37,891 and $132,926, respectively, on April 30, 2015, and paid such preferred shareholders $12,313 and $44,050, respectively, on July 20, 2015 and October 22, 2015; and paid such preferred shareholders $12,313 and $43,101, respectively, on February 1, 2016. The Board declared and the Company paid dividends to Series I and Series II Class B Preferred Shareholders in the following amounts: $12,313 and $42,800, respectively, on April 21, 2016, July 28, 2016, October 20, 2016, and January 6, 2017.
12. STOCK OPTION EXERCISES
Stock options were exercised at various dates in 2016, 2015, and 2014 and, consequently, a total of 1,046,580 shares of Common Stock were issued in 2016, 272,477 shares of Common Stock were issued in 2015, and 418,195 shares of Common Stock in 2014 for an aggregate payment of $855,021 in 2016, $283,933 in 2015, and $398,328 in 2014 to exercise such options. These options were granted in 2008 and 2009 at exercise prices of $0.81 and $1.30.
13. STOCKHOLDERS’ EQUITY
Preferred Stock
The Company is authorized to issue 5,000,000 shares of Preferred Stock Class A with a par value of One Dollar ($1.00) per share; 5,000,000 shares of Preferred Stock Class B with a par value of One Dollar ($1.00) per share; and 5,000,000 shares of Preferred Stock Class C with a par value of One Dollar ($1.00) per share.
The Company has one class of Preferred Stock outstanding: Class B Convertible Preferred Stock (“Class B Stock”). The Class B Stock has five series: Series I, Series II, Series III, Series IV, and Series V.
The Class B Stock has been allocated among Series I, II, III, IV, and V in the amounts of 98,500; 171,200; 129,245; 342,500; and 40,000 shares, respectively as of December 31, 2016. The remaining 4,218,555 authorized shares have not been assigned a series.
Series I Class B Stock
There were 98,500 shares of $1 par value Series I Class B Stock outstanding at December 31, 2016 and 2015. Holders of Series I Class B Stock are entitled to receive a cumulative annual dividend of $0.50 per share, payable quarterly if declared by the Board of Directors. The Company paid dividends of $49,250; $62,516; and $38,814 in 2016, 2015, and 2014, respectively. At December 31, 2016, no dividends were in arrears.
Series I Class B Stock is redeemable after three years from the date of issuance at the option of the Company at a price of $7.50 per share, plus all unpaid dividends. Each share of Series I Class B Stock may, at the option of the stockholder, be converted to one share of Common Stock after three years from the date of issuance or in the event the Company files an initial registration statement under the Securities Act of 1933. No shares of Series I Class B Stock were converted into Common Stock in 2016 or 2015. In the event of voluntary or involuntary dissolution, liquidation, or winding up of the Company, holders of Series I Class B Stock then outstanding are entitled to $6.25 per share, plus all unpaid dividends prior to any distributions to holders of Series II Class B Stock, Series III Class B Stock, Series IV Class B Stock, Series V Class B Stock, or Common Stock.
Series II Class B Stock
There were 171,200 shares of $1 par value Series II Class B Stock outstanding at December 31, 2016 and 2015. Holders of Series II Class B Stock are entitled to receive a cumulative annual dividend of $1.00 per share, payable quarterly if declared by the Board of Directors. Holders of Series II Class B Stock generally have no voting rights until dividends are in arrears and unpaid for twelve consecutive quarters. In such case, the holders of Series II Class B Stock have the right to elect one-third of the Board of Directors of the Company. The Company paid dividends of $171,200; $221,026; and $134,025 in 2016, 2015, and 2014, respectively. At December 31, 2016, no dividends were in arrears.
Series II Class B Stock is redeemable after three years from the date of issuance at the option of the Company at a price of $15.00 per share plus all unpaid dividends. Each share of Series II Class B Stock may, at the option of the stockholder, be converted to one share of Common Stock after three years from the date of issuance or in the event the Company files an initial registration statement under the Securities Act of 1933. Pursuant to these terms, 5,000 shares of Series II Class B Stock were converted into Common Stock in 2015. No shares were converted in 2016. In the event of voluntary or involuntary dissolution, liquidation, or winding up of the Company, holders of Series II Class B Stock then outstanding are entitled to $12.50 per share, plus all unpaid dividends, after distribution obligations to holders of Series I Class B Stock have been satisfied and prior to any distributions to holders of Series III Class B Stock, Series IV Class B Stock, Series V Class B Stock, or Common Stock.
Series III Class B Stock
There were 129,245 shares of $1 par value Series III Class B Stock outstanding at December 31, 2016 and 2015. Holders of Series III Class B Stock are entitled to receive a cumulative annual dividend of $1.00 per share, payable quarterly if declared by the Board of Directors. At December 31, 2016, approximately $4,016,000 of dividends which have not been declared were in arrears.
Series III Class B Stock is redeemable after three years from the date of issuance at the option of the Company at a price of $15.00 per share, plus all unpaid dividends. Each share of Series III Class B Stock may, at the option of the stockholder, be converted to one share of Common Stock after three years from the date of issuance or in the event the Company files an initial registration statement under the Securities Act of 1933. Pursuant to these terms, 1,000 shares of Series III Class B Stock were converted into Common Stock in 2015. No shares were converted in 2016. In the event of voluntary or involuntary dissolution, liquidation, or winding up of the Company, holders of Series III Class B Stock then outstanding are entitled to $12.50 per share, plus all unpaid dividends, after distribution obligations to Series I Class B Stock and Series II Class B Stock have been satisfied and prior to any distributions to holders of Series IV Class B Stock, Series V Class B Stock, or Common Stock.
Series IV Class B Stock
There were 342,500 shares of $1 par value Series IV Class B Stock outstanding at December 31, 2016 and 2015. Holders of Series IV Class B Stock are entitled to receive a cumulative annual dividend of $1.00 per share, payable quarterly, if declared by the Board of Directors. At December 31, 2016, approximately $5,799,000 of dividends which have not been declared were in arrears.
Series IV Class B Stock is redeemable after three years from the date of issuance at the option of the Company at a price of $11.00 per share plus all unpaid dividends. Each share of Series IV Class B Stock may, at the option of the stockholder any time subsequent to three years from date of issuance, be converted into one share of Common Stock, or in the event the Company files an initial registration statement under the Securities Act of 1933. No shares of Series IV Class B Stock were converted into Common Stock in 2016 or 2015. However, the Company did enter into an agreement which had the effect of cancelling 200,000 shares in 2015. See Note 19. In the event of voluntary or involuntary liquidation, dissolution, or winding up of the Company, holders of Series IV Class B Stock then outstanding are entitled to receive liquidating distributions of $11.00 per share, unpaid dividends after distribution obligations to Series I Class B Stock, Series II Class B Stock, and Series III Class B Stock have been satisfied and prior to any distribution to holders of Series V Class B Stock or Common Stock.
Series V Class B Stock
There were 40,000 shares of $1 par value Series V Class B Stock outstanding at December 31, 2016 and 2015. Holders of Series V Class B Stock are entitled to receive a cumulative annual dividend of $0.32 per share, payable quarterly, if declared by the Board of Directors. At December 31, 2016, approximately $983,000 of dividends which have not been declared were in arrears.
Series V Class B Stock is redeemable after two years from the date of issuance at the option of the Company at a price of $4.40 per share plus all unpaid dividends. Each share of Series V Class B Stock may, at the option of the stockholder any time subsequent to the date of issuance, be converted into Common Stock. No shares of Series V Class B Stock were converted into Common Stock in 2016 or 2015. In the event of voluntary or involuntary liquidation, dissolution, or winding up of the Company, holders of Series V Class B Stock then outstanding are entitled to receive liquidating distributions of $4.40 per share, plus unpaid dividends after distribution obligations to Series I Class B Stock, Series II Class B Stock, Series III Class B Stock, and Series IV Class B Stock have been satisfied and prior to any distribution to the holders of the Common Stock.
Common stock
The Company is authorized to issue 100,000,000 shares of no par value Common Stock, of which 29,666,454 and 28,619,874 shares were outstanding at December 31, 2016, and 2015, respectively.
14. RELATED PARTY TRANSACTIONS
The Company has a license agreement with the Chief Executive Officer of the Company. See Note 5.
In 2016, the Company authorized three of its executive officers to purchase shares of Common Stock directly from the Company at market prices.
In November 2016, the Company granted a stock option to its Chief Executive Officer for the purchase of three million shares of Common Stock. Such stock option terminated by its terms before becoming exercisable in December 2016.
During 2014, the Company paid $38,693 to a family member of its Chief Executive Officer as an employee.
15. STOCK OPTIONS
Stock options
The Company has approved stock option plans for the granting of stock options to employees, Directors, and consultants. Options for the purchase of 3,649,508 shares of Common Stock have been issued under the 2008 Stock Option Plan, which, pursuant to a 2014 amendment, authorizes a total of 6,000,000 shares of Common Stock upon the exercise of stock options. Options for the purchase of 1,875,419 shares under the 2008 Stock Option Plan were outstanding as of December 31, 2016 2,350,492 shares are available for future issuance under the 2008 Stock Option Plan. A stock option for 3,000,000 shares granted to Thomas J. Shaw on November 2, 2016 terminated by its terms prior to becoming exercisable following a December 27, 2016 shareholder vote against such option.
The Compensation and Benefits Committee administers all plans and determines and/or recommends to the Board exercise prices at which options are granted. All executive compensation, including the granting of stock options, is determined by the Compensation and Benefits Committee. Shares issued upon exercise of options come from the Company’s authorized but unissued Common Stock. The options vested over periods up to three years from the date of grant and generally expire ten years after the date of grant. Unvested options issued under the 2008 Stock Option Plan expire immediately after termination of employment.
Employee options
A summary of Director, officer, and employee options granted and outstanding under the Plans is presented below:
|
|
|
Years Ended December 31, |
| |||||||||||||
|
|
|
2016 |
|
2015 |
|
2014 |
| |||||||||
|
|
|
Shares |
|
Weighted |
|
Shares |
|
Weighted |
|
Shares |
|
Weighted |
| |||
|
Outstanding at beginning of period |
|
2,125,069 |
|
$ |
0.94 |
|
2,386,736 |
|
$ |
0.95 |
|
2,820,631 |
|
$ |
0.95 |
|
|
Granted |
|
750,400 |
|
$ |
2.18 |
|
— |
|
$ |
— |
|
— |
|
$ |
— |
|
|
Exercised |
|
(1,046,580 |
) |
$ |
(0.82 |
) |
(259,977 |
) |
$ |
(1.05 |
) |
(418,195 |
) |
$ |
(0.95 |
) |
|
Forfeited |
|
(10,970 |
) |
$ |
(1.08 |
) |
(1,690 |
) |
$ |
(1.30 |
) |
(15,700 |
) |
$ |
(1.37 |
) |
|
|
|
|
|
|
|
|
|
|
|
|
|
|
| |||
|
Outstanding at end of period |
|
1,817,919 |
|
$ |
1.52 |
|
2,125,069 |
|
$ |
0.94 |
|
2,386,736 |
|
$ |
0.95 |
|
|
|
|
|
|
|
|
|
|
|
|
|
|
|
| |||
|
Exercisable at end of period |
|
1,218,519 |
|
$ |
1.06 |
|
2,125,069 |
|
$ |
0.94 |
|
2,386,736 |
|
$ |
0.95 |
|
600,400 employee options were issued in 2016. A grant of three million options to the Company’s chief executive officer terminated by its terms prior to becoming exercisable. The fair value of the September 2016 grants exercisable into 500,400 shares is $1.783 per share of underlying Common Stock and is estimated on the date of the grant using the Black Scholes pricing model with the following assumptions: expected volatility of 67.1%, risk free interest rate of 1.51%, and an expected life of 7.1 years. These options were issued under the First Amended 2008 Stock Option Plan. The fair value of the December 2016 grants exercisable into 100,000 shares is $0.728 per share of underlying Common Stock and is estimated on the date of the grant using the Black Scholes pricing model with the following assumptions: expected volatility of 72.5%, risk free interest rate of 2.37%, and an expected life of 7.1 years. These options were issued under the First Amended 2008 Stock Option Plan. No employee options were issued in 2015 or 2014.
150,000 options were issued to non-employee directors in 2016. The fair value of the 2016 grants is $0.728 per share of underlying Common Stock and is estimated on the date of the grant using the Black Scholes
pricing model with the following assumptions: expected volatility of 72.5%, risk free interest rate of 2.37%, and an expected life of 7.1 years. These options were issued under the First Amended 2008 Stock Option Plan. No options were issued to non-employee directors in 2015 or 2014.
The following table summarizes information about Director, officer, and employee options outstanding under the aforementioned plans at December 31, 2016:
|
Exercise |
|
Shares |
|
Weighted |
|
Shares |
|
|
1.30 |
|
478,416 |
|
1.88 |
|
478,416 |
|
|
1.46 |
|
50,000 |
|
6.37 |
|
50,000 |
|
|
0.81 |
|
540,103 |
|
2.54 |
|
540,103 |
|
|
1.05 |
|
250,000 |
|
9.99 |
|
150,000 |
|
|
2.75 |
|
499,400 |
|
9.70 |
|
— |
|
Non-employee options
A summary of options outstanding during the years ended December 31 and held by non-employees is as follows:
|
|
|
Years Ended December 31, |
| |||||||||||||
|
|
|
2016 |
|
2015 |
|
2014 |
| |||||||||
|
|
|
Shares |
|
Weighted |
|
Shares |
|
Weighted |
|
Shares |
|
Weighted |
| |||
|
|
|
|
|
|
|
|
|
|
|
|
|
|
| |||
|
Outstanding at beginning of period |
|
57,500 |
|
$ |
0.81 |
|
70,000 |
|
$ |
0.81 |
|
70,000 |
|
$ |
0.81 |
|
|
Granted |
|
— |
|
— |
|
— |
|
— |
|
— |
|
— |
| |||
|
Exercised |
|
— |
|
— |
|
(12,500 |
) |
(0.81 |
) |
— |
|
— |
| |||
|
Forfeited |
|
— |
|
$ |
— |
|
— |
|
— |
|
— |
|
$ |
— |
| |
|
|
|
|
|
|
|
|
|
|
|
|
|
|
| |||
|
Outstanding at end of period |
|
57,500 |
|
$ |
0.81 |
|
57,500 |
|
$ |
0.81 |
|
70,000 |
|
$ |
0.81 |
|
|
|
|
|
|
|
|
|
|
|
|
|
|
|
| |||
|
Exercisable at end of period |
|
57,500 |
|
$ |
0.81 |
|
57,500 |
|
$ |
0.81 |
|
70,000 |
|
$ |
0.81 |
|
The following table summarizes information about non-employee options outstanding under the aforementioned plans at December 31, 2016:
|
Exercise |
|
Shares |
|
Weighted Average |
|
Shares |
|
|
0.81 |
|
57,500 |
|
2.54 |
|
57,500 |
|
The Company recorded $388 thousand of stock-based compensation expense in 2016. Unrecognized stock-based compensation expense of $684,794 will be fully recognized in 2017. The Company recorded no stock-based compensation expense in 2015 or 2014. The total intrinsic value of options exercised was $1,414,892; $856,269; and $1,157,615 in 2016, 2015, and 2014, respectively. The aggregate intrinsic value of options outstanding and exercisable with exercise prices lower than market price at December 31, 2016, was $71,712.
Options Pricing Models — Assumptions
The expected life is based on the Company’s historical experience with option exercise trends. The assumptions for expected volatility is based on a calculation of volatility over the five-years preceding the grant date. Risk-free interest rates are set using grant-date U.S. Treasury yield curves. In its calculations, the Company assumed no dividends.
16. 401(k) PLAN
The Company implemented an employee savings and retirement plan (the “401(k) Plan”) in 2005 that is intended to be a tax-qualified plan covering substantially all employees. Under the terms of the 401(k) Plan, employees may elect to contribute up to 88% of their compensation, or the statutory prescribed limit, if less. The Company may, at its discretion, match employee contributions. In the first quarter of 2016, the Company reinstituted a policy of matching. For 2016, the Company matched each participant’s elective deferrals up to 2% of the participant’s compensation for the pay period. The total match for 2016 was $122,369. The Company did not match contributions in 2015 or 2014.
17. BUSINESS SEGMENTS
|
|
|
2016 |
|
2015 |
|
2014 |
| |||
|
U.S. sales |
|
$ |
26,308,246 |
|
$ |
23,029,976 |
|
$ |
27,649,974 |
|
|
North and South America sales (excluding U.S.) |
|
2,741,518 |
|
5,668,785 |
|
5,651,426 |
| |||
|
Other international sales |
|
776,872 |
|
853,439 |
|
1,219,230 |
| |||
|
Total sales |
|
$ |
29,826,636 |
|
$ |
29,552,200 |
|
$ |
34,520,630 |
|
|
|
|
|
|
|
|
|
| |||
|
Long-lived assets |
|
|
|
|
|
|
| |||
|
U.S. |
|
$ |
11,930,293 |
|
$ |
11,282,192 |
|
$ |
10,642,859 |
|
|
International |
|
$ |
161,744 |
|
$ |
185,869 |
|
$ |
209,994 |
|
The Company does not operate in separate reportable segments. The Company has minimal long-lived assets in foreign countries. Shipments to international customers generally require a prepayment either by wire transfer or an irrevocable confirmed letter of credit. The Company does extend credit to international customers on some occasions depending upon certain criteria, including, but not limited to, the credit worthiness of the customer, the stability of the country, banking restrictions, and the size of the order. All transactions are in U.S. currency.
18. TREASURY SHARES
The Board of Directors of the Company cancelled all treasury shares effective August 11, 2015.
19. PREFERRED STOCK TRANSACTION
The Company exchanged 728,000 shares of Common Stock for 200,000 shares of our Series IV Class B Convertible Preferred Stock as of November 30, 2015, pursuant to an agreement with a shareholder. Such shareholder agreed to waive all unpaid dividends in arrears associated with the tendered preferred stock, equaling $3,094,795. The fair value of the common stock issued ($2,606,240) over the carrying value of the preferred stock extinguished ($2,000,000) was $606,240. The excess of the dividend arrearage waived less the excess value of common stock issued, less the preferred dividend requirements for 2015 through the extinguishment date ($182,877) resulted in a deemed capital contribution of $2,305,678 for purposes of computing net income available to common shareholders. Future dividend requirements of $200,000 per year are avoided as a result of this transaction.
20. SUBSEQUENT EVENTS
Thomas J. Shaw purchased two million shares of Common Stock at market price from the Company on January 12, 2017 for an aggregate purchase price of $1.78 million.
In February of 2017, Mr. Cowan and Ms. Larios were each granted cash bonuses of $250,000. As of the date of this report, Mr. Cowan’s bonus has not been paid.
The Company has negotiated a reduction of its future litigation expenses and expects such expenses to be significantly less in 2017.
SELECTED QUARTERLY FINANCIAL DATA - UNAUDITED
The selected quarterly financial data for the periods ended December 31, 2015, and 2014, have been derived from the Company’s unaudited financial statements and include all adjustments, consisting only of normal recurring adjustments, necessary for a fair presentation of the results of the interim periods.
|
|
|
(In thousands, except for per share and outstanding stock amounts) |
| ||||||||||
|
|
|
2016 |
| ||||||||||
|
|
|
Quarter 1 |
|
Quarter 2 |
|
Quarter 3 |
|
Quarter 4 |
| ||||
|
Sales, net |
|
$ |
5,922 |
|
$ |
7,575 |
|
$ |
8,840 |
|
$ |
7,489 |
|
|
Cost of sales |
|
3,732 |
|
4,956 |
|
5,580 |
|
5,215 |
| ||||
|
Gross profit |
|
2,190 |
|
2,619 |
|
3,260 |
|
2,274 |
| ||||
|
Total operating expenses |
|
3,084 |
|
3,224 |
|
3,341 |
|
4,200 |
| ||||
|
Loss from operations |
|
(894 |
) |
(605 |
) |
(81 |
) |
(1,926 |
) | ||||
|
Interest and other income |
|
5 |
|
6 |
|
9 |
|
7 |
| ||||
|
Interest expense, net |
|
(49 |
) |
(57 |
) |
(52 |
) |
(55 |
) | ||||
|
Provision for income taxes |
|
1 |
|
1 |
|
1 |
|
— |
| ||||
|
Net loss |
|
(939 |
) |
(657 |
) |
(125 |
) |
(1,974 |
) | ||||
|
Preferred stock dividend requirements |
|
(176 |
) |
(176 |
) |
(176 |
) |
(176 |
) | ||||
|
Loss applicable to common shareholders |
|
$ |
(1,115 |
) |
$ |
(833 |
) |
$ |
(301 |
) |
$ |
(2,150 |
) |
|
Basic loss per share |
|
$ |
(0.04 |
) |
$ |
(0.03 |
) |
$ |
(0.01 |
) |
$ |
(0.07 |
) |
|
Diluted loss per share |
|
$ |
(0.04 |
) |
$ |
(0.03 |
) |
$ |
(0.01 |
) |
$ |
(0.07 |
) |
|
Weighted average shares outstanding - basic |
|
28,624,874 |
|
29,483,207 |
|
29,649,874 |
|
29,659,791 |
| ||||
|
Weighted average shares outstanding - diluted |
|
28,624,874 |
|
29,483,207 |
|
29,649,874 |
|
29,659,791 |
| ||||
|
Gross profit margin |
|
37.0 |
% |
34.6 |
% |
36.9 |
% |
30.4 |
% | ||||
|
|
|
(In thousands, except for per share and outstanding stock amounts) |
| ||||||||||
|
|
|
2015 |
| ||||||||||
|
|
|
Quarter 1 |
|
Quarter 2 |
|
Quarter 3 |
|
Quarter 4 |
| ||||
|
Sales, net |
|
$ |
6,179 |
|
$ |
6,715 |
|
$ |
9,483 |
|
$ |
7,175 |
|
|
Cost of sales |
|
3,781 |
|
4,114 |
|
6,259 |
|
4,833 |
| ||||
|
Gross profit |
|
2,398 |
|
2,601 |
|
3,224 |
|
2,342 |
| ||||
|
Total operating expenses |
|
3,293 |
|
3,841 |
|
3,423 |
|
3,215 |
| ||||
|
Loss from operations |
|
(895 |
) |
(1,240 |
) |
(199 |
) |
(873 |
) | ||||
|
Litigation proceeds |
|
— |
|
7,725 |
|
— |
|
— |
| ||||
|
Interest and other income |
|
7 |
|
9 |
|
5 |
|
4 |
| ||||
|
Interest expense, net |
|
(54 |
) |
(53 |
) |
(59 |
) |
(54 |
) | ||||
|
Provision for income taxes |
|
2 |
|
2 |
|
2 |
|
2 |
| ||||
|
Net income (loss) |
|
(944 |
) |
6,439 |
|
(255 |
) |
(925 |
) | ||||
|
Preferred stock dividend requirements |
|
(228 |
) |
(228 |
) |
(227 |
) |
(176 |
) | ||||
|
Deemed capital contribution on extinguishment of preferred stock |
|
— |
|
— |
|
— |
|
2,455 |
| ||||
|
Income (loss) applicable to common shareholders |
|
$ |
(1,172 |
) |
$ |
6,211 |
|
$ |
(482 |
) |
$ |
1,354 |
|
|
Basic earnings (loss) per share |
|
$ |
(0.04 |
) |
$ |
0.22 |
|
$ |
(0.02 |
) |
$ |
0.05 |
|
|
Diluted earnings (loss) per share |
|
$ |
(0.04 |
) |
$ |
0.21 |
|
$ |
(0.02 |
) |
$ |
0.05 |
|
|
Weighted average shares outstanding - basic |
|
27,663,500 |
|
27,741,052 |
|
27,873,447 |
|
28,012,374 |
| ||||
|
Weighted average shares outstanding - diluted |
|
27,663,500 |
|
29,432,468 |
|
27,873,447 |
|
29,605,874 |
| ||||
|
Gross profit margin |
|
38.8 |
% |
38.7 |
% |
34.0 |
% |
32.6 |
% | ||||
Major variances for 2016 as compared to 2015 are due to stock option expense, asset impairment, and higher administrative fees. Additionally, the cost of sales were impacted by start-up costs for EasyPoint® needle production. The 2016 increases were mitigated by the Medical Device Excise Tax being suspended, lower severance pay costs, lower professional fees, and lower bonus expense. Certain quarterly amounts may not add to the annual totals due to rounding. A non-recurring recognition of $7,724,826 received from BD in the second quarter of 2015 pursuant to a patent infringement case had a significant impact on 2015 income.
Item 9. Changes in and Disagreements with Accountants on Accounting and Financial Disclosure.
There were no reportable disagreements with accountants on accounting and financial disclosures.
Effective June 30, 2016, our previous public accounting firm, CF & Co., LLP, announced that all of its partners and staff joined Moss Adams LLP. As a result, effective June 30, 2016, CF & Co., LLP resigned as our independent registered public accounting firm and our Audit Committee engaged Moss Adams LLP to serve as our independent registered public accounting firm.
Item 9A. Controls and Procedures.
Disclosure Controls and Procedures
Pursuant to Rule 13a-15(b) under the Securities Exchange Act of 1934 (the “Exchange Act”), Management, with the participation of our President, Chairman, and Chief Executive Officer, Thomas J. Shaw (the “CEO”), and our Vice President and Chief Financial Officer, Douglas W. Cowan (the “CFO”), acting in their capacities as our principal executive and financial officers, evaluated the effectiveness of our disclosure controls and procedures, as defined in Rule 13a-15(e) under the Exchange Act. The term disclosure controls and procedures means controls and other procedures that are designed to ensure that information required to be disclosed by us in our periodic reports is: i) recorded, processed, summarized, and reported within the time periods specified in the Securities and Exchange Commission’s (the “SEC”) rules and forms; and ii) accumulated and communicated to our Management, including our principal executive and principal financial officers, as appropriate to allow timely decisions regarding required disclosure. Based upon this evaluation, the CEO and CFO concluded that, as of December 31, 2016, our disclosure controls and procedures were not effective, as discussed below.
Management’s Annual Report on Internal Control over Financial Reporting
Management is responsible for establishing and maintaining adequate internal control over our financial reporting as defined in Rule 13a-15(f) under the Exchange Act. The term internal control over financial reporting means a process designed by, or under the supervision of, our principal executive and principal financial officers and effected by our Board of Directors, Management and other personnel, to provide reasonable assurance regarding the reliability of financial reporting and the preparation of financial statements for external purposes in accordance with generally accepted accounting principles and includes those policies and procedures that: (i) pertain to the maintenance of records that in reasonable detail accurately and fairly reflect our transactions and dispositions of assets; (ii) provide reasonable assurance that our transactions are recorded as necessary to permit preparation of financial statements in accordance with generally accepted accounting principles, and that our receipts and expenditures are being made only in accordance with authorizations of Management and Directors; and (iii) provide reasonable assurance regarding prevention or timely detection of unauthorized acquisition, use, or disposition of our assets that could have a material effect on our financial statements. Management used the Internal Control - Integrated Framework issued by the Committee of Sponsoring Organizations of the Treadway Commission to evaluate the effectiveness of our internal control over financial reporting as required by paragraph (c) of Rule 13a-15 under the Exchange Act.
During the preparation of the Annual Report on Form 10-K for the year ended December 31, 2015, our auditors brought errors in the total amount of raw materials to the attention of Management. The errors resulted from an incorrect pricing of two individual inventory amounts in our detailed raw materials ledger, which is currently maintained in a spreadsheet. The errors arising from the underlying deficiency did not result in a revision to previously filed financial statements. However, in the absence of remedial efforts, this control deficiency could have resulted in future misstatements that would not be prevented or detected in a timely manner. Accordingly, Management, with the participation of our CEO and CFO, concluded that there was a material weakness in our internal control over financial reporting and that our disclosure controls and procedures and our internal control over financial reporting were not effective as of December 31, 2015.
Also reported in the Annual Report on Form 10-K for the year ended December 31, 2015 and throughout the 2016 year in quarterly reports on Form 10-Q, we are transitioning to an improved Oracle inventory accounting system to correct material weaknesses. As we are still implementing this system, we cannot state that internal
controls over financial reporting or our disclosures controls and procedures are effective yet. We expect the Oracle system to be fully operational by June 30, 2017.
Changes in Internal Control Over Financial Reporting
Except as noted above, there has been no change in our internal control over financial reporting during the fourth quarter of 2016 or subsequent to December 31, 2016, which has materially affected, or is reasonably likely to materially affect, our internal control over financial reporting.
None.
Item 10. Directors, Executive Officers and Corporate Governance.
The following table sets forth information concerning our Directors, executives, and certain of our significant employees as of the date of this report. Our Board of Directors currently consists of a total of five (5) members, two (2) members of which are Class 1 Directors and three (3) of which are Class 2 Directors which serve for two-year terms.
|
Name |
|
Age |
|
Position |
|
Term as |
|
EXECUTIVES |
|
|
|
|
|
|
|
Thomas J. Shaw |
|
66 |
|
Chairman, President, Chief Executive Officer, and Class 2 Director |
|
2018 |
|
Douglas W. Cowan |
|
73 |
|
Vice President, Chief Financial Officer, Treasurer, Principal Accounting Officer, and Class 2 Director |
|
2018 |
|
Russell B. Kuhlman |
|
63 |
|
Vice President, Sales Development |
|
N/A |
|
Michele M. Larios |
|
50 |
|
Vice President, General Counsel, and Secretary |
|
N/A |
|
|
|
|
|
|
|
|
|
INDEPENDENT DIRECTORS |
|
|
|
| ||
|
Marco Laterza |
|
69 |
|
Class 1 Director |
|
2017 |
|
Amy Mack |
|
49 |
|
Class 1 Director |
|
2017 |
|
Walter O. Bigby, Jr. |
|
52 |
|
Class 2 Director |
|
2018 |
|
|
|
|
|
|
|
|
|
SIGNIFICANT EMPLOYEES |
|
|
|
| ||
|
Kathryn M. Duesman |
|
54 |
|
Executive Director, Global Health |
|
N/A |
|
Lawrence G. Salerno |
|
56 |
|
Director of Operations |
|
N/A |
|
Shayne Blythe |
|
48 |
|
Director of Sales and Marketing Logistics |
|
N/A |
|
John W. Fort III |
|
48 |
|
Director of Accounting |
|
N/A |
|
James A. Hoover |
|
69 |
|
Director of Quality Assurance |
|
N/A |
|
R. John Maday |
|
56 |
|
Production Manager |
|
N/A |
|
Judy Ni Zhu |
|
58 |
|
Research and Development Manager |
|
N/A |
|
Patti King |
|
59 |
|
Director of National Accounts |
|
N/A |
Executives
Thomas J. Shaw, our Founder, has served as Chairman of the Board, President, Chief Executive Officer, and Director since our inception. We believe it is appropriate for Mr. Shaw to continue to serve as a Director and as the Chairman of the Board because of his deep knowledge of the strengths and weaknesses of our products (as their primary inventor) and of the Company (as its Founder). Further, his strategic knowledge of the Company and its competitive environment arising from his ongoing services as its CEO is vital to the successful supervision of the Company by the Board of Directors. Finally, Mr. Shaw’s educational background in both Engineering and
Accounting is helpful to Board deliberations. In addition to his duties overseeing our Management, he continues to lead our design team in product development of other medical safety devices that utilize, among other things, his unique patented friction ring technology. Mr. Shaw has extensive experience in industrial product design and has developed several solutions to complicated mechanical engineering challenges.
Douglas W. Cowan is a Vice President and our Chief Financial Officer, Treasurer, Principal Accounting Officer, and a Director. Mr. Cowan joined us as Chief Financial Officer and was elected to the Board of Directors in 1999. We believe it is appropriate Mr. Cowan continue to serve as a Director due to his level of involvement in the financial state of the Company (as its CFO) as well as his lead role in supervising all internal control and disclosure control procedures and statements. He also serves as the primary contact for investors which enables him to bring their concerns to the Board on appropriate topics as they arise. His expertise as a CPA and experience as the Company’s CFO allow him to guide the Board, upon request, with regard to financial matters. He is responsible for our financial, accounting, investor relations, information technology, risk management, and forecasting functions.
Russell B. Kuhlman joined us in February 1997 and is our Vice President, Sales Development. Mr. Kuhlman is responsible for development of national customers and liaison with GPOs and product training for our sales organization, as well as distribution. Mr. Kuhlman’s efforts with us have resulted in bringing onboard Specialty Distributors, influencing legislation, and educating influential healthcare representatives about the benefits of our product line. Mr. Kuhlman is respected throughout the industry and is a main contributor to the safety effort in this country.
Michele M. Larios joined us in February 1998 and currently serves as our Vice President, General Counsel, and Secretary. Ms. Larios is responsible for our legal and legislative, human resource, and regulatory functions. In addition to working on all legal matters, both internally and with outside counsel, Ms. Larios oversees work on any pertinent legislative issues and all relevant regulatory matters.
Independent Directors
Marco Laterza joined us as a Director effective as of March 22, 2005. We believe it is appropriate Mr. Laterza continue to serve as a Director because of his skills as a CPA as well as his decades of experience in advising individuals and entities with regard to corporate planning and financial issues. Such skills and experience provide a valuable contribution in his role as the designated financial expert on the Audit Committee as well as provide valuable independent accounting advice to the Board. Since 2015, Mr. Laterza has owned and operated an accounting practice and income tax consulting practice. From 1988 through 2014, Mr. Laterza owned and operated a public accounting practice. His practice included corporate, partnership and individual taxation, compilation/review of financial statements, financial planning, business consulting, and trusts and estates. Formerly, Mr. Laterza was employed in a number of positions from 1977 to 1985 with El Paso Natural Gas Company eventually serving as its Director of Accounting.
Amy Mack joined us as a Director on November 19, 2007. We believe it is appropriate that Ms. Mack continue as a Board member due both to her experience as a nurse (the primary retail user of our products) as well as her experience in running her own company. Since April of 2000, she has been the Secretary of EmergiStaff & Associates, a nursing agency, and she served as the Chief Nursing Officer of EmergiStaff & Associates from 2000 to 2010. From 2003 to 2010, she was the owner and Aesthetics Nurse Specialist for Spa O2 & Medical Aesthetics. Ms. Mack has served as an emergency room nurse in various emergency rooms throughout her career as a nurse.
Walter O. Bigby, Jr. has served on our Board of Directors since July 2012. We believe it is appropriate for Mr. Bigby to continue to serve as a Director due to his experience in owning and operating healthcare-related businesses. Mr. Bigby’s experience includes ownership of several small businesses, including hospitals, nursing homes, commercial real estate, and office equipment providers. Mr. Bigby has owned and operated Bastrop Rehabilitation Hospital, a rehabilitation hospital in Louisiana, since 2001. He is currently a minority interest owner in a nursing home in Louisiana. In 1995, Mr. Bigby sold his home health agency to Columbia HCA and remained a contract employee of the company (Hayden Health, Inc.) for three years developing other home health markets. Mr. Bigby has over a decade of experience operating healthcare businesses heavily regulated by Federal agencies and has experience with Medicare and Medicaid.
Significant Employees
Kathryn M. Duesman, RN, joined us in 1996 and currently serves as the Executive Director, Global Health. She provides clinical expertise on existing products as well as those in development. She has been instrumental in developing training and marketing materials and has spoken and been published on safety sharps issues. Ms. Duesman works with international agencies to promote the use of safe technologies in developing countries.
Lawrence G. Salerno has been employed with us since 1995 and has served as Director of Operations for us since 1998. He is responsible for the manufacture of all our products, as well as all product development and process development projects. In addition, he supervises all aspects of the construction and expansion of our facilities in Little Elm, Texas. Mr. Salerno is the brother of a 5% shareholder who ceased to be a 10% shareholder in 2008.
Shayne Blythe has been with us since 2001 and is our Director of Sales and Marketing Logistics. She is responsible for developing and implementing strategic directions, objectives, comprehensive sales and marketing plans, and programs. In addition, she directs and oversees all aspects of the distribution process and customer service policies in order to monitor and maintain customer satisfaction.
John W. Fort III is our Director of Accounting. Mr. Fort joined us in March of 2000 as a Financial Analyst and has served as our Director of Accounting since October of 2002. His primary responsibilities include managing the day-to-day operations of the Accounting and Finance Department and coordination of the annual audits, and interim reviews by our independent accountants, as well as our cost accounting and forecasting functions.
James A. Hoover joined us in February 1996 and is our Director of Quality Assurance. Prior to his becoming Director of Quality Assurance he was Production Manager. He is responsible for our quality assurance functions. Mr. Hoover has also developed and implemented FDA required procedures and has been involved in the FDA inspection process.
R. John Maday joined us in July 1999 and is our Production Manager. He is responsible for supervision of the production of our products. Prior to becoming Production Manager on January 1, 2005, he served as our Production General Supervisor. Mr. Maday has extensive manufacturing experience in both class II and III medical devices.
Judy Ni Zhu joined us in 1995 and is our Research and Development Manager. Her primary focus is on new product development and improvement of current products. Prior to joining us, Ms. Zhu worked as a design engineer with Mr. Shaw on the original 3mL syringe and other SBIR grant projects.
Patti S. King joined us in 2006 and is our Director of National Accounts. Ms. King is responsible for managing all activities with healthcare group purchasing organizations (GPOs), which includes national contracting negotiations and contract implementation. She has over 30 years of healthcare experience, including patient care in respiratory therapy and cardiopulmonary technology, clinical data research, clinical software development, sales, sales and operations management, and national account (group purchasing) business development. In 2005 and 2006, Ms. King served on our Board of Directors.
FAMILY RELATIONSHIPS
There are no family relationships among the above persons except as set forth above.
DIRECTORSHIPS IN OTHER COMPANIES
No Directors hold directorships in reporting companies.
INVOLVEMENT IN CERTAIN LEGAL PROCEEDINGS
None of the above persons or any business in which such person was an executive officer have been involved in a bankruptcy petition, been subject to a criminal proceeding (excluding traffic violations and other minor
offenses), been subject to any order enjoining or suspending their involvement in any type of business, or been party to an alleged violation of a securities law, commodities law, law or regulation respecting financial institutions or insurance companies, law or regulation prohibiting mail or wire fraud, or rules of any organization that has disciplinary authority over its members.
SECTION 16(a) BENEFICIAL OWNERSHIP REPORTING COMPLIANCE
Section 16 of the Exchange Act requires our Directors, executive officers, and persons who own more than 10% of a registered class of our equity securities to file with the SEC initial reports of beneficial ownership (Form 3) and reports of changes in beneficial ownership (Forms 4 and 5) of our Common Stock and our other equity securities. Officers, Directors, and greater than 10% shareholders are required by the SEC’s regulations to furnish us with copies of all Section 16(a) reports they file. Russell B. Kuhlman, an executive officer, filed a Form 4 five weeks late. Based on our review of the forms submitted to us during and with respect to its most recent fiscal year, all of our other executive officers filed all reports timely.
CODE OF ETHICS
Effective as of March 9, 2004, we adopted a code of ethics that applies to all employees, including, but not limited to, our principal executive and financial officers. Our Code of Business Conduct and Ethics is designed to deter wrongdoing and to promote:
1. Honest and ethical conduct, including the ethical handling of actual or apparent conflicts of interests between personal and professional relationships;
2. Full, fair, accurate, timely, and understandable disclosure in reports and documents that we file with, or submit to, the SEC and in our other public communications;
3. Compliance with applicable governmental laws, rules, and regulations;
4. The prompt, internal reporting of violations of the code to an appropriate person or persons identified in the code; and
5. Accountability for adherence to the code.
A copy of the code is incorporated herein as Exhibit No. 14. We have posted a copy of the code on our website at www.retractable.com. Please follow the link to “Investors” then click “Governance” then click “Charters,” then select “RVP Corporate Code of Conduct.” Any amendment to this code or waiver of its application to the principal executive officer, principal financial officer, principal accounting officer, or controller or similar person shall be disclosed to investors by means of a Form 8-K filing with the SEC. We will provide to any person without charge, upon request, a copy of such code of ethics. Such requests should be submitted in writing to Mr. Douglas W. Cowan at 511 Lobo Lane, P.O. Box 9, Little Elm, Texas 75068-0009.
AUDIT COMMITTEE
We have a separately-designated standing Audit Committee established in accordance with Section 3(a)(58)(A) of the Exchange Act consisting of Marco Laterza and Walter O. Bigby, Jr. Each of the members of the Audit Committee is independent as determined by the NYSE MKT rules. During 2016, the Company relied on a provision of Section 801(h) allowing the Audit Committee to consist of only two members. Section 801(h) is applicable to the Company because it is a Smaller Reporting Company.
Audit Committee Financial Expert
The Board of Directors has determined that we have at least one financial expert serving on the Audit Committee. Mr. Marco Laterza serves as our designated Audit Committee Financial Expert. Mr. Laterza is independent as defined for Audit Committee members by the listing standards of the NYSE MKT.
Item 11. Executive Compensation.
COMPENSATION DISCUSSION AND ANALYSIS
Compensation Consultant Reports
On October 13, 2016, the Company’s Compensation and Benefits Committee retained Longnecker Investment Group Inc., d/b/a Longnecker & Associates, a compensation consulting company. This engagement is the first time since 2003 that the Company has engaged such a consultant or engaged in a review of comparable compensation programs. The reason for the Company’s inactivity in the intervening years has been due to the Company’s unique market environment. Although the market conditions have not changed materially, the Company believes it owes its most loyal executive officers more competitive compensation.
The Compensation and Benefits Committee, after reviewing the factors set forth in Rule 10C-1(b)(4) under the Securities Exchange Act of 1934, determined that Longnecker & Associates was independent.
The Company’s Compensation and Benefits Committee received reports from Longnecker & Associates on the following matters in 2016:
· The competitiveness of the base salary, annual incentives, and long-term incentives paid to Mr. Shaw compared with the external market over his tenure;
· A base salary analysis and the competitiveness of base salaries, annual incentives, and long-term incentives paid to Mr. Cowan and Ms. Larios compared with the external market over their tenures and a calculation of the overall value of over/under-compensation; and
· A market competitive study of possible equity grants to certain officers and directors.
The results of the reports indicated that Mr. Shaw, Mr. Cowan, and Ms. Larios had been underpaid for the past fifteen years. In many cases, a large component of the under-compensation is the comparative size of equity grants and bonuses.
The Company initially proposed a sizable stock option grant for Mr. Shaw to compensate him for past years’ underpayments. However, following the grant of this stock option, the stock price dropped dramatically in December following the Fifth Circuit’s December 2 opinion which affirmed in part, reversed in part, and vacated and remanded the district court’s opinion in our case against BD. As such, the Company determined that it would be inappropriate to incur a stock option expense of $5.9 million relating to that option and announced a reversal of its opinion on the stock option’s approval. Consequently, the shareholders voted against the stock option, causing the option to terminate effective December 27.
One of the Longnecker & Associates reports indicated a range of appropriate annual equity grants for chief financial officers, general counsels, and independent directors. Consistent with such report, the Compensation and Benefits Committee granted stock options for the purchase of 50,000 shares of Common Stock to Mr. Cowan, Ms. Larios, and all three independent directors on December 27, 2016. The stock option expense associated with these grants was determined to be reasonable for the Company, in contrast to the stock option expense in connection with Mr. Shaw’s option grant discussed above.
Longnecker & Associates determined that Mr. Cowan’s and Ms. Larios’ base salaries are currently appropriate for their positions. However, as stated above, both officers were historically underpaid in terms of overall compensation. One report indicated that Ms. Larios’ underpayments over the last fifteen years aggregated $3.2 million. Another report indicated that Mr. Cowan’s aggregate underpayments for the same period was $1.8 million. In consideration of their loyalty, the Compensation and Benefits Committee issued to Mr. Cowan and Ms. Larios a special cash bonus of $250,000 each in February 2017. As of the date of this report, Mr. Cowan’s bonus has not yet been paid. The Longnecker & Associates reports supported an even higher bonus amount, but the Committee determined to be more conservative in its grant at this time.
For several of the reports, the benchmarking used by Longnecker & Associates was slightly different, as described below.
For the reports determining historical under-compensation for Ms. Larios and Mr. Cowan and evaluating cash bonuses, both officers’ compensation was compared to the 75th percentile of compensation data from the following published salary surveys: the 2015/2016 ERI Executive Compensation Assessor by the Economic Research Institute; the 2016 CompAnalyst Compensation Survey by Kenexa; the 2015 Top Management Compensation Survey by Towers Watson; and the 2015 General Executive Benchmark by Mercer. No individual companies were used because the report covered fifteen years of data.
These same surveys listed in the foregoing paragraph were used in the report created by Longnecker & Associates in recommending the stock option grant to Mr. Shaw, which was also evaluated using the 75th percentile. As indicated above, this stock option terminated by its terms shortly after the Board of Directors determined to recommend that the shareholders reject it.
For the report on annual long-term incentives, the following public peer companies were used in the comparisons: Cogentix Medical, Inc., BIOLASE, Inc., GenMark Diagnostics, Inc., Utah Medical Products, Inc., Allied Healthcare Products, Inc., IRadimed Corporation, Stereotaxis Inc., Bovie Medial Corporation, Misonix, Inc., CAS Medical Systems Inc., Electromed, Inc., Chembio Diagnostics, Inc., Miramar Labs, Inc., Sientra, Inc., Amedica Corporation, and ViewRay, Inc.
The Objectives of Our Compensation Plan
Our executive officer compensation program (the “Compensation Program”) is based on the belief that competitive compensation is essential to attract, retain, motivate, and reward highly qualified and industrious executive officers. Our Compensation Program is intended to accomplish the following:
· attract and retain highly talented and productive executive officers;
· provide incentives and rewards for superior performance by the executive officers; and
· align the interests of executive officers with the interests of our stockholders.
Our Compensation Program is designed to award both superior long-term performance by our executive officers and their loyalty.
Summary of Each Element of Compensation
To achieve these objectives, the Compensation and Benefits Committee has approved an executive officer compensation program that consists of four basic components:
· base salary;
· short-term incentive compensation in the form of cash bonuses;
· periodic long-term incentive compensation in the form of stock options; and
· medical, life, and benefit programs (which are generally available to all employees).
Why We Choose to Pay Each Element of Our Compensation Program
Base Salary
We choose to pay a significant component of our compensation in base salary due to the fact that our financial performance is constrained by the activities of BD. Until such time as we believe that we have access to the market, we believe that it is appropriate to weigh our Compensation Program heavily in favor of base salaries rather than incentive compensation.
Cash Bonuses
From time to time and when our cash reserves allow, we grant cash bonuses in order to reward significant efforts or the accomplishment of short term goals. The Compensation and Benefits Committee granted such bonuses in February 2017. Prior to 2017, the last bonuses were granted in 2010.
Long-Term Incentives: Stock Options
Long-term incentives are provided through grants of stock options. The grants are designed to align the interests of executive officers with those of stockholders and to provide each executive officer with a significant incentive to manage from the perspective of an owner with an equity stake in the Company.
How We Determine the Amount or Formula for Payment in Light of Our Objectives
Executive compensation remains the same until there is a review of such compensation by the Compensation and Benefits Committee. Compensation, other than that of the Chief Executive Officer, has generally not been reviewed annually. Under the terms of Mr. Shaw’s employment agreement, his compensation is reviewed annually.
Base Salary
The base salary for each of our executive officers is subjectively determined primarily on the basis of the following factors: experience, individual performance, contribution to our performance, level of responsibility, duties and functions, salary levels in effect for comparable positions within and without our industry, and internal base salary comparability considerations. However, salaries can also be affected by our long-term needs.
These base salaries are reviewed periodically and may be adjusted based upon the factors discussed in the previous paragraph, as well as upon individual performance during the previous fiscal year, changes in the duties, responsibilities and functions of the executive officer, and general changes in the compensation peer group in which we compete for executive talent. The relative weight given to each of these factors in the Compensation and Benefits Committee’s recommendation differs from individual to individual, as the Compensation and Benefits Committee deems appropriate.
A 10% reduction in executive officer salary occurred in July 2014, but the salaries were generally restored in January 2015. Executive officers were generally given a one-time payment in December 2014 to offset the 2014 reductions.
Mr. Shaw’s Employment Agreement provides that his salary is automatically increased by the percentage increase in the consumer price index (“CPI”) from the previous year. The Compensation and Benefits Committee decided to increase Mr. Shaw’s salary by the CPI percentage increase ($9,866 or 2.10%) over his 2016 salary for 2017.
Cash Bonuses
The bonuses, when paid, are paid on a discretionary basis as determined by the Compensation and Benefits Committee. Factors considered by the Compensation and Benefits Committee include personal performance, level of responsibility, and the factors used in determination of base salary as stated above, except with a greater focus on the prior fiscal year. The Compensation and Benefits Committee also considers our need to retain cash in deciding whether to grant cash bonuses.
In February of 2017, Mr. Cowan and Ms. Larios were each granted cash bonuses of $250,000.
Long-Term Incentive: Stock Options
We have issued stock options to our employees from time to time and may do so in the future. Effective September 9, 2016, we granted options for the purchase of 500,400 shares of Common Stock to our employees. Effective December 27, 2016, we granted options for the purchase of a total of 250,000 shares (50,000 shares each) to our chief financial officer, general counsel, and our three independent directors.
Generally, if stock options are to be issued, Management prepares a proposal to the Compensation and Benefits Committee. Considerations by Management in its initial proposal in determining a suitable aggregate fair market value of options to be granted include our financial condition, the number of options already outstanding, and the benefit to the non-officer employees. The proposal includes information relating to the expected expense of such grants to be recognized by us, the approximate number of options to be issued, the number of options currently outstanding, the employees to be included, the amount of stock currently outstanding, and the method under which the options would be awarded. If the recommendation is acceptable, the committee grants the options. If the committee feels changes are merited, it grants options on its own terms.
With regard to many past grants, after the aggregate number of shares underlying the options to be granted was determined, we allocated the options to our various departments using a factor based on their annual compensation times their performance rating. The individual employee’s allocation factor was the numerator of a fraction. The denominator was the department’s sum of all factors (annual compensation times performance ratings of all the eligible employees). The resulting fraction was multiplied by the stock options to be awarded to determine the employee’s individual portion of the aggregate approved options. Future grants may be based on the value of contributions to the Company and not necessarily pursuant to any formula. The allocation may be further reviewed by each department’s management if they believed certain employees were not awarded an appropriate number of options. Management would consider any suggestions.
Each stock option grant to employees allows the employee to acquire shares of Common Stock at a fixed price per share (never less than the closing stock price of the Common Stock on the date of grant or the prior trading day, as applicable) for a fixed period (usually ten years). Options granted in 2016 vested in one year for employees and vested immediately for independent directors. Accordingly, generally stock option grants will provide a return to the employee only if the employee remains employed by us during the vesting period, and then only if the market price of the underlying Common Stock appreciates. Future grants may vest over a shorter or longer period.
How Each Compensation Element and Decision Fits Into Overall Compensation Objectives
Our Compensation Program is intended to accomplish the following objectives: 1) attract and retain highly talented and productive executive officers; 2) provide incentives and rewards for superior performance by the executive officers; and 3) align the interests of executive officers with the interests of our stockholders.
We generally pay the bulk of our compensation in the form of cash compensation due to the fact that competing in a market environment in which results will not always be commensurate with performance. We believe that the performance of our executives has been outstanding. We believe this is especially true given the market environment in which we operate. Bonuses are granted occasionally to recognize extraordinary performance and/or extraordinary job requirements.
Periodically, we grant stock options with the intent to provide both an incentive and reward to executive officers for long-term performance and to align the interests of our employees with that of the shareholders.
Shareholder Advisory Votes
A majority of the votes cast in 2016 on the say-on-pay proposal were voted in favor of the proposal. The Compensation and Benefits Committee will continue to take into account the outcome of say-on-pay votes when making compensation decisions for the named executive officers. However, we have determined that it is not appropriate to continue to keep the compensation of the executive officers static in light of the fact that we have received analyses that our executive officers have been historically undercompensated.
Allocation between Long-Term/Current and Between Cash/Non-Cash Compensation
All of our long-term compensation consists of non-cash compensation in the form of stock options. We believe that the granting of stock options incentivizes executives to maximize our long-term strengths as well as our stock price. However, because our stock price has little relationship with our performance, the most significant component of compensation is base salary and not stock options. Management is incentivized to maximize shareholder value and will be rewarded if they do so.
How Determinations Are Made as to When Awards Are Granted
Generally, option awards to executive officers are granted by the Compensation and Benefits Committee and for others are granted at the discretion of the Board after recommendation of the Compensation and Benefits Committee or on the committee’s own initiative. No awards are granted if the Compensation and Benefits Committee does not support a recommendation.
Unfortunately, our stock price does not always react as expected to our achievements. Accordingly, at times, options have been granted to aid in retaining competent and experienced executives without regard to the then current stock price. However, such options always have exercise prices that are at or above fair market value on the date of grant.
In addition, there is no relationship between the date of grant of options and our possession of material non-public information (i.e., we grant options without regard to whether or not we are in possession of material non-public information). Furthermore, it is our policy with regard to options that (although the options could be exercised) the underlying shares could not be sold into the market while the executive was in possession of material non-public information. Accordingly, we believe that there is minimal risk of the executive profiting from such material nonpublic information.
What Specific Items of Corporate Performance Are Taken Into Account in Setting Compensation Policies and Making Compensation Decisions
Generally, cash reserves as well as trends in sales and costs are taken into account when considering the advisability of increasing base salaries or granting cash bonuses. However, no specific items of corporate performance are taken into account in setting executive compensation due to the fact that we compete in a market environment where significant achievement or performance is not always correlated with corporate results. At such times that any of these factors make it inadvisable to increase salaries or grant bonuses, then consideration is given to increasing option awards taking into account the value of prior option awards.
Awards are granted on the basis of historical performance. Accordingly, there is no discretion to change the awards once granted.
How Compensation Reflects Individual Performance
Executive compensation is not based on the individual’s contribution to specific, quantitative corporate objectives due to factors mentioned above regarding our market environment. However, the individual’s contribution to our performance is determined pursuant to qualitative factors as discussed above under “How We Determine the Amount or Formula for Payment in Light of Our Objectives.”
Factors We Consider in Determining to Change Compensation Materially
We consider our cash position, current liquidity trends, and the short-term and long-term needs for cash reserves when evaluating whether we can change compensation materially at a given time.
On an individual-by-individual basis, we also consider the value of past option compensation, the competitiveness of that individual’s base salary, and that individual’s contribution to our goals.
The Impact of the Accounting and Tax Treatments of Our Types of Compensation
Stock options granted to executives and other employees are expensed for accounting purposes under the Stock Compensation Topic of the Financial Accounting Standards Board Accounting Standards Codification. We expense all of our option costs as we do the costs of salaries and any periodic bonuses. Accordingly, the impact of tax treatment of various compensation forms does not impact our compensation decisions. Stock option expense is not recognized for tax purposes, except in the case of non-qualified stock options. For non-qualified stock options, the intrinsic value of the option is recognized when the option is exercised.
Our Policy Regarding Stock Ownership and Hedging
We do not have a policy regarding stock ownership by executive officers. We prohibit certain stock transactions by employees and Directors, including:
1. Purchases and sales of our stock within a six month period;
2. Short sales of our stock; and
3. Transactions in puts, calls, or other derivative securities involving our stock.
Furthermore, employees and Directors are required to pre-clear any hedging transactions.
The Role of Our Executives and Directors in Determining Compensation
Management establishes the initial recommendations regarding compensation for all employees, including themselves. The Compensation and Benefits Committee reviews executive compensation changes.
Compensation Pursuant to Employment Agreement
We have an Employment Agreement with Mr. Thomas J. Shaw (the “Employment Agreement”) which was modified effective January 1, 2008 to avoid adverse tax consequences to Mr. Shaw created by the passage of the American Jobs Creation Act of 2004. No other executives or Directors are compensated pursuant to employment agreements.
The Employment Agreement provides for an initial period of three years which ended December 31, 2010 and automatically and continuously renews for consecutive two-year periods. The Employment Agreement is terminable either by us or Mr. Shaw upon 30 days’ written notice or upon Mr. Shaw’s death.
The Employment Agreement provides for an annual salary of at least $416,400 with an annual salary increase equal to no less than the percentage increase in the CPI over the prior year. The Employment Agreement requires that Mr. Shaw’s salary be reviewed by the Compensation and Benefits Committee annually, which shall make such increases as it considers appropriate. Accordingly, the Compensation and Benefits Committee increased his 2017 salary by $9,866 (2.10%) over his 2016 salary in accordance with the percentage increase in the CPI over the prior year.
Under the Employment Agreement, we are obligated to provide certain benefits, including, but not limited to, participation in qualified pension plan and profit-sharing plans, participation in the Company’s Cafeteria Plan and other such insurance benefits provided to other executives, paid vacation, and sick leave. We are also obligated to furnish him with a cellular telephone and suitable office space as well as reimburse him for any reasonable and necessary out of pocket travel and entertainment expenses incurred by him in carrying out his duties and responsibilities, membership dues to professional organizations, and any business-related seminars and conferences.
Pursuant to the Employment Agreement, we are obligated to indemnify Mr. Shaw for all legal expenses, court costs, and all liabilities incurred in connection with any proceeding involving him by reason of his being an officer, employee, or agent of the Company. We are further obligated to pay reasonable attorney fees and expenses
and court and other costs associated with his defense in the event that, in Mr. Shaw’s sole judgment, he needs to retain counsel or otherwise expend his personal funds for his defense.
Upon his death, Mr. Shaw’s estate shall be entitled to his salary through the date of death, applicable benefits, and reimbursement of expenses.
We have the right to terminate the Employment Agreement if Mr. Shaw incurs a permanent disability during the term of his employment. A permanent disability means that Mr. Shaw is unable to engage in any substantial gainful activity by reason of any medically determinable physical or mental impairment which can be expected to result in death or can be expected to last for a continuous period of not less than 12 months or is, by reason of any medically determinable physical or mental impairment which can be expected to result in death or can be expected to last for a continuous period of not less than 12 months, receiving income replacement benefits for a period of not less than 3 months under an accident and health plan covering employees of the Company. Mr. Shaw shall also be deemed to be disabled if he is determined to be totally disabled by the Social Security Administration. In such event, Mr. Shaw is entitled to his salary through the date of termination, reimbursement of expenses, and salary for a period of 24 months as well as applicable benefits.
Mr. Shaw’s employment may be terminated for cause which is defined to be conviction of a felony which is materially detrimental to the Company, proof, as determined finally by a court of competent jurisdiction of the gross negligence or willful misconduct which is materially detrimental to the Company, or proof, as determined finally by a court of competent jurisdiction, of a breach of a fiduciary duty which is materially detrimental to the Company. In such event, he shall be entitled to his salary through the date of termination plus reimbursement of expenses.
If Mr. Shaw is terminated without cause and not at his implicit request, Mr. Shaw shall be entitled to his salary through the date of termination, reimbursement of expenses, his salary for 24 months, as well as applicable benefits.
If Mr. Shaw resigns (other than because of a change in control), he is entitled to his salary through the date of termination, reimbursement of expenses, salary for 90 days, and applicable benefits.
Mr. Shaw has the right under this agreement to resign in the event that there is a change in control. A “Change of Control” shall be deemed to have occurred on either of the following dates: (i) the date any one person (other than Mr. Shaw), or more than one person acting as a group, acquires (or has acquired during the 12-month period ending on the date of the most recent acquisition by such person or persons) ownership of stock of the Company possessing 30% or more of the total possible voting power of the stock of the Company (assuming the immediate conversion of all then outstanding convertible preferred stock) or (ii) the date a majority of members of the Board of Directors is replaced during any 12-month period by Directors whose appointment or election is not endorsed by a majority of the members of the Company’s Board of Directors before the date of the appointment or election. Mr. Shaw further has the right to resign if there is a change in ownership. A change in ownership is defined to have occurred on the date that any one person (other than Mr. Shaw) or more than one person acting as a group acquires ownership of the Company’s stock that, together with the stock previously held by such person or group, constitutes more than 50% of the total fair market value or total voting power (assuming the immediate conversion of all then outstanding convertible preferred stock) of the Company. In such event Mr. Shaw is entitled to salary through the date of termination, salary for 24 months, reimbursement of expenses, and applicable benefits.
Mr. Shaw’s commitment to the Company may not be construed as preventing him from participating in other businesses or from investing his personal assets as may require occasional or incidental time in the management, conservation, and protection of such investments provided such investments or businesses cannot be construed as being competitive or in conflict with the business of the Company.
Mr. Shaw has agreed to a one-year non-compete, not to hire or attempt to hire employees for one year, and not make known our customers or accounts or to call on or solicit our accounts or customers in the event of termination of his employment for one year unless the termination is without cause or pursuant to a change of control or ownership.
Compensation Committee Report
The Compensation and Benefits Committee has reviewed and discussed the COMPENSATION DISCUSSION AND ANALYSIS required by Item 402(b) of Regulation S-K with Management, and, based on the review and discussions referred to in paragraph (e)(5)(i)(A) of Item 407 of Regulation S-K, has recommended to the Board of Directors that the COMPENSATION DISCUSSION AND ANALYSIS be included in this report on Form 10-K.
|
|
WALTER O. BIGBY, JR. |
|
|
AMY MACK |
|
|
MARCO LATERZA |
The following Summary Compensation Table sets forth the total compensation paid or accrued by us over the past three fiscal years to or for the account of the named executive officers:
SUMMARY COMPENSATION TABLE FOR 2014-2016
|
Name and Principal Position |
|
Year |
|
Salary |
|
Option |
|
All Other |
|
Total |
|
|
Thomas J. Shaw |
|
2014 |
|
464,454 |
(1) |
— |
|
— |
|
464,454 |
|
|
President and CEO |
|
2015 |
|
484,506 |
|
— |
|
— |
|
484,506 |
|
|
(principal executive officer) |
|
2016 |
|
469,827 |
|
— |
|
1,350,000 |
(2) |
1,819,827 |
|
|
|
|
|
|
|
|
|
|
|
|
|
|
|
Michele M. Larios |
|
2014 |
|
351,346 |
(1) |
— |
|
— |
|
351,346 |
|
|
Vice President, |
|
2015 |
|
363,462 |
|
— |
|
— |
|
363,462 |
|
|
General Counsel |
|
2016 |
|
350,000 |
|
36,400 |
(3) |
— |
|
386,400 |
|
|
|
|
|
|
|
|
|
|
|
|
|
|
|
Douglas W. Cowan |
|
2014 |
|
291,115 |
(1) |
— |
|
— |
|
291,115 |
|
|
Vice President, CFO |
|
2015 |
|
301,154 |
|
— |
|
— |
|
301,154 |
|
|
(principal financial officer, principal accounting officer) |
|
2016 |
|
290,000 |
|
36,400 |
(3) |
— |
|
326,400 |
|
|
|
|
|
|
|
|
|
|
|
|
|
|
|
Russell B. Kuhlman |
|
2014 |
|
146,117 |
(1) |
— |
|
112,600 |
(5) |
258,717 |
|
|
Vice President, Sales |
|
2015 |
|
151,351 |
|
— |
|
— |
|
151,351 |
|
|
Development |
|
2016 |
|
153,522 |
|
23,357 |
(3) |
— |
|
176,879 |
|
|
|
|
|
|
|
|
|
|
|
|
|
|
|
Kathryn M. Duesman(4) |
|
2014 |
|
171,519 |
|
— |
|
— |
|
171,519 |
|
|
Executive Director, |
|
2015 |
|
178,214 |
|
— |
|
— |
|
178,214 |
|
|
Global Health |
|
2016 |
|
184,749 |
|
36,908 |
(3) |
— |
|
221,657 |
|
(1) The following amounts included in the Salary column for 2014 represent nonrecurring payments made to offset salary reductions: for Thomas J. Shaw, $23,143; for Michele M. Larios, $17,500; for Douglas W. Cowan, $14,500; and for Russell B. Kuhlman, $7,069.
(2) This amount is the result of Mr. Shaw’s gain on exercising a portion of his stock option for 1,000,000 shares of Common Stock. This gain had no effect on our financial statements. The expense related to the stock options was recognized in previous years.
(3) Assumptions for Ms. Larios and Mr. Cowan’s stock option awards include: 50,000 underlying shares each, exercise price of $1.05 per share, a ten-year term, a 7.1 year expected life, a risk-free rate of 2.37%, and a volatility factor of 72.5%. These options vest in December 2017.
Mr. Kuhlman was granted an option for 13,100 underlying shares. Ms. Duesman was granted an option for 20,700 underlying shares. Assumptions for Mr. Kuhlman’s and Ms. Duesman’s stock option awards include: exercise price of $2.75 per share, a ten-year term, a 7.1 year expected life, a risk-free rate of 1.51%, and a volatility factor of 67.16%. These options vest in September 2017.
(4) Ms. Duesman is not an executive officer, but qualifies as a “named executive officer” by virtue of Item 402(m)(2)(iii).
(5) This amount is the result of Mr. Kuhlman’s gain on exercising a portion of his stock option for 45,000 shares of Common Stock. This gain had no effect on our financial statements. The expense related to the stock options was recognized in previous years.
GRANTS OF PLAN-BASED AWARDS
The following Grants of Plan-Based Awards for 2016 table sets forth information regarding grants of awards made under any plan to each named executive officer in the last completed fiscal year.
Grants of Plan-Based Awards for 2016
|
Name |
|
Grant |
|
Estimated |
|
Exercise |
|
Grant date |
| ||
|
Thomas J. Shaw |
|
— |
|
— |
|
— |
|
— |
| ||
|
President and CEO |
|
|
|
|
|
|
|
|
| ||
|
(principal executive officer) |
|
|
|
|
|
|
|
|
| ||
|
|
|
|
|
|
|
|
|
|
| ||
|
Douglas W. Cowan |
|
12/27/2016 |
|
50,000 |
|
$ |
1.05 |
|
$ |
36,400 |
|
|
Vice President, CFO |
|
|
|
|
|
|
|
|
| ||
|
(principal financial officer) |
|
|
|
|
|
|
|
|
| ||
|
|
|
|
|
|
|
|
|
|
| ||
|
Michele M. Larios |
|
12/27/2016 |
|
50,000 |
|
$ |
1.05 |
|
$ |
36,400 |
|
|
Vice President, |
|
|
|
|
|
|
|
|
| ||
|
General Counsel |
|
|
|
|
|
|
|
|
| ||
|
|
|
|
|
|
|
|
|
|
| ||
|
Russell B. Kuhlman |
|
9/9/2016 |
|
13,100 |
|
$ |
2.75 |
|
$ |
23,357 |
|
|
Vice President, Sales |
|
|
|
|
|
|
|
|
| ||
|
|
|
|
|
|
|
|
|
|
| ||
|
Kathryn M. Duesman |
|
9/9/2016 |
|
20,700 |
|
$ |
2.75 |
|
$ |
36,908 |
|
|
Executive Director, |
|
|
|
|
|
|
|
|
| ||
|
Global Health |
|
|
|
|
|
|
|
|
| ||
(1) These options were granted under the First Amended 2008 Stock Option Plan.
Narrative Disclosure to Summary Compensation Table and Grants of Plan-Based Awards Table
Please see Compensation Pursuant to Employment Agreement above and POTENTIAL PAYMENTS UPON TERMINATION OR CHANGE IN CONTROL below for terms of our only employment agreement in effect.
Salary represents a substantial portion of the total compensation for all named executive officers. This form of payment is favored by the Company over equity awards due to the market environment in which the Company operates.
The vesting schedule for each of the officers’ option grants is one year from the date of grant. Other than continued employment, there are no performance-based conditions to the awards. All computations assume that the officer will continue employment for the requisite one-year period.
OUTSTANDING EQUITY AWARDS AT FISCAL YEAR-END
The following Outstanding Equity Awards at Fiscal Year-End Table sets forth information regarding unexercised options held by the named executive officers as of December 31, 2016.
OUTSTANDING EQUITY AWARDS AT 2016 FISCAL YEAR END
|
|
|
Option Awards |
| |||||||
|
Name |
|
Number of |
|
Number of |
|
Option |
|
Option |
| |
|
Thomas J. Shaw |
|
— |
|
— |
|
— |
|
— |
| |
|
President, CEO |
|
|
|
|
|
|
|
|
| |
|
(principal executive officer) |
|
|
|
|
|
|
|
|
| |
|
|
|
|
|
|
|
|
|
|
| |
|
Michele M. Larios |
|
— |
|
50,000 |
|
$ |
1.05 |
|
12/27/2026 |
|
|
Vice President, |
|
152,950 |
|
— |
|
$ |
0.81 |
|
07/15/2019 |
|
|
General Counsel |
|
97,050 |
|
— |
|
$ |
1.30 |
|
11/18/2018 |
|
|
|
|
|
|
|
|
|
|
|
| |
|
Douglas W. Cowan |
|
— |
|
50,000 |
|
$ |
1.05 |
|
12/27/2026 |
|
|
Vice President, CFO |
|
98,000 |
|
— |
|
$ |
0.81 |
|
07/15/2019 |
|
|
(principal financial officer, principal accounting officer) |
|
102,000 |
|
— |
|
$ |
1.30 |
|
11/18/2018 |
|
|
|
|
|
|
|
|
|
|
|
| |
|
Russell B. Kuhlman |
|
— |
|
13,100 |
|
$ |
2.75 |
|
09/09/2026 |
|
|
Vice President, Sales Development |
|
43,450 |
|
— |
|
$ |
1.30 |
|
11/18/2018 |
|
|
|
|
|
|
|
|
|
|
|
| |
|
Kathryn M. Duesman |
|
— |
|
20,700 |
|
$ |
2.75 |
|
09/09/2026 |
|
|
Executive Director, Global Health |
|
53,550 |
|
— |
|
$ |
0.81 |
|
07/15/2019 |
|
|
|
|
66,450 |
|
— |
|
$ |
1.30 |
|
11/18/2018 |
|
(1) The vesting schedule for each of the officers’ unearned option grants is one year from the date of grant (i.e., December 27, 2017 for Ms. Larios and Mr. Cowan and September 9, 2017 for Mr. Kuhlman and Ms. Duesman).
OPTION EXERCISES
The following table sets forth information concerning the exercise of stock options during the last completed fiscal year for the named executive officers.
OPTION EXERCISES FOR 2016
|
|
|
Option awards |
| |||
|
Name |
|
Number of |
|
Intrinsic |
| |
|
Thomas J. Shaw |
|
1,000,000 |
|
$ |
1,350,000 |
|
|
President, CEO |
|
|
|
|
| |
|
(principal executive officer) |
|
|
|
|
| |
Mr. Shaw exercised a stock option for the purchase of 1,000,000 shares with an exercise price of $0.81 per shares on April 5, 2016, a date on which the Company’s stock price closed at $2.16 per share.
PENSION BENEFITS
We do not have a pension plan other than the 401(k) plan which is available to all employees on the first day of the month after 90 days of service.
401(k) Plan
We implemented an employee savings and retirement plan (the “401(k) Plan”) in 2005 that is intended to be a tax-qualified plan covering substantially all employees. Under the terms of the 401(k) Plan, employees may elect to contribute up to 88% of their compensation, or the statutory prescribed limit, if less. We may, at our discretion, match employee contributions. For 2016, we matched each participant’s elective deferrals up to 2% of the participant’s compensation for the pay period. We made matching contributions of approximately $122,369 in 2016, of which $15,062 were to named executive officers. There were no matching contributions in 2015 or 2014.
POTENTIAL PAYMENTS UPON TERMINATION OR CHANGE IN CONTROL
Other than the information set forth below for Mr. Shaw, no other named executive officer has a contract in place for termination or change in control payments.
The following table identifies the types and amounts of payments that shall be made to Thomas J. Shaw, our CEO, in the event of a termination of his employment or a change in control per his Employment Agreement. Such payments shall be made by us and shall be one-time, lump sum payments except as indicated below. In 2016, no other contract existed for payments upon termination or change in control.
SUMMARY OF PAYMENTS UPON TERMINATION OR CHANGE IN CONTROL
ASSUMING OCCURRENCE AS OF DECEMBER 31, 2016(1)
|
Payment Triggering Event |
|
Salary |
|
Amounts |
|
Reimbursement |
|
Undiscounted |
|
Payment |
|
Value of |
|
|
Death |
|
x |
|
x |
|
x |
|
— |
|
— |
|
— |
|
|
|
|
|
|
|
|
|
|
|
|
|
|
|
|
|
Disability |
|
x |
|
x |
|
x |
|
939,654 |
|
— |
|
939,654 |
|
|
|
|
|
|
|
|
|
|
|
|
|
|
|
|
|
Termination With Cause |
|
x |
|
— |
|
x |
|
— |
|
— |
|
— |
|
|
|
|
|
|
|
|
|
|
|
|
|
|
|
|
|
Termination Without Cause |
|
x |
|
x |
|
x |
|
939,654 |
|
— |
|
939,654 |
|
|
|
|
|
|
|
|
|
|
|
|
|
|
|
|
|
Resignation (Other Than After a Change in Control) |
|
x |
|
x |
|
x |
|
— |
|
116,164 |
|
116,164 |
|
|
|
|
|
|
|
|
|
|
|
|
|
|
|
|
|
Resignation (After a Change in Control) |
|
x |
|
x |
|
x |
|
939,654 |
|
— |
|
939,654 |
|
(1) The above payments would be paid under Mr. Shaw’s agreement at certain times. Any payments arising as a result of disability or resignation would be paid no sooner than six months and one day from the termination date but no later than seven months from the termination date. Any payments arising as a result of death would be paid no later than the 90th day following the death. Payments arising as a result of termination with cause or termination without cause would be paid no later than the 30th day following the date of termination, except that any amount due in excess of an amount equal to the lesser of: i) two times annual compensation or ii) two times the limit on compensation under section 401(17) of the Internal Revenue Code of 1986 shall be paid no earlier than six months and one day after the date of termination but in no event later than seven months after the date of termination. Under Mr. Shaw’s agreement, Mr. Shaw has agreed to a one-year non-compete, not to hire or attempt to hire
employees for one year, and not make known our customers or accounts or to call on or solicit our accounts or customers in the event of termination of his employment for one year unless the termination is without cause or pursuant to a change of control. However, it is not clear that the above payments are conditioned on the performance of these contractual obligations.
(2) Mr. Shaw is paid every two weeks. Therefore, the maximum value for this column in the event the triggering event took place immediately prior to a scheduled payment date is two weeks’ salary ($18,070).
(3) Mr. Shaw participates in our benefit plans which do not discriminate in scope, terms, or operation in favor of executive officers. Such plans are generally available to all salaried employees. Accordingly, the value of such payments is not included in the “Value of Payments” column.
(4) This value does not include payments under our benefit plans for reasons set forth in footnote 3 above. In addition, this value assumes that the triggering event occurred on December 31, 2016. Authorized payments under the Employment Agreement are also capped to one dollar less than the amount that would cause Mr. Shaw to be the recipient of a parachute payment under Section 280G(b) of the Internal Revenue Code.
COMPENSATION OF DIRECTORS
The following table identifies the types and amounts of compensation earned by our current and former Directors (with the exception of those that are named executive officers as described in footnote 1 to the table) in the last Fiscal Year:
DIRECTOR COMPENSATION TABLE FOR 2016
|
Name(1) |
|
Fees Earned |
|
Option Awards |
|
Total |
| |||
|
Marco Laterza |
|
$ |
3,500 |
|
$ |
36,400 |
|
$ |
39,900 |
|
|
Amy Mack |
|
$ |
3,500 |
|
$ |
36,400 |
|
$ |
39,900 |
|
|
Walter O. Bigby, Jr. |
|
$ |
3,500 |
|
$ |
36,400 |
|
$ |
39,900 |
|
(1) Thomas J. Shaw and Douglas W. Cowan are named executive officers who were also Directors in 2016. Their compensation is reflected in the Summary Compensation and other tables presented earlier.
(2) On December 27, 2016, the Compensation and Benefits Committee approved grants of stock options to all three independent directors for 50,000 shares each with ten-year terms under the First Amended 2008 Stock Option Plan with exercise prices at fair market value ($1.05 per share). The options vested immediately. The value of an option for the purchase of one underlying common share is valued at $0.728, using the Black Scholes Option Pricing Model using a risk-free rate of 2.37%, a volatility factor of 72.5%, and an expected life of 7.1 years.
Narrative Explanation of Director Compensation Table for 2016
In 2016, we paid each non-employee Director a fee of $500 per meeting and reimbursed travel expenses, if airfare, hotel, and other reasonable travel-related expenses were incurred to attend Board meetings. We do not pay any additional amounts for committee participation or special assignment.
Generally, employee Directors are compensated on an at-will basis as discussed in the COMPENSATION DISCUSSION AND ANALYSIS. However, one employee, Mr. Thomas J. Shaw, our President and CEO, is compensated pursuant to an Employment Agreement. Please see “Compensation Pursuant to Employment Agreement”, set forth above for an in depth summary of the terms of such agreement.
Compensation Committee Interlocks and Insider Participation
The Compensation and Benefits Committee is currently composed of Walter O. Bigby, Jr., Amy Mack, and Marco Laterza. Each of these members of this committee is an independent Board member and none have ever been employees of the Company.
There are no interlocking Directors or executive officers between us and any other company. Accordingly, none of our executive officers or Directors served as a Director or executive officer for another entity whose executive officers or Directors served on our Board of Directors.
COMPENSATION POLICIES AND PRACTICES AS THEY RELATE TO RISK MANAGEMENT
We do not believe that risk-taking incentives are created by our compensation policies. We do not have business units. We believe that our compensation expense is a reasonable percentage of revenues overall. We have not set specific performance criteria for the award of bonuses. Salaries and bonuses, if any, are awarded based on skill, experience, and our overall revenues. Non-cash awards to employees are made periodically in the form of stock options, which we believe align the employees’ interests with those of stockholders. We review our compensation policies and practices as they relate to risk management objectives if compensation amounts are materially amended or if our risk profile changes. No changes to our compensation policies and practices have been implemented as a result of changes to our risk profile.
Item 12. Security Ownership of Certain Beneficial Owners and Management and Related Stockholder Matters.
EQUITY COMPENSATION PLAN INFORMATION
The following table sets forth information relating to our equity compensation plans as of December 31, 2016:
Equity Compensation Plan Information
|
|
|
Number of securities |
|
Weighted |
|
Number of securities |
|
|
Plan category |
|
(a) |
|
(b) |
|
(c) |
|
|
Equity compensation plans approved by security holders |
|
1,875,419 |
|
1.50 |
|
2,350,492 |
|
|
Total |
|
1,875,419 |
|
1.50 |
|
2,350,492 |
|
SECURITY OWNERSHIP OF CERTAIN BENEFICIAL OWNERS
The following table sets forth certain information regarding the beneficial ownership as of March 1, 2017, for each person known by us to own beneficially 5% or more of our Common Stock. Except pursuant to applicable community property laws, each shareholder identified in the table possesses sole voting and investment power with respect to his or her shares, except as noted below.
|
Title of Class |
|
Name and Address of Beneficial Owner |
|
Amount and |
|
Percent of |
|
|
Common Stock |
|
|
|
|
|
|
|
|
|
|
|
|
|
|
|
|
|
|
|
Thomas J. Shaw(2) |
|
16,335,642 |
|
51.6 |
% |
|
|
|
|
|
|
|
|
|
|
|
|
Suzanne M. August(3) |
|
3,800,000 |
|
12.0 |
% |
|
|
|
|
|
|
|
|
|
|
|
|
Lillian E. Salerno(4) |
|
1,646,000 |
|
5.2 |
% |
(1) The Percent of Class is calculated for the Common Stock class by dividing each beneficial owner’s Amount of Beneficial Ownership, as shown in the table above, by the sum of the total outstanding Common Stock (31,666,454 shares) plus that beneficial owner’s stock equivalents (options), if any.
(2) 2,770,000 of the shares are owned by the August 2010 Family Trust and the August Gifting Trust but are controlled by Mr. Shaw pursuant to a Voting Agreement. These shares are permanently controlled by Mr. Shaw until such time as they are sold. These shares are included in the share amounts and percentages for both Mr. Shaw and Ms. August in the above table. Mr. Shaw has investment power over 1,500,000 shares of Common Stock as Trustee pursuant to trust agreements for the benefit of family members. Ms. August has voting control over 1,000,000 of such shares as Special Trustee. These 1,000,000 shares are included in the share amounts and percentages for both Mr. Shaw and Ms. August in the above table.
(3) 2,770,000 shares of these shares are controlled by Mr. Thomas J. Shaw pursuant to a Voting Agreement and are held by the August 2010 Family Trust and August Gifting Trust, for which Ms. August serves as Trustee. These shares are included in the share amounts and percentages for both Mr. Shaw and Ms. August in the above table. Ms. August has voting control over 1,000,000 shares of Common Stock as Special Trustee pursuant to trust agreements for the benefit of family members. Mr. Shaw has investment power over such 1,000,000 shares as Trustee. These shares are included in the share amounts and percentages for both Mr. Shaw and Ms. August in the above table.
(4) 25,000 shares identified as Common Stock are shares which are obtainable by the exercise of a stock option. 500,000 shares identified as Common Stock are owned by a trust for which Ms. Salerno serves as trustee.
SECURITY OWNERSHIP OF MANAGEMENT AND DIRECTORS
The following table sets forth certain information regarding the beneficial ownership of our capital stock as of March 1, 2017, for each named executive officer specified by Item 402 of Regulation S-K (i.e., our CEO, CFO, and three other highest paid officers) and Director of the Company. Except pursuant to applicable community property laws or as otherwise discussed below, each shareholder identified in the table possesses sole voting and investment power with respect to his or her shares.
|
Title of Class |
|
Name of |
|
Amount and |
|
Percent |
|
|
Common Stock |
|
|
|
|
|
|
|
|
As a Group |
|
Named Executive Officers and Directors |
|
17,494,920 |
|
55.2 |
% |
|
As Individuals |
|
Thomas J. Shaw(2) |
|
16,335,642 |
|
51.6 |
% |
|
|
|
Michele M. Larios(3) |
|
561,000 |
|
1.8 |
% |
|
|
|
Douglas W. Cowan(4) |
|
200,000 |
|
<1 |
% |
|
|
|
Russell B. Kuhlman(5) |
|
89,450 |
|
<1 |
% |
|
|
|
Marco Laterza(6) |
|
110,000 |
|
<1 |
% |
|
|
|
Walter O. Bigby, Jr.(7) |
|
105,000 |
|
<1 |
% |
|
|
|
Amy Mack(8) |
|
93,828 |
|
<1 |
% |
(1) The Percent of Class is calculated for the individuals holding Common Stock by dividing each beneficial owner’s Amount of Beneficial Ownership, as shown in the table above, by the sum of the total outstanding Common Stock (31,666,454 shares) plus that beneficial owner’s stock equivalents (options), if any. The Percent of Class is calculated for the “As a Group” row by totaling all of the Percent of Class percentages appearing in the chart. The executive officers’ shares do not include options which do not vest until September and December of 2017.
(2) 2,770,000 of the shares are owned by the August 2010 Family Trust and the August Gifting Trust but are controlled by Mr. Shaw pursuant to a Voting Agreement. These shares are permanently controlled by Mr. Shaw until such time as they are sold. Mr. Shaw has investment power over 1,500,000 shares of Common Stock as Trustee pursuant to trust agreements for the benefit of family members.
(3) 250,000 of these shares are acquirable by the exercise of stock options. 1,000 of these shares are owned by Ms. Larios’ children. 300,000 of these shares are owned by trusts for the benefit of non-family members for which Ms. Larios serves as trustee. The chart does not reflect a grant of an option for 50,000 shares which does not vest until December 2017.
(4) These shares are acquirable by the exercise of stock options. The chart does not reflect a grant of an option for 50,000 shares which does not vest until December 2017.
(5) 43,450 of these shares are acquirable by the exercise of stock options. This does not include 13,100 shares underlying an option which becomes exercisable in September 2017.
(6) 65,000 of these shares are acquirable by the exercise of stock options.
(7) 100,000 of these shares are acquirable by the exercise of stock options.
(8) These shares are acquirable by the exercise of stock options.
There are no arrangements, the operation of which would result in a change in control of the Company, other than:
1. The 2,770,000 shares owned by the August 2010 Family Trust and August Gifting Trust shall cease to be controlled by Mr. Shaw under the Voting Agreement upon their sale to a third party for value; and
2. Mr. Shaw has voting control over 14,835,642 of the currently outstanding shares of the Common Stock (46.8%) and investment power over 13,565,642 shares (42.8%) for a total beneficial ownership of 51.6% of the currently outstanding shares of the Common Stock. Assuming the exercise of all vested options and conversion of all outstanding preferred shares, Mr. Shaw would have beneficial ownership of 48.4% of the Common Stock. This calculation does not include the potential dilution from the unvested 2016 stock option grants to employees for 600,400 shares or the two million shares authorized for private sale to insiders, including Mr. Shaw who may purchase one million additional shares directly from the Company.
Item 13. Certain Relationships and Related Transactions, and Director Independence
Related Party Transactions
We believe that all of the transactions set forth below were made on terms no less favorable to us than could have been obtained from unaffiliated third parties. In accordance with our Audit Committee Charter, the Audit Committee has reviewed and approved all related party transactions. In particular, the Audit Committee reviews all proposed transactions where the amount involved meets or exceeds $120,000.
A royalty of 5% of gross sales of all licensed products sold to customers over the life of the Technology Licensing Agreement is paid (See Item 1 — Patents, Trademarks, Licenses, and Proprietary Rights). Of this royalty, Ms. Suzanne August, the former spouse of Mr. Shaw, was entitled to $100,000 per quarter until May 11, 2015, when such royalty payments ceased being paid to Ms. August. A royalty of $2,499,210 and $2,388,817 was paid to Thomas J. Shaw in 2016 and 2015, respectively. Ms. August received $245,055 in 2015.
We also approved three of our executive officers to purchase shares directly from the Company. Thomas J. Shaw exercised a portion of such right on January 12, 2017, buying two million shares at market price for an aggregate purchase price of $1.78 million. Mr. Shaw has one million additional shares authorized for purchase at market price any time prior to September 9, 2018. Mr. Cowan and Ms. Larios are authorized to purchase 500,000 shares each at market price any time prior to September 9, 2018. The approximate dollar value of these potential future purchases cannot be predicted.
In November 2016, the Compensation and Benefits Committee granted a stock option to Mr. Shaw for the purchase of three million shares of Common Stock. Such stock option terminated by its terms before becoming exercisable in December 2016.
Director Independence
The Board of Directors has the responsibility for establishing corporate policies and for our overall performance, although it is not involved in day-to-day operations. Currently, a majority of the Directors serving on our Board of Directors are independent Directors as defined in the listing standards of the NYSE MKT. Our current independent Directors are Marco Laterza, Amy Mack, and Walter O. Bigby, Jr. Each of our committees is constituted solely by independent Directors.
Item 14. Principal Accounting Fees and Services.
AUDIT FEES
The aggregate fees billed by CF & Co., L.L.P. for professional services rendered for the audit of our annual financial statements for 2015 and the reviews of the financial statements included in our Forms 10-Q for 2015 and the first quarter of 2016 or services normally provided by the accountant in connection with statutory and regulatory filings for these periods were $30,000.
The aggregate fees billed Moss Adams LLP for professional services rendered for the audit of our annual financial statements for 2016 and the reviews of the financial statements included in our Forms 10-Q for the second and third quarters of 2016 or services normally provided by the accountant in connection with statutory and regulatory filings for these periods were $176,876.
AUDIT RELATED FEES
The aggregate fees billed by CF & Co., L.L.P. for professional services rendered for the audit of our 401(k) plan for 2015 was $13,000. Audit-related fees for Form S-8 were $1,800 in 2015.
The aggregate fees billed by Moss Adams LLP for professional services rendered for the audit of our 401(k) plan for 2016 was $14,000.
TAX FEES
The aggregate fees billed by CF & Co., L.L.P. for preparation of federal and state income tax returns and tax consulting costs related to notices from taxing authorities for 2015 was $19,325.
The aggregate fees billed by Moss Adams LLP for preparation of federal and state income tax returns and tax consulting costs related to notices from taxing authorities for 2016 was $52,980.
PRE-APPROVAL POLICIES AND PROCEDURES
The engagement of the independent accountants was entered into pursuant to the approval policies and procedures of the Audit Committee. Before any independent accountant was engaged to render services, the engagement was approved by the Audit Committee. The engagements for audit and tax services were detailed separately. The Audit Committee implemented its approval procedures, i.e., they were not delegated to any other party. All of the services provided were pre-approved by the Audit Committee.
Item 15. Exhibits, Financial Statement Schedules.
|
|
|
Balance at |
|
Additions |
|
Deductions |
|
Balance at |
| ||||
|
Provision for Inventories |
|
|
|
|
|
|
|
|
| ||||
|
Fiscal year ended 2014 |
|
$ |
681,395 |
|
$ |
— |
|
$ |
— |
|
$ |
681,395 |
|
|
Fiscal year ended 2015 |
|
$ |
681,395 |
|
$ |
— |
|
$ |
— |
|
$ |
681,395 |
|
|
Fiscal year ended 2016 |
|
$ |
681,395 |
|
$ |
176,424 |
|
$ |
262,296 |
|
$ |
595,523 |
|
|
|
|
|
|
|
|
|
|
|
| ||||
|
Provision for Accounts Receivable |
|
|
|
|
|
|
|
|
| ||||
|
Fiscal year ended 2014 |
|
$ |
1,698,506 |
|
$ |
27,300 |
|
$ |
— |
|
$ |
1,725,806 |
|
|
Fiscal year ended 2015 |
|
$ |
1,725,806 |
|
$ |
116,395 |
|
$ |
46,720 |
|
$ |
1,795,481 |
|
|
Fiscal year ended 2016 |
|
$ |
1,795,481 |
|
$ |
92,000 |
|
$ |
155,496 |
|
$ |
1,731,985 |
|
|
|
|
|
|
|
|
|
|
|
| ||||
|
Deferred Tax Valuation |
|
|
|
|
|
|
|
|
| ||||
|
Fiscal year ended 2014 |
|
$ |
8,577,666 |
|
$ |
807,790 |
|
$ |
— |
|
$ |
9,385,456 |
|
|
Fiscal year ended 2015 |
|
$ |
9,385,456 |
|
$ |
— |
|
$ |
1,633,484 |
|
$ |
7,751,972 |
|
|
Fiscal year ended 2016 |
|
$ |
7,751,972 |
|
$ |
1,445,361 |
|
$ |
— |
|
$ |
9,197,333 |
|
|
|
|
|
|
|
|
|
|
|
| ||||
|
Provision for Rebates |
|
|
|
(A) |
|
(B) |
|
(C) |
| ||||
|
Fiscal year ended 2014 |
|
$ |
26,793,666 |
|
$ |
19,115,643 |
|
$ |
12,070,529 |
|
$ |
33,838,780 |
|
|
Fiscal year ended 2015 |
|
$ |
33,838,780 |
|
$ |
19,488,956 |
|
$ |
12,155,856 |
|
$ |
41,171,880 |
|
|
Fiscal year ended 2016 |
|
$ |
41,171,880 |
|
$ |
19,693,872 |
|
$ |
21,882,467 |
|
$ |
38,983,285 |
|
(A) Represents estimated rebates deducted from gross revenues
(B) Represents rebates credited to the distributor and charge offs against the allowance
(C) Includes $3,591,534; $3,733,199; and $4,160,099 in Accounts payable for 2016, 2015, and 2014, respectively.
(3) Exhibits:
The following exhibits are filed herewith or incorporated herein by reference to exhibits previously filed with the SEC.
(b) Exhibits
|
Exhibit |
|
Description of Document |
|
3(i) |
|
Restated Certificate of Formation with Certificates of Designation, Preferences, Rights and Limitations of Class B Preferred Stock (all Series)* |
|
|
|
|
|
3(ii) |
|
Fourth Amended and Restated Bylaws of RTI** |
|
|
|
|
|
4 |
|
Restated Certificate of Formation with Certificates of Designation, Preferences, Rights and Limitations of Class B Preferred Stock (all Series)* |
|
|
|
|
|
10.1 |
|
Sample United States Distribution Agreement*** |
|
|
|
|
|
10.2 |
|
Sample Foreign Distribution Agreement*** |
|
|
|
|
|
10.3 |
|
Employment Agreement between RTI and Thomas J. Shaw dated as of January 1, 2008 (This is a management compensation contract.)**** |
|
|
|
|
|
10.4 |
|
Technology License Agreement between Thomas J. Shaw and RTI dated the 23rd day of June 1995*** |
|
|
|
|
|
10.5 |
|
First Amendment to Technology License Agreement between Thomas J. Shaw and RTI dated the 3rd day of July, 2008***** |
|
|
|
|
|
10.6 |
|
Second Amendment to Technology License Agreement between Thomas J. Shaw and Retractable Technologies, Inc. dated as of the 7th day of September, 2012† |
|
|
|
|
|
10.7 |
|
Retractable Technologies, Inc. First Amended 2008 Stock Option Plan†† |
|
|
|
|
|
10.8 |
|
Thomas J. Shaw Nonqualified Stock Option Agreement Issued Outside of Any Plan◦ |
|
|
|
|
|
10.9 |
|
Voting Agreement Between Thomas J. Shaw and Suzanne August dated November 8, 2006◦◦ |
|
|
|
|
|
10.10 |
|
Purchase Agreement dated as of January 12, 2017, by and between Retractable Technologies, Inc. and Thomas J. Shaw††† |
|
|
|
|
|
14 |
|
Retractable Technologies, Inc. Code of Business Conduct and Ethics◦◦◦ |
|
|
|
|
|
23 |
|
Consent of Independent Registered Public Accounting Firm◦◦◦◦ |
|
|
|
|
|
31.1 |
|
Certification of Principal Executive Officer◦◦◦◦ |
|
|
|
|
|
31.2 |
|
Certification of Principal Financial Officer◦◦◦◦ |
|
|
|
|
|
32 |
|
Section 1350 Certifications◦◦◦◦ |
|
Exhibit |
|
Description of Document |
|
101 |
|
The following materials from this report, formatted in XBRL (eXtensible Business Reporting Language): (i) Balance Sheets as of December 31, 2016, and 2015, (ii) the Statements of Operations for the years ended December 31, 2016, 2015, and 2014, (iii) the Statements of Changes in Stockholders’ Equity for the years ended December 31, 2016, 2015, and 2014, (iv) the Statements of Cash Flows for the years ended December 31, 2016, 2015, and 2014, and (v) Notes to Financial Statements.◦◦◦◦ |
|
* |
|
Incorporated herein by reference to RTI’s Form 10-Q filed on November 15, 2010 |
|
|
|
|
|
** |
|
Incorporated herein by reference to RTI’s Form 8-K filed on May 13, 2010 |
|
|
|
|
|
*** |
|
Incorporated herein by reference to RTI’s Registration Statement on Form 10-SB filed on June 23, 2000 |
|
|
|
|
|
**** |
|
Incorporated herein by reference to RTI’s Form 10-Q filed on November 14, 2008 |
|
|
|
|
|
***** |
|
Incorporated herein by reference to RTI’s Form 10-K filed on March 31, 2009 |
|
|
|
|
|
† |
|
Incorporated herein by reference to RTI’s Form 10-Q filed on November 14, 2012 |
|
|
|
|
|
†† |
|
Incorporated herein by reference to RTI’s Form 10-Q filed on November 14, 2014 |
|
|
|
|
|
††† |
|
Incorporated herein by reference to RTI’s Form 8-K filed on January 13, 2017 |
|
|
|
|
|
◦ |
|
Incorporated herein by reference to RTI’s Form 10-K filed on March 31, 2010 |
|
|
|
|
|
◦◦ |
|
Incorporated herein by reference to RTI’s Schedule TO filed on October 17, 2008 |
|
|
|
|
|
◦◦◦ |
|
Incorporated herein by reference to RTI’s Form 8-K filed on February 19, 2010 |
|
|
|
|
|
◦◦◦◦ |
|
Filed herewith |
|
|
|
|
|
(c) |
|
Excluded Financial Statement Schedules: None |
Pursuant to the requirements of Section 13 or 15(d) of the Securities Exchange Act of 1934, the registrant has duly caused this report to be signed on its behalf by the undersigned, thereunto duly authorized.
|
|
|
|
RETRACTABLE TECHNOLOGIES, INC. |
|
|
|
|
(Registrant) |
|
|
|
|
|
|
|
|
|
|
|
|
|
By: |
/s/ Thomas J. Shaw |
|
|
|
|
THOMAS J. SHAW |
|
|
|
|
CHAIRMAN, PRESIDENT, AND |
|
|
|
|
CHIEF EXECUTIVE OFFICER |
|
|
|
|
|
|
|
|
Date: |
March 31, 2017 |
Pursuant to the requirements of the Securities Exchange Act of 1934, this report has been signed below by the following persons on behalf of the registrant and in the capacities and on the dates indicated.
|
|
|
|
|
/s/ Douglas W. Cowan |
|
|
DOUGLAS W. COWAN |
|
|
VICE PRESIDENT, CHIEF FINANCIAL OFFICER, PRINCIPAL ACCOUNTING OFFICER, TREASURER, AND DIRECTOR |
|
|
|
|
|
March 31, 2017 |
|
|
|
|
|
/s/ Amy Mack |
|
|
AMY MACK |
|
|
DIRECTOR |
|
|
|
|
|
March 31, 2017 |
|
|
|
|
|
/s/ Marco Laterza |
|
|
MARCO LATERZA |
|
|
DIRECTOR |
|
|
|
|
|
March 31, 2017 |
|
|
|
|
|
/s/ Walter O. Bigby, Jr. |
|
|
WALTER O. BIGBY, JR. |
|
|
DIRECTOR |
|
|
|
|
|
March 31, 2017 |