Attached files
| file | filename |
|---|---|
| EX-21.1 - SUBSIDIARIES OF QUMU CORPORATION - Qumu Corp | qumuexhibit21112312016.htm |
| EX-32 - CERTIFICATION OF CEO / CFO PURSUANT TO SECTION 906 - Qumu Corp | qumuexhibit3212312016.htm |
| EX-31.2 - CERTIFICATION OF CFO PURSUANT TO SECTION 302 - Qumu Corp | qumuexhibit31212312016.htm |
| EX-31.1 - CERTIFICATION OF CEO PURSUANT TO SECTION 302 - Qumu Corp | qumuexhibit31112312016.htm |
| EX-23.1 - CONSENT OF KPMG LLP - Qumu Corp | qumuexhibit23112312016.htm |
| EX-10.13 - AMENDMENT TO TERM LOAN CREDIT AGREEMENT - Qumu Corp | qumuexhibit101312312016.htm |
FORM 10-K
U.S. SECURITIES AND EXCHANGE COMMISSION
WASHINGTON, DC 20549
x ANNUAL REPORT PURSUANT TO SECTION 13 OR 15(D) OF THE
SECURITIES EXCHANGE ACT OF 1934
FOR THE FISCAL YEAR ENDED December 31, 2016
OR
o TRANSITION REPORT PURSUANT TO SECTION 13 OR 15(D) OF THE
SECURITIES EXCHANGE ACT OF 1934
COMMISSION FILE NO. 000-20728
QUMU CORPORATION
(Exact name of registrant as specified in its charter)
Minnesota | 41-1577970 | |
State or other jurisdiction of incorporation or organization | (I.R.S. Employer Identification No.) | |
510 1st Avenue North, Suite 305, Minneapolis, MN 55403 | ||
(Address of principal executive offices) | ||
(612) 638 - 9100 | ||
(Registrant's telephone number, including area code) | ||
Securities registered pursuant to Section 12(b) of the Act: | Common Stock, $.01 par value | |
Preferred Stock Purchase Rights | ||
Securities registered pursuant to Section 12(g) of the Act: | None | |
Indicate by checkmark if the registrant is a well-known seasoned issuer, as defined in Rule 405 of the Securities Act. Yes o No x
Indicate by checkmark if the registrant is not required to file reports pursuant to Section 13 or Section 15(d) of the Act. Yes o No x
Indicate by checkmark whether the registrant (1) has filed all reports required to be filed by Section 13 or 15 (d) of the Securities Exchange Act of 1934 during the preceding 12 months (or for such shorter period that the Registrant was required to file such reports), and (2) has been subject to such filing requirements for the past 90 days. Yes x No o
Indicate by check mark whether the registrant has submitted electronically and posted on its corporate Web site, if any, every Interactive Data File required to be submitted and posted pursuant to Rule 405 of Regulation S-T during the preceding 12 months (or for such shorter period that the registrant was required to submit and post such files). Yes x No o
Indicate by checkmark if disclosure of delinquent filers pursuant to Item 405 of Regulation S-K is not contained herein, and will not be contained, to the best of registrant’s knowledge, in definitive proxy or information statements incorporated by reference in Part III of this Form 10-K or any amendment to this Form 10-K. o
Indicate by checkmark whether the registrant is a large accelerated filer, an accelerated filer, a non-accelerated filer or a smaller reporting company.
Large Accelerated Filer o Accelerated Filer o Non-Accelerated Filer o Smaller Reporting Company x
Indicate by checkmark whether the registrant is a shell company (as defined in Rule 12b-2 of the Exchange Act): Yes o No x
The aggregate market value of common stock held by non-affiliates of the registrant, computed by reference to the last quoted price at which such stock was sold on such date as reported by the Nasdaq Stock Market as of the last business day of the registrant’s most recently completed second fiscal quarter was approximately $37,187,000.
As of March 24, 2017, the registrant had 9,221,614 outstanding shares of common stock.
DOCUMENTS INCORPORATED BY REFERENCE
Portions of the registrant’s definitive proxy statement for its 2017 Annual Meeting of Shareholders, to be filed within 120 days after the end of the fiscal year covered by this report, are incorporated by reference into Part III hereof.
1
TABLE OF CONTENTS
Page | ||
2
General Information
PART I
Cautionary Note Regarding Forward-Looking Statements
We make statements from time to time regarding our business and prospects, such as projections of future performance, statements of management's plans and objectives, forecasts of market trends, and other matters that are forward-looking statements within the meaning of Section 27A of the Securities Act of 1933 and Section 21E of the Securities Exchange Act of 1934. Statements containing the words or phrases “will likely result,” “are expected to,” “will continue,” “is anticipated,” “estimates,” “projects,” “believes,” “expects,” “anticipates,” “intends,” “target,” “goal,” “plans,” “objective,” “should” or similar expressions identify forward-looking statements. Forward-looking statements may appear in documents, reports, filings with the Securities and Exchange Commission (SEC), news releases, written or oral presentations made by our authorized officers or other representatives. For such statements, we claim the protection of the safe harbor for forward-looking statements contained in the Private Securities Litigation Reform Act of 1995.
Our future results, including results expressed in or implied by forward-looking statements, involve a number of risks and uncertainties. Forward-looking statements are not guarantees of future actions, outcomes, results or performance. Any forward-looking statement made by us or on our behalf speaks only as of the date on which such statement is made. We do not undertake any obligation to update or keep current any forward-looking statement to reflect events or circumstances arising after the date of such statement.
In addition to the factors identified or described by us from time to time in filings with the SEC, there are many important factors that could cause our future results to differ materially from historical results or trends, results anticipated or planned by us, or the results expressed in or implied by any forward-looking statements. These important factors are described below under Item 1A. Risk Factors.
ITEM 1. BUSINESS
Overview
Qumu Corporation ("Qumu" or the "Company") provides the software applications businesses use to create, manage, secure, deliver and measure the success of their videos. The Company's innovative solutions release the power in video to engage and empower employees, partners and clients, allowing organizations around the world to realize the greatest possible value from video they create and publish. Whatever the audience size, viewer device or network configuration, the Company's solutions are how business does video. Qumu markets its products to customers primarily in North America, Europe and Asia.
Qumu generates revenue through the sale of enterprise video content management software solutions, hardware, maintenance and support, and professional and other services. Software sales may take the form of a perpetual software license, a term software license or a cloud-hosted software as a service (SaaS). Software licenses and appliances revenue includes sales of perpetual software licenses and hardware. Service revenue includes term software licenses, SaaS, maintenance and support, and professional and other services. An individual sale can range from single year agreements for thousands of dollars to multi-year agreements for over a million dollars.
Year Ended December 31, | Increase (Decrease) | Percent Increase (Decrease) | |||||||||||||||||||||||
2016 | 2015 | 2014 | 2015 to 2016 | 2014 to 2015 | 2015 to 2016 | 2014 to 2015 | |||||||||||||||||||
Software licenses and appliances | $ | 5,839 | $ | 9,456 | $ | 11,363 | $ | (3,617 | ) | $ | (1,907 | ) | (38 | )% | (17 | )% | |||||||||
Service | 25,843 | 24,998 | 15,158 | 845 | 9,840 | 3 | % | 65 | % | ||||||||||||||||
Total revenues | $ | 31,682 | $ | 34,454 | $ | 26,521 | $ | (2,772 | ) | $ | 7,933 | (8 | )% | 30 | % | ||||||||||
History
The Company was founded in 1978, incorporated as IXI, Inc. in Minnesota in February 1987 and changed its name to Rimage Corporation in April 1988. From 1995 to 2011, the Company focused its business on the development and sale of its CD recordable publishing systems and DVD recordable publishing systems.
In response to declines in the disc publishing business due to technology substitutions and the rise of video as a communication and collaboration platform, in October 2011, the Company acquired Qumu, Inc., a leader in the enterprise video content management software market, and changed its name to Qumu Corporation in September 2013. Qumu completed the transition to an enterprise video content management software company in July 2014, when the Company closed on the sale of its disc publishing assets to Equus Holdings, Inc. and Redwood Acquisition, Inc. (now known as Rimage Corporation).
3
On October 3, 2014, the Company acquired Kulu Valley Ltd., a private limited company incorporated and operating in England and Wales, subsequently renamed Qumu Ltd (“Kulu Valley”). The acquisition was made to expand Qumu’s addressable market through the offering of Kulu Valley’s best-in-class video content creation capabilities and easy-to-deploy pure cloud solution, while providing customers with access to industry-leading video content management and delivery capability.
Enterprise Video Content Management and Delivery Software
To increase communication, engagement and collaboration between employees and stakeholders, organizations have and continue to be invested significantly in content and network infrastructure that connects these employees and stakeholders across offices, conference rooms, computers, tablets and smart phones. As part of this, enterprises are adopting video as a mainstream communication and collaboration tool because they understand its benefits over other mediums.
Qumu video content management software solutions allow organizations to create, capture, organize and deliver content across the extended enterprise to a wide variety of end points, including mobile devices and thin clients. Qumu's video platform supports both live and on-demand streaming, and also secure download capabilities, a critical component for enterprise delivery. Qumu provides information technology administrators and corporate communication leaders a way to securely address the challenges of video that might otherwise overwhelm their data networks while utilizing their existing information technology infrastructures, thereby maximizing their investment and enabling the rapid adoption of video in their content, collaboration, communication and marketing infrastructures.
Qumu provides an end-to-end solution with an intuitive and rich user experience to create, manage and deliver live and on-demand video content both behind and beyond the secure firewall.
Capabilities and Products
Qumu Platform - Creating a Global Video Infrastructure for Organizations
The Qumu platform is a video content management software solution that can be deployed as a perpetual software license, a term software license or a cloud-hosted software as a service (SaaS). Qumu’s implementations can range in size from tens of thousands to millions of dollars, and they integrate with customers' existing video services (e.g., videoconferencing systems), business applications and broader IT infrastructures using Qumu's extensive application services or "APIs." Deployments also range from a single customer location to a global infrastructure serving over one hundred thousand corporate employees. Qumu’s platform solution components are deployed as needed to serve different capabilities of the enterprise video content lifecycle of creating, capturing, managing, delivering and experiencing video content.
Video Capture
• | Qumu Capture Studio is a portable software-enabled device that quickly and easily records, edits, and publishes video and presentation content. |
• | Qumu Quick Capture is a browser-based applet for the simple creation of videos captured from a user's computer screen and/or webcam. |
• | Qumu's encoder control facilitates live encoding and can leverage popular encoders from multiple vendors. |
• | Qumu also integrates with videoconferencing systems or Unified Communication software to enable their use as “studios” for the creation of live or on-demand video content. |
• | Qumu’s Creator provides ease of use for anyone to create slides and video at the desktop to produce their own rich content. |
Video Management
Qumu’s platform is an enterprise scalable solution that provides central control for all video applications, content and resources involved in the production and delivery of enterprise video. Video Control Center manages both live streamed video and video on-demand workflows. This comprehensive business video platform includes numerous industry-leading features:
• | Patent pending Qumu Pathfinder technology for intelligent routing to multiple device types with different bitrates, enabling more efficient use of the network and improved user experience. |
• | Qumu Speech Search for searching and indexing the spoken dialogue within video programs, greatly reducing time-to-knowledge. |
• | Live Broadcast Console for managing and deploying live streamed videos across an organization. |
• | Broad and deep security capabilities encompassing single-sign-on ("SSO"), Active Directory/LDAP integration, and Security Assertion Markup Language ("SAML") that make it easy to create a secure video application and network based on the enterprise's existing security standards. |
4
Video Delivery
• | The combination of Pathfinder with Qumu’s VideoNet Edge software creates a unique, highly secure, fault tolerant video delivery network with advanced streaming and caching features to provide outstanding performance for an unlimited number of users. By ensuring that only one stream crosses the WAN on its way to viewers in remote locations, VideoNet Edge minimizes the strain placed on the network by live webcasting or video on demand. VideoNet Edge can work as the sole distribution platform for video or in conjunction with other enterprise or Internet-based content distribution networks (“CDNs”). Qumu VideoNet Edge provides caching of H.264/MPEG-4, Windows Media & Flash video, Video on Demand and live broadcast content, reducing traffic from the centrally-located origin server. Importantly, Qumu offers VideoNet Edge software in a variety of form factors (Windows Software, virtual machine, appliance, and integrated with Citrix CloudBridge and Riverbed VSP) to provide customers with the most deployment options. |
• | Qumu VideoNet Edge software solutions can federate existing CDNs into a single system for intranet and Internet content distribution of video and related media assets. The federation capability includes Internet-based CDNs like Akamai and Amazon CloudFront as well as intranet-based devices like Riverbed Steelhead, Cisco ACNS/WaaS/CDS, and Blue Coat Director. This federation capability allows customers and partners to execute an “embrace and replace” strategy for upgrading their networks as opposed to “rip and replace” from other vendors. |
• | Qumu Secure Download allows video to be securely delivered to mobile devices, viewed offline, and managed/disposed automatically based on prescribed policies. |
Mobility and Integration
• | Qumu provides Mobile Apps for iOS, Android and Windows phones and tablets. The apps are complete out-of-the-box native video applications built using the Qumu Mobile SDKs. Customers can also work with Qumu Professional Services to create fully branded applications accessing Qumu's video infrastructure. Qumu’s HTML5-based video portal also provides native support for all device platforms. |
• | Qumu provides integration between its mobile apps and leading mobile device management/mobile application management ("MDM/MAM") platforms such as Good Technology and XenMobile to ensure that Qumu's solutions work within the environments its customers are investing in for mobile security. |
• | Qumu integrates with a variety of key business applications and infrastructure capabilities to enable organizations to employ video in any work context required. Qumu offers integration with Microsoft SharePoint and Lync as well as with Office365; IBM Connections and IBM WebSphere; Jive and other collaborative and social platforms. Qumu continues to work with partners and integrators to extend video functionality through the use of its REST APIs. Qumu also integrates with Citrix capabilities such as XenApp and XenDesktop, enabling Qumu video to be delivered to thick or thin clients managed within a Citrix virtual desktop infrastructure. |
Externalizing Video for Maximum Reach and Impact
The Qumu platform in a cloud deployment allows SaaS enabled customers to easily create video and rich media presentations and deliver video seamlessly to customers, partners, and employees. Cloud deployments allow organizations worldwide to rapidly and clearly present their messages and drive business opportunities through the integration of video with their web sites and their marketing and campaign automation platforms.
The Qumu platform in a cloud delivery brings the power of Qumu video to organizations that do not wish to make infrastructure investments to own and support their applications. Instead, Qumu provides the following capabilities that are easily purchased, implemented, and available through the web browser:
• | Create rich media with the Qumu platform in minutes - Qumu's customers can capture video and easily integrate it with PowerPoint slides to ensure that messages are delivered and understood; provide high quality sales enablement on a regular basis from the desktop; and broadcast news about products and services to partners and customers every week. |
• | Embed and share Qumu content easily with nearly any application - video “widgets” can be embedded, played, and tracked within any external application, ranging from web sites, to email offers, to campaigns managed and executed by platforms like Eloqua and Salesforce.com. Analytics on origin and viewership are easily captured and integrated back for targeted marketing and sales. |
• | Quickly create and deliver video for both live and on-demand - organizations purchase Qumu's cloud platform to support a variety of live broadcasts and on-demand scenarios, and the platform enables both to be executed and managed easily whenever desired. Video and content created and captured is managed within the cloud platform resident on IBM SoftLayer, thus providing market-leading security and compliance for users. |
5
• | Support an unlimited number of users - Qumu's cloud platform scales easily with a customer's needs, enabling organizations to create rich video presentations for 100's or to drive high performance video marketing campaigns to many thousands. Video is also transcoded automatically to support any user, format, or device for viewing. |
Marketing and Distribution
Qumu’s solutions serve a growing customer base of large enterprises across a wide range of vertical and horizontal markets. Qumu has primarily targeted enterprises with 10,000+ employees and a history of video use for corporate communications. Qumu's customers are some the largest corporations worldwide. Beginning in 2014, Qumu increased its efforts and ability in targeting mid-size businesses with less than 10,000 employees by promoting the new cloud deployment model.
Qumu serves its customer base primarily via direct sales, and to a lesser extent via channel partners, offering a variety of deployment methodologies and business models to meet customer demand including software, software on server appliance, software-enabled devices, SaaS and managed services.
In 2016, Qumu was selected as a leader by multiple industry reports:
• | Gartner’s Critical Capabilities reports focus on a group of competing products or services based on a set of use cases that match typical client deployment scenarios. These use cases are based on the real-world problems that clients need to solve, as well as how they intend to use the technology or service within their enterprises. Qumu received the highest scores for video content management. |
• | Aragon Research named Qumu a leader in its Video Content Management report. |
• | Wainhouse Research positioned Qumu as the leader in Enterprise Streaming Market. |
These selections are visible proof points in the market that had a positive impact on Qumu’s market awareness and lead generation activities.
Qumu sells products and services internationally through its U.S. operation and its subsidiaries in the United Kingdom and Japan. International sales comprised approximately 27%, 27% and 15% of revenues for the years ended December 31, 2016, 2015 and 2014, respectively. During the years ended December 31, 2016 and 2015, the Company had one customer that accounted for more than 10% of its revenues; no customer accounted for more than 10% of revenues for the year ended December 31, 2014.
Competition
Major competitors of Qumu include Kaltura, Kontiki, Cisco, Polycom, vBrick, Brightcove and MediaPlatform. Due to Qumu's unique end to end solution for a complete video infrastructure that includes support for mobile devices and existing IT infrastructure, Qumu believes it is able to compete effectively with these competitors. Qumu also differentiates itself from its competitors through its video delivery technology and flexibility as to solution deployment and service options.
Research and Development
Qumu develops its software internally and licenses or purchases software from third parties. Research and development expense was $8.5 million, $10.7 million and $9.5 million for the years ended December 31, 2016, 2015 and 2014, respectively.
As of December 31, 2016, the Company employed 61 employees in research and development. This staff engages in research and development of new products and enhancements to existing products. In addition, Qumu partners with third parties to utilize their competencies in creating products to enhance its product offerings.
Backlog of Contracted Commitments
The Company's contracted commitment backlog was $22.9 million at December 31, 2016, compared to $33.4 million at December 31, 2015. The Company defines contracted commitments as the dollar value of signed non-cancellable customer purchase commitments. Of the total at December 31, 2016, the Company expects to recognize between $16.0 million and $17.0 million as revenue during the year ended December 31, 2017. Actual amounts could differ depending on timing of customer deployments and other factors.
Intellectual Property
Qumu currently maintains three U.S. patents and has two non-provisional utility patent applications pending in the U.S. Further, Qumu protects the proprietary nature of its software primarily through copyright and license agreements. It is Qumu's policy to protect the proprietary nature of its newly developed products whenever they are likely to become significant sources
6
of revenue. No assurance can be given that Qumu will be able to obtain patent or other protection for its products. In addition, Qumu has registered and may in the future register trademarks and other marks used in its business.
Qumu also licenses or purchases the intellectual property ownership rights of programs developed by others with license or technology transfer agreements that may obligate Qumu to pay a flat license fee or royalties, typically based on a dollar amount per unit shipped or a percentage of the revenue generated by those programs. Contractual obligations with respect to such licenses will require cash payments of $301,000 in 2017.
As the number of Qumu's products increases and the functionality of those products expand, Qumu believes that it may become increasingly subject to attempts by others to duplicate its proprietary technology and to the possibility of infringement of its intellectual property. In addition, although Qumu does not believe that any of its products infringe on the rights of others, third parties have claimed, and may in the future claim, Qumu's products infringe on their rights and these third parties may assert infringement claims against Qumu in the future. Qumu may litigate to enforce its intellectual property rights and to defend against claimed infringement of the rights of others or to determine the ownership, scope, or validity of Qumu's proprietary rights and the rights of others. Any claim of infringement against Qumu could involve significant liabilities to third parties, could require Qumu to seek licenses from third parties and could prevent Qumu from developing, selling or using its products.
The Company is the owner of various trademarks and trade names referenced in this Annual Report on Form 10-K including: "Qumu," "VideoNet Edge" and "Pathfinder." Solely for convenience, the trademarks and trade names in this Report are referred to without the ® and TM symbols, but such references should not be construed as any indicator that the Company or the other respective owners will not assert, to the fullest extent under applicable law, its or their rights thereto.
Employees
As of December 31, 2016, the Company had 150 employees, of which 61 were involved in research and development, 28 in service and support, 37 in sales and marketing, and 24 in administration and management. None of Qumu's employees are represented by a labor union or covered by a collective bargaining agreement.
Available Information
Qumu maintains a website at www.qumu.com. Qumu files reports with the Securities and Exchange Commission and its annual reports on Form 10-K, quarterly reports on Form 10-Q, current reports on Form 8-K, and other reports filed or furnished pursuant to Section 13(a) or 15(d) of the Securities Exchange Act of 1934, are available on its website, as soon as reasonably practicable after these documents are filed with the SEC. To obtain copies of these reports, go to www.qumu.com and click on “Company,” then click on “Investor Relations,” then "SEC Filings" and all current EDGAR reports are available for viewing. A copy of any report filed by the Company with the SEC will also be furnished without charge to any shareholder who requests it in writing to: Secretary, Qumu Corporation 510 1st Avenue North, Suite 305, Minneapolis, MN 55403.
ITEM 1A. RISK FACTORS
If any of the following risks actually occur, our results of operations, cash flows and the market price of our common stock could be negatively impacted. Although we believe that we have identified and discussed below the most significant risk factors affecting our business, there may be additional risks and uncertainties that are not presently known or that are not currently believed to be significant that may adversely affect our performance or financial condition. Any forecast regarding our future performance, including, but not limited to, forecasts regarding estimated bookings, revenue, or cash flow from our operating activities, are forward-looking statements. These forward-looking statements reflect various assumptions and are subject to significant uncertainties and risks that could cause the actual results to differ materially from those described in the forward-looking statement, including the risks reflected in the risk factors set forth below. Consequently, the future results expressed or implied by any forward-looking statement are not guaranteed and the variation of actual results or events from such statements may be material and adverse.
The markets for video content and software to manage video content are each in early stages of development. If this market does not develop or develops more slowly than we expect, our revenues may decline or fail to grow.
With the sale of the disc publishing business on July 1, 2014, we now derive all of our revenues from providing video content management software. The use of video as a mainstream communication and collaboration platform and the market for video content management software is in an early stage of development, and it is uncertain whether this use of video will achieve high levels of acceptance. Widespread acceptance and use of video in the enterprise is critical to our future growth and success. Likewise, it is uncertain whether video content management software will achieve high levels of demand and market acceptance. Our success will depend on enterprises adopting video as a platform and upon enterprise demand for software to help them capture, organize and distribute this content.
7
Some customers may be reluctant or unwilling to use video as a medium within the enterprise for a number of reasons, including lack of perceived benefit of this new method of communication and existing investments in other enterprise-wide communications tools. Further, even if customers are using video as a medium, these customers may choose to rely upon their own IT infrastructure and resources to manage their video content. Because many companies generally are predisposed to maintaining control of their IT systems and infrastructure, there may be resistance to using software as a service provided by a third party. Privacy concerns and transition costs are also factors that may affect a potential customer’s decision to subscribe to an external solution.
Additional factors that may limit market acceptance of our video content management software include:
• | competitive dynamics may cause pricing levels to change as the market matures and cause customers to seek out lower priced alternatives to our video content management software or force us to reduce the prices we charge for our products or services; or |
• | existing and new market participants may introduce new types of solutions and different approaches to enable enterprises to address their enterprise communications or video communications needs and these disruptive technologies may reduce demand for our video content management software. |
If customers do not perceive the benefits of our video content management software, or if customers are unwilling to accept video content as an alternative to other more traditional forms of enterprise communication, the market for our software might not continue to develop or might develop more slowly than we expect, either of which would significantly adversely affect our financial results and prospects.
To compete effectively, we must continually improve existing products and introduce new products that achieve market acceptance.
The software industry in general, and in particular, software targeted to a new and developing market like enterprise video content management, is characterized by rapid technological changes, evolving industry standards, changing customer requirements, and frequent new product and service introductions and enhancements. The introduction of products using new technologies or the adoption of new industry standards can make our existing products, or products under development, obsolete or unmarketable. If these technologies are patented or proprietary to our competitors, we may not be able to access these technologies. In order to remain competitive and increase sales, we must anticipate and adapt to these rapidly changing technologies, enhance our existing products and introduce new products to address the changing demands of our customers. If we fail to anticipate or respond to technological developments or customer requirements, or if we are significantly delayed in developing and introducing products, our revenues will decline.
The process of developing new technology is complex and uncertain, and if we fail to accurately predict customers’ changing needs and emerging technological trends, our business could be harmed. We must commit significant resources and may incur obligations (such as royalty obligations) to develop new products and features before knowing whether our investments will result in products the market will accept and without knowing the levels of revenue, if any, that may be derived from these products. Although we expect to continue to invest substantial resources in product development activities, our efforts to achieve and maintain profitability will require us to be selective and focused with our research and development expenditures. Some of our competitors have greater engineering and product development resources than we have, allowing them to develop a greater number of products or improvements or to develop them more quickly.
If we fail to anticipate or respond in a cost-effective and timely manner to technological developments, changes in industry standards or customer requirements, or if we experience any significant delays in the development or introduction of new products or improvements to existing products, our business, operating results and financial condition could be affected adversely.
If we do not generate sufficient cash flow to fund our operations, we may need additional capital and any additional capital we seek may not be available in the amount or at the time we need it.
In the year ended December 31, 2016, we had an operating loss of $11.4 million, used $9.4 million of net cash in continuing operating activities, and ended 2016 with $10.4 million in cash and cash equivalents. In the third quarter of 2015 through early 2016, we implemented a significant expense reduction program that, when combined with expected revenue growth in 2017, we believe will allow us to attain our goal of being cash flow breakeven for the second half of 2017.
On October 21, 2016, we entered into a credit agreement with HCP-FVD, LLC as lender and Hale Capital Partners, LP as administrative agent for an $8.0 million term loan secured by substantially all of our assets. The credit agreement was amended effective March 31, 2017 to modify certain covenants and certain prepayment terms. The term loan requires payment of interest monthly at the prime rate plus 6% and is due in full at its maturity date of October 21, 2019. As of December 31, 2016, interest was payable at 9.75%.
8
Our financing needs are based upon management estimates as to future revenue and expense. If we are not able to become cash flow breakeven for the second half of 2017 by increasing revenue and controlling expenses, we may need to raise funds in the future to execute our business plan and pursue our growth objectives. Our credit agreement also contains covenants requiring minimum cash in the U.S. of $4.0 million and requiring that our combined eligible accounts receivable and cash in the U.S. be no less than 118% of our obligations under the credit agreement. If we are not able to achieve our operating plan for 2017, we may need to raise funds in the future to achieve covenant compliance. In addition to these potential short-term capital needs, we will need to generate sufficient cash to repay the term loan at maturity or secure capital to refinance the term loan at maturity. If we are unable to maintain compliance with our covenants, we may have to negotiate with our lender and there can be no assurance the lender will not accelerate the repayment of such borrowings.
If we are able to raise funds in the future, we cannot assure you that additional financing will be available in the amount or at the time we need it, or that it will be available on acceptable terms or at all. We may obtain future additional financing by incurring indebtedness or from an offering of our equity securities or both.
If we raise additional equity financing, our shareholders may experience significant dilution of their ownership interests and the value of shares of our common stock could decline. Our efforts to raise additional funds from the sale of equity may be hampered by the currently depressed trading price of our common stock. If we raise additional equity financing, the provisions our credit agreement require us to use the proceeds from the equity financing to prepay our term loan. New investors may demand rights, preferences or privileges senior to those of existing holders of common stock. Our efforts to raise funds by incurring additional indebtedness may be hampered by the covenants and restrictions of our existing outstanding indebtedness and the fact that our assets are pledged to our lender to secure existing debt. The covenants of our credit agreement restrict our ability to make dividends, create liens, incur indebtedness, and sell our assets and properties, subject to certain exceptions. Likewise, any additional debt we incur would likely have covenants that would affect the manner in which we conduct our business, including by restricting our ability to incur additional indebtedness, preventing us from creating liens or requiring specified financial covenants. In addition, we may face challenges in securing additional debt financing if our future cash flow from operations is not sufficient to support debt service payments. If we raise capital through the sale of our investment in BriefCam, the credit agreement also requires us to use the proceeds to prepay our term loan. If we cannot timely raise any needed funds, we may be forced to make further substantial reductions in our operating expenses, which could limit our sales and marketing efforts, adversely affect our ability to attract and retain qualified personnel, limit our ability to develop and enhance our solutions, make it more difficult for us to respond to competitive pressures or unanticipated working capital requirements, and otherwise adversely affect our ability to pursue our growth objectives.
We have limited operating history with our video content software management business, which may make evaluating our business and prospects difficult.
With our acquisition of Qumu, Inc. in October 2011, we began our video content management business. Prior to the acquisition of Qumu, Inc. and through July 1, 2014, we also operated the disc publishing business. On October 3, 2014, we acquired Kulu Valley Ltd., a private limited company incorporated in England and Wales, subsequently renamed Qumu Ltd, to add its cloud-based video content creation capabilities and expanded market reach to include external use cases. As a result, we have a limited history with our video content software management business and an even more limited history with the standalone operation of our video content software management business. Accordingly, our historical financial results are not necessarily indicative of the future financial condition or results of operations of our video content management business. This limited history may make it difficult for shareholders, prospective investors, analysts and others to evaluate our business and prospects given the risks and uncertainties that we face as a relatively early stage, high technology company entering a new and rapidly evolving market.
We face intense competition and such competition may result in price reductions, lower gross profits and loss of market share.
Our products face intense competition, both from other products and from other technologies, both in the U.S. and in international markets. We compete with others such as Kaltura, Kontiki, Cisco, Polycom, vBrick, Brightcove and MediaPlatform who deliver video content to businesses. Further, because some prospective customers may choose to rely upon their own IT infrastructure and resources to manage their video content, we compete with customer-created solutions for video content management. We expect the intensity of competition we face to increase in the future from other established and emerging companies.
Many of our competitors have greater resources than we do, including greater sales, product development, marketing, financial, technical or engineering resources. In addition, because our enterprise video content management software business is relatively new with a limited operating history, our target customers may prefer to purchase software products that are critical to their business from one of our larger, more established competitors.
9
To remain competitive, we believe that we must continue to provide:
• | technologically advanced products and solutions that anticipate and satisfy the demands of end-users; |
• | continuing advancements or innovations in our product offerings, including products with price-performance advantages or value-added features in security, reliability or other key areas of customer interest; |
• | innovations in video content creation, management, delivery and user experience; |
• | a responsive and effective sales force; |
• | a dependable and efficient sales distribution network; |
• | superior customer service; and |
• | high levels of quality and reliability. |
We cannot assure you that we will be able to compete successfully against our current or future competitors. Competition may result in price reductions, lower gross profit margins, increased discounts to customers and loss of market share, and could require increased spending by us on research and development, sales and marketing and customer support.
We encounter long sales cycles with our enterprise video solutions, which could adversely affect our operating results in a given period.
Our ability to increase revenues and achieve profitability depends, in large part, on widespread acceptance of our enterprise video content management software products by large businesses and other organizations. As we target our sales efforts at these customers, we face greater costs, longer sales cycles and less predictability in completing sales. In the large enterprise market, the customer’s decision to use our products may be an enterprise-wide decision and, therefore, these types of sales require us to provide greater levels of education regarding the use and benefits of our applications. Further, given the constant innovation with our industry and our products, customers may delay purchasing decisions until certain features or products in development are brought to market. Longer sales cycles could cause our operating and financial results to suffer in a given period.
Adverse economic conditions, particularly those affecting our customers have harmed and may continue to harm our business.
Unfavorable changes in economic conditions, including recession, inflation, lack of access to capital, lack of consumer confidence or other changes have resulted and may continue to result in lower spending among our customers and target customers.
Further, we sell our products throughout the United States, as well as in several international countries to commercial and government customers. Our business may be adversely affected by factors in the United States and other countries such as disruptions in financial markets, reductions in government spending, or downturns in economic activity in specific countries or regions, or in the various industries in which we operate; social, political or labor conditions in specific countries or regions; or adverse changes in the availability and cost of capital, interest rates, tax rates, or regulations. These factors are beyond our control, but may result in further decreases in spending among customers and softening demand for our products.
Further, challenging economic conditions also may impair the ability of our customers to pay for products and services they have purchased. As a result, our cash flow may be negatively impacted and our allowance for doubtful accounts and write-offs of accounts receivable may increase.
Our sales will decline, and our business will be materially harmed, if our sales and marketing efforts are not effective.
We will need to continue to optimize our sales infrastructure in order to grow our customer base and our business. Identifying and recruiting qualified personnel and training them in the use and functionality of our software requires significant time, expense and attention. It can take six months or longer before our sales representatives are fully-trained and productive. If we are unable to hire, develop and retain talented sales personnel or if new sales personnel are unable to achieve desired productivity levels in a reasonable period of time, we may not be able to realize the expected benefits of this investment or increase our revenues. We also intend to expand new sales models that focus on different sales strategies tailored to different customer types. Our business may be adversely affected if our efforts to train our internal sales force or execute our selling strategies do not generate a corresponding increase in revenues.
For sales that are made to customers through our channel partners, we depend on these businesses to provide effective sales and marketing support to our products. Our channel partners are independent businesses that we do not control. Our agreements with channel partners do not contain requirements that a certain percentage of such parties’ sales are of our products. These channel partners may choose to devote their efforts to other products in different markets or reduce or fail to devote the resources to provide effective sales and marketing support of our products, any of which could harm our business by reducing sales to customers.
10
We believe that our future growth and success will depend upon the success of our internal sales and marketing efforts as well as those of our channel partners.
Competition for highly skilled personnel is intense and if we fail to attract and retain talented employees, we may fail to compete effectively.
Our future success depends, in significant part, on our continuing ability to identify, hire, develop, motivate, and retain highly skilled personnel for all areas of our organization. Competition in our industry for qualified employees, particularly in senior management, product development and sales, is intense. In addition, our compensation arrangements, such as our equity award programs, may not always be successful in attracting new employees and retaining and motivating our existing employees given the high demand for these employees from other employers. Our ability to compete effectively depends on our ability to attract new employees and to retain and motivate our existing employees.
Our enterprise video content management software products must be successfully integrated into our customers’ information technology environments and workflows and changes to these environments, workflows or unforeseen combinations of technologies may harm our customers’ experience in using our software products.
A significant portion of our sales are made into applications that require our enterprise video content management software products to be integrated into other enterprise workflows, enterprise information technology environments or software functionalities. Any significant changes to enterprise workflows, IT environments or software programs may limit the use or functionality of or demand for our products. As our customers advance technologically, we must be able to effectively integrate our products to remain competitive. Further, current and potential customers may choose to use products offered by our competitors or may not purchase our products if our products would require changes in their existing enterprise workflows, IT environments or software.
The growth and functionality of our enterprise video content management software products depend upon the solution’s effective operation with mobile operating systems and computer networks.
Our products are currently compatible with various mobile operating systems including the iOS, Windows Mobile and Android operating systems. The functionality of our products depends upon the continued interoperability of these products with popular mobile operating systems. Any changes in these systems that degrade our products’ functionality or give preferential treatment to competitive offerings could adversely affect the operability and usage of our video management software products on mobile devices. Additionally, in order to deliver a high quality user experience, it is important that our products work well with a range of mobile technologies, systems, and networks. We may not be successful in keeping pace with changes in mobile technologies, operating systems, or networks or in developing products that operate effectively within existing or future technologies, systems, and networks. Further, any significant changes to mobile operating systems by their respective developers may prevent our products from working properly or at all on these systems. In the event that it is more difficult for users to access content delivered by our solutions to their mobile devices, if our products do not operate effectively within the most popular operating systems or if popular mobile devices do not offer a high quality user experience, sales of and customer demand for our software products could be harmed.
Any failure of major elements of our products could lead to significant disruptions in the ability to serve customers, which could damage our reputation, reduce our revenues or otherwise harm our business.
Our business is dependent upon providing customers with fast, efficient and reliable services. A reduction in the performance, reliability or availability of required network infrastructure may harm our ability to distribute content to our customers, as well as our reputation and ability to attract and retain customers. Our content management software solutions and operations are susceptible to, and could be damaged or interrupted by outages caused by fire, flood, power loss, telecommunications failure, Internet or mobile network breakdown, earthquake and similar events. Our solutions are also subject to human error, security breaches, power losses, computer viruses, break-ins, “denial of service” attacks, sabotage, intentional acts of vandalism and tampering designed to disrupt our computer systems and network communications. Our failure to protect our network against damage from any of these events could harm our business.
11
Our operations also depend on web browsers, ISPs (Internet service providers) and mobile networks to provide our customers’ end-users with access to websites, streaming and mobile content. Many of these providers have experienced outages in the past, and could experience outages, delays and other difficulties due to system failures unrelated to our solutions. Any such outage, delay or difficulty could adversely affect our ability to effectively provide our products and services, which would harm our business.
If we lose access to third-party licenses, our software product development and production may be delayed or we may incur additional expense to modify our products or products in development.
Some of our solutions contain software licensed from third parties. Third-party licensing arrangements are subject to a number of risks and uncertainties, including:
• | undetected errors or unauthorized use of another person’s code in the third-party’s software; |
• | disagreement over the scope of the license and other key terms, such as royalties payable; |
• | infringement actions brought by third-party licensees; |
• | that third parties will create solutions that directly compete with our products; and |
• | termination or expiration of the license. |
Because of these risks, some of these licenses may not be available to us in the future on terms that are acceptable to us or allow our products to remain competitive. The loss of these licenses or the inability to maintain any of them on commercially acceptable terms could delay development of future products or impair the functionality or enhancement of existing products, leading to increased expense associated with licenses of third-party software or development of alternative software to provide comparable functionality for our existing products and modification of our existing products. Further, if we lose or are unable to maintain any of these third-party licenses or are required to modify software obtained under third-party licenses, it could delay the release of new products, delay enhancements to our existing products or delay sales of our existing products. Any delays could result in loss of competitive position, loss of sales and loss of customer confidence, which could have a material adverse effect on our business, results of operations and financial condition.
If the limited amount of open source software that is incorporated into our products were to become unavailable or if we violate the terms of open source licenses, it could adversely affect sales of our products, which could disrupt our business and harm our financial results.
Our products incorporate a limited amount of “open source” software. Open source software is made available to us and to the public by its authors or other third parties under licenses that impose certain obligations on licensees that re-distribute or make derivative works of the open source software. We may not be able to replace the functionality provided by the open source software currently incorporated in our products if that software becomes unavailable, obsolete or incompatible with future versions of our products. In addition, we must carefully monitor our compliance with the licensing requirements applicable to that open source software. If we have failed or if in the future we fail to comply with the applicable license requirements, we might lose the right to use the subject open source software. The terms of some open source licenses would require us to give our customers significant rights to open source software that is subject to those licenses and is incorporated in our products. This would include the right to obtain from us the source code form of that open source software, and the right to use, modify and distribute that open source software to others. We may be required to provide these rights to customers on a royalty-free basis. Those rights might also extend to modifications and additions we make to the subject open source software. That open source software, and those modifications and additions, also might be obtained by our competitors and used in competing products.
The enforceability and interpretation of open source licenses remains uncertain under applicable law. Unfavorable court decisions could require us to replace open source software incorporated in our products. In some cases this might require us to obtain licenses to commercial software under terms that restrict our use of that commercial software and require us to pay royalties. In some cases we might need to redesign our software products, or to discontinue the sale of our software products if a redesign could not be accomplished on a timely basis. These same consequences result if our use of any open source software or commercial software is found to infringe any intellectual property right of another party. Any of these occurrences would harm our business, operating results and financial condition.
We sell a significant portion of our products internationally, which exposes us to risks associated with international operations.
We sell a significant amount of our products to customers outside the United States, particularly in Europe and Asia. International sales comprised approximately 27%, 27% and 15% of revenues for the years ended December 31, 2016, 2015 and 2014, respectively. We expect that sales to international customers, including customers in Europe and Asia, will continue to account for a significant portion of our net sales. Sales outside the United States involve the following risks, among others:
• | international governments may impose tariffs, quotas and taxes; |
12
• | the demand for our products will depend, in part, on local economic health; |
• | political and economic instability may reduce demand for our products; |
• | restrictions on the export or import of technology may reduce or eliminate our ability to sell in certain markets; |
• | potentially limited intellectual property protection in certain countries may limit our recourse against infringing products or cause us to refrain from selling in certain markets; |
• | potential difficulties in managing our international operations; |
• | the burden and cost of complying with a variety of international laws, including those relating to data security and privacy; |
• | we may decide to price our products in foreign currency denominations; |
• | our contracts with international channel partners cannot fully protect us against political and economic instability; |
• | potential difficulties in collecting receivables; and |
• | we may not be able to control our international channel partners’ efforts on our behalf. |
The financial results of our non-U.S. subsidiaries are translated into U.S. dollars for consolidation with our overall financial results. Currency translations and fluctuations may adversely affect the financial performance of our consolidated operations. Currency fluctuations may also increase the relative price of our product in international markets and thereby could also cause our products to become less affordable or less price competitive than those of international manufacturers. These risks associated with international operations may have a material adverse effect on our revenue from or costs associated with international sales.
If our domestic or international intellectual property rights are not adequately protected, others may offer products similar to ours or independently develop the same or similar technologies or otherwise obtain access to our technology and trade secrets which could depress our product selling prices and gross profit or result in loss of market share.
We believe that protecting our proprietary technology is important to our success and competitive positioning. In addition to common law intellectual property rights, we rely on patents, trade secrets, trademarks, copyrights, know-how, license agreements and contractual provisions to establish and protect our intellectual property rights. However, these legal means afford us only limited protection and may not adequately protect our rights or remedies to gain or keep any advantages we may have over our competitors.
Our competitors, who may have or could develop or acquire significant resources, may make substantial investments in competing technologies, or may apply for and obtain patents that will prevent, limit or interfere with our ability to develop or market our products. Further, although we do not believe that any of our products infringe on the rights of others, third parties have claimed, and may claim in the future, that our products infringe on their rights, and these third parties may assert infringement claims against us in the future.
Costly litigation may be necessary to enforce patents issued to us, to protect trade secrets or “know-how” we own, to defend us against claimed infringement of the rights of others or to determine the ownership, scope, or validity of our proprietary rights and the rights of others. Any claim of infringement against us may involve significant liabilities to third parties, could require us to seek licenses from third parties, and could prevent us from manufacturing, selling, or using our products. The occurrence of this litigation, or the effect of an adverse determination in any of this type of litigation, could have a material adverse effect on our business, financial condition and results of operations. Further, the laws of some of the countries in which our products are or may be sold may not protect our products and intellectual property to the same extent as the United States or at all. Our failure to protect or enforce our intellectual property rights could have a material adverse effect on our business, results of operations and financial condition.
Changes in laws and regulations related to the Internet or changes in the Internet infrastructure itself may diminish the demand for our products, and could have a negative impact on our business.
The future success of our business depends in part upon the continued use of the Internet as a primary medium for commerce, communication and business applications. Federal, state or international government bodies or agencies have in the past adopted, and may in the future adopt, laws or regulations affecting the use of the Internet as a commercial medium. Changes in these laws or regulations could require us to modify our products in order to comply with these changes. In addition, government agencies or private organizations may begin to impose taxes, fees or other charges for accessing the Internet or commerce conducted via the Internet. These laws or charges could limit the growth of Internet-related commerce or communications generally, or result in reductions in the demand for Internet-based applications such as ours. The adoption of any laws or regulations that adversely affect the growth, popularity or use of the Internet could limit the growth of the video as a mainstream communication and collaboration tool, limit the market for video content management software generally, and limit the demand for our products.
13
In addition, the use of the Internet as a business tool could be adversely affected due to delays in the development or adoption of new standards and protocols to handle increased demands of Internet activity, security, reliability, cost, ease of use, accessibility, and quality of service. The performance of the Internet and its acceptance as a business tool has been adversely affected by “viruses,” “worms” and similar malicious programs and the Internet has experienced a variety of outages and other delays as a result of damage to portions of its infrastructure. If the use of the Internet is adversely affected by these issues, demand for our applications could suffer.
Expanding laws, regulations and customer requirements relating to data security and privacy may adversely affect sales of our products and result in increased compliance costs.
Our customers can use our products to collect, use and store personal or identifying information regarding their employees, customers and suppliers. Federal, state and international government bodies and agencies have adopted, are considering adopting, or may adopt laws and regulations regarding data security, privacy and the collection, use, storage and disclosure of personal information obtained from consumers and individuals. These laws and regulations could reduce the demand for our software products if we fail to design or enhance our products to enable our customers to comply with the privacy and security measures required by the legislation.
We also must comply with the policies, procedures and business requirements of our customers relating to data privacy and security, which can vary based upon the customer, the customer’s industry or location, and the product the customer selects, and which may be more restrictive than the privacy and security measures required by law or regulation. In particular, the European Union and many countries in Europe have stringent privacy laws and regulations, which may impact our ability to profitably operate in certain European countries or to offer products that meet the needs of customers subject to European Union privacy laws and regulations.
The costs of compliance with, and other burdens imposed by, our customers’ own requirements and the privacy and security laws and regulations that are applicable to our customers’ businesses may limit the use and adoption of our products and reduce overall demand. Non-compliance with our customers’ specific requirements may lead to termination of contracts with these customers or liabilities to the customers; non-compliance with applicable laws and regulations may lead to significant fines, penalties or liabilities.
Furthermore, privacy concerns may cause our customers’ workers to resist providing the personal data necessary to allow our customers to use our products effectively. If a customer experiences a significant data security breach involving our software products, our customers could lose confidence in our software’s ability to protect the personal information of their employees, customers and suppliers, which could cause our customers to discontinue use of our products. The loss of confidence from a significant data security breach involving our software products could hurt our reputation, cause sales and marketing challenges to existing and new customers, cause loss of market share or exacerbate competitive pressures, result in an increase in our development costs to address any potential vulnerabilities in our software products, and may result in reduced demand and revenue. Even the perception of privacy concerns, whether or not valid, may inhibit market adoption of our products in certain industries.
Domestic and international legislative and regulatory initiatives and our customers’ privacy policies and practices may adversely affect our customers’ ability to process, handle, store, use and transmit demographic and personal information from their employees, customers and suppliers, which could reduce demand for our products.
In addition to government activity, privacy advocacy groups and the technology and other industries are considering various new, additional or different self-regulatory standards that may place additional burdens on our software products. If the processing of personal information were to be curtailed in this manner, our software products would be less effective, which may reduce demand for our products and adversely affect our business.
A failure to maintain adequate internal control over financial reporting in accordance with Section 404 of the Sarbanes-Oxley Act of 2002 or to prevent or detect material misstatements in our annual or interim financial statements in the future could result in inaccurate financial reporting, or could otherwise harm our business.
Ensuring that we have internal financial and accounting controls and procedures adequate to produce accurate financial statements on a timely basis is a costly and time-consuming effort that needs to be re-evaluated frequently. The Sarbanes-Oxley Act requires, among other things, that we maintain effective internal control over financial reporting and disclosure controls and procedures. In particular, we are required to perform annual system and process evaluation and testing of our internal control over financial reporting to allow management to report on the effectiveness of our internal control over financial reporting. Furthermore, implementing any appropriate future changes to our internal control over financial reporting may entail substantial costs in order to modify our existing accounting systems, may take a significant period of time to complete and may distract our officers, directors and employees from the operation of our business. If we are not able to comply with the
14
requirements of Section 404 in the future, or if material weaknesses are identified, the market price of our common stock could decline.
We may face circumstances in the future that could result in impairment charges, including, but not limited to, significant goodwill impairment charges.
If the fair value of any of our long-lived assets decreases as a result of an economic slowdown, a downturn in the markets where we sell products and services or a downturn in our financial performance and/or future outlook, we may be required to record an impairment charge on such assets, including goodwill.
We are required to test intangible assets with indefinite life periods for potential impairment annually and on an interim basis if there are indicators of a potential impairment. We also are required to evaluate amortizable intangible assets and fixed assets for impairment if there are indicators of a possible impairment. One potential indicator of impairment is the value of our market capitalization, or enterprise value, as compared to our net book value.
As of December 31, 2016, the Company’s market capitalization, without a control premium, was greater than its book value and the Company concluded there was no goodwill impairment. Declines in the Company’s market capitalization or a downturn in our future financial performance and/or future outlook could require the Company to record goodwill and other impairment charges. While a goodwill impairment charge is a non-cash charge, it would have a negative impact on our results of operations.
We may experience significant quarterly and annual fluctuations in our results of operations due to a number of factors and these fluctuations may negatively impact the market price of our common stock.
Our quarterly and annual results of operations may fluctuate significantly due to a variety of factors, many of which are outside of our control. With the sale of the disc publishing business on July 1, 2014, there may be even wider fluctuations in our results of operations given the smaller size of our retained software business. This variability may lead to volatility in our stock price as research analysts and investors respond to quarterly fluctuations and this volatility may be exacerbated by the relatively illiquid nature of our common stock. In addition, comparing our results of operations on a period-to-period basis, particularly on a sequential quarterly basis, may not be meaningful. You should not rely on our past results as an indication of our future performance.
Factors that may affect our results of operations include:
• | the number and mix of products and solutions sold in the period; |
• | the timing and amount of our recorded revenue, which will depend upon the mix of products and solutions selected by our customers with revenue from paid-up perpetual software licenses being recognized upon delivery, revenue from term software licenses recognized over the term of the contract, and revenue from cloud-hosted services recognized over the term of the subscription agreement; |
• | timing of customer purchase commitments, including the impact of long sales cycles and seasonal buying patterns; |
• | variability in the size of customer purchases and the impact of large customer orders on a particular period; |
• | the timing of major development projects and market launch of new products or improvements to existing products; |
• | reductions in our customers’ budgets for information technology purchases and delays in their purchasing cycles, due to changing global economic or market conditions; |
• | the impact to the marketplace of competitive products and pricing; |
• | the timing and level of operating expenses; |
• | the impact on revenue and expenses of acquisitions by us or by our competitors; |
• | future accounting pronouncements or changes in our accounting policies; and |
• | the impact of a recession or any other adverse global economic conditions on our business, including uncertainties that may cause a delay in entering into or a failure to enter into significant customer agreements. |
The foregoing factors are difficult to forecast, and these, as well as other factors, could adversely affect our quarterly and annual results of operations. Failure to achieve our quarterly or annual forecasts or to meet or exceed the expectations of research analysts or investors may cause our stock price to decline abruptly and significantly.
The limited liquidity for our common stock could affect your ability to sell your shares at a satisfactory price.
Our common stock is relatively illiquid. As of December 31, 2016, we had 9,227,247 shares of common stock outstanding. The average daily trading volume in our common stock, as reported by the Nasdaq Stock Market, for the 63 trading days beginning October 1, 2016 and ending December 31, 2016 was approximately 28,900 shares. A more active public market for our
15
common stock may not develop, which could adversely affect the trading price and liquidity of our common stock. Moreover, a thin trading market for our stock could cause the market price for our common stock to fluctuate significantly more than the stock market as a whole. Without a larger float, our common stock is less liquid than the stock of companies with broader public ownership. As a result, the trading prices of our common stock have been and may continue to be more volatile. In addition, in the absence of an active public trading market, shareholders may be unable to liquidate their shares of our common stock at a satisfactory price.
Provisions of Minnesota law, our bylaws and other agreements may deter a change of control of our company and may have a possible negative effect on our stock price.
Certain provisions of Minnesota law, our bylaws and other agreements may make it more difficult for a third-party to acquire, or discourage a third-party from attempting to acquire, control of our company, including:
• | the provisions of Minnesota law relating to business combinations and control share acquisitions; |
• | the provisions of our bylaws regarding the business properly brought before shareholders; |
• | the right of our board of directors to establish more than one class or series of shares and to fix the relative rights and preferences of any such different classes or series; |
• | the provisions of our stock incentive plans allowing for the acceleration of vesting or payments of awards granted under the plans in the event of specified events that result in a “change in control”; |
• | the provisions of our agreements provide for severance payments to our executive officers in the event of certain terminations following a “change in control”; and |
• | the provisions of our credit agreement requiring prepayment in full of our term loan upon a change in control. |
These measures could discourage or prevent a takeover of our company or changes in our management, even if an acquisition or such changes would be beneficial to our shareholders. This may have a negative effect on the price of our common stock.
Compliance with changing regulation of corporate governance and public disclosure may result in additional expenses and will constitute a larger percentage of our annual revenue than prior to the sale of the disc publishing business.
Keeping abreast of, and in compliance with, changing laws, regulations and standards relating to corporate governance and public company disclosure requirements, including the Sarbanes-Oxley Act of 2002 and in particular Section 404 of that Act relating to management certification of internal controls, the regulations of the Securities and Exchange Commission and the rules of the Nasdaq Stock Market have required an increased amount of management attention and external resources. We intend to invest all reasonably necessary resources to comply with evolving corporate governance and public disclosure standards, and this investment may result in increased general and administrative expenses and a diversion of management time and attention from revenue-generating activities to compliance activities. While all public companies face the costs and burdens associated with being public companies, the costs and burden of being a public company will be a significant portion of our annual revenues, which have been reduced following the sale of the disc publishing business on July 1, 2014.
ITEM 1B. UNRESOLVED STAFF COMMENTS
None.
ITEM 2. PROPERTIES
Location of Property | Use of Property | Approximate Monthly Rent (USD) | Approximate Leased Square Footage | Lease Expiration Date | |||||
Minneapolis, Minnesota (Headquarters) | Engineering, service, sales, marketing and administration | $ | 23,000 | (1) | 16,500 | January 2023 | |||
San Bruno, California | Engineering, service, sales, marketing and administration | $ | 36,000 | (2) | 13,900 | June 2018 | |||
London, England | Engineering, service, sales, marketing and administration | $ | 36,500 | 5,500 | September 2019 | ||||
Hyderabad, India | Software development and testing | $ | 7,500 | 4,800 | September 2018 | ||||
_________________________________________________
(1) | The agreement has escalating lease payments ranging from approximately $23,000 to $26,000 per month during the course of the lease. |
(2) | The agreement has escalating lease payments ranging from approximately $33,000 to $38,000 per month during the course of the lease. |
16
ITEM 3. LEGAL PROCEEDINGS
The Company is exposed to a number of asserted and unasserted legal claims encountered in the ordinary course of its business. Although the outcome of any such legal actions cannot be predicted, management believes that there are no pending legal proceedings against or involving the Company for which the outcome is likely to have a material adverse effect upon its financial position or results of operations.
ITEM 4. MINE SAFETY DISCLOSURES
Not applicable.
17
PART II
ITEM 5. MARKET FOR COMMON EQUITY, RELATED STOCKHOLDER MATTERS AND ISSUER PURCHASES OF EQUITY SECURITIES
Market Information
Qumu's common stock is traded on the Nasdaq Global Market under the symbol “QUMU.” The following table sets forth, for the periods indicated, the range of low and high sales prices for Qumu's common stock as reported on The Nasdaq Stock Market.
Year Ended December 31, | ||||||||||||||||
2016 | 2015 | |||||||||||||||
Low | High | Low | High | |||||||||||||
First Quarter | $ | 2.10 | $ | 5.48 | $ | 12.31 | $ | 15.87 | ||||||||
Second Quarter | $ | 3.53 | $ | 5.50 | $ | 6.80 | $ | 14.99 | ||||||||
Third Quarter | $ | 2.19 | $ | 4.84 | $ | 1.58 | $ | 8.59 | ||||||||
Fourth Quarter | $ | 2.20 | $ | 3.77 | $ | 2.40 | $ | 4.94 | ||||||||
Shareholders
As of March 24, 2017, there were 107 shareholders of record of Qumu's common stock.
Dividends
The Company did not pay a dividend in 2016 or 2015 and does not expect to pay a dividend in 2017. The payment by Qumu of dividends, if any, on its common stock in the future is subject to the discretion of the Board of Directors and will depend on Qumu's future earnings, financial condition, capital requirements and other relevant factors. Under the credit agreement, the Company is prohibited from making dividends, distributions or payments on its capital stock.
Issuer Purchases of Equity Securities
The Company’s Board of Directors has approved common stock repurchases of up to 3,500,000 shares of the Company’s common stock. The Company has implemented a Rule 10b5-1 plan in connection with the repurchase program in order to give the Company the ability to repurchase its shares at times when it otherwise might be prevented from doing so under insider trading laws or because of self-imposed blackout periods. Shares may be purchased at prevailing market prices in the open market or in private transactions, subject to market conditions, share price, trading volume and other factors. The repurchase program may be discontinued at any time. The repurchase program has been funded to date using cash on hand. During the three months ended December 31, 2016, no repurchases were made under the repurchase program. While the current authorization remains in effect, the Company expects its primary use of cash will be to fund operations in support of the Company’s goals for revenue growth and operating margin improvement.
In addition to shares purchased under the Board authorization, the Company purchases shares of common stock held by employees who wish to tender owned shares to satisfy the exercise price or tax withholding on stock option exercises or vesting of restricted stock awards. All of the share repurchase activity included in the table below for the three months ended December 31, 2016 was associated with satisfaction of employee tax withholding requirements on vesting of restricted stock awards. Under the credit agreement, the Company is prohibited from repurchasing or redeeming its stock, subject to certain exceptions relating to the exercise or vesting of equity awards.
Information on the Company’s repurchases of its common stock during each month of the fourth quarter ended December 31, 2016, is as follows:
Monthly Period | Total Number of Shares Purchased | Average Price Paid per Share | Total Number of Shares Purchased as Part of Publicly Announced Plans or Programs | Maximum Number of Shares That May Yet Be purchased Under the Plans or Programs (at end of period) | |||||||||
October 2016 | 1,680 | $ | 3.28 | — | 778,365 | ||||||||
November 2016 | 796 | $ | 2.83 | — | 778,365 | ||||||||
December 2016 | — | $ | — | — | 778,365 | ||||||||
18
Other Information Regarding Equity Compensation Plans
The following table sets forth information regarding Qumu's equity compensation plans in effect as of December 31, 2016. Each of the Company’s equity compensation plans is an “employee benefit plan” as defined by Rule 405 of Regulation C of the Securities Act of 1933.
Securities Authorized for Issuance Under Equity Compensation Plans | ||||||||||
Plan category | Number of Shares of Common Stock to be Issued Upon Exercise of Outstanding Options, Warrants and Rights | Weighted-Average Exercise Price of Outstanding Options, Warrants and Rights | Number of Shares of Common Stock Remaining Available for Future Issuance Under Equity Compensation Plans(1) | |||||||
Equity compensation plans approved by shareholders | 1,277,700 | $ | 6.81 | 741,831 | ||||||
Equity compensation plans not approved by shareholders(2) | 230,000 | $ | 8.28 | — | ||||||
Total | 1,507,700 | $ | 7.03 | 741,831 | ||||||
_______________________________________
(1) Excludes shares of common stock listed in the first column.
(2) Consists of outstanding non-qualified stock option grants to two of the Company’s current senior management level employees, Vern Hanzlik and Peter Goepfrich on November 26, 2012 and May 18, 2015, the respective first days of employment with Qumu. The stock options were granted outside of the Company’s current equity incentive plan, the 2007 Stock Incentive Plan, as “inducement awards” pursuant to Nasdaq Listing Rule 4350(i)(1)(A)(iv). The options have an exercise price equal to the closing price of the Company’s common stock as reported by the Nasdaq Stock Market on the grant dates, vest in four equal installments on each of the first four anniversaries of the date of grant, and have a term of seven years. In other respects, the options were structured to mirror the terms of options granted under the Company’s 2007 Stock Incentive Plan and are subject to a stock option plan and agreement entered into by and between the Company and each employee.
19
Performance Graph
The Company’s common stock is quoted on The Nasdaq Global Market. The graph and table below set forth a comparison of the cumulative total return of the Company’s common stock over the last five fiscal years with a broad market index and published industry index. The Company has selected the NASDAQ Computer Services Index as its published industry index.
The following graph shows changes during the period from December 31, 2011 to December 31, 2016 in the value of $100 invested in: (1) the NASDAQ US Benchmark TR Index; (2) the NASDAQ Computer Services Index; and (3) Qumu's common stock. The values of each investment as of the dates indicated are based on share prices plus any dividends paid in cash, with the dividends reinvested on the date they were paid. The calculations exclude trading commissions and taxes. The table and graph are not necessarily indicative of future investment performance.
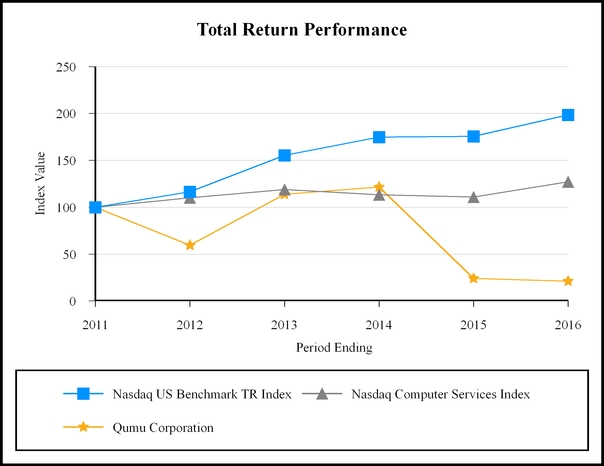
12/31/11 | 12/31/12 | 12/31/13 | 12/31/14 | 12/31/15 | 12/31/16 | ||||||||||||||||||
Nasdaq US Benchmark TR Index | $ | 100.00 | $ | 116.43 | $ | 155.41 | $ | 174.78 | $ | 175.62 | $ | 198.47 | |||||||||||
Nasdaq Computer Services Index | $ | 100.00 | $ | 110.13 | $ | 118.95 | $ | 113.21 | $ | 110.85 | $ | 127.18 | |||||||||||
Qumu Corporation | $ | 100.00 | $ | 59.38 | $ | 113.78 | $ | 121.51 | $ | 24.09 | $ | 21.16 | |||||||||||
20
ITEM 6. SELECTED FINANCIAL DATA
The selected consolidated financial data below should be read in conjunction with “Management’s Discussion and Analysis of Financial Condition and Results of Operations” in Item 7 below and the Consolidated Financial Statements and the Notes thereto included in Item 8 below. Results of operations exclude the operations of the disc publishing business, which are reported as discontinued operations for all periods presented in the Consolidated Financial Statements due to the sale of the Disc Publishing business on July 1, 2014.
Consolidated Statements of Operations Information
Year Ended December 31, | |||||||||||||||||||
2016 | 2015 | 2014 | 2013 | 2012 | |||||||||||||||
Total revenues | $ | 31,682 | $ | 34,454 | $ | 26,521 | $ | 17,736 | $ | 9,836 | |||||||||
Gross profit | $ | 19,322 | $ | 16,955 | $ | 12,049 | $ | 10,402 | $ | 5,917 | |||||||||
Operating loss (1) | $ | (11,361 | ) | $ | (29,404 | ) | $ | (28,726 | ) | $ | (19,605 | ) | $ | (49,428 | ) | ||||
Net loss from continuing operations (1) (2) | $ | (11,175 | ) | $ | (28,689 | ) | $ | (22,343 | ) | $ | (16,221 | ) | $ | (53,790 | ) | ||||
Net income (loss) (1) (2) | $ | (11,175 | ) | $ | (28,699 | ) | $ | (8,520 | ) | $ | (9,694 | ) | $ | (48,338 | ) | ||||
Net loss from continuing operations per share – basic(1)(2) | $ | (1.21 | ) | $ | (3.11 | ) | $ | (2.53 | ) | $ | (1.87 | ) | $ | (5.39 | ) | ||||
Net loss from continuing operations per share – diluted(1)(2) | $ | (1.23 | ) | $ | (3.11 | ) | $ | (2.53 | ) | $ | (1.87 | ) | $ | (5.39 | ) | ||||
Weighted average shares outstanding: | |||||||||||||||||||
Basic | 9,232 | 9,235 | 8,836 | 8,691 | 9,971 | ||||||||||||||
Diluted | 9,232 | 9,235 | 8,836 | 8,691 | 9,971 | ||||||||||||||
_________________________________________________
(1) The Company recorded non-cash goodwill and intangible asset impairment charges of $29,548 before tax in fiscal year 2012.
(2) The Company recorded non-cash deferred tax asset valuation allowance charge of $13,967 in fiscal year 2012.
Consolidated Balance Sheets Information
December 31, | |||||||||||||||||||
2016 | 2015 | 2014 | 2013 | 2012 | |||||||||||||||
Cash and cash equivalents | $ | 10,364 | $ | 7,072 | $ | 11,684 | $ | 37,725 | $ | 28,644 | |||||||||
Marketable securities | $ | — | $ | 6,249 | $ | 23,486 | $ | 13,233 | $ | 21,496 | |||||||||
Current assets | $ | 20,646 | $ | 28,629 | $ | 52,752 | $ | 71,774 | $ | 75,950 | |||||||||
Total assets | $ | 42,229 | $ | 54,412 | $ | 80,177 | $ | 89,146 | $ | 95,563 | |||||||||
Current liabilities | $ | 15,431 | $ | 19,113 | $ | 19,377 | $ | 23,028 | $ | 19,807 | |||||||||
Long-term liabilities | $ | 8,222 | $ | 4,542 | $ | 2,527 | $ | 3,537 | $ | 5,129 | |||||||||
Stockholders’ equity | $ | 18,576 | $ | 30,757 | $ | 58,273 | $ | 62,581 | $ | 70,627 | |||||||||
Historical data is not necessarily indicative of the Company's future results of operations or financial condition. See discussion of "Risk Factors" in Part I, Item 1A of this Annual Report on Form 10-K.
21
ITEM 7. MANAGEMENT’S DISCUSSION AND ANALYSIS OF FINANCIAL CONDITION AND RESULTS OF OPERATIONS
The following discussion and analysis of our financial condition and results of operations should be read together with the section titled “Selected Financial Data” and our audited financial statements and related notes which are included elsewhere in this Annual Report on Form 10-K. Our actual results could differ materially from those anticipated in the forward-looking statements included in this discussion as a result of certain factors, including, but not limited to, those discussed in “Risk Factors” included elsewhere in this Annual Report on Form 10-K.
Overview
Qumu Corporation ("Qumu" or the "Company") provides the software applications businesses use to create, manage, secure, deliver and measure the success of their videos. The Company's innovative solutions release the power in video to engage and empower employees, partners and clients, allowing organizations around the world to realize the greatest possible value from video they create and publish. Whatever the audience size, viewer device or network configuration, the Company's solutions are how business does video.
The Company generates revenue through the sale of enterprise video content management software solutions, hardware, maintenance and support, and professional and other services. Software sales may take the form of a perpetual software license, a term software license or a cloud-hosted software as a service (SaaS). Software licenses and appliances revenue includes sales of perpetual software licenses and hardware. Service revenue includes term software licenses, SaaS, maintenance and support, and professional and other services.
For the years ended December 31, 2016, 2015 and 2014, the Company generated revenues of $31.7 million, $34.5 million and $26.5 million, respectively. Subscription, maintenance and support revenue, which is included in service revenue in the Company's consolidated statements of operations, increased 14% in 2016 to $21.4 million from $18.8 million in 2015 as the Company continues to advance its transition to more revenue that is recurring in nature from primarily perpetual software license revenue.
History
The Company was founded in 1978, incorporated as IXI, Inc. in Minnesota in February 1987 and changed its name to Rimage Corporation in April 1988. From 1995 to 2011, the Company focused its business on the development and sale of its CD recordable publishing systems and DVD recordable publishing systems.
In response to declines in the disc publishing business due to technology substitutions and the rise of video as a communication and collaboration platform, in October 2011, the Company acquired Qumu, Inc., a leader in the enterprise video content management software market and changed its name to Qumu Corporation in September 2013. Qumu completed the transition to enterprise video content management software company in July 2014, when the Company closed on the sale of its disc publishing assets to Equus Holdings, Inc. and Redwood Acquisition, Inc. (now known as Rimage Corporation). As a result, the disc publishing business was classified as held for sale and qualified for presentation as discontinued operations effective with the reporting of the Company's financial results for the second quarter of 2014.
On October 3, 2014, the Company acquired Kulu Valley Ltd., a private limited company incorporated and operating in England and Wales, subsequently renamed Qumu Ltd (“Kulu Valley”). The acquisition was made to expand Qumu’s addressable market through the offering of Kulu Valley’s best-in-class video content creation capabilities and easy-to-deploy pure cloud solution, and provides Kulu Valley’s customers with access to industry-leading video content management and delivery capability.
The results of the discontinued disc publishing business and associated financial impacts from the sale of this business have been presented as discontinued operations for the years ended December 31, 2016, 2015 and 2014. No general corporate charges were allocated to the discontinued business. The assets and liabilities of the discontinued business are presented on the consolidated balance sheets as assets and liabilities from discontinued operations. Other than consolidated amounts reflecting operating results and balances for both the continuing and discontinued operations, all remaining amounts presented in the accompanying consolidated financial statements reflect the financial results and financial position of the Company's continuing enterprise video content management software business.
The following discussion of year-to-year changes and trends in financial statement results under "Management’s Discussion and Analysis of Financial Condition and Results of Operations” aligns with the financial statement presentation described above.
22
Critical Accounting Policies
The discussion of the Company's financial condition and results of operations is based upon its financial statements, which are prepared in accordance with accounting principles generally accepted in the United States of America, or GAAP. The preparation of these financial statements requires management to make estimates, judgments and assumptions that affect the reported amounts of assets, liabilities, revenues, costs and expenses and related disclosures. On an ongoing basis, management evaluates its estimates and assumptions. Management bases its estimates of the carrying value of certain assets and liabilities on historical experience and on various other assumptions that management believes to be reasonable. The Company's actual results may differ from these estimates under different assumptions or conditions.
Management believes that of the Company's significant accounting policies, which are described in the notes to our financial statements, the following accounting policies involve a greater degree of judgment, complexity and effect on materiality. A critical accounting policy is one that is both material to the presentation of our financial statements and requires management to make difficult, subjective or complex judgments for uncertain matters that could have a material effect on the Company's financial condition and results of operations. Accordingly, these are the policies management believes are the most critical to aid in fully understanding and evaluating the Company's financial condition and results of operations.
Revenue Recognition
The Company follows specific and detailed guidelines in determining the proper amount of revenue to be recorded; however, certain judgments affect the application of its revenue recognition policy.
The Company commences revenue recognition when all of the following conditions are met: there is persuasive evidence of an arrangement; the product has been delivered or the services have been provided to the customer; the collection of the fees is reasonably assured; and the amount of fees to be paid by the customer is fixed or determinable.
Revenue results are difficult to predict, and any shortfall in revenue or delay in recognizing revenue could cause the Company's operating results to vary significantly from period to period. The significant judgments for revenue recognition typically involve allocation of revenue to multiple element arrangements, which must be analyzed to determine the fair value of each element, the amount of revenue to be recognized for each element, if any, and the period and conditions under which deferred revenue should be recognized. As a result, if facts and circumstances change that affect management's current judgments, the Company's revenue could be materially different in the future.
Long-lived Assets
The Company continually monitors events and changes in circumstances that could indicate that carrying amounts of its long-lived assets, including property and equipment and intangible assets may not be recoverable. When such events or changes in circumstances occur, the Company assesses the recoverability of long-lived assets by determining whether the carrying value of such assets will be recovered through their undiscounted expected future cash flows. If the future undiscounted cash flows are less than the carrying amount of these assets, the Company recognizes an impairment loss based on the excess of the carrying amount over the fair value of the assets.
Goodwill
The Company records goodwill when consideration paid in a purchase acquisition exceeds the fair value of the net tangible assets and the identified intangible assets acquired. Goodwill is not amortized, but rather is tested for impairment annually or more frequently if facts and circumstances warrant a review. The Company has determined that there is a single reporting unit for the purpose of goodwill impairment tests. For purposes of assessing the impairment of goodwill, the Company annually, at its fiscal year end, estimates the fair value of the reporting unit and compares this amount to the carrying value of the reporting unit. If the Company determines that the carrying value of the reporting unit exceeds its fair value, an impairment charge is recognized in the amount by which the carrying amount of the asset exceeds its fair value.
As of December 31, 2016, the Company’s market capitalization, without a control premium, was greater than its book value and, as a result, the Company concluded there was no goodwill impairment. Declines in the Company’s market capitalization or a downturn in its future financial performance and/or future outlook could require the Company to record goodwill and other impairment charges. While a goodwill impairment charge is a non-cash charge, it would have a negative impact on the Company's results of operations.
Investment in Nonconsolidated Company
As of December 31, 2016 and 2015, the Company held an investment totaling $3.1 million in convertible preferred stock of BriefCam, Ltd. ("BriefCam") a privately-held Israeli company that develops video synopsis technology to augment security
23
and surveillance systems to facilitate review of surveillance video. The investment is included in other non-current assets. Because Qumu's ownership interest is less than 20% and it has no other rights or privileges that enable it to exercise significant influence over the operating and financial policies of BriefCam, Qumu accounts for this equity investment using the cost method. Equity securities accounted for under the cost method are reviewed quarterly for changes in circumstances or the occurrence of events that suggest the Company’s investment may not be fully recoverable. If an unrealized loss for the investment is considered to be other-than-temporary, the loss will be recognized in the consolidated statements of operations in the period the determination is made. Qumu monitors BriefCam's results of operations, business plan and capital raising activities and is not aware of any events or circumstances that would indicate a decline in the fair value below the carrying value of its investment.
Derivative Liability
In conjunction with debt financing completed in October 2016, the Company issued a warrant for the purchase of up to 314,286 shares of the Company's common stock, the entire portion of which remained unexercised and outstanding at December 31, 2016. The Company accounts for the warrant, a derivative financial instrument issued in conjunction with the Company's 2016 debt financing, as a current liability based upon the characteristics and provisions of the instrument. The warrant was determined to be ineligible for equity classification because of provisions that allow the holder under certain circumstances, essentially the sale of the Company as defined in the warrant agreement, to elect to receive a minimum cash payment in lieu of the Company's common shares. The warrant liability was recorded in the Company's consolidated balance sheets at its fair value on the date of issuance and is revalued on each subsequent balance sheet date until such instrument is exercised or expires, with any changes in the fair value between reporting periods recorded as other income or expense. The Company estimates the fair value of this liability using an option pricing model that is based on the individual characteristics of the warrant on the valuation date, which includes assumptions for expected volatility, expected life and risk-free interest rate, as well as the present value of the minimum cash payment component of the instrument. Changes in the assumptions used could have a material impact on the resulting fair value. The primary input affecting the value of the warrant liability is the Company’s stock price. Generally, increases (decreases) in the fair value of the underlying stock would result in a corresponding increase (decrease) in the fair value of the warrant liability.
Stock-Based Compensation
Stock-based compensation is measured at the grant date, based on the fair value of the award, and is recognized ratably as an expense over the vesting period of the award. Determining the appropriate fair value model and calculating the fair value of stock-based payment awards require the use of subjective assumptions, including the expected life of the stock-based payment awards and stock price volatility. Management uses the Black-Scholes option pricing model to value award grants and determine the related compensation expense. The assumptions used in calculating the fair value of stock-based payment awards represent management’s best estimates, but the estimates involve inherent uncertainties and the application of management judgment. As a result, if factors change and management uses different assumptions, the Company's stock-based compensation expense could be materially different in the future. The Company expects to continue to grant stock-based awards in the future, and to the extent that the Company does, its actual stock-based compensation expense recognized in future periods will likely increase.
Royalties for Third-Party Technology
Royalties for third-party technology are either paid in advance and capitalized as prepaid royalties or are accrued as incurred and subsequently paid. These royalties are generally expensed to cost of revenue generally at the greater of a rate based on the contractual or estimated term or an effective royalty rate based on the total projected net revenue for contracts with guaranteed minimums. Each quarter, the Company also evaluates the expected future realization of its prepaid royalties, as well as any minimum commitments not yet paid to determine amounts it deems unlikely to be realized through product sales. Any impairments or losses determined before the launch of a product are generally charged to general and administrative expense, and any impairments or losses determined post-launch are charged to cost of revenue. Unrecognized minimum royalty-based commitments are accounted for as executory contracts, and therefore, any losses on these commitments are recognized when the underlying intellectual property is abandoned (i.e., cease use) or the contractual rights to use the intellectual property are terminated.
Income Taxes
Significant judgment is required in determining the realizability of deferred tax assets. Management must assess the likelihood that the Company's net deferred tax assets will be recovered from future taxable income, and to the extent management believes that recovery is not likely, the Company must establish a valuation allowance. Considerations for determining the realizability of the Company's deferred tax assets primarily involve cumulative pre-tax income for financial reporting purposes, cumulative taxable income for the past three years, estimated future pre-tax income for financial reporting purposes and estimated future
24
taxable income from the Company's core business. Management also considers the expiration dates and amounts of net operating loss carryforwards and other tax credits, and estimate the impact of future tax deductions from the exercise of stock options. These estimates are projected through the life of the related deferred tax assets based on assumptions which management believes to be reasonable and consistent with current operating results.
Since 2012, the Company has maintained a full valuation allowance against the Company U.S. deferred tax assets. If pretax results improve in future periods, the Company may be able to reverse the valuation allowance, which would positively impact earnings. As of December 31, 2016, the Company had $78.1 million of net operating loss carryforwards for U.S. federal tax purposes and $63.9 million of net operating loss carryforwards for various states.
Results of Operations
The percentage relationships to revenues of certain income and expense items for the years ended December 31, 2016, 2015 and 2014, and the percentage changes in these income and expense items between years, are contained in the following table (all amounts presented reflect only the financial results of the Company's continuing enterprise video content management software business):
Percentage of Revenues | Percent Increase (Decrease) | |||||||||||||
2016 | 2015 | 2014 | 2015 to 2016 | 2014 to 2015 | ||||||||||
Revenues | 100.0 | % | 100.0 | % | 100.0 | % | (8 | )% | 30 | % | ||||
Cost of revenues | (39.0 | ) | (50.8 | ) | (54.6 | ) | (29 | ) | 21 | |||||
Gross profit | 61.0 | 49.2 | 45.4 | 14 | 41 | |||||||||
Operating expenses: | ||||||||||||||
Research and development | 27.0 | 31.0 | 35.8 | (20 | ) | 12 | ||||||||
Sales and marketing | 36.4 | 52.2 | 67.8 | (36 | ) | — | ||||||||
General and administrative | 30.7 | 49.0 | 47.6 | (42 | ) | 34 | ||||||||
Amortization of purchased intangibles | 2.8 | 2.3 | 2.5 | 12 | 22 | |||||||||
Total operating expenses | 96.9 | 134.5 | 153.7 | (34 | ) | 14 | ||||||||
Operating loss | (35.9 | ) | (85.3 | ) | (108.3 | ) | (61 | ) | 2 | |||||
Other expense, net | (0.2 | ) | (0.4 | ) | (0.7 | ) | (47 | ) | (31 | ) | ||||
Loss before income taxes | (36.1 | ) | (85.7 | ) | (109.0 | ) | (61 | ) | 2 | |||||
Income tax benefit | (0.8 | ) | (2.4 | ) | (24.8 | ) | (70 | ) | (87 | ) | ||||
Net loss from continuing operations | (35.3 | )% | (83.3 | )% | (84.2 | )% | (61 | )% | 28 | % | ||||
Revenues
The Company generates revenue through the sale of enterprise video content management software solutions, hardware, maintenance and support, and professional and other services. Software sales may take the form of a perpetual software license, a term software license or a cloud-hosted software as a service (SaaS). Software licenses and appliances revenue includes sales of perpetual software licenses and hardware. Service revenue includes term software licenses, SaaS, maintenance and support, and professional and other services.
The table below describes Qumu's revenues by product category (in thousands):
Year Ended December 31, | Increase (Decrease) | Percent Increase (Decrease) | |||||||||||||||||||||||
2016 | 2015 | 2014 | 2015 to 2016 | 2014 to 2015 | 2015 to 2016 | 2014 to 2015 | |||||||||||||||||||
Software licenses and appliances | $ | 5,839 | $ | 9,456 | $ | 11,363 | $ | (3,617 | ) | $ | (1,907 | ) | (38 | )% | (17 | )% | |||||||||
Service | |||||||||||||||||||||||||
Subscription, maintenance and support | 21,443 | 18,804 | 12,229 | 2,639 | 6,575 | 14 | 54 | ||||||||||||||||||
Professional services and other | 4,400 | 6,194 | 2,929 | (1,794 | ) | 3,265 | (29 | ) | 111 | ||||||||||||||||
Total service | 25,843 | 24,998 | 15,158 | 845 | 9,840 | 3 | 65 | ||||||||||||||||||
Total revenues | $ | 31,682 | $ | 34,454 | $ | 26,521 | $ | (2,772 | ) | $ | 7,933 | (8 | )% | 30 | % | ||||||||||
The $2.8 million decrease in total revenues from 2015 to 2016 reflects a $3.6 million decrease in software licenses and appliances revenues, partially offset by a $0.8 million increase in service revenues. The decrease in software licenses and appliances revenues in 2016 was largely impacted by a decrease in the value of perpetual product license contracts entered into in 2016 and converted to revenue. Revenues can vary year to year based on the type of contract the Company enters into with each customer. Contracts for perpetual software licenses, which are included in software licenses and appliances revenue, generally result in revenue recognized closer to the contract commitment date, while contracts for term software licenses and
25
SaaS, which are included in service revenue, result in most of the revenue being recognized over the period of the contract. The $0.8 million increase in service revenues from 2015 to 2016 resulted from a $2.6 million increase in subscription, maintenance and support revenues driven primarily from growth in the customer base and $1.2 million of previously deferred subscription, maintenance and support revenue contingent on a customer's acceptance, which was received in the fourth quarter of 2016. Partially offsetting the growth in subscription, maintenance and support revenues was an approximately $1.8 million decrease in professional services revenues. The decrease in professional services revenues, which generally move directionally with changes in perpetual license sales, was driven by the decrease in the value of perpetual product license contracts entered into in 2016, partially offset by the recognition of $0.4 million of previously deferred professional service revenue contingent on a customer's acceptance, which was received in the fourth quarter of 2016.
The $7.9 million increase in total revenues from 2014 to 2015 reflects a $9.8 million increase in service revenues, partially offset by a $1.9 million decrease in software licenses and appliances revenues. The decrease in software license revenues in 2015 was largely impacted by a decrease in the value of perpetual product license contracts entered into in 2015 and converted to revenue. The $9.8 million increase in service revenues from 2014 to 2015 resulted from a $6.6 million increase in subscription, maintenance and support revenues driven primarily from growth in the customer base, including the favorable impact of SaaS revenues from Qumu’s acquisition of Kulu Valley effective October 3, 2014. Also contributing to the growth in services revenue was an approximately $3.3 million increase in professional services revenues as Qumu assists its customers in the deployment of its growing base of enterprise video solutions.
Future consolidated revenues will be dependent upon many factors, including the rate of adoption of the Company's software solutions in its targeted markets and whether arrangements with customers are structured as a perpetual software license, a term software license or a SaaS, which impacts the timing of revenue recognition. Other factors that will influence future consolidated revenues include the timing of customer orders, the product and service mix of customer orders, the impact of changes in economic conditions and the impact of foreign currency exchange rate fluctuations.
Cost of Revenues and Gross Profit
A comparison of gross profit and gross margin by revenue category is as follows (dollars in thousands):
Year Ended December 31, | Increase (Decrease) | Percent Increase (Decrease) | |||||||||||||||||||||||
2016 | 2015 | 2014 | 2015 to 2016 | 2014 to 2015 | 2015 to 2016 | 2014 to 2015 | |||||||||||||||||||
Gross profit: | |||||||||||||||||||||||||
Software licenses and appliances | $ | 3,365 | $ | 6,507 | $ | 7,547 | $ | (3,142 | ) | $ | (1,040 | ) | (48 | )% | (14 | )% | |||||||||
Service | 15,957 | 10,448 | 4,502 | 5,509 | 5,946 | 53 | 132 | ||||||||||||||||||
Total gross profit | $ | 19,322 | $ | 16,955 | $ | 12,049 | $ | 2,367 | $ | 4,906 | 14 | % | 41 | % | |||||||||||
Gross margin: | |||||||||||||||||||||||||
Software licenses and appliances | 57.6 | % | 68.8 | % | 66.4 | % | (11.2 | )% | 2.4 | % | |||||||||||||||
Service | 61.7 | % | 41.8 | % | 29.7 | % | 19.9 | % | 12.1 | % | |||||||||||||||
Total gross margin | 61.0 | % | 49.2 | % | 45.4 | % | 11.8 | % | 3.8 | % | |||||||||||||||
For the years ended December 31, 2016, 2015 and 2014, gross margins are inclusive of the impact of approximately $1.3 million, $1.3 million and $0.7 million, respectively, in amortization expense associated with intangible assets acquired as a result of the acquisition of Qumu, Inc. in the fourth quarter of 2011 and Kulu Valley in the fourth quarter of 2014. The Company had 28, 43 and 49 service personnel at December 31, 2016, 2015 and 2014, respectively.
The 11.8% improvement in gross margin in 2016 compared to 2015 was primarily due to a 19.9% improvement in service gross margin primarily driven by improved economies of scale on increased service revenue and a reduction in headcount. Additionally, the year ended December 31, 2016 included severance expense of $116,000 relating to cost reduction initiatives. Service margin for the full year 2016 also benefited from the cost savings initiatives in the second half of 2015 and a 1.8% favorable impact in 2016 of $1.6 million of previously deferred service revenue contingent on a customer's acceptance, which was received in the fourth quarter 2016. Partially offsetting the improvement in service gross margin was a 11.2% decrease in software licenses and appliance gross margin due to the decrease in software licenses revenues.
The 3.8% improvement in gross margin in 2015 compared to 2014 was primarily due to a 12.1% improvement in service gross margin primarily driven by improved economies of scale on increased service revenue. Service margin also improved due to cost savings initiatives in the second half of 2015. The year ended December 31, 2015 included severance expense of $49,000 relating the cost reduction initiatives.
26
Future gross profit margins will fluctuate quarter to quarter and will be impacted by the rate of growth and mix of the Company's product and service offerings and foreign currency exchange rate fluctuations. Cost of software licenses and appliances revenues in 2017 are expected to include approximately $1.2 million of amortization expense for purchased intangibles.
Operating Expenses
The following is a summary of operating expenses:
Year Ended December 31, | Increase (Decrease) | Percent Increase (Decrease) | |||||||||||||||||||||||
2016 | 2015 | 2014 | 2015 to 2016 | 2014 to 2015 | 2015 to 2016 | 2014 to 2015 | |||||||||||||||||||
Operating expenses: | |||||||||||||||||||||||||
Research and development | $ | 8,541 | $ | 10,689 | $ | 9,506 | $ | (2,148 | ) | $ | 1,183 | (20 | )% | 12 | % | ||||||||||
Sales and marketing | 11,529 | 17,994 | 17,991 | (6,465 | ) | 3 | (36 | ) | — | ||||||||||||||||
General and administrative | 9,722 | 16,878 | 12,626 | (7,156 | ) | 4,252 | (42 | ) | 34 | ||||||||||||||||
Amortization of purchased intangibles | 891 | 798 | 652 | 93 | 146 | 12 | 22 | ||||||||||||||||||
Total operating expenses | $ | 30,683 | $ | 46,359 | $ | 40,775 | $ | (15,676 | ) | $ | 5,584 | (34 | )% | 14 | % | ||||||||||
Operating expenses for the year ended December 31, 2016 reflected cost savings initiatives in the second half of 2015 and into 2016 across all functional expense categories, with the exception of amortization of purchased intangibles. Operating expenses for the year ended December 31, 2016 included severance expense of $447,000 relating the cost reduction initiatives.
Operating expenses for the year ended December 31, 2015 included an equipment operating lease loss of $1.0 million, a loss relating to a third-party license agreement of $1.2 million, and severance expense of $2.1 million relating the cost reduction initiatives and executive transitions.
Research and development
Research and development expenses were as follows (dollars in thousands):
Year Ended December 31, | Increase (Decrease) | Percent Increase (Decrease) | |||||||||||||||||||||||
2016 | 2015 | 2014 | 2015 to 2016 | 2014 to 2015 | 2015 to 2016 | 2014 to 2015 | |||||||||||||||||||
Compensation and employee-related | $ | 6,238 | $ | 6,738 | $ | 5,762 | $ | (500 | ) | $ | 976 | (7 | )% | 17 | % | ||||||||||
Overhead and other expenses | 1,201 | 1,067 | 749 | 134 | 318 | 13 | 42 | ||||||||||||||||||
Outside services and consulting | 685 | 2,349 | 2,403 | (1,664 | ) | (54 | ) | (71 | ) | (2 | ) | ||||||||||||||
Depreciation and amortization | 210 | 273 | 349 | (63 | ) | (76 | ) | (23 | ) | (22 | ) | ||||||||||||||
Equity-based compensation | 207 | 262 | 243 | (55 | ) | 19 | (21 | ) | 8 | ||||||||||||||||
Total research and development expenses | $ | 8,541 | $ | 10,689 | $ | 9,506 | $ | (2,148 | ) | $ | 1,183 | (20 | )% | 12 | % | ||||||||||
Total research and development expenses for the years ended December 31, 2016, 2015 and 2014 represented 27%, 31% and 36% of revenues, respectively. The Company had 61, 57 and 61 research and development personnel at December 31, 2016, 2015 and 2014, respectively.
The decrease in expenses from 2015 to 2016 was driven primarily by less utilization of contractors in 2016 and lower employee costs due to fewer U.S. research and development personnel during 2016. The year ended December 31, 2016 included severance expense of $13,000 relating to cost reduction initiatives. The increase in expenses from 2014 to 2015 was driven primarily by increased employee costs through the addition of engineering employees from the acquisition of Kulu Valley in October 2014. The year ended December 31, 2015 included severance expense of $136,000 relating to cost reduction initiatives.
27
Sales and marketing
Sales and marketing expenses were as follows (dollars in thousands):
Year Ended December 31, | Increase (Decrease) | Percent Increase (Decrease) | |||||||||||||||||||||||
2016 | 2015 | 2014 | 2015 to 2016 | 2014 to 2015 | 2015 to 2016 | 2014 to 2015 | |||||||||||||||||||
Compensation and employee-related | $ | 9,175 | $ | 14,293 | $ | 14,487 | $ | (5,118 | ) | $ | (194 | ) | (36 | )% | (1 | )% | |||||||||
Overhead and other expenses | 1,172 | 1,691 | 921 | (519 | ) | 770 | (31 | ) | 84 | ||||||||||||||||
Outside services and consulting | 844 | 1,521 | 2,174 | (677 | ) | (653 | ) | (45 | ) | (30 | ) | ||||||||||||||
Depreciation and amortization | 128 | 130 | 135 | (2 | ) | (5 | ) | (2 | ) | (4 | ) | ||||||||||||||
Equity-based compensation | 210 | 359 | 274 | (149 | ) | 85 | (42 | ) | 31 | ||||||||||||||||
Total sales and marketing expenses | $ | 11,529 | $ | 17,994 | $ | 17,991 | $ | (6,465 | ) | $ | 3 | (36 | )% | — | % | ||||||||||
Total sales and marketing expenses for the years ended December 31, 2016, 2015 and 2014 represented 36%, 52% and 68% of revenues, respectively. The Company had 37, 61 and 81 sales and marketing personnel at December 31, 2016, 2015 and 2014, respectively.
The decrease in expenses from 2015 to 2016 was driven primarily by lower employee costs due to fewer sales and marketing personnel during 2016 and by less utilization of contractors in 2016. The year ended December 31, 2016 included severance expense of $356,000 relating to cost reduction initiatives. Expenses remained flat from 2014 to 2015, as the favorable impact of an expense reduction program implemented in the 2015 third quarter was offset by additional employee costs and the allocation of corporate overhead expense in connection with the Kulu Valley operations, which included a full year of expense in 2015 compared to one quarter of expense in 2014, and severance costs incurred in 2015. The year ended December 31, 2015 included severance expense of $550,000 relating the cost reduction initiatives.
General and administrative
General and administrative expenses were as follows (dollars in thousands):
Year Ended December 31, | Increase (Decrease) | Percent Increase (Decrease) | |||||||||||||||||||||||
2016 | 2015 | 2014 | 2015 to 2016 | 2014 to 2015 | 2015 to 2016 | 2014 to 2015 | |||||||||||||||||||
Compensation and employee-related | $ | 3,920 | $ | 7,522 | $ | 6,189 | $ | (3,602 | ) | $ | 1,333 | (48 | )% | 22 | % | ||||||||||
Overhead and other expenses | 1,708 | 3,607 | 1,261 | (1,899 | ) | 2,346 | (53 | ) | 186 | ||||||||||||||||
Outside services and consulting | 2,383 | 4,146 | 3,697 | (1,763 | ) | 449 | (43 | ) | 12 | ||||||||||||||||
Depreciation and amortization | 756 | 549 | 210 | 207 | 339 | 38 | 161 | ||||||||||||||||||
Equity-based compensation | 955 | 1,054 | 1,269 | (99 | ) | (215 | ) | (9 | ) | (17 | ) | ||||||||||||||
Total general and administrative expenses | $ | 9,722 | $ | 16,878 | $ | 12,626 | $ | (7,156 | ) | $ | 4,252 | (42 | )% | 34 | % | ||||||||||
Total general and administrative expenses for the years ended December 31, 2016, 2015 and 2014 represented 31%, 49% and 48% of revenues, respectively. The Company had 24, 31 and 31 general and administrative personnel at December 31, 2016, 2015 and 2014, respectively.
The decrease in expenses from 2015 to 2016 was partially driven by the realization in 2016 of expense reduction initiatives which included decreased contractor utilization and lower headcount. The year ended December 31, 2016 included severance expense of $78,000. Additionally, expenses incurred in 2015 that contributed to the decrease included an equipment operating lease loss of $1.0 million, a loss relating to a third-party license agreement of $1.2 million, and severance expense of $1.4 million relating the cost reduction and executive transition initiatives. Also driving the decrease were non-recurring audit, legal and outside service costs in 2015 associated with transition and reorganization activities resulting from the divestiture in 2014 of the Company's disc publishing business. These non-recurring costs in 2015 were also the primary driver of the dollar increase in expenses from 2014 to 2015.
Amortization of Purchased Intangibles
Operating expenses include $891,000, $798,000 and $652,000 in 2016, 2015 and 2014, respectively, for the amortization of intangible assets acquired as part of the Company’s acquisition of Qumu, Inc. in October 2011 and Kulu Valley in October 2014. Operating expenses in 2017 are expected to include approximately $0.9 million of amortization expense associated with purchased intangibles, exclusive of the portion classified in cost of revenue.
28
Other Income (Expense), Net
The Company recognized interest expense on its term loan and capital leases of $287,000 in 2016 and interest income on cash and marketable securities, net of interest expense on capital leases, of $7,000 and $60,000 in 2015 and 2014, respectively.
In conjunction with the debt financing completed in October 2016, the Company issued a warrant for the purchase of up to 314,286 shares of the Company's common stock, the entire portion of which remained unexercised and outstanding at December 31, 2016. The warrant contains a cash settlement feature upon the occurrence of a certain events, essentially the sale of the Company as defined in the warrant agreement. As a result of this feature, the warrant is subject to derivative accounting as prescribed under ASC 815. Accordingly, the fair value of the warrant on the date of issuance was recorded in the Company’s consolidated balance sheets as a liability. The fair value of the warrant liability is estimated at the end of each reporting period and the change in the fair value is recorded as a non-operating gain or loss in the Company’s consolidated statements of operations. During the year ended December 31, 2016, the Company recorded a non-cash gain from the change in fair value of the warrant liability of $137,000. The decrease in fair value was primarily driven by a decrease in the Company’s stock price, which had a corresponding impact to the valuation of the warrant liability.
Other income also included the net gains on foreign currency transactions of $162,000 in 2016 and net losses on foreign currency transactions of $131,000 and $201,000 in 2015 and 2014, respectively. See “Liquidity and Capital Resources” below for a discussion of changes in cash levels.
Income Taxes
The provision for income taxes represents federal, state, and foreign income taxes or income tax benefit on income or loss. For the years ended December 31, 2016, 2015 and 2014, net income tax benefit amounted to $252,000, $839,000 and $6.6 million, respectively.
Income tax benefit in 2016 and 2015 is primarily attributable to UK operations, which include refundable research credits. Income tax benefit in 2014 primarily reflects the realization of income tax benefits on losses from continuing operations as a result of income generated from discontinued operations, including the gain on sale of the disc publishing business recognized in the third quarter of 2014.
Net Income from Discontinued Operations, Net of Tax
The Company closed the sale of its disc publishing business effective July 1, 2014. As a result, net income from discontinued operations includes the financial results of the Company’s disc publishing business through June 30, 2014. Included in net income from discontinued operations for the third quarter of 2014 is the recognition of a gain on sale of the disc publishing business of $16.2 million. This amount excludes the impact of transaction related expenses which were primarily incurred and recognized prior to the third quarter of 2014. Discontinued operations results also include non-recurring expenses incurred by the Company as a result of the sale of the disc publishing business. These expenses included third-party transaction specific costs, one-time income tax related impacts and the acceleration of vesting of cash-based long-term incentive and stock-based awards payable to employees of the disc publishing business upon completion of the asset sale transaction. Non-recurring expenses and income tax related impacts amounted to approximately $9.6 million for the year ended December 31, 2014.
29
Liquidity and Capital Resources
The following table sets forth certain relevant measures of the Company's liquidity and capital resources (in thousands):
December 31, | |||||||
2016 | 2015 | ||||||
Cash and cash equivalents | $ | 10,364 | $ | 7,072 | |||
Marketable securities | — | 6,249 | |||||
Cash, cash equivalents and marketable securities | $ | 10,364 | $ | 13,321 | |||
Working capital | $ | 5,215 | $ | 9,516 | |||
Financing obligations | $ | 678 | $ | 1,021 | |||
Term loan | 6,617 | — | |||||
Financing obligations and term loan | $ | 7,295 | $ | 1,021 | |||
The Company expects it will be able to maintain current operations and anticipated capital expenditure requirements for at least the next 12 months through its cash reserves, which includes the proceeds of the debt financing completed in the fourth quarter of 2016, as well as any cash flows that may be generated from current operations. Based on expected revenue growth and continued management of expenses to scale with revenue, the Company expects that it will be cash flow breakeven for the second half of 2017. If the Company is unable to meet its revenue growth expectations, it is positioned to further reduce costs to mitigate the impact on its cash reserves for at least the next 12 months.
At December 31, 2016, the Company had aggregate working capital of $5.2 million, down $4.3 million from working capital of $9.5 million at December 31, 2015. The primary contributors to the decrease in working capital were the generation of a net loss adjusted for non-cash items during the year ended December 31, 2016 of $6.7 million, purchases of property and equipment of $76,000 and principal payments on capital lease obligations of $513,000, which were partially offset by net proceeds from the debt financing completed in October 2016 of $7.5 million.
Financing obligations consist of capital leases related to the acquisition of computer and network equipment and furniture and other financing obligations. The term loan consists of a three-year note having a face value of $8.0 million, due in full at maturity on October 21, 2019.
Apart from proceeds from the term loan received in the fourth quarter of 2016, the Company's primary source of cash from operating activities has been cash collections from sales of products and services to customers. The Company expects cash inflows from operating activities to be affected by increases or decreases in sales and timing of collections. The Company's primary use of cash for operating activities has been for personnel costs, payment of royalties associated with third-party software licenses and purchases of equipment to fulfill customer orders. The Company expects cash flows from operating activities to be affected by fluctuations in revenues, personnel costs and the amount and timing of royalty payments and equipment purchases as the Company continues to support the growth of the business. The amount of cash and cash equivalents held by the Company's international subsidiaries that is not available to fund domestic operations unless repatriated was $1.4 million as of December 31, 2016. The repatriation of cash and cash equivalents held by the Company's international subsidiaries would not result in an adverse tax impact on cash due to the Company's net operating loss position with respect to income taxes.
Summary of Credit Agreement and Warrant
On October 21, 2016, the Company and its wholly-owned subsidiary, Qumu, Inc., entered into a term loan credit agreement (the “credit agreement”) with HCP-FVD, LLC as lender and Hale Capital Partners, LP as administrative agent (the “Administrative Agent”). HCP-FVD, LLC is an affiliate of Hale Capital Partners, LP.
Pursuant to the credit agreement, the Company borrowed $8.0 million as a term loan on October 21, 2016. The term loan is scheduled to mature on October 21, 2019, requires payment of interest monthly at the prime rate plus 6.0%. As of December 31, 2016, interest was payable at 9.75%.
The Company may prepay the term loan at any time with the payment of the applicable pre-payment fee. The Company is obligated to prepay the term loan, with the payment of the applicable pre-payment fee, with the net proceeds from certain dispositions (other than its interest in BriefCam, Ltd.), issuances of equity or debt securities, extraordinary transactions and upon a change of control.
The credit agreement contains affirmative and negative covenants and requirements relating to the Company and its operations. The affirmative covenants require, among other things, that the Company deliver to the Administrative Agent financial statements, annual operating plan, updated schedules, various reports, compliance certificates and other financial, bank account
30
and accounts receivable information. There are also affirmative covenants relating to access to collateral and the Company's books and records, insurance, compliance with laws, payment of taxes, maintenance of existence, employee benefit plans, maintenance of accounts, and environmental matters. The negative covenants prohibit the Company from incurring debt, encumbering its assets, exceeding operating lease expense amounts, making dividends, distributions or payments on the Company's capital stock, being a party to any acquisition or any merger or consolidation or similar transaction, modifying its organizational documents, entering into certain transactions with affiliates, making certain transfers to or conducting certain business through foreign subsidiaries, and incentivizing accelerated customer payments. The negative covenants of the credit agreement also require the Company to meet various financial covenants relating to a maximum cumulative net cash operating amount, minimum eligible accounts receivable and cash, minimum cash, minimum core bookings, maximum deferred revenue non-current, minimum subscription, and maintenance and support revenue until the quarter ended September 30, 2017 and after the quarter ended September 30, 2017, minimum subscription and maintenance and support dollar renewal rates. The Company was in compliance with all its covenants as of December 31, 2016.
Upon certain events of default relating to bankruptcy or insolvency, as defined in the credit agreement, the obligations will become immediately due and payable. Upon other events of default – including those relating to non-payment of the term loan obligations, non-payment of other debt, default of other material obligations, non-compliance with loan covenants, breach of representations or warranties, certain pension plan events, certain judgments, invalidity of collateral documents, termination of the Company's reporting obligations to the Securities and Exchange Commission or failure to be listed on any national stock exchange, material adverse effect or cessation of business – the Administrative Agent may declare all or any part of the obligations under the credit agreement to be due and payable.
Pursuant to the credit agreement, for so long as any obligations are outstanding, Hale Capital Partners, LP has the right to appoint and remove one observer to the Company's Board of Directors. The initial board observer appointed by Hale Capital Partners, LP is Martin Hale, Jr.
In connection with the credit agreement, the Company granted a first priority security interest in substantially all of the Company's properties, rights and assets and Qumu, Inc. provided a guaranty of the Company's obligations under the credit agreement pursuant to a guaranty and collateral agreement dated October 21, 2016 in favor of the Administrative Agent. As part of the security granted by the guaranty and collateral agreement, the Company pledged to the Administrative Agent all of the Company's shares in Qumu, Inc. Pursuant to a charge over shares by deed by Qumu Corporation as Chargor and the Administrative Agent, the Company pledged to the Administrative Agent 65% of the Company's shares in Qumu UK Holdings Ltd.
In connection with the credit agreement, on October 21, 2016, the Company issued to HCP-FVD, LLC a warrant to purchase 314,286 shares of the Company's common stock. The warrant has an exercise price of $2.80 per share, an expiration date of October 21, 2026, and is transferable. Upon a “Fundamental Transaction,” essentially the sale of the Company as defined in the warrant agreement, the warrant holder has the right thereafter to receive, upon exercise of the warrant, the same amount and kind of securities, cash or property as it would have been entitled to receive upon the occurrence of such Fundamental Transaction if the holder had been, immediately prior to such Fundamental Transaction, the holder of the number of common shares then issuable upon such exercise of the warrant. Alternatively, the holder may require us to purchase the warrant from the holder thereof for a cash amount equal to the greater of the Original Issuance Value ($915,389) in respect of the remaining unexercised portion of the warrant and the Black-Scholes value of the remaining unexercised portion of the warrant through the date of consummation of the Fundamental Transaction. Pursuant to the terms of the warrant, the Company filed and caused to be effective a registration statement to register the resale of the shares of common stock underlying the warrant.
See Item 9B. Other Information – Amendment No. 1 to Credit Agreement for a summary of the amendments to the credit agreement effective March 31, 2017.
Summary of Cash Flows. A summary of cash flows is as follows (in thousands):
Year Ended December 31, | |||||||||||
2016 | 2015 | 2014 | |||||||||
Cash flows from (used in): | |||||||||||
Operating activities | $ | (9,484 | ) | $ | (23,227 | ) | $ | (22,644 | ) | ||
Investing activities | 6,174 | 18,923 | (3,180 | ) | |||||||
Financing activities | 6,956 | (228 | ) | 35 | |||||||
Effect of exchange rate changes on cash | (354 | ) | (80 | ) | (252 | ) | |||||
Net change in cash and cash equivalents | $ | 3,292 | $ | (4,612 | ) | $ | (26,041 | ) | |||
Net change in marketable securities and restricted cash | $ | (6,249 | ) | $ | (19,537 | ) | $ | 12,553 | |||
31
Operating activities
Net cash used in operating activities was $9.5 million for 2016 compared to $23.2 million for 2015.
The change in operating cash flows for the 2016 period as compared to the 2015 period was favorably impacted by the change in receivables, as well as a lower net loss for the year ended December 31, 2016 compared to 2015. The change in operating cash flows for the 2016 period as compared to the 2015 period was unfavorably impacted by the changes in accounts payable and other accrued liabilities, accrued compensation, and deferred revenue balances, which decreased during the year ended December 31, 2016, driven by the timing of sales and maintenance renewals, and the timing of delivery of products and services as impacted by the appropriate revenue recognition criteria. Additionally, the change in cash used in operating activities for the year ended December 31, 2016 as compared to the 2015 period was impacted by a $715,000 unfavorable change in cash from discontinued operations in connection with the Company's sale of its discontinued disc publishing business effective July 1, 2014.
Investing activities
Net cash provided by investing activities totaled, in the aggregate, $6.2 million for 2016 compared to net cash provided of $18.9 million in 2015. Primarily driving the generation of cash in 2016 were maturities of marketable securities of $6.3 million, partially offset by purchases of property and equipment of $76,000. The $18.9 million cash provided by investing activities in 2015 resulted from maturities of marketable securities, net of related purchases, of $17.2 million, the Company's receipt of escrowed proceeds from the sale of the disc publishing business of $2.3 million, and purchases of property and equipment of $635,000.
Financing activities
Financing activities provided net cash of $7.0 million during 2016, primarily from net proceeds from the debt financing of $7.5 million, offset in part by cash used for payments on financing obligations of $513,000. Financing activities used $228,000 of cash in the comparable period in 2015, primarily consisting of cash used for payments on financing obligations.
Since October 2010, the Company’s Board of Directors has approved common stock repurchases of up to 3,500,000 shares. Shares may be purchased at prevailing market prices in the open market or in private transactions, subject to market conditions, share price, trading volume and other factors. The repurchase program has been funded to date using cash on hand and may be discontinued at any time. The Company did not repurchase any shares of its common stock under the repurchase program during the years ended December 31, 2016, 2015 and 2014. As of December 31, 2016, the Company had 778,365 shares available for repurchase under the authorizations. While the current authorization remains in effect, the Company expects its primary use of cash will be to fund operations in support of the Company’s goals for revenue growth and operating margin improvement. Under the credit agreement, the Company is prohibited from repurchasing or redeeming its stock, subject to certain exceptions for relating to the exercise or vesting of equity awards.
The Company did not declare or pay any dividends during the years ended December 31, 2016, 2015 and 2014. Under the credit agreement, the Company is prohibited from declaring or paying any dividends.
Contractual Obligations. The following table summarizes the Company's contractual cash obligations at December 31, 2016, and the net effect such obligations are expected to have on liquidity and cash flow in future periods. Some of the amounts included in this table are based on management's estimates and assumptions about these obligations, including their duration, the possibility of renewal, anticipated actions by third parties and other factors. Because these estimates and assumptions are necessarily subjective, the amounts the Company will actually pay in future periods may vary from those reflected in the table.
(In thousands) | Payments Due by Period | ||||||||||||||||||||||||||
Contractual Obligations | 2017 | 2018 | 2019 | 2020 | 2021 | Thereafter | Total | ||||||||||||||||||||
Term loan(1) | $ | 791 | $ | 791 | $ | 8,637 | $ | — | $ | — | $ | — | $ | 10,219 | |||||||||||||
Operating leases | 1,185 | 978 | 522 | 298 | 300 | 332 | 3,615 | ||||||||||||||||||||
Capital leases and other financing obligations (1) | 545 | 171 | 3 | — | — | — | 719 | ||||||||||||||||||||
Purchase obligations(2) | 734 | 128 | — | — | — | — | 862 | ||||||||||||||||||||
Income tax liabilities under ASC 740 (3) | — | — | — | — | — | — | — | ||||||||||||||||||||
Total contractual cash obligations | $ | 3,255 | $ | 2,068 | $ | 9,162 | $ | 298 | $ | 300 | $ | 332 | $ | 15,415 | |||||||||||||
_________________________________________________
(1) | Amounts include principal and interest. |
32
(2) | Purchase obligations include all commitments to purchase goods or services that meet one or both of the following criteria: (1) they are non-cancelable or (2) the Company must make specified minimum payments even if it does not take delivery of the contracted products or services. If the obligation is non-cancelable, the entire value of the contract is included in the table. |
(3) | The Company does not currently expect any income tax liabilities accrued under ASC 740 as of December 31, 2016 to be paid to the applicable tax authorities in 2017. The full balance of unrecognized tax benefits under ASC 740 of $1.0 million at December 31, 2016, has been excluded from the above table as the period of payment or reversal cannot be reasonably estimated. This amount is before reduction for deferred federal benefits of uncertain tax positions and also excludes potential interest and penalties. |
New Accounting Pronouncements
In May 2014, the FASB issued ASU 2014-09, Revenue from Contracts with Customers, which requires an entity to recognize the amount of revenue to which it expects to be entitled for the transfer of promised goods or services to customers. The ASU will replace most existing revenue recognition guidance in U.S. GAAP when it becomes effective. In July 2015, the FASB voted to amend ASU 2014-09 by approving a one-year deferral of the effective date as well as providing the option to early adopt the standard on the original effective date. The new standard is effective for the Company on January 1, 2018 but may be early adopted effective January 1, 2017.
The new revenue standard may be applied using either of the following transition methods: a full retrospective approach reflecting the application of the standard in each prior reporting period with the option to elect certain practical expedients, or a modified retrospective approach with the cumulative effect of initially adopting the standard recognized at the date of adoption (which includes additional footnote disclosures). The Company will adopt the standard in the first quarter of 2018 and preliminarily expects to use the modified retrospective method. However, the Company is continuing to evaluate the impact of the standard, and its adoption method is subject to change.
Currently, the Company is in the process of reviewing its historical contracts to quantify the impact that the adoption of the standard will have on specific performance obligations. The Company is also continuing to evaluate the impact of the standard on its recognition of costs related to obtaining customer contracts (namely, sales commissions). While the Company continues to assess all potential impacts of this new standard, it currently believes the most significant impacts relate to the accounting for the timing of revenue recognition of subscription, or term-based, software license arrangements. Specifically, under the new standard:
• | Software revenue associated with non-cancellable subscription or, term-based, software license arrangements will generally be recognized upon delivery of the license. Historically, these arrangements have been material, and the Company currently recognizes this revenue ratably over the term of the software license; and |
• | The Company expects that the accounting for software revenue derived from perpetual based licensing arrangements and associated services revenues will not be materially impacted. |
The adoption of the standard will require the implementation of new accounting processes, which will change the Company's internal controls over revenue recognition, contract acquisition costs and financial reporting. The Company is designing and implementing these controls in anticipation of adopting the new standard January 1, 2018.
Information regarding other new accounting pronouncements for which the Company does not expect the adoption to have a material impact to the consolidated financial statements and related disclosures, or for which the impact of adoption is currently being evaluated, is included in Note 1 to the Consolidated Financial Statements.
ITEM 7A. QUANTITATIVE AND QUALITATIVE DISCLOSURES ABOUT MARKET RISK
Foreign Currency Translation. As of December 31, 2016, the Company is exposed to market risk primarily from foreign exchange rate fluctuations of the British Pound Sterling, Japanese Yen and Singapore Dollar to the U.S. Dollar as the financial position and operating results of the Company’s foreign subsidiaries are translated into U.S. dollars for consolidation. Resulting translation adjustments are recorded as a separate component of stockholders’ equity.
Interest Rates. The Company's term loan requires payment of interest monthly at the prime rate plus 6% and changes in interest rates would impact the Company's monthly interest payment and cash reserves.
33
ITEM 8. FINANCIAL STATEMENTS AND SUPPLEMENTARY DATA
Financial Statements
Page in Annual Report on Form 10-K For Year Ended December 31, 2016 | |
34
Report of Independent Registered Public Accounting Firm
The Board of Directors and Stockholders
Qumu Corporation:
We have audited the accompanying consolidated balance sheets of Qumu Corporation and subsidiaries as of December 31, 2016 and 2015, and the related consolidated statements of operations, comprehensive income (loss), stockholders’ equity, and cash flows for each of the years in the three-year period ended December 31, 2016. These consolidated financial statements are the responsibility of the Company’s management. Our responsibility is to express an opinion on these consolidated financial statements based on our audits.
We conducted our audits in accordance with the standards of the Public Company Accounting Oversight Board (United States). Those standards require that we plan and perform the audit to obtain reasonable assurance about whether the financial statements are free of material misstatement. An audit includes examining, on a test basis, evidence supporting the amounts and disclosures in the financial statements. An audit also includes assessing the accounting principles used and significant estimates made by management, as well as evaluating the overall financial statement presentation. We believe that our audits provide a reasonable basis for our opinion.
In our opinion, the consolidated financial statements referred to above present fairly, in all material respects, the financial position of Qumu Corporation and subsidiaries as of December 31, 2016 and 2015 and the results of their operations and their cash flows for each of the years in the three-year period ended December 31, 2016, in conformity with U.S. generally accepted accounting principles.
/s/ KPMG LLP
Minneapolis, Minnesota
March 31, 2017
35
QUMU CORPORATION AND SUBSIDIARIES
Consolidated Balance Sheets
(In thousands, except share data)
December 31, | |||||||
2016 | 2015 | ||||||
Assets | |||||||
Current assets: | |||||||
Cash and cash equivalents | $ | 10,364 | $ | 7,072 | |||
Marketable securities | — | 6,249 | |||||
Receivables, net | 7,495 | 11,257 | |||||
Income tax receivable | 317 | 659 | |||||
Prepaid expenses and other current assets | 2,470 | 3,392 | |||||
Total current assets | 20,646 | 28,629 | |||||
Property and equipment, net | 1,827 | 2,942 | |||||
Intangible assets, net | 8,110 | 11,032 | |||||
Goodwill | 6,749 | 8,103 | |||||
Deferred income taxes, non-current | 70 | 57 | |||||
Other assets, non-current | 4,827 | 3,649 | |||||
Total assets | $ | 42,229 | $ | 54,412 | |||
Liabilities and Stockholders’ Equity | |||||||
Current liabilities: | |||||||
Accounts payable and other accrued liabilities | $ | 2,394 | $ | 3,864 | |||
Accrued compensation | 2,361 | 4,014 | |||||
Deferred revenue | 8,992 | 10,413 | |||||
Deferred rent | 283 | 270 | |||||
Financing obligations | 508 | 502 | |||||
Warrant liability | 893 | — | |||||
Current liabilities from discontinued operations | — | 50 | |||||
Total current liabilities | 15,431 | 19,113 | |||||
Long-term liabilities: | |||||||
Deferred revenue, non-current | 423 | 2,215 | |||||
Income taxes payable, non-current | 6 | 9 | |||||
Deferred tax liability, non-current | 294 | 575 | |||||
Deferred rent, non-current | 712 | 998 | |||||
Financing obligations, non-current | 170 | 519 | |||||
Term loan, non-current | 6,617 | — | |||||
Other non-current liabilities | — | 226 | |||||
Total long-term liabilities | 8,222 | 4,542 | |||||
Total liabilities | 23,653 | 23,655 | |||||
Commitments and contingencies (Note 7) | |||||||
Stockholders’ equity: | |||||||
Preferred stock, $0.01 par value, authorized 250,000 shares, no shares issued and outstanding | — | — | |||||
Common stock, $0.01 par value, authorized 29,750,000 shares, issued and outstanding 9,227,247 and 9,188,682, respectively | 92 | 92 | |||||
Additional paid-in capital | 66,864 | 65,484 | |||||
Accumulated deficit | (44,473 | ) | (33,298 | ) | |||
Accumulated other comprehensive loss | (3,907 | ) | (1,521 | ) | |||
Total stockholders’ equity | 18,576 | 30,757 | |||||
Total liabilities and stockholders’ equity | $ | 42,229 | $ | 54,412 | |||
See accompanying notes to consolidated financial statements.
36
QUMU CORPORATION AND SUBSIDIARIES
Consolidated Statements of Operations
(In thousands, except per share data)
Year Ended December 31, | |||||||||||
2016 | 2015 | 2014 | |||||||||
Revenues: | |||||||||||
Software licenses and appliances | $ | 5,839 | $ | 9,456 | $ | 11,363 | |||||
Service | 25,843 | 24,998 | 15,158 | ||||||||
Total revenues | 31,682 | 34,454 | 26,521 | ||||||||
Cost of revenues: | |||||||||||
Software licenses and appliances | 2,474 | 2,949 | 3,816 | ||||||||
Service | 9,886 | 14,550 | 10,656 | ||||||||
Total cost of revenues | 12,360 | 17,499 | 14,472 | ||||||||
Gross profit | 19,322 | 16,955 | 12,049 | ||||||||
Operating expenses: | |||||||||||
Research and development | 8,541 | 10,689 | 9,506 | ||||||||
Sales and marketing | 11,529 | 17,994 | 17,991 | ||||||||
General and administrative | 9,722 | 16,878 | 12,626 | ||||||||
Amortization of purchased intangibles | 891 | 798 | 652 | ||||||||
Total operating expenses | 30,683 | 46,359 | 40,775 | ||||||||
Operating loss | (11,361 | ) | (29,404 | ) | (28,726 | ) | |||||
Other income (expense): | |||||||||||
Interest income (expense), net | (287 | ) | 7 | 60 | |||||||
Change in fair value of warrant liability | 137 | — | — | ||||||||
Other, net | 84 | (131 | ) | (241 | ) | ||||||
Total other expense, net | (66 | ) | (124 | ) | (181 | ) | |||||
Loss before income taxes | (11,427 | ) | (29,528 | ) | (28,907 | ) | |||||
Income tax benefit | (252 | ) | (839 | ) | (6,564 | ) | |||||
Net loss from continuing operations | (11,175 | ) | (28,689 | ) | (22,343 | ) | |||||
Net income (loss) from discontinued operations, net of tax | — | (10 | ) | 13,823 | |||||||
Net loss | $ | (11,175 | ) | $ | (28,699 | ) | $ | (8,520 | ) | ||
Net income (loss) per share – basic: | |||||||||||
Net loss from continuing operations per share – basic | $ | (1.21 | ) | $ | (3.11 | ) | $ | (2.53 | ) | ||
Net income (loss) from discontinued operations per share – basic | — | — | 1.57 | ||||||||
Net loss per share – basic | $ | (1.21 | ) | $ | (3.11 | ) | $ | (0.96 | ) | ||
Basic weighted average shares outstanding | 9,232 | 9,235 | 8,836 | ||||||||
Net income (loss) per share – diluted: | |||||||||||
Net loss from continuing operations per share – diluted | $ | (1.23 | ) | $ | (3.11 | ) | $ | (2.53 | ) | ||
Net income (loss) from discontinued operations per share – diluted | — | — | 1.57 | ||||||||
Net loss per share – diluted | $ | (1.23 | ) | $ | (3.11 | ) | $ | (0.96 | ) | ||
Diluted weighted average shares outstanding | 9,232 | 9,235 | 8,836 | ||||||||
See accompanying notes to consolidated financial statements.
37
QUMU CORPORATION AND SUBSIDIARIES
Consolidated Statements of Comprehensive Income (Loss)
(In thousands)
Year Ended December 31, | |||||||||||
2016 | 2015 | 2014 | |||||||||
Net loss | $ | (11,175 | ) | $ | (28,699 | ) | $ | (8,520 | ) | ||
Other comprehensive income (loss): | |||||||||||
Net change in foreign currency translation adjustments | (2,387 | ) | (749 | ) | (856 | ) | |||||
Change in net unrealized gain (loss) on marketable securities, net of tax | 1 | 13 | 5 | ||||||||
Total other comprehensive loss | (2,386 | ) | (736 | ) | (851 | ) | |||||
Total comprehensive loss | $ | (13,561 | ) | $ | (29,435 | ) | $ | (9,371 | ) | ||
See accompanying notes to consolidated financial statements.
38
QUMU CORPORATION AND SUBSIDIARIES
Consolidated Statements of Stockholders’ Equity
(In thousands)
Common Stock | Additional Paid-in Capital | Retained Earnings (Accum Deficit) | Accumulated Other Comprehensive Income (Loss) | Total | ||||||||||||||||||
Shares | Amount | |||||||||||||||||||||
Balance at December 31, 2013 | 8,674 | $ | 87 | $ | 58,411 | $ | 3,921 | $ | 162 | $ | 62,581 | |||||||||||
Net loss | — | — | — | (8,520 | ) | — | (8,520 | ) | ||||||||||||||
Other comprehensive loss, net of taxes | — | — | — | — | (851 | ) | (851 | ) | ||||||||||||||
Issuance of restricted stock | 156 | 1 | (1 | ) | — | — | — | |||||||||||||||
Stock issued in stock option exercise | 86 | 1 | 192 | — | — | 193 | ||||||||||||||||
Redemption of stock to cover tax withholding for employee stock plans | (64 | ) | (1 | ) | (98 | ) | — | — | (99 | ) | ||||||||||||
Net tax reductions relating to exercise and expiration of stock options | — | — | (8 | ) | — | — | (8 | ) | ||||||||||||||
Stock-based compensation | — | — | 2,039 | — | — | 2,039 | ||||||||||||||||
Foreign currency translation transfer related to the sale of foreign operations | — | — | — | — | (96 | ) | (96 | ) | ||||||||||||||
Shares issued for acquisition | 275 | 3 | 3,031 | — | — | 3,034 | ||||||||||||||||
Balance at December 31, 2014 | 9,127 | $ | 91 | $ | 63,566 | $ | (4,599 | ) | $ | (785 | ) | $ | 58,273 | |||||||||
Net loss | — | — | — | (28,699 | ) | — | (28,699 | ) | ||||||||||||||
Other comprehensive loss, net of taxes | — | — | — | — | (736 | ) | (736 | ) | ||||||||||||||
Issuance of restricted stock | 48 | 1 | (1 | ) | — | — | — | |||||||||||||||
Stock issued in stock option exercise | 20 | — | 142 | — | — | 142 | ||||||||||||||||
Redemption of stock to cover tax withholding for employee stock plans | (6 | ) | — | (50 | ) | — | — | (50 | ) | |||||||||||||
Net tax reductions relating to exercise and expiration of stock options | — | — | (7 | ) | — | — | (7 | ) | ||||||||||||||
Stock-based compensation | — | — | 1,834 | — | — | 1,834 | ||||||||||||||||
Balance at December 31, 2015 | 9,189 | $ | 92 | $ | 65,484 | $ | (33,298 | ) | $ | (1,521 | ) | $ | 30,757 | |||||||||
Net loss | — | — | — | (11,175 | ) | — | (11,175 | ) | ||||||||||||||
Other comprehensive loss, net of taxes | — | — | — | — | (2,386 | ) | (2,386 | ) | ||||||||||||||
Issuance of restricted stock | 45 | — | — | — | — | — | ||||||||||||||||
Redemption of stock to cover tax withholding for employee stock plans | (7 | ) | — | (26 | ) | — | — | (26 | ) | |||||||||||||
Net tax reductions relating to exercise and expiration of stock options | — | — | (15 | ) | — | — | (15 | ) | ||||||||||||||
Stock-based compensation | — | — | 1,421 | — | — | 1,421 | ||||||||||||||||
Balance at December 31, 2016 | 9,227 | $ | 92 | $ | 66,864 | $ | (44,473 | ) | $ | (3,907 | ) | $ | 18,576 | |||||||||
See accompanying notes to consolidated financial statements.
39
QUMU CORPORATION AND SUBSIDIARIES
Consolidated Statements of Cash Flows
(In thousands)
Year Ended December 31, | |||||||||||
2016 | 2015 | 2014 | |||||||||
Operating activities: | |||||||||||
Net loss | $ | (11,175 | ) | $ | (28,699 | ) | $ | (8,520 | ) | ||
Net income (loss) from discontinued operations, net of tax | — | (10 | ) | 13,823 | |||||||
Net loss from continuing operations | (11,175 | ) | (28,689 | ) | (22,343 | ) | |||||
Adjustments to reconcile net loss to net cash used in continuing operating activities: | |||||||||||
Depreciation and amortization | 3,303 | 3,118 | 2,049 | ||||||||
Stock-based compensation | 1,421 | 1,834 | 1,841 | ||||||||
Accretion of debt discount and issuance costs | 152 | — | — | ||||||||
Loss on disposal of property and equipment | 4 | 108 | 102 | ||||||||
Change in fair value of warrant liability | (137 | ) | — | — | |||||||
Deferred income taxes | (229 | ) | (564 | ) | (126 | ) | |||||
Current income tax benefit resulting from income generated from discontinued operations | — | — | (6,337 | ) | |||||||
Changes in operating assets and liabilities: | |||||||||||
Receivables | 3,244 | (1,331 | ) | (5,679 | ) | ||||||
Income taxes receivable / payable | 266 | (378 | ) | 1,068 | |||||||
Prepaid expenses and other assets | (138 | ) | 748 | (2,032 | ) | ||||||
Accounts payable and other accrued liabilities | (1,406 | ) | 443 | 1,189 | |||||||
Accrued compensation | (1,575 | ) | (2,184 | ) | 686 | ||||||
Deferred revenue | (2,673 | ) | 2,729 | 5,499 | |||||||
Deferred rent | (265 | ) | 48 | (105 | ) | ||||||
Other non-current liabilities | (226 | ) | 226 | — | |||||||
Net cash used in continuing operating activities | (9,434 | ) | (23,892 | ) | (24,188 | ) | |||||
Net cash provided by (used in) discontinued operating activities | (50 | ) | 665 | 1,544 | |||||||
Net cash used in operating activities | (9,484 | ) | (23,227 | ) | (22,644 | ) | |||||
Investing activities: | |||||||||||
Sales and maturities of marketable securities | 6,250 | 27,465 | 23,250 | ||||||||
Purchases of marketable securities | — | (10,250 | ) | (33,499 | ) | ||||||
Purchases of property and equipment | (76 | ) | (635 | ) | (1,051 | ) | |||||
Proceeds from sale of property and equipment | — | 43 | — | ||||||||
Cash paid for acquisition of business, net of cash acquired | — | — | (11,556 | ) | |||||||
Net cash provided by (used in) continuing investing activities | 6,174 | 16,623 | (22,856 | ) | |||||||
Net cash provided by discontinued investing activities, including proceeds from sale of business | — | 2,300 | 19,676 | ||||||||
Net cash provided by (used in) investing activities | 6,174 | 18,923 | (3,180 | ) | |||||||
Financing activities: | |||||||||||
Proceeds from term loan and warrant issuance | 8,000 | — | — | ||||||||
Payments for term loan and warrant issuance costs | (505 | ) | — | — | |||||||
Principal payments on capital lease obligations | (513 | ) | (320 | ) | — | ||||||
Common stock repurchases to settle employee withholding liability | (26 | ) | (50 | ) | (99 | ) | |||||
Proceeds from employee stock plans | — | 142 | 193 | ||||||||
Net cash provided by (used in) continuing financing activities | 6,956 | (228 | ) | 94 | |||||||
Net cash used in discontinued financing activities | — | — | (59 | ) | |||||||
Net cash provided by (used in) financing activities | 6,956 | (228 | ) | 35 | |||||||
Effect of exchange rate changes on cash | (354 | ) | (80 | ) | (252 | ) | |||||
Net increase (decrease) in cash and cash equivalents | 3,292 | (4,612 | ) | (26,041 | ) | ||||||
Cash and cash equivalents, beginning of year | 7,072 | 11,684 | 37,725 | ||||||||
Cash and cash equivalents, end of year | $ | 10,364 | $ | 7,072 | $ | 11,684 | |||||
See accompanying notes to consolidated financial statements.
40
QUMU CORPORATION AND SUBSIDIARIES
Consolidated Statements of Cash Flows
Supplemental Cash Flow Disclosures
(In thousands)
Years Ended December 31, | |||||||||||
2016 | 2015 | 2014 | |||||||||
Supplemental disclosures of net cash paid (received) during the year: | |||||||||||
Income taxes | $ | 22 | $ | (22 | ) | $ | (1,145 | ) | |||
Interest | $ | 211 | $ | 33 | $ | — | |||||
Non-cash investing and financing activities: | |||||||||||
Financing obligations related to prepaid expenses and other assets | $ | 182 | $ | 402 | $ | — | |||||
Financing obligations related to property and equipment | $ | — | $ | 927 | $ | — | |||||
Accrued liabilities and other non-current liabilities related to leasehold improvements | $ | — | $ | 689 | $ | — | |||||
Stock issued for acquisition of business | $ | — | $ | — | $ | 3,034 | |||||
Proceeds from sale of business held in escrow | $ | — | $ | — | $ | 2,300 | |||||
See accompanying notes to consolidated financial statements.
41
QUMU CORPORATION AND SUBSIDIARIES
NOTES TO CONSOLIDATED FINANCIAL STATEMENTS
1) Nature of Business and Summary of Significant Accounting Policies
Nature of Business
Qumu Corporation (the "Company") provides the software applications businesses use to create, manage, secure, deliver and measure the success of their videos. The Company's innovative solutions release the power in video to engage and empower employees, partners and clients, allowing organizations around the world to realize the greatest possible value from video they create and publish. Whatever the audience size, viewer device or network configuration, the Company's solutions are how business does video.
The Company views its operations and manages its business as one segment and one reporting unit. Factors used to identify the Company's single operating segment and reporting unit include the financial information available for evaluation by the chief operating decision maker in making decisions about how to allocate resources and assess performance. The Company manages the marketing of its products and services through regional sales representatives and independent distributors in the United States and international markets.
The Company previously conducted its operations through two businesses consisting of 1) its enterprise video content management software business and 2) its disc publishing business. As further described in Note 2, on June 27, 2014, the Company's shareholders approved the sale of the disc publishing assets and on July 1, 2014, the sale was completed. As a result, effective June 27, 2014, the disc publishing business was classified as held for sale and qualified for presentation as discontinued operations effective with the reporting of the Company's financial results for the second quarter of 2014. Accordingly, effective June 27, 2014, the Company had one remaining reportable segment, the enterprise video content management software business. The operational results of the disc publishing business are presented in the “Net income from discontinued operations, net of tax” line item on the consolidated statements of operations. All remaining amounts presented in the accompanying consolidated financial statements and notes reflect the financial results and financial position of the Company's continuing enterprise video content management software business, other than consolidated amounts reflecting operating results and balances for both the continuing and discontinued operations.
Principles of Consolidation
The consolidated financial statements include the accounts of the Company and its wholly-owned subsidiaries. All intercompany accounts and transactions have been eliminated.
Use of Estimates
The preparation of financial statements in conformity with accounting principles generally accepted in the United States of America requires management to make estimates and assumptions that affect the reported amounts of assets and liabilities and disclosure of contingent assets and liabilities at the date of the financial statements and the reported amounts of revenues and expenses during the reporting period. Actual results could differ from those estimates.
Liquidity
The Company has experienced recurring operating losses and negative cash flows from operating activities, and was unable to project future compliance with certain covenants in its credit agreement under certain financial scenarios. If the Company is not able to maintain compliance with its covenants that results in an Event of Default, the lender may accelerate the repayment of outstanding principal, which could negatively impact the Company’s ability to fund its working capital requirements, capital expenditures and general corporate expenses. Subsequent to year end, the Company amended its credit agreement and is projecting future compliance with the amended covenants with an operating plan that, when combined with its expense reduction program, further aligns resources with revenue.
Fair Value of Financial Instruments
The Company’s financial instruments consist primarily of cash, cash equivalents and marketable securities, for which the current carrying amounts approximate fair market values based on quoted market prices or net asset value; the warrant liability, for which the fair value is based on the Company's estimates of assumptions that market participants would use in pricing the liability; and the term loan, for which the fair value is estimated using a discounted cash flow analysis based on the Company’s current incremental borrowing rate and the contractual terms of the loan.
42
Revenue Recognition
The Company generates revenue through the sale of enterprise video content management software solutions, hardware, maintenance and support, and professional and other services. Software sales may take the form of a perpetual software license, a term software license or a cloud-hosted software as a service (SaaS). Software licenses and appliances revenue includes sales of perpetual software licenses and hardware. Service revenue includes term software licenses, SaaS, maintenance and support, and professional and other services. The Company commences revenue recognition when all of the following conditions are met: there is persuasive evidence of an arrangement; the product has been delivered or the services have been provided to the customer; the collection of the fees is reasonably assured; and the amount of fees to be paid by the customer is fixed or determinable. More specifically:
• | Revenue from perpetual software licenses and hardware are generally recognized when the product has been delivered. |
• | Revenue from subscription, maintenance and support, which includes term software licenses, cloud-hosted software as a service and maintenance and support, are generally recognized ratably over the contract term beginning on the commencement date of each contract, which is the date the Company’s product has been delivered or service is made available to customers. |
• | Revenue from professional and other services, which are not essential to the functionality of the software, are generally recognized as the services are provided to customers. |
The Company allocates revenue to the software-related and non-software elements under one arrangement based on the relative selling price. In such circumstances, the selling price for a deliverable is based on the following hierarchy: i) vendor-specific objective evidence (“VSOE”), if available, ii) third-party evidence (“TPE”), if VSOE is not available, or iii) estimated selling price (“ESP”), if neither VSOE nor TPE is available. The Company determines VSOE of the selling price for software-related elements, including professional services and software maintenance and support contracts, based on the price charged for the deliverable when sold separately. After the arrangement consideration has been allocated to the software-related and non-software related elements, the Company accounts for each respective element as follows:
• | Revenue for each of the non-software elements is allocated based on the selling price hierarchy and recognized as noted above provided all other criteria required for revenue recognition have been met. |
• | Revenue for each of the software-related elements is allocated based on the VSOE of each element and recognized as noted above provided all other criteria required for revenue recognition have been met. In software-related arrangements for which the Company does not have the VSOE of the fair value for all elements, revenue is deferred until the earlier of when the VSOE is determined for the undelivered elements (residual method) or when all elements for which the Company does not have the VSOE of the fair value have been delivered, unless the only undelivered element is maintenance and support, in which case the entire amount of revenue is recognized over the maintenance and support period. |
Other items relating to charges collected from customers:
• | Shipping and handling charges collected from customers as part of the Company's sales transactions are included in revenues and the associated costs are included in cost of revenues. |
• | Sales taxes charged to and collected from customers as part of the Company’s sales transactions are excluded from revenues and recorded as a liability to the applicable governmental taxing authority. |
Deferred Revenue
Deferred revenue consists of billings or payments received in advance of revenue recognition and is recognized as the revenue recognition criteria are met. The deferred revenue balance does not represent the total contract value of annual or multi-year, non-cancelable subscription agreements. Deferred revenue that will be recognized during the succeeding 12-month period is recorded as current deferred revenue, and the remaining portion is recorded as non-current deferred revenue.
43
Deferred Commissions
Sales commissions represent the direct incremental costs related to the acquisition of customer contracts. The Company recognizes commissions as sales and marketing expense at the time the associated product revenue is recognized, requiring establishment of a deferred cost in the event a commission is paid prior to recognition of revenue. The deferred commission amounts are recoverable through the related future revenue streams under non-cancelable customer contracts and also commission clawback provisions in the Company's sales compensation plans. Deferred commission costs included in prepaid expenses and other assets were $411,000 and $954,000 at December 31, 2016 and 2015, respectively. Deferred commission costs in other assets, non-current were $148,000 and $104,000 at December 31, 2016 and 2015, respectively.
Cash and Cash Equivalents
The Company considers all highly liquid investments purchased with an original maturity of three months or less to be cash equivalents. Cash and cash equivalents are stated at fair value.
Marketable Securities
Management determines the appropriate classification of marketable securities at the time of purchase and reevaluates such designation as of each balance sheet date. Marketable securities held by the Company are classified as available-for-sale. Available-for-sale securities are carried at fair value as determined by quoted market prices with unrealized gains and losses, net of tax, reported as a separate component of stockholders’ equity. The Company analyzes its marketable securities for impairment on an ongoing basis. Factors considered in determining whether an unrealized loss is a temporary loss or an other-than-temporary loss include the length of time and extent to which the securities have been in an unrealized loss position and the Company’s ability and intent to hold the investment for a period of time sufficient to allow for any anticipated market recovery.
Accounts Receivable and Allowance for Doubtful Accounts
Accounts receivable are initially recorded at a selling price, which approximates fair value upon the sale of goods or services to customers. The Company maintains an allowance for doubtful accounts to reflect accounts receivable at net realizable value. In judging the adequacy of the allowance for doubtful accounts, the Company considers multiple factors, including historical bad debt experience, the general economic environment, the need for specific client reserves and the aging of the Company’s receivables. A portion of this provision is included in operating expenses as a general and administrative expense and a portion of this provision is included as a reduction of license revenue. A considerable amount of judgment is required in assessing these factors. If the factors utilized in determining the allowance do not reflect future performance, then a change in the allowance for doubtful accounts would be necessary in the period such determination has been made, which would impact future results of operations.
Changes to the allowance for doubtful accounts consisted of the following (in thousands):
Year Ended December 31, | ||||||||||||
Allowance for Doubtful Accounts: | 2016 | 2015 | 2014 | |||||||||
Balance at beginning of year | $ | 24 | $ | 55 | $ | 20 | ||||||
Write-offs | (11 | ) | — | (8 | ) | |||||||
Recoveries | — | — | — | |||||||||
Change in provision | 21 | (31 | ) | 43 | ||||||||
Balance at end of year | $ | 34 | $ | 24 | $ | 55 | ||||||
Inventories
Inventories are stated at the lower of cost or market. Cost is determined on a first-in, first-out basis. The Company records provisions for potential excess, obsolete and slow moving inventory. Results could be different if demand for the Company’s products decreased because of economic or competitive conditions, or if products became obsolete because of technical advancements in the industry or by the Company. Inventory included in prepaid expenses and other current assets was $204,000 and $250,000 as of December 31, 2016 and 2015, respectively.
Property and Equipment
Property and equipment are stated at cost and depreciated on a straight-line basis over estimated useful lives ranging from one to seven years for most assets. Leasehold improvements are amortized using the straight-line method over the shorter of the property’s useful life or the term of the underlying lease. Repairs and maintenance costs are charged to operations as incurred.
44
The asset cost and related accumulated depreciation or amortization are adjusted for asset retirement or disposal, with the resulting gain or loss, if any, credited or charged to results of operations.
Long-lived Assets
The Company continually monitors events and changes in circumstances that could indicate that carrying amounts of its long-lived assets, including property and equipment and intangible assets may not be recoverable. When such events or changes in circumstances occur, the Company assesses the recoverability of long-lived assets by determining whether the carrying value of such assets will be recovered through their undiscounted expected future cash flows. If the future undiscounted cash flows are less than the carrying amount of these assets, the Company recognizes an impairment loss based on the excess of the carrying amount over the fair value of the assets.
Goodwill
The Company records goodwill when consideration paid in a purchase acquisition exceeds the fair value of the net tangible assets and the identified intangible assets acquired. Goodwill is not amortized, but rather is tested for impairment annually or more frequently if facts and circumstances warrant a review. The Company has determined that there is a single reporting unit for the purpose of goodwill impairment tests. For purposes of assessing the impairment of goodwill, the Company annually, at its fiscal year end, estimates the fair value of the reporting unit and compares this amount to the carrying value of the reporting unit. If the Company determines that the carrying value of the reporting unit exceeds its fair value, an impairment charge is recognized in the amount by which the carrying amount of the asset exceeds its fair value. As of December 31, 2016, the Company completed its annual impairment test of goodwill. Based upon that evaluation, the Company determined that its goodwill was not impaired. See Note 5–"Intangible Assets and Goodwill."
Investment in Nonconsolidated Company
As of December 31, 2016 and 2015, the Company held an investment totaling $3.1 million in convertible preferred stock of BriefCam, Ltd. ("BriefCam") a privately-held Israeli company that develops video synopsis technology to augment security and surveillance systems to facilitate review of surveillance video. The investment is included in other non-current assets. Because Qumu's ownership interest is less than 20% and it has no other rights or privileges that enable it to exercise significant influence over the operating and financial policies of BriefCam, Qumu accounts for this equity investment using the cost method. Equity securities accounted for under the cost method are reviewed quarterly for changes in circumstances or the occurrence of events that suggest the Company’s investment may not be fully recoverable. If an unrealized loss for the investment is considered to be other-than-temporary, the loss will be recognized in the consolidated statements of operations in the period the determination is made. Qumu monitors BriefCam's results of operations, business plan and capital raising activities and is not aware of any events or circumstances that would indicate a decline in the fair value below the carrying value of its investment.
Derivative Liability
In conjunction with debt financing completed in October 2016, the Company issued a warrant for the purchase of up to 314,286 shares of the Company's common stock, the entire portion of which remained unexercised and outstanding at December 31, 2016. The Company accounts for the warrant, a derivative financial instrument issued in conjunction with the Company's 2016 debt financing, as a current liability based upon the characteristics and provisions of the instrument. The warrant was determined to be ineligible for equity classification because of provisions that allow the holder under certain circumstances, essentially the sale of the Company as defined in the warrant agreement, to elect to receive a minimum cash payment in lieu of the Company's common shares. The warrant liability was recorded in the Company's consolidated balance sheets at its fair value on the date of issuance and is revalued on each subsequent balance sheet date until such instrument is exercised or expires, with any changes in the fair value between reporting periods recorded as other income or expense. The Company estimates the fair value of this liability using an option pricing model that is based on the individual characteristics of the warrant on the valuation date, which includes assumptions for expected volatility, expected life and risk-free interest rate, as well as the present value of the minimum cash payment component of the instrument. Changes in the assumptions used could have a material impact on the resulting fair value. The primary input affecting the value of the warrant liability is the Company’s stock price. Generally, increases (decreases) in the fair value of the underlying stock would result in a corresponding increase (decrease) in the fair value of the warrant liability.
Stock-Based Compensation
The Company measures stock-based compensation based on the fair value of the award at the date of grant. The Company recognizes stock-based compensation on a straight-line basis over the requisite service period for the entire award, net of an estimated forfeiture rate. Compensation cost is recognized for all awards over the vesting period to the extent the requisite
45
service requirements are met, whether or not the award is ultimately exercised. Conversely, when the requisite service requirements are not met and the award is forfeited prior to vesting, any compensation expense previously recognized for the award is reversed.
Research and Development Costs
Costs related to research, design and development of products are charged to research and development expense as incurred. Software development costs are capitalized beginning when a product’s technological feasibility has been established and ending when a product is available for general release to customers. The Company uses the working model approach to determine technological feasibility. The Company’s products are released soon after technological feasibility has been established. As a result, the Company has not capitalized any software development costs because such costs have not been significant.
Royalties for Third-Party Technology
Royalties for third-party technology are either paid in advance and capitalized as prepaid royalties or are accrued as incurred and subsequently paid. These royalties are generally expensed to cost of revenue generally at the greater of a rate based on the contractual or estimated term or an effective royalty rate based on the total projected net revenue for contracts with guaranteed minimums. Each quarter, the Company also evaluates the expected future realization of its prepaid royalties, as well as any minimum commitments not yet paid to determine amounts it deems unlikely to be realized through product sales. Any impairments or losses determined before the launch of a product are generally charged to general and administrative expense, and any impairments or losses determined post-launch are charged to cost of revenue. Unrecognized minimum royalty-based commitments are accounted for as executory contracts and, therefore, any losses on these commitments are recognized when the underlying intellectual property is abandoned (i.e., cease use) or the contractual rights to use the intellectual property are terminated.
During the quarter ended December 31, 2015, the Company recognized a loss relating to a third-party license agreement of $1.2 million to general and administration expense which included the write-off of a $606,000 prepaid royalty and the accrual of the remaining $606,000 minimum royalty payments.
Income Taxes
The Company provides for income taxes using the liability method, which requires recognition of deferred tax assets and liabilities for the expected future tax consequences of events that have been included in the financial statements. Deferred tax assets and liabilities are determined based on the difference between the financial statement and tax basis of assets and liabilities using enacted tax rates in effect for the year in which the differences are expected to reverse. Deferred tax assets are reduced by a valuation allowance when it is more likely than not that some component or all of the deferred tax assets will not be realized. Tax rate changes are reflected in income during the period such changes are enacted.
Foreign Currency Translation
The functional currency for each of the Company’s international subsidiaries is the respective local currency. The Company translates its financial statements of consolidated entities whose functional currency is not the U.S. dollar into U.S. dollars. The Company translates its assets and liabilities at the exchange rate in effect as of the financial statement date and translates statement of operations accounts using the average exchange rate for the period. Exchange rate differences resulting from translation adjustments are accounted for as a component of accumulated other comprehensive loss. Gains or losses, whether realized or unrealized, due to transactions in foreign currencies are reflected in the consolidated statements of operations under the line item other income (expense). The net gain on foreign currency transactions was $162,000 for the year ended December 31, 2016 and net losses on foreign currency transactions were $131,000 and $201,000 for the years ended December 31, 2015 and 2014, respectively, and are included in other expenses in the consolidated statements of operations.
Net Loss Per Share
Basic net loss per common share is computed by dividing net loss by the weighted-average number of common shares outstanding during the period. Diluted net loss per share is calculated by adjusting both the numerator (net loss) and the denominator (weighted-average number of shares outstanding), giving effect to all potentially dilutive common shares from the warrant, options and restricted stock units. The treasury stock method is used for computing potentially dilutive common shares. Under this method, consideration that would be received upon exercise (as well as remaining compensation cost to be recognized for awards not yet vested) is assumed to be used to repurchase shares of stock in the market, with the net number of shares assumed to be issued added to the denominator. In addition, the numerator is adjusted to exclude the changes in the fair value of the warrants that are classified as a liability, but may be settled in shares. For the year ended December 31, 2016, the Company reported diluted net loss as the impact of excluding the warrant income and related potentially dilutive shares was
46
dilutive. Basic and diluted net loss per common share was the same for the years ended December 31, 2015 and 2014 as the impact of all potentially dilutive securities outstanding was anti-dilutive.
Comprehensive Income (Loss)
Comprehensive income (loss) includes net income and items defined as other comprehensive income, such as unrealized gains and losses on certain marketable securities and foreign currency translation adjustments. Such items are reported in the consolidated statements of comprehensive income (loss).
New Accounting Pronouncements
In March 2016, the FASB issued ASU 2016-09, Compensation – Stock Compensation (Topic 718): Improvements to Employee Share-Based Payment Accounting, which will simplify the income tax consequences, accounting for forfeitures and classification on the statements of consolidated cash flows. This standard is effective for fiscal years, and interim periods within those fiscal years, beginning after December 15, 2016, with early adoption permitted. The Company adopted ASU 2016-09 effective January 1, 2017 and does not expect the adoption to have a material impact to the consolidated financial statements and related disclosures.
In February 2016, the FASB issued ASU 2016-02, Leases, which will supersede the existing lease guidance and will require all leases with a term greater than 12 months to be recognized in the statements of financial position and eliminate current real estate-specific lease guidance, while maintaining substantially similar classification criteria for distinguishing between finance leases and operating leases. This standard is effective for fiscal years, and interim periods within those fiscal years, beginning after December 15, 2018, with early adoption permitted. The Company is currently evaluating the impact on its consolidated financial statements of adopting this standard, which will require right-of-use assets and lease liabilities be recorded in the consolidated balance sheet for operating leases.
In January 2016, the FASB issued ASU 2016-01, Financial Instruments - Overall, which requires entities to measure equity instruments at fair value and recognize any changes in fair value in net income (loss). Entities may estimate the fair value of certain equity securities that do not have readily determinable fair value or may choose a practical expedient. If the practical expedient is elected, these investments would be recorded at cost, less any impairment, plus or minus changes resulting from observable price changes in orderly transactions for the identical or a similar investment of the same issuer. The guidance also updates certain presentation and disclosure requirements. This standard is effective for fiscal years, and interim periods within those fiscal years, beginning after December 15, 2017. The Company is currently evaluating the impact of adopting this standard, which could be material to its consolidated financial statements.
In April 2015, the FASB issued ASU 2015-05, Customer’s Accounting for Fees Paid in a Cloud Computing Arrangement, which provides guidance to customers about whether a cloud computing arrangement includes software, which the Company adopted prospectively as of January 1, 2016. The adoption had no impact on the Company's financial position, results of operations or cash flows.
In May 2014, the FASB issued ASU 2014-09, Revenue from Contracts with Customers, which requires an entity to recognize the amount of revenue to which it expects to be entitled for the transfer of promised goods or services to customers. The ASU will replace most existing revenue recognition guidance in U.S. GAAP when it becomes effective. In July 2015, the FASB voted to amend ASU 2014-09 by approving a one-year deferral of the effective date as well as providing the option to early adopt the standard on the original effective date. The new standard is effective for the Company on January 1, 2018 but may be early adopted effective January 1, 2017.
The new revenue standard may be applied using either of the following transition methods: a full retrospective approach reflecting the application of the standard in each prior reporting period with the option to elect certain practical expedients, or a modified retrospective approach with the cumulative effect of initially adopting the standard recognized at the date of adoption (which includes additional footnote disclosures). The Company will adopt the standard in the first quarter of 2018 and preliminarily expects to use the modified retrospective method. However, the Company is continuing to evaluate the impact of the standard, and its adoption method is subject to change.
Currently, the Company is in the process of reviewing its historical contracts to quantify the impact that the adoption of the standard will have on specific performance obligations. The Company is also continuing to evaluate the impact of the standard on its recognition of costs related to obtaining customer contracts (namely, sales commissions). While the Company continues to assess all potential impacts of this new standard, it currently believes the most significant impacts relate to the accounting for the timing of revenue recognition of subscription, or term-based, software license arrangements. Specifically, under the new standard:
47
• | Software revenue associated with non-cancellable subscription or, term-based, software license arrangements will generally be recognized upon delivery of the license. Historically, these arrangements have been material, and the Company currently recognizes this revenue ratably over the term of the software license; and |
• | The Company expects that the accounting for software revenue derived from perpetual based licensing arrangements and associated services revenues will not be materially impacted. |
The adoption of the standard will require the implementation of new accounting processes, which will change the Company's internal controls over revenue recognition, contract acquisition costs and financial reporting. The Company is designing and implementing these controls in anticipation adopting the new standard January 1, 2018.
2) Divestiture of Disc Publishing Business
On April 24, 2014, the Company entered into an asset purchase agreement (the “asset purchase agreement”) with Equus Holdings, Inc. and Redwood Acquisition, Inc. (now known as Rimage Corporation, “Buyer”). Under the terms of the asset purchase agreement, the Company agreed to sell to Buyer all of the assets primarily used or primarily held for use in connection with its disc publishing business. Buyer also agreed to assume on the closing date certain agreements and liabilities relating to the disc publishing business and the acquired assets.
At a special meeting of the Company's shareholders held on June 27, 2014, the Company's shareholders approved the sale of the disc publishing assets as contemplated by the asset purchase agreement. As a result, effective June 27, 2014, the disc publishing business was classified as held for sale and qualified for discontinued operations presentation in the Company’s consolidated financial statements. The results of the discontinued disc publishing business have been presented as discontinued operations effective with the reporting of financial results for the second quarter 2014. As such, financial results for the years ended December 31, 2016, 2015 and 2014 have been reported on this basis.
On July 1, 2014, the Company’s sale of the disc publishing business was completed. The Company also entered into a mutual transition services agreement with Buyer and entered into a lease agreement with Buyer for the lease from Buyer of a portion of the property located at 7725 Washington Avenue South, Minneapolis, MN 55439. The Company terminated the lease agreement in September 2015 due to the Company relocating its corporate headquarters to 510 1st Avenue North, Suite 305, Minneapolis, MN 55403.
The adjusted purchase price paid to the Company was $22.0 million, of which $2.3 million was placed in an escrow account to support the Company’s indemnification obligations under the asset purchase agreement for a fifteen-month escrow period. In the third quarter of 2014, the Company recorded a gain on sale of the disc publishing business of $16.2 million, exclusive of the impact of transaction related expenses recorded through September 30, 2014. The gain on sale attributable to the U.S. is offset for federal income tax purposes by current or prior-year tax losses but is subject to applicable state income taxes.
The operational results of the disc publishing business are presented in the “Net income from discontinued operations, net of tax” line item in the consolidated statements of operations. Also included in this line item for the 2014 period is the gain on sale of the disc publishing business and non-recurring expenses incurred by the Company as a result of the sale of the disc publishing business, including third-party transaction specific costs, one-time income tax related impacts and the acceleration of vesting of cash-based long-term incentive and stock-based awards payable to employees of the disc publishing business upon completion of the asset sale transaction. The described non-recurring expenses and income tax related impacts amounted to approximately $9.6 million for the year ended December 31, 2014. No general corporate charges were allocated to the discontinued business. The assets and liabilities of the discontinued business are presented on the consolidated balance sheets as assets and liabilities from discontinued operations.
Other than consolidated amounts reflecting operating results and balances for both the continuing and discontinued operations, all remaining amounts presented in the accompanying consolidated financial statements and notes reflect the financial results and financial position of the Company's continuing enterprise video content management software business.
48
Revenue, operating income, gain on sale of business, income tax expense and net income from discontinued operations were as follows (in thousands):
Year Ended December 31, | ||||||||||||
2016 | 2015 | 2014 | ||||||||||
Net revenue | $ | — | $ | — | $ | 29,922 | ||||||
Operating income | — | — | 4,520 | |||||||||
Gain on sale of discontinued operations | — | — | 16,167 | |||||||||
Income tax expense (benefit) | — | (92 | ) | 6,955 | ||||||||
Net income (loss) from discontinued operations, net of tax | $ | — | $ | (10 | ) | $ | 13,823 | |||||
As of December 31, 2015, assets and liabilities from discontinued operations consisted of $50,000 of other current liabilities. The Company had no assets and liabilities from discontinued operations as of December 31, 2016.
3) Marketable Securities
No marketable securities were outstanding as of December 31, 2016. Marketable securities as of December 31, 2015 consisted of the following (in thousands):
December 31, 2015 | |||||||||||||||
Amortized Cost | Gross Unrealized Gains | Gross Unrealized Losses | Fair value | ||||||||||||
Certificates of deposit | $ | 6,250 | $ | — | $ | (1 | ) | $ | 6,249 | ||||||
Total marketable securities | $ | 6,250 | $ | — | $ | (1 | ) | $ | 6,249 | ||||||
4) Property and Equipment
Property and equipment consisted of the following (in thousands):
December 31, | |||||||
2016 | 2015 | ||||||
Computer, network equipment and furniture | $ | 3,639 | $ | 3,642 | |||
Leasehold improvements | 1,899 | 1,915 | |||||
Total property and equipment | 5,538 | 5,557 | |||||
Less accumulated depreciation and amortization | (3,711 | ) | (2,615 | ) | |||
Total property and equipment, net | $ | 1,827 | $ | 2,942 | |||
Depreciation and amortization expense associated with property and equipment was $1,161,000, $1,052,000 and $747,000 for the years ended December 31, 2016, 2015 and 2014, respectively.
49
5) Intangible Assets and Goodwill
Intangible Assets
The Company’s amortizable intangible assets consisted of the following (in thousands):
December 31, 2016 | |||||||||||||||||||
Customer Relationships | Developed Technology | Trademarks / Trade-Names | Covenants Not to Compete | Total | |||||||||||||||
Original cost | $ | 4,759 | $ | 7,917 | $ | 2,178 | $ | 31 | $ | 14,885 | |||||||||
Accumulated amortization | (1,577 | ) | (4,509 | ) | (658 | ) | (31 | ) | (6,775 | ) | |||||||||
Net identifiable intangible assets | $ | 3,182 | $ | 3,408 | $ | 1,520 | $ | — | $ | 8,110 | |||||||||
Weighted-average useful lives (years) | 10 | 6 | 15 | 2 | 9 | ||||||||||||||
December 31, 2015 | |||||||||||||||||||
Customer Relationships | Developed Technology | Trademarks / Trade-Names | Covenants Not to Compete | Total | |||||||||||||||
Original cost | $ | 5,115 | $ | 8,567 | $ | 2,190 | $ | 38 | $ | 15,910 | |||||||||
Accumulated amortization | (1,075 | ) | (3,261 | ) | (528 | ) | (14 | ) | (4,878 | ) | |||||||||
Net identifiable intangible assets | $ | 4,040 | $ | 5,306 | $ | 1,662 | $ | 24 | $ | 11,032 | |||||||||
Weighted-average useful lives (years) | 10 | 6 | 15 | 2 | 9 | ||||||||||||||
Changes to the carrying amount of net amortizable intangible assets for the year ended December 31, 2016 consisted of the following (in thousands):
Year Ended December 31, 2016 | |||
Balance, beginning of period | $ | 11,032 | |
Amortization expense | (2,142 | ) | |
Currency translation | (780 | ) | |
Balance, end of period | $ | 8,110 | |
Amortization expense of intangible assets consisted of the following (in thousands):
Year Ended December 31, | |||||||||||
2016 | 2015 | 2014 | |||||||||
Amortization expense associated with the developed technology included in cost of revenues | $ | 1,251 | $ | 1,268 | $ | 650 | |||||
Amortization expense associated with other acquired intangible assets included in operating expenses | 891 | 798 | 652 | ||||||||
Total amortization expense | $ | 2,142 | $ | 2,066 | $ | 1,302 | |||||
The Company estimates that amortization expense associated with intangible assets will be as follows (in thousands):
Year Ending December 31, | |||
2017 | $ | 2,059 | |
2018 | 1,861 | ||
2019 | 1,188 | ||
2020 | 922 | ||
2021 | 722 | ||
Thereafter | 1,358 | ||
Total | $ | 8,110 | |
Goodwill
On October 3, 2014, the Company completed the acquisition of Kulu Valley, Ltd., subsequently renamed Qumu Ltd, and recognized $8.8 million of goodwill and $6.7 million of intangible assets. The goodwill balance of $6.7 million at December
50
31, 2016 reflects the impact of foreign currency exchange rate fluctuations since the acquisition date. The gross carrying amount of goodwill related to the 2011 acquisition of Qumu, Inc. of $22.2 million was fully impaired in 2012.
As of December 31, 2016, the Company’s market capitalization, without a control premium, was greater than its book value and, as a result, the Company concluded there was no goodwill impairment. Declines in the Company’s market capitalization or a downturn in its future financial performance and/or future outlook could require the Company to record goodwill and other impairment charges. While a goodwill impairment charge is a non-cash charge, it would have a negative impact on the Company's results of operations.
6) Fair Value Measurements
A hierarchy for inputs used in measuring fair value is in place that distinguishes market data between observable independent market inputs and unobservable market assumptions by the reporting entity. The hierarchy is intended to maximize the use of observable inputs and minimize the use of unobservable inputs by requiring that the most observable inputs be used when available. Three levels within the hierarchy may be used to measure fair value:
• | Level 1: Inputs are unadjusted quoted prices in active markets for identical assets and liabilities. |
• | Level 2: Inputs include data points that are observable such as quoted prices for similar assets or liabilities in active markets, quoted prices for identical or similar assets or liabilities in markets that are not active, and inputs (other than quoted prices) such as interest rates and yield curves that are observable for the asset or liability, either directly or indirectly. |
• | Level 3: Inputs are generated from model-based techniques that use significant assumptions not observable in the market. These unobservable assumptions reflect an entity’s own estimates of assumptions that market participants would use in pricing the asset or liability. |
The Company’s assets and liabilities measured at fair value on a recurring basis and the fair value hierarchy utilized to determine such fair values is as follows at December 31, 2016 (in thousands):
Fair Value Measurements Using | |||||||||||||||
Total Fair Value at December 31, 2016 | Quoted Prices in Active Markets (Level 1) | Significant Other Observable Inputs (Level 2) | Significant Unobservable Inputs (Level 3) | ||||||||||||
Liabilities: | |||||||||||||||
Derivative warrant liability | $ | 893 | $ | — | $ | — | $ | 893 | |||||||
In conjunction with the October 21, 2016 debt financing, the Company issued a warrant for the purchase of up to 314,286 shares of the Company's common stock, the entire portion of which remained unexercised and outstanding at December 31, 2016. The warrant, which expires on October 21, 2026, has an exercise price of $2.80 per share and is transferrable. The warrant contains a cash settlement feature contingent upon the occurrence of certain events defined in the warrant agreement. As a result of this cash settlement feature, the warrant is subject to derivative accounting as prescribed under ASC 815. Accordingly, the fair value of the warrant on the date of issuance was recorded in the Company’s consolidated balance sheets as a liability.
The warrant liability was recorded in the Company's consolidated balance sheets at its fair value on the date of issuance and is revalued on each subsequent balance sheet date until such instrument is exercised or expires, with any changes in the fair value between reporting periods recorded as other income or expense. During the year ended December 31, 2016, the Company recorded a non-cash gain from the change in fair value of the warrant liability of $137,000. The decrease in fair value of the warrant liability during the year ended December 31, 2016 was primarily driven by a decrease in the Company’s stock price.
The Company estimates the fair value of this liability using an option pricing model that is based on the individual characteristics of the warrant on the valuation date, which includes assumptions for expected volatility, expected life and risk-free interest rate, as well as the present value of the minimum cash payment component of the instrument. Changes in the assumptions used could have a material impact on the resulting fair value. The primary input affecting the value of the warrant liability is the Company’s stock price. Generally, increases (decreases) in the fair value of the underlying stock would result in a corresponding increase (decrease) in the fair value of the warrant liability.
51
The Company classified the warrant liability as Level 3 due to the lack of relevant observable market data over fair value inputs such as the probability-weighting of the various scenarios in the arrangement. The following table represents a rollforward of the fair value of the Level 3 instrument (significant unobservable inputs):
Balance at December 31, 2015 | $ | — | ||
Issuance of warrant instrument | 1,030 | |||
Change in fair value | (137 | ) | ||
Balance at December 31, 2016 | $ | 893 | ||
The Company had no assets and liabilities measured at fair value on a recurring basis at December 31, 2015.
7) Commitments and Contingencies
Leases and Other Financing Obligations
Balances for assets acquired under capital lease obligations and included in property and equipment were as follows (in thousands):
December 31, | |||||||
2016 | 2015 | ||||||
Computer and network equipment | $ | 511 | $ | 511 | |||
Furniture | 287 | 287 | |||||
Assets acquired under capital lease obligations | 798 | 798 | |||||
Accumulated depreciation | (372 | ) | (123 | ) | |||
Assets acquired under capital lease obligations, net | $ | 426 | $ | 675 | |||
The current and long-term portions of capital leases and other financing obligations were as follows (in thousands):
December 31, | |||||||
2016 | 2015 | ||||||
Capital leases and other financing obligations, current | $ | 508 | $ | 502 | |||
Capital leases and other financing obligations, noncurrent | 170 | 519 | |||||
Total capital leases and other financing obligations | $ | 678 | $ | 1,021 | |||
The Company leases certain of its facilities and some of its equipment under non-cancelable operating lease arrangements. The rental payments under these leases are charged to expense on a straight-line basis over the non-cancelable term of the lease.
Future minimum payments under capital lease obligations, other financing obligations, and non-cancelable operating leases, excluding property taxes and other operating expenses as of December 31, 2016 are as follows (in thousands):
Capital leases and other financing obligations | Operating leases | Total | |||||||||
Years ending December 31, | |||||||||||
2017 | $ | 545 | $ | 1,185 | $ | 1,730 | |||||
2018 | 171 | 978 | 1,149 | ||||||||
2019 | 3 | 522 | 525 | ||||||||
2020 | — | 298 | 298 | ||||||||
2021 | — | 300 | 300 | ||||||||
Thereafter | — | 332 | 332 | ||||||||
Total minimum lease payments | 719 | $ | 3,615 | $ | 4,334 | ||||||
Less amount representing interest | (41 | ) | |||||||||
Present value of net minimum lease payments | $ | 678 | |||||||||
On March 5, 2015, the Company entered into an office facility lease agreement for space that serves as its corporate headquarters. The eighty-nine month lease commenced on September 1, 2015, provides the Company approximately 17,216 square feet in Minneapolis, Minnesota, with the initial term expiring January 31, 2023. Total base rent payable over the lease period is $1.8 million. The Company has one option to extend the term of the lease for an additional five year period with respect to the leased premises. The lease agreement allowed the Company to construct leasehold improvements to the new space prior to the effective date of the lease. As the leasehold improvements are the property of the Company, the associated
52
costs, amounting to approximately $713,000, were capitalized in property and equipment as of September 30, 2015 and will be depreciated over the term of the lease. As an incentive to enter into the lease agreement, the lessor provided the Company a one-time tenant improvement allowance of $689,000 to apply against the cost of the leasehold improvements. The one-time tenant improvement allowance is included in deferred rent and will be amortized as a reduction of rent expense over the term of the lease.
During the third quarter 2015, the Company recognized an equipment operating lease loss of $1.0 million relating to equipment the Company no longer utilizes as part of it managed services offerings.
Rent expense under operating leases amounted to approximately $1.3 million, $1.0 million and $743,000 for the years ended December 31, 2016, 2015 and 2014, respectively.
Term Loan
On October 21, 2016, Qumu Corporation (the “Company”) and its wholly-owned subsidiary, Qumu, Inc., entered into a term loan credit agreement (the “credit agreement”) with HCP-FVD, LLC as lender and Hale Capital Partners, LP as administrative agent (the “Administrative Agent”). HCP-FVD, LLC is an affiliate of Hale Capital Partners, LP.
Pursuant to the credit agreement, the Company borrowed $8.0 million as a term loan on October 21, 2016. The term loan is scheduled to mature on October 21, 2019, requires payment of interest monthly at the prime rate plus 6.0%. As of December 31, 2016, interest was payable at 9.75% and the effective interest rate, which includes the impact of accreting the original issue discount and debt issuance costs noted below to interest expense over the term of the loan, was 16.5%.
Upon issuance, the term loan was recorded in the Company's consolidated balance sheet net of an original issue discount of $1.0 million, which represented the fair value of the warrant issued in connection with the debt financing. Also upon issuance, the Company recorded debt issuance costs of $440,000, which are net of $65,000 of costs allocated to the warrant liability and are recorded as a reduction to the carrying value of the term loan.
The term loan is reported in the Company's consolidated balance sheets as follows (in thousands):
December 31, | |||||||
2016 | 2015 | ||||||
Term loan, at face value | $ | 8,000 | $ | — | |||
Unamortized original issue discount | (967 | ) | — | ||||
Unamortized debt issuance costs | (416 | ) | — | ||||
Term loan | $ | 6,617 | $ | — | |||
The term loan had an estimated fair value of $7.2 million as of December 31, 2016. The fair value of the term loan is estimated using a discounted cash flow analysis based on the Company’s current incremental borrowing rate. As the contractual terms of the loan provide all the necessary inputs for this calculation, the term loan is classified as Level 2. The estimated fair value is not necessarily indicative of the amount that would be realized in a current market exchange.
The Company may prepay the term loan at any time with the payment of the applicable pre-payment fee. The Company is obligated to prepay the term loan, with the payment of the applicable pre-payment fee, with the net proceeds from certain dispositions, issuances of equity or debt securities, extraordinary transactions or upon a change of control.
The credit agreement contains affirmative and negative covenants and requirements relating to the Company and its operations. The negative covenants prohibit the Company from incurring debt, encumbering its assets, exceeding operating lease expense amounts, making dividends, distributions or payments on the Company’s capital stock, being a party to any acquisition or any merger or consolidation or similar transaction, modifying its organizational documents, entering into certain transactions with affiliates, making certain transfers to or conducting certain business through foreign subsidiaries, and incentivizing accelerated customer payments. The negative covenants of the credit agreement also require the Company to meet various financial covenants relating to a maximum cumulative net cash operating amount, minimum eligible accounts receivable and cash, minimum cash, minimum core bookings, maximum deferred revenue non-current, minimum subscription, maintenance and support revenue, and minimum subscription and maintenance and support dollar renewal rates. The Company was in compliance with all its covenants as of December 31, 2016.
While the Company was in compliance with all its covenants at December 31, 2016, the Company’s quarterly and annual results of operations are subject to significant fluctuations due to a variety of factors, many of which are outside of the Company’s control. These factors include the number and mix of products and solutions sold in the period, timing of customer purchase commitments, including the impact of long sales cycles and seasonal buying patterns, and variability in the size of
53
customer purchases and the impact of large customer orders on a particular period. The foregoing factors are difficult to forecast, and these, as well as other factors, could adversely affect the Company’s quarterly and annual results of operations. Failure to achieve its quarterly or annual forecasts may result in the Company being out of compliance with covenants or projecting noncompliance in the future. Management actively monitors its opportunity pipeline, forecast, and projected covenant compliance on an ongoing basis. Subsequent to year end, the Company amended its credit agreement to reduce the minimum core bookings covenant requirement for any computation period ending prior to June 30, 2018 while also increasing the ratio of minimum eligible accounts receivable and cash to outstanding obligations. The amendments also modified certain prepayment terms.
If at any time the Company's operating forecast projects non-compliance with its cash-related financial covenants, the Company would reduce its operating costs, including but not limited to headcount reductions, to achieve projected compliance. The Company has no legal or other restrictions that would materially limit its ability to execute on such operating cost reductions, nor does the Company believe that such reductions would materially impact the long-term prospects of the Company. However, there can be no assurance that any future expense reduction measures will result in the expected reductions in the timeframes necessary to achieve compliance with any cash-related financial covenant.
In connection with the credit agreement, the Company granted a first priority security interest in substantially all of its properties, rights and assets and in the stock of Qumu, Inc. Pursuant to a charge over shares by deed by Qumu Corporation as Chargor and the Administrative Agent, the Company pledged to the Administrative Agent 65% of its shares in Qumu UK Holdings Ltd.
Warrant
In conjunction with the October 21, 2016 debt financing, the Company issued a warrant for the purchase of up to 314,286 shares of the Company's common stock, the entire portion of which remained unexercised and outstanding at December 31, 2016. The warrant, which expires on October 21, 2026, has an exercise price of $2.80 per share and is transferrable. The warrant contains a cash settlement feature contingent upon the occurrence of certain events, essentially the sale of the Company as defined in the warrant agreement. As a result of this cash settlement feature, the warrant is subject to derivative accounting as prescribed under ASC 815. Accordingly, the fair value of the warrant on the date of issuance was recorded in the Company’s consolidated balance sheets as a liability.
Contingencies
The Company is exposed to a number of asserted and unasserted legal claims encountered in the ordinary course of its business. Although the outcome of any such legal actions cannot be predicted, management believes that there are no pending legal proceedings against or involving the Company for which the outcome is likely to have a material adverse effect upon its financial position or results of operations.
The Company’s standard arrangements include provisions indemnifying customers against liabilities if the Company's products infringe a third-party’s intellectual property rights. The Company has not incurred any costs in its continuing operations as a result of such indemnifications and has not accrued any liabilities related to such contingent obligations in the accompanying consolidated financial statements.
8) Stock-Based Compensation
The Company issues shares pursuant to the 2007 Stock Incentive Plan (the “2007 Plan”) which provides for the grant of stock incentive awards in the form of incentive and non-qualified stock options, stock appreciation rights, restricted stock, restricted stock units, performance stock, performance units and other awards in stock and/or cash to certain key employees, non-employee directors and service providers. The exercise price of stock options granted under the 2007 Plan is equal to the market value on the date of grant. As of December 31, 2016, 2,730,320 shares are authorized under the 2007 Plan, of which 741,831 were available for future grant.
In addition to awards granted under the 2007 Plan, the Company granted non-qualified options to purchase 200,000, 100,000, 50,000 and 130,000 shares of its common stock to newly hired senior management level employees on April 1, 2009, November 26, 2012, January 7, 2013 and May 18, 2015, respectively, of which 230,000 were outstanding as of December 31, 2016. The options in all cases were granted outside of any shareholder-approved plan as inducements to accept employment with the Company. The options have an exercise price equal to the closing price of the Company’s common stock as reported by the Nasdaq Stock Market on the date of grant, vest in four equal installments on each of the first four anniversaries of the date of grant and have terms of seven years. In other respects, the options were structured to mirror the terms of the options granted under the 2007 Plan and are subject to stock option agreements between the Company and the employees.
54
The Company recognized the following amounts related to the Company’s share-based payment arrangements (in thousands):
Year Ended December 31, | |||||||||||
2016 | 2015 | 2014 | |||||||||
Stock-based compensation cost charged against loss, before income tax benefit | |||||||||||
Stock options | $ | 554 | $ | 686 | $ | 812 | |||||
Restricted stock and restricted stock units | 867 | 1,148 | 1,029 | ||||||||
Total expense included in continuing operations | $ | 1,421 | $ | 1,834 | $ | 1,841 | |||||
Stock-based compensation cost included in: | |||||||||||
Cost of revenues | $ | 49 | $ | 159 | $ | 55 | |||||
Operating expenses | 1,372 | 1,675 | 1,786 | ||||||||
Total expense included in continuing operations | $ | 1,421 | $ | 1,834 | $ | 1,841 | |||||
As of December 31, 2016, total stock option compensation expense of $1.3 million and $894,000 was not yet recognized related to non-vested option awards and related to non-vested shares and share unit awards, respectively, and is expected to be recognized over a weighted average period of 3.0 years and 1.6 years, respectively.
In addition to the stock-based compensation costs recognized in continuing operations related to the Company’s share-based payment arrangements, stock-based compensation costs of $198,000 are included in discontinued operations for the year ended December 31, 2014.
Stock Options
The fair value of each option award is estimated at the date of grant using the Black-Scholes option pricing model. The assumptions used to determine the fair value of stock option awards granted were as follows:
Year Ended December 31, | |||||
2016 | 2015 | 2014 | |||
Expected life of options in years | 4.75 | 4.75 | 4.75 | ||
Risk-free interest rate | 1.1% - 1.4% | 1.3% - 1.6% | 1.4% - 1.6% | ||
Expected volatility | 57.4% - 63.7% | 34.5% - 53.2% | 33.1% - 34.5% | ||
Expected dividend yield | —% | —% | —% | ||
The Company reviews these assumptions at the time of each new option award and adjusts them as necessary to ensure proper option valuation. The expected life represents the period that the stock option awards are expected to be outstanding. Effective April 2008, the Company’s Board of Directors approved a change in the contractual term of stock options granted to employees from ten to seven years. Given the reduction in the contractual term of its employee stock option awards, the Company determined it was unable to rely on its historical exercise data as a basis for estimating the expected life of stock options granted to employees subsequent to this change. As such, the Company used the “simplified” method for determining the expected life of stock options granted to employees in 2016, 2015 and 2014, which bases the expected life calculation on the average of the vesting term and the contractual term of the awards. The risk-free interest rate is based on the yield of constant maturity U.S. treasury bonds with a remaining term equal to the expected life of the awards. The Company estimated the stock price volatility using weekly price observations over the most recent historical period equal to the expected life of the awards.
55
A summary of share option activity is presented in the table below (in thousands, except per share data):
Shares | Weighted Average Exercise Price | Weighted Average Remaining Contractual Term (in years) | Aggregate Intrinsic Value(1) | |||||||||
Options outstanding at December 31, 2013 | 1,748 | $ | 12.95 | |||||||||
Granted | 133 | 14.58 | ||||||||||
Exercised | (86 | ) | 12.28 | |||||||||
Canceled | (160 | ) | 15.75 | |||||||||
Options outstanding at December 31, 2014 | 1,635 | 12.84 | ||||||||||
Granted | 617 | 4.73 | ||||||||||
Exercised | (20 | ) | 7.27 | |||||||||
Canceled | (419 | ) | 13.45 | |||||||||
Options outstanding at December 31, 2015 | 1,813 | 10.00 | ||||||||||
Granted | 374 | 2.86 | ||||||||||
Exercised | — | — | ||||||||||
Canceled | (679 | ) | 12.66 | |||||||||
Options outstanding at December 31, 2016 | 1,508 | 7.03 | 4.7 | $ | — | |||||||
Total vested and expected to vest as of December 31, 2016 | 1,501 | 7.05 | 4.7 | — | ||||||||
Options exercisable as of: | ||||||||||||
December 31, 2014 | 1,003 | $ | 14.15 | |||||||||
December 31, 2015 | 969 | 13.09 | ||||||||||
December 31, 2016 | 703 | 10.06 | 3.1 | $ | — | |||||||
________________________________________________________________
(1) | Aggregate intrinsic value includes only those options with intrinsic value (options where the exercise price is below the market value). |
Other information pertaining to options is as follows (in thousands, except per share data):
Year Ended December 31, | |||||||||||
2016 | 2015 | 2014 | |||||||||
Fair value of options granted | $ | 556 | $ | 1,119 | $ | 612 | |||||
Per share weighted average fair value of options granted | $ | 1.49 | $ | 1.81 | $ | 4.60 | |||||
Total intrinsic value of stock options exercised | $ | — | $ | 131 | $ | 242 | |||||
The aggregate impact of the exercise of stock options, expirations of vested stock options and lapse of restrictions on restricted stock generated a net tax impact of $15,000, $7,000 and $6,000 in 2016, 2015 and 2014 respectively, recorded as a reduction in additional paid-in capital.
Restricted Stock and Restricted Stock Units
Restricted stock and restricted stock units are valued based on the market value of the Company’s shares on the date of grant, which was equal to the intrinsic value of the shares on that date. These awards vest and the restrictions lapse over varying periods from the date of grant. The Company recognizes compensation expense for the intrinsic value of the restricted awards ratably over the vesting period.
56
A summary of restricted stock and restricted stock units activity is presented in the table below (in thousands, except per share data):
Number of Shares | Weighted Average Grant-Date Fair Value | |||||
Nonvested at December 31, 2013 | 118 | $ | 10.94 | |||
Granted | 184 | 14.92 | ||||
Vested | (76 | ) | 10.35 | |||
Canceled | (12 | ) | 10.63 | |||
Nonvested at December 31, 2014 | 214 | 14.59 | ||||
Granted | 129 | 9.96 | ||||
Vested | (92 | ) | 14.52 | |||
Canceled | (76 | ) | 12.64 | |||
Nonvested at December 31, 2015 | 175 | 12.05 | ||||
Granted | 120 | 4.00 | ||||
Vested | (76 | ) | 11.27 | |||
Canceled | (29 | ) | 13.03 | |||
Nonvested at December 31, 2016 | 190 | $ | 7.13 | |||
Other information pertaining to restricted stock and restricted stock units is as follows (in thousands, except per share data):
Year Ended December 31, | |||||||||||
2016 | 2015 | 2014 | |||||||||
Per share weighted average grant-date fair value of restricted stock and restricted stock units granted | $ | 4.00 | $ | 9.96 | $ | 14.92 | |||||
Total fair value of restricted stock and restricted stock units vested | $ | 294 | $ | 667 | $ | 1,076 | |||||
9) Stockholders' Equity
Common Stock
Since October 2010, the Company’s Board of Directors has approved common stock repurchases of up to 3,500,000 shares. Shares may be purchased at prevailing market prices in the open market or in private transactions, subject to market conditions, share price, trading volume and other factors. The repurchase program may be discontinued at any time. The repurchase program has been funded to date using cash on hand. The Company repurchased no shares under the share repurchase program during the years ended December 31, 2016, 2015 and 2014. As of December 31, 2016, 778,365 shares were available under the Board authorizations. Under the credit agreement, the Company is prohibited from repurchasing or redeeming its stock, subject to certain exceptions relating to the exercise or vesting of equity awards.
10) 401(K) Savings Plan
The Company has a savings plan under Section 401(k) of the Internal Revenue Code. The plan allows employees to contribute up to 100% of pretax compensation. The Company matches a percentage of employees’ contributions. Matching contributions totaled $428,000, $359,000 and $324,000 for the years ended December 31, 2016, 2015 and 2014, respectively.
11) Income Taxes
The components of loss before income taxes consist of the following (in thousands):
Year Ended December 31, | |||||||||||
2016 | 2015 | 2014 | |||||||||
Loss before income taxes: | |||||||||||
Domestic | $ | (10,834 | ) | $ | (26,889 | ) | $ | (26,271 | ) | ||
Foreign | (593 | ) | (2,639 | ) | (2,636 | ) | |||||
Total loss before income taxes | $ | (11,427 | ) | $ | (29,528 | ) | $ | (28,907 | ) | ||
57
The provision for income tax expense (benefit) consists of the following (in thousands):
Year Ended December 31, | |||||||||||
2016 | 2015 | 2014 | |||||||||
Current: | |||||||||||
U.S. Federal | $ | (6 | ) | $ | (3 | ) | $ | (122 | ) | ||
State | 50 | 27 | 35 | ||||||||
Foreign | (249 | ) | (817 | ) | (96 | ) | |||||
Total current | (205 | ) | (793 | ) | (183 | ) | |||||
Deferred: | |||||||||||
U.S. Federal | — | 1 | (5,693 | ) | |||||||
State | 12 | (47 | ) | (562 | ) | ||||||
Foreign | (59 | ) | — | (126 | ) | ||||||
Total deferred | (47 | ) | (46 | ) | (6,381 | ) | |||||
Total provision for income tax benefit | $ | (252 | ) | $ | (839 | ) | $ | (6,564 | ) | ||
Total income tax benefit differs from the expected income tax benefit, computed by applying the federal statutory rate of 34% to earnings before income taxes as follows (in thousands):
Year Ended December 31, | |||||||||||
2016 | 2015 | 2014 | |||||||||
Expected income tax benefit | $ | (3,885 | ) | $ | (10,040 | ) | $ | (9,828 | ) | ||
State income taxes, net of federal tax effect | (789 | ) | (830 | ) | (347 | ) | |||||
Change in tax rate | (162 | ) | 48 | 20 | |||||||
Foreign tax | (105 | ) | 80 | 690 | |||||||
Non-deductible stock issuance costs | (24 | ) | — | — | |||||||
Federal R&D credit | (17 | ) | (82 | ) | (88 | ) | |||||
Foreign unremitted earnings | 58 | — | — | ||||||||
Change in valuation allowance | 4,566 | 9,906 | 2,957 | ||||||||
Other, net | 106 | 79 | 32 | ||||||||
Total provision for income tax benefit | $ | (252 | ) | $ | (839 | ) | $ | (6,564 | ) | ||
The tax effects of temporary differences that give rise to significant portions of deferred tax assets (liabilities) are presented below (in thousands):
December 31, | |||||||
2016 | 2015 | ||||||
Deferred tax assets: | |||||||
Inventory provisions and uniform capitalization | $ | — | $ | 24 | |||
Accounts receivable allowances | 12 | 9 | |||||
Non-qualified stock option and restricted stock expense | 961 | 1,789 | |||||
Deferred revenue | 408 | 76 | |||||
Loss and credit carryforwards of U.S. subsidiary | 33,673 | 28,366 | |||||
Loss carryforward of foreign subsidiaries | 1 | 382 | |||||
Other accruals and reserves | 674 | 1,108 | |||||
Other | (349 | ) | 122 | ||||
Total deferred tax assets before valuation allowance | 35,380 | 31,876 | |||||
Less valuation allowance | (32,930 | ) | (28,928 | ) | |||
Total deferred tax assets | $ | 2,450 | $ | 2,948 | |||
Deferred tax liabilities: | |||||||
Acquired intangibles | $ | (2,526 | ) | $ | (3,067 | ) | |
Fixed Assets | (148 | ) | (399 | ) | |||
Total deferred tax liabilities | $ | (2,674 | ) | $ | (3,466 | ) | |
Total net deferred tax assets (liabilities) | $ | (224 | ) | $ | (518 | ) | |
As of December 31, 2016, the Company had $78.1 million of net operating loss carryforwards for U.S. federal tax purposes and $63.9 million of net operating loss carryforwards for various states. The loss carryforwards for federal tax purposes will expire
58
between 2022 and 2036 if not utilized. The loss carryforwards for state tax purposes will expire between 2022 and 2036 if not utilized.
As of December 31, 2016, the Company had federal and state research and development credit carryforwards of $3.0 million, net of Section 383 limitations, which will begin to expire in 2022 if not utilized.
As a result of its acquisition of Qumu, Inc. in October 2011, utilization of U.S. net operating losses and tax credits of Qumu, Inc. are subject to annual limitations under Internal Revenue Code Sections 382 and 383, respectively.
The Company assessed that the valuation allowance against its U.S. deferred tax assets is still appropriate as of December 31, 2016, based on the consideration of all available positive and negative evidence, using the “more likely than not” standard required by ASC 740, Income Taxes. The valuation allowance will be reviewed quarterly and will be maintained until sufficient positive evidence exists to support the reversal of the valuation allowance.
The Company generally believes that it is more likely than not that the future results of the operations of its subsidiaries in the U.K. will generate sufficient taxable income due to the reversal of deferred tax liabilities to realize the tax benefits related to its deferred tax assets. As of December 31, 2016, the Company had a cumulative foreign tax loss carryforward of $1.7 million in the U.K. This amount can be carried forward indefinitely.
As of December 31, 2016, the Company has accrued a $58,000 deferred tax liability on unremitted earnings attributable to its international subsidiaries that are no longer considered to be reinvested indefinitely. Accumulated undistributed foreign earnings relate primarily to operations of the Company's subsidiaries in Japan and the U.K. and amount to approximately $1.1 million as of December 31, 2016. The amount of cash and cash equivalents held by the Company's international subsidiaries that are not available to fund domestic operations unless repatriated was $1.4 million as of December 31, 2016. The repatriation of cash and cash equivalents held by the Company's international subsidiaries would not result in an adverse tax impact on cash due to the Company's net operating loss position with respect to income taxes.
A reconciliation of the beginning and ending amounts of gross unrecognized tax benefits is presented in the table below (in thousands):
Year Ended December 31, | |||||||
2016 | 2015 | ||||||
Gross unrecognized tax benefits at beginning of year | $ | 970 | $ | 900 | |||
Increases related to: | |||||||
Prior year income tax positions | 58 | 2 | |||||
Current year income tax positions | 14 | 68 | |||||
Gross unrecognized tax benefits at end of year | $ | 1,042 | $ | 970 | |||
Included in the balance of unrecognized tax benefits at December 31, 2016 are potential benefits of $6,000 that if recognized, would affect the effective tax rate. The Company does not anticipate that the total amount of unrecognized tax benefits as of December 31, 2016 will change significantly by December 31, 2017.
The Company recognizes accrued interest and penalties related to unrecognized tax benefits as a component of income tax expense. Total accrued interest and penalties amounted to $3,000 and $4,000 on a gross basis at December 31, 2016 and 2015, respectively, and are excluded from the reconciliation of unrecognized tax benefits presented above. Interest and penalties recognized in the consolidated statements of operations related to uncertain tax positions amounted to a net tax expense in 2016 of $1,000 and net tax benefit in 2015 of $3,000.
The Company files income tax returns in the U.S. federal jurisdiction and various state and foreign jurisdictions. As of December 31, 2016, the Company was no longer subject to income tax examinations for taxable years before 2014 in the case of U.S. federal taxing authorities, and taxable years generally before 2012 in the case of state taxing authorities, consisting primarily of Minnesota and California.
59
12) Computation of Net Loss From Continuing Operations Per Share of Common Stock
The following table identifies the components of net loss from continuing operations per basic and diluted share (in thousands, except for per share data):
Year Ended December 31, | |||||||||||
2016 | 2015 | 2014 | |||||||||
Net loss per share from continuing operations – basic | |||||||||||
Net loss from continuing operations | $ | (11,175 | ) | $ | (28,689 | ) | $ | (22,343 | ) | ||
Weighted average shares outstanding – basic | 9,232 | 9,235 | 8,836 | ||||||||
Net loss per share from continuing operations – basic | $ | (1.21 | ) | $ | (3.11 | ) | $ | (2.53 | ) | ||
Net loss per share from continuing operations – diluted | |||||||||||
Loss from continuing operations attributable to common shareholders: | |||||||||||
Net loss from continuing operations | $ | (11,175 | ) | $ | (28,689 | ) | $ | (22,343 | ) | ||
Numerator effect of dilutive securities | |||||||||||
Warrant | (137 | ) | — | — | |||||||
Loss from continuing operations attributable to common shareholders | $ | (11,312 | ) | $ | (28,689 | ) | $ | (22,343 | ) | ||
Weighted averages shares outstanding – diluted: | |||||||||||
Weighted average shares outstanding – basic | 9,232 | 9,235 | 8,836 | ||||||||
Denominator effect of dilutive securities | |||||||||||
Stock options and restricted stock units | — | — | — | ||||||||
Warrant | — | — | — | ||||||||
Diluted potential common shares | — | — | — | ||||||||
Weighted average shares outstanding – diluted | 9,232 | 9,235 | 8,836 | ||||||||
Net loss per share from continuing operations – diluted | $ | (1.23 | ) | $ | (3.11 | ) | $ | (2.53 | ) | ||
Stock options and restricted stock units to acquire weighted average common shares of 1,511,000, 1,676,000 and 1,724,000 for the years ended December 31, 2016, 2015 and 2014, respectively, have been excluded from the computation of diluted weighted average shares outstanding for each respective period as their effect is anti-dilutive.
13) Significant Customers and Geographic Data
Customers accounting for more than 10% of the Company’s total revenue are as follows (in thousands):
Years Ended December 31, | ||||||||||
Revenues | 2016 | 2015 | 2014 | |||||||
Customer A | $ | 4,402 | $ | 4,375 | * | |||||
_________________________________________________
* Sales did not exceed 10%
Customers accounting for more than 10% of the Company’s accounts receivable are as follows (in thousands):
December 31, | ||||||||||
Accounts Receivable | 2016 | 2015 | 2014 | |||||||
Customer A | $ | 1,099 | * | * | ||||||
Customer B | $ | 748 | * | * | ||||||
Customer C | * | $ | 1,144 | * | ||||||
Customer D | * | $ | 1,173 | * | ||||||
_________________________________________________
* Accounts receivable balance did not exceed 10%
60
The Company’s revenues from each of its principal geographic regions are presented based on customer location as follows (in thousands):
Years Ended December 31, | ||||||||||||
2016 | 2015 | 2014 | ||||||||||
North America | $ | 23,089 | $ | 25,254 | $ | 22,634 | ||||||
Europe | 7,924 | 8,128 | 2,712 | |||||||||
Asia | 669 | 1,072 | 1,175 | |||||||||
Total | $ | 31,682 | $ | 34,454 | $ | 26,521 | ||||||
Net property and equipment of the Company were located as follows (in thousands):
December 31, | ||||||||
2016 | 2015 | |||||||
North America | $ | 1,732 | $ | 2,715 | ||||
Europe | 95 | 209 | ||||||
Asia | — | 18 | ||||||
Total | $ | 1,827 | $ | 2,942 | ||||
14) Supplemental Quarterly Data – Unaudited (In thousands, except per share data)
2015 | 2016 | ||||||||||||||||||||||||||||||
First | Second | Third | Fourth | First | Second | Third | Fourth | ||||||||||||||||||||||||
Revenues | $ | 5,969 | $ | 8,764 | $ | 9,602 | $ | 10,119 | $ | 8,736 | $ | 6,515 | $ | 7,110 | $ | 9,321 | |||||||||||||||
Cost of revenues | 3,775 | 4,492 | 4,870 | 4,362 | 3,818 | 2,954 | 2,857 | 2,731 | |||||||||||||||||||||||
Gross profit | 2,194 | 4,272 | 4,732 | 5,757 | 4,918 | 3,561 | 4,253 | 6,590 | |||||||||||||||||||||||
Operating expenses: | |||||||||||||||||||||||||||||||
Research and development | 2,802 | 2,858 | 2,848 | 2,181 | 2,350 | 2,410 | 1,986 | 1,795 | |||||||||||||||||||||||
Sales and marketing | 4,828 | 4,740 | 4,706 | 3,720 | 3,532 | 2,978 | 2,435 | 2,584 | |||||||||||||||||||||||
General and administrative | 4,364 | 3,558 | 4,353 | 4,603 | 2,970 | 2,265 | 2,109 | 2,378 | |||||||||||||||||||||||
Amortization of intangibles | 199 | 200 | 200 | 199 | 226 | 227 | 221 | 217 | |||||||||||||||||||||||
Total operating expenses | 12,193 | 11,356 | 12,107 | 10,703 | 9,078 | 7,880 | 6,751 | 6,974 | |||||||||||||||||||||||
Operating loss | (9,999 | ) | (7,084 | ) | (7,375 | ) | (4,946 | ) | (4,160 | ) | (4,319 | ) | (2,498 | ) | (384 | ) | |||||||||||||||
Other income (expense): | |||||||||||||||||||||||||||||||
Interest income (expense), net | 16 | 15 | (10 | ) | (14 | ) | (12 | ) | (15 | ) | (13 | ) | (247 | ) | |||||||||||||||||
Change in fair value of warrant liability | — | — | — | — | — | — | — | 137 | |||||||||||||||||||||||
Other, net | (64 | ) | (4 | ) | (89 | ) | 26 | 36 | (47 | ) | (13 | ) | 108 | ||||||||||||||||||
Total other income (loss), net | (48 | ) | 11 | (99 | ) | 12 | 24 | (62 | ) | (26 | ) | (2 | ) | ||||||||||||||||||
Loss before income taxes | (10,047 | ) | (7,073 | ) | (7,474 | ) | (4,934 | ) | (4,136 | ) | (4,381 | ) | (2,524 | ) | (386 | ) | |||||||||||||||
Income tax benefit | (174 | ) | (146 | ) | (163 | ) | (357 | ) | (4 | ) | (90 | ) | (39 | ) | (119 | ) | |||||||||||||||
Net loss from continuing operations | (9,873 | ) | (6,927 | ) | (7,311 | ) | (4,577 | ) | (4,132 | ) | (4,291 | ) | (2,485 | ) | (267 | ) | |||||||||||||||
Net income (loss) from discontinued operations, net of tax | (67 | ) | (22 | ) | 79 | — | — | — | — | — | |||||||||||||||||||||
Net income (loss) | $ | (9,940 | ) | $ | (6,949 | ) | $ | (7,232 | ) | $ | (4,577 | ) | $ | (4,132 | ) | $ | (4,291 | ) | $ | (2,485 | ) | $ | (267 | ) | |||||||
Net income (loss) per share – basic(1) | $ | (1.08 | ) | $ | (0.75 | ) | $ | (0.78 | ) | $ | (0.50 | ) | $ | (0.45 | ) | $ | (0.46 | ) | $ | (0.27 | ) | $ | (0.03 | ) | |||||||
Net income (loss) per share – diluted(1) | $ | (1.08 | ) | $ | (0.75 | ) | $ | (0.78 | ) | $ | (0.50 | ) | $ | (0.45 | ) | $ | (0.46 | ) | $ | (0.27 | ) | $ | (0.04 | ) | |||||||
(1) | Due to the averaging of shares, quarterly earnings per share may not add to the total for the full year. |
61
ITEM 9. CHANGES IN AND DISAGREEMENTS WITH ACCOUNTANTS ON ACCOUNTING AND FINANCIAL DISCLOSURE
None.
ITEM 9A. CONTROLS AND PROCEDURES
a) | Evaluation of Disclosure Controls and Procedures |
Our Chief Executive Officer, Vern Hanzlik, and our Chief Financial Officer, Peter J. Goepfrich, have evaluated the Company’s disclosure controls and procedures as of December 31, 2016. Our Chief Executive Officer and our Chief Financial Officer used the definition of “disclosure controls and procedures” as set forth in Rule 13a-15(e) under the Exchange Act in making their conclusion as to the effectiveness of such controls and procedures.
Based upon such evaluation, our Chief Executive Officer and our Chief Financial Officer have concluded that our disclosure controls and procedures were effective as of December 31, 2016.
b) | Management’s Report on Internal Control Over Financial Reporting |
Management is responsible for establishing and maintaining adequate internal control over financial reporting as defined in Rules 13a-15(f) and 15d-15(f) under the Exchange Act. Under the supervision of our Chief Executive Officer and our Chief Financial Officer, we conducted an evaluation of the effectiveness of our internal control over financial reporting based on the framework in Internal Control - Integrated Framework (2013) issued by the Committee of Sponsoring Organizations of the Treadway Commission (COSO).
A company’s internal control over financial reporting is a process designed to provide reasonable assurance regarding the reliability of financial reporting and the preparation of financial statements for external purposes in accordance with U.S. generally accepted accounting principles. A company’s internal control over financial reporting includes those policies and procedures that:
(i) | Pertain to the maintenance of records that, in reasonable detail, accurately and fairly reflect the transactions and dispositions of the assets of the company; |
(ii) | Provide reasonable assurance that transactions are recorded as necessary to permit preparation of financial statements in accordance with U.S. generally accepted accounting principles, and that receipts and expenditures of the company are being made only in accordance with authorizations of management and directors of the company; and |
(iii) | Provide reasonable assurance regarding prevention or timely detection of unauthorized acquisition, use or disposition of the company’s assets that could have a material effect on the financial statements. |
Because of its inherent limitations, internal control over financial reporting may not prevent or detect misstatements. Also, projections of any evaluation of effectiveness to future periods are subject to the risk that controls may become inadequate because of changes in conditions, or that the degree of compliance with the policies or procedures may deteriorate.
Based on our assessment and those criteria, management believes that the Company's internal control over financial reporting was effective as of December 31, 2016.
c) | Remediation of Material Weakness in Internal Control over Financial Reporting |
Based on our assessment of the effectiveness of our internal control over financial reporting as of December 31, 2015, management identified material weaknesses in internal control over (i) financial reporting related to the Company’s risk assessment and monitoring processes, (ii) manual journal entries, (iii) account reconciliations and (iv) revenue review.
To remediate the material weakness related to internal control over financial reporting relating to the Company’s risk assessment and monitoring processes, during the first half of 2016 we reviewed our existing processes and engaged a third-party consulting firm that assisted us with implementing process-level controls and monitoring activities that are responsive to changes in the business and personnel and are aligned with our financial reporting objectives. Additionally, during the first nine months of 2016, we completed the implementation of our new enterprise resource planning ("ERP") system and implemented new controls, and enhanced existing controls, that address the completeness and accuracy of underlying data included in system-generated reports. With respect to our monitoring activities, we implemented processes, including a sub-certification process, that assist us in the timely identification, evaluation, communication and remediation of internal control deficiencies.
With respect to the material weaknesses over manual journal entries, account reconciliations and revenue review, action was taken by management to enhance the design of existing controls and implement additional controls. The implementation of our
62
new ERP system in 2016 enabled us to obtain complete populations of manual journal entries and enhanced the process for the appropriate review and approval of those entries. Regarding account reconciliations, we implemented procedures to monitor their timely completion and review. The implementation of our new ERP system assisted us in addressing the material weakness over revenue review by providing system-generated reports that are validated for completeness and accuracy. Additionally, we enhanced our processes over the documentation and review of revenue entries recorded to the general ledger, including the evaluation of the completeness and accuracy of underlying data.
A substantial portion of the Company's remediation was completed in conjunction with the third quarter 2016 financial close and financial reporting cycle. During the fourth quarter of fiscal 2016, we successfully completed the testing necessary to conclude that the controls were operating effectively and have concluded that the material weaknesses have been remediated.
d) | Changes in Internal Control Over Financial Reporting |
There have been no changes in internal controls over financial reporting that occurred during the fourth quarter ended December 31, 2016 that have materially affected, or are reasonable likely to materially affect, the Company’s internal control over financial reporting other than the remediation of material weaknesses described above.
ITEM 9B. OTHER INFORMATION
2016 Incentive Plan Payouts
On March 31, 2017, the Company’s Compensation Committee approved and the Board of Directors ratified determinations under the 2016 short-term incentive plan adopted by the Compensation Committee on January 21, 2016 (the “2016 Incentive Plan”) to the Company’s executive officers: Vern Hanzlik, President and Chief Executive Officer, and Peter J. Goepfrich, Chief Financial Officer.
As previously reported, under the 2016 Incentive Plan, the Compensation Committee determined minimum, target and maximum amounts of three performance goals for 2016: core bookings, revenue and adjusted EBITDA, which were weighted 25%, 25% and 50%, respectively. Additionally, failure to achieve the adjusted EBITDA metric, even if other performance goals are achieved, would result in no incentive pay under the 2016 Incentive Plan.
For 2016, the Company’s core bookings, revenue and adjusted EBITDA were $10,988,000, $31,682,000 and $(6,637,000), respectively. The Company did not achieve the minimum performance goals established by the Compensation Committee under the 2016 Incentive Plan relating to either core bookings or revenue. The Company achieved more than the minimum but less than the target adjusted EBITDA for 2016, resulting in a payout of 48% of the incentive amount attributable to this performance goal. Applying the weighting of the 2016 Incentive Plan to this level of achievement of adjusted EBITDA, Mr. Hanzlik earned $47,888 and Mr. Goepfrich earned $34,595 in incentive pay under the 2016 Incentive Plan.
Amendment No. 1 to Credit Agreement
On March 31, 2017, the Company and its wholly-owned subsidiary, Qumu, Inc., entered into an Amendment No. 1 to its credit agreement dated October 21, 2016 with HCP-FVD, LLC as lender and Hale Capital Partners, LP as administrative agent. Through the Amendment No. 1, the parties agreed to reduce the minimum core bookings covenant from $10 million to $8 million for any computation period ending prior to June 30, 2018 (returning to $10 million for any computation period ending on or after June 30, 2018) and to increase the covenant relating to minimum amount of eligible accounts receivable and cash from 100% to 118% of outstanding obligations. The parties also amended the credit agreement to require prepayment of 100% of the net cash proceeds of any “Asset Disposition” as defined in the credit agreement and to increase the prepayment fee to 10% of the principal amount prepaid if prepayment occurs at any time prior to October 21, 2019. In connection with the amendment, the Company paid the administrative agent an amendment fee of $125,000.
The foregoing summary of the Amendment No. 1 does not purport to be complete and is subject to and qualified in its entirety by reference to the Amendment No. 1 attached hereto as Exhibit 10.13 and incorporated herein by reference.
63
PART III
ITEM 10. DIRECTORS, EXECUTIVE OFFICERS AND CORPORATE GOVERNANCE
The information required by this item is incorporated herein by reference to the following sections of the Company’s Proxy Statement for its 2017 Annual Meeting of Shareholders, which will be filed with the Securities and Exchange Commission pursuant to Regulation 14A within 120 days after the close of the fiscal year for which this report is filed (the “Proxy Statement”):
▪ | Ownership of Voting Securities by Principal Holders and Management; |
▪ | Proposal 1—Election of Directors; |
▪ | Executive Officers; |
▪ | Executive Compensation; |
▪ | Section 16(a) Beneficial Ownership Reporting Compliance; |
▪ | Corporate Governance; and |
▪ | Code of Ethics. |
ITEM 11. EXECUTIVE COMPENSATION
The information required by this item is incorporated herein by reference to the sections of the Company’s Proxy Statement entitled “Executive Compensation” and “Director Compensation.”
ITEM 12. SECURITY OWNERSHIP OF CERTAIN BENEFICIAL OWNERS AND MANAGEMENT AND RELATED STOCKHOLDER MATTERS
The information required by this item is incorporated herein by reference to the section of the Company’s Proxy Statement entitled “Ownership of Voting Securities by Principal Holders and Management,” and is incorporated herein by reference to Part II, Item 5 entitled “Market for Common Equity, Related Stockholder Matters and Issuer Purchases of Equity Securities” of this Annual Report on Form 10-K.
ITEM 13. CERTAIN RELATIONSHIPS AND RELATED TRANSACTIONS AND DIRECTOR INDEPENDENCE
The information required by this item is incorporated by reference to the sections of the Company’s Proxy Statement entitled “Certain Relationships and Related Person Transactions” and “Corporate Governance.”
ITEM 14. PRINCIPAL ACCOUNTANT FEES AND SERVICES
The information required by this item is incorporated herein by reference to the section of the Company’s Proxy Statement entitled “Relationship with Independent Registered Public Accounting Firm.”
64
PART IV
ITEM 15. EXHIBITS AND FINANCIAL STATEMENT SCHEDULES
(a) | (1) Financial Statements. See Part II, Item 8 of this report | |
(2) Exhibits. See Index to Exhibits on page 67 of this report | ||
(b) | See Index to Exhibits on page 67 of this report | |
65
SIGNATURES
Pursuant to the requirements of Section 13 or 15 (d) of the Securities Exchange Act of 1934, the registrant caused this report to be signed on its behalf by the undersigned, thereto duly authorized.
Dated: March 31, 2017 | QUMU CORPORATION | |||
By: | /s/ Vern Hanzlik | |||
Vern Hanzlik | ||||
Chief Executive Officer | ||||
By: | /s/ Peter J. Goepfrich | |||
Peter J. Goepfrich | ||||
Chief Financial Officer | ||||
Pursuant to the requirements of the Securities Exchange Act of 1934, this report has been signed below by the following persons on behalf of the registrant and in the capacities and on the dates indicated. Each person whose signature appears below constitutes and appoints Vern Hanzlik and Peter J. Goepfrich as his or her true and lawful attorneys-in-fact and agents, each acting alone, with full power of substitution and re-substitution, for him or her and in his or her name, place and stead, in any and all capacities, to sign any and all amendments to this Annual Report on Form 10-K and to file the same, with all exhibits thereto, and other documents in connection therewith, with the U.S. Securities and Exchange Commission, granting unto said attorneys-in-fact and agents, each acting alone, full power and authority to do and perform each and every act and thing requisite and necessary to be done in and about the premises, as fully to all intents and purposes as he or she might or could do in person, hereby ratifying and confirming all said attorneys-in-fact and agents, each acting alone, or his substitute or substitutes, may lawfully do or cause to be done by virtue thereof.
Signature | Title | Date | |||||
/s/ Vern Hanzlik | Chief Executive Officer | March 31, 2017 | |||||
Vern Hanzlik | (Principal Executive Officer), Director | ||||||
/s/ Peter J. Goepfrich | Chief Financial Officer (Principal | March 31, 2017 | |||||
Peter J. Goepfrich | Financial and Accounting Officer) | ||||||
/s/ Daniel R. Fishback | Director | March 31, 2017 | |||||
Daniel R. Fishback | |||||||
/s/ Thomas F. Madison | Director | March 31, 2017 | |||||
Thomas F. Madison | |||||||
/s/ Kimberly K. Nelson | Director | March 31, 2017 | |||||
Kimberly K. Nelson | |||||||
/s/ Donald T. Netter | Director | March 31, 2017 | |||||
Donald T. Netter | |||||||
/s/ Robert F. Olson | Director | March 31, 2017 | |||||
Robert F. Olson | |||||||
/s/ Justin A. Orlando | Director | March 31, 2017 | |||||
Justin A. Orlando | |||||||
66
INDEX TO EXHIBITS
Exhibit No. | Description |
2.1 | Asset Purchase Agreement dated April 24, 2014 by and among Equus Holdings, Inc., as Parent, Redwood Acquisition, Inc. as Buyer and Qumu Corporation as Seller (Incorporated by reference to Exhibit 2.1 to the Company's Current Report on Form 8-K dated April 24, 2014). |
2.2 | Majority Share Purchase Agreement dated October 3, 2014 by and among Qumu Corporation and Sellers identified therein (Incorporated by reference to Exhibit 2.1 to the Company's Current Report on Form 8-K dated October 3, 2014). |
2.3 | Form of Minority Share Purchase Agreement dated October 3, 2014 by and among Qumu Corporation and Sellers identified therein (Incorporated by reference to Exhibit 2.2 to the Company's Current Report on Form 8-K dated October 3, 2014). |
3.1 | 1992 Restated Articles of Incorporation of Rimage Corporation (Incorporated by reference to Exhibit 3.1 to the Company’s Registration Statement on Form SB-2 (File No. 33-22558)). |
3.2 | Articles of Amendment to 1992 Restated Articles of Incorporation of Rimage Corporation (Incorporated by reference to Exhibit 4.2 to the Company’s Registration Statement on Form S-8 (File No. 333-69550)). |
3.3 | Amended and Restated Bylaws of Rimage Corporation, as amended (Incorporated by reference to Exhibit 3.2 to the Company’s Current Report on Form 8-K dated March 7, 2007). |
3.4 | Articles of Amendment to Articles of Incorporation of Rimage Corporation as filed with the Minnesota Secretary of State effective as of September 16, 2013 (Incorporated by reference to Exhibit 3.1 to the Company’s Current Report on Form 8-K dated September 16, 2013). |
3.5 | Amendments effective March 2, 2016 to Bylaws of Qumu Corporation (Incorporated by reference to Exhibit 3.1 to the Company’s Current Report on Form 8-K dated March 2, 2016). |
4.1 | Rights Agreement dated as of September 17, 2003 between Rimage Corporation and Wells Fargo Bank, as Rights Agent (Incorporated by reference to Exhibit 1 to the Company’s Registration Statement on Form 8-A (File No. 000-20728)). |
4.2 | Amendment No. 1 dated September 11, 2013 to Rights Agreement by and between Rimage Corporation and Wells Fargo Bank Minnesota, N.A., as Rights Agent (Incorporated by reference to Exhibit 4.1 to the Company’s Current Report on Form 8-K dated September 11, 2013). |
4.3 | Amendment No. 2 dated March 10, 2014 to Rights Agreement by and between Rimage Corporation and Wells Fargo Bank Minnesota, N.A., as Rights Agent, as amended by Amendment No. 1 dated September 11, 2013 (Incorporated by reference to Exhibit 4.1 to the Company’s Current Report on Form 8-K dated March 10, 2014). |
10.1 | Second Amended and Restated 2007 Stock Incentive Plan * (Incorporated by reference to Appendix A to the Company’s Proxy Statement for the 2014 Annual Meeting of Shareholders held on May 20, 2014). |
10.2 | Form of Non-Employee Director Restricted Stock Unit Agreement with Deferral Election *(Incorporated by reference to Exhibit 10.18 of the Company’s Annual Report on Form 10-K dated March 12, 2010). |
10.3 | Amended and Restated Form of Severance/Change in Control Letter Agreement dated February 21, 2013, between the Company and certain executive officers * (Incorporated by reference to Exhibit 10.3 of the Company’s Current Report on Form 8-K dated February 21, 2013). |
10.4 | Agreement dated March 18, 2015 among Qumu Corporation and Dolphin Limited Partnership III, L.P., Dolphin Associates III, LLC, and Dolphin Holdings Corp. III (Incorporated by reference to Exhibit 10.1 to the Company’s Current Report on Form 8-K dated March 18, 2015). |
10.5 | Transition Agreement dated March 4, 2015 by and between Qumu Corporation and James R. Stewart * (Incorporated by reference to Exhibit 10.1 to the Company’s Current Report on Form 8-K dated March 4, 2015). |
10.6 | Building Lease dated March 5, 2015 by and between Qumu Corporation, as Tenant, and Butler North, LLC, as Landlord (Incorporated by reference to Exhibit 10.1 to the Company’s Current Report on Form 8-K dated March 5, 2015). |
10.7 | Letter Agreement effective April 27, 2015 regarding Offer of Employment by Qumu Corporation and Peter J. Goepfrich * (Incorporated by reference to Exhibit 10.1 to the Company’s Current Report on Form 8-K dated April 27, 2015). |
10.8 | Stock Option Agreement dated May 18, 2015 by and between Qumu Corporation and Peter J. Goepfrich * (Incorporated by reference to Exhibit 4.1 to the Company’s Registration Statement on Form S-8 (File No. 333-206270)). |
10.9 | Separation Letter Agreement dated October 19, 2015 by and between Qumu Corporation and Sherman L. Black * (Incorporated by reference to Exhibit 10.1 to the Company’s Current Report on Form 8-K dated October 29, 2015). |
10.10 | Term Loan Credit Agreement dated October 21, 2016 by and among Qumu Corporation, Qumu, Inc., the Lenders party thereto and Hale Capital Partners, LP as Administrative Agent (Incorporated by reference to Exhibit 10.1 to the Company’s Current Report on Form 8-K dated October 21, 2016). |
10.11 | Guaranty and Collateral Agreement dated October 21, 2016 by Qumu Corporation and Qumu, Inc. in favor of Hale Capital Partners, LP as administrative agent (Incorporated by reference to Exhibit 10.1 to the Company’s Current Report on Form 8-K dated October 21, 2016). |
10.12 | Warrant to Purchase 314,286 shares of Common Stock issued by Qumu Corporation to HCP-FVD, LLC on October 21, 2016 (Incorporated by reference to Exhibit 10.1 to the Company’s Current Report on Form 8-K dated October 21, 2016). |
10.13 | Amendment No. 1 to Credit Agreement dated as of March 31, 2017 by and among Qumu Corporation, as Borrower, Qumu, Inc., as Guarantor, HCP-FVD, LLC, as Lender and Hale Capital Partners, LP, as Administrative Agent. |
21.1 | Subsidiaries of Qumu Corporation. |
23.1 | Consent of KPMG LLP, Independent Registered Public Accounting Firm. |
31.1 | Certificate of Chief Executive Officer pursuant to Rules 13a-14(a) and 15d-14(a) of the Exchange Act. |
31.2 | Certificate of Chief Financial Officer pursuant to Rules 13a-14(a) and 15d-14(a) of the Exchange Act. |
67
Exhibit No. | Description |
32 | Certification pursuant to 18 U.S.C. §1350. |
101.INS | XBRL Instance Document. |
101.SCH | XBRL Taxonomy Extension Schema Document. |
101.CAL | XBRL Taxonomy Extension Calculation Linkbase Document. |
101.DEF | XBRL Taxonomy Extension Definition Linkbase Document. |
101.LAB | XBRL Taxonomy Extension Label Linkbase Document. |
101.PRE | XBRL Taxonomy Extension Presentation Linkbase Document. |
* Indicates a management contract or compensatory plan or arrangement | |
Effective September 16, 2013, Rimage Corporation changed its corporate name to Qumu Corporation. | |
68