Attached files
UNITED STATES
SECURITIES AND EXCHANGE COMMISSION
Washington, D.C. 20549
FORM 10-K
x ANNUAL REPORT PURSUANT TO SECTION 13 OR 15(d) OF THE SECURITIES EXCHANGE ACT OF 1934
For the fiscal year ended: December 31, 2016
OR
o TRANSITION REPORT PURSUANT TO SECTION 13 OR 15(d) OF THE SECURITIES EXCHANGE ACT OF 1934
For the transition period from: to
Commission File Number 000-50009
PACIFIC HEALTH CARE ORGANIZATION, INC.
(Exact name of registrant as specified in its charter)
|
Utah
|
87-0285238
|
|
(State or other jurisdiction of incorporation or organization)
|
(I.R.S. Employer I.D. No.)
|
|
|
|
|
1201 Dove Street, Suite 300
Newport Beach, California
|
92660
|
|
(Address of principal executive offices)
|
(Zip Code)
|
|
Registrant’s telephone number, including area code: (949) 721-8272
|
Securities registered pursuant to Section 12(b) of the Act: None
Securities registered pursuant to Section 12(g) of the Act:
$.001 par value, common voting shares
(Title of class)
|
Indicate by check mark if the registrant is a well-known seasoned issuer, as defined in Rule 405 of the Securities Act.
|
|||||
|
|
Yes
|
☐
|
No
|
☒
|
|
|
Indicate by check mark if the registrant is not required to file reports pursuant to Section 13 or 15(d) of the Exchange Act.
|
|||||
|
|
Yes
|
☐
|
No
|
☒
|
|
|
Indicate by check mark whether the registrant (1) has filed all reports required to be filed by Section 13 or 15(d) of the Securities Exchange Act of 1934 during the past 12 months (or for such shorter period that the registrant was required to file such reports), and (2) has been subject to such filing requirements for the past 90 days.
|
|||||
|
|
Yes
|
☒
|
No
|
☐
|
|
|
Indicate by check mark whether the registrant has submitted electronically and posted on its corporate web site, if any, every Interactive Data File required to be submitted and posted pursuant to Rule 405 of Regulation S-T (§232.405 of this chapter) during the preceding 12 months (or such shorter period that the registrant was required to submit and post such files).
|
|||||
|
|
Yes
|
☒
|
No
|
☐
|
|
|
Indicate by check mark if disclosure of delinquent filers pursuant to Item 405 of Regulation S-K (§232.405 of this chapter) is not contained herein, and will not be contained, to the best of registrant’s knowledge, in definitive proxy or information statements incorporated by reference in Part III of this Form 10-K or any amendment to this Form 10-K.
|
|
|
|
|
☐
|
|
|
Indicate by check mark whether the registrant is a large accelerated filer, an accelerated filer, a non-accelerated filer or a smaller reporting company. See the definitions of “large accelerated filer,” “accelerated filer” and “smaller reporting company” in Rule 12b-2 of the Exchange Act.
|
|
||||||
|
|
|
||||||
|
|
Large accelerated filer
|
☐
|
|
Accelerated filer
|
☐
|
|
|
|
|
|
|
|
|
|
|
|
|
|
Non-accelerated filer
|
☐
|
|
Smaller reporting company
|
☒
|
|
|
|
|
(Do not check if smaller reporting company)
|
|
|
|
|
|
|
|
Indicate by check mark whether the registrant is a shell company (as defined in Rule 12b-2 of the Exchange Act).
|
|||||
|
|
Yes
|
☐
|
No
|
☒
|
|
|
The aggregate market value of the voting and non-voting common equity held by non-affiliates computed by reference to the price at which the common equity was last sold, or the average bid and asked price of such common equity, as of the last business day of the registrant’s most recently completed second fiscal quarter was approximately $2,546,000
|
|
As of March 16, 2017 the issuer had 800,000 shares of its $.001 par value common stock outstanding.
|
|
Documents incorporated by reference: None
|
|
|
|
Page
|
|
|
PART I
|
|||
|
|
|
|
|
|
Item 1.
|
5
|
||
|
|
|
|
|
|
Item 1A.
|
9
|
||
|
|
|
|
|
|
Item 1B.
|
13
|
||
|
|
|
|
|
|
Item 2.
|
13
|
||
|
|
|
|
|
|
Item 3.
|
13
|
||
|
|
|
|
|
|
Item 4.
|
13
|
||
|
|
|
|
|
|
PART II
|
|||
|
|
|
|
|
|
Item 5.
|
14
|
||
|
|
|
|
|
|
Item 6.
|
15
|
||
|
|
|
|
|
|
Item 7.
|
15
|
||
|
|
|
|
|
|
Item 7A.
|
22
|
||
|
|
|
|
|
|
Item 8.
|
23
|
||
|
|
|
|
|
|
Item 9.
|
36
|
||
|
|
|
|
|
|
Item 9A.
|
36
|
||
|
|
|
|
|
|
Item 9B.
|
37
|
||
|
|
|
|
|
|
PART III
|
|||
|
|
|
|
|
|
Item 10.
|
38
|
||
|
|
|
|
|
|
Item 11.
|
40
|
||
|
|
|
|
|
|
Item 12.
|
43
|
||
|
|
|
|
|
|
Item 13.
|
44
|
||
|
|
|
|
|
|
Item 14.
|
45
|
||
|
|
|
|
|
|
PART IV
|
|||
|
|
|
|
|
|
Item 15.
|
46
|
||
|
|
|
|
|
|
Item 16.
|
47
|
||
|
|
48
|
||
PACIFIC HEALTH CARE ORGANIZATION, INC.
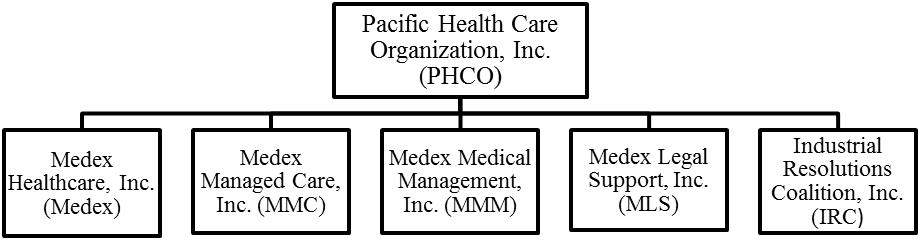
Throughout this Annual Report on Form 10-K, unless the context indicates otherwise, the terms, “we,” “us,” “our” or “the Company” refer to Pacific Health Care Organization, Inc., (“PHCO”) and our wholly-owned subsidiaries Medex Healthcare, Inc. (“Medex”), Industrial Resolutions Coalition, Inc. (“IRC”), Medex Managed Care, Inc. (“MMC”), Medex Medical Management, Inc. (“MMM”) and Medex Legal Support, Inc., (“MLS”).
CAUTIONARY STATEMENT REGARDING
FORWARD-LOOKING STATEMENTS
This Annual Report on Form 10-K contains forward-looking statements within the meaning of Section 27A of the Securities Act of 1933, as amended (the “Securities Act”) and Section 21E of the Securities Exchange Act of 1934, as amended, (the “Exchange Act”) that are based on our management’s beliefs and assumptions and on information currently available to our management. For this purpose any statement contained in this Annual Report on Form 10-K that is not a statement of historical fact may be deemed to be forward-looking, including, but not limited to statements about future demand for the products and services we offer, changes in the composition of the products and services we offer, the impact of the loss of one or more significant customers, our ability to add new customers to replace the loss of current customers, future revenues, expenses, results of operations, liquidity and capital resources or cash flows, or our actions, intentions, plans, strategies and objectives. Without limiting the foregoing, words such as “believe,” “expect,” “project,” “intend,” “estimate,” “budget,” “plan,” “forecast,” “predict,” “may,” “will,” “could,” “should,” or “anticipate” or comparable terminology are intended to identify forward-looking statements. These statements by their nature involve known and unknown risks, uncertainties, and other factors that may cause our actual results, performance or achievements or the industry to be materially different from any future results, performance or achievements expressed or implied by such forward-looking statements. Such factors include, but are not limited to, economic conditions generally and in the industry in which we and our customers participate; cost reduction efforts by our existing and prospective customers; competition within our industry, including competition from much larger competitors; business combinations; legislative requirements or changes which could render our services less competitive or obsolete; our failure to successfully develop new services and/or products or to anticipate current or prospective customers’ needs; our ability to retain existing customers and to attract new customers; price increases; employee limitations; and delays, reductions, or cancellations of contracts we have previously entered.
Forward-looking statements are predictions and not guarantees of future performance or events. Forward-looking statements are based on current industry, financial and economic information, which we have assessed but which by its nature, is dynamic and subject to rapid and possibly abrupt change. Our actual results could differ materially from those stated or implied by such forward-looking statements due to risks and uncertainties associated with our business. We hereby qualify all our forward-looking statements by these cautionary statements. These forward-looking statements speak only as of their dates and should not be unduly relied upon. We undertake no obligation to publicly update or revise any forward-looking statements whether as a result of new information, future events or otherwise (other than pursuant to reporting obligations imposed on registrants pursuant to the Exchange Act) to reflect subsequent events or circumstances.
The following discussion should be read in conjunction with our consolidated financial statements and the related notes contained elsewhere in this Annual Report on Form 10-K and in our other filings with the Securities and Exchange Commission (the “Commission”).
PART I
Company History
Pacific Health Care Organization, Inc. is a Utah corporation incorporated in 1970. In 2001 PHCO acquired Medex Healthcare, Inc. and subsequently established several other operating subsidiary companies to create a workers’ compensation managed-care company that offers an integrated and layered array of complimentary business solutions that enable our clients to better manage their employee worker compensation related healthcare administration costs.
Our clients include self-administered employers, insurers, third party administrators, municipalities and others. Although we have processed medical bill reviews in 25 states, our principal clients are located in the State of California where the high cost of workers’ compensation insurance is a critical problem. As of the end of December 31, 2015, according to the Workers’ Compensation Insurance Rating Bureau of California, the State of California has the highest per claim costs in the nation, reporting costs for workers’ compensation claims that exceed by also 200% the combined median cost of claims of all other states. Medical costs per indemnity claim have risen by more than 50% per claim since 2005. Workers’ compensation costs continue to increase in large measure due to rising medical costs, inflation, and fraud, among other factors. Medical and indemnity costs associated with workers’ compensation in the state of California cost employers billions of dollars annually.
Business of the Company
We are workers’ compensation cost containment specialists. Our business objective is to deliver value to our clients that reduces their workers’ compensation related medical claims expense in a manner that will assure that injured employees receive high quality healthcare that allows them to recover from injury and return to gainful employment without undue delay. According to studies conducted by auditing bodies on behalf of the California Division of Workers’ Compensation, (“DWC”) the two most significant cost drivers for workers’ compensation are claims frequency and medical treatment costs.
Our core service focuses on the reduction of medical treatment costs by enabling our client/employers to share the control over the medical treatment process. This control is obtained by participation in one of our medical treatment networks. We hold several valuable government-issued licenses to operate medical treatment networks. Through Medex we hold two of the total of nine licenses issued by the State of California to establish and manage a Health Care Organization (“HCO”) within the state of California. We also hold approvals issued by the State of California to act as a Medical Provider Network (“MPN”). Additionally, we offer a Nurse Case Management program that allows us to provide additional patient care and cost-saving medical treatment administration.
Health Care Organizations
An HCO is a network of health care professionals specializing in the treatment of workplace injuries and in back-to-work rehabilitation and training of our clients’ employees. HCOs were created to appeal to injured workers, while providing substantial savings to the client/employers. In most cases, our HCO programs gives the client/employer 180 days of medical control in a provider network within which the client/employer has the ability to direct the administration of the claim. The injured worker may change physicians once during this period, but the worker may not leave the provider network. The increased length of time during which the client/employer has control over administration of the claim is designed to decrease the incidence of fraudulent claims and disability awards. The right to control treatment within a network is also based upon the notion that if there is more control over medical treatment there will be more control over getting injured workers healthy and back on the job. A final outcome would be to control total claim treatment cost and related workers’ compensation insurance premiums.
Our HCO licenses allow us to cover the entire state of California. Our clients can offer their injured workers a choice of enrolling in an HCO with a network managed by primary care providers which require primary care physicians to make referrals to needed specialists or in an HCO where injured workers do not need any prior authorization to be seen and treated by specialists.
Our HCO networks have contracted with approximately 3,900 individual medical providers and clinics, as well as hospitals, pharmacies, rehabilitation centers and other ancillary services enabling our HCOs to provide comprehensive medical services throughout California. Our provider networks are composed of experts in treating worker injuries. We are continually reviewing and enhancing these networks based upon the nominations of new clients and the approvals of their claims administrators. All network provider credentials are reviewed and approved by our subsidiary Medex.
HCO guidelines impose certain medical oversight, reporting, information delivery and usage fees upon HCOs. These requirements increase the administrative costs and obligations on HCOs over those applicable to an MPN, although the obligations and cost differentials between the two types of organizations have been narrowing over the past few years.
Medical Provider Networks
Like an HCO, an MPN is a network of health care professionals, but MPN networks do not require the same level of medical expertise in treating work place injuries. Under an MPN program the client/employer dictates which physician the injured employee will see for the initial visit. Thereafter, the MPN program grants the employee discretion to choose which physician in the network will continue treatment of the claim; the client/employer is benefited by having that discretion limited for the life of the claim to physicians within the MPN network. In addition, the California MPN statute and regulations allow the injured employee to dispute treatment decisions, provide for second and third medical opinions, and then permits case review by an independent medical reviewer, whose decision can result in the client/employer losing control over medical treatment of the employee.
Unlike our HCOs, our MPN does not require our clients to pay annual fee assessments, nor does it require our clients to comply with annual enrollment notice delivery requirements. As a result, there are fewer administrative costs associated with an MPN program, which allows our MPN to market its services at a lower cost to employers than our HCOs. For this reason, many clients may opt to use the less complicated MPN even though it provides client/employers fewer rights to control medical treatment of employee injury claims.
HCO + MPN
As a licensed HCO and approved MPN, in addition to offering HCO and MPN programs, we are also able to offer our client/employers a combination of the HCO and MPN programs. Under this plan model a client/employer can enroll its employees in the HCO program, and then prior to the expiration of the 180-day treatment period under the HCO program, the client/employer can enroll the employee into the MPN program. This allows client/employers to take advantage of both programs. To our knowledge, PHCO is currently the only entity that offers clients/employers and HCO+MPN combination program.
Nurse Case Management
Nurse case management keeps medical treatment claims progressing to a resolution and assures treatment plans are aligned from a medical perspective. Nurse oversight is a collaborative process that assesses plans, implements, coordinates, monitors and evaluates the options and services required to meet an injured worker’s health needs. Nurse case managers act as a liaison between the injured worker, claims adjuster, medical providers and attorneys to achieve optimal results for injured workers and employer/clients.
Our credentialed nurses have expertise in various clinical areas and extensive backgrounds in workers’ compensation matters. This combination allows our nurses the opportunity to facilitate medical treatment while understanding the nuances of workers’ compensation up to and including litigation. By providing these services our client/employers contribute to effective delivery of medical treatment assuring the injured worker receives quality treatment in a timely and appropriate manner to return the worker to employment.
Workers’ Compensation Carve-outs
Some employers are able to opt out of the standard workers’ compensation regulatory scheme through carve-out agreements that comply with state law requirements. We facilitate the negotiation of legal agreements for the implementation of Workers’ Compensation Carve-Outs for California client/employers and provide services to the carve-out agreement parties. Under such carve-out agreements certain clients are able to access our HCOs, MPN and Nurse Case Management Program.
California law permits employers and employees to establish alternative dispute resolution systems to resolve disputes in the workers’ compensation context. These arrangements are called carve-outs because the employers and employees covered by such agreements are carved out from the standard state workers’ compensation scheme, provided applicable statutory and regulatory requirements covering the administration of carve-out programs are met. These carve-out agreements are made between client/employers and the collective bargaining units representing covered client employees.
Ancillary Services
Beyond the core services we provide to facilitate client/employers involvement in employee medical treatment claims administration and patient treatment options, we also provide to our HCO and MPN clients a number of claims-related services that bring efficiencies to claim processing and management that further reduce the overall burden of workers’ compensation claims resolution. These services include various back office type functions that assure cost efficiency and accuracy in claim processing, claim reimbursement and claim dispute resolution.
All of our services are fully integrated to allow for partial and full bundling of services and sharing of information across all our platforms. Our bundled services have allowed some client/employers to achieve up to a 70% reduction in the cost of injury claim resolution while maintaining superior treatment for injured workers. Seamless integration between services enhances cost-savings by providing concurrent access to complete, accurate and timely information relating to our HCOs, MPNs or PPO networks and all our ancillary services as claims are managed to completion. Among such services are:
|
·
|
Utilization Review
|
Using skilled staff and an automated review system we deliver utilization review services to self-insured clients, insurance companies and public entities. Utilization review cuts overhead costs of these clients. Utilization review is a safeguard against unnecessary and inappropriate medical treatment from the perspective of medical necessity, quality of care, appropriateness of decision-making, etc. applied in accordance with the applicable workers’ compensation law.
|
·
|
Medical Bill Review
|
We provide professional analysis of medical provider services and equipment billing to ascertain proper reimbursement. Such services include, but are not limited to, coding review and rebundling, confirming that the services are customary and reasonable, fee schedule compliance, out-of-network bill review, pharmacy review, and preferred provider organization repricing arrangements. These services result in significant network savings.
|
·
|
Lien Representation Services
|
When a worker is injured in the scope of employment the client/employer is required to provide workers’ compensation benefits. If the provider of services is not paid because the services were not authorized, or if the provider disputes the amount of reimbursement, the provider may file a lien against the workers’ compensation claim. We provide comprehensive lien representation services from negotiation through litigation and petitions for reconsideration.
|
·
|
Legal Support Services
|
We provide expert witness testimony before the California Workers Compensation Appeals Board. The fees include reimbursement of witness fees, travel and lodging expenses.
|
·
|
Medicare Set Aside Fees
|
In December 2015, we commenced offering Medicare Set Aside services for workers’ compensation claims which is a financial agreement that allocates a portion of a workers’ compensation settlement to pay for future medical services related to the work-place injury, illness, or disease. The purpose of the set aside arrangement is to provide funds to the injured party to pay for future medical expenses that would otherwise be covered by Medicare. This program affords our client/employers an effective way to overcome complications after settlement and avoids unnecessary costs attached to the claim.
Significant Customers
We provide services to virtually any size employer in the state of California as well as insurers, third party administrators, self-administered employers, municipalities and other industries. We also provide some client/employers utilization review, nurse case management and medical provider network, medical bill review, network access fee services and Medicare set aside services outside the state of California.
During 2016, TriStar Risk Management and Carl Warren & Company (“Carl Warren”) accounted for approximately 14% and 12%, respectively, of our total sales.
Competition
We were one of the first commercial enterprises capable of offering HCO services and MPN services in California. Now there are many companies who compete in this market. Many of these competitors are larger than PHCO and may have greater financial, research and marketing experience and resources than we do, and they may therefore represent substantial long-term competition. As of December 31, 2016, in California there were nine certified health care organization licenses issued to seven companies. We own two of the nine licenses and have six possible direct HCO competitors. Only two of these HCO competitors, however, are currently writing HCO business due to the complexity of the HCO regulations. There are minimal requirements for establishing MPNs and therefore, as of October 2016, there were in excess of 2,500 MPNs in the state of California according to the DWC MPN website. Of these, we administer 92 MPNs.
We compete on both quality of service delivery and price of services. We maintain quality of service by virtue of the training, skill and experience of our professional staff and numerous outside consultants. We compete on price through our integrated and robust information technology systems. We focus our business primarily to those employers and payers who use our HCO and/or MPN services. We anticipate that this focus will keep the majority of this business stable and renewable. However, periodically we expect that some large clients may establish the in-house capability of performing the services we offer, as this has occurred in the past. If we are unable to compete effectively, it will be difficult for us to retain current customers or add new customers, and our business, financial condition, and results of operations could be materially and adversely affected.
We rely on our well-trained and knowledgeable in-house professionals to develop service offerings aligned with market need. We target the needs of insurers, third party administrators, self-administered employers. We contract directly with medical providers based on quality determinations rather than the provision of discounted medical services. We believe this provides us a competitive advantage because we can market a direct relationship with providers who have demonstrated expertise in treating work related injuries and writing credible medical reports rather than relying on third party relationships or discounts alone.
We offer both HCO and MPN programs to potential clients, as well as an HCO/MPN combination model, which we believe also gives us a competitive advantage, because of the manner in which the network was created. While some of our competitors offer either HCO or MPN services, to our knowledge, none of our competitors offer this type of HCO/MPN combination model, nor, in our opinion, do they have the legal and medical expertise to administer one.
Governmental Regulation
Managed care programs for workers’ compensation are subject to various laws and regulations. The nature and degree of applicable regulation varies by state and by the specific services provided. Parties that provide or arrange for the provision of healthcare services are subject to numerous complex regulatory requirements that govern many aspects of their conduct and operations. Because managed healthcare is a rapidly changing and expanding industry and the cost of providing healthcare continues to increase, it is possible that the applicable federal and state regulatory frameworks will expand to have a greater impact upon the conduct and operation of our business.
As discussed above, the provision of workers’ compensation managed care in the state of California is governed by legislation and secondary regulations. The services we provide have developed largely in response to legislation or other governmental action. Changes in the legislation regulating workers’ compensation may create greater or lesser demand for the services we offer or require us to develop new or modified services to meet the needs of the marketplace and compete effectively. We could also be materially and adversely affected if the state of California were to elect to reduce the extent of medical cost containment strategies available to insurance companies and other payers, or adopt other strategies for cost containment that would not support demand for our services.
There has been considerable discussion of healthcare reform at both the federal and state level in recent years. Due to uncertainties regarding the ultimate features of reform initiatives and the timing of their enactment, we cannot predict which, if any, reforms will be adopted, when they may be adopted, or what impact they may have on our business or within the industry in which we participate.
Employees
Including the employees of our subsidiaries, as of March 16, 2017 we employed thirty-six full-time employees and one part-time employee. We also use the services of a number of consultants. In addition, all executive officers of the Company work on a full-time basis. Over the next twelve months, we anticipate hiring additional employees only if business revenues increase and our operating requirements warrant such hiring.
Reports to Security Holders
We file Annual Reports on Form 10-K, Quarterly Reports on Form 10-Q, Current Reports on Form 8-K, proxy and information statements and other filings pursuant to Sections 13, 14 and 15(d) of the Exchange Act, and amendments to such filings with the Commission. The public may read and copy any materials we file with the Commission at its Public Reference Room at 100 F Street N.E., Washington, DC 20549. The public may obtain information on the operation of the Public Reference Room by calling the SEC at 1-800-SEC-0330. The Commission maintains its internet site www.sec.gov, which contains reports, proxy and information statements and our other Commission filings. We also post an electronic copy of our Annual Report on Form 10-K on our website www.pacifichealthcareorganization.com, which you can view or download free of charge. Materials posted on our website are not part of this report.
You should consider carefully the following risk factors, together with the other information contained in this report and the other reports we file with the Commission, in evaluating us or making an investment in our common stock. The risks described below are the material risks, although not the only risks, relating to us and our common stock. If any of the following risks and uncertainties develop into actual material events, it could have a material adverse effect on our business, operations and financial condition. You should not draw any inference as to the magnitude or likelihood of any particular risk from its position in the following discussion.
A significant percentage of our revenue is generated from a few customers, the loss of one or more of which could have a material impact on our results of operations, cash flows and financial condition.
A significant portion of operating revenue is received from a relatively small group of our customers. Sales to three customers accounted for approximately 35% of our total revenue in 2016.
We cannot guarantee that significant customers will not, at some point, terminate or reduce our services. The loss of one or more significant customers will likely have an adverse impact on our business, results of operations, cash flows and financial condition, perhaps materially, until such time as we are able to retain new customers to replace them.
Most of our customer contracts permit either party to terminate without cause. Many organizations in the insurance industry have consolidated and this could result in the loss of one or more of our customers through a merger or acquisition. Additionally, we could lose customers due to competitive pricing pressures or other reasons. If several customers terminate their contracts, or do not renew or extend their contracts with us, our results could be materially adversely affected.
Our revenues may decline if we cannot compete successfully in an intensely competitive market.
We target our products to employers seeking to control the cost of employee workers’ compensation claims. We face competition from a variety of companies and the markets for our services are fragmented and competitive. Our competitors include national managed care providers, preferred provider networks, smaller independent providers and insurance companies. Many of our current and potential competitors have significantly greater financial, technical, marketing, and other resources than we do. As a result, our competitors may be able to respond more quickly to new or emerging ways to manage treatment costs, including enhanced technology, changes in regulations and standards, and shifts in customer requirements. We believe that as managed care techniques continue to gain acceptance in the marketplace, our competitors will increasingly consist of insurance companies, large workers’ compensation managed care service companies and other significant providers of managed care products. These competitors may also be able to devote greater resources to the development, promotion and sale of services and may be able to deliver competitive services or solutions at a lower end user price. Any of these competitive pressures could have a material adverse effect on our business, results of operations and financial condition.
Our business is driven substantially by the relation between the value we provide and the amounts we charge of that value. If the scope and quality of our services lag behind the market or lower cost participants are able to provide competitive services at lower prices, we may lose client/employers which could have an adverse impact on our results of operations and financial condition.
As noted in the description of business, we are in the business of assisting our client/employers control the cost of their employee workers’ compensation claims. While we believe that factors, including the quality of care provided to the employee, the rapidity at which the employee returns to work, and the service provided to the customer, play a part in the selection and retention process of our customers, we understand that price is a primary determining factor in whether client/employers selects or retains our services. While our competitors may offer direct fees less than those we charge, they have traditionally added fees to their other associated services and thus raised total cost of our services. If our competitors are able to reduce the cost at which they provide services, we anticipate that we would have to likewise attempt to reduce the cost at which we provide our services or risk losing employer customers. Either outcome could have a material adverse impact on our business, results of operations and financial condition.
Our financial performance is tied to the quality of the information technology platform we use to provide our services and communicate with our clients. The information technology business evolves rapidly and advancements can disrupt or alter the competitive environment.
Effective and competitive delivery of our services is increasingly dependent upon information technology resources and processes, both those provided internally as well as those provided through third-party vendors. In addition to better serving customers, the effective use of technology increases efficiency and enables us to reduce costs. Our future success will depend, in part, on our ability to address the needs of our client/employers by using technology to provide services to enhance customer convenience, as well as to create additional efficiencies in our operations. Many of our competitors have greater resources to invest in technological improvements. Additionally, as technology in the industry changes and evolves, keeping pace may become increasingly complex and expensive. There can be no assurance that we will be able to effectively implement new technology-driven products and services, which could reduce our ability to compete effectively.
An interruption in our ability to access, review or deliver critical data may cause customers to cancel their service and/or may reduce our ability to effectively compete.
Certain aspects of our business are dependent upon our ability to store, retrieve, process and manage data and to maintain and upgrade our data processing capabilities. Interruption of data processing capabilities for any extended length of time, loss of stored data, programming errors or other system failures could cause our client/employers to cancel their service and could have a material adverse effect on our business and results of operations.
In addition, we expect that a considerable amount of our future growth will depend on our ability to process and manage claims data more efficiently and to provide more meaningful healthcare information to customers and payors of healthcare. There can be no assurance that our current data processing capabilities will be adequate for our future growth, that we will be able to efficiently upgrade our systems to meet future demands, or that we will be able to develop, license or otherwise acquire software to address these market demands as well or as timely as our competitors.
Declines in workers’ compensation claims could materially impact our financial condition and results of operations.
Changes in the strength of the economy affect the size and activity of the work force and consequently alters the size of the work force and the level of workers’ compensation claims. In addition to working with our client/employers, we also provide outsource services to payors of worker’s compensation benefits. These payors include third party administrators, insurance companies, self-insured, self-administered employers and municipalities. If these payors reduce the amount of work they outsource, our financial condition and results of operations could be affected negatively.
Failure to maintain our licenses would have material impact on our business.
We require state issued licenses to operate our HCO and MPN networks in the state of California. If the state of California were to determine that we have failed to comply with the licensure requirements, it has the authority to deny, suspend or revoke our licenses. If our licenses were suspended or revoked, we would no longer be able to operate our HCO and/or MPN networks. In addition to the reduction in revenue we would experience from the loss of our HCO and/or MPN operations, the other services we offer would likely also be impacted negatively as many of the customers for our utilization review, medical bill review and nurse case management services are derived from our HCO and MPN clientele.
Our business is subject to online security risks, and if we are unable to safeguard the security and privacy of confidential data, our reputation and business could be harmed.
Our services involve the collection and storage of confidential information and the transmission of this information. For example, we collect personal information, information regarding medical history, and information regarding medical treatments. In certain cases, such information is provided to third-parties, and we may therefore be unable to control the use of such information or the security protections employed by such third-parties. We may be required to expend significant capital and other resources to protect against security breaches or to alleviate problems caused by security breaches. Despite our implementation of security measures, techniques used to obtain unauthorized access or to sabotage systems change frequently. As a result, we may be unable to anticipate these techniques or to implement adequate preventative measures. Any compromise or perceived compromise of our security (or the security of our third-party service providers who have access to our enrollees’ confidential information) could damage our reputation and our relationship with our customers, third-party administrators, insurers and enrollees, could reduce demand for our services and could subject us to significant liability as well as regulatory action. In addition, in the event that new data security laws are implemented, or our customers determine to impose new requirements on us relating to data security, we may be unable to timely comply with such requirements, or such requirements may not be compatible with our current processes. Changing our processes could be time consuming and expensive, and failure to timely implement required changes could result in our inability to sell our services.
Healthcare providers are becoming increasingly resistant to the application of certain healthcare cost containment techniques; this may cause revenue from some of our cost containment operations to decrease.
Healthcare providers have become more active in their efforts to minimize the use of certain cost containment techniques and are engaging in litigation to avoid application of certain cost containment practices. Recent litigation between healthcare providers and insurers has challenged certain insurers’ claims adjudication and reimbursement decisions. Although these lawsuits do not directly involve us or any services we provide, these cases may affect the use by insurers of certain cost containment services that we provide and may result in a decrease in revenue from our cost containment business.
If utilization by payors, including employers, of early intervention services continues to increase, the revenue from our later stage network and healthcare management services could be negatively affected.
The performance of early intervention services, including injury occupational healthcare, first notice of loss, and telephonic case management services, often result in a decrease in the average length of, and the total costs associated with, a healthcare claim. By successfully intervening at an early stage in a claim, the need for additional cost containment services for that claim often can be reduced or even eliminated. As employers continue to increase their utilization of early intervention services, the revenue from our later stage network and healthcare management services will decrease.
If we are unable to continue to attract and retain key employees with the skills our business requires, our business could be impacted negatively.
We compete with other workers’ compensation managed care companies and healthcare providers in recruiting qualified management and staff personnel. Employees with industry expertise are critical to our competitive strategy. There is intense competition for the services of such persons. We cannot guarantee that we will be able to attract and retain such persons if our competitors, many of whom have greater financial resources and larger organizations than ours, offer higher salaries, better benefit packages and broader opportunities than we are able to offer. If we are unable to attract or retain key employees, our business and financial condition could be affected.
Changes in government regulations could increase our costs of operations and/or reduce the demand for our services.
California has licensing and other regulatory requirements applicable to our business. These laws typically establish minimum standards for qualifications of personnel, confidentiality, internal quality control and dispute resolution procedures. These regulatory programs may result in increased costs of operation for us, which may have an adverse impact upon our ability to compete with other available alternatives for healthcare cost control. Regulation in the healthcare and workers’ compensation fields is constantly evolving. We are unable to predict what additional government initiatives affecting our business, if any, may be promulgated in the future. Our business may be adversely affected by failure to comply with existing laws and regulations, failure to obtain necessary licenses and government approvals or failure to adapt to new or modified regulatory requirements. Proposals for healthcare legislative reforms are regularly considered at the federal and state levels. To the extent that such proposals affect workers’ compensation, such proposals may affect adversely our business, financial condition and results of operations. In addition, changes in workers’ compensation and managed health care laws or regulations may reduce demand for our services, require us to develop new or modified services to meet the demands of the marketplace or reduce the fees that we may charge for our services. Any of these factors could materially impact our results of operations.
Exposure to potential litigation and legal liability may adversely affect our financial condition and results of operations.
Through our utilization review and nurse case management services, we make recommendations concerning the appropriateness of providers’ medical treatment plans of patients, and as a result, could be exposed to claims for adverse medical consequences. We do not grant or deny claims for payment of benefits and we do not believe that we engage in the practice of medicine or the delivery of medical services. There can be no assurance, however, that we will not be subject to claims or litigation related to the authorization or denial of claims for payment of benefits or allegations that we engage in the practice of medicine or the delivery of medical services.
In addition, there can be no assurance that we will not be subject to other litigation that may adversely affect our business, financial condition or results of operations, including but not limited to being joined in litigation brought against our customers in the managed care industry. We maintain professional liability insurance and such other coverages as we believe are reasonable in light of our experience to date. We also cannot assure you that our insurance will provide sufficient coverage or that insurance companies will make insurance available at a reasonable cost to protect us from significant future liability.
The price and trading volume of our common stock may be volatile, which may negative affect the value and liquidity of your shares.
The market price of our common stock may be highly volatile and subject to wide fluctuations. During the twelve month period ended December 31, 2016, the low bid price for our common stock was $7.10 per share and the high bid price was $12.50 per share. Our common stock is currently quoted on the OTC Markets, which is generally a thinly traded market that lacks the liquidity of certain other public markets. Additionally, there are a limited number of our shares of common stock outstanding, which may further limit the liquidity of our shares. Moreover, in the past, stock markets have experienced price and volume fluctuations that have particularly affected companies in the healthcare and managed care markets resulting in changes in the market price of the stock of many companies, which may not have been directly related to the operating performance of those companies. We cannot assure you that the market price for our common stock will not fluctuate or decline significantly in the future or that there will be sufficient trading volume in our common stock to allow you to sell your shares in the market when you desire to do so.
Our Chief Executive Officer, President and Chairman of the board of directors has the ability to exercise significant control over the Company.
Tom Kubota, our Chief Executive Officer, President and Chairman of the board of directors beneficially owns 483,000 shares, or approximately 60%, of our outstanding common stock. Since 2008, Mr. Kubota has a majority of our outstanding common stock and voting control of the Company. During 2016, the Company sold 1,000 shares of Series A Preferred Stock to Mr. Kubota, which represents 100% of the outstanding shares of Series A Preferred Stock of the Company. This transaction did not materially increase his economic interest in the Company, but it did increase his voting control to effectively 98%. In most matters, our Series A Preferred Stock is treated on parity with our common stock on a share-for-share basis, with the exception that each share of Series A Preferred Stock is entitled to 20,000 votes of common stock on all matters submitted to a vote of our common stock holders. The Series A Preferred Stock is convertible to shares of common stock on a one share for one share basis at the election of the holder thereof. The board of directors elected to sell shares of Series A Preferred Stock to Mr. Kubota because they believed the limited number of common shares outstanding restricted the Company’s ability to pursue potential acquisitions and other growth opportunities without jeopardizing the continuity of its strategic vision and business objectives. This capital structure may be viewed positively, negatively or indifferently by the market, investors and potential acquisition targets. If, it is viewed negatively, it could affect the liquidity and/or market price for our common stock.
This information is not required for smaller reporting companies.
We lease approximately 9,500 square feet of office space located at 1201 Dove Street, Suites 300 and 350 Newport Beach California, 92660. This office space lease expires in March 2022. This space serves as our principal executive offices, as well as, the principal offices of our subsidiaries. We believe this space will be sufficient for our needs for the foreseeable future.
From time to time, we may become involved in various lawsuits and legal proceedings which arise in the ordinary course of business. Litigation is subject to inherent uncertainties, and an adverse result in such matters may arise from time to time that may harm our business. To the knowledge of management, there is no material litigation or governmental agency proceeding pending or threatened against us or any of our subsidiaries. Further, we are not aware of any material proceeding to which any director, member of senior management or owner of record or beneficially of more than five percent of any class of our voting securities or any of our subsidiaries, or any associate of any of them is a party adverse to or has a material interest adverse to us or any of our subsidiaries.
Not applicable.
PART II
ITEM 5. MARKET FOR REGISTRANT’S COMMON EQUITY, RELATED STOCKHOLDER MATTERS AND ISSUER PURCHASES OF EQUITY SECURITIES
Market Information
Our common stock is currently traded on the OTCQB under the ticker symbol “PFHO”. The following table presents the quarterly high and low bid quotations for the periods indicated. The following table sets forth the published high and low bid quotations furnished to us by OTC Markets Group, Inc. These quotations reflect inter-dealer prices without retail mark-up, mark-down or commission and may not necessarily represent actual transactions.
|
|
High
|
Low
|
||||||
|
|
||||||||
|
Fiscal year ended December 31, 2016
|
||||||||
|
|
||||||||
|
Fourth Quarter
|
$
|
12.50
|
$
|
8.60
|
||||
|
Third Quarter
|
$
|
10.25
|
$
|
8.50
|
||||
|
Second Quarter
|
$
|
10.25
|
$
|
7.10
|
||||
|
First Quarter
|
$
|
10.00
|
$
|
7.36
|
||||
|
|
||||||||
|
Fiscal year ended December 31, 2015
|
||||||||
|
|
||||||||
|
Fourth Quarter
|
$
|
22.90
|
$
|
7.40
|
||||
|
Third Quarter
|
$
|
31.00
|
$
|
16.25
|
||||
|
Second Quarter
|
$
|
34.01
|
$
|
29.05
|
||||
|
First Quarter
|
$
|
42.50
|
$
|
30.00
|
||||
Holders
As of March 16, 2017, we had approximately 295 shareholders of record holding 800,000 shares of our common stock. The number of record shareholders was determined from the records of our stock transfer agent and does not include beneficial owners of common stock whose shares are held in “nominee” or “street” name.
Dividends
On September 4, 2015, our board of directors declared a special one-time cash dividend of $1.25 per share payable to the record holders of our common stock on September 14, 2015. Prior to September 2015, we had not declared a cash dividend on any class of equity securities and the board of directors does not currently anticipate declaring cash dividends in the future.
Our ability to pay dividends is subject to limitations imposed by Utah law. Under Utah law, dividends may not be made if, after giving effect to the dividend; a) the company would be unable to pay its debts as they become due in the usual course of business; or b) the company’s total assets would be less than the sum of its total liabilities plus the amount that would be needed to satisfy the rights of any holders of preferential rights whose rights are superior to those receiving the dividend.
Securities Authorized for Issuance Under Equity Compensation Plans
Information regarding securities authorized for issuance under our equity compensation plans is set forth in Item 12 – Security Ownership of Certain Beneficial Owners and Management and Related Stockholder Matters of this Annual Report on Form 10-K under the heading “Equity Compensation Plans”.
Performance Graph
This information is not required for smaller reporting companies.
Recent Sales of Unregistered Securities
Except as previously reported in our Quarterly Reports on Form 10-Q and our Current Reports on Form 8-K, we have not sold any other equity securities during the year ended December 31, 2016, which were not registered under the Securities Act of 1933, as amended.
Purchases of Equity Securities by the Issuer and Affiliated Purchasers
Neither we, nor any affiliated purchaser, purchased any of our equity securities during the year ended December 31, 2016.
This information is not required for smaller reporting companies.
The following is a discussion of our consolidated financial condition and results of operations for the years ended December 31, 2016 and 2015, and other factors that are expected to affect our prospective financial condition. The following discussion and analysis should be read together with our Consolidated Financial Statements and related notes beginning on page 23 of this Annual Report on Form 10-K.
Some of the statements set forth in this section are forward-looking statements relating to our future results of operations, liquidity and capital resources. Our actual results, liquidity and capital resources may vary from the results anticipated by these statements. We disclaim any obligation to update or revise any forward-looking statements based on the occurrence of future events, the receipt of new information, or otherwise. Actual future results may differ materially from those expressed in the forward-looking statement made by the Company or its management as a rest of a number of risks, uncertainties and assumptions. Please see “Cautionary Statement Regarding Forward-Looking Statements” on page 4 of this Annual Report on Form 10-K.
Overview
We are workers’ compensation cost containment specialists. Our business objective is to deliver value to our clients that reduces their workers’ compensation related medical claims expense in a manner that will assure that injured employees receive high quality healthcare that allows them to recover from injury and return to gainful employment without undue delay. Our clients include self-administered employers, insurers, third party administrators, municipalities and others. Although we have processed medical bill reviews in 25 states, our principal clients are located in the State of California where the high cost of workers’ compensation insurance is a critical problem.
Our core service focuses on reducing medical treatment costs by enabling employer/clients to share the control over the medical treatment process. This control is obtained by participation in one of our medical treatment networks. We realize revenues from enrollment of the employees of our client/employers into our various networks. To assist our client/employers to ensure quality, timely and cost effective treatment of their injured employees, we make our staff of credentialed registered nurses available to provide case management to assure treatment plans are properly aligned from a medical perspective.
Beyond the core services we also provide claims-related services including utilization review, medical bill review, lien representation and legal support and Medicare set aside service that bring efficiencies to claims processing and management that further reduces the overall burden of worker compensation claims resolution.
Our business generally has a long sales cycle, typically in excess of one year. Once we have established a customer relationship and enrolled employees of our client/employers, our revenue adjusts with the growth or retraction of client/employers’ managed headcount. Throughout the year, new employees and client/employers are added while others terminate from the program for a variety of reasons.
In the current economic environment, we anticipate businesses will continue to seek ways to control their workers’ compensation program costs. Even though our HCO and MPN programs have been shown to create a favorable return on investment for our client/employers, (as our services are a significant component of the employers’ loss prevention programs), from time-to-time we experience customer volatility in the form of existing client/employers terminating or seeking to renegotiate the scope and terms of existing services, or seeking to reduce costs by managing their workers’ compensation care services in-house.
Summary of Fiscal 2016
During the year ended December 31, 2016, total revenues decreased 31% due primarily to the loss of several large customers during the latter part of 2015 and early 2016. Revenue from utilization review, MPN and medical bill review were most directly impacted decreasing 78%, 39%, and 37%, respectively. Offsetting those reductions, revenue from nurse case management services and HCO increased 85% and 13%, respectively. During fiscal 2016, we were successful in adding a number of new clients whose combined revenues totaled $527,215, which helped offset some of the impact of the losses experienced in the latter part of 2015 and early 2016.
During fiscal 2016, we were able to reduce operating expenses by 13%, primarily as a result of lower outsource service fees. This reduction was partially offset by higher data maintenance fees. As a result, our income from operations was $969,328 during fiscal 2016, compared to $2,822,211 in fiscal 2015.
Our provision for income tax expense decreased 65% during fiscal 2016 as a result of the decrease in income from operations.
Our net income decreased 66% to $566,748. Basic and fully diluted earnings per share during fiscal 2016 was $0.71, compared to $2.10 during fiscal 2015.
Comparison of the Fiscal Years Ended December 31, 2016 and 2015
Results of Operations
The following represents selected components of our consolidated results of operations, for the years ended December 31, 2016 and 2015, respectively, together with changes from year-to-year:
|
Year Ended December 31,
|
||||||||||||||||
|
2016
|
2015
|
Amount Change
|
% Change
|
|||||||||||||
|
Revenues
|
||||||||||||||||
|
HCO fees
|
$
|
1,427,936
|
$
|
1,268,635
|
$
|
159,301
|
13
|
%
|
||||||||
|
MPN fees
|
578,646
|
947,903
|
(369,257
|
)
|
(39
|
%)
|
||||||||||
|
UR fees
|
775,610
|
3,458,398
|
(2,682,788
|
)
|
(78
|
%)
|
||||||||||
|
MBR fees
|
625,492
|
988,731
|
(363,239
|
)
|
(37
|
%)
|
||||||||||
|
NCM fees
|
1,735,772
|
939,675
|
796,097
|
85
|
%
|
|||||||||||
|
Other
|
544,240
|
621,132
|
(76,892
|
)
|
(12
|
%)
|
||||||||||
|
Total revenues
|
5,687,696
|
8,224,474
|
(2,536,778
|
)
|
(31
|
%)
|
||||||||||
|
Expense
|
||||||||||||||||
|
Depreciation
|
84,700
|
69,254
|
15,446
|
22
|
%
|
|||||||||||
|
Bad debt provision
|
13,500
|
14,417
|
(917
|
)
|
(6
|
%)
|
||||||||||
|
Consulting fees
|
340,653
|
370,956
|
(30,303
|
)
|
(8
|
%)
|
||||||||||
|
Salaries and wages
|
2,316,571
|
2,324,977
|
(8,406
|
)
|
(0
|
%)
|
||||||||||
|
Professional fees
|
328,943
|
395,627
|
(66,684
|
)
|
(17
|
%)
|
||||||||||
|
Insurance
|
339,235
|
339,619
|
(384
|
)
|
(0
|
%)
|
||||||||||
|
Outsource service fees
|
402,894
|
1,094,944
|
(692,050
|
)
|
(63
|
%)
|
||||||||||
|
Data maintenance
|
230,619
|
154,524
|
76,095
|
49
|
%
|
|||||||||||
|
General and administrative
|
661,253
|
637,945
|
23,308
|
4
|
%
|
|||||||||||
|
Total expenses
|
4,718,368
|
5,402,263
|
(683,895
|
)
|
(13
|
%)
|
||||||||||
|
Income from operations
|
969,328
|
2,822,211
|
(1,852,883
|
)
|
(66
|
%)
|
||||||||||
|
Other expense
|
||||||||||||||||
|
Interest expense
|
-
|
202
|
(202
|
)
|
(100
|
%)
|
||||||||||
|
Total other expense
|
-
|
202
|
(202
|
)
|
(100
|
%)
|
||||||||||
|
Income before income tax provision
|
969,328
|
2,822,009
|
(1,852,681
|
)
|
(66
|
%)
|
||||||||||
|
Income tax provision
|
402,580
|
1,144,785
|
(742,205
|
)
|
(65
|
%)
|
||||||||||
|
Net income
|
$
|
566,748
|
$
|
1,677,224
|
$
|
(1,110,476
|
)
|
(66
|
%)
|
|||||||
Revenue
Total revenues during the year ended December 31, 2016, decreased 31% to $5,687,696 compared to $8,224,474 during the year ended December 31, 2015.
During 2016, HCO and nurse case management revenues increased 13% and 85%, respectively, and MPN, utilization review, medical bill review and other revenues decreased by 39%, 78%, 37%, and 12%, respectively. Other revenues consisted of revenues derived primarily from network claims repricing services, lien representation services, legal support services, workers’ compensation carve out revenues and Medicare set aside revenues. The loss of several large customers during the latter part of 2015 had a significant negative impact on our revenues during 2016.
The following table summarizes approximate enrollment in our HCO and MPN networks as of December 31, 2016 and 2015, respectively, together with changes from year-to-year:
|
As of December 31,
|
||||||||||||||||
|
2016
|
2015
|
Amount Change
|
% Change
|
|||||||||||||
|
HCO
|
182,000
|
145,000
|
37,000
|
26
|
%
|
|||||||||||
|
MPN
|
136,000
|
206,000
|
(70,000
|
)
|
(34
|
%)
|
||||||||||
|
Total enrollment
|
318,000
|
351,000
|
(33,000
|
)
|
(9
|
%)
|
||||||||||
The net increase during 2016 in HCO enrollment when compared to the previous year was primarily the result of several existing HCO customers increasing their enrollment and the addition of a new customer. MPN enrollment decreased primarily as a result of the loss of a major MPN customer, and reductions in employee enrollment from several of our self-insured MPN clients.
Utilization Review
During the year ended December 31, 2016, utilization review revenue decreased $2,682,788 to $775,610. During the fourth quarter 2015, the largest customer of our utilization review services, terminated our services. During 2016 we recorded $0 revenue from that former customer compared to $2,564,042 in 2015. The loss of that customer had a significant negative impact on our utilization review fees and total revenue during 2016.
Medical Bill Review
During the twelve months ended December 31, 2016, revenue from medical bill review decreased by $363,239 to $625,492 when compared the same period a year earlier. This was largely the result of the loss of a large customer in June 2015 and lower revenues realized from two other customers. During 2016, we recorded no revenue from the customer lost in June 2015 compared to $330,429 in revenues realized from this customer in 2015.
HCO
During the years ended December 31, 2016 and 2015, HCO revenue was $1,427,936 and $1,268,635, respectively. HCO revenue increased 13% during 2016 and HCO employee enrollment increased 26% when compared to the same period a year earlier. Increases in HCO revenue generally lag several months behind increases in HCO enrollment because there is typically a ramp up period between the time new employees are enrolled and when we begin generating revenue from claims processing and other HCO services. The increase in HCO revenue of $159,301 was primarily attributable to revenue derived from initial notification fees and mailing fees from a new HCO customer. These initial notification and mailing fees occur at the time new employees are enrolled and reoccur in future periods based on the terms of the customer’s contract.
MPN
MPN revenue for 2016 was $578,646 compared to $947,903 for 2015, a decrease of 39%. During the same period, employee enrollment decreased by 34% resulting primarily from terminations by a large customer in each of the third and fourth fiscal quarters of 2015. These customer losses were partially offset by adding new customers in the third quarter of 2015 and the first and second quarters of 2016, coupled with increases in revenue from existing customers.
Nurse Case Management
During the twelve-month periods ended December 31, 2016 and 2015, revenue from nurse case management revenue was $1,735,772 and $939,675, respectively. The increase in nurse case management revenue of $796,097 was primarily attributable to adding three new customers, and net increases from existing customers which contributed $306,999 and $489,098, respectively, to the total increase in nurse case management revenue.
Other
Other fees consist of revenue derived from network access and claims repricing, lien representation, legal support services, Medicare set aside, and worker’s compensation carve-outs services. Other fee revenue for the years ended December 31, 2016 and 2015, was $544,240 and $621,132, respectively.
Revenue from network access and claims repricing fees contributed 79% and 89% of total Other fees during 2016 and 2015, respectively. We realized a 23% decrease in network access fees as a result of one customer realizing lower savings from using our network. During fiscal 2016, Medicare set aside contributed 14% to Other fees. We did not offer Medicare set aside services during fiscal 2015.
Expenses
Total expenses for the years ended December 31, 2016 and 2015, were $4,718,368 and $5,402,263, respectively. The decrease of $683,895 was primarily the result of decreases in outsource service and professional fees. These decreases were partially offset by increased data maintenance expense.
Depreciation
During the twelve-month period ended December 31, 2016, we recorded depreciation expense of $84,700 compared to $69,254 during the comparable 2015 period. The increase in depreciation was primarily attributable to the purchase of additional furniture, fixtures and computer equipment.
Bad Debt
During the years ended December 31, 2016 and 2015, we recorded bad debt provisions of $13,500 and $14,417, respectively, to cover potential uncollectible receivables from various customers. At December 31, 2016 and 2015, our allowances for bad debt balances were $64,150 and $55,000, respectively. The accrual for bad debt provision was lower in 2016, compared to 2015, due to a lower number of potential uncollectable accounts.
Consulting Fees
During the year ended December 31, 2016, consulting fees decreased approximately 8% to $340,653 from $370,956 during 2015. This decrease of $30,303 was primarily the result of hiring a consultant in December 2015, whose position was changed to an employee position in March 2016.
Salaries and Wages
During the twelve months ended December 31, 2016, salaries and wages decreased less than 1%. This decrease was primarily the result of employee vacancies during the year and salary reductions of 10% realized from three senior executives partially offset by writing off of deferred compensation and higher levels of commissions. As of December 31, 2016 and 2015, the Company employed 37 and 36 full-time employees, respectively.
Professional Fees
For the year ended December 31, 2016, we incurred professional fees of $328,943 compared to $395,627 during the same period in 2015. This 17% decrease was primarily the result of lower professional fees paid for field case management services which was partially offset by higher legal fees.
Insurance
During 2016, we incurred insurance expenses of $339,235, a decrease of $384 when compared to 2015. We expect insurance fees to moderately increase starting in May of 2017.
Outsource Service Fees
Outsource service fees consist of costs incurred by our subsidiaries in outsourcing utilization review, medical bill review and nurse case management services, and typically tends to increase and decrease in correspondence with increases and decreases in demand for those services. We incurred $402,894 and $1,094,944 in outsource service fees during the twelve-month periods ended December 2016 and 2015, respectively. The decrease of $692,050 was primarily the result of the termination of business with a large customer in September 2015. We anticipate our outsource service fees will continue to move in correspondence with the level of utilization review, medical bill review and certain nurse case management services we provide in the future.
Data Maintenance
During the year ended December 31, 2016, we incurred data maintenance fees of $230,619, an increase of $76,095 over 2015. During the same twelve–month period we experienced an HCO employee enrollment increase of 25% when compared to 2015. The data maintenance fees increase was primarily attributable to data maintenance fees incurred for enrollment of a new HCO customer in March 2016.
General and Administrative
General and administrative expenses increased 4% to $661,253 during the twelve months ended December 31, 2016, when compared to 2015. The increase in general and administrative expense was primarily attributable to increases in charitable contributions, IT enhancement expense, license and permits, office supplies, postage expense, telephone expense, office rent and vacation expense, partially offset by decreases in advertising, dues and subscriptions, loss on settlement, moving expense, shareholders expense, travel and entertainment, and miscellaneous general and administrative expense.
Income from Operations
As a result of the 31% decrease in total revenue during fiscal 2016, which was only partially offset by the 13% decrease increase in total expenses, our income from operations decreased 66% during the fiscal year ended December 31, 2016, when compared to the same fiscal period of 2015.
Other Expense
During 2016, we realized zero other expense, compared to $202 during 2015. This decrease in other expense was the result of no interest expense incurred in 2016.
Income Tax Provision
Because we realized income from operations of $969,328 during the year ended December 31, 2016, compared to $2,822,211 during the year ended December 31, 2015, we realized a $742,205, or 65%, decrease in our income tax provision.
Net Income
During the year ended December 31, 2016, total revenues of $5,687,696 were lower by $2,536,778 when compared to the same period 2015. This decrease in total revenues was partially offset by decreases in total expenses of $683,895, resulting in income from operations of $969,328, compared to income from operations of $2,822,211 during 2015. We realized net income of $566,748 in 2016, compared to net income of $1,677,224 during 2015. As discussed in this report, the loss of several major clients during 2015 and early 2016, contributed to the lower net income in 2016. Although the loss of these customers substantially negatively impacted our net income in 2016, we were able to add a number of new customers during 2016. Revenue from these new customers accounted for approximately 10% of our total revenue during 2016.
Liquidity and Capital Resources
We realized net income and an increase in cash during fiscal 2016. As of December 31, 2016, we had cash on hand of $5,005,617 compared to $3,834,924 at December 31, 2015. The $1,170,693 increase in cash on hand was primarily the result of net cash provided by our operating activities and net cash provided by financing activities, partially offset by cash used in investing activities. Net cash provided by our operating activities was the result of realizing net income coupled with decreases in our account receivables, deferred tax assets, prepaid income tax, deferred compensation and increases in depreciation, bad debt provision, accounts payable, accrued expenses, income tax payable and deferred rent. We used $42,484 in investing activities for purchases of computers, furniture and equipment. Cash flow from financing activities was the result of the issuance of Series A Preferred Stock, partially offset by payments of outstanding dividends payable. Barring a significant downturn in the economy or the loss of major customers, we believe that cash on hand and anticipated revenues from operations will be sufficient to cover our operating expenses over the next twelve months.
We currently have planned certain capital expenditures during 2016, to expand our IT capabilities. We believe we have adequate capital on hand to cover these expenditures and do not anticipate this will require us to seek outside sources of funding. We continue to investigate potential opportunities to expand our business either through the creation of new business lines or the acquisition of existing businesses. We have not identified any suitable opportunity at the current time. We anticipate an expansion or acquisition of this sort may require greater capital resources than we currently possess. Should we need additional capital resources, we could seek to obtain such through debt and/or equity financing. We do not currently possess an institutional source of financing and there is no assurance that we could be successful in obtaining equity or debt financing when needed on favorable terms, or at all. We could also use shares of our capital stock as consideration for a business acquisition transaction.
During the third fiscal quarter 2015, the Company terminated its common stock repurchase program. As of December 31, 2015, we had repurchased 8,269 shares as treasury stock for approximately $254,057. During the year 2016, all of the treasury stock was retired.
During the third fiscal quarter 2015, our board of directors declared a special one-time cash dividend of $1.25 per share payable to the record holders of our common stock on September 14, 2015. As of December 31, 2016, the cumulative amount paid for the dividend was $935,667 with $56,923 payable. This payable has been accrued and included in dividend payable on the balance sheet.
Cash Flow
During the year ended December 31, 2016, cash was primarily used to fund operations. We had net increases in cash of $1,170,693 and $888,899 during the years ended December 31, 2016 and 2015, respectively. See below for additional, discussion and analysis of cash flow.
|
|
December 31, 2016
|
December 31, 2015
|
||||||
|
|
||||||||
|
Net cash provided by operating activities
|
$
|
1,206,239
|
$
|
2,166,322
|
||||
|
Net cash (used in) investing activities
|
(42,484
|
)
|
(158,325
|
)
|
||||
|
Net cash provided by (used in) by financing activities
|
6,938
|
(1,119,098
|
)
|
|||||
|
Net increase in cash
|
$
|
1,170,693
|
$
|
888,899
|
||||
Net cash provided by operating activities was $1,206,239 and $2,166,322 in 2016 and 2015, respectively. The decrease of $960,083 in cash flow from operating activities is primarily the result of decreases in net income, accounts receivable, deferred tax asset and unearned revenue and increases in bad debt provision and prepaid expenses, partially offset by increases in depreciation, other assets, accounts payable, accrued expenses, income tax payable, and deferred rent expense and decrease in prepaid income deferred compensation.
Net cash used in investing activities was $42,484 and $158,325 in 2016 and 2015, respectively. Net cash used in investing activities was higher by $115,841 in 2015, because we purchased computers, furniture and equipment for our new offices.
Net cash provided by financing activities in 2016 was $6,938. By comparison, in 2015 we used cash $1,119,098 in financing activities in 2015. During 2016 and 2015, we paid cash dividends totaling $2,062 and $933,605, respectively. In 2016 we issued 1,000 shares of our Series A preferred stock for $9,000. No Series A preferred stock was issued in 2015. In 2016 we did not repurchase any of our outstanding common stock. In 2015 we repurchased 6,241 shares of our outstanding common stock at a cost of $177,342. During fiscal 2016, we paid $8,151 less in capital lease obligations than in 2015 as a result of the termination of our remaining capital lease.
Summary of Material Contractual Commitments as of December 31, 2016
The following is a summary of our material contractual commitments as of December 31, 2016:
|
|
Payments Due By Period
|
|||||||||||||||||||
|
|
Total
|
Less than 1 year
|
1-3 years
|
3-5 years
|
More than 5 years
|
|||||||||||||||
|
Operating Leases:
|
||||||||||||||||||||
|
Operating Leases – Equipment(1)
|
$
|
1,920
|
$
|
1,920
|
$
|
-
|
$
|
-
|
$
|
-
|
||||||||||
|
Office Leases(2)
|
1,366,484
|
228,329
|
502,816
|
537,929
|
97,410
|
|||||||||||||||
|
Total Operating Leases
|
$
|
1,368,404
|
$
|
230,249
|
$
|
502,816
|
$
|
537,929
|
$
|
97,410
|
||||||||||
| (1) |
In February 2014 we entered into a 36 month operating lease for an office copy machine with monthly payments at $960.
|
| (2) |
On July 23, 2015, we entered into a 79 month lease to lease approximately 9,439 square feet of office space that commenced on September 28, 2015. This office space serves as our principal executive offices, as well as, the principal offices of our operating subsidiaries.
|
In January 2010, we entered into a capital lease arrangement whereby we leased an office copy machine for $25,543. The asset was recorded on our balance sheet under office equipment under capital lease and our liability incurred under the lease was recorded as current and noncurrent obligations under capital lease. The lease arrangement was for a term of 48 months at level rents with capital interest rate at 7%. During January 2015, this office copy machine under our capital lease arrangement was retired.
In August 2012, we entered into a capital lease arrangement whereby we leased office server equipment for $38,380. The asset was recorded on our balance sheet under office equipment under capital lease and our liability incurred under the lease was recorded as current and noncurrent obligations under capital lease. The lease arrangement was for a term of 36 months at level rents with capital interest rate at 7.5%. The term of this capital lease arrangement expired in July 2015.
Off-Balance Sheet Financing Arrangements
As of December 31, 2016, we had no off-balance sheet financing arrangements.
Critical Accounting Policies and Estimates
The preparation of financial statements in accordance with accounting standards generally accepted in the United States requires management to make estimates and assumptions that affect both the recorded values of assets and liabilities at the date of the financial statements and the revenues recognized and expenses incurred during the reporting period. Our estimates and assumptions affect our recognition of deferred expenses, bad debts, income taxes, the carrying value of our long-lived assets and our provision for certain contingencies. These estimates require management to make difficult, subjective and complex judgments, often as a result of the need to make estimates about the effect of matters that are inherently uncertain and may change in subsequent periods. We evaluate the reasonableness of these estimates and assumptions continually based on a combination of historical information and other information that comes to our attention that may vary our outlook for the future. Actual results may differ from these estimates under different assumptions.
The following is not intended to be a comprehensive list of our accounting policies. Management suggests that Note 2 – Significant Accounting Policies of the Consolidated Financial Statements included in this Annual Report on Form 10-K, be read in conjunction with this Management’s Discussion and Analysis of Financial Condition and Results of Operations for additional information regarding critical accounting policies. We believe the critical accounting policies that most impact our Consolidated Financial Statements are described below.
Basis of Accounting — We used the accrual method of accounting in accordance with accounting principles generally accepted in the United States for the period ended December 31, 2016.
Revenue Recognition — In general, we recognize revenue when (i) persuasive evidence of an arrangement exists, (ii) delivery has occurred or services have been rendered, (iii) the fee is fixed or determinable and (iv) collectability is reasonably assured. Revenues are generated as services are provided to the customer based on the sales price agreed and collected. We recognize revenue as the time is worked or as units of production are completed, which is when the revenue is earned and realized. Labor costs are recognized as the costs are incurred. We derive our revenue from the sale of Managed Care Services, Review Services and Case Management Services. These services are billed individually as separate components to our customers.
These fees include monthly administration fees, claim network fees, flat rate fees or hourly fees depending on the agreement with the client. Such revenue is recognized at the end of each month for which services are performed.
Management reviews each agreement in accordance with the provision of revenue recognition topic ASC 605. Arrangements entered into pursuant to such agreements can consist of bundled managed care which include various units of accounting such as network solutions and patient management which includes managed care. Such elements are considered separate units of accounting due to each element having value to the customer on a stand-alone basis and are billed separately. The selling price for each unit of accounting is determined using the contract price. When our customers purchase several products the pricing of the products sold is generally the same as if the products were sold on an individual basis. Revenue is recognized as the work is performed in accordance with our customer contracts. Based upon the nature of our products, bundled managed care elements are generally delivered in the same accounting period. We recognize revenue for patient management services ratably over the life of the customer contract. We estimate, based upon prior experience in managed care, the deferral amount from when the customers claim is received to when the customer contract expires. Advance payments from subscribers and billings made in advance are recorded on the balance sheet as deferred revenue.
Accounts Receivables and Bad Debt Allowance – In the normal course of business we extend credit to our customers on a short-term basis. Although the credit risk associated with these customers is minimal, we routinely review our accounts receivable balances and makes provisions for doubtful accounts. We age our receivables by date of invoice. Management reviews bad debt reserves quarterly and reserves specific accounts as warranted or sets up a general reserve based on amounts over 90 days past due. When an account is deemed uncollectible, we charge off the receivable against the bad debt reserve. A considerable amount of judgment is required in assessing the realization of these receivables including the current creditworthiness of each customer and related aging of the past-due balances, including any billing disputes. In order to assess the collectability of these receivables, we perform ongoing credit evaluations of our customers’ financial condition. Through these evaluations, we may become aware of a situation where a customer may not be able to meet its financial obligations due to deterioration of its financial viability, credit ratings or bankruptcy. The allowance for doubtful accounts is based on the best information available to us and is reevaluated and adjusted as additional information is received. We evaluate the allowance based on historical write-off experience, the size of the individual customer balances, past-due amounts and the overall national economy. At fiscal year ended 2016 and 2015, our bad debt reserve of $64,150 and $55,000, respectively as a general reserve for certain balances over 90 days past due and for accounts that are potentially uncollectible.
The percentages of the amounts due from major customers to total accounts receivable as of December 31, 2016 and 2015, are as follows:
|
|
12/31/16
|
12/31/15
|
||||||
|
Customer A
|
14
|
%
|
13
|
%
|
||||
|
Customer B
|
7
|
%
|
11
|
%
|
||||
|
Customer C
|
14
|
%
|
8
|
%
|
||||
|
Customer D
|
7
|
%
|
18
|
%
|
||||
Recently Issued Accounting Pronouncements
We have evaluated all recently issued accounting pronouncements of the FASB, and have concluded that none of them may have or will have a significant financial impact on our financial statements.
This information is not required for smaller reporting companies.
PRITCHETT, SILER & HARDY, P.C.
CERTIFIED PUBLIC ACCOUNTANTS
A PROFESSIONAL CORPORATION
515 SOUTH 400 EAST, SUITE 100
SALT LAKE CITY, UTAH 84111
(801) 328-2727 FAX (801) 328-1123
To the Board of Directors and Stockholders
Pacific Health Care Organization, Inc.
Newport Beach, CA
We have audited the accompanying consolidated balance sheets of Pacific Health Care Organization, Inc. as of December 31, 2016 and 2015 and the related consolidated statements of operations, stockholders’ equity and cash flows for the years then ended. These financial statements are the responsibility of the Company’s management. Our responsibility is to express an opinion on these consolidated financial statements based on our audits.
We conducted our audits in accordance with the standards of the Public Company Accounting Oversight Board (United States). Those standards require that we plan and perform the audit to obtain reasonable assurance about whether the financial statements are free of material misstatement. The Company is not required to have, nor were we engaged to perform, an audit of its internal control over financial reporting. Our audit included consideration of internal control over financial reporting as a basis for designing audit procedures that are appropriate in the circumstances, but not for the purpose of expressing an opinion on the effectiveness of the Company’s internal control over financial reporting. Accordingly, we express no such opinion. An audit also includes examining, on a test basis, evidence supporting the amounts and disclosures in the financial statements, assessing the accounting principles used and significant estimates made by management, as well as evaluating the overall financial statement presentation. We believe that our audits provide a reasonable basis for our opinion.
In our opinion, the financial statements referred to above present fairly, in all material respects, the consolidated financial position of Pacific Health Care Organization, Inc. as of December 31, 2015 and 2014 and the consolidated results of their operations and cash flows for the years then ended, in conformity with accounting principles generally accepted in the United States of America.
/s/ Pritchett, Siler & Hardy, P.C.
Pritchett, Siler & Hardy, P.C.
Salt Lake City, Utah
March 30, 2017
Pacific Health Care Organization, Inc.
|
ASSETS
|
||||||||
|
|
December 31,
|
December 31,
|
||||||
|
|
2016
|
2015
|
||||||
|
Current Assets
|
||||||||
|
Cash
|
$
|
5,005,617
|
$
|
3,834,924
|
||||
|
Accounts receivable, net of allowance of $64,150 and $55,000
|
849,648
|
1,040,357
|
||||||
|
Prepaid income tax
|
-
|
245,419
|
||||||
|
Deferred tax assets
|
11,661
|
35,296
|
||||||
|
Prepaid expenses
|
136,862
|
66,200
|
||||||
|
Total current assets
|
6,003,788
|
5,222,196
|
||||||
|
|
||||||||
|
Property and Equipment, net
|
||||||||
|
Computer equipment
|
349,955
|
308,266
|
||||||
|
Furniture and fixtures
|
206,785
|
206,784
|
||||||
|
Office equipment
|
15,595
|
14,800
|
||||||
|
Total property and equipment
|
572,335
|
529,850
|
||||||
|
Less: accumulated depreciation and amortization
|
(346,295
|
)
|
(261,594
|
)
|
||||
|
Net property and equipment
|
226,040
|
268,256
|
||||||
|
Other assets
|
26,788
|
26,788
|
||||||
|
Total assets
|
$
|
6,256,616
|
$
|
5,517,240
|
||||
|
LIABILITIES AND STOCKHOLDERS’ EQUITY
|
||||||||
|
Current Liabilities
|
||||||||
|
Accounts payable
|
$
|
101,294
|
$
|
63,565
|
||||
|
Accrued expenses
|
253,367
|
212,144
|
||||||
|
Income tax payable
|
31,226
|
-
|
||||||
|
Dividends payable
|
56,923
|
58,985
|
||||||
|
Unearned revenue
|
38,748
|
43,329
|
||||||
|
Deferred rent expense
|
17,485
|
6,891
|
||||||
|
Total current liabilities
|
499,043
|
384,914
|
||||||
|
|
||||||||
|
Total Liabilities
|
499,043
|
384,914
|
||||||
|
|
||||||||
|
Commitments and Contingencies
|
||||||||
|
|
||||||||
|
Shareholder’s Equity
|
||||||||
|
Preferred stock; 5,000,000 shares authorized at $0.001 par value of which 10,000 shares
designated as Series A preferred and 1,000 shares issued and outstanding at December 31, 2016
and zero shares of Series A preferred designated, issued and outstanding at December 31, 2015.
|
1
|
-
|
||||||
|
Common stock, $0.001 par value, 50,000,000 shares authorized at December 31, 2016 and
2015; 802,424 shares issued (800,000 outstanding) and 802,424 issued and (800,000
outstanding net of treasury shares), respectively.
|
800
|
800
|
||||||
|
Additional paid-in capital
|
428,072
|
673,130
|
||||||
|
Treasury stock at cost (zero shares and 2,028 shares outstanding at December 31, 2016 and
2015, respectively)
|
-
|
(254,057
|
)
|
|||||
|
Deferred stock compensation
|
-
|
(49,499
|
)
|
|||||
|
Retained earnings
|
5,328,700
|
4,761,952
|
||||||
|
Total stockholders’ equity
|
5,757,573
|
5,132,326
|
||||||
|
|
||||||||
|
Total liabilities and stockholders’ equity
|
$
|
6,256,616
|
$
|
5,517,240
|
||||
The accompanying notes are an integral part of these consolidated financial statements.
Pacific Health Care Organization, Inc.
|
|
Years Ended
|
|||||||
|
|
December 31,
|
December 31,
|
||||||
|
|
2016
|
2015
|
||||||
|
Revenues
|
||||||||
|
HCO fees
|
$
|
1,427,936
|
$
|
1,268,635
|
||||
|
MPN fees
|
578,646
|
947,903
|
||||||
|
UR fees
|
775,610
|
3,458,398
|
||||||
|
MBR fees
|
625,492
|
988,731
|
||||||
|
NCM fees
|
1,735,772
|
939,675
|
||||||
|
Other
|
544,240
|
621,132
|
||||||
|
Total revenues
|
5,687,696
|
8,224,474
|
||||||
|
|
||||||||
|
Expenses
|
||||||||
|
Depreciation
|
84,700
|
69,254
|
||||||
|
Bad debt provision
|
13,500
|
14,417
|
||||||
|
Consulting fees
|
340,653
|
370,956
|
||||||
|
Salaries and wages
|
2,316,571
|
2,324,977
|
||||||
|
Professional fees
|
328,943
|
395,627
|
||||||
|
Insurance
|
339,235
|
339,619
|
||||||
|
Outsource service fees
|
402,894
|
1,094,944
|
||||||
|
Data maintenance
|
230,619
|
154,524
|
||||||
|
General and administrative
|
661,253
|
637,945
|
||||||
|
|
||||||||
|
Total expenses
|
4,718,368
|
5,402,263
|
||||||
|
|
||||||||
|
Income from operations
|
969,328
|
2,822,211
|
||||||
|
|
||||||||
|
Other expense
|
||||||||
|
Interest expense
|
-
|
202
|
||||||
|
Total other expense
|
-
|
202
|
||||||
|
Income before income tax provision
|
969,328
|
2,822,009
|
||||||
|
|
||||||||
|
Income tax provision
|
402,580
|
1,144,785
|
||||||
|
|
||||||||
|
Net income
|
$
|
566,748
|
$
|
1,677,224
|
||||
|
|
||||||||
|
Basic and fully diluted earnings per share:
|
||||||||
|
Earnings per share amount
|
$
|
0.71
|
$
|
2.10
|
||||
|
Weighted average common shares outstanding
|
800,000
|
800,000
|
||||||
The accompanying notes are an integral part of these consolidated financial statements.
Pacific Health Care Organization, Inc.
Consolidated Statements of Stockholders’ Equity
For the Years Ended December 31, 2016 and 2015
|
Preferred Stock
|
Common Stock
|
Treasury Stock
|
Deferred
|
Paid
|
|
Total
|
||||||||||||||||||||||||||||||||||
|
|
Shares
|
Amount
|
Shares
|
Amount
|
Shares
|
Amount
|
Stock
Compensation
|
in
Capital
|
Retained
Earnings |
Shareholders’
Equity
|
||||||||||||||||||||||||||||||
|
Balance January 1, 2015
|
-
|
$
|
-
|
800,396
|
$
|
800
|
2,028
|
$
|
(76,715
|
)
|
$
|
-
|
$
|
623,631
|
$
|
4,077,318
|
$
|
4,625,034
|
||||||||||||||||||||||
|
|
||||||||||||||||||||||||||||||||||||||||
|
Net income for the year ended December 31, 2015
|
1,677,224
|
1,677,224
|
||||||||||||||||||||||||||||||||||||||
|
Issuance of dividend
|
(992,590
|
)
|
(992,590
|
)
|
||||||||||||||||||||||||||||||||||||
|
Previous year’s adjustment to common stock
|
(83
|
)
|
-
|
-
|
-
|
|||||||||||||||||||||||||||||||||||
|
Unvested employee stock grants
|
5,928
|
6
|
(49,499
|
)
|
49,493
|
-
|
||||||||||||||||||||||||||||||||||
|
Purchase of treasury stock
|
-
|
-
|
(6,241
|
)
|
(6
|
)
|
6,241
|
(177,342
|
)
|
6
|
(177,342
|
)
|
||||||||||||||||||||||||||||
|
Balance December 31, 2015
|
$
|
-
|
800,000
|
$
|
800
|
8,269
|
$
|
(254,057
|
)
|
$
|
(49,499
|
)
|
$
|
673,130
|
$
|
4,761,952
|
$
|
5,132,326
|
||||||||||||||||||||||
|
|
||||||||||||||||||||||||||||||||||||||||
|
Net income for the year ended December 31, 2016
|
566,748
|
566,748
|
||||||||||||||||||||||||||||||||||||||
|
Recission of treasury stock
|
(8,269
|
)
|
254,057
|
(254,057
|
)
|
-
|
||||||||||||||||||||||||||||||||||
|
Vested employee stock grants
|
49,499
|
49,499
|
||||||||||||||||||||||||||||||||||||||
|
Issuance of Series A preferred stock
|
1,000
|
1
|
8,999
|
9,000
|
||||||||||||||||||||||||||||||||||||
|
Balance December 31, 2016
|
1,000
|
$
|
1
|
800,000
|
$
|
800
|
-
|
$
|
-
|
$
|
-
|
$
|
428,072
|
$
|
5,328,700
|
$
|
5,757,573
|
|||||||||||||||||||||||
The accompanying notes are an integral part of these consolidated financial statements.
Pacific Health Care Organization, Inc.
For the Years Ended December 31, 2016 and 2015
|
|
2016
|
2015
|
||||||
|
Cash Flows from Operating Activities
|
||||||||
|
Net income
|
$
|
566,748
|
$
|
1,677,224
|
||||
|
Adjustments to reconcile net income to net cash:
|
||||||||
|
Depreciation
|
84,700
|
69,254
|
||||||
|
Changes in operating assets and liabilities:
|
||||||||
|
Increase in bad debt provision
|
9,150
|
14,490
|
||||||
|
Decrease in accounts receivable
|
181,559
|
813,334
|
||||||
|
Decrease in deferred tax asset
|
23,635
|
41,763
|
||||||
|
Decrease (increase) in prepaid income tax
|
245,419
|
(242,716
|
)
|
|||||
|
(Increase) in other assets
|
-
|
(18,630
|
)
|
|||||
|
(Increase) decrease in prepaid expenses
|
(70,662
|
)
|
11,078
|
|||||
|
Increase (decrease) in accounts payable
|
37,729
|
(176,649
|
)
|
|||||
|
Increase (decrease) in accrued expenses
|
41,223
|
(49,366
|
)
|
|||||
|
Increase (decrease) in income tax payable
|
31,226
|
(9,348
|
)
|
|||||
|
Increase (decrease) in deferred rent expense
|
10,594
|
(7,441
|
)
|
|||||
|
(Decrease) increase in unearned revenue
|
(4,581
|
)
|
43,329
|
|||||
|
Decrease in deferred compensation
|
49,499
|
-
|
||||||
|
Net cash provided by operating activities
|
1,206,240
|
2,166,322
|
||||||
|
Cash Flows from Investing Activities
|
||||||||
|
Purchase of furniture and equipment
|
(42,485
|
)
|
(158,325
|
)
|
||||
|
Net cash used by investing activities
|
(42,485
|
)
|
(158,325
|
)
|
||||
|
Cash Flows from Financing Activities
|
||||||||
|
Purchase of treasury stock
|
-
|
(177,342
|
)
|
|||||
|
Issuance of Series A preferred stock
|
9,000
|
-
|
||||||
|
Issuance of cash dividends
|
(2,062
|
)
|
(933,605
|
)
|
||||
|
Payment of obligations under capital lease
|
-
|
(8,151
|
)
|
|||||
|
Net cash provided by (used in) financing activities
|
6,938
|
(1,119,098
|
)
|
|||||
|
|
||||||||
|
Increase in cash
|
1,170,693
|
888,899
|
||||||
|
|
||||||||
|
Cash at beginning of period
|
3,834,924
|
2,946,025
|
||||||
|
Cash at end of period
|
$
|
5,005,617
|
$
|
3,834,924
|
||||
|
|
||||||||
|
Supplemental Cash Flow Information
|
||||||||
|
Cash paid for:
|
||||||||
|
Interest
|
$
|
-
|
$
|
205
|
||||
|
Income taxes paid
|
$
|
102,300
|
$
|
1,355,086
|
||||
The accompanying notes are an integral part of these consolidated financial statements.
Pacific Health Care Organization, Inc.
Years Ended December 31, 2016 and 2015
NOTE 1 – CORPORATE HISTORY
Pacific Health Care Organization, Inc. (the “Company”) is a specialty workers’ compensation managed care company providing a range of services principally to California employers and claims administrators. The Company was incorporated under the laws of the state of Utah in April 1970, under the name Clear Air, Inc. The Company changed its name to Pacific Health Care Organization, Inc., in January 2001. In February 2001, the Company acquired Medex Healthcare, Inc. (“Medex”), a California corporation organized in March 1994, in a share for share exchange. Medex is a wholly-owned subsidiary of the Company. Medex is in the business of managing and administering both Health Care Organizations (“HCOs”) and Managed Provider Networks (”MPNs”) in the state of California. In August 2001, we formed Industrial Resolutions Coalition, Inc. (“IRC”), a California corporation, as a wholly-owned subsidiary of PHCO. IRC oversees and manages the Company’s Workers’ Compensation Carve-Outs services. In June 2010, the Company acquired Medex Legal Support, Inc. (“MLS”), a Nevada corporation incorporated in September 2009. MLS offers lien representation services and Medicare Set Aside (“MSA”) services. In February 2012, we incorporated Medex Medical Management, Inc., (“MMM”) in the state of Nevada, as a wholly owned subsidiary of the Company. MMM is responsible for overseeing and managing nurse case management services. In March 2011, we incorporated Medex Managed Care, Inc. (“MMC”) in the state of Nevada, as a wholly owned subsidiary of the Company. MMC oversees and manages the Company’s utilization review and managed bill review services.
NOTE 2 – SIGNIFICANT ACCOUNTING POLICIES
A. Basis of Accounting
The Company used the accrual method of accounting in accordance with accounting principles generally accepted in the United States for the periods ended December 31, 2016 and 2015.
B. Revenue Recognition
In general, the Company recognizes revenue when (i) persuasive evidence of an arrangement exists, (ii) delivery has occurred or services have been rendered, (iii) the fee is fixed or determinable and (iv) collectability is reasonably assured. Revenues are generated as services are provided to the customer based on the sales price agreed and collected. The Company recognizes revenue as the time is worked or as units of production are completed, which is when the revenue is earned and realized. Labor costs are recognized as the costs are incurred. The Company derives its revenue from the sale of Managed Care Services, Review Services and Case Management Services. These services are billed individually as separate components to our customers.
These fees include monthly administration fees, claim network fees, legal support fees, Medicare set aside fees, lien service fees, workers’ compensation carve-outs, flat rate fees or hourly fees depending on the agreement with the client. Such revenue is recognized at the end of each month for which services are performed.
Management reviews each agreement in accordance with the provisions of revenue recognition topic ASC 605. Such agreements may consist of bundled managed care which included various units of accounting such as network solutions and patient management which includes managed care. Such elements are considered separate units of accounting due to each element having value to the customer on a stand-alone basis and are billed separately. The selling price for each unit of accounting is determined using the contract price. When the Company’s customers purchase several products the pricing of the products sold is generally the same as if the products were sold on an individual basis. Revenue is recognized as the work is performed in accordance with the Company’s customer contracts. Based upon the nature of the Company’s products, bundled managed care elements are generally delivered in the same accounting period. The Company recognizes revenue for patient management services ratably over the life of the customer contract. Based upon its prior experience in managed care, the Company estimates the deferral amount from when the customer’s claim is received to when the customer contract expires. Advance payments from subscribers and billings made in advance are recorded on the balance sheet as deferred revenue.
C. Cash Equivalents
The Company considers all short term, highly liquid investments that are readily convertible, within three months, to known amounts as cash equivalents. As of the date of these consolidated financial statements, the Company has no cash equivalents.
Pacific Health Care Organization, Inc.
Notes to Consolidated Financial Statements
Years Ended December 31, 2016 and 2015
D. Concentrations of Credit Risk
Financial instruments that potentially subject the Company to concentrations of credit risks consist of cash and cash equivalents. The Company places its cash and cash equivalents at well-known, quality financial institutions. At times, such cash and investments may be in excess of the FDIC insurance limit.
E. Earnings (Per Share of Common Stock)
The computation of earnings per share of common stock is based on the weighted average number of shares outstanding at the date of the consolidated financial statements.
|
|
For the Years Ended December 31,
|
|||||||
|
|
2016
|
2015
|
||||||
|
Basic Earnings per share:
|
||||||||
|
Income (numerator)
|
$
|
566,748
|
$
|
1,677,224
|
||||
|
Shares (denominator)
|
800,000
|
800,000
|
||||||
|
Per share amount
|
$
|
0.71
|
$
|
2.10
|
||||
|
Fully Diluted Earnings per share:
|
||||||||
|
Income (numerator)
|
$
|
566,748
|
$
|
1,677,224
|
||||
|
Shares (denominator)
|
800,000
|
800,000
|
||||||
|
Per share amount
|
$
|
0.71
|
$
|
2.10
|
||||
F. Depreciation
The cost of property and equipment is depreciated over the estimated useful lives of the related assets. The cost of leasehold improvements is depreciated over the lesser of the length of the lease of the related assets or the estimated lives of the assets. Depreciation is computed on the straight line method which is five years for computer equipment, office equipment, and furniture and fixtures, respectively.
G. Use of Estimates
The preparation of the financial statements in conformity with accounting principles generally accepted in the United States of America requires management to make estimates and assumptions that affect the amounts reported in the consolidated financial statements and accompanying notes. Actual results could differ from those estimates. Significant estimates include the values assigned to the allowance for doubtful accounts and accruals for income taxes.
H. Principles of Consolidation
The accompanying consolidated financial statements include the accounts of the Company and its wholly-owned subsidiaries. Intercompany transactions and balances have been eliminated in consolidation.
I. Fair Value of Financial Instruments
The Company applies ASC 820, “Fair Value Measurements.” This guidance defines fair value, establishes a three-level valuation hierarchy for disclosures of fair value measurement and enhances disclosure requirements for fair value measures. The three levels are defined as follows:
| • |
Level 1 inputs to the valuation methodology are quoted prices (unadjusted) for identical assets or liabilities in active markets.
|
| • |
Level 2 inputs to the valuation methodology include quoted prices for similar assets and liabilities in active markets, and inputs that are observable for the asset or liability, either directly or indirectly, for substantially the full term of the financial instrument.
|
| • |
Level 3 inputs to valuation methodology are unobservable and significant to the fair measurement.
|
The carrying amounts reported in the balance sheets for the cash and cash equivalents, receivables and current liabilities each qualify as financial instruments and are a reasonable estimate of fair value because of the short period of time between the origination of such instruments and their expected realization and their current market rate of interest.
Pacific Health Care Organization, Inc.
Notes to Consolidated Financial Statements
Years Ended December 31, 2016 and 2015
J. General and Administrative Expenses
General and administrative expenses include fees for office space and supplies, dues and subscriptions, IT and internet expenses, postage and delivery expenses, rent equipment, equipment repairs, license and permits, telephone, compensated absences, miscellaneous expense, auto expense, travel expenses and entertainment costs.
K. Income Taxes
The Company utilizes the asset and liability method of accounting for income taxes. Under this method, deferred tax assets and liabilities are provided based on the difference between the financial statements and tax basis of assets and liabilities measured by the currently enacted tax rates in effect for the years in which these differences are expected to reverse. Deferred tax expense or benefit is the result of changes in deferred tax assets and liabilities.
L. Capital Structure
The Company has two classes of stock. The Articles of Incorporation of the Company, as amended, authorize 5,000,000 shares of $0.001 par value preferred stock, which may be issued in one or more series, with designation, rights and privileges of such preferred stock to be set by the Board of Directors of the Company from time to time. On November 21, 2016, the Board of Directors of the Company approved a Certificate of Designation of Rights, Privileges and Preferences of Series A Preferred Stock and authorized the Company’s officers to file such with the Utah Division of Corporations and Commercial Code to create the Series A Preferred Stock. The Series A Preferred Stock has a par value of $0.001 and consists of 10,000 shares. The holders of Series A Preferred Stock are entitled to vote with the Common Stock holders on all matters brought for approval of the Common Stock holders. In connection with any such matter, each outstanding share of Series A Preferred Stock is entitled to 20,000 votes of Common Stock of the Company. In the event of a liquidation, dissolution or winding up of the Company, the Series A Preferred Stock shall rank in parity with the Company’s Common Stock. Holders of Series A Preferred Stock are entitled to receive dividends, when, as and if declared by the Board of Directors. The Series A Preferred Stock shall rank in parity with the Company’s Common Stock as to any dividends. As of December 31, 2016 and 2015, 1,000 and zero shares of the Series A Preferred Stock were outstanding, respectively.
The Company also has voting common stock of 50,000,000 shares authorized at December 31, 2016 and 2015, 802,424 shares issued and 800,000 outstanding and 802,424 issued and 800,000 outstanding net of treasury shares, respectively. The Company purchased no shares and 6,241 shares of treasury stock at cost in during fiscal 2016 and 2015, respectively. During 2016, the Company retired 8,269 shares of treasury stock. As of December 31, 2016 and 2015, the Company paid dividends of $2,062 and $933,605, respectively. As of December 31, 2016 and 2015, the Company accrued and recorded dividend payables on the balance sheet of $56,923 and $58,985, respectively. No dividends were paid prior to 2015.
Treasury stock is accounted for by the cost method, whereby shares of common stock reacquired are recorded at their purchase price. When treasury stock is re-issued at a higher price than its cost, the difference is recorded as a component of additional paid-in capital to the extent that there are gains to offset the losses. If there are no treasury stock gains in additional paid-in capital, the losses are recorded as a component of accumulated deficit.
M. Stock Based Compensation
The Company has adopted the fair value method of accounting for stock-based employee compensation in accordance with statement of ASC Topic 718, “Compensation – Stock Compensation” which requires that equity-based payments (to the extent they are compensatory) be recognized in our consolidated statements of operations based on their fair value.
N. Trade Receivables
The Company in the normal course of business extends credit to its customers on a short-term basis. Although the credit risk associated with these customers is minimal, the Company routinely reviews its accounts receivable balances and makes provisions for doubtful accounts. The Company ages its receivables by date of invoice. Management reviews bad debt reserves quarterly and reserves specific accounts as warranted or sets up a general reserve based on amounts over 90 days past due. When an account is deemed uncollectible, the Company charges off the receivable against the bad debt reserve. A considerable amount of judgment is required in assessing the realization of these receivables including the current creditworthiness of each customer and related aging of the past-due balances, including any billing disputes. In order to assess the collectability of these receivables, the Company performs ongoing credit evaluations of its customers’ financial condition.
Pacific Health Care Organization, Inc.
Notes to Consolidated Financial Statements
Years Ended December 31, 2016 and 2015
Through these evaluations, the Company may become aware of a situation where a customer may not be able to meet its financial obligations due to deterioration of its financial viability, credit ratings or bankruptcy. The allowance for doubtful accounts is based on the best information available to the Company and is reevaluated and adjusted as additional information is received. The Company evaluates the allowance based on historical write-off experience, the size of the individual customer balances, past-due amounts and the overall national economy. At fiscal year-end 2016 and 2015, the Company’s bad debt reserve of $64,150 and $55,000, respectively as a general reserve for certain balances over 90 days past due and for accounts that are potentially uncollectible.
The percentages of the amounts due from major customers to total accounts receivable as of December 31, 2016 and 2015, are as follows:
|
|
12/31/16
|
12/31/15
|
||||||
|
Customer A
|
14
|
%
|
13
|
%
|
||||
|
Customer B
|
7
|
%
|
11
|
%
|
||||
|
Customer C
|
14
|
%
|
8
|
%
|
||||
|
Customer D
|
7
|
%
|
18
|
%
|
||||
O. Significant Customers
The Company provides services to insurers, third party administrators, self-administered employers, municipalities and other industries. The Company is able to provide a full range of services to virtually any size employer in the state of California. The Company is also able to provide UR, MBR and NCM services both inside and outside the state of California.
During the fourth quarter 2015, the Company’s largest customer, notified the Company it would be terminating the services provided by the Company in December 2015. The customer cited changing business needs in its termination letter as the reason for termination. The Company was providing UR, NCM, MPN and network access fee services to this customer. The Company anticipates the loss of this customer will significantly impact its profitability and liquidity until such time as the Company is able to replace the revenues generated from the customer. During the twelve-month period ended December 31, 2016 compared to 2015 the Company recorded no revenue from this former client, compared to $2,564,042 in 2015.
During the second fiscal quarter 2015, one of the Company’s significant MBR customer ceased using the Company’s MBR services following the customer’s acquisition by a third party and the decision to take its MBR business in-house. During 2016 the Company recorded no revenue from sales to this former customer, compared to $330,429 in 2015.
P. Reclassifications
Certain prior year amounts have been reclassified to conform to the current year presentation. Such reclassifications have had no effect on the financial position, operations or cash flows for the period ended December 31, 2016.
Q. Subsequent Events
In accordance with ASC 855-10 Company management reviewed all material events through the date of issuance and there are no material subsequent events to report.
NOTE 3 – RECENTLY ISSUED ACCOUNTING STANDARDS
In August 2015, the FASB issued ASU No. 2015-14, Revenue from Contracts with Customers (Topic 606). The amendments in this ASU defer the effective date of ASU 2014-09. Public business entities should apply the guidance in ASU 2014-09 to annual reporting periods beginning after December 15, 2017, including interim reporting periods within that reporting period. Earlier application is permitted only as of annual reporting periods beginning after December 15, 2016, including interim reporting periods within that reporting period. The Company is still evaluating the effect of the adoption of ASU 2014-09.
In February 2016, the FASB issued ASU No. 2016-02 Leases (Topic 842) intended to improve financial reporting around leasing transactions. The ASU will require organizations that lease assets - referred to as "lessees"- to recognize on the balance sheet the assets and liabilities for the rights and obligations created by those leases. For public companies, the standard is effective for fiscal years beginning after December 15, 2018 and interim periods therein. Earlier adoption is permitted for any annual or interim period for which consolidated financial statements have not yet been issued. The Company is currently evaluating the potential impact that the adoption of ASU No. 2016-02 may have on its financial statements.
The Company has reviewed all other recently issued, but not yet effective, accounting pronouncements and does not believe the future adoption of any such pronouncements may be expected to cause a material impact on our financial statements.
Pacific Health Care Organization, Inc.
Notes to Consolidated Financial Statements
Years Ended December 31, 2016 and 2015
NOTE 4 – FIXED ASSETS
The Company capitalizes the purchase of equipment and fixtures for major purchases in excess of $1,000 per item. Capitalized amounts are depreciated over the useful life of the assets using the straight line method of depreciation which is five years for computer equipment, office equipment, and furniture and fixtures. Scheduled below are the assets, costs and accumulated depreciation at December 31, 2016 and 2015.
|
|
Cost
|
Accumulated Depreciation
and Amortization
|
||||||||||||||
|
Assets
|
December 31, 2016
|
December 31, 2015
|
December 31, 2016(1)
|
December 31, 2015
|
||||||||||||
|
Computer equipment
|
$
|
349,955
|
$
|
308,266
|
$
|
224,143
|
$
|
172,073
|
||||||||
|
Furniture and fixtures
|
206,785
|
206,784
|
107,838
|
76,632
|
||||||||||||
|
Office equipment
|
15,595
|
14,800
|
14,314
|
12,889
|
||||||||||||
|
Totals
|
$
|
572,335
|
$
|
529,850
|
$
|
346,295
|
$
|
261,594
|
||||||||
| (1) |
Depreciation expense for the years ended December 31, 2016 and 2015, totaled $84,700 and $69,254, respectively.
|
NOTE 5 – INCOME TAXES
The Company accounts for corporate income taxes in accordance with FASB ASC 740-10 “Income Taxes.” FASB ASC 740-10 requires an asset and liability approach for financial accounting and reporting for income tax purposes.
The tax provision for the years ended December 31, 2016 and 2015, consisted of the following:
|
|
2016
|
2015
|
||||||
|
Current
|
||||||||
|
Federal
|
$
|
286,985
|
$
|
846,096
|
||||
|
State
|
91,960
|
256,927
|
||||||
|
Deferred
|
||||||||
|
Federal
|
29,776
|
35,439
|
||||||
|
State
|
(6,141
|
)
|
6,323
|
|||||
|
Total tax provision
|
$
|
402,580
|
$
|
1,144,785
|
||||
Deferred income taxes reflect the net tax effects of temporary differences between the carrying amounts of assets and liabilities for financial reporting purposes and the amounts used for income tax purposes. The Company’s total deferred tax liabilities, deferred tax assets, and deferred tax asset valuation allowances at December 31, 2016 and December 31, 2015, are as follows:
|
|
2016
|
2015
|
||||||
|
|
||||||||
|
Depreciation
|
||||||||
|
Federal
|
$
|
(69,125
|
)
|
$
|
(81,902
|
)
|
||
|
State
|
(19,779
|
)
|
(23,434
|
)
|
||||
|
Reserve for bad debts
|
||||||||
|
Federal
|
18,303
|
16,133
|
||||||
|
State
|
5,263
|
4,642
|
||||||
|
State tax deductions
|
28,416
|
79,647
|
||||||
|
Compensated absences accrual
|
||||||||
|
Federal
|
37,774
|
31,265
|
||||||
|
State
|
10,808
|
8,945
|
||||||
|
|
||||||||
|
Deferred tax asset
|
$
|
11,660
|
$
|
35,296
|
||||
Pacific Health Care Organization, Inc.
Notes to Consolidated Financial Statements
Years Ended December 31, 2016 and 2015
The reconciliation of income tax computed at statutory rates of income tax benefits is as follows:
|
|
2016
|
2015
|
||||||
|
|
||||||||
|
Expense at federal statutory rate of 34%
|
$
|
329,572
|
$
|
959,483
|
||||
|
State tax effects
|
56,447
|
173,745
|
||||||
|
Non-deductible expenses
|
11,528
|
16,889
|
||||||
|
Effects of rate change
|
0
|
0
|
||||||
|
Other items
|
5,033
|
(5,332
|
)
|
|||||
|
Income tax provision
|
$
|
402,580
|
$
|
1,144,785
|
||||
The Financial Accounting Standards Board (FASB) has issued ASC 740-10 (Prior authoritative literature: Financial Interpretation No. 48, “Accounting for Uncertainty in Income Taxes - An Interpretation of FASB Statement No. 109 (FIN 48)).” ASC 740-10 clarifies the accounting for uncertainty in income taxes recognized in an enterprise’s financial statements in accordance with prior literature FASB Statement No. 109, Accounting for Income Taxes. This standard requires a company to determine whether it is more likely than not that a tax position will be sustained upon examination based upon the technical merits of the position. If the more-likely-than-not threshold is met, a company must measure the tax position to determine the amount to recognize in the financial statements. As a result of the implementation of this standard, the Company performed a review of its material tax positions in accordance with recognition and measurement standards established by ASC 740-10.
The Company follows the interpretations of the FASB, which establish a single model to address accounting for uncertain tax positions. The interpretations clarify the accounting for income taxes by prescribing a minimum recognition threshold a tax position is required to meet before being recognized in the financial statements and also provide guidance on derecognition, measurement, classification, interest and penalties, accounting in interim periods, disclosure and transition.
The Company takes a two-step approach to recognizing and measuring uncertain tax positions. The first step is to evaluate the tax position for recognition by determining if the weight of available evidence indicates that it is more likely than not that the tax position will be sustained on audit, including resolution of any related appeals or litigation processes. The second step is to measure the tax benefit as the largest amount that is more than 50% likely of being realized upon effective settlement. The Company re-evaluates its income tax positions on a quarterly basis to consider factors such as changes in facts or circumstances, changes in or interpretations of tax law, effectively settled issues under audit, and new audit activity. Such a change in recognition or measurement would result in recognition of a tax benefit or an additional charge to the tax provision. Interest and penalties on unrecognized tax benefits are classified as income tax expense.
The Company includes interest and penalties arising from the underpayment of income taxes in the consolidated statements of operations in the provision for income taxes. As of December 31, 2016, the Company had no accrued interest or penalties. The years 2014, 2015 and 2016 are still open for examination by the Internal Revenue Service.
NOTE 6 – CONTRACTUAL COMMITMENTS
In August 2012, the Company entered into a capital lease arrangement whereby it leased office server equipment for $38,380. The asset was recorded on the balance sheet under office equipment under capital lease and the liability incurred under the lease was recorded as current and noncurrent obligations under capital lease. The lease arrangement was for a term of 36 months at level operating rents with a capital interest rate of 7.5%. The term of this capital lease arrangement expired in July 2015.
In October 2013, the Company entered into a 36 month lease for an office copy machine with monthly payments at $160.93. In December 2013, the Company leased two document scanners with monthly lease payments of $206.93 each for 36 months.
In July 2015, the Company entered into a new 79 month office lease that commenced on September 28, 2015. The lease provides for approximately 9,439 square feet of office space. This office space serves as the principal executive offices of the Company, as well as, the principal offices of the Company’s operating subsidiaries, Medex, IRC, MLS, MMM and MMC.
In August 2012, the Company entered into a capital lease arrangement whereby we leased office server equipment for $38,380. The asset was recorded on the balance sheet under office equipment under capital lease and the liability incurred under the lease was recorded as current and noncurrent obligations under capital lease. The lease arrangement was for a term of 36 months at level rents with capital interest rate at 7.5%. The term of this capital lease arrangement expired in July 2015.
Pacific Health Care Organization, Inc.
Notes to Consolidated Financial Statements
Years Ended December 31, 2016 and 2015
Following is the base annual rent payment schedule for the Company’s office lease:
|
Rent Period
|
Annual Rent Payment
|
|||
|
Jan. 1 to Dec. 31, 2017
|
228,329
|
|||
|
Jan. 1 to Dec. 31, 2018
|
257,874
|
|||
|
Jan. 1 to Dec. 31, 2019
|
244,942
|
|||
|
Jan. 1 to Dec. 31, 2020
|
275,996
|
|||
|
Jan. 1 to Dec. 31, 2021
|
261,932
|
|||
|
Jan. 1 to Mar. 31, 2022
|
97,411
|
|||
|
Total
|
$
|
1,366,484
|
||
Rent expense for office space for the years ended December 31, 2016 and December 31, 2015, was $240,492 and $166,285, respectively.
NOTE 7 – ACCRUED AND OTHER LIABILITIES
Accrued liabilities consist of the following:
|
|
2016
|
2015
|
||||||
|
|
||||||||
|
Salaries and wages
|
$
|
45,943
|
$
|
-
|
||||
|
Compensated absences
|
131,645
|
100,856
|
||||||
|
Legal fees
|
2,500
|
27,984
|
||||||
|
Accounting fees
|
38,222
|
19,550
|
||||||
|
Loss on settlement
|
-
|
42,300
|
||||||
|
Sales commissions
|
34,790
|
18,836
|
||||||
|
Bonus
|
492
|
3,492
|
||||||
|
Other
|
(225
|
)
|
(874
|
)
|
||||
|
Total
|
$
|
253,367
|
$
|
212,144
|
||||
NOTE 8 – EQUITY INCENTIVE AWARDS
2002 Stock Option Plan
In August 2002, the Company adopted the PHCO 2002 Stock Option Plan (the “2002 Plan”). The 2002 Plan provides for the grant of options to officers, consultants and employees to acquire shares of the Company’s common stock at a purchase price equal to or greater than fair market value as of the date of the grant. Options are exercisable six months after the grant date and expire five years from the grant date. The 2002 Plan calls for a total of 50,000 shares to be held for grant. Options to purchase 4,250 common shares were granted in August 2002. Options to purchase 938 common shares were exercised; the balance of the outstanding options expired unexercised in August 2007. No securities were awarded under the 2002 Plan in 2016 or 2015. The 2002 Plan will remain effective until such time as no further awards may be granted and all awards granted under the 2002 Plan are no longer outstanding unless earlier terminated by the Company’s board of directors.
2005 Stock Option Plan
In November 2005, at the annual meeting of stockholders of the Company, the Company and its shareholders adopted the Pacific Health Care Organization, Inc., 2005 Stock Option Plan (the “2005 Plan”). The 2005 Plan provides for the grant of Company securities, including options, warrants and restricted stock to officers, directors, consultants and employees to acquire shares of the Company’s common stock at a purchase price equal to or greater than fair market value as of the date of the grant. Options are exercisable six months after the grant date and expire five years from the grant date. The 2005 Plan permits the granting of up to 50,000 common shares of the Company. The 2005 Plan will remain effective until such time as no further awards may be granted and all awards granted under the 2005 Plan are no longer outstanding unless earlier terminated by the Company’s board of directors. Notwithstanding the foregoing, the Company may no longer make awards of “incentive stock options”, as that term is used in Section 422 of the Internal Revenue Code, under the 2005 Plan.
Pacific Health Care Organization, Inc.
Notes to Consolidated Financial Statements
Years Ended December 31, 2016 and 2015
On December 31, 2015, under the 2005 Plan, and pursuant to an effective S-8 registration statement filed with the Commission on December 28, 2015, the Company made restricted stock grants of 5,928 shares of its common stock to ten employees, including 750 shares to Tom Kubota, the Company’s President, chief executive officer and a greater than 5% shareholder of the Company, 750 shares to Fred Odaka, the Company’s chief financial officer and 750 share to Donald Balzano, a Company consultant and greater than 5% shareholder of the Company. The grants vested one year from the date of grant and were subject to forfeiture should the recipient terminate his employment or its consulting agreement with the Company prior to vesting. The restricted stock grants were valued at $8.35 per share, the closing price of the Company’s common stock on the December 31, 2015, grant date.
NOTE 9 – LITIGATION
From time to time, the Company may become involved in various lawsuits and legal proceedings which arise in the ordinary course of business. Litigation is subject to inherent uncertainties, and an adverse result in such matters may arise from time to time that may harm the Company’s business. To the knowledge of management, there is no material litigation or governmental agency proceeding pending or threatened against the Company or any of its subsidiaries. Further, the Company is not aware of any material proceeding to which any director, member of senior management or owner of record or beneficially of more than five percent of any class of voting securities of the Company or any of its subsidiaries, or any associate of any of them is a party adverse to or has a material interest adverse to the Company or any of its subsidiaries.
NOTE 10 – BENEFITS AND OTHER COMPENSATION
The Company offers a 401(k) profit sharing plan for employees who meet the eligibility requirements. Pursuant to the plan, we may make discretionary matching contributions and/or discretionary profit sharing contributions to the plan. All such contributions must comply with federal pension laws, non-discrimination requirements and the terms of the plan. In determining whether to make a discretionary contribution, the board of directors would evaluate current and future prospects and management’s desire to reward and retain employees and attract new employees. To date, the Company has never made matching contributions and/or discretionary profit sharing contributions to any plan.
None.
Evaluation of Disclosure Controls and Procedures
We maintain “disclosure controls and procedures,” as defined in Rules 13a-15(e) and 15d-15(e) under the Exchange Act, which are controls and other procedures that are designed to provide reasonable assurance that information required to be disclosed by a company in the reports that it files or submits under the Exchange Act is recorded, processed, summarized and reported within the time periods specified in the SEC’s rules and forms. Disclosure controls and procedures include, without limitation, controls and procedures designed to ensure that information required to be disclosed by a company in the reports that it files or submits under the Exchange Act is accumulated and communicated to the company’s management, including its principal executive and principal financial officers, as appropriate to allow timely decisions regarding required disclosure.
Our management, under the supervision and with the participation of our principal executive officer and principal financial officer, conducted an evaluation the effectiveness of our disclosure controls and procedures as of the end of the period covered by this Annual Report on Form 10-K. Based on the evaluation of our disclosure controls and procedures as of December 31, 2016, the end of the period covered by this report, our Chief Executive Officer and Chief Financial Officer concluded that our disclosure controls and procedures were effective at a reasonable assurance level.
Management’s Report on Internal Control over Financial Reporting
Our management is responsible for establishing and maintaining adequate internal control over financial reporting as defined in Rule 13a-15(f) or 15d-15(f) under the Exchange Act.
Our internal control over financial reporting refers to a process designed by, or under the supervision of, our principal executive officer and principal financial officer and effected by our board of directors, management and other personnel, to provide reasonable assurance regarding the reliability of financial reporting and the preparation of financial statements for external purposes in accordance with generally accepted accounting principles and includes those policies and procedures that: (i) pertain to the maintenance of records that in reasonable detail accurately and fairly reflect the transactions and dispositions of our assets; (ii) provide reasonable assurance that transactions are recorded as necessary to permit preparation of financial statements in accordance with generally accepted accounting principles, and that our receipts and expenditures are being made only in accordance with authorizations of our management and directors; and (iii) provide reasonable assurance regarding prevention or timely detection of unauthorized acquisition, use, or disposition of our assets that could have a material effect on our financial statements.
Under the supervision and with the participation of our management, including our Chief Executive Officer and Chief Financial Officer, we conducted an evaluation of the effectiveness of our internal control over financial reporting as of the end of the period covered by this Annual Report on Form 10-K. This evaluation was based on the framework set forth by the Committee of Sponsoring Organizations of the Treadway Commission (COSO) in Internal Control-Integrated Framework (2013). Based on this evaluation under the framework in the Internal Control – Integrated Framework (2013), our management, including our Chief Executive Officer and our Chief Financial Officer concluded that our internal control over financial reporting is effective as of December 31, 2016.
Changes in Internal Control Over Financial Reporting
There were no changes in our internal control over financial reporting identified in management’s evaluation pursuant to Rules 13a-15(d) and 15d-15(d) of the Exchange Act that occurred during the quarter ended December 31, 2016, that have materially affected, or are reasonably likely to materially affect, our internal control over financial reporting.
Inherent Limitations on Effectiveness of Controls
Our management does not expect that our disclosure controls and procedures or our internal control over financial reporting will prevent all errors and all fraud. A control system, no matter how well conceived and operated, can provide only reasonable, not absolute, assurance that the objectives of the control system are met. Further, the design of a control system must reflect the fact that there are resource constraints, and the benefits of controls must be considered relative to their costs. Because of the inherent limitations in all control systems, no evaluation of controls can provide absolute assurance that all control issues and instances of fraud, if any, have been detected. These inherent limitations include the realities that judgments in decision-making can be faulty, and that breakdowns can occur because of a simple error or mistake. Additionally, controls can be circumvented by the individual acts of some persons, by collusion of two or more people or by management override of the controls. The design of any system of controls also is based in part upon certain assumptions about the likelihood of future events, and there can be no assurance that any design will succeed in achieving its stated goals under all potential future conditions; over time, controls may become inadequate because of changes in conditions, or the degree of compliance with policies or procedures may deteriorate. Because of the inherent limitations in a cost-effective control system, misstatements due to error or fraud may occur and not be detected.
None.
PART III
The following table sets forth our executive officers and directors, their ages, and all offices and positions they hold with the Company as of March 16, 2017. There is no agreement or understanding between the Company or any other person and any director or executive officer pursuant to which he or she was selected as a director or executive officer.
|
Name
|
Age
|
Positions with the Company
|
Director Since
|
Executive Officer Since
|
||||
|
Tom Kubota
|
77
|
Chief Executive Officer, President and Chairman of the Board of Directors
|
Sept. 2000
|
Sept. 2000
|
||||
|
Fred Odaka
|
80
|
Chief Financial Officer and Secretary
|
Aug. 2008
|
|||||
|
David Wang
|
54
|
Director
|
Nov. 2007
|
|||||
|
Stacy Hadley
|
49
|
Director
|
Nov. 2016
|
|||||
|
Gunter Soraperra
|
56
|
Director
|
Nov. 2016
|
Tom Kubota. Since 2000, Mr. Kubota has been primarily engaged in the operations of PHCO and running his consulting firm Nanko Investments, Inc. Mr. Kubota also has over thirty years of experience in the investment banking, securities and corporate finance field. He held the position of Vice President at Drexel Burnham Lambert; at Stem, Frank, Meyer and Fox; and at Cantor Fitzgerald. Mr. Kubota is the president of Nanko Investments, Inc., which specializes in capital formation services for high technology and natural resources companies. He has expertise in counseling emerging public companies and has previously served as a director of both private and public companies. Mr. Kubota is not currently, nor has he in the past five years been, a nominee or director of any other SEC registrant. In concluding that Mr. Kubota was an appropriate candidate to serve on the Company’s board of directors, the board considered his experience as the Company’s president and chief executive officer, his many years of investment banking and corporate finance experience and his prior management experience.
Fred Odaka. Mr. Odaka joined PHCO as CFO in August 2008. He has held senior level management positions in corporate finance for over 30 years and has served as CFO for private and public companies. Prior to joining PHCO, from 1998 to May 2008, Mr. Odaka was CFO of Rx for Africa, Inc. (“RXAF”), f/k/a Diamond Entertainment Corporation (“DMEC”) – OTCBB. At the time, RXAF owned and operated a large pharmaceutical plant in Addis Ababa, Ethiopia. Prior to the merger, DMEC marketed and sold DVD titles to the home video market primarily through mass merchandisers and department stores. For four years, Mr. Odaka was a Financial Consultant and Analyst for Kibel, Green Inc., a leading West Coast business advisory and financial service firm specializing in corporate re-structure and crisis intervention. Mr. Odaka was also a co-founder of Rexon Inc., a manufacturer of computers and computer peripheral equipment and from 1978 to 1984 held the position of Vice President/CFO and was instrumental in taking the company public. Mr. Odaka also served as Controller of the computer division of Perkin-Elmer, a NYSE traded company. Mr. Odaka received his Bachelor of Science degree in Finance from Fresno State College, Fresno, California.
David Wang. Mr. Wang has served as a managing member of Reef Capital Management, LLC since late 2013. He is responsible for managing a fund that was created to generate long-term cash flow to investors by investing primarily in drilling and development of oil projects. Prior to joining Reef Capital Management, Mr. Wang co-founded and began serving as the President of Aces Fuel Technology in Santa Monica, California in 2005. Aces Fuel Technology specialized in marketing and selling a fuel and oil catalyst. Mr. Wang was responsible for overseeing day-to-day operations. Mr. Wang earned a BS in Computer Science/ Mathematics from the University of California, Los Angeles (UCLA) in 1985. He earned an MBA degree with an emphasis in Financial and Entrepreneurial Studies from the Anderson School at UCLA in 2000. Mr. Wang is not currently, nor has he in the past five years been, a nominee or director of any other SEC registrant. In concluding that Mr. Wang was an appropriate candidate to serve on the Company's board of directors, the board considered his education background, his experience in entrepreneurial business enterprises and his favorable history of attracting venture capital funds through his established contacts in the investment banking community.
Stacy Hadley. Mrs. Hadley has over 20 years of accounting and audit experience. She has been employed with Now CFO, a provider of outsourced accounting and financial solutions, since September 2015. Mrs. Hadley is currently a Partner at CFO Now. She is currently responsible for overseeing the operations of company’s Houston, Texas office and is serving as the Chief Financial Officer for a midstream construction company with $100 million in revenue. From November 2014 to September 2015, Mrs. Hadley was employed by Harman International as a Compliance and Financial Consultant where, among other things, she oversaw compliance reporting of four business units and divisional shared services, worked with finance directors to implement and document internal control testing, and documented procedures to ensure adherence with company policies and internal controls. From December 2012 to November 2014, Mrs. Hadley served as the Controller for Dalbo Holdings where she was responsible for general ledger accounting, analyzing and reconciling accounts and records for service lines, verifying revenues, expenses and other accounting functions. From 2008 through November 2012, Mrs. Hadley worked for Morrill & Associates, CPAs, where she gained progressive audit experience auditing public and privately held companies. Mrs. Hadley received licensure as a Certified Public Accountant in July 2014. Mrs. Hadley received a Bachelor’s of Science Degree in Accounting and a Master’s Degree in Accounting from Weber State University, Utah in 2010 and 2012, respectively. During the past five years Mrs. Hadley has not served, and she does not currently serve, as a director of any other SEC registrant or any registered investment company. The board of directors considered Mrs. Hadley’s years of accounting and auditing experience both with accounting firms, and in-house with a number of different employers, as well as her educational background and her CPA licensure in concluding that she is qualified to serve on the Company’s board of directors.
Gunter Soraperra. Mr. Soraperra has served as the Chief Executive Officer of Traunkristall Design since 2000. Traunkristall specializes in the design, production, and sale of high-end hand-made crystal products and has business activities in more than 25 countries. Among other things, Mr. Soraperra is responsible for setting strategy and direction, allocation of capital, and overseeing sales and marketing at Traunkristall. Mr. Soraperra received a Master of Business Administration degree from the University of Graz, Austria in 1990. Over the past fifteen years Mr. Soraperra has also served as a Senior Vice President of a private Swiss investment group responsible for coordinating international activities, financing and mergers and acquisitions. He has also served on the advisory boards of various international companies. In the past five years Mr. Soraperra has not served, and he does not currently serve, as a director of any other SEC registrant or any registered investment company. In concluding that Mr. Soraperra was qualified to serve on the Company’s board of directors, the board considered Mr. Soraperra’s years of strategy, management, finance and operational experience.
Family Relationships
There are no family relations among any of our executive officers and directors.
Compliance with Section 16(a) of the Exchange Act
Section 16(a) of the Exchange Act requires our directors and executive officers, and any persons who own more than 10% of a registered class of our equity securities, to file with the Commission reports of beneficial ownership and changes in beneficial ownership. These persons are required by Commission regulation to furnish us with copies of all Section 16(a) forms they file. To our knowledge, based solely on our review of the copies of such reports furnished to us or written representations that no other reports were required during the fiscal year ended December 31, 2016, we believe that, with the exception of a Form 3 that was filed several days late by our director Stacy Hadley due to difficulties obtaining Edgar ID codes, all reports required to be filed under Section 16(a) were filed on a timely basis.
Code of Ethics
Our board of directors has adopted a code of ethics that applies to our principal executive officer, principal financial officer, principal accounting officer or controller or to persons performing similar functions. The code of ethics is designed to deter wrongdoing and to promote (i) honest and ethical conduct, including the ethical handling of actual or apparent conflicts of interest between personal and professional relationships, (ii) full, fair, accurate, timely and understandable disclosure in reports and documents we file with, or submit to, the Commission and in other public communications we make, (iii) compliance with applicable governmental laws, rules and regulations, (iv) prompt internal reporting of violations of the code, and (v) accountability for adherence to the code. We will provide a copy of our code of ethics, without charge, to any person upon receipt of written request for such delivered to our corporate headquarters. All such requests should be sent care of Pacific Health Care Organization, Inc., Attn: Corporate Secretary, 1201 Dove Street, Suite 300, Newport Beach, California 92660. A copy of our code of ethics has been posted on our website and may be viewed at www.pacifichealthcareorganization.com. If we make any substantive amendments to, or grant any waivers from, the code of ethics for any officer or director, we will disclose the nature of such amendment or waiver on our website or in a Current Report on Form 8-K.
Committees of the Board of Directors
The OTCQB does not require us to have a separately-designated standing audit committee, a compensation committee or a nominating and corporate governance committee. Our board of directors has determined that it is in the Company’s best interest to have the full board fulfill the functions that would be performed by these committees.
While we do not currently have a standing audit committee, our board of directors believes that were it to establish an audit committee, Mrs. Hadley would qualify as an “audit committee financial expert” under the rules adopted by the Commission pursuant to the Sarbanes-Oxley Act of 2002.
Procedures for Security Holders to Nominate Candidate to the Board of Directors
There have been no material changes to the procedures by which shareholders may recommend nominees to our board of directors since March 30, 2012, the date we last provided information with regard to our director nomination process.
The table below summarizes compensation paid to or earned by our named executive officers (“NEOs”) for the fiscal years ended December 31, 2016 and 2015. No other executive officer of the Company had total compensation of $100,000 or more in 2016.
Summary Compensation Table
|
Name and
Principal Position
|
Year
|
Salary
($)
|
Bonus
($)
|
Stock Awards(1)
($)
|
All Other
Compensation
($)
|
Total
($)
|
||||||||||||||||
|
Tom Kubota
|
2016
|
178,814
|
(2) |
-
|
-
|
16,777
|
(3) |
195,591
|
||||||||||||||
|
Chief Executive Officer,
|
2015
|
193,536
|
938
|
6,263
|
59,774
|
(4) |
260,511
|
|||||||||||||||
|
President and Director
|
|
|||||||||||||||||||||
|
|
|
|||||||||||||||||||||
|
Fred Odaka
|
2016
|
102,572
|
(2) | - |
-
|
10,832
|
(5) |
113,404
|
||||||||||||||
|
Chief Financial Officer
|
2015
|
116,126
|
938
|
6,263
|
23,962
|
(6) |
147,289
|
|||||||||||||||
(1) For details regarding the assumptions made in the valuation of stock awards, please see “Valuation of Restricted Stock Grants” below.
(2) Reflects annual base salary reduction of 10% effective April 2016.
(3) Reflects health insurance premiums, auto expenses, and director’s fees of $4,181, $7,796, and $4,800, respectively.
(4) Reflects health insurance premiums, auto expenses, payment of accrued time off and director’s fees of $4,692, $8,372, $43,110 and $3,600, respectively.
(5) Reflects health insurance premiums and fees for attending board meetings of $6,032, and $4,800, respectively.
(6) Reflects health insurance premiums, payment of accrued time off and fees for attending board meetings of $5,922, $14,440 and $3,600, respectively.
Narrative Disclosure to Summary Compensation Table
Employment Agreements
We have a written employment agreement with Mr. Odaka. We do not have a written employment agreement with Mr. Kubota. Each of our NEOs is employed/retained on an at-will basis and each can terminate their employment arrangement with the Company at any time, with or without cause. Likewise, we can terminate their employment at any time, with or without cause.
Base Salary
Base salary is used to recognize the experience, skills, knowledge and responsibilities required of our NEOs. The base salary for each NEO is typically set at the time the individual is hired based on the factors discussed in the preceding sentence and the negotiation process between us and the NEO. We also take into consideration the individual’s past performance, experience and expertise we need and local market and labor conditions. Changes to base salary, if any, are determined based on several factors, including evaluation of performance, anticipated financial performance of the Company, economic condition and local market and labor conditions. During the fourth quarter 2014, the board of directors awarded 12% base salary increases to each of our NEO’s, which became effective January 1, 2015. As a result, Mr. Kubota’s annual base salary for 2015 increased to approximately $193,500 and Mr. Odaka’s annual base salary increased to approximately $116,100. In April 2016, Mr. Kubota and Mr. Odaka agreed to temporarily reduce their annual base salaries by 10%. As of the date of this report, the reduction of 10% still remains in force. In addition, the board has not extended annual base salary increases to Mr. Kubota or Mr. Odaka for 2017, although the board could determine to do so at any time in its sole discretion.
Non-Equity Incentive Compensation
From time to time we may make cash awards to our employees, including the NEOs. Such awards may be designed to incentivize employees over a specified period of time pursuant to pre-established, performance-based criteria, the accomplishment of which is substantially uncertain at the time the criteria are established. In the event this type of cash award is made, it would be reflected in the “Summary Compensation Table” under a separate column entitled “Nonequity Incentive Plan Compensation.” The criteria for earning non-equity incentive bonuses may be based on corporate financial performance measures that would be developed by our board of directors at the time such non-equity incentive plan is established. Our board has discretion to determine the applicable performance measures and the appropriate weighting of such measures at the time it establishes any non-equity incentive plan. Our board of directors did not establish a non-equity incentive compensation plan during the fiscal years ended December 31, 2016 or 2015, and no non-equity incentive compensation was awarded during these years.
Bonuses
We may also make cash awards to employees that are not part of any pre-established, performance-based criteria. Awards of this type are completely discretionary and subjectively determined by our board of directors at the time they are awarded. Such awards are reported in the “Summary Compensation Table” in the column entitled “Bonus.”
On December 3, 2015, our board of directors, in recognition of service rendered to the Company, awarded a total of $7,410 in bonuses to nine employees and one consultant. Included in these bonuses were bonuses awarded to Mr. Kubota and Mr. Odaka for $938 each. These cash bonuses were completely discretionary and were not based on any pre-established criteria. The board of directors was under no contractual or other obligation to award cash bonuses.
Equity Incentive Compensation
Our equity incentive award program is the primary vehicle for offering long-term incentives to our employees. From time to time, we may also make equity incentive awards to our NEOs, employees, and consultants in the form of stock options, restricted stock grants or some other form of equity award. Equity incentive awards are reflected in the “Summary Compensation Table” under the columns entitled “Stock Awards” and “Option Awards” as appropriate. For information regarding equity incentive compensation awarded to our NEOs in the past two fiscal years, see “Valuation of Restricted Stock Grants” below.
Our board of directors has no obligation to make award equity compensation. That does not mean the board of directors may not, as it deems appropriate, award equity incentive compensation when it deems such to be appropriate in the future.
Valuation of Restricted Stock Grants
On December 31, 2015, we awarded restricted stock grants to ten employees and consultants, including our NEOs, under the Pacific Health Care Organization, Inc. 2005 Stock Option Plan (the “2005 Plan”). The total number of restricted shares of common stock granted was 5,928 shares. The grants vested one year from the date of grant and were subject to forfeiture should the NEO terminate his employment prior to vesting. The restricted stock grants were valued at $8.35 per share, the closing price of our common stock on the December 31, 2015 grant date. Mr. Kubota and Mr. Odaka were each awarded a restricted stock grant of 750 shares of our common stock. These restricted stock grants vested to Mr. Kubota and Mr. Odaka when the vesting period expired in December 2016.
Benefits and Other Compensation
We currently provide health care benefits, including medical, vision and dental insurance, subject to certain deductibles and co-payments to its full time employees. We also provide for paid time off (“PTO”), which includes vacation, sick leave and other out-of-the-office time and is accrued and paid in accordance with our PTO policy. We may also provide group life and disability insurance to employees who are eligible to participate in such programs.
The Company offers a 401(k) profit sharing plan for employees who meet the eligibility requirements. Pursuant to the plan, we may make discretionary matching contributions and/or discretionary profit sharing contributions to the plan. All such contributions must comply with federal pension laws, non-discrimination requirements and the terms of the plan. In determining whether to make a discretionary contribution, the board of directors would evaluate current and future prospects and management’s desire to reward and retain employees and attract new employees. To date, we have never made matching contributions and/or discretionary profit sharing contributions to any plan.
Other than the foregoing, we do not offer any retirement or other benefit plans to our employees, including our NEOs, at the present time, however, the board of directors may adopt plans as it deems to be reasonable under the circumstances.
Mr. Kubota and Mr. Odaka are entitled to participate, if eligible under such plans, in any insurance programs we offer to our employees, are eligible for PTO and to participate in such other fringe benefit programs as we may make available to our other employees.
Nonqualified Deferred Compensation
We offer no defined contribution or other plan that provides for the deferral of compensation on a basis that is not tax-qualified to any of our employees including our NEOs.
Pension Benefits
We offer no pension or other specified retirement payments or benefits, including but not limited to tax-qualified deferred benefit plans and supplemental executive retirement plans to our NEOs.
Termination and Change in Control
We do not have agreements, plans or arrangements, written or unwritten, with any of our NEOs that would provide for payments or other benefits to any of our NEOs following, or in connection with, the resignation, retirement or other termination of any NEO or change in control of the Company or a change in the responsibilities of any NEO following a change in control of the Company.
OUTSTANDING EQUITY AWARDS AT FISCAL YEAR-END
On December 31, 2016, restricted stock grants of 750 shares awarded to each of our NEOs on December 31, 2015, vested. Therefore, as of the end of fiscal 2016, we had no NEOs holding outstanding equity awards.
DIRECTOR COMPENSATION
We offer cash compensation to attract and retain candidates to serve on our board of directors.
Meeting Fees
All directors receive a fee of $1,200 per meeting for each meeting attended either in person or telephonically. Additionally, all directors are paid $1,000 for attendance at the annual meeting of stockholders, plus airfare and hotel expense.
Equity Compensation
We do not currently have a fixed plan for the award of equity compensation to our directors, and we did not award any equity compensation to any of our directors during 2016.
Director Compensation Table
The following table sets forth a summary of the compensation we paid to our directors for services on our board during 2016.
|
Name
|
Fees Earned or Paid in Cash ($)
|
All Other
Compensation($)
|
Total ($)
|
|||||||||
|
Tom Kubota
|
4,800
|
190,791
|
(1)
|
195,591
|
||||||||
|
|
||||||||||||
|
David Wang
|
4,800
|
-
|
4,800
|
|||||||||
|
Gunter Soraperra(2)
|
1,200
|
-
|
1,200
|
|||||||||
|
|
||||||||||||
|
Stacy Hadley(2)
|
1,200
|
-
|
1,200
|
|||||||||
|
|
||||||||||||
|
Thomas Iwanski(3)
|
3,600
|
1,000
|
(4)
|
4,600
|
||||||||
| (1) |
Mr. Kubota is employed as the Company’s chief executive officer and President. For details regarding All Other Compensation paid to Mr. Kubota, please see “Summary Compensation Table” above.
|
| (2) |
Mr. Soraperra and Mrs. Hadley were appointed to fill vacancies on the board of directors on November 7, 2016.
|
| (3) |
Mr. Iwanski resigned as a member of the Company’s board of directors on October 5, 2016.
|
| (4) |
Fees paid for consulting services rendered in connection with the evaluation of business development projects during 2016.
|
ITEM 12. SECURITY OWNERSHIP OF CERTAIN BENEFICIAL OWNERS AND MANAGEMENT AND RELATED STOCKHOLDER MATTERS
The following table sets forth, as of March 16, 2017:
| · |
each person known to us to beneficially own more than 5% of our common stock or Series A Preferred Stock;
|
| · |
each of our named executive officers;
|
| · |
each member of our board of directors; and
|
| · |
all of our directors and executive officers as a group.
|
On March 16, 2017, there were 800,000 shares of common stock issued and outstanding and 1,000 shares of Series A Preferred Stock issued and outstanding.
Beneficial ownership is determined in accordance with the rules of the SEC. These rules generally attribute beneficial ownership of securities to persons who possess sole or shared voting power or investment power with respect to such securities. Except as otherwise indicated, the persons or entities listed below have sole voting and investment power with respect to all shares of the Company’s common stock and Series A Preferred Stock beneficially owned by them, except to the extent this power may be shared with a spouse.
Unless otherwise indicated, the address of each person or entity named in the table is 1201 Dove Street, Suite 300, Newport Beach, California 92660.
|
|
Common Stock Beneficially Owned(1)
|
Series A Preferred Stock Beneficially Owned(2)
|
||||||||||||||
|
Name of Beneficial Owner
|
Number
|
%
|
Number
|
%
|
||||||||||||
|
|
||||||||||||||||
|
Directors and Named Executive Officers:
|
||||||||||||||||
|
Tom Kubota(3)
|
484,000
|
60.4
|
%
|
1,000
|
100
|
%
|
||||||||||
|
Fred Odaka
|
750
|
*
|
%
|
--
|
--
|
%
|
||||||||||
|
Stacy Hadley
|
--
|
--
|
%
|
--
|
--
|
%
|
||||||||||
|
Gunter Soraperra
|
--
|
--
|
%
|
--
|
--
|
%
|
||||||||||
|
David Wang
|
--
|
--
|
%
|
--
|
--
|
%
|
||||||||||
|
|
||||||||||||||||
|
All directors and executive officers as a group
(5 persons)
|
484,750
|
60.5
|
%
|
1,000
|
100
|
%
|
||||||||||
|
|
||||||||||||||||
|
5% Shareholders:
|
||||||||||||||||
|
Donald P. Balzano(4)
|
54,915
|
6.9
|
%
|
--
|
--
|
%
|
||||||||||
|
5422 Michelle Drive
|
||||||||||||||||
|
Torrance, CA 90503
|
||||||||||||||||
|
Bruce and Sarah Everakes(5)
|
40,101
|
5.0
|
%
|
--
|
--
|
%
|
||||||||||
|
3442 Riverfalls
|
||||||||||||||||
|
Northbrook, IL 60062
|
||||||||||||||||
* Less than 1%.
| (1) |
Includes shares of common stock that may be deemed to be beneficially owned by such persons due to their beneficial ownership of Series A Preferred Stock, which are convertible to common stock on a share-for-share basis at any time at the election of the holder.
|
| (2) |
Each share of Series A Preferred Stock entitles its holder to vote together with the common stock as a single class on all matters presented to the Company’s common stock holders for their vote. Each outstanding share of Series A Preferred Stock votes as 20,000 shares of common stock. The Series A Preferred Stock ranks in parity with the common stock on a per share basis, not on a per vote basis, as to any dividends, liquidation, dissolution or winding up of the Company.
|
| (3) |
Mr. Kubota holds the shares in the Tom Kubota Revocable Trust of 2013 (the “Trust”). Mr. Kubota is the sole Trustee of the Trust. As such he may be deemed to have voting and/or investment power over the shares held by the Trust and therefore may be deemed to be the beneficial owner of those shares.
|
| (4) |
Mr. Balzano is a Company consultant and serves as the president of our wholly-owned subsidiaries Industrial Resolutions Coalition, Inc. and Medex Legal Support, Inc.
|
| (5) |
Based solely on the Schedule 13G filed by Bruce Everakes on October 2, 2015.
|
Equity Compensation Plans
|
Plan category
|
Number of securities to be issued upon exercise of outstanding options, warrants and rights
|
Weighted
average exercise price of outstanding options, warrants and rights
|
Number of securities remaining available for future issuance under equity compensation plans (excluding securities reflected in column (a))
|
||||||||||
|
|
(a)
|
(b)
|
(c)
|
||||||||||
|
Equity compensation plans approved by security holders
|
0
|
$
|
0.00
|
89,822
|
|||||||||
|
Equity compensation plans not approved by security holders
|
0
|
$
|
0.00
|
-0-
|
|||||||||
|
Total
|
0
|
$
|
0.00
|
89,822
|
|||||||||
2002 Stock Option Plan
On August 13, 2002, we adopted the Pacific Health Care Organization, Inc. 2002 Stock Option Plan (the “2002 Plan”) which allows for a total of 50,000 shares to be held for grant. Unless terminated by the Board, the 2002 Plan shall continue to remain effective until such time as all shares covered under the 2002 Plan have been granted and all awards granted under the 2002 Plan are no longer outstanding. As of March 16, 2017, 42,750 shares remain available for grant under the 2002 Plan.
2005 Stock Option Plan
On November 18, 2005, our shareholders adopted the Pacific Health Care Organization, Inc., 2005 Stock Option Plan (the “2005 Plan”). The 2005 Plan provides for the grant of Company securities, including options, warrants and restricted stock to officers, directors, consultants and employees to acquire shares of the Company’s common stock at a purchase price equal to or greater than fair market value as of the date of the grant. Options are exercisable six months after the grant date and expire five years from the grant date. The 2005 Plan permits the granting of up to 50,000 common shares of the Company. As of March 16, 2017, 44,072 shares remain available for grant under the 2005 Plan.
Except as disclosed in Item 11 Executive Compensation, during fiscal 2016 and 2015, we did not engage in transactions with related persons (as defined by Rule 404 of Regulation S-K (Instructions to Item 404(a)) that exceeded the lesser of $120,000 or 1% of the average of our total assets at year-end for the last two fiscal years in which any such related person had or will have a direct or indirect material interest.
Director Independence
The board has determined that as of December 31, 2016, Mrs. Hadley, Mr. Soraperra and Mr. Wang would qualify as “independent directors” as that term is defined in the listing standards of the NYSE MKT. Such independence definition includes a series of objective tests, including that the director is not an employee of the company and has not engaged in various types of business dealings with the company. In addition, as further required by the NYSE MKT listing standards, the board of directors has made a subjective determination as to each independent director that no relationships exist which, in the opinion of the board of directors, would interfere with the exercise of independent judgment in carrying out the responsibilities of a director.
Fees for professional services provided by our independent registered public accounting firm in each of the last two fiscal years, in each of the following categories, were as follows:
|
|
2016
|
2015
|
||||||
|
|
||||||||
|
Audit
|
$
|
57,011
|
$
|
54,530
|
||||
|
Audit related
|
-0-
|
-0-
|
||||||
|
Tax
|
-0-
|
-0-
|
||||||
|
All other
|
-0-
|
-0-
|
||||||
|
|
||||||||
|
Total
|
$
|
57,011
|
$
|
54,530
|
||||
Audit Fees. Audit fees were for professional services rendered in connection with the audit of the financial statements included in our Annual Report on Form 10-K and review of the financial statements included in our Quarterly Reports on Form 10-Q and for services normally provided by our independent registered public accounting firm in connection with statutory and regulatory filings or engagements.
Board of Directors Pre-Approval Policies and Procedures. At its regularly scheduled and special meetings, our board of directors, in lieu of an established audit committee, considers and pre-approves any audit and non-audit services to be performed by our independent registered public accounting firm. The board of directors has the authority to grant pre-approvals of non-audit services.
Our full board of directors is responsible for selection, review and oversight of our independent registered public accounting firm. The board of directors has not, as of the time of filing this Annual Report on Form 10-K with the Commission, adopted policies and procedures for pre-approving audit or permissible non-audit services performed by our independent registered public accounting firm. Instead, the board of directors as a whole has pre-approved all such services, except for services meeting a “de minimus” exception. To qualify for the “de minimus” exception, the aggregate amount of all such non-audit services provided to the Company must constitute not more than 5% of the total amount of revenues paid by us to our independent registered public accounting firm during the fiscal year in which the non-audit services are provided; such services were not recognized by us at the time of the engagement to be non-audit services; and the non-audit services are promptly brought to the attention of the board and approved prior to the completion of the audit by the board or by one or more members of the board to whom authority to grant such approval has been delegated. In the future, our board of directors may approve the services of our independent registered public accounting firm pursuant to pre-approval policies and procedures adopted by the board of directors, or an audit committee if one is standing, provided the policies and procedures are detailed as to the particular service, the board of directors is informed of each service, and such policies and procedures do not include delegation of the board of director’s responsibilities to our management.
The board of directors has determined that the provision of services by Pritchett, Siler & Hardy, P.C., described above are compatible with maintaining their independence as our independent registered public accounting firm.
PART IV
(a) (1) Financial Statements
The following financial statements of the registrant are included in response to Item 8 of this Annual Report on Form 10-K:
Report of Independent Registered Public Accounting Firm – Pritchett, Siler & Hardy, P.C. dated March 30, 2017.
Consolidated Balance Sheets as of December 31, 2016 and 2015.
Consolidated Statements of Operations for the years ended December 31, 2016 and 2015.
Consolidated Statements of Stockholders’ Equity for the years ended December 31, 2016 and 2016.
Consolidated Statements of Cash Flows for the years ended December 31, 2016 and 2015.
Notes to Consolidated Financial Statements.
(a)(2) Financial Statement Schedules
Schedules are omitted because the required information is either inapplicable or presented in the consolidated financial statements or related notes.
(a)(3) Exhibits
|
Exhibit No.
|
|
Exhibit Description
|
|
|
|
|
|
3.1
|
|
Articles of Incorporation and Amendments thereto(1)
|
|
3.2
|
|
Bylaws(1)
|
|
3.3
|
|
Bylaws(2)
|
|
3.4
|
|
Articles of Amendment to Articles of Incorporation to effect 1 share for 50 shares reverse split(3)
|
|
3.5
|
|
Articles of Amendment to Articles of Incorporation to effect 2.5 shares for 1 share forward split(3)
|
|
3.6
|
|
Certificate of Designation of Rights, Privileges and Preferences of Series A Preferred Stock(4)
|
|
4.1
|
|
Pacific Health Care Organization, Inc., 2002 Stock Option Plan(1)+
|
|
4.2
|
|
Pacific Health Care Organization, Inc., 2005 Stock Option Plan(5)+
|
|
10.1
|
|
Employment Agreement, dated February 1, 2013, between Pacific Health Care Organization, Inc. and Fred Odaka(6)+
|
|
10.2
|
|
Form of Restricted Stock Grant Agreement(7)+
|
|
14.1
|
|
Code of Ethics(8)
|
|
21.1
|
|
|
|
23.1
|
|
|
|
31.1
|
|
|
|
31.2
|
|
|
|
32.1
|
|
|
|
101
|
|
The following materials from Pacific Health Care Organization, Inc.’s Annual Report on Form 10-K for the year ended December 31, 2016, formatted in XBRL (eXtensible Business Reporting Language): (i) the Consolidated Balance Sheets, (ii) the Consolidated Statements of Operations, (iii) the Consolidated Statements of Stockholders’ Equity, (iv) the Consolidated Statements of Cash Flows, and (v) Notes to the Consolidated Financial Statements. *
|
+ Indicates management contract, compensatory plan or arrangement of the Company.
* Filed or furnished herewith, as applicable.
| (1) |
Incorporated by reference to Registrant’s Registration Statement on Form 10-SB as filed with the Commission on September 19, 2002.
|
| (2) |
Incorporated by reference to Registrant’s Registration Statement on Form 10-SB/A-2 as filed with the Commission on July 13, 2004.
|
| (3) |
Incorporated by reference to Registrant’s Definitive Proxy Statement on Schedule 14A as filed with the Commission on March 13, 2008.
|
| (4) |
Incorporated by reference to Registrant’s Current Report on Form 8-K as filed with the Commission on November 22, 2016.
|
| (5) |
Incorporated by reference to Registrant’s Definitive Proxy Statement on Schedule 14A as filed with the Commission on October 21, 2005.
|
| (6) |
Incorporated by reference to Registrant’s Annual Report on Form 10-K as filed with the Commission on April 1, 2013.
|
| (7) |
Incorporated by reference to Registrant’s Annual Report on Form 10-K as filed with the Commission on March 30, 2016.
|
| (8) |
Incorporated by reference to Registrant’s Annual Report on Form 10-KSB as filed with the Commission on April 17, 2007.
|
(b) Exhibits:
See Item 15(a) (3) above.
(c) Financial Statement Schedules:
See Item 15(a) (2) above.
None.
Pursuant to the requirements of Section 13 or 15(d) of the Securities Exchange Act of 1934, the registrant has duly caused this report to be signed on its behalf by the undersigned, thereunto duly authorized.
|
|
PACIFIC HEALTH CARE ORGANIZATION, INC.
|
||
|
|
|
|
|
|
Date: March 31, 2017
|
By:
|
/s/ Tom Kubota
|
|
|
|
|
Tom Kubota
|
|
|
|
|
Chief Executive Officer and President
|
|
|
|
|
|
|
Pursuant to the requirements of the Securities Exchange Act of 1934, this report has been signed below by the following persons on behalf of the registrant and in the capacities and on the dated indicated.
|
Signatures
|
|
Title
|
|
Date
|
|
|
|
|
|
|
|
|
|
|
|
|
|
/s/ Tom Kubota
|
|
Chief Executive Officer, President and Director
|
|
March 31, 2017
|
|
Tom Kubota
|
|
|
|
|
|
|
|
|
|
|
|
|
|
|
|
|
|
/s/ Fred U. Odaka
|
|
Chief Financial Officer
|
|
March 31, 2017
|
|
Fred U. Odaka
|
|
|
|
|
|
|
|
|
|
|
|
|
|
|
|
|
|
/s/ David Wang
|
|
Director
|
|
March 31, 2017
|
|
David Wang
|
|
|
|
|
|
|
|
|
|
|
|
|
|
|
|
|
|
/s/ Stacy Hadley
|
|
Director
|
|
March 31, 2017
|
|
Stacy Hadley
|
|
|
|
|
|
|
|
|
|
|
|
|
|
|
|
|
|
/s/ Gunter Soraperra
|
|
Director
|
|
March 31, 2017
|
|
Gunter Soraperra
|
|
|
|
|
48