Attached files
| file | filename |
|---|---|
| EX-31.1 - CERTIFICATION PURSUANT TO RULE 13A-14(A)/15D-14(A) CERTIFICATIONS SECTION 302 OF - VERSAR INC | exhibit31-1_otten.htm |
| EX-32.2 - CERTIFICATE PURSUANT TO SECTION 18 U.S.C. PURSUANT TO SECTION 906 OF THE SARBANE - VERSAR INC | exhibit32-2_downes.htm |
| EX-32.1 - CERTIFICATE PURSUANT TO SECTION 18 U.S.C. PURSUANT TO SECTION 906 OF THE SARBANE - VERSAR INC | exhibit32-1_otten.htm |
| EX-31.2 - CERTIFICATION PURSUANT TO RULE 13A-14(A)/15D-14(A) CERTIFICATIONS SECTION 302 OF - VERSAR INC | exhibit31-2_downes.htm |
| EX-23.2 - CONSENTS OF EXPERTS AND COUNSEL - VERSAR INC | gt_consentofindependentre.htm |
| EX-23.1 - CONSENTS OF EXPERTS AND COUNSEL - VERSAR INC | versarconsentofindependen.htm |
| EX-21 - SUBSIDIARIES OF THE REGISTRANT - VERSAR INC | exhibit21.htm |
UNITED
STATES
SECURITIES AND EXCHANGE COMMISSION
WASHINGTON, D.C. 20549
FORM 10-K
ANNUAL REPORT PURSUANT TO SECTION 13 OR 15(d) OF
THE SECURITIES EXCHANGE ACT OF 1934
|
For the fiscal year ended
|
Commission File
|
|
July 1, 2016
|
No. 1-9309
|
Versar, Inc.
(Exact name of registrant as specified in its charter)
|
DELAWARE
|
54-0852979
|
|
(State or other jurisdiction
of Incorporation or organization)
|
(I.R.S. employer identification no.)
|
|
6850 Versar Center, Springfield, Virginia
|
22151
|
|
(Address of principal executive offices)
|
(Zip code)
|
(703) 750-3000
(Registrant’s telephone number, including area
code)
Securities registered pursuant to Section 12(b) of the
Act:
Common Stock, $.01 par value
(Title of Class)
NYSE MKT
(Name of each exchange on which registered)
Securities registered pursuant to Section 12(g) of Act:
NONE
Indicate by check mark if the registrant is a well-known seasoned
issuer, as defined in Rule 405 of the Securities Act.
Yes ☐ No ☑
Indicate by check mark if the registrant is not required to file
reports pursuant to Section 13 or Section 15(d) of the
Act.
Yes ☐ No ☑
Indicate by check mark whether the registrant (1) has filed all
reports required to be filed by Section 13 or 15(d) of the
Securities Exchange Act of 1934 during the preceding 12 months (or
for such shorter period that the registrant was required to file
such reports), and (2) has been subject to such filing requirements
for the past 90 days.
Yes ☐ No ☑
Indicate by check mark whether the registrant has submitted
electronically and posted on its corporate web site, if any, every
Interactive Data File required to be submitted and posted pursuant
to Rule 405 of Regulation S-T during the preceding 12 months (or
for such shorter period that the registrant was required to submit
and post such files).
Yes ☑ No ☐
Indicate by check mark if disclosure of
delinquent filers pursuant to Item 405 of Regulation S-K is not
contained herein, and will not be contained, to the best of
registrant’s knowledge, in definitive proxy or information
statements incorporated by reference in Part III of this Form 10-K
or any amendment to this Form 10-K. ☐
Indicate by check mark whether the registrant is a large
accelerated filer, an accelerated filer, or a non-accelerated filer
(as defined in Rule 12b-2 of the Exchange Act).
|
Large accelerated filer ☐
|
Accelerated filer ☐
|
|
Non-accelerated filer ☐
(Do not check if a smaller reporting company)
|
Smaller reporting company
☑
|
Indicate by check mark whether the registrant is a shell company
(as defined in Rule 12b-2 of the Exchange Act).
Yes ☐ No ☑
The aggregate market value of the voting stock held by
non-affiliates of the registrant as of March 1, 2017 was
approximately $10,348,996.
The number of shares of Common Stock outstanding as of March 1,
2017 was 9,950,958.
PART I
Item 1. Business
Unless this report indicates otherwise the terms
”Versar,” the “Company,” “we,”
“us,” and “our” refer to Versar, Inc. and
consolidated subsidiaries. Versar’s fiscal year end is based
upon a 52 or 53 week year ending on the last Friday of the fiscal
period and therefore does not close on a calendar month end. The
Company’s fiscal year 2016 included 53 weeks and fiscal years
2015 and 2014 included 52 weeks.
Cautionary Statement Regarding Forward-Looking
Statements
This report contains
certain forward-looking statements that are based on current
expectations. Actual results may differ materially.
The forward-looking
statements include, without limitation, those regarding the
continued award of future work or task orders from government and
private clients, cost controls and reductions, the expected
resolution of delays in billing of certain projects, and the
possible impact of current and future claims against the Company
based upon negligence and other theories of liability.
Forward-looking statements involve numerous risks and uncertainties
that could cause actual results to differ materially, including,
but not limited to, the possibility that the demand for the
Company's services may decline as a result of possible changes in
general and industry specific economic conditions and the effects
of competitive services and pricing; the possibility that the
Company will not be able to perform work within budget or
contractual limitations; one or more current or future claims made
against the Company may result in substantial liabilities; the
possibility that the Company will not be able to attract and retain
key professional employees; failure to recover at-risk contract
costs; changes to or failure of the Federal, State, or local
governments to fund certain programs in which the Company
participates; changes in customer procurement policies and
practices; delays in project funding; effects of U.S. Government
conflict of interest policies; loss of anticipated new contract
vehicles either due to funding changes or competitive factors, and
such other risks and uncertainties set forth in this report and in
other reports and other documents filed by the Company from time to
time with the Securities and Exchange
Commission.
Business Overview
Versar, Inc. is a Delaware corporation incorporated in 1969. We are
a global project management company providing value-oriented
solutions to government and commercial clients in three business
segments: (1) Engineering and Construction Management (ECM); (2)
Environmental Services Group (ESG); and (3) Professional Services
Group (PSG). We also provide tailored and secure engineering
solutions in extreme environments and offer specialized abilities
in construction management, security system integration,
performance-based remediation, and hazardous materials
mangement.
Fiscal 2016 proved to be an eventful year for Versar. The year
began with the successful completion of the strategic acquisition
of a federal security integration business from Johnson Controls,
formerly known as Johnson Controls Security Systems, which is now
known as Versar Security Systems (VSS). VSS is a security systems
integrator that designs, installs and supports complex physical
security, network security, and facilities management systems
primarily for Federal Government clients such as Federal Aviation
Administration (FAA), the Food and Drug Administration (FDA),
Department of Justice (DOJ), the Federal Bureau of Investigation
(FBI) and the Federal Emergency Management Agency (FEMA). The
acquisition of VSS expanded Versar’s client base, technical
capabilities, and geographic scope.
As the year progressed, Versar faced significant challenges as
revised government procedures and other market factors resulted in
longer timelines for contract awards and project start dates than
the Company anticipated. This resulting impact on the
Company’s financial performance created constraints that
initiated covenant defaults with our lender and a related inability
to file our required securities filings in a timely manner,
resulting in additional oversight from the lender and the
Company’s related contracting of a Chief Restructuring
Officer (CRO) and exploration of financial and strategic
alternatives. The Company operated at a financial loss for fiscal
2016. In response, the Company initiated a wide range of deliberate
cost cutting measures during fiscal 2016, the results of which will
continue to be realized in future periods. We will continue to
manage our costs based on financial performance. As we adapted
internally to longer cycles in both contract award and project
start dates, we experienced a decrease in our backlog as compared
to fiscal 2015. To address this, we adjusted our bidding strategies
and teaming partnerships, diversified our capabilities, and made
strategic hires. As a service-based company, our revenue is
primarily derived from the provision of labor-based services,
rather than capital-intensive product offerings. Thus, our revenue
is driven by our ability to retain existing clients, attract new
clients, provide quality project and program management at
competitive rates, and identify and retain qualified
employees.
Business Segments
The company is aligned into three reportable segments: ECM, ESG,
and PSG, all of which are described below.
ECM
ECM’s services include facility
planning and programming, engineering design, construction,
construction management and security systems installation and
support. ECM supports federal, state and local governments, as well
as commercial clients worldwide. Our
global network of engineering and construction resources
facilitates the effective mobilization of highly skilled
construction teams and advanced methodologies around the
world.
The primary markets for ECM’s services include a broad range
of infrastructure, master planning, and engineering design for
facilities, transportation, resource management, energy, and local,
regional and international development.
Our services include:
●
Facility Condition Assessments and Space Utilization Analysis
providing Architect-Engineer studies, master planning and area
development plans, sustainability and energy audits, full
Sustainment, Restoration and Modernization (SRM) and Military
Construction (MILCON) design capabilities
●
Construction Management Services providing quality assurance
services in Title II or as owner’s representatives, providing
a legally defensible record of the construction, earned value
project management to objectively measure construction progress,
engineering and schedule analysis and negotiation of change
orders
●
Construction Services includes integrated design-build solutions
for construction, horizontal and vertical SRM projects,
construction of design-bid-build projects including all building
trades, equipment installation and furnishings as
specified
●
Security Systems planning and analysis that includes developing and
updating physical security plans, site surveys and physical
security risk assessments. Engineering and design turnkey solutions
integrating physical and electronic security systems, full
program/project documentation, and configuration management and
design control expertise.
ECM’s key
projects that contributed to the revenue include integration and
maintenance of access control and security systems for the FAA,
construction management services for the U.S. Air Force (USAF) and
U.S. Army, construction management and personal services including
engineering, construction inspection, operations and maintenance
and administrative support to the U.S. Army Corps of Engineers
(USACE) and project and construction management services for the
District of Columbia Courts and commercial customers. The largest
ECM project during fiscal 2016 was the $109.5 million firm fixed
price Design/Bid/Build runway repair task order at Dover Air Force
Base (DAFB) awarded, on August 13, 2014 under Versar’s
S/R&M Acquisition Task Order Contract (SATOC) indefinite
delivery/indefinite quantity (IDIQ) with the Air Force Civil
Engineer Center (AFCEC), held with our joint venture partner,
Johnson Controls Federal Systems. The SATOC IDIQ primarily services
Air Force customers, providing a fast track, efficient method for
execution of all types of facility repairs, renovations and
construction. During the months of December 2016 through February
2017, the work on the task order was suspended due to normal
seasonal weather conditions. Work resumed in March 2017 and the
contract is anticipated to be completed by the end of June
2017.
ESG
ESG
supports federal, state and local governments, and commercial
clients worldwide. For over 40 years, our team of engineers,
scientists, archeologists, and unexploded ordnance staff has
performed thousands of investigations, assessments, and remediation
safely and effectively. Our client-focused approach, complemented
by our regulatory expertise, provides low risk with high value in
today’s complex regulatory climate.
Our
services include:
●
Compliance
services include hazardous waste and hazardous materials management
from permitting support to compliance with applicable federal laws,
emergency response training, hazardous waste facility
decommissioning, energy planning, energy audit and assessment,
commission and metering, Energy Savings Performance Contract (ESPC)
support and Executive Order 13514/sustainability services. We are a
greenhouse gas verification body in California, one of the few
companies certified to review greenhouse gas emissions data in that
state.
●
Cultural Resources
provides clients with reliable solutions from recognized experts,
quality products that are comprehensive yet focused on client
objectives, and large-business resources with small-business
responsiveness and flexibility. ESG’s staff has set the
standard for management, methodologies, and products. Our expertise
and experience in the design and management of innovative programs
that are responsive to client needs and satisfy regulatory
requirements.
●
Natural Resources
services include protected species assessments and management,
wetland delineations and Section 404 permitting, ecosystem and
habitat restoration, and water quality monitoring, ecological
modeling, and environmental planning. Our team has extensive
expertise in developing innovative means for mitigation, managing
the complex regulatory environment, and providing our clients with
the knowledge and experience needed to meet or exceed goals and
objectives.
●
Remediation
services provides on-going federal remediation and restoration
projects, including four Air Force Performance Based Remediation
(PBR) projects operating at more than ten different locations in
nine states. Our success is based in part on the understanding that
the goal of remedial action projects is to eliminate our
clients’ long-term liability and reduce the life cycle costs
of environmental restoration.
●
UXO/MMRP provides
range sustainment services at two of the world’s largest
ranges. Our highly experience staff provide range sustainment
services, range permitting, monitoring, and deconstruction,
surface, subsurface, and underwater investigations and removals,
geophysical surveys, and anomaly avoidance and construction
support.
ESG’s key
projects that contributed to the revenue are our New England, Great
Lakes, Tinker and Front Range PBRs, Range Sustainment Services at
Nellis AFB, hydrodynamic flow modeling and sedimentation study at
Naval Submarine Base Kings Bay, shoreline stabilization projects at
Possum and Cedar Point for the Navy, an Environmental Impact
Statement (EIS) for housing privatization for the USAF, fence to
fence programs at Cannon, Holloman, Barksdale, Columbus AFBs and
Joint Base McGuire-Dix-Lakehurst, large cultural resources efforts
at Avon Park, Tyndall AFB, and Joint Base McGuire-Dix-Lakehurst,
and numerous remedial actions for the U.S. Environmental Protection
Agency (EPA).
PSG
PSG provides onsite environmental, engineering, construction
management, and logistics services to the USAF, U.S. Army, U.S.
Army Reserve, National Guard Bureau, FAA, Bureau of Land Management
(BLM), and DOJ through the Drug Enforcement Agency (DEA). Versar
provides on-site services that enhance a customer’s mission
through the use of subject matter experts who are fully dedicated
to accomplish mission objectives. These services are particularly
attractive as the federal agencies and Department of Defense (DOD)
continue to be impacted by budgetary pressures. This segment
focuses on providing onsite support to government clients to
augment their capabilities and capacities.
Our services include:
●
Facilities and operational support by delivering comprehensive
facility maintenance, life cycle management plan minimizing
operating costs, space utilization, operational
planning/forecasting, and automated planning technical support
services ensuring operational readiness of reserve forces to the
U.S. Army Reserve.
●
Versar assists the U.S. Army Reserve with assessing, improving,
obtaining, maintaining, and sustaining environmental compliance, as
well as conservation requirements, performing hazardous waste
management, spill prevention and clean-up, biological assessments,
wetland sustainment, and environmental training.
●
Environmental quality program services, to include facility and
utilities integration, National Environmental Policy Act
considerations, water program management, wildlife program
management, archaeological and historical preservation to DOD Joint
Base communities.
●
Microbiological and chemical support to the U.S. Army’s
designated Major Range and Test Facility Base for Chemical and
Biological Testing and Training.
●
Biological, archaeological, and GIS support to plan restoration
projects for wildlife habitat improvements and also field
verification of GIS-generated disturbances and related mapping
data.
●
Engineering expertise and program oversight for civil engineering
activities related to various facilities services performed at the
Air National Guard Readiness Center and National Guard
Bureau.
●
Provides the DOJ’s DEA engineering and facilities planning
support for the implementation and completion of SRM
projects.
Revenue Earned by Geographic Location
Our consolidated gross revenue for fiscal 2016 was $167.9 million,
of which approximately $165.7 million was funded with U.S. currency
and approximately $2.2 million was derived from PPS, and funded in
Pounds sterling. Approximately 11% of our fiscal 2016 revenue was
generated in international locations.
Our consolidated gross revenue for fiscal 2015 was $159.9 million,
of which approximately $154.8 million was funded with U.S. currency
and approximately $5.1 million was derived from PPS, and funded in
Pounds sterling. Approximately 18% of our fiscal 2015 revenue was
generated in international locations.
Our consolidated gross revenue for fiscal 2014 was $110.3 million,
of which approximately $107.6 million was funded with U.S. currency
and approximately $2.7 million of the remainder was derived from
PPS, and funded in Pounds sterling. Approximately 30% of our fiscal
2014 business was conducted in international
locations.
Our Strategy
In addressing fiscal 2016’s challenges, Versar remains
committed to our customers, shareholders, employees and partners.
Versar will continue to provide technical expertise to our
primarily federal customers. We will focus on international
construction management in austere environments, security
solutions, ongoing investments in military base efficiencies and
renovation, compliance and environmental remediation. To reiterate
our long-term strategy to reflect our new reality, the following
elements are driving our strategy:
1.
Re-Establish Financial Stability and Grow Shareholder Value. In the
near term, Versar will become current with our financial reporting
requirements with the NYSE MKT LLC (the Exchange) and Securities
and Exchange Commission (SEC). While we continue to seek a
long-term financial solution, we are exploring all strategic
options. We are committed to conservatively managing our resources
to ensure shareholder value and re-establish our financial
stability.
2.
Profitably execute current backlog. Our front-line project managers
and employees will continue to control costs and streamline
processes to profitably execute our current backlog. In addition,
our back-office staff will redouble efforts to support our
front-line employees efficiently and effectively serve our
customers. We are committed to innovatively transform our business
processes to be as efficient and cost-effective as
possible.
3.
Grow our pipeline. We are aggressively mining existing Indefinite
Delivery Indefinite Quantity (IDIQ) contract vehicles to increase
win rates. While we reduced back-office staff in our Business
Development division, we remain committed to growing our pipeline
and backlog by carefully managing our proposal efforts from
identification through award to maximize our business development
investments.
4.
Retain and attract the best people. Our employees are critical to
the execution of our strategy and we are committed to attracting
and retaining the employees required to achieve all the elements of
our strategy.
Competition
Government Contracting is a highly competitive industry, where
price is often the deciding factor. In that environment, it is
critical for Versar to differentiate our capabilities and offerings
to ensure that our customers understand the value of our offerings.
Versar carefully targets our business development and sales efforts
and has developed strategic partnerships to enhance our competitive
advantage.
The acquisition of VSS in fiscal 2016 expanded our customer base to
include the FAA and FEMA, among others, as well as increased our
service offerings into higher margin classified construction.
During fiscal 2017, we will position the company to expand these
new capabilities to existing customers and existing capabilities to
new customers.
Backlog
We report “funded” backlog, which represents orders for
goods and services for which we have received firm contractual
commitments. Based on its history, the Company believes that
approximately 90% of funded backlog will be performed in the
succeeding twelve to eighteen-month period following the execution
of the relevant contract. However, there can be no assurance that
we will ultimately realize our full backlog. Additionally, other
companies with similar types of contracts may not calculate backlog
in the same manner we do, as their calculations may be based on
different subjective factors or because they use a different
methodology. Therefore, information presented by us regarding
funded backlog may not necessarily be comparable to similar
presentations by others.
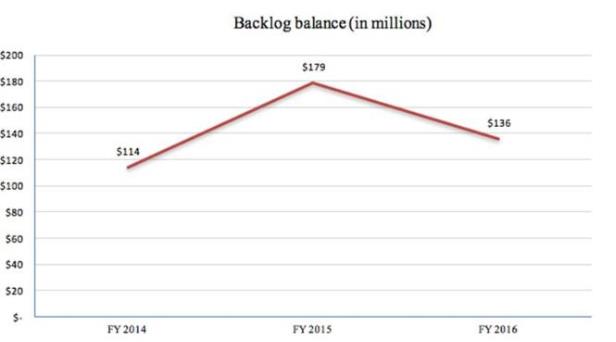
As of July 1, 2016, funded backlog was approximately $136 million,
a decrease of approximately 24% compared to approximately $179
million of funded backlog at the end of the fiscal year 2015.
Backlog for the DAFB project at the end of fiscal 2015 was $55.1
million compared to $8.6 million at the end of fiscal 2016. During
fiscal 2016, the DAFB revenue recognized was $50.2 million as
compared to $43.2 million in fiscal 2015. The Company’s
funded backlog value at fiscal 2015 was the largest in the
Company’s history primarily driven by the August 13, 2014
award of DAFB contract of $98.3 million.
Employees
At July 1, 2016, we had 529 employees, of which 75% are engineers,
scientists, and other professionals. 58% of our professional
employees have a bachelor’s degree, 38% have a master’s
degree, and 4% have a doctorate degree as their highest level of
education earned.
Item 1A. Risk Factors
Our line of credit contains, and our future
debt agreements may contain, covenants that may restrict our
ability to engage in activities that may be in our long-term best
interest, including financing future operations or capital needs or
engaging in other business activities, and that require us to
maintain specific financial ratios or levels.
Our
line of credit restricts, among other things, our ability
to:
●
incur additional
debt;
●
pay dividends or
distributions on our capital stock;
●
purchase, redeem
or retire capital stock;
●
make acquisitions
and investments;
●
create liens on
our assets;
●
enter into certain
transactions with affiliates;
●
merge or
consolidate with another company;
●
obtain or maintain
the appropriate bonding necessary to perform our work;
or
●
transfer or sell
assets outside the ordinary course of business.
In
addition, our line of credit requires that we comply with certain
consolidated Earnings Before Interest, Tax, Depreciation and
Amortization (EBITDA) financial ratios and levels,. These covenants
may adversely impact our ability to finance our future operations
or utilize the capital required to pursue available business
opportunities.
During fiscal 2016, we were in default under certain of our
financial maintenance covenants under our loan agreement, which
defaults were addressed by amendment of the loan agreement
subsequent to the end of the fiscal year; however, we are required
to repay or replace the existing facility. In the future, our
ability to fund our operations could be jeopardized if we cannot
obtain alternative sources of funding. If in the future we again
default under any future credit agreement, or if we are unable to
obtain a new facility or refinance our existing indebtedness, it
would have a material adverse impact on our financial position and
operations.
On
December 9, 2016, Versar, together with certain of its domestic
subsidiaries acting as guarantors, entered into a First Amendment
and Waiver (the Amendment) to the loan agreement (the Loan
Agreement) dated September 30, 2015 with Bank of America, N.A. (the
Lender), as the lender and letter of credit issuer for a revolving
credit facility in the amount of $25,000,000 and a term facility in
the amount $5,000,000. Under the Amendment, the Lender waived all
existing events of default, and reduced the revolving facility to
$13,000,000 from $25,000,000. The Amendment amends the Loan
Agreement to remove the consolidated Total Leverage Ratio covenant,
consolidated Senior Leverage Ratio covenant, consolidated Fixed
Charge Coverage Ratio covenant, and the consolidated Asset
Coverage Ratio covenant, and adds a covenant requiring Versar to
maintain certain minimum quarterly consolidated EBITDA amounts and
requires the Company to pursue alternative sources of funding for
its ongoing business operations and to repay or replace the Loan
Agreement.
If the
Company is not able to repay or refinance the obligations under the
Loan Agreement in accordance with the Loan Agreement requirements
or meet certain other conditions, the Lender may exercise its
rights and remedies with respect to such defaults. In such event,
the Lender could demand immediate repayment of the outstanding
borrowings and terminate the facility. The Lender could also seek
to foreclose on its security interests in our assets and those of
our subsidiaries, which would materially and negatively impact our
ability to fund our business operations. We are currently seeking
alternative sources of funding for our ongoing business operations
as needed. There can be no assurance that we will be able to obtain
alternative financing on terms acceptable to the Company, or at
all. Failure to secure alternative financing would have a material
adverse effect on the Company and its financial
condition.
The Company is taking affirmative steps to modify operational plans
and its internal organization to ensure that it can continue to
operate with its existing cash resources. The actual amount of
funds that the Company will need will be determined by many
factors, some of which are beyond its control, and the Company may
need funds sooner than currently anticipated.
The accompanying Financial Statements have been prepared assuming
the Company will continue as a going concern. If the Company is
unable to identify alternative sources of funding and raise
additional capital as needed to fund operations, due to the
Company’s negative cash flow from operations and accumulated
deficit, there would be substantial doubt about its ability to
continue as a going concern. The Financial Statements do not
include any adjustments that might result from the outcome of this
uncertainty.
We are dependent on government contracts for the majority of our
revenue, and a reduction or delay in spending by government
agencies could adversely affect our business and operating
results.
Contracts with agencies of the United States government and various
state and local governments represented approximately 90% of our
revenue in fiscal 2016, with the remaining 10% of our revenue
coming from commercial sources. Therefore, the success of our
business is materially dependent on contracts with governmental
agencies. Companies engaged in government contracting are subject
to certain unique business risks not shared by those serving the
general commercial sector. Among these risks are:
●
a competitive procurement process with no firm schedule or
guarantee of contracts being awarded;
●
competitive pricing pressure that may require cost reductions in
order to realize revenue under contracts;
●
award of work to competitors due primarily to policy
reasons;
●
dependence on congressional and state appropriations and
administrative allotment of funds;
●
policies and regulations that can be readily changed by governing
bodies;
●
competing political priorities and changes in the political climate
regarding funding and operations of the services;
●
shifts in buying practices and policy changes regarding the use of
contractors;
●
changes in and delays or cancellations of government programs or
requirements;
●
government contracts that are usually awarded for relatively short
periods of time and are subject to renewal options in favor of the
government; and
●
many contracts with U.S. government agencies require annual funding
and may be terminated in the agency’s sole
discretion.
The U.S. government’s contracting laws provide that the U.S.
government can do business only with responsible contractors.
Accordingly, U.S. government agencies have the authority under
certain circumstances to suspend or debar a contractor from bidding
on government contracts.
A reduction or shift in spending priorities by U.S. government
agencies could limit or eliminate the continued funding of our
existing government contracts or awards of new contracts or new
task orders under existing contracts. Any such reductions or shifts
in spending, if significant, could have a material adverse effect
on our business.
Inability of the legislative and executive branches of the federal
government to agree on a budget for key agencies or to enact
appropriations in a timely manner has in the past delayed, and may
in the future delay, the award of contracts. These delays, if
significant, could have a material adverse effect on our
business.
Our government contracts are subject to audit and potential
reduction of costs and fees.
Contracts with the U.S. government and many other state and local
governmental agencies are subject to auditing by governmental
agencies, which could result in the disallowance of certain costs
and expenses. These audits can result in the disallowance of
significant costs and expenses if the auditing agency determines,
in its discretion, that certain costs and expenses were
unwarranted, allowable, or were excessive. Disallowance of costs
and expenses, if pervasive or significant, could have a material
adverse effect on our business.
As a government contractor, we are subject to a number of
procurement laws and regulations, violation of which could result
in sanctions, contract termination, forfeiture of profit, harm to
our reputation or loss of our status as an eligible government
contractor.
We must comply with federal, state and local laws and regulations
regarding the formation, administration and performance of
government contracts. These laws and regulations govern how we
transact business with our government clients and, in some
instances, impose additional costs and related obligations on our
business operations. Even though we take significant precautions to
identify, prevent and deter fraud, misconduct and non-compliance,
we face the risk that our personnel or outside partners may engage
in misconduct, fraud or improper activities. Government contract
violations could result in the imposition of civil and criminal
penalties or sanctions, contract termination, forfeiture of profit
and/or suspension of payment, any of which could make us lose our
status as an eligible government contractor and could cause our
reputation to suffer serious harm. Loss of our status as an
eligible government contractor would have a material adverse effect
on our business.
Actual or perceived conflicts of interest may prevent us from being
able to bid on or perform contracts.
U.S. government agencies have conflict of interest policies that
may prevent us from bidding on or performing certain contracts.
When dealing with U.S. government agencies that have such policies,
we must decide, at times with incomplete information, whether to
participate in a particular business opportunity when doing so
could preclude us from participating in a related procurement at a
future date. We have, on occasion, declined to bid on certain
projects because of actual or perceived conflicts of interest. We
will continue to encounter such conflicts of interest in the
future, which could cause us to be unable to secure key contracts
with U.S. government customers.
Robust enforcement of environmental regulations is important to our
financial success.
Our business is materially dependent on the continued enforcement
by local, state and federal governments of various environmental
regulations. From time to time, depending on changed enforcement
priorities, local, state and federal agencies modify environmental
clean-up standards to promote economic growth and to discourage
industrial businesses from relocating. Any relaxation in
environmental and compliance standards could impact our ability to
secure additional contracting work with such agencies or with other
federal agencies that operate or manage contaminated
property.
Many of our U.S. government customers procure goods and services
through IDIQ, government wide acquisition contract (GWAC) or GSA
Schedule contracts under which we must compete for post-award
orders.
Budgetary pressures and reforms in the procurement process have
caused many U.S. government customers to purchase goods and
services through ID/IQ, GSA Schedule contracts and other multiple
award and/or GWAC contract vehicles. These contract vehicles
increase competition and pricing pressures, requiring us to make
sustained efforts following the initial contract award to obtain
ongoing awards and realize revenue. There can be no assurance that
we will increase revenue or otherwise sell successfully under these
contract vehicles. Any failure by the Company to compete
effectively in this procurement environment could harm our
business, financial condition, operating results and cash flows and
our ability to meet our financial obligations.
If we fail to recover at-risk contract costs, we may have reduced
fees or losses.
We are at risk for any costs incurred before a contract is
executed, modified or renewed. A customer may choose not to pay us
for these costs. While such costs are typically associated with
specific anticipated contracts and funding modifications, we cannot
be certain that our customers will execute these contracts or
contract renewals, or that they will pay us for all our related
at-risk costs. If any such unrecovered at-risk costs are
significant, we may experience a decline in contract margins or
experience losses on certain contracts or in certain periods,
resulting in reduced profitability. We face increased pressure on
profit margins and may need to lower margins to price projects at a
more competitive rate to win awards.
We could face potential liability for failure to properly design
remediation.
Part of our business involves the design and implementation of
remediation at environmental clean-up sites. If we fail to properly
design and build a remediation system, or if a person claims that
we did, we could face expensive litigation or regulatory
enforcement efforts and potential settlement costs. If we fail to
successfully defend against such a lawsuit, it could have a
material adverse effect on our business.
Environmental laws and regulations and our use of hazardous
materials may subject us to significant liabilities.
Our operations are subject to U.S. federal, state and local
environmental laws and regulations, as well as environmental laws
and regulations in the various countries in which we operate. We
are also subject to environmental laws and regulations relating to
the discharge, storage, treatment, handling, disposal and
remediation of regulated substances and waste products, such as
radioactive, biochemical or other hazardous materials and
explosives. We may incur substantial costs in the future because of
modifications to current laws and regulations, new laws and
regulations, new guidance or new interpretation of existing laws or
regulations, violations of environmental laws or required operating
permits, or discovery of previously unknown contamination.
Incurring such additional costs could have a material adverse
effect on our business.
Our failure to properly manage projects may result in additional
costs or claims.
Our engagements regularly involve complex and lengthy projects. The
quality of our performance on such projects depends in large part
upon our ability to manage the relationship with our clients, and
to effectively manage the projects and deploy appropriate resources
in a timely manner. If we miscalculate the resources or time
required to complete those projects with capped or fixed fees, our
operating results could be adversely affected. Further, any defects
or errors, or failures to meet our client’s expectations,
could result in claims for damages against us.
Our services expose us to significant risks of liability and it may
be difficult to obtain or maintain adequate insurance
coverage.
Our services involve significant risks of professional and other
liabilities that may exceed the fees we derive from performance.
Our business activities could expose us to potential liability
under various laws and regulations and under federal and state
workplace health and safety regulations. In addition, we sometimes
may assume liability by contract under indemnification agreements.
Given the varied nature of our many agreements, we are not able to
predict the magnitude of any such liabilities.
We obtain insurance from third party carriers to cover our
potential risks and liabilities. However, it is possible that we
may not be able to obtain adequate insurance to meet our needs, may
have to pay an excessive amount for the insurance coverage we
require, or may not be able to acquire any insurance for certain
types of business risks.
We are exposed to risks associated with operating
internationally.
A certain portion of our business is conducted internationally.
Consequently, we are subject to a variety of risks that are
specific to international operations, including the
following:
●
export regulations that could erode profit margins or restrict
exports;
●
compliance with the U.S. Foreign Corrupt Practices
Act;
●
compliance with the U.K Anti Bribery Act;
●
compliance with the anti-corruption laws of other jurisdictions in
which we operate;
●
the burden and cost of compliance with foreign laws, treaties and
technical standards and changes in those regulations;
●
contract award and funding delays;
●
potential restrictions on transfers of funds;
●
foreign currency fluctuations;
●
import and export duties and value added taxes;
●
transportation delays and interruptions;
●
uncertainties arising from foreign local business practices and
cultural considerations; and
●
potential military conflicts, civil strife and political
risks.
While we have and will continue to adopt and implement aggressive
measures to reduce the potential impact of losses resulting from
the risks of our foreign business, we cannot ensure that such
measures will be adequate.
Political destabilization or insurgency in the regions in which we
operate may have a material adverse effect on our
business.
Certain regions in which we operate are highly politically
unstable. Insurgent activities in the areas in which we operate may
cause further destabilization in these regions. There can be no
assurance that the regions in which we operate will continue to be
stable enough to allow us to operate profitably or at all. We are
required to increase compensation to our personnel as an incentive
to deploy them to many of these regions. To date, we have been able
to recover such costs under our contracts, but we may not be able
to do so in the future. To the extent that we are unable to
transfer such increased costs to our customers, our operating
margins would be adversely impacted, which could adversely affect
our operating performance. In addition, increased insurgent
activities or destabilization, including civil unrest or a civil
war in Iraq or Afghanistan, may lead to a determination by the U.S.
government to halt our operations in a particular location, country
or region and to perform the services that we provide using
military personnel.
If our partners fail to perform their contractual obligations on a
project, we could be exposed to legal liability, loss of reputation
or reduced profits.
From time to time, we enter into joint venture and other
contractual arrangements with partners to jointly bid on and
execute certain projects. The success of these joint projects
depends in part on the satisfactory performance of the contractual
obligations by our partners. If any of our partners fail to satisfy
their contractual obligations, we may be required to make
additional investments and provide additional services to complete
projects, increasing our cost on such projects. If we are unable to
adequately address a partner’s performance issues, then our
client could terminate the joint project, exposing us to legal
liability, loss of reputation or reduced profits.
We operate in highly competitive industries.
The markets for many of our services are highly competitive. There
are numerous professional architectural, engineering, construction
management, and environmental consulting firms, and other
organizations that offer many of the same services offered by us.
We compete with many companies that have greater resources than us
and we cannot provide assurance that such competitors will not
substantially increase the resources they devote to those
businesses that compete directly with our services. Competitive
factors considered by clients include reputation, performance,
price, geographic location and availability of technically skilled
personnel. In addition, we face competition from the use by our
clients of in-house environmental, engineering and other
staff.
Our long-term growth strategy includes acquisitions of other
businesses, which may require us to incur costs and liabilities or
have other unexpected consequences which may adversely affect our
operating results and financial condition.
Like other companies with similar growth strategies, we may be
unable to successfully implement our growth strategy, as we may be
unable to identify suitable acquisition candidates, obtain
acceptable financing, or consummate any future acquisitions. We
frequently engage in evaluations of potential acquisitions and
negotiations for possible acquisitions, certain of which, if
consummated, could significantly enhance the Company’s
competitive position. Although it is our general objective only to
acquire those companies which will be accretive to both earnings
and cash flow, any potential acquisitions may result in material
transaction expenses, increased interest and amortization expense,
increased depreciation expense and increased operating expense, any
of which could have a material adverse effect on our operating
results. Acquisitions will require integration and management of
the acquired businesses to realize economies of scale and control
costs. In addition, acquisitions may involve other risks, including
diversion of management resources otherwise available for ongoing
development of our business and risks associated with entering new
markets. Future acquisitions may also result in potential dilution
of the Company’s securities. Consummation of acquisitions may
subject the Company to unanticipated business uncertainties or
legal liabilities relating to those acquired businesses for which
the sellers of the acquired businesses may not fully indemnify us.
We may not realize the full anticipated benefit of any acquired
business that has operated as a small business (as determined by
the Small Business Administration based upon the North American
Industry Classification Systems) if following their acquisition by
us certain of their contracts are revoked or not renewed because
they fail to continue to maintain small business
status.
An economic
downturn may have a material
adverse effect on our business.
In an economic recession, or under other adverse macroeconomic
conditions that may arise from natural or man-made events,
customers and vendors may be less likely to meet contractual terms
and payment or delivery obligations. In particular, if the U.S.
government changes its operational priorities in Iraq and/or
Afghanistan, reduces the DOD Operations and Maintenance budget, or
reduces funding for Department of State initiatives in which we
participate, our business, financial condition and results of
operations could be severely affected.
Our quarterly and annual revenue, expenses and operating results
may fluctuate significantly, which could have a negative effect on
the price of our common stock.
Our quarterly and annual revenues, expenses and operating results
have and may continue to fluctuate significantly because of a
number of factors, including:
●
the seasonality of the spending cycle of our public sector clients,
notably the U.S. government, and the spending patterns of our
private sector clients;
●
the hiring and utilization rates of employees in the United States
and internationally;
●
the number and significance of client engagements commenced and
completed during the period;
●
the delays incurred in connection with an engagement because of
weather or other factors;
●
the ability to work within foreign countries’ regulations,
tax requirements and obligations;
●
the business, financial, and security risks related to working in
foreign countries;
●
the ability of clients to terminate engagements without
penalties;
●
the creditworthiness and solvency of clients;
●
the size and scope of engagements;
●
the delay in federal, state and local government
procurements;
●
the ability to perform contracts within budget or contractual
limitations;
●
the timing of expenses incurred for corporate
initiatives;
●
any threatened or pending litigation or other regulatory
enforcement matters;
●
periodic reductions in the prices of services offered by our
competitors;
●
the likelihood of winning the re-bids of our existing large
government contracts;
●
the general economic and political conditions;
●
the loss of a major contract or the shutdown of a major
program;
●
the volatility of currencies in foreign countries; and
●
our ability to integrate any acquisition or the ability of an
acquired business to continue to perform as expected.
Variations in any of these factors could cause significant
fluctuations in our operating results from quarter to quarter and
could result in net losses and have a material adverse effect on
our stock price.
We are highly dependent on key personnel and our business could
suffer if we fail to continue to attract, train and retain skilled
employees.
Our business is managed by a number of key management and operating
professional personnel. The loss of key personnel could have a
material adverse effect on our business.
Availability of highly trained and skilled professional,
administrative and technical personnel is critical to our future
growth and profitability. Even in the current economic climate,
competition in our industry for scientists, engineers, technicians,
management and professional personnel is intense and competitors
aggressively recruit key employees. Competition for experienced
personnel, particularly in highly specialized areas, has
occasionally made it more difficult for us to timely meet all our
staffing needs. We cannot be certain that we will be able to
continue to attract and retain required staff. Any failure to do so
could have a material adverse effect on our business, financial
condition, operating results and our ability to meet our financial
obligations. Failure to recruit and retain a sufficient number of
such employees could adversely affect our ability to maintain or
grow our business. Some of our contracts require us to staff a
program with personnel that the customer considers key to
successful performance. If we cannot provide such personnel or
acceptable substitutes, the customer may terminate the contract,
and we may be unable to recover our costs.
In order to succeed, we will have to keep up with a variety of
rapidly changing technologies. Various factors could affect our
ability to keep pace with these changes.
Our success will largely depend on our ability to keep pace with
changing technologies that can occur rapidly in our core business
segments. We may incur significant expenses updating our
technologies, which could have a material adverse effect on our
margins and results of operations. Even if we keep up with the
latest developments and available technology, newer services or
technologies could negatively affect our business.
Our employees may engage in misconduct or other improper
activities, which could harm our business.
Like all companies, we face the risk of employee fraud or other
misconduct. Employee misconduct could include intentional failures
to comply with U.S. government procurement regulations,
unauthorized activities, attempts to obtain reimbursement for
improper expenses, or submission of falsified time records.
Employee misconduct could also involve improper use of our
customers’ sensitive or classified information, which could
result in regulatory sanctions against us. Negative press reports
regarding employee misconduct could harm our reputation with the
government agencies for which we work. If our reputation with these
agencies is negatively affected, or if we are suspended or debarred
from contracting with government agencies for any reason, our
future revenues and growth prospects would be adversely affected.
It is not always possible to deter employee misconduct, and the
precautions we take to prevent and detect this activity may not be
effective in controlling unknown or unmanaged risks or losses,
which could harm our business, financial condition, operating
results and our ability to meet our financial
obligations.
Internal system or service failures could disrupt our business and
impair our ability to effectively provide our services and products
to our customers, which could damage our reputation and adversely
affect our revenue, profitability and operating
results.
Our information technology systems are
subject to systems failures, including network, software or
hardware failures, whether caused by us, third-party service
providers, cyber intruders or hackers, computer viruses, attacks on
our computers systems, phishing attacks, natural disasters, power
shortages or terrorist attacks. Any such failures or cyber-threat
could cause loss of data and interruptions or delays in our
business processes, cause us to incur remediation costs, subject us
to claims and damage our reputation. Failure or disruption of our
communications or utilities could cause us to interrupt or suspend
our operations or otherwise adversely affect our business. Any
system or service disruptions if not anticipated and appropriately
mitigated could have a material adverse effect on our business
including, among other things, an adverse effect on our ability to
bill our customers for work performed on our contracts, collect the
amounts that have been billed and produce accurate financial
statements in a timely manner. Our property and business
interruption insurance may be inadequate to compensate us for all
losses that may occur as a result of any system or operational
failure or disruption and, as a result, our results of operations
could be materially and adversely affected. Versar has invested in and implemented
systems that will allow it to achieve and remain in compliance with
the regulations governing its business; however, there can be no
assurance that such systems will be effective at achieving and
maintaining compliance or that we will not incur additional costs
in order to make such systems effective.
We have submitted claims to clients for work we performed beyond
the initial scope of some of our contracts. If these clients do not
approve these claims, our results of operations could be adversely
impacted.
We typically have pending claims submitted under some of our
contracts for payment of work performed beyond the initial
contractual requirements for which we have already recorded
revenue. In general, we cannot guarantee that such claims will be
approved in whole, in part, or at all. If these claims are not
approved, our revenue may be reduced in future
periods.
An impairment charge of goodwill could have a material adverse
impact on our financial condition and results of
operations.
Because we have grown in part through acquisitions, goodwill
and intangible assets-net represent a substantial portion of our
assets. Goodwill and intangible assets-net were $7.2 million as of
July 1, 2016. Under accounting principles generally accepted in the
United States, we are required to test goodwill carried in our
Consolidated Balance Sheets for possible impairment on an annual
basis based upon a fair value approach and whenever events occur
that indicate impairment could exist. These events or circumstances
could include a significant change in the business climate,
including a significant sustained decline in a reporting unit's
market value, legal factors, operating performance indicators,
competition, sale or disposition of a significant portion of our
business, a significant sustained decline in our market
capitalization and other factors. In connection with our annual
goodwill impairment testing for fiscal 2016, we recorded impairment
charges of $20.3 million related to goodwill and $3.8 million
related to intangible assets due to market conditions and business
trends within the ECM, ESG, and PSG reporting units.
Maintaining adequate bonding capacity is necessary for us to
successfully bid on and win fixed-price contracts. Failing to
maintain adequate bonding capacity could have a material adverse
impact on our ability to pursue new construction services
contracts.
In line with industry practice, we are often required to provide
bid, performance or payment bonds to clients under certain
fixed-price contracts. These bonds indemnify the
customer should we fail to perform our obligations under the
relevant contract. If a bond is required for a
particular project and we are unable to obtain an appropriate bond,
we cannot pursue that project. We have bonding capacity
but, as is typically the case, the issuance of a bond is at the
surety’s sole discretion. Moreover, due to events
that affect the insurance and bonding markets generally, bonding
may be more difficult to obtain in the future or may only be
available at significantly higher costs. There can be no
assurance that our bonding capacity will continue to be available
to us on reasonable terms. Our inability to obtain
adequate bonding and, as a result, to bid on new fixed-price
contracts could have a material adverse effect on our business,
financial condition, results of operations and cash
flows.
Our operating margins may decline under our fixed-price contracts
if we fail to estimate accurately the time and resources necessary
to satisfy our obligations.
Some of our contracts are fixed-price contracts, under which we
bear the risk of any cost overruns. Our profits are adversely
affected if our costs under these contracts exceed the assumptions
that we used in bidding for the contract. Often, we are required to
fix the price for a contract before we finalize the project
specifications, increasing the risk that we may misprice these
contracts. The complexity of many of our engagements makes
accurately estimating our time and resources more difficult. In the
event we fail to estimate our time and resources accurately, our
expenses will increase and our profitability, if any, under such
contracts will decrease.
Item 2. Properties
Our corporate executive office is located in Springfield, Virginia,
which is a suburb of Washington, D.C. Versar currently leases
40,507 square feet from Springfield Realty Investors, LLC. The rent
is subject to a two percent escalation per year through December
31, 2021.
As of July 1, 2016, we had under lease an
aggregate of approximately 213,000 square feet of office and manufacturing
space in the following locations (parenthetical reference of
business segments using space): Dulles (ECM), Springfield (all
segments), Hampton, VA (ESG); Chandler, AZ (ESG); Westminster, CO
(all segments); Atlanta, GA (ESG and PSG); Aiea, HI (ECM); Boise,
ID (ESG); Columbia (ESG), and Germantown, MD (ECM and ESG);
Charleston, SC (ESG); San Antonio and El Paso, TX (ESG); Clark Air
Force Base, the Republic of Philippines (ECM); Milton Keynes, U.K.
(ECM); and Abu Dhabi (ECM and ESG), United Arab Emirates. The lease
terms primarily range from two to six years.
Item 3. Legal Proceedings
Versar and its subsidiaries are parties from time to time to
various legal actions arising in the normal course of business. We
believe that any ultimate unfavorable resolution of any current
ongoing legal actions will not have a material adverse effect on
its consolidated financial condition and results of
operations.
PART II
Item 5. Market for Registrant’s Common Equity, Related
Stockholder Matters and Issuer Purchases of Equity Securities
Common Stock
Our common stock is traded on the NYSE MKT under the symbol VSR. At
March 1, 2017, the Company had 825 stockholders of record,
excluding stockholders whose shares were held in nominee name. The
quarterly high and low sales prices as reported on the NYSE MKT
during fiscal years 2016 and 2015 are presented below.
|
Fiscal Year 2017
|
High
|
Low
|
|
2nd Quarter
|
1.56
|
1.19
|
|
1st Quarter
|
1.87
|
1.15
|
|
|
|
|
|
Fiscal Year 2016
|
High
|
Low
|
|
4th Quarter
|
3.25
|
1.01
|
|
3rd Quarter
|
3.07
|
1.93
|
|
2nd Quarter
|
3.55
|
2.67
|
|
1st Quarter
|
4.38
|
2.86
|
|
|
|
|
|
Fiscal Year 2015
|
High
|
Low
|
|
4th Quarter
|
4.45
|
3.06
|
|
3rd Quarter
|
3.60
|
2.96
|
|
2nd Quarter
|
7.84
|
2.69
|
|
1st Quarter
|
4.10
|
3.06
|
No cash dividends have been paid by Versar since it began public
trading of its stock in 1986. The Board of Directors intends to
retain any future earnings for use in our business and does not
anticipate paying cash dividends in the foreseeable future. Under
the terms of our revolving line of credit, approval would be
required from our Lender for the payment of any dividends. We have
established equity compensation plans to attract, motivate and
reward good performance of high caliber employees, directors and
service providers serving Versar and its affiliates. Currently,
there is one stock incentive plan, which was previously approved by
the stockholders: the 2010 Stock Incentive Plan. We do not maintain
any equity compensation plans not approved by our stockholders.
Through July 1, 2016, 551,369 restricted stock units have been
granted under this plan.
Equity Compensation Plan Information
|
|
|
|
|
|
|
Number of securities
|
|
|
|
|
|
|
|
remaining available for
|
|
|
|
Number of Securities
|
|
|
|
future issuance under
|
|
|
|
to be issued upon
|
|
Weighted-average
|
|
equity compensation
|
|
|
|
exercise of
|
|
exercise price of
|
|
plans, excluding
|
|
|
|
outstanding options,
|
|
outstanding options,
|
|
securities reflected in
|
|
|
|
warrants and rights
|
|
warrants and rights
|
|
column (a)
|
|
Plan Category
|
|
(a)
|
|
(b)
|
|
(c)
|
|
Equity compensation plans approved by security holders
|
|
-
|
|
-
|
|
539,935
|
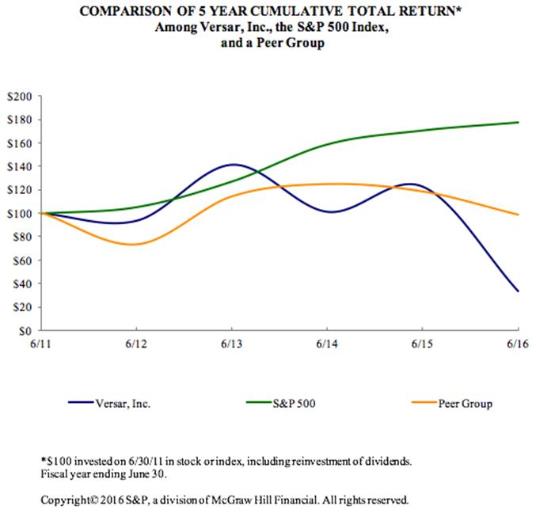
The graph below matches Versar, Inc.'s cumulative 5-Year total
shareholder return on common stock with the cumulative total
returns of (i) the S&P 500 index and (ii) a customized peer
group of five companies comprised of AECOM Technology Corp.,
Arcadis, NV, Ecology & Environment Inc., TRC Companies Inc. and
URS Corp. The graph tracks the performance of a $100 investment in
our common stock, in each of the peer groups, and the index (with
the reinvestment of all dividends) from 6/30/2011 to
6/30/2016.
The stock price performance included in this graph is not
necessarily indicative of future stock price
performance.
Item 7. Management’s Discussion and Analysis of Financial
Condition and Results of Operations
The following discussion and analysis of our financial condition
and results of operations is provided to enhance the understanding
of, and should be read together with, our consolidated financial
statements and the notes to those statements that appear elsewhere
in this Annual Report on Form 10-K. This discussion contains
forward-looking statements that involve risks and uncertainties.
Unless otherwise specifically noted, all years refer to our fiscal
years which ended on July 1, 2016, June 26, 2015 and June 27,
2014.
Financial Trends
Our business performance is affected by the overall level of U.S.
Government spending and the alignment of our offerings and
capabilities with the budget priorities of the U.S. Government.
Adverse changes in fiscal and economic conditions, such as the
manner in which spending reductions are implemented, including
sequestration, future government shutdowns, and issues related to
the nation’s debt ceiling, could have a material adverse
effect on our business.
In this challenging economic environment, our focus is on those
opportunities where the U.S. Government continues funding and which
clearly align with Versar’s capabilities. These opportunities
include construction management, security system integration,
performance-based remediation, and hazardous materials management.
We also continue to focus on areas that we believe offer attractive
enough returns to our clients, such as construction type services
both in the U. S. and internationally, improvements in energy
efficiency, and assisting with facility upgrades. We continue to
see a decline in some of our PSG contract positions largely due to
the continued shift to more contract solicitations being targeted
to small business and similar such programs. If we are unable to
seek new ways to develop our relationships with firms qualified for
these programs to increase our ability to capture more of this work
and maintain current projects this may result in a material impact
of future periods. Overall, our pipeline remains robust, but longer
timelines for contract awards and project start dates have slowed
the transition from pipeline to backlog and then to revenue
generating projects.
We believe that Versar has the expertise to identify and respond to
the challenges raised by the issues we face and that we are
positioned in the coming year to address these concerns. Our
business operates through the following three business segments:
ECM, ESG, and PSG. These segments are segregated based on the
nature of the work, business processes, customer bases and the
business environment in which each of the segments
operates.
The initial award for the DAFB project was $98.3 million. Seven
modifications have raised the contract ceiling to $109.5 million.
DAFB project contributed $50.2 million of revenue for fiscal 2016
as compared to $43.2 million for fiscal 2015, an increase of $6.9
million. Versar is the prime contractor on the DAFB project, with a
significant portion of the work performed by sub-contractors,
resulting in positive smaller gross margin on the project than our
self-performing projects. During January 2017, the DAFB customer,
issued the Company a Notice of Forbearance stating we had not met
our contractual obligation to complete the DAFB project by December
31, 2016. We submitted several change order requests to the DAFB
customer during fiscal 2016, which are still pending resolution.
The requested change orders impacted our timeline for completion of
the project, and were outside the original scope of services to be
performed, but did not impact the project’s profitability. We
continue to work and perform tasks on the DAFB project, while under
the Notice of Forbearance, in order to deliver the completed runway
project as soon as possible. We anticipate the acceptance of the
change orders and resolution of the construction related issues by
the DAFB customer that will resolve the current Notice of
Forbearance and allow the Company to complete the construction
project by June 28, 2017.
There are risk factors or uncertainties that could significantly
impact our future financial performance. A sample of these risks is
listed below. For a complete discussion of these risk factors and
uncertainties, refer to Item 1A. Risk Factors, herein.
Factors
Affecting Fiscal 2016 Performance
During fiscal 2016, the Company recognized many onetime project
losses and charges to our Income Statement and Balance Sheet as
follows:
Loss Contingency Accruals in the ESG Segment
In June 2016, a class action lawsuit was filed against the Company
by former employees alleging violations of several provisions of
California’s labor law relating to paid lunch time and breaks
for the years 2012 through 2015. The Company has reviewed the
supporting files and documentation regarding this notice and has
engaged outside counsel with experience with these matters to
assist the Company in the defense of this matter. Given that this
matter is in a very early stage it is difficult to predict the
likely outcome; however, management has determined a reasonably
possible loss in a range of $0.5 to $1.0 million, including the
expenses of outside counsel. The Company performed an initial
financial review of the number of employees, days worked, and hours
per day worked by employees on this project over the course of the
years noted in the lawsuit. As a result of this analysis, the
Company has recorded a loss contingency accrual of $0.5 million
related to this event. On October 11, 2016, the mediation resulted
in a Confidential Memorandum Of Understanding (MOU) for settlement
of this claim. The estimated contingency accrual of $0.5 million
remains consistent with this MOU.
In May 2016, during a routine audit by the General Services
Administration (“GSA”) concerning authorized GSA
schedule rates compared to the invoicing of a federal customer, the
GSA discovered that the Company had been charging its customer
several billing rates that were not supported by the contractual
listed billing rates for the fiscal 2015 and 2016. The outcome of
this audit finding has not yet been resolved. The Company has
performed a preliminary financial analysis of the number of
employees working, labor categories billed to the customer, the
contractual billing rates that should have been billed, days
worked, and hours per day worked on this project over the course of
the years noted in the audit finding. This preliminary analysis is
the basis for the Company’s probable loss and provided the
basis for the accrual made. Therefore, the Company determined the
audit finding to be estimateable and recorded a loss contingency
accrual of $0.3 million related to this event during the fiscal
year ended July 1, 2016. Subsequently, the outstanding audit
issues were resolved and the Company made a payment of $0.3 million
to the GSA in November 2016.
During April 2016, a project under one of
the Company’s PBR Task Orders involving a ground water
extraction well system at a site in Ohio failing
to meet minimum performance
requirements required rehabilitation/replacement. This work was
completed under the Company’s 2009 United States Air Force
Worldwide Environmental Restoration and Construction contract with
the Air Force Civil Engineer Center (“AFCEC”). This
extraction well system failure was not included in the
Company’s original budget for the performance of this
work. In accordance with the performance basis of our
contract with the customer, the Company must repair and or replace
all equipment located on the site that fails to meet performance
requirements. The Company has performed a review of the materials
and labor required to rehabilitate or replace the extraction well
system and used this review as the basis of the estimate for the
accrual. The Company recorded a loss contingency accrual of $0.3
million to rehabilitate or replace the extraction well system. The
corrective action will occur during the first three quarters of
fiscal 2017.
Lease Loss Accruals
In March 2016, the Company abandoned its field office facilities in
Charleston, SC and Lynchburg, VA, both within the ESG segment.
Although the Company remains obligated under the terms of these
leases for the rent and other costs associated with these leases,
the Company decided to cease using these spaces effective April 1,
2016, and does not plan to occupy them in the future. Therefore,
the Company recorded a charge to selling, general and
administrative expenses of approximately $0.4 million to recognize
the costs of exiting these spaces. This liability is equal to the
total amount of rent and other direct costs for the period of time
that the space is expected to remain unoccupied. In addition, this
liability includes, the present value of the amount by which the
rent paid by the Company to the landlord exceeds any rent paid to
the Company by a tenant under a sublease over the remainder of the
lease terms, which expire in April 2019 for Charleston, SC, and
June 2020 for Lynchburg, VA. The Company also recognized $0.1
million of costs for the associated leasehold improvements related
to the Lynchburg, VA office.
In June 2016, the Company abandoned an office in San Antonio, TX,
which is within the ECM segment. The Company will, however,
continue to use a smaller office in San Antonio. Although the
Company remains obligated under the terms of this lease for the
rent and other costs associated with this lease, the Company made
the decision to cease using this space on July 1, 2016, and has no
foreseeable plans to occupy it in the future. Therefore, the
Company recorded a charge to selling, general and administrative
expenses of approximately $0.2 million to recognize the costs of
exiting this space. This liability is equal to the total amount of
rent and other direct costs for the period of time that the space
is expected to remain unoccupied. In addition, this liability
includes the present value of the amount by which the rent paid by
the Company to the landlord exceeds any rent paid to the Company by
a tenant under a sublease over the remainder of the lease term,
which expires in February 2019. The Company also recognized $0.2
million of costs for the associated leasehold improvements related
to the San Antonio, TX office.
Other Nonrecurring Expenses
On September 30, 2015, the Company, together with certain of
its domestic subsidiaries acting as guarantors, entered into a loan
agreement with the Lender and letter of credit issuer for a
revolving credit facility in the amount of $25.0 million and a term
facility in the amount of $5.0 million. The proceeds of the term
facility and borrowings under the revolving credit facility were
used to repay amounts outstanding under the Company’s Third
Amended and Restated Loan and Security Agreement with United Bank
and to pay a portion of the purchase price for the acquisition of
VSS.
During the third and fourth quarters of fiscal 2016, as has
previously been disclosed, following discussion with the Lender,
the Company determined that it was not in compliance with the
covenants regarding its Consolidated Total Leverage Ratio,
Consolidated Senior Leverage Ratio and Asset Coverage Ratio under
the loan agreement. Each failure to comply with these covenants
constitutes a default under the Loan Agreement. On May 12, 2016,
the Company, certain of its subsidiaries, and the Lender entered
into a Forbearance Agreement pursuant to which the Lender agreed to
forbear from exercising any and all rights or remedies available to
it under the Loan Agreement and applicable law related to these
defaults for a period ending on the earliest to occur of: (a) a
breach by the Company of any obligation or covenant under the
Forbearance Agreement, (b) any other default or event of default
under the Loan Agreement or (c) June 1, 2016 (the Forbearance
Period). During the Forbearance Period, the Company continued to
have the right to borrow funds pursuant to the terms of the Loan
Agreement. The Lender engaged an advisor to review the
Company’s financial condition on the Lender’s behalf.
The Company accrued $0.1 million at July 1, 2016 related to the
costs of services provided by the Lenders’
advisor.
Subsequent to the end of fiscal year 2016, the Company, certain of
its subsidiaries and the Lender entered into forbearance
agreements, which allowed the Company to borrow funds pursuant to
the Loan Agreement, consistent with current Company needs as set
forth in a 13-week cash flow forecast subject to certain caps on
revolving borrowings initially of $15.5 million and reducing to
$13.5 million through December 9, 2016. In addition, from and after
June 30, 2016 outstanding amounts under the credit facility bear
interest at the default interest rate set forth in the credit
facility equal to the LIBOR Daily Floating Rate (as defined in the
credit facility) plus 3.95%. The Company was required to provide a
13 week cash flow forecast updated on a weekly basis to the Lender
and the Lender waived any provisions prohibiting the financing of
insurance premiums for policies covering the period of July 1, 2016
to June 30, 2017 in the ordinary course of the Company’s
business and in amounts consistent with past practices. The
forbearance agreement also required the Company to pursue
alternative sources of funding for its ongoing business operations.
In connection with the forbearance agreement, the Company recorded
a charge to selling, general and administrative expenses of
approximately $0.2 million for fiscal year 2016 related to the
remaining deferred expenses associated with the loan agreement
entered into in September 2015.
On December 9, 2016, Versar, together with certain of its domestic
subsidiaries acting as guarantors (collectively, the Guarantors),
entered into a First Amendment and Waiver (the Amendment) to the
loan agreement (the Loan Agreement) dated September 30, 2015 with
the Lender.
Under the Amendment, the Lender waived all existing events of
default, and reduced the revolving facility to $13,000,000 from
$25,000,000. The interest rate on borrowings under the revolving
facility and the term facility accrue at the LIBOR Daily Floating
Rate plus 5.00% from LIBOR plus 1.87%. The Amendment amended the
Loan Agreement to add a covenant requiring Versar to maintain
certain minimum quarterly consolidated EBITDA amounts. The
Amendment also eliminated the Loan Agreement covenants requiring
maintenance of a required consolidated total leverage ratio,
consolidated fixed charge coverage ratio, consolidated senior
leverage ratio and consolidated asset coverage ratio.
The Company, entered into negotiations with Applied Research
Associates (ARA) regarding the fiscal 2014 acquisition of GMI, and
the related price agreement dated September 2, 2013 between Versar
and ARA. Per the price agreement, after the closing date of the
acquisition, Versar was to calculate the net working capital
adjustment and then make a payment to, or receive a payment from,
ARA for the adjusted amount. As the Company continues to negotiate
a payment settlement to ARA, a reasonably possible payment
calculation is within a range of $0.7 million to $2.2 million. The
Company has recorded a loss contingency accrual of $1.2 million
which represents management’s best estimate of the ultimate
cost to resolve this matter. The contracts acquired related to this
acquisition are reported within the ECM and ESG segments on a 58.6%
and 41.4% allocation with the segments receiving their proportional
share of the loss contingency accrual.
During the fourth quarter of fiscal 2016, the Company recorded a
$9.5 million charge to record a full valuation allowance against
its deferred tax assets. ASC 740-10-30-4 requires deferred taxes to
be determined separately for each taxpaying component in each tax
jurisdiction. Furthermore, the deferred tax assets must be reduced
by a valuation allowance if, based on the weight of available
positive and negative evidence, it is “more likely than
not” that some portion or all of the deferred tax assets will
not be realized. The Company has determined to reduce the deferred
tax asset to the amount that is more likely than not to be
realized.
Additionally, during the fourth quarter of fiscal 2016, the Company
recorded a $1.9 million charge to recognize a loss on the sale of
PPS, which is scheduled to be sold in March 2017. This amount is
recorded as Other Expense (Income) in the financial
statements.
Goodwill and Intangible Expense Impairments
During the third quarter of fiscal 2016, sustained delays in
contract awards and contract funding and the direct impact on the
Company’s results of operations, coupled with the continued
decrease in the Company’s stock price, and were deemed to be
triggering events that led to an interim period test for goodwill
impairment. As a result of our analysis, we recorded an impairment
charge of $15.9 million. The carrying value of goodwill after
impairment at April 1, 2016 was $4.4 million. The Company’s
remaining goodwill balance, after impairment, was derived from the
acquisition of JMWA in fiscal 2015. Based on the results of the
impairment testing, the Company concluded that the value of
definite-lived intangible assets with a carrying value of $2.9
million was not recoverable. The Company has recorded a charge of
$1.5 million for the partial impairment of definite-lived
intangible assets acquired from JMWA, a charge of $0.8 million for
the impairment of definite-lived intangible assets acquired from
GMI, and a charge of $0.7 million for the impairment of
definite-lived intangible assets of PPS, acquired in fiscal 2010,
and Charon Consulting, acquired in fiscal 2012. As a result of
these charges, the carrying amount of intangible assets acquired
from Charon and PPS has been reduced to zero, and the carrying
amount of intangible assets in the Company’s PSG segment have
been reduced to zero.
During the fourth quarter of fiscal 2016, continued delays in
contract awards and contract funding and the direct impact on the
Company’s results of operations, coupled with the continued
decrease in the Company’s stock price, and were deemed to be
triggering events that led to an updated test for goodwill
impairment. As a result of our analysis, we recorded an additional
impairment charge of $4.4 million. The carrying value of goodwill
after impairment at July 1, 2016 was zero. Based on the results of
the impairment testing, the Company concluded that the value of
definite-lived assets with a carrying value of $0.9 million was not
recoverable. The Company has recorded a charge of $0.3 million for
the impairment of definite-lived intangible assets acquired from
JMWA, a charge of $0.6 million for the impairment of definite-lived
intangible assets acquired from GMI. As a result of these charges,
the carrying amount of intangible assets acquired from JMWA and GMI
has been reduced to zero.
Consolidated Results of Operations
The table below sets forth our consolidated results of continuing
operations for the fiscal years ended July 1, 2016, June 26, 2015,
and June 27, 2014.
|
|
For the Fiscal Year Ended
|
||
|
|
July 1, 2016
|
June 26, 2015
|
June 27, 2014
|
|
|
(dollars in thousands)
|
||
|
GROSS REVENUE
|
$167,917
|
$159,877
|
$110,280
|
|
Purchased services and materials, at cost
|
107,199
|
90,289
|
55,108
|
|
Direct costs of services and overhead
|
57,544
|
55,797
|
46,653
|
|
GROSS PROFIT
|
$3,174
|
$13,791
|
$8,519
|
|
Gross Profit percentage
|
2%
|
9%
|
8%
|
|
|
|
|
|
|
Selling general and administrative expenses
|
13,031
|
11,003
|
10,175
|
|
Other operating expense (income)
|
1,937
|
-
|
(1,596)
|
|
Goodwill Impairment
|
20,332
|
-
|
1,381
|
|
Intangible impairment
|
3,812
|
-
|
-
|
|
OPERATING (LOSS) INCOME
|
(35,937)
|
2,788
|
(1,441)
|
|
OTHER (INCOME) EXPENSE
|
|
|
|
|
Interest income
|
(19)
|
(2)
|
(15)
|
|
Interest expense
|
702
|
447
|
133
|
|
(LOSS) INCOME BEFORE INCOME TAXES, FROM CONTINUING
OPERATIONS
|
$(36,619)
|
$2,343
|
$(1,559)
|
Fiscal Year 2016 Compared to Fiscal Year 2015
Gross revenue for fiscal 2016 was $167.9 million, an increase of 5%
compared to $159.9 million during fiscal 2015. VSS contributed
$17.6 million to the increase and our DAFB project contributed an
additional $6.9 million off-set by decreases in revenue of
approximately (i) $3.0 million related to reduced sales from PPS,
(ii) $1.9 million related to decreased levels of Title II work in
Iraq and Afghanistan within ECM, (iii) $2.3 million related to PBR
projects, (iv) $4.0 million related to the expiration of the Ft.
Irwin contract within ESG, and a (v) $3.8 million from PSG’s
historical business line as a result of the continued shift of
contract solicitations to businesses that qualify for small
business programs.
Purchased services and materials for fiscal 2016 were $107.2
million, an increase of 19% compared to $90.3 million during fiscal
2015. VSS, acquired during fiscal 2016, contributed $10.0 million
to the increase and the DAFB project contributed an additional $6.0
million. We are the prime contractor at DAFB, and as such, a
significant portion of the work is performed by
sub-contractors.
Direct
costs of services and overhead for fiscal 2016 were $57.5 million,
an increase of 3% compared to $55.8 million during the fiscal
2015.
Gross profit from operations for fiscal 2016 was $3.2 million, a
decrease of 77% compared to gross profit of $13.8 million for
fiscal 2015. Gross profit contributions from VSS were $2.1 million,
offset by a project mix shift, such as the decline in our Title II
work in Iraq and Afghanistan, ncreased costs associated with the
DAFB project, and a loss of $2.1 million in our PPS subsidiary,
which we are in the process of divesting. In addition, we incurred
losses of $900,000 to complete a firm-fixed price project at
Homestead AFB we obtained as a result of the GMI acquisition. This
decrease was magnified by the expiration of the Ft. Irwin contract
In addition, the Company recognized $1.3 million of loss
contingency accruals in connection with (i) a class action lawsuit
from a group of former employees at Ft. Irwin, (ii) a probable loss
relate within our ESG segment due to the audit finding by GSA
within the ESG segment, and (iii) the loss accrual for the removal
and installation of the new well pump for the PBR task orders (see
“Factors Affecting Fiscal 2016 Performance--Loss Contingency
Accruals” above for more information). Primarily because we
are the prime contractor on the DAFB project, with a significant
portion of the work performed by sub-contractors, our consolidated
gross margin decreased from 9% to 3%. As the DAFB project becomes a
smaller percentage of our overall revenue mix we expect to see
margins improve. However, our higher margin Title II work in Iraq
and Afghanistan has declined during fiscal 2016, so to sustain
improved margins we will need to continue to secure additional
higher margin work under new contracts. A charge for $1.2 million
for the ARA net working capital adjustments also contributed to the
decline in the gross profit (see Non Recurring Expenses
above).
Selling, general and administrative expenses for fiscal 2016 were
$13.0 million, or 8% of gross revenue, compared to $11.0 million,
or 7% of gross revenue, during fiscal 2015. The increase in fiscal
2016 included approximately $0.6 million in integration costs and
approximately $0.65 million in transaction costs associated with
the acquisition of VSS, approximately $0.6 million to record the
costs of impairing exiting lease spaces, and approximately $0.15
million in restructuring costs and fees associated with our
forbearance agreements with Bank of America, including legal fees
arising from our efforts to obtain alternative
financing.
We recorded a Goodwill and Intangible impairments charge of $ 24.1
million due to a decline in the estimated fair value in the ECM,
ESG, and PSG reporting units, attributable to goodwill acquired in
certain acquisitions. (For additional information on these goodwill
and intangible impairments, see Note 7 to our Consolidated
Financial Statements included herein).
Other operating expense for fiscal 2016 was a $1.9 million charge
for the loss on the sale of PPS subsidiary.
Operating loss, before income taxes, for fiscal 2016 was $36.6
million compared to operating income of $2.3 million during fiscal
2015. The decline in operating income was the result of the items
discussed above.
Fiscal Year 2015 Compared to Fiscal Year 2014
Gross revenue for fiscal 2015 was $159.9 million, an increase of
45% compared to $110.3 million during fiscal 2014. JMWA, acquired
in fiscal 2015, contributed $29.2 million to the increase and the
DAFB project contributed an additional $32.0 million. These
increases were off-set by a $6.2 million decrease in revenue
related to PBR projects within ESG and a $5.5 million decrease in
revenue from PSG’s historical business line as a result of
the continued shift of contract solicitations to businesses that
qualify for small business programs. Additionally, we continue to
see declines in revenue from our international operations in
Afghanistan and Iraq as the Title II work in that region winds
down.
Purchased services and materials for fiscal 2015 was $90.3 million,
an increase of 64% compared to $55.1 million during fiscal 2014. We
are the prime contractor on the DAFB project, and, as such, a
significant portion of the work is performed by
sub-contractors.
Direct costs of services and overhead for fiscal 2015 were $55.8
million, an increase of 20% compared to $46.7 million during fiscal
2014. Additional costs associated with JMWA were partially offset
by the cost savings associated with our internal re-alignment
within ESG.
Gross profit from continuing operations for fiscal 2015 was $13.8
million, an increase of 62% compared to $8.5 million for fiscal
2014. Gross profit contributions from JMWA were $7.1 million.
Although we are the prime contractor on the DAFB project, with a
significant portion of the work performed by sub-contractors, we
were still able to improve our gross margin from 8% to 9%.
Additionally, we saw margin improvement in our ESG group due to the
reduction in contract related overhead expenses as a result of our
internal realignment of the ESG organization.
Selling, general and administrative expenses for fiscal 2015 were
$11.0 million, or 7% of gross revenue, compared to $10.2 million,
or 9% of gross revenue, during fiscal 2014. Fiscal 2015 included
approximately $1.0 million related to integration costs associated
with the acquisition of JMWA. Management was able to realize cost
savings as the result of internal re-organizations within our
business segments.
Operating income from continuing operations for fiscal 2015 was
$2.8 million compared to operating loss of $1.4 million during
fiscal 2014. The improvement in operating income was the result of
the items discussed above.
Results of Operations by Business Segment
The tables below set forth the operating results for our three
business segments for the fiscal years ended July 1, 2016, June 26,
2015, and June 27, 2014.
ECM
|
|
For the Fiscal Year Ended
|
||
|
|
July 1, 2016
|
June 26, 2015
|
June 27, 2014
|
|
GROSS REVENUE
|
$110,533
|
$91,111
|
$52,012
|
|
Purchased services and materials, at cost
|
86,927
|
68,159
|
32,991
|
|
Direct costs of services and overhead
|
20,498
|
14,922
|
13,733
|
|
GROSS PROFIT, from continuing operations
|
3,108
|
8,030
|
5,288
|
|
Income (Loss) from discontinued operations
|
-
|
-
|
317
|
|
GROSS PROFIT
|
$3,108
|
$8,030
|
$5,605
|
|
Gross profit (loss) percentage
|
3%
|
9%
|
10%
|
Fiscal 2016 Compared to Fiscal 2015
Gross revenue for fiscal 2016 was $110.5 million, an increase of
21% compared to $91.1 million during fiscal 2015. VSS,
acquired during fiscal 2016, contributed $17.6 million to the
increase, and revenue from the DAFB project contributed
approximately $6.9 million to the increase, offset by a decrease in
revenue from PPS of approximately $3.0 million. Our Title II work
in Iraq and Afghanistan continued to wind down during fiscal 2016,
so to sustain improved margins we will need to continue to secure
additional higher margin work under new contracts.
Gross profit from continuing operations for fiscal 2016 was $3.1
million, a decrease of 61% compared to $8.0 million during the
fiscal 2015. Gross profit margin decreased from 9% to 3% for fiscal
2016. VSS contributed $2.1 million to gross profit offset by the
decline of our higher margin Title II, a $0.9 million loss on our
Homestead AFB project, and a $2.1 million loss associated with PPS.
A charge for $0.7 million for the ARA net working capital
adjustments also contributed to the decline in the gross profit
(see Non Recurring Expenses above).
Fiscal 2015 Compared to Fiscal 2014
Gross revenue for fiscal 2015 was $91.1 million, an increase of 75%
compared to $52.0 million during fiscal 2014. JMWA contributed $7.0
million, revenue from the DAFB project contributed approximately
$28.0 million, and revenue from PPS contributed approximately $2.0
million to this increase.
Gross profit from continuing operations for fiscal 2015 was $8.0
million, an increase of 52% compared to $5.3 million during fiscal
2014. JMWA contributed $2.3 million to this increase and the
remaining increase is directly attributable to DAFB project.
Although we are the prime contractor on the DAFB project, with a
significant portion of the work performed by sub-contractors, we
were able to achieve a gross margin of 9% as the result of
efficient project management compared to 10% for fiscal 2014.
Lastly, during the first quarter of fiscal 2015, we recognized a
loss of approximately $0.7 million related to a project managed out
of our Knoxville office that was inherited through the acquisition
of GMI in fiscal 2014.
ESG
|
|
For the Fiscal Year Ended
|
||
|
|
July 1, 2016
|
June 26, 2015
|
June 27, 2014
|
|
GROSS REVENUE
|
$38,688
|
$46,620
|
$46,848
|
|
Purchased services and materials, at cost
|
17,628
|
19,666
|
21,438
|
|
Direct costs of services and overhead
|
20,170
|
23,287
|
23,294
|
|
GROSS (LOSS) PROFIT
|
$890
|
$3,667
|
$2,116
|
|
Gross (loss) profit percentage
|
2%
|
8%
|
5%
|
Fiscal 2016 Compared to Fiscal 2015
Gross
revenue for fiscal 2016 was $38.7 million, a decrease of 17%
compared to $46.6 million during fiscal 2015. The decrease in
revenue was due to the expiration of the significant contract with
Ft. Irwin and anticipated revenue decreases associated with the
maturing of the PBR program.
Gross profit for fiscal 2016 was $0.9 million, a decrease of 76%
compared to $3.7 million during fiscal 2015. This decrease is due
to a total of $1.3 million of project loss contingency accruals in
connection with (i) Ft. Irwin class action lawsuit brought by a
number of former employees, (ii) a probable loss from the audit
finding by GSA, and (iii) the loss accrual for the removal and
installation of the new well pump for the PBR task orders, as
described above. Additionally, several projects experienced
decreased gross profit related to no cost work extensions due to
demobilization expenses and higher overtime requirements to finish
projects within the required period of performance. These decreases
were offset by costs savings in the reduction of the amount of work
performed by subcontractors, and by a reduction in contract related
overhead expenses following the internal realignment of ESG’s
organization in early fiscal 2016. A charge for $0.5 million for
the ARA net working capital adjustments also contributed to the
decline in the gross profit (see Non Recurring Expenses
above).
Fiscal 2015 Compared to Fiscal 2014
Gross revenue for fiscal 2015 was $46.6 million, a slight decrease
compared to $46.8 million during fiscal 2014. JMWA contributed $6.0
million in revenue, however this increase was off-set by decreases
in revenue due to the timing of our PBR projects.
Gross profit for fiscal 2015 was $3.7 million, an increase of 76%
compared to $2.1 million during fiscal 2014. Although revenue was
slightly down from the prior fiscal year, we were able to realize a
3% increase in gross margins to 8%, compared to 5% in the prior
fiscal year. We were able to achieve higher margins as the result
of a decrease in the amount of work that was performed by
subcontractors, 42% compared to 46% in the prior fiscal year, and
by a reduction in contract related overhead expenses.
PSG
|
|
For the Fiscal Year Ended
|
||
|
|
July 1, 2016
|
June 26, 2015
|
June 27, 2014
|
|
GROSS REVENUE
|
$18,696
|
$22,146
|
$11,420
|
|
Purchased services and materials, at cost
|
2,644
|
2,464
|
679
|
|
Direct costs of services and overhead
|
16,876
|
17,588
|
9,626
|
|
GROSS (LOSS) PROFIT
|
$(824)
|
$2,094
|
$1,115
|
|
Gross (loss) profit percentage
|
-4%
|
9%
|
10%
|
Fiscal 2016 Compared to Fiscal 2015
Gross revenue for fiscal 2016 was $18.7 million, a decrease of 16 %
compared to $22.1 million during fiscal 2015. We continue to see a
decline in our contract positions largely due to the continued
shift to more contract solicitations being targeted to small
business and similar such programs. We continue to seek new ways to
develop our relationships with firms qualified for these programs
to increase our ability to capture more of this work and maintain
current projects. We continue to experience profit pressures in
this segment.
Gross
loss for fiscal 2016 was $0.8 million, a decrease of 139% compared
to gross profit of $2.1 million during fiscal 2015. This decrease
is a direct result of the decline in revenue due to the loss of
task orders and the allocation of significant indirect costs due to
their high level of direct labor.
Fiscal 2015 Compared to Fiscal 2014
Gross revenue for fiscal 2015 was $22.1 million, an increase of 94%
compared to $11.4 million during fiscal 2014. This increase was
directly attributable to the $16.2 million contributed by JMWA,
off-set by a $5.5 million decrease in revenue from historical
business lines. We continued to experience a decline in our
contract positions largely due to the continued shift to more
contract solicitations being targeted to small business and similar
such programs.
Gross profit for fiscal 2015 was $2.1 million, an increase of 88%
compared to $1.1 million during fiscal 2014. This increase was the
direct result of the contribution of JMWA.
Gross Revenue by Client Base
Our business segments provide services to various industries,
serving government and commercial clients. A summary of gross
revenue from continuing operations generated from our client base
is as follows:
|
|
Years Ended
|
|||||
|
|
July 1, 2016
|
June 26, 2015
|
June 27, 2014
|
|||
|
|
|
(in thousands)
|
|
|||
|
Government
|
|
|
|
|
|
|
|
DoD
|
116,062
|
69%
|
129,305
|
81%
|
86,039
|
78%
|
|
State and Local
|
6,899
|
4%
|
7,249
|
5%
|
8,573
|
8%
|
|
EPA
|
4,583
|
3%
|
6,457
|
4%
|
1,593
|
1%
|
|
Other
|
38,416
|
23%
|
11,552
|
7%
|
6,314
|
6%
|
|
Commercial
|
1,957
|
1%
|
5,314
|
3%
|
7,761
|
7%
|
|
Gross Revenue
|
167,917
|
100%
|
159,877
|
100%
|
110,280
|
100%
|
Liquidity and Capital Resources
Our working capital as of July 1, 2016 was approximately a negative
$2.2 million, compared to positive working capital at June 26, 2015
of $23.1 million. A significant factor contributing to this change
in working capital is the $14.9 million increase in the outstanding
line of credit balance with Bank of America, the $9.5 million
decrease in the ending accounts receivable balance, the $1.9
million for the loss on the sale of PPS, and $1.4 million decrease
in deferred income taxes as compared to fiscal 2015. Our current
ratio at July 1, 2016 was 0.96 compared to 1.54 from the prior
fiscal year.
On July 1, 2014, we acquired JMWA. The acquisition price of $13
million was paid in cash and with seller notes in the principal
amount of $6 million. On July 1, 2016, the outstanding aggregate
principal balance of the notes was $3.9 million. On September 30,
2015, the Company successfully completed the acquisition of JCSS,
now known as VSS. The Company paid a cash purchase price of $10.5
million and agreed to pay contingent consideration of up to a
maximum of $9.5 million based on the occurrence of certain events
within the earn-out period of 3 years from September 30, 2015. As
of July 1, 2016, management believes the amount of the contingent
consideration that will be earned within the earn-out period is
$3.2 million, including probability weighing of future cash flows.
All payment related to the VSS contingent consideration over the
next 2.5 years will also be funded through existing working capital
(See Note 3 – Acquisitions).
On September 30, 2015, the Company, together with certain of
its domestic subsidiaries acting as guarantors, entered into a loan
with Bank of America, N.A. as the lender and letter of credit
issuer for a revolving credit facility in the amount of $25.0
million and a term facility in the amount of $5.0 million. The
proceeds of the term facility and borrowings under the revolving
credit facility were used to repay amounts outstanding under the
Company’s Third Amended and Restated Loan and Security
Agreement with United Bank and to pay a portion of the purchase
price for the acquisition of VSS.
The maturity date of the revolving credit facility is
September 30, 2018 and the maturity date of the term facility
is March 31, 2017. The principal amount of the term facility
amortizes in quarterly installments equal to $0.8 million with no
penalty for prepayment. Interest initially accrued on the revolving
credit facility and the term facility at a rate per year equal to
the LIBOR Daily Floating Rate (as defined in the Loan Agreement)
plus 1.95% and was payable in arrears on December 31, 2015 and
on the last day of each quarter thereafter. Obligations under the
loan agreement are guaranteed unconditionally and on a joint and
several basis by the guarantors and secured by substantially all of
the assets of Versar and the guarantors. The loan agreement
contains customary affirmative and negative covenants and during
fiscal year 2016 contained financial covenants related to the
maintenance of a Consolidated Total Leverage Ratio (which requires
that the Company maintain a Consolidated Total Leverage Ratio, as
defined, of not greater than 3.25:1.0), Consolidated Senior
Leverage Ratio (which requires the Company to maintain a
Consolidated Senior Leverage Ratio, as defined, of not greater than
2.75:1.0), Consolidated Fixed Charge Coverage Ratio(which requires
the Company maintain an Fixed Charge Coverage Ration greater than
1.25:1.0 and Consolidated Asset Coverage Ratio (which requires the
Company maintain an Asset Coverage Ratio, as defined, of greater
than 1.25:1.0).
During the third and fourth quarters of fiscal 2016, following
discussion with the Lender, the Company determined that it was not
in compliance with the Consolidated Total Leverage Ratio,
Consolidated Senior Leverage Ratio, and Asset Coverage Ratio
covenants for the fiscal quarters ended January 1, 2016, April 1,
2016, and July 1, 2016. Each failure to comply with these covenants
constitutes a default under the loan agreement. On May 12, 2016,
the Company, with certain of its subsidiaries and the Lender
entered into a forbearance agreement pursuant to which the Lender
agreed to forbear from exercising any and all rights or remedies
available to it under the loan agreement and applicable law related
to these defaults for a period ending on the earliest to occur of:
(a) a breach by the Company of any obligation or covenant under the
forbearance agreement, (b) any other default or event of default
under the loan agreement or (c) June 1, 2016 (the Forbearance
Period). Subsequently, the Company and the Lender entered into
additional forbearance agreements to extend the Forbearance Period
through December 9, 2016, and to allow the Company to borrow
funds pursuant to the terms of the loan agreement, consistent with
current Company needs as set forth in a 13-week cash flow forecast
and subject to certain caps on revolving borrowings initially of
$15.5 million and reducing to $13.5 million. In addition, from and
after June 30, 2016, outstanding amounts under the credit facility
bore interest at the default interest rate equal to the LIBOR Daily
Floating Rate (as defined in the Loan Agreement) plus 3.95%. The
Company is required to provide a 13-week cash flow forecast updated
on a weekly basis to the Lender, and the Lender waived any
provisions prohibiting the financing of insurance premiums for
policies covering the period of July 1, 2016 to June 30, 2017 in
the ordinary course of the Company’s business and in amounts
consistent with past practices. The Lender has engaged an advisor
to review the Company’s financial condition on the
Lender’s behalf, and also required the Company to pursue
alternative sources of funding for its ongoing business
operations.
As of
July 1, 2016, the available balance on the Company’s
revolving credit facility was approximately $9.7 million. As of
December 30, 2016 the available balance on the Company’s
revolving credit facility was approximately $2.7
million.
On December 9, 2016 (the Closing Date), Versar, Inc. (Versar),
together with certain of its domestic subsidiaries acting as
guarantors (collectively, the Guarantors), entered into a First
Amendment and Waiver (the Amendment) to the loan agreement (the
Loan Agreement) dated September 30, 2015 with Bank of America, N.A.
(the Lender).
Under the Amendment, the Lender waived all existing events of
default, and reduced the revolving facility to $13,000,000 from
$25,000,000. The interest rate on borrowings under the revolving
facility and the term facility will accrue at the LIBOR Daily
Floating Rate plus 5.00% from LIBOR plus 1.87%. The Amendment added
a covenant requiring Versar to maintain certain minimum quarterly
consolidated EBITDA amounts. The Amendment also eliminated the Loan
Agreement covenants requiring maintenance of a required
consolidated total leverage ratio, consolidated fixed charge
coverage ratio, consolidated senior leverage ratio and asset
coverage ratio.
In addition to the foregoing, and subject to certain conditions
regarding the use of cash collateral and other cash received to
satisfy outstanding obligations under the Loan Agreement, the
Amendment suspended all amortization payments under the term
facility such that the entire amount of the term facility shall be
due and payable on September 30, 2017. The original maturity date
under the Loan Agreement was September 30, 2018. As consideration
for the Amendment and the waiver of the existing events of default,
Versar agrees to pay an amendment fee of .5% of the aggregate
principal amount of the term facility outstanding as of November
30, 2016 plus the commitments under the revolving facility in
effect as of the same date, which fee is due and payable on the
earlier of a subsequent event of default or August 30, 2017. The
Company paid $0.3 million in amendment fees in December
2016.
Finally, the Amendment continued the requirement for Versar to
retain a CRO and recognized Versar’s ongoing efforts to work
with the Lender and continues the requirements to engage with a
strategic financial advisor to assist with the structuring and
consummation of a transaction, the purpose of which will be the
replacement or repayment in full of all obligations under the Loan
Agreement.
Our capital requirements for fiscal 2016
were approximately $0.7 million, used primarily for annual hardware
and software purchases to maintain our existing information
technology systems. We anticipate that our discretionary capital
requirements for fiscal 2017 will be approximately $0.5 million.
Also, the Company has made certain cost cutting measures
during fiscal 2016 so that we can continue to operate within
existing cash resources. We
believe that our cash balance of $1.1 million at the end of fiscal
2016, along with anticipated cash flows from ongoing operations and
the funds available from our line of credit facility, will
be sufficient to meet our working capital and liquidity needs
during fiscal 2017. Going
forward, the Company will continue to aggressively manage our cash
flows and costs as needed based on the performance of the Company.
Additionally, the surety broker has informed the Company
that bonding for new work may be limited due to our accumulated
deficit. The surety broker has requested that for all new bonds
issued: i) a portion of the required bonds for future work be
placed in a collateral account, and ii) establish a funds control
account for each new project. A funds control account
essentially eliminates the payment risk for the surety. The surety
establishes a separate bank account in the contractor’s name,
oversees all of the payment disbursements from the Company, and
delivers checks from each payment for the Company to distribute to
their vendors working on the project. The surety essentially
becomes the contractor’s accounts payable back office.
We continue to work with our surety broker and bonding companies to
find ways to issue bonds. As we commit to obtaining new
financing our bonding capacity’s availability is also
expected to increase.
Contractual Obligations
At July 1, 2016, we had total contractual obligations of
approximately $21.6 million, including short-term obligations of
approximately $6.9 million. The short-term obligations will become
due over the next twelve months (fiscal 2017). Our contractual
obligations are primarily related to lease commitments.
Additionally, we have principal and interest obligations related to
the notes payable from our acquisition of JMWA. The table below
specifies the total contractual payment obligations as of July 1,
2016.
|
Contractual Obligations
|
Total
|
Within 1 Year
|
2-3 Years
|
4-5 Years
|
After 5 Years
|
|
Lease obligations
|
$13,986
|
$2,948
|
$5,668
|
$3,816
|
$1,554
|
|
Notes Payable to sellers
|
3,825
|
1,331
|
2,494
|
-
|
-
|
|
Notes Payable to Bank of America
|
2,500
|
2,500
|
-
|
-
|
-
|
|
Deferred Compensation obligations
|
1,019
|
107
|
214
|
201
|
497
|
|
Estimated interest obligations
|
293
|
167
|
126
|
-
|
-
|
|
Total contractual obligations
|
$21,623
|
$7,053
|
$8,502
|
$4,017
|
$2,051
|
On October 3, 2016 the Company did not make the quarterly principal
payments to three individuals who were the former owners of JMWA.
However, the Company continued to make monthly interest payments
through the end of calendar year 2016 at an increased interest rate
(seven percent per annum, rather than five percent per annum). On
November 21, 2016, two of the former JMWA shareholders filed an
action against the Company in Fairfax County District Court, VA for
failure to make such payments and to enforce their rights to such
payments. Consequently, in the second quarter of fiscal 2017, the
Company has moved the long-term portion of the debt to short term
notes payable for a total of $3.8 million. Starting in January 2017
the Company stopped making the interest-only payments to two of the
former owners and continues to make the monthly interest only
payment at seven percent per annum to one owner. The discovery
process is currently underway. A trial date is set for July
2017.
On January 1, 2017 the Company did not make $0.1 million in
periodic payment to three individuals who participate in a Deferred
Compensation Agreement plan established by the Company in 1988. The
Company continues to negotiate with the individuals to reschedule
the payments for a future period.
Critical Accounting Policies and Related Estimates That Could Have
a Material Effect on Our Consolidated Financial
Statements
Critical Accounting Policies and Estimates
Below is a discussion of the accounting policies and related
estimates that we believe are the most critical to understanding
our consolidated financial position and results of operations which
require management judgments and estimates, or involve
uncertainties. Information regarding our other accounting policies
is included in the notes to our consolidated financial statements
included elsewhere in this annual report on Form 10-K.
Revenue
recognition: On cost-plus
fee contracts, revenue is recognized to the extent of costs
incurred plus a proportionate amount of fee earned, and on
time-and-material contracts, revenue is recognized to the extent of
billable rates times hours delivered plus material and other
reimbursable costs incurred. We record income from fixed-price
contracts, extending over more than one accounting period, using
the percentage-of-completion method. During the performance of such
contracts, estimated final contract prices and costs are
periodically reviewed and revisions are made as required. Fixed
price contracts can be significantly impacted by changes in
contract performance, contract delays, liquidated damages and
penalty provisions, and contract change orders, which may affect
the revenue recognition on a project. Revisions to such estimates
are made when they become known. Detailed quarterly project reviews
are conducted with project managers to review all project progress
accruals and revenue recognition. There is the possibility that
there will be future and currently unforeseeable adjustments to our
estimated contract revenues, costs and margins for fixed price
contracts, particularly in the later stages of these contracts.
Such adjustments are common in the construction industry given the
nature of the contracts. These adjustments could either positively
or negatively impact our estimates due to the circumstances
surrounding the negotiations of change orders, the impact of
schedule slippage, subcontractor claims and contract disputes which
are normally resolved at the end of the
contract.
Allowance for doubtful
accounts: Disputes arise
in the normal course of our business on projects where we are
contesting with customers for collection of funds because of events
such as delays, changes in contract specifications and questions of
cost allowability and collectability. Such disputes, whether claims
or unapproved change orders in process of negotiation, are recorded
at the lesser of their estimated net realizable value or actual
costs incurred and only when realization is probable and can be
reliably estimated. Management reviews outstanding receivables on a
quarterly basis and assesses the need for reserves, taking into
consideration past collection history and other events that bear on
the collectability of such receivables. All receivables over 60
days old are reviewed as part of this process.
Share-based
compensation: Share-based
compensation is measured at the grant date, based on the fair value
of the award. All of the Company's equity awards granted to
employees in fiscal 2016, 2015, and 2014 were restricted stock unit
awards. Share-based compensation cost for restricted stock unit
awards is based on the fair market value of the Company’s
stock on the date of grant. Stock-based compensation cost for stock
options is calculated on the date of grant using the fair value of
stock options, as calculated using the Black-Scholes pricing
model.
Net deferred tax
asset: The Company
established a full valuation allowance against its U.S net deferred
tax assets during the year and maintained the full valuation
allowance from our Philippine branch. Therefore, the net balance of
deferred taxes as of July 1, 2016 is zero.
Long-lived
assets: We review
long-lived assets for impairment whenever events or changes in
circumstances indicate that the carrying value of an asset might
not be recoverable. An impairment loss is recognized if the
carrying value exceeds the fair value. We review the cash flows of
the operating units to ensure the carrying values do not exceed the
cash flows that they support. Any write-downs are treated as
permanent reductions. We believe the carrying value of our
long-lived assets as of July 1, 2016 are fully
recoverable.
Goodwill:
During fiscal 2015, the Company
changed the annual goodwill impairment assessment date from the
last day of the fiscal year to the first day of the fourth quarter
of the fiscal year. Management determined that performing the
assessment prior to the close of the fiscal year provided the
external valuation firm, the independent external auditors, and the
Company with sufficient time to generate, review, and conclude on
the valuation analysis results. At the close of fiscal year 2015,
management assessed whether there were any conditions present
during the fourth quarter that would indicate impairment subsequent
to the initial assessment date and concluded that no such
conditions were present.
During the third quarter of fiscal 2016, sustained delays in
contract awards and contract funding and the direct impact on the
Company’s results of operations, coupled with the continued
decrease in the Company’s stock price, were deemed to be
triggering events that led to an updated test for goodwill
impairment. As a result of our analysis, we recorded an impairment
charge of $15.9 million. The carrying value of goodwill after
impairment at April 1, 2016 was $4.4 million.
During the fourth quarter of fiscal 2016, sustained delays in
contract awards and contract funding and the direct impact on the
Company’s results of operations, coupled with the continued
decrease in the Company’s stock price, and were deemed to be
triggering events that led to an interim period test for goodwill
impairment. As a result of our analysis, we recorded an impairment
charge of $4.4 million. The carrying value of goodwill after
impairment atJuly 1, 2016 was zero. . Based on the results of the
impairment testing, the Company concluded that the value of
definite-lived intangible assets with a carrying value of $2.9
million was not recoverable. The Company has recorded a charge of
$1.8 million for the impairment of definite-lived intangible assets
acquired from JMWA, a charge of $1.1 million for the impairment of
definite-lived intangible assets acquired from GMI, and a charge of
$0.7 million for the impairment of definite-lived intangible assets
of PPS, acquired in fiscal 2010, and Charron Consulting, acquired
in fiscal 2012. As a result of these charges, the carrying amount
of intangible assets acquired from Charron and PPS has been reduced
to zero, and the carrying amount of intangible assets in the
Company’s PSG and ESG segments have been reduced to zero. The
carrying value of goodwill at July 1, 2016 and June 26, 2015 was
zero million and $16.1 million, respectively. The goodwill balances
were principally generated from our acquisition of JMWA during
fiscal 2015, GMI during fiscal 2014, Charron during fiscal 2012,
and the acquisitions of PPS and Advent Environmental, Inc. (Advent)
during fiscal 2010. To conduct the annual goodwill impairment
analysis, management, with the assistance of an external valuation
firm, estimated the fair value of each reporting unit using a
market-based valuation approach based on guideline public company
data.
The first step of the goodwill impairment analysis identifies
potential impairment and the second step measures the amount of
impairment loss to be recognized, if any. Step 2 is only performed
if Step 1 indicates potential impairment. Potential impairment is
identified by comparing the fair value of the reporting unit with
its carrying amount, including goodwill. The carrying amount of a
reporting unit equals assets (including goodwill) less liabilities
assigned to that reporting unit. The fair value of a reporting unit
is the price that would be received if the reporting unit was sold.
Value is based on the assumptions of market participants. Market
participants may be strategic acquirers, financial buyers, or both.
The assumptions of market participants do not include assumed
synergies which are unique to the parent company. Our external
valuation firm has estimated the fair value of each reporting unit
using both a discounted cash flow analysis and the Guideline Public
Company (GPC) method under the market approach. Each of the
GPC’s is assumed to be a market participant. The valuation
analysis methodology adjusted the value of the reporting units by
including a premium for control, or market participant acquisition
premium (MPAP). The MPAP reflects the capitalized benefit of
reducing a company’s operating costs. These costs are
associated with a company’s public reporting requirements.
The adjustment assumes an acquirer could take the company private
and eliminate these costs.
For the year ended July 1, 2016, we concluded that there was an
indication of impairment to the Company’s recorded remaining
goodwill balance which are now zero.
Intangible
assets: The net carrying
value of our intangible assets at July 1, 2016 and June 26, 2015
was $7.2 million and $4.6 million, respectively. The intangible
assets include customer related assets, marketing related assets,
and technology-based assets. These intangible assets are amortized
over a 5 - 15 year useful life. We review our intangible assets for
impairment whenever events or changes in circumstances indicate
that the carrying value of the asset might not be recoverable. An
impairment loss is recognized if the carrying value exceeds the
fair value. Any impairments of the asset are treated as permanent
reductions. In connection with our annual goodwill impairment
testing for fiscal 2016, we recorded an intangible impairment
charge of $3.7 million due to market conditions and business trends
within the ECM, ESG, and PSG reporting units.
Impact of Inflation
We protect ourselves from the effects of inflation. The majority of
contracts we perform are for a period of a year or less and are
firm fixed price contracts. Multi-year contracts provide for
projected increases in labor and other costs.
Business Segments
We have the following three business segments: ECM, ESG, and PSG.
Additional details regarding these segments are contained in Note 2
- Business Segments, of the Notes to the Consolidated Financial
Statements included elsewhere in this annual report on Form
10-K.
Item 7A. Quantitative and Qualitative Disclosures about Market
Risk
We have not entered into any transactions using derivative
financial instruments or derivative commodity instruments and
believe that our exposure to interest rate risk and other relevant
market risk is not material.
Item 8. Financial Statements and Supplementary Data Report of
Independent Registered Public Accounting Firm
Report of Independent Registered Public Accounting
Firm
Board of Directors and Stockholders Versar, Inc.
We have audited the accompanying consolidated balance sheet of
Versar, Inc. (a Delaware corporation) and subsidiaries (the
“Company”) as of July 1, 2016 the related consolidated
statements of operations, comprehensive (loss) income, changes in
stockholders’ equity, and cash flows for the year ended. Our
audit also included the financial statement schedule listed in the
Index at Item 15. These financial statements and financial
statement schedule are the responsibility of the Company’s
management. Our responsibility is to express an opinion on these
financial statements based on our audit. The financial statements
and financial statement schedule of Versar, Inc. and subsidiaries
as of June 26, 2015 and June 27, 2014 and for each of the two years
then ended were audited by other auditors whose report dated
September 15, 2015, expressed an unqualified opinion on those
statements.
We conducted our audit in accordance with the standards of the
Public Company Accounting Oversight Board (United States). Those
standards require that we plan and perform the audit to obtain
reasonable assurance about whether the financial statements are
free of material misstatement. We were not engaged to perform an
audit of the Company’s internal control over financial
reporting. Our audit included consideration of internal control
over financial reporting as a basis for designing audit procedures
that are appropriate in the circumstances, but not for the purpose
of expressing an opinion on the effectiveness of the
Company’s internal control over financial reporting.
Accordingly, we express no such opinion. An audit also includes
examining, on a test basis, evidence supporting the amounts and
disclosures in the financial statements, assessing the accounting
principles used and significant estimates made by management, as
well as evaluating the overall financial statement presentation. We
believe that our audit provides a reasonable basis for our
opinion.
In our opinion, the fiscal year 2016 consolidated financial
statements referred to above present fairly, in all material
respects, the financial position of Versar, Inc. and subsidiaries
as of July 1, 2016, and the results of its operations and its cash
flows for the year ended July 1, 2016, in conformity with
accounting principles generally accepted in the United States of
America. Also in our opinion, the related financial statement
schedule, when considered in relation to the basic consolidated
financial statements taken as a whole, presents fairly, in all
material respects, the information set forth therein.
The accompanying consolidated financial statements have been
prepared assuming that the Company will continue as a going
concern. As described in Note 2 to the consolidated financial
statements, the Company generated a net loss of $37.9 million for
the fiscal year ended July 1, 2016, expects losses to continue in
the future and had an accumulated deficit of $27.4 million at that
date. These conditions raise substantial doubt about its ability to
continue as a going concern. Management’s plans in regard to
these matters are also described in Note 2. The consolidated
financial statements do not include any adjustments that might
result from the outcome of this uncertainty.
/s/ Urish Popeck & Co., LLC
Pittsburgh, PA
March 27, 2017
|
VERSAR, INC. AND SUBSIDIARIES
|
||
|
Consolidated Balance Sheets
|
||
|
(In thousands, except share amounts)
|
||
|
|
As of
|
|
|
|
July 1,2016
|
June 26,2015
|
|
ASSETS
|
|
|
|
Current assets
|
|
|
|
Cash and cash equivalents
|
$1,549
|
$2,109
|
|
Accounts receivable, net
|
47,675
|
57,171
|
|
Inventory, net
|
221
|
1,188
|
|
Prepaid expenses and other current assets
|
1,007
|
1,540
|
|
Deferred income taxes
|
-
|
1,366
|
|
Income tax receivable
|
1,513
|
2,373
|
|
Total current assets
|
51,965
|
65,747
|
|
Property and equipment, net
|
1,328
|
2,084
|
|
Deferred income taxes, non-current
|
-
|
414
|
|
Goodwill
|
-
|
16,066
|
|
Intangible assets, net
|
7,248
|
4,643
|
|
Other assets
|
775
|
252
|
|
Total assets
|
$61,316
|
$89,206
|
|
|
|
|
|
LIABILITIES AND STOCKHOLDERS' EQUITY
|
|
|
|
Current liabilities
|
|
|
|
Accounts payable
|
$18,156
|
$35,852
|
|
Billings in excess of revenue
|
7,156
|
-
|
|
Accrued salaries and vacation
|
2,478
|
3,332
|
|
Bank line of credit
|
14,854
|
-
|
|
Notes payable, current
|
3,831
|
2,313
|
|
Other current liabilities
|
7,724
|
1,114
|
|
Total current liabilities
|
54,199
|
42,611
|
|
|
|
|
|
Notes payable, non-current
|
2,494
|
5,835
|
|
Other long-term liabilities
|
3,555
|
1,390
|
|
Total liabilities
|
60,248
|
49,836
|
|
|
|
|
|
COMMITMENTS AND CONTINGENCIES
|
|
|
|
Stockholders' equity
|
|
|
|
Common
stock $.01 par value; 30,000,000 shares authorized;10,217,227
shares issued and 9,982,778 shares outstanding as of July 1 2016;
10,128,923 shares issued and
9,805,082 shares outstanding as of June 26, 2015 (10,217,277 shares
issued and 9,950,958 shares outstanding as of March 1,
2017)
|
102
|
101
|
|
Capital in excess of par value
|
31,128
|
30,798
|
|
(Accumulated deficit) Retained earnings
|
(27,448)
|
10,439
|
|
Treasury stock, at cost
|
(1,480)
|
(1,460)
|
|
Accumulated other comprehensive loss; foreign currency
translation
|
(1,234)
|
(508)
|
|
Total stockholders' equity
|
1,068
|
39,370
|
|
Total liabilities and stockholders' equity
|
$61,316
|
$89,206
|
The accompanying notes are an integral part of these consolidated
financial statements.
|
VERSAR, INC. AND SUBSIDIARIES
|
|||
|
Consolidated Statements of Operations
|
|||
|
(In thousands, except per share amounts)
|
|||
|
|
For the Fiscal Year Ended
|
||
|
|
July 1, 2016
|
June 26, 2015
|
June 27, 2014
|
|
|
|
|
|
|
GROSS REVENUE
|
$167,917
|
$159,877
|
$110,280
|
|
Purchased services and materials, at
cost
|
107,199
|
90,289
|
55,108
|
|
Direct costs of services and
overhead
|
57,544
|
55,797
|
46,653
|
|
GROSS (LOSS) PROFIT
|
3,174
|
13,791
|
8,519
|
|
|
|
|
|
|
Selling, general and administrative
expenses
|
13,031
|
11,003
|
10,175
|
|
Other operating expense ( income)
|
1,937
|
-
|
(1,596)
|
|
Goodwill impairment
|
20,331
|
-
|
1,381
|
|
Intangible impairment
|
3,812
|
-
|
-
|
|
OPERATING (LOSS) INCOME
|
(35,937)
|
2,788
|
(1,441)
|
|
|
|
|
|
|
OTHER (INCOME) EXPENSE
|
|
|
|
|
Interest income
|
(19)
|
(2)
|
(15)
|
|
Interest expense
|
702
|
447
|
133
|
|
(LOSS) INCOME BEFORE INCOME TAXES, FROM CONTINUING
OPERATIONS
|
(36,620)
|
2,343
|
(1,559)
|
|
|
|
|
|
|
Income tax expense (benefit)
|
1,267
|
936
|
(1,043)
|
|
|
|
|
|
|
NET (LOSS) INCOME FROM CONTINUING OPERATIONS
|
(37,887)
|
1,407
|
(516)
|
|
Income (Loss) from discontinued operations, net of tax
|
-
|
-
|
182
|
|
NET (LOSS) INCOME
|
$(37,887)
|
$1,407
|
$(334)
|
|
|
|
|
|
|
NET (LOSS) INCOME PER SHARE-BASIC and DILUTED
|
|
|
|
|
Continuing operations
|
$(3.84)
|
0.14
|
$(0.05)
|
|
Discontinued operations
|
-
|
-
|
0.02
|
|
NET (LOSS) INCOME PER SHARE-BASIC and DILUTED
|
$(3.84)
|
$0.14
|
$(0.03)
|
|
|
|
|
|
|
WEIGHTED AVERAGE NUMBER OF SHARES OUTSTANDING-BASIC
|
9,857
|
9,771
|
9,663
|
|
WEIGHTED AVERAGE NUMBER OF SHARES OUTSTANDING-DILUTED
|
9,857
|
9,771
|
9,663
|
The accompanying notes are an integral part of these consolidated
financial statements.
VERSAR, INC. AND SUBSIDIARIES
Consolidated Statements of Comprehensive (Loss) Income
Fiscal Years Ended July 1, 2016, June 26, 2015, and June 27,
2014
|
|
For the Fiscal Year Ended
|
||
|
|
July 1, 2016
|
June 26, 2015
|
June 27, 2014
|
|
COMPREHENSIVE (LOSS) INCOME
|
|
|
|
|
Net (loss) income
|
$(37,887)
|
$1,407
|
$(334)
|
|
Foreign currency translation adjustments
|
(726)
|
(164)
|
31
|
|
TOTAL COMPREHENSIVE (LOSS) INCOME
|
$(38,613)
|
$1,243
|
$(303)
|
The accompanying notes are an integral part of these consolidated
financial statements.
VERSAR, INC. AND SUBSIDIARIES
Consolidated Statements of Changes in Stockholders’
Equity
Fiscal Years Ended July 1, 2016, June 26, 2015, and June 27, 2014
(in thousands)
|
|
|
|
|
Retained
|
|
|
Other
|
|
|
|
|
|
Capital
|
Earnings
/
|
|
|
Comprehensive
|
Stockholders'
|
|
|
Common
Stock
|
in Excess
of
|
(Accumulated)
|
Treasury
|
Loss
|
Equity
|
||
|
|
Shares
|
Amount
|
Par
Value
|
Deficit)
|
Shares
|
Amount
|
|
|
|
|
|
|
|
|
|
|
|
|
|
Balance at June 27, 2014
|
10,013
|
$100
|
$30,393
|
$9,032
|
(305)
|
$(1,396)
|
$(344)
|
$37,785
|
|
Restricted stock
units
|
116
|
1
|
405
|
-
|
-
|
-
|
-
|
406
|
|
Treasury
stock
|
-
|
-
|
-
|
-
|
(19)
|
(64)
|
-
|
(64)
|
|
Net
income
|
-
|
-
|
-
|
1,407
|
-
|
-
|
-
|
1,407
|
|
Foreign Currency
Translation Adjustment
|
-
|
-
|
-
|
-
|
-
|
-
|
(164)
|
(164)
|
|
Balance at June 26, 2015
|
10,129
|
101
|
30,798
|
10,439
|
(324)
|
(1,460)
|
(508)
|
39,370
|
|
Restricted stock
units
|
88
|
1
|
330
|
-
|
-
|
-
|
-
|
331
|
|
Treasury
stock
|
-
|
-
|
-
|
-
|
(7)
|
(20)
|
-
|
(20)
|
|
Net
loss
|
-
|
-
|
-
|
(37,887)
|
-
|
-
|
-
|
(37,887)
|
|
Foreign Currency
Translation Adjustment
|
-
|
-
|
-
|
-
|
-
|
-
|
(726)
|
(726)
|
|
Balance at July 1, 2016
|
10,217
|
$102
|
$31,128
|
$(27,448)
|
(331)
|
$(1,480)
|
$(1,234)
|
$1,068
|
The accompanying notes are an integral part of these consolidated
financial statements.
VERSAR, INC. AND SUBSIDIARIES
Consolidated Statements of Cash Flows
(in thousands)
|
|
For the Fiscal Year Ended
|
||
|
|
July 1, 2016
|
June 26, 2015
|
June 27, 2014
|
|
Cash flows from operating activities:
|
|
|
|
|
Net income (loss)
|
$(37,887)
|
$1,407
|
$(334)
|
|
|
|
|
|
|
Adjustments to reconcile net income (loss) from continuing
operations to net cash provided by operating
activities:
|
|
|
|
|
Depreciation and amortization
|
5,756
|
2,566
|
1,973
|
|
(Gain) loss on sale of property and equipment
|
(79)
|
59
|
34
|
|
Change in contingent notes
|
-
|
-
|
(1,590)
|
|
Provision for (recovery of) doubtful accounts
receivable
|
1,001
|
(27)
|
(886)
|
|
Loss on life insurance policy cash surrender value
|
-
|
(35)
|
(63)
|
|
Provision (benefit) for income taxes expense
|
1,779
|
1,008
|
(913)
|
|
Share based compensation
|
329
|
405
|
502
|
|
Goodwill impairment
|
20,331
|
-
|
1,381
|
|
Intangible impairment
|
3,812
|
-
|
-
|
|
Changes in assets and liabilities:
|
|
|
|
|
Decrease (increase) in accounts
receivable
|
15,191
|
(26,239)
|
10,682
|
|
Decrease (increase) in prepaid and other
assets
|
1,148
|
(344)
|
356
|
|
(Increase) decrease in inventories
|
(96)
|
7
|
64
|
|
(Decrease) increase in accounts
payable
|
(19,635)
|
23,013
|
(2,190)
|
|
Decrease in accrued salaries and
vacation
|
(1,055)
|
(938)
|
(130)
|
|
Decrease in income tax payable
|
829
|
(15)
|
(141)
|
|
Decrease (increase) in other assets and
liabilities
|
6,503
|
(705)
|
(1,998)
|
|
Net cash provided by operating
activities
|
(2,072)
|
162
|
6,747
|
|
|
|
|
|
|
Cash flows from investing activities:
|
|
|
|
|
Purchase of property and equipment
|
(686)
|
(839)
|
(971)
|
|
Payment for VSS acquisition, net of cash acquired
|
(11,080)
|
-
|
-
|
|
Payment for JMWA acquisition, net of cash acquired
|
-
|
(7,164)
|
-
|
|
Payment for GMI acquisiton, net of cash acquired
|
-
|
-
|
(2,788)
|
|
Proceeds from sale of office equipment
|
270
|
-
|
-
|
|
Premiums paid on life insurance policies
|
-
|
(23)
|
(23)
|
|
Proceeds received on life insurance policies
|
-
|
835
|
-
|
|
Net cash used in investing activities
|
(11,496)
|
(7,191)
|
(3,782)
|
|
|
|
|
|
|
Cash flows from financing activities:
|
|
|
|
|
Borrowings on line of credit
|
73,464
|
19,943
|
-
|
|
Repayments on line of credit
|
(58,611)
|
(19,943)
|
-
|
|
Loan for JMWA Purchase
|
-
|
4,000
|
-
|
|
Repayment of Loan for JMWA Purchase
|
(1,266)
|
(1,189)
|
-
|
|
Loan for VSS Purchase
|
5,000
|
-
|
-
|
|
Repayment of Loan for VSS Purchase
|
(2,500)
|
-
|
-
|
|
Proceeds from exercise of stock options
|
-
|
-
|
99
|
|
Repayments of notes payable
|
(3,058)
|
(3,559)
|
(2,045)
|
|
Purchase of treasury stock
|
(20)
|
(64)
|
(171)
|
|
Net cash provided by financing activities
|
13,009
|
(812)
|
(2,117)
|
|
Effect of exchange rate changes on cash and cash
equivalents
|
(1)
|
276
|
98
|
|
Net decrease in cash and cash equivalents
|
(560)
|
(7,565)
|
946
|
|
Cash and cash equivalents at the beginning of the
period
|
2,109
|
9,674
|
8,728
|
|
Cash and cash equivalents at the end of the period
|
$1,549
|
$2,109
|
$9,674
|
|
Supplemental disclosure of cash and non-cash
activities:
|
|
|
|
|
Promissory notes-payable issued in
connection with JMWA acquisition
|
$-
|
$6,000
|
$-
|
|
Promissory notes-payable issued in
connection with GMI acquisition
|
$-
|
$-
|
$1,250
|
|
Contingent consideration payable related to
VSS acquisition
|
$3,154
|
$-
|
$-
|
|
Cash paid for interest
|
$133
|
$429
|
$133
|
|
Cash paid for income taxes
|
$254
|
$48
|
$254
|
The accompanying notes are an integral part of these consolidated
financial statements.
VERSAR, INC. AND SUBSIDIARIES
NOTES TO CONSOLIDATED FINANCIAL STATEMENTS NOTE 1 - SIGNIFICANT
ACCOUNTING POLICIES
NOTE 1 - Significant Accounting Policies
Principles of
consolidation and business operations: Versar, Inc., a Delaware corporation
organized in 1969, is a global project management firm that
provides value oriented solutions to government and commercial
clients. We also provide tailored and secure engineering solutions
in extreme environments and offers specialized abilities in
construction management, security system integration,
performance-based remediation, and hazardous materials management.
The accompanying consolidated financial statements include the
accounts of Versar, Inc. and its wholly-owned subsidiaries
(“Versar” or the “Company”). All
intercompany balances and transactions have been eliminated in
consolidation. The Company operates within three business segments
ECM, ESG and PSG. Refer to Note 3 - Business Segments for
additional information. The Company’s fiscal year end is
based upon 52 or 53 weeks per year ending on the last Friday of the
fiscal period and therefore does not close on a calendar month end.
The Company’s fiscal year 2016 included 53 weeks and its
fiscal years 2015 and 2014 included 52 weeks.
Accounting
estimates: The financial
statements have been prepared in conformity with accounting
principles generally accepted in the United States of America
(“GAAP”), which require management to make estimates
and assumptions that affect the reported amounts of assets and
liabilities and disclosure of contingent assets and liabilities at
the date of the financial statements and the reported amounts of
revenues and expenses during the reporting period. Actual results
may differ from those estimates.
Contract accounting and
revenue recognition: Contracts in process are stated at the lower
of actual cost incurred plus accrued profits or incurred costs
reduced by progress billings. The Company records income from major
fixed-price contracts, extending over more than one accounting
period, using the percentage-of-completion method. During
performance of such contracts, estimated final contract prices and
costs are periodically reviewed and revisions are made as required.
The effects of these revisions are included in the periods in which
the revisions are made. On cost-plus-fee type contracts, revenue is
recognized to the extent of costs incurred plus a proportionate
amount of fee earned, and on time-and material contracts, revenue
is recognized to the extent of billable rates times hours delivered
plus material and other reimbursable costs incurred. Losses on
contracts are recognized when they become
known.
Direct costs of services
and overhead: These
expenses represent the cost to Versar of direct and overhead staff,
including recoverable overhead costs and unallowable costs that are
directly attributable to contracts performed by the
Company.
Pre-contract
costs: Costs incurred by
the Company prior to the execution of a contract, including bid and
proposal costs, are expensed when incurred regardless of whether
the bid is successful.
Depreciation and
amortization: Property
and equipment are carried at cost net of accumulated depreciation
and amortization. Depreciation and amortization are computed on a
straight-line basis over the estimated useful lives of the assets.
Repairs and maintenance that do not add significant value or
significantly lengthen an asset’s useful life are charged to
current operations.
Allowance for doubtful
accounts receivable: Disputes arise in the normal course of our
business on projects where we are contesting with customers for
collection of funds because of events such as delays, changes in
contract specifications and questions of cost allowability and
collectability. Such disputes, whether claims or unapproved change
orders in process of negotiation, are recorded at the lesser of
their estimated net realizable value or actual costs incurred and only when
realization is probable and can be reliably estimated. Management
reviews outstanding receivables on a quarterly basis and assesses
the need for reserves, taking into consideration past collection
history and other events that bear on the collectability of such
receivables. All receivables over 60 days old are reviewed as part
of this process.
Share-based
compensation: Share-based
compensation expense is measured at the grant date, based on the
fair value of the award. The Company's recent equity awards have
been restricted stock unit awards. Share-based compensation cost
for restricted stock unit awards is based on the fair market value
of the Company’s stock on the date of grant. Share-based
compensation expense for stock options is calculated on the date of
grant using the Black-Scholes pricing model to determine the fair
value of stock options. Compensation expense is then recognized
ratably over the requisite service period of the
grants.
Net income (loss) per
share: Basic net income
(loss) per common share is computed by dividing net income by the
weighted average number of common shares outstanding during the
period. Diluted net income per common share also includes common
equivalent shares outstanding during the period, if dilutive. The
Company’s common equivalent shares consist of shares to be
issued under outstanding stock options and shares to be issued upon
vesting of unvested restricted stock units.
The following is a reconciliation of weighted average outstanding
shares for purposes of calculating basic net (loss) income per
share compared to diluted net (loss) income per share:
|
|
For the Fiscal Year End
|
||
|
|
July 1, 2016
|
June 26, 2015
|
June 27,2014
|
|
|
(in thousands)
|
||
|
Weighted average common shares outstanding-basic
|
9,857
|
9,771
|
9,663
|
|
Effect of assumed exercise of options and vesting of restricted
stock unit awards, using the treasury stock method
|
-
|
-
|
-
|
|
Weighted average common shares outstanding-diluted
|
9,857
|
9,771
|
9,663
|
|
|
|
|
|
For fiscal 2014, there were outstanding options to purchase
approximately 43,000 shares of common stock, however, due to the
net loss, there was no impact to dilution. We had no outstanding
options in fiscal years 2015 and 2016.
Cash and cash
equivalents: All
investments with an original maturity of three months or less when
purchased are considered to be cash equivalents. Cash and cash
equivalents are maintained at financial institutions and, at times,
balances may exceed federally insured limits. The Company has never
experienced any losses related to these
balances.
Inventory:
The Company’s inventory is valued at the lower of cost or
market and is accounted for on a first-in first-out
basis.
Long-lived
assets: The Company is
required to review long-lived assets and certain identifiable
intangibles for impairment whenever events or changes in
circumstances indicate that the carrying value of an asset might
not be recoverable. An impairment loss is recognized if the
carrying value exceeds the fair value. Any write-downs are treated
as permanent reductions. The Company believes the long-lived assets
as of July 1, 2016 are fully recoverable.
Income taxes:
The Company recognizes deferred
tax liabilities and assets for the expected future tax consequences
of temporary differences between the carrying amounts and the tax
bases of certain assets and liabilities. A valuation allowance is
established, as necessary, to reduce deferred income tax assets to
the amount expected to be realized in future
periods.
Goodwill:
The carrying value of goodwill
at July 1, 2016 and June 26, 2015 was zero and $16.1 million,
respectively. To conduct the annual goodwill impairment analysis,
management, with the assistance of an external valuation firm,
estimated the fair value of each reporting unit using a
market-based valuation approach based on comparable public company
data (see Note 7 for results). As of July 1, 2016, the Company has
recognized impairment expense of $11.5 million for the ECM
reporting unit, $4.4 million for the ESG reporting unit, and $4.4
million for the PSG reporting unit. These charges are associated
with impairment of goodwill acquired from JCSS, Advent, PPS,
Charron, GMI, and JMWA.
Other intangible
assets: The net carrying
value of intangible assets at July 1, 2016 and June 26, 2015 was
$7.2 million and $4.6 million, respectively. The intangible assets
accumulated from acquisitions include customer related assets,
marketing related assets, technology-based assets, contractual
related assets, and non-competition related assets. These
intangible assets are amortized over a 1.75 - 15 year useful life.
The Company is required to review its amortized intangible assets
for impairment whenever events or changes in circumstances indicate
that the carrying value of the asset might not be recoverable. An
impairment loss is recognized if the carrying value exceeds the
fair value. Any impairment of the assets would be treated as
permanent reductions. Based on the results of the impairment
testing during the third and fourth quarters of fiscal 2016, the
Company concluded that the value of intangible assets with a
carrying amount of $3.7 million was not recoverable. As a result of
these charges, the carrying amount of intangible assets acquired
from GMI, Charron, Advent, JMWA, and PPS has been reduced to zero.
The carrying amount of intangible assets in the Company’s PSG
and ESG segments have been reduced to zero.
Treasury stock:
The Company accounts for
treasury stock using the cost method. There were 330,742 and
323,841 shares of treasury stock at historical cost of
approximately $1.5 million at July 1, 2016 and June 26, 2015,
respectively.
Foreign Currency
Translation and Transactions: The financial position and results of
operations of the Company’s foreign affiliates are translated
using the local currency as the functional currency. Assets and
liabilities of the affiliates are translated at the exchange rate
in effect at year-end. Statement of Operations accounts are
translated at the average rate of exchange prevailing during the
year. Translation adjustments arising from the use of differing
exchange rates from period to period are included in Other
Comprehensive Income (Loss) within the Company’s Consolidated
Statements of Comprehensive Income (Loss). Gains and losses
resulting from foreign currency transactions are included in
operations and are not material for the fiscal years presented. At
July 1, 2016 and June 26, 2015, the Company had cash held in
foreign banks of approximately $0.5 million and $0.8 million,
respectively. At July 1, 2016 and June 26, 2015, the Company had
net assets held in the United Kingdom of approximately $0.3
million.
Fair value of Financial
Instruments: The fair
values of the Company’s cash and cash equivalents, accounts
receivable, accounts payable, and accrued liabilities approximate
their carrying values because of the short-term nature of those
instruments. The carrying value of the Company’s debt
approximates its fair value based upon the quoted market price
offered to the Company for debt of the same maturity and
quality.
Commitments and
Contingencies: Liabilities for loss contingencies arising
from claims, assessments, litigation, fines, and penalties and
other sources are recorded when it is probable that a liability has
been incurred and the amount of the assessment and/or remediation
can be reasonably estimated.
Recent Accounting Pronouncements
In
April 2014, the Financial
Accounting Standards Board (“FASB”) issued Accounting
Standards Update No. 2014-08, “Reporting
Discontinued Operations and Disclosures of Disposals of Components
of an Entity”
(“ASU 2014-08”),
which amends the requirements for reporting discontinued operations
and requires additional disclosures about discontinued operations.
Under the new guidance, a discontinued operation is defined as
a disposal of a component or group of
components that is disposed of or is classified as held for sale
and represents a strategic shift that has (or will have) a major effect
on an entity’s operations and financial results. This new
accounting guidance is effective for annual periods beginning after
December 15, 2014. The Company adopted this guidance for the fiscal
year ended July 1, 2016 and had no impact on the fiscal 2016
financial statements.
In
April 2015, the FASB issued Accounting Standards Update No.
2015-03, Interest—Imputation of Interest
(Subtopic 835-30): Simplifying the Presentation of Debt Issuance
Costs, which simplifies the presentation of debt issuance
costs as a deduction from the carrying amount of the related debt
liability instead of a deferred charge. For public business
entities, the amendments of the update are effective for financial
statements issued for fiscal years beginning after December 15,
2015, and interim periods within those fiscal years. Early adoption
of the amendments in this update are permitted for financial
statements that have not been previously issued. The Company has
elected to adopt this standard for the fiscal year ended July 1,
2016. The Company reclassified $0.2 million of the Lenders debt
issuance costs from Prepaid expenses within the other current
assets to the Bank line of credit section within current
liabilities on the Company consolidated balance
sheets.
In
September 2015, the FASB issued Accounting Standards Update
No. 2015-16 – “Simplifying the Accounting for
Measurement-Period Adjustments (Topic 805): Business
Combinations” (“ASU 2015-16”), which
replaces the requirement that an acquirer in a business combination
account for measurement period adjustments retrospectively with a
requirement that an acquirer recognize adjustments to the
provisional amounts that are identified during the measurement
period in the reporting period in which the adjustment amounts are
determined. ASU 2015-16 requires that the acquirer record, in
the same period’s financial statements, the effect on
earnings of changes in depreciation, amortization, or other income
effects, if any, as a result of the change to the provisional
amounts, calculated as if the accounting had been completed at the
acquisition date. For public business entities, ASU 2015-16 is
effective for fiscal years beginning after December 15, 2015,
including interim periods within those fiscal years. The guidance
is to be applied prospectively to adjustments to provisional
amounts that occur after the effective date of the guidance, with
earlier application permitted for financial statements that have
not been issued. The Company will adopt the guidance for fiscal
2017 and does not expect the adoption of this guidance to have a
material impact on its consolidated financial
statements.
In
November 2015, the FASB issued Accounting Standards Update NO.
2015-17 – “Balance
Sheet Classifications of Deferred Taxes” (“ASU
2015-17”). To simplify the presentation of deferred income
taxes, ASU 2015-17 require that deferred tax liabilities and assets
be classified as noncurrent in a classified statement of financial
position. ASU 2015-17 eliminate the guidance in Topic 740 that
requires an entity to separate deferred tax liabilities and assets
into a current amount and a noncurrent amount in a classified
statement of financial position. ASU 2017 -17 is effective for
fiscal years beginning after December 15, 2016, including
interim periods within those fiscal years. The guidance is to be
applied prospectively to adjustments to provisional amounts that
occur after the effective date of the guidance, with earlier
application permitted for financial statements that have not been
issued. The Company adopted this
guidance for the fiscal year ended July 1, 2016 and had no impact
on the fiscal 2016 financial statements.
In February 2016, the FASB issued
Accounting Standards Update No.
2016-02, Leases
(Topic 842) (“ASU
2016-02”), which
requires the recognition of lease rights and obligations as assets
and liabilities on the balance sheet. Previously, lessees were
not required to recognize on the balance sheet assets and
liabilities arising from operating leases. The ASU also requires
disclosure of key information about leasing arrangements. ASU
2016-02 is effective on January 1, 2019, using the modified
retrospective method of adoption, with early adoption permitted. We
have not yet determined the effect of the adoption of ASU 2016-02
on our consolidated financial statements nor have we selected a
transition date.
In March 2016,
the FASB issued ASU 2016-07 (Topic 323), Investments
– Equity Method and Joint Ventures. The new guidance
eliminates the requirement that when an investment qualifies for
use of the equity method as a result of an increase in the level of
ownership interest or degree of influence, an investor must adjust
the investment, results of operations, and retained earnings
retroactively on a step-by-step basis as if the equity method had
been in effect during all previous periods that the investment had
been held. The guidance is effective for fiscal years, beginning
after December 15, 2016. Early adoption is permitted. The Company
does not anticipate the adoption of this guidance to have a
material impact on its consolidated financial
statements.
In May
2014, the FASB issued ASU 2014-09, Revenue from Contracts with Customers
(Topic 606). ASU 2014-09 provides a single comprehensive
revenue recognition framework and supersedes almost all existing
revenue recognition guidance. Included in the new principles-based
revenue recognition model are changes to the basis for deciding on
the timing for revenue recognition. In addition, the standard
expands and improves revenue disclosures. In August 2015, the FASB
issued ASU 2015-14, Revenue
from Contracts with Customers (Topic 606): Deferral of Effective
Date, to amend ASU 2014-09 to defer the effective date of
the new revenue recognition standard. As a result, ASU 2014-09 is
effective for the Company for fiscal 2018 and can be adopted either
retrospectively to each prior reporting period presented or as a
cumulative effect adjustment as of the date of
adoption.
In
March 2016, the FASB issued ASU 2016-08, Revenue from Contracts with Customers (Topic
606): Principal versus Agent Considerations (Reporting
Revenue Gross versus Net) to amend ASU 2014-09, clarifying the
implementation guidance on principal versus agent considerations in
the new revenue recognition standard. Specifically, ASU 2016-08
clarifies how an entity should identify the unit of accounting
(i.e., the specified good or service) for the principal versus
agent evaluation and how it should apply the control principle to
certain types of arrangements.
In
April 2016, the FASB issued ASU 2016-10, Revenue from Contracts with Customers (Topic
606): Identifying Performance Obligations and Licensing
to amend ASU 2014-09, reducing the complexity when
applying the guidance for identifying performance obligations and
improving the operability and understandability of the license
implementation guidance.
In May
2016, the FASB issued ASU 2016-12, Revenue from Contracts with Customers (Topic
606): Narrow-Scope Improvements and Practical Expedients.
The improvements address completed contracts and contract
modifications at transition, noncash consideration, the
presentation of sales taxes and other taxes collected from
customers, and assessment of collectability when determining
whether a transaction represents a valid contract. Specifically,
ASU 2016-12 clarifies how an entity should evaluate the
collectability threshold and when an entity can recognize nonrefundable
consideration received as revenue if an arrangement does not meet
the standard’s contract criteria. The pronouncement is
effective for fiscal years, and interim periods within those fiscal
years, beginning after December 15, 2017. The Company is evaluating
the impact all the foregoing Topic 606 amendments will have on its
consolidated financial statements.
In August
27, 2014, the FASB (the “board”) issued Accounting
Standards Update No. 2014-15, Disclosure of Uncertainties about an
Entity’s Ability to Continue as a Going Concern, which
requires management to assess a company’s ability to continue
as a going concern and to provide related footnote disclosures in
certain circumstances. Before this new standard, there was minimal
guidance in U.S. GAAP specific to going concern. Under the new
standard, disclosures are required when conditions give rise to
substantial doubt about a company’s ability to continue as a
going concern within one year from the financial statement issuance
date. The new standard applies to all companies and is effective
for the annual period ending after December 15, 2016, and all
annual and interim periods thereafter. The Company will adopt the
guidance for fiscal 2017 and does not expect the adoption of this
guidance to have a material impact on its consolidated financial
statements.
In
January 2017, the FASB issued ASU 2017-04, Intangibles - Goodwill and Other (Topic 350):
Simplifying the Test for Goodwill Impairment: These
amendments eliminate Step 2 from the goodwill impairment test. The
annual, or interim, goodwill impairment test is performed by
comparing the fair value of a reporting unit with its carrying
amount. An impairment charge should be recognized for the amount by
which the carrying amount exceeds the reporting unit’s fair
value; however, the loss recognized should not exceed the total
amount of goodwill allocated to that reporting unit. In addition,
income tax effects from any tax deductible goodwill on the carrying
amount of the reporting unit should be considered when measuring
the goodwill impairment loss, if applicable. The Company will adopt
the guidance for fiscal 2017 and does not expect the adoption of
this guidance to have a material impact on its consolidated
financial statements.
NOTE 2 – GOING CONCERN
The accompanying financial statements and notes have been prepared
assuming that the Company will continue as a going concern. For the
fiscal year ended July 1, 2016, the Company generated a net loss of
$37.9 million and had an accumulated deficits of $27.4 million with
limited sources of operating cash flows, and further losses are
anticipated in the development of its business. Further, the
Company was in default under its loan agreement as of July 1, 2016.
On December 9, 2016 Versar, together with certain of its domestic
subsidiaries acting as guarantors, entered into an Amendment and to
the Loan Agreement dated September 30, 2015 with the Lender (see
Note 13 – Debt). The Company’s ability to continue as a
going concern is dependent upon the Company’s ability to
generate profitable operations and/or raise additional capital
through equity or debt financing to meet its obligations and repay
its liabilities when they come due.
The Company intends to continue funding its business operations and
its working capital needs by way of private placements financing,
obtaining additional term loans or borrowings from other financial
institutions, until such time profitable operations can be
achieved. As much as management believes that this plan provides an
opportunity for the Company to continue as a going concern, there
are no written agreements in place for such funding or issuance of
securities and there can be no assurance that sufficient funding
will be available in the future. These and other factors raise
substantial doubt about the Company’s ability to continue as
a going concern.
These financial statements do not include any adjustments relating
to the recoverability and classification of recorded asset amounts,
or amounts and classification of liabilities that might result from
the outcome of this uncertainty.
NOTE 3 - BUSINESS SEGMENTS
The Company’s ECM business segment provides facility planning
and programming, engineering design, construction, construction
management and security systems installation and support services.
ESG provides full service environmental consulting including
compliance, cultural resources. Natural resources, remediation and
UXO/MMRP services. PSG provides onsite environmental, engineering,
construction and logistics services.
Summary financial information for the Company’s business
segments from continuing operations is as follows:
|
|
For the Fiscal Year Ended
|
||
|
|
July 1, 2016
|
June 26, 2015
|
June 27, 2014
|
|
|
(in thousands)
|
||
|
GROSS REVENUE
|
|
|
|
|
ECM
|
$110,533
|
$91,111
|
$52,012
|
|
ESG
|
38,688
|
46,620
|
46,848
|
|
PSG
|
18,696
|
22,146
|
11,420
|
|
|
$167,917
|
$159,877
|
$110,280
|
|
|
|
|
|
|
GROSS PROFIT (LOSS) (a)
|
|
|
|
|
ECM
|
$3,108
|
$8,030
|
$5,288
|
|
ESG
|
890
|
3,667
|
2,116
|
|
PSG
|
(824)
|
2,094
|
1,115
|
|
|
$3,174
|
$13,791
|
$8,519
|
|
|
|
|
|
|
Selling, general and administrative expenses
|
13,031
|
11,003
|
10,175
|
|
Other operating expense (income)
|
1,937
|
-
|
(1,596)
|
|
Goodwill impairment
|
20,332
|
-
|
1,381
|
|
Intangible impairment
|
3,812
|
-
|
-
|
|
OPERATING (LOSS) INCOME
|
$(35,937)
|
$2,788
|
$(1,441)
|
a) - Gross profit is defined as gross revenues less purchased
services and materials, at cost, less direct costs of services and
overhead allocated on a proportional basis. During fiscal 2015, the
Company’s management changed the method of allocating
business development (BD) costs to the reportable segments in order
to refine the information used by our Chief Operating Decision
Maker (CODM). The new methodology allocates BD costs to the
selling, general, and administrative expense line, while the old
methodology allocated BD costs to contract costs. The presentation
for fiscal 2014 has been reclassified to conform to fiscal 2015
presentation. Approximately $1.8 million has been recast from
contract costs to selling, general, and administrative expenses for
the year ended June 27, 2014.
|
|
As of
|
|
|
|
July 1, 2016
|
June 26, 2015
|
|
ASSETS
|
(in thousands)
|
|
|
|
|
|
|
ECM
|
$21,842
|
$35,925
|
|
ESG
|
21,492
|
47,347
|
|
PSG
|
17,982
|
5,934
|
|
Total Assets
|
$61,316
|
$89,206
|
NOTE 4 - ACQUISITIONS
On
September 30, 2015, the Company completed the acquisition of a
specialized federal security integration business from Johnson
Controls, Inc., which is now known as Versar Security Systems
(VSS). This group is headquartered in Germantown, Maryland and
generated approximately $34 million in trailing twelve month
revenues prior to the acquisition date from key long term customers
such as FAA and FEMA. The results of operations of VSS have been
included in the Company’s consolidated results from the date
of acquisition. VSS has contributed approximately $17.6 million in
revenue and $15.4 million in expenses from the date of the
acquisition through July 1, 2016. Additionally, the Company has
incurred approximately $0.6 million of acquisition and integration
costs through July 1, 2016, recorded in selling, general, and
administrative expenses.
VSS expands the Company’s service offerings to include higher
margin classified construction, enables Versar to generate more
work with existing clients and positions the Company to more
effectively compete for new opportunities. At closing, the Company
paid a cash purchase price of $10.5 million. In addition, the
Company agreed to pay contingent consideration of up to a maximum
of $9.5 million (undiscounted) based on certain events within the
earn out period of 3 years from September 30, 2015. Based on the
facts and circumstances as of April 1, 2016, management believes
that the amount of the contingent consideration that will be earned
within the earn out period is $3.2 million, including probability
weighing of future cash flows. This anticipated contingent
consideration is recognized as consideration and as a liability, of
which $1.6 million is presented within other current liabilities
and $1.6 million is presented within other long-term liabilities on
the condensed consolidated balance sheet as of July 1, 2016. The
potential undiscounted amount of all future payments that the
Company could be required to make under the contingent
consideration agreement ranges from $0 to a maximum payout of $9.5
million, with the amount recorded being the most
probable.
The final purchase price allocation in the table below reflects the
Company’s estimate of the fair value of the assets acquired
and liabilities assumed as of the September 30, 2015 acquisition
date. Goodwill was allocated to the ECM segment. Goodwill
represents the value in excess of fair market value that the
Company paid to acquire JCSS. The allocation of intangibles has
been completed by an independent third party and recorded on the
Company’s consolidated balance sheet as of July 1,
2016.
|
|
Amount
|
|
Description
|
(in thousands)
|
|
Accounts receivable
|
$6,979
|
|
Prepaid and other
|
15
|
|
Property and equipment
|
29
|
|
Goodwill
|
4,266
|
|
Intangibles
|
8,129
|
|
Assets Acquired
|
19,418
|
|
|
|
|
Account payable
|
1,675
|
|
Other liabilities
|
3,509
|
|
Liabilities Assumed
|
5,184
|
|
|
|
|
Acquisition Purchase Price
|
$14,234
|
|
|
|
The table below summarizes the unaudited pro forma statements of
operations for the fiscal year ended July 1, 2016, June 26, 2015
and June 27, 2014, assuming that the VSS acquisition had been
completed as of the first day of each of the three fiscal years,
respectively. These pro forma statements do not include any
adjustments that may have resulted from synergies derived from the
acquisition or for amortization of intangibles other than during
the period the acquired entity was part of the
Company.
|
VERSAR, INC. AND SUBSIDIARIES
|
|||||||||
|
|
|||||||||
|
Pro forma Consolidated Statements of Operations
|
|||||||||
|
(In thousands, except per share amounts)
|
|||||||||
|
|
|||||||||
|
|
For the Fiscal
Year EndedJuly 1, 2016(in thousands)
|
For the Fiscal
Year EndedJune 26, 2015(in thousands)
|
For the Fiscal
Year EndedJune 27, 2014(in thousands)
|
||||||
|
|
Versar
|
VSS
|
Pro Forma
Combined
|
Versar
|
VSS
|
Pro Forma
Combined
|
Versar
|
VSS
|
Pro Forma
Combined
|
|
|
|
|
|
|
|
|
|
|
|
|
GROSS
REVENUE
|
$167,917
|
6,497
|
174,414
|
$159,877
|
31,438
|
191,315
|
$110,280
|
41,526
|
151,806
|
|
Purchased
services and materials, at cost
|
107,199
|
3,816
|
111,015
|
90,289
|
20,956
|
111,245
|
55,108
|
27,886
|
82,994
|
|
Direct
costs of services and overhead
|
57,544
|
1,043
|
58,587
|
55,797
|
5,570
|
61,368
|
46,653
|
7,413
|
54,066
|
|
GROSS
PROFIT
|
3,174
|
1,638
|
4,812
|
13,791
|
4,912
|
18,702
|
8,519
|
6,227
|
14,745
|
|
Selling,
general and administrative expenses
|
13,031
|
450
|
13,481
|
11,003
|
1,207
|
12,209
|
10,175
|
2,021
|
12,196
|
|
Other
operating expense (income)
|
1,937
|
-
|
1,937
|
-
|
(2)
|
(2)
|
(1,596)
|
(2)
|
(1,598)
|
|
Goodwill
impairment
|
20,332
|
-
|
20,332
|
-
|
-
|
-
|
1,381
|
-
|
1,381
|
|
Intangible
impairment
|
3,812
|
-
|
3,812
|
-
|
-
|
-
|
-
|
-
|
-
|
|
OPERATING
(LOSS) INCOME
|
(35,937)
|
1,188
|
(34,749)
|
2,788
|
3,707
|
6,494
|
(1,441)
|
4,208
|
2,767
|
|
|
|
|
|
|
|
|
|
|
|
|
OTHER
EXPENSE
|
|
|
|
|
|
|
|
|
|
|
Interest
income
|
(19)
|
-
|
(19)
|
(2)
|
-
|
(2)
|
(15)
|
-
|
(15)
|
|
Interest
expense
|
702
|
-
|
702
|
447
|
-
|
447
|
133
|
-
|
133
|
|
(LOSS) INCOME
BEFORE INCOME TAXES, FROM CONTINUING OPERATIONS
|
(36,620)
|
1,188
|
(35,432)
|
2,343
|
3,707
|
6,051
|
(1,559)
|
4,208
|
2,649
|
|
Income
tax (benefit) expense
|
1,267
|
457
|
1,724
|
936
|
1,394
|
2,330
|
(1,043)
|
1,520
|
477
|
|
NET (LOSS)
INCOME FROM CONTINUING OPERATIONS
|
(37,887)
|
731
|
(37,156)
|
1,407
|
2,313
|
3,720
|
(516)
|
2,688
|
2,172
|
|
Income (Loss)
from discontinued operations, net of tax
|
-
|
-
|
-
|
-
|
-
|
-
|
182
|
-
|
182
|
|
NET (LOSS)
INCOME
|
$(37,887)
|
731
|
(37,156)
|
$1,407
|
2,313
|
3,720
|
$(334)
|
2,688
|
2,354
|
|
|
|
|
|
|
|
|
|
|
|
|
NET (LOSS)
INCOME PER SHARE-BASIC and DILUTED
|
|
|
|
|
|
|
|
|
|
|
Continuing
operations
|
$(3.84)
|
-
|
(3.84)
|
$0.14
|
-
|
0.14
|
$(0.05)
|
-
|
(0.05)
|
|
Discontinued
operations
|
-
|
-
|
|
-
|
-
|
-
|
0.02
|
-
|
0.02
|
|
NET (LOSS)
INCOME PER SHARE-BASIC and DILUTED
|
$(3.84)
|
-
|
(3.84)
|
$0.14
|
-
|
0.14
|
$(0.03)
|
-
|
(0.03)
|
|
|
|
|
|
|
|
|
|
|
|
|
WEIGHTED
AVERAGE NUMBER OF SHARES OUTSTANDING-BASIC
|
9,857
|
-
|
9,857
|
9,771
|
-
|
9,771
|
9,663
|
-
|
9,663
|
|
WEIGHTED
AVERAGE NUMBER OF SHARES OUTSTANDING-DILUTED
|
9,857
|
-
|
9,857
|
9,771
|
-
|
9,771
|
9,663
|
-
|
9,663
|
On July 1, 2014, Versar acquired all of the issued and outstanding
capital stock of JMWA. JMWA was a service disabled veteran owned
small business providing architectural, design, planning,
construction management, environmental, facilities, and logistical
consulting services to federal, state, municipal and commercial
clients. The outstanding capital stock of JMWA was acquired by
Versar pursuant to a Stock Purchase Agreement by and among Versar,
JMWA, and the stockholders of JMWA and entered into on June 30,
2014. The aggregate purchase price for the outstanding capital
stock of JMWA was $13.0 million, which was comprised of: (i) cash
in the amount of $7.0 million paid pro rata in accordance with each
stockholder’s ownership interest in JMWA at closing; and (ii)
three seller notes with an aggregate principal amount of $6.0
million issued by Versar to the JMWA stockholders, pro rata in
accordance with each stockholders’ ownership interest in JMWA
at closing. The seller notes bear interest at a rate of 5.00% per
annum and mature on the third business day of January 2019. The
purchase price is subject to a post-closing adjustment based on an
agreed target net working capital of JMWA as of the date of
closing. The Stock Purchase Agreement contains customary
representations and warranties and requires the JMWA stockholders
to indemnify Versar for certain liabilities arising under the
agreement, subject to certain limitations and
conditions.
The final purchase price allocation in the table below reflects the
Company’s estimate of the fair value of the assets acquired
and liabilities assumed on the July 1, 2014 acquisition date.
Goodwill has been allocated between our ECM, ESG, and PSG segments
based on a percentage of segment specific JMWA revenue dollars for
fiscal 2015. Goodwill, which in certain circumstances, may be
deductible for tax purposes, represents the value in excess of fair
market value that the Company paid to acquire JMWA, less identified
intangible assets. The Company incurred approximately $0.1 million
in transaction costs related to the JMWA acquisition. During fiscal
2015, the Company recorded measurement period adjustments totaling
approximately $1.1 million related to accounts receivable,
intangible assets, goodwill, accounts payable, and other
liabilities.
|
|
Amount
|
|
Description
|
(in thousands)
|
|
Cash
|
$456
|
|
Accounts receivable
|
4,996
|
|
Property and equipment
|
382
|
|
Other assets
|
147
|
|
Intangibles
|
2,833
|
|
Goodwill
|
8,355
|
|
Assets Acquired
|
17,169
|
|
|
|
|
Account payable
|
1,603
|
|
Other liabilities
|
2,566
|
|
Liabilities Assumed
|
4,169
|
|
|
|
|
Purchase Price
|
$13,000
|
|
|
|
NOTE 5 – FAIR VALUE
MEASUREMENT
Versar applies ASC 820 –
Fair Value
Measurements and Disclosures in determining the fair value to be
disclosed for financial and nonfinancial assets and
liabilities.
ASC 820 defines fair value as the price that would be received to
sell an asset or paid to transfer a liability (an exit price) in an
orderly transaction between market participants at the measurement
date. It establishes a fair value hierarchy and a framework which
requires categorizing assets and liabilities into one of three
levels based on the assumptions (inputs) used in valuing the asset
or liability. Level 1 provides the most reliable measure of fair
value, while Level 3 generally requires significant management
judgment.
Level 1
inputs are unadjusted, quoted
market prices in active markets for identical assets or
liabilities.
Level 2
inputs are observable inputs
other than quoted prices included in Level 1, such as quoted prices
for similar assets or liabilities in active markets or quoted
prices for identical assets or liabilities in inactive
markets.
Level 3
inputs include unobservable
inputs that are supported by little, infrequent, or no market
activity and reflect management’s own assumptions about
inputs used in pricing the asset or liability.
As a result of the acquisition of JMWA, the Company is required to
report at fair value the assets and liabilities it acquired as a
result of the acquisition. The significant valuation technique
utilized in the fair value measurement of the assets and
liabilities acquired was primarily an income approach used to
determine fair value of the acquired intangible assets.
Additionally, a market approach and an asset-based approach were
used as secondary methodologies. This valuation technique is
considered to be Level 3 fair value estimate, and required the
estimate of appropriate royalty and discount rates and forecasted
future revenues generated by each identifiable intangible
asset.
NOTE 6 – DISCONTINUED OPERATIONS
The consolidated financial statements and related footnote
disclosures reflect fiscal 2013 discontinuation of the Lab,
Telecom, and Domestic Products business components in the ECM
segment. Income and losses associated with these components, net of
applicable income taxes, is shown as income or loss from
discontinued operations for the fiscal year ended June 27, 2014
(excluding quarterly financial data in Note 18). For the year ended
July 1, 2016, there was no activity associated with discontinued
operations.
Operating results for the discontinued operations for the years
ended July 1, 2016, June 26, 2015, and June 27, 2014, were as
follows;
|
|
For the Fiscal Years Ended
|
||
|
|
July 1, 2016
|
June 26, 2015
|
June 27, 2014
|
|
|
(in thousands)
|
||
|
|
|
|
|
|
Gross Revenues
|
$-
|
$-
|
$-
|
|
Income (Loss) from discontinued operations
|
-
|
-
|
317
|
|
Provision for income taxes
|
-
|
-
|
(135)
|
|
Income (Loss) from discontinued operations, net of
taxes
|
$-
|
$-
|
$182
|
NOTE 7 - GOODWILL AND INTANGIBLE ASSETS
Goodwill
The carrying value of goodwill at July 1, 2016 and June 26, 2015
was zero million and $16.1million, respectively. The goodwill
balances were principally generated from our acquisition of VSS
during fiscal 2016 (see Note 4), JMWA during fiscal 2015, GMI
during fiscal 2014, Charon during fiscal 2012, and PPS and Advent
during fiscal 2010. We had three reporting units at July 1, 2016.
The aggregate balance of goodwill decreased by $20.3 million at
July 1, 2016 and increased by 8.0 million at June 26, 2015,
respectively. In connection with the preparation of fiscal 2016
financial statements, management conducted a test of the
Company’s goodwill as of April 2, 2016 and July 1, 2016. A
roll forward of the carrying value of the Company’s goodwill
balance, by business segment, for fiscal 2016 and 2015 is as
follows (in thousands):
|
|
Goodwill Balances
|
|||
|
|
ECM
|
ESG
|
PSG
|
Total
|
|
Balance, June 27, 2014
|
$5,302
|
$2,771
|
$-
|
$8,073
|
|
JMWA Acquisition
|
1,920
|
1,631
|
4,442
|
7,993
|
|
Balance, June 26, 2015
|
$7,222
|
$4,402
|
$4,442
|
$16,066
|
|
VSS Acquisition
|
4,266
|
-
|
-
|
4,266
|
|
Impairment
|
(11,488)
|
(4,401)
|
(4,442)
|
(20,332)
|
|
Balance, July 1, 2016
|
$-
|
$-
|
$-
|
$-
|
The Company records goodwill in connection with the acquisition of
businesses when the purchase price exceeds the fair values of the
assets acquired and liabilities assumed. Generally, the most
significant intangible assets from the businesses that the Company
acquires are the assembled workforces, which includes the human
capital of the management, administrative, marketing and business
development, engineering and technical employees of the acquired
businesses. Since intangible assets for assembled workforces are
part of goodwill in accordance with the accounting standards for
business combinations, the substantial majority of the intangible
assets for recent business acquisitions are recognized as
goodwill.
During fiscal 2015, the Company changed the goodwill impairment
assessment date from the last day of the fiscal year to the first
day of the fourth quarter of the fiscal year, or March 28, 2015.
Management determined that performing the assessment prior to the
close of the fiscal year provided the external valuation firm, the
independent registered public accountants, and the Company with
sufficient time to generate, review, and conclude on the valuation
analysis results. At the close of each fiscal year, management
assessed whether there were any conditions present during the
fourth quarter that would indicate impairment subsequent to the
initial assessment date and concluded that no such conditions were
present.
The first step of the goodwill impairment analysis identifies
potential impairment and the second step measures the amount of
impairment loss to be recognized, if any. Step 2 is only performed
if Step 1 indicates potential impairment. Potential impairment is
identified by comparing the fair value of the reporting unit with
its carrying amount, including goodwill. The carrying amount of a
reporting unit equals assets (including goodwill) less liabilities
assigned to that reporting unit. The fair value of a reporting unit
is the price that would be received if the reporting unit was sold.
Value is based on the assumptions of market participants. Market
participants may be strategic acquirers, financial buyers, or both.
The assumptions of market participants do not include assumed
synergies which are unique to the parent company. Management, with
the assistance of an external valuation firm has estimated the fair
value of each reporting unit using the Guideline Public Company
(GPC) method under the market approach. Each of the GPC’s is
assumed to be a market participant. The valuation analysis
methodology adjusted the value of the reporting units by including
a premium for control, or MPAP. The MPAP reflects the capitalized
benefit of reducing the Company’s operating costs. These
costs are associated with a company’s public reporting
requirements. The adjustment assumes an acquirer could take a
company private and eliminate these costs. Based upon fiscal 2015
analysis, the estimated fair value of a company’s reporting
units exceeded the carrying value of their net assets and
therefore, management concluded that the goodwill was not
impaired.
During the third quarter of fiscal 2016, sustained delays in
contract awards and contract funding and the direct impact on the
Company’s results of operations, coupled with the continued
decrease in the Company’s stock price, and were deemed to be
triggering events that led to an interim period test for goodwill
impairment. As a result of our analysis, we recorded an impairment
charge of $15.9 million. The carrying value of goodwill after
impairment at April 1, 2016 was $4.4 million. The Company’s
remaining goodwill balance, after impairment, was derived from a
partial impairment the acquisition of JMWA acquired in fiscal 2015.
As a result of these charges, the carrying amount of goodwill
assets acquired from VSS, JMWA, GMI, Charron Consulting and PPS has
been reduced to zero, and the carrying amount of goodwill assets in
the Company’s ECM and PSG segment have been reduced to
zero.
During the fourth quarter of fiscal 2016, sustained delays in
contract awards and contract funding and the direct impact on the
Company’s results of operations, coupled with the continued
decrease in the Company’s stock price, and were deemed to be
triggering events that led to an updated test for goodwill
impairment. As a result of our analysis, we recorded an additional
impairment charge of $4.4 million. The carrying value of goodwill
after impairment at July 1, 2016 was zero. Based on the results of
the impairment testing, the Company concluded that the value of
definite-lived assets with a carrying value of $0.9 million was not
recoverable. The Company has recorded a charge of $0.3 million for
the impairment of definite-lived intangible assets acquired from
JMWA, a charge of $0.6 million for the impairment of definite-lived
intangible assets acquired from GMI. As a result of these charges,
the carrying amount of intangible assets acquired from JMWA and GMI
has been reduced to zero.
The carrying value of goodwill at June 26,
2015 was $16.1 million. The goodwill balance was principally
generated from the acquisition of GMI during fiscal 2014, the
fiscal 2012 acquisition of Charron, and the fiscal 2010
acquisitions of PPS and Advent. The Company had three reporting
units at June 26, 2015. The aggregate balance of goodwill declined
by $1.4 million at June 26, 2015. In connection with the
preparation of the fiscal 2014 financial statements, the Company
conducted a test of our goodwill as of June 26, 2015. The June 26,
2015 decline was due to an impairment charge of $1.4 million as a
result of a decline in the estimated fair value of the ECM
reporting unit. The June 26, 2015 impairment is attributable to
goodwill acquired from acquisitions prior to
2011.
Intangible Assets
In connection with the acquisitions of VSS, JMWA, GMI, Charron,
PPS, and Advent, the Company identified certain intangible assets.
These intangible assets were customer-related, marketing-related
and technology-related. A summary of the Company’s intangible
asset balances as of July 1, 2016 and June 26, 2015, as well as
their respective amortization periods, is as follows (in
thousands):
|
|
Gross Carrying Amount
|
Accumulated Amortization
|
Impairment Expense
|
Net Carrying Amount
|
Amortization Period
|
|
As of July 1, 2016
|
|
|
|
|
|
|
|
|
|
|
|
|
|
Customer-related
|
$12,409
|
$(2,407)
|
$(3,618)
|
$6,384
|
5-15 yrs
|
|
Marketing-related
|
1,084
|
(980)
|
(104)
|
-
|
2-7 yrs
|
|
Technology-related
|
841
|
(751)
|
(90)
|
-
|
7 yrs
|
|
Contractual-related
|
1,199
|
(514)
|
-
|
685
|
1.75 yrs
|
|
Non-competition-related
|
211
|
(32)
|
-
|
179
|
5 yrs
|
|
Total
|
$15,744
|
(4,684)
|
(3,812)
|
$7,248
|
|
|
|
Gross Carrying Amount
|
Accumulated Amortization
|
Impairment Expense
|
Net Carrying Amount
|
Amortization Period
|
|
As of June 26, 2015
|
|
|
|
|
|
|
|
|
|
|
|
|
|
Customer-related
|
$5,689
|
$(1,613)
|
$-
|
$4,076
|
5-15 yrs
|
|
Marketing-related
|
1,084
|
(698)
|
-
|
386
|
5-7 yrs
|
|
Technology-related
|
841
|
(660)
|
-
|
181
|
7 yrs
|
|
|
|
|
|
|
|
|
Total
|
$7,614
|
$(2,971)
|
$-
|
$4,643
|
|
Amortization expense for intangible assets was approximately $1.7
million, $1.1 million and $0.6 million for fiscal 2016, 2015, and
2014, respectively. The Company concluded that the value of
definite-lived intangible assets with a carrying value of $3.8
million was not recoverable. The Company has recorded a charge of
$3.8 million for the full impairment of definite-lived intangible
assets. As a result of these charges, the carrying amount of
intangible assets acquired from JMWA, GMI, Charron and PPS has been
reduced to zero, and the carrying amount of intangible assets in
the Company’s PSG and ESG segment have been reduced to
zero.
No intangible asset impairment charges were recorded during fiscal
2015 or 2014.
Expected future amortization expense in the fiscal years subsequent
to July 1, 2016 is as follows:
|
Years
|
|
Amounts
|
|
|
|
(in thousands)
|
|
2017
|
|
1,265
|
|
2018
|
|
579
|
|
2019
|
|
579
|
|
2020
|
|
579
|
|
2021
|
|
548
|
|
Thereafter
|
|
3,698
|
|
Total
|
|
$7,248
|
NOTE 8 - ACCOUNTS RECEIVABLE
Unbilled receivables represent amounts earned which have not yet
been billed and other amounts which can be invoiced upon completion
of fixed-price contract milestones, attainment of certain contract
objectives, or completion of federal and state governments’
incurred cost audits. Management anticipates that such unbilled
receivables will be substantially billed and collected in fiscal
2017; therefore, they have been presented as current assets in
accordance with industry practice. As part of concentration risk,
management continues to assess the impact of having the PBR
contracts within the ESG segment represent a significant portion
the outstanding receivable balance.
|
|
As of
|
|
|
|
July 1, 2016
|
June 26, 2015
|
|
|
(in thousands)
|
|
|
Billed receivables
|
|
|
|
U.S. Government
|
$7,531
|
$8,787
|
|
Commercial
|
11,159
|
8,074
|
|
Unbilled receivables
|
|
|
|
U.S. Government
|
20,883
|
40,769
|
|
Commercial
|
9,103
|
157
|
|
Total receivables
|
48,676
|
57,787
|
|
Allowance for doubtful accounts
|
(1,001)
|
(616)
|
|
Accounts receivable, net
|
$47,675
|
$57,171
|
NOTE 9 - CUSTOMER INFORMATION
A substantial portion of the Company’s revenue from
continuing operations is derived from contracts with the U.S.
Government as follows:
|
|
As of
|
||
|
|
July 1, 2016
|
June 26, 2015
|
June 27, 2014
|
|
|
|
(in thousands)
|
|
|
|
|
|
|
|
DoD
|
$116,062
|
$129,305
|
$86,039
|
|
U.S. EPA
|
4,583
|
6,457
|
1,593
|
|
Other US Government agencies
|
38,415
|
11,552
|
6,314
|
|
Total US Government
|
$159,060
|
$147,314
|
$93,946
|
A majority of the DOD work is related to the Company’s runway
repair project at DAFB, support of the reconstruction efforts in
Iraq and Afghanistan with the USAF and U.S. Army, and our PBR
contracts with AFCEC. Revenue of approximately $ 16.6 million for
fiscal 2016, $29 million for fiscal 2015, and $33 million for
fiscal 2014, was derived from the Company’s international
work for the U.S. Government, respectively.
NOTE 10 - PREPAID EXPENSES AND OTHER CURRENT ASSETS
Prepaid expenses and other current assets include the
following:
|
|
As of
|
|
|
|
July 1, 2016
|
June 26, 2015
|
|
|
(in thousands)
|
|
|
|
|
|
|
Prepaid insurance
|
$18
|
$295
|
|
Prepaid rent
|
48
|
113
|
|
Other prepaid expenses
|
457
|
474
|
|
Collateralized Cash
|
472
|
-
|
|
Miscellaneous receivables
|
12
|
658
|
|
Total
|
$1,007
|
$1,540
|
Other prepaid expenses include maintenance agreements, licensing,
subscriptions, and miscellaneous receivables from employees and a
service provider. The collateralized cash amount is related to a
bid bond the Company issued.
NOTE 11 – INVENTORY
The Company’s inventory balance includes the
following:
|
|
As of
|
|
|
|
July 1, 2016
|
June 26, 2015
|
|
|
(in thousands)
|
|
|
Raw Materials
|
$132
|
$722
|
|
Finished Goods
|
94
|
400
|
|
Work-in-process
|
7
|
152
|
|
Reserve
|
(12)
|
(86)
|
|
Total
|
$221
|
$1,188
|
During the fourth quarter of fiscal 2016, the Company recorded a
$0.6 million charge to write-down certain PPS assets, primarily
inventory, to their estimated net realizable value as of July 1,
2016. This amount is recorded as Other Expense (Income) in the
financial statements.
NOTE 12 - PROPERTY AND EQUIPMENT
|
|
|
As of
|
|
|
Description
|
Useful life
|
July 1, 2016
|
June 26, 2015
|
|
|
|
(in thousands)
|
|
|
Furniture and fixtures
|
8
|
$640
|
$1,274
|
|
Equipment
|
3 to 10
|
4,446
|
6,330
|
|
Capital leases
|
Life of lease
|
565
|
565
|
|
Leasehold improvements
|
(a)
|
684
|
1,435
|
|
Property and equipment, gross
|
|
$6,335
|
$9,604
|
|
Accumulated depreciation
|
|
(5,007)
|
(7,520)
|
|
Property and equipment, net
|
|
$1,328
|
$2,084
|
(a) The useful life is the shorter of lease term or the life
of the asset.
Depreciation of property and equipment was approximately $1.3
million and $1.5 million, for the fiscal years 2016 and 2015,
respectively.
Maintenance and repair expense approximated $0.1 million for the
fiscal years 2016, 2015, and 2014 respectively.
NOTE 13 - DEBT
Notes Payable
As part of the purchase price for JMWA in July 2014, the Company
agreed to pay the three JMWA stockholders with an aggregate
principal balance of up to $6.0 million, which are payable
quarterly over a four and a half-year period with interest accruing
at a rate of 5% per year. Accrued interest is recorded within the
note payable line item in the consolidated balance sheet. As of
July 1, 2016, the outstanding principal balance of the JMWA
shareholders was $3.9 million.
On October 3, 2016 the Company did not make the quarterly principal
payments to three individuals who were the former owners of JMWA.
However, the Company continued to make monthly interest payments
through the end of calendar year 2016 at an increased interest rate
(seven percent per annum, rather than five percent per annum). On
November 21, 2016, two of the former JMWA shareholders filed an
action against the Company in Fairfax County District Court, VA for
failure to make such payments and to enforce their rights to such
payments. During the second quarter of fiscal 2017, the Company has
moved the long term portion of the debt to short term notes payable
for a total of $3.5 million. The Company is defending the lawsuit
on legal grounds. Starting January 2017 the Company stopped making
the interest only payments to two of the former owners and
continues to make the monthly interest only payment at seven
percent per annum to one owner.
On September 30, 2015, the Company, together with certain of
its domestic subsidiaries acting as guarantors, entered into a Loan
Agreement with the Lender and letter of credit issuer for a
revolving credit facility in the amount of $25.0 million, $14.6
million of which was drawn on the date of closing, and a term
facility in the amount of $5.0 million, which was fully drawn on
the date of closing.
The maturity date of the revolving credit
facility is September 30, 2018 and the maturity date of the
term facility is March 31, 2017. The principal amount of the
term facility amortizes in quarterly installments equal to $0.8
million with no penalty for prepayment. Interest accrues on the
revolving credit facility and the term facility at a rate per year
equal to the LIBOR Daily Floating Rate (as defined in the Loan
Agreement) plus 1.95% and was payable in arrears on
December 31, 2015 and on the last day of each quarter
thereafter. Obligations under the Loan Agreement are guaranteed
unconditionally and on a joint and several basis by the Guarantors
and secured by substantially all of the assets of Versar and the
Guarantors. The Loan Agreement contains customary affirmative and
negative covenants and during fiscal year 2016 contained financial
covenants related to the maintenance of a Consolidated Total
Leverage Ratio, Consolidated Senior Leverage Ratio, Consolidated
Fixed Charge Coverage Ratio and a Consolidated Asset Coverage
Ratio. On December 9, 2016 Versar, together with certain of its
domestic subsidiaries acting as guarantors, entered into an
Amendment to the Loan Agreement dated September 30, 2015 with the
Lender removing these covenants and adding a covenant
requiring Versar to maintain certain minimum quarterly consolidated
EBITDA amounts.
The proceeds of the term facility and borrowings under the
revolving credit facility were used to repay amounts outstanding
under the Company’s Third Amended and Restated Loan and
Security Agreement with United Bank and to pay a portion the
purchase price for the acquisition of VSS.
As of July 1, 2016, the Company’s outstanding principal debt
balance was $6.4 million comprised of the Bank of America facility
term loan balance of $2.5 million, and JMWA Note balance of $3.8
million. The following maturity schedule presents all outstanding
debt as of July 1, 2016.
|
Fiscal Years
|
Amounts
|
|
|
(in thousands)
|
|
2017
|
$3,831
|
|
2018
|
1,399
|
|
2019
|
1,095
|
|
Total
|
$6,325
|
On January 1, 2017 the Company did not make $0.1 million in
periodic payment to three individuals who participate in a Deferred
Compensation Agreement plan established by the Company in 1988. The
Company continues to negotiate with the individuals to reschedule
the payments for a future period.
Line of Credit
As noted above, the Company had a $25.0 million revolving line
of credit facility pursuant to the Loan Agreement with the Lender.
The revolving credit facility is scheduled to mature on
September 30, 2018. The Company had $14.8 million
outstanding under its line of credit for the fiscal year ended July
1, 2016. On December 9, 2016 Versar, together with certain of its
domestic subsidiaries acting as guarantors, entered into an
Amendment to the Loan Agreement dated September 30, 2015 with the
Lender. The Company now has a $13.0 million revolving line of
credit facility. The Company has $10.3 million outstanding under
its line of credit for the six months ended December 30,
2016.
The Company has elected to adopt ASU No. 2015-13 to simplify the
presentation of debt issuance costs for the fiscal year ended July
1, 2016. $0.2 million of remaining unamortized cost associated with
the Loan Agreement as of July 1, 2016 is therefore no longer
presented as a separate asset - deferred charge on the consolidated
balance sheet, and instead reclassified as a direct deduction from
the carrying value of the line of credit.
Debt Covenants
During the third and fourth quarters of fiscal 2016, following
discussion with the Lender, the Company determined that it was not
in compliance with the Consolidated Total Leverage Ratio covenant
for the fiscal quarters ended January 1, 2016, and April 1,
2016, the Consolidated Total Leverage Ratio covenant, Consolidated
Senior Leverage Ratio covenant and the Asset Coverage Ratio
covenant for the fiscal quarter ended April 1, 2016, which defaults
continued as of July 1, 2016. Each failure to comply with
these covenants constitutes a default under the Loan Agreement. On
May 12, 2016, the Company, certain of its subsidiaries and the
Lender entered into a Forbearance Agreement pursuant to which the
Lender agreed to forbear from exercising any and all rights or
remedies available to it under the Loan Agreement and applicable
law related to these defaults for a period ending on the earliest
to occur of: (a) a breach by the Company of any obligation or
covenant under the Forbearance Agreement, (b) any other default or
event of default under the Loan Agreement or (c) June 1, 2016 (the
Forbearance Period).
The Forbearance Period was subsequently
extended by additional Forbearance Agreements between the Company
and the Lender, through December 9, 2016. During the
Forbearance Period, the Company was allowed to borrow funds
pursuant to the terms of the Loan Agreement, consistent with
current Company needs as set forth in a required 13-week cash flow
forecast and subject to certain caps on revolving borrowings
initially of $15.5 million and reducing to $13.5 million. In
addition, the Forbearance Agreements provided that from and after
June 30, 2016 outstanding amounts under the credit facility will
bear interest at the default interest rate equal to the LIBOR Daily
Floating Rate (as defined in the Loan Agreement) plus 3.95%,
required that the Company provide a 13 week cash flow forecast
updated on a weekly basis to the Lender, and waives any provisions
prohibiting the financing of insurance premiums for policies
covering the period of July 1, 2016 to June 30, 2017 in the
ordinary course of the Company’s business and in amounts
consistent with past practices. On December 9, 2016 Versar,
together with certain of its domestic subsidiaries acting as
guarantors, entered into an Amendment to the Loan Agreement dated
September 30, 2015 with the Lender, among other things, eliminating
the events of default and amending the due date of the loan
agreement to September 30, 2017. The Lender has engaged an
advisor to review the Company’s financial condition on the
Lender’s behalf, and pursuant to the Forbearance Agreements
and the Amendment, requires the
Company to pursue alternative sources of funding for its ongoing
business operations. If the Company is unable to raise
additional financing, the Company will need to adjust its
operational plans so that the Company can continue to operate with
its existing cash resources. The actual amount of funds that the
Company will need will be determined by many factors, some of which
are beyond its control and the Company may need funds sooner than
currently anticipated.
As of
the fiscal 2017 quarter ended December 30, 2016, we are in
compliance with all covenants under the Amendment to the Loan
Agreement.
NOTE 14 - OTHER CURRENT LIABILITIES
Other current liabilities include the following:
|
|
As of
|
|
|
|
July 1, 2016
|
June 26, 2015
|
|
|
|
|
|
Project related reserves
|
$867
|
$57
|
|
Payroll related
|
110
|
221
|
|
Deferred rent
|
330
|
63
|
|
Earn-out obligations
|
1,577
|
-
|
|
Severance accrual
|
96
|
16
|
|
Acquired capital lease liability
|
97
|
176
|
|
Warranty Reserve
|
302
|
-
|
|
ARA Reserve
|
1,200
|
-
|
|
PPS Reserve
|
1,314
|
-
|
|
Other
|
1,831
|
581
|
|
Total
|
$7,724
|
$1,114
|
Other accrued and miscellaneous liabilities include accrued legal,
audit, VAT tax liability, foreign entity obligations, and other
miscellaneous items.
NOTE 15 – LEASE LOSS LIABILITIES
In March 2016, the Company abandoned its field office facilities in
Charleston, SC and Lynchburg, VA, within the ESG and ECM segments,
respectively. Although the Company remains obligated under the
terms of these leases for the rent and other costs associated with
these leases, the Company made the decision to cease using these
spaces on April 1, 2016, and has no foreseeable plans to occupy
them in the future. Therefore, the Company recorded a charge to
selling, general and administrative expenses of approximately $0.4
million to recognize the costs of exiting these spaces. The
liability is equal to the total amount of rent and other direct
costs for the period of time the space is expected to remain
unoccupied plus the present value of the amount by which the rent
paid by the Company to the landlord exceeds any rent paid to the
Company by a tenant under a sublease over the remainder of the
lease terms, which expire in April 2019 for Charleston, SC, and
June 2020 for Lynchburg, VA. The Company also recognized $0.1
million of costs for the associated leasehold improvements related
to the Lynchburg, VA office.
In June 2016, the Company abandoned its field office facilities in
San Antonio, TX within the ECM segment. Although the Company
remains obligated under the terms of the lease for the rent and
other costs associated with the lease, the Company made the
decision to cease using this space on July 1, 2016, and has no
foreseeable plans to occupy it in the future. Therefore, the
Company recorded a charge to selling, general and administrative
expenses of approximately $0.2 million to recognize the costs of
exiting this space. The liability is equal to the total amount of
rent and other direct costs for the period of time the space is
expected to remain unoccupied plus the present value of the amount
by which the rent paid by the Company to the landlord exceeds any
rent paid to the Company by a tenant under a sublease over the
remainder of the lease terms, which expires in February 2019. The
Company also recognized $0.2 million of costs for the associated
leasehold improvements related to the San Antonio, TX
office.
The following table summarizes information related to our accrued
lease loss liabilities at July 1, 2016 and June 26,
2015.
|
|
As of
|
As of
|
|
|
July 1, 2016
|
June 26, 2015
|
|
|
(in thousands)
|
(in thousands)
|
|
Lease loss accruals
|
$718
|
$-
|
|
Rent payments
|
(20)
|
-
|
|
Balance
|
$698
|
$-
|
NOTE 16 – SHARE-BASED COMPENSATION
In November 2010, the stockholders approved the Versar, Inc. 2010
Stock Incentive Plan (the “2010 Plan”), under which the
Company may grant incentive awards to directors, officers, and
employees of the Company and its affiliates and to service
providers to the Company and its affiliates. One million shares of
Versar common stock were reserved for issuance under the 2010 Plan.
The 2010 Plan is administered by the Compensation Committee of the
Board of Directors. Through July 1, 2016, a total of 551,369
restricted stock units have been issued under the 2010 Plan. As of
July 1, 2016, there are 448,631 shares remaining available for
future issuance of awards (including restricted stock units) under
the 2010 Plan.
During the twelve month period ended July 1, 2016, the Company
awarded 209,500 restricted stock units to certain employees, which
generally vest over a two-year period following the date of grant.
The grant date fair value of these awards is approximately $0.6
million. The total unrecognized compensation cost, measured on the
grant date, that relates to 130,948 non-vested restricted stock
awards at July 1, 2016, was approximately $0.4 million, which if
earned, will be recognized over the weighted average remaining
service period of two years. Share-based compensation expense
relating to all outstanding restricted stock unit awards totaled
approximately $0.4 million and $0.4 million for the year ended July
1, 2016 and June 26, 2015, respectively. These expenses were
included in the direct costs of services and overhead and general
and administrative lines of the Company’s Condensed
Consolidated Statements of Operations. There were no stock options
outstanding and exercisable as of July 1, 2016. 20,000 stock
options were exercised during fiscal year 2014, with an intrinsic
value of approximately $0.1 million.
Exercisable qualified stock options outstanding at July 1, 2016 are
as follows:
|
|
Option Shares
|
Weighted Average Option Price Per Share
|
Total
|
|
|
(in thousands, except share price)
|
||
|
Outstanding at June 27, 2014
|
14
|
$3.99
|
$57
|
|
Exercised
|
-
|
-
|
-
|
|
Cancelled
|
(14)
|
3.99
|
(57)
|
|
Outstanding at June 26, 2015
|
-
|
-
|
-
|
|
Exercised
|
-
|
-
|
-
|
|
Cancelled
|
-
|
-
|
-
|
|
|
|
|
|
|
Outstanding at July 1, 2016
|
-
|
$-
|
$-
|
|
|
|
|
|
NOTE 17 - INCOME TAXES
The Company regularly reviews the recoverability of its deferred
tax assets and establishes a valuation allowance as deemed
appropriate. The Company established a full valuation allowance
against its U.S. deferred tax assets at July 1, 2016 of $12.9
million as it determined they were not more likely than not to
realize the deferred tax assets due to current year losses and
projections for the near future. The company also maintained full
valuation allowances on the Philippine and UK branches of $0.1
million and $0.9 million, respectively. The deferred tax assets in
the foreign jurisdictions are related primarily to net operating
loss carryforwards, as these jurisdictions have a history of losses
and it is not more likely than not that the deferred tax assets
will be realized. The valuation allowance at the end of fiscal 2015
was $0.8 million to offset the deferred tax asset from the
Philippine branch operations, PPS, and for the U.S capital losses
not more likely than not to be realized in the future.
At July 1, 2016, the Company has net operating loss carryforwards
in the Philippines branch of approximately $0.1 million ($0.2
million gross), PPS $1.0 million ($5.4 million gross) and $0.4
million ($1.1 million gross) from the acquisition of Geo-Marine,
Inc. In addition, they had $0.1 million of R&D credits carry
forward.
Pretax income (loss) is comprised of the following:
|
|
For the Fiscal Year Ended
|
||
|
|
July 1, 2016
|
June 26, 2015
|
June 27, 2014
|
|
|
(in thousands)
|
||
|
|
|
|
|
|
US Entities
|
$(39,395)
|
1,675
|
150
|
|
Foreign Entities
|
2,775
|
669
|
(1,709)
|
|
Total continuing operations
|
(36,620)
|
2,343
|
(1,559)
|
|
Discontinued operations
|
-
|
-
|
317
|
|
Total pretax (loss) income
|
$(36,620)
|
2,343
|
(1,244)
|
Income tax expense (benefit) for continuing operations is as
follows:
|
|
For the Fiscal Year Ended
|
||
|
|
July 1, 2016
|
June 26, 2015
|
June 27, 2014
|
|
|
(in thousands)
|
||
|
Current
|
|
|
|
|
Federal
|
$(459)
|
$(254)
|
$(130)
|
|
State
|
2
|
182
|
(86)
|
|
Foreign
|
-
|
-
|
1
|
|
|
|
|
|
|
Deferred
|
|
|
|
|
Federal
|
(10,033)
|
873
|
(819)
|
|
State
|
(1,981)
|
133
|
(9)
|
|
Foreign
|
-
|
(159)
|
(429)
|
|
Change in Valuation allowance
|
13,738
|
-
|
429
|
|
|
|
|
|
|
Income tax (benefit) expenses, continued operations
|
$1,267
|
$936
|
$(1,043)
|
|
Income tax benefit, current from discontinued
operations
|
-
|
-
|
(189)
|
|
Income tax benefit, deferred from discontinued
operations
|
-
|
-
|
324
|
|
Income tax (benefit) expenses
|
$1,267
|
$936
|
$(908)
|
Deferred tax assets (liabilities) are comprised of the following as
of the dates indicated below:
|
|
For the Fiscal Year Ended
|
|
|
|
July 1, 2016
|
June 26, 2015
|
|
|
(in thousands)
|
|
|
|
|
|
|
Deferred Tax Assets
|
|
|
|
Employee benefits
|
$283
|
$329
|
|
Bad debt reserves
|
382
|
229
|
|
All other reserves
|
1,174
|
653
|
|
Net operating losses and tax credit
|
4,969
|
1,222
|
|
Capital loss carryforward
|
-
|
108
|
|
Accrued expenses
|
435
|
446
|
|
Depreciation and amortization
|
7,430
|
831
|
|
Other
|
239
|
1
|
|
Total deferred tax
assets
|
$14,912
|
$3,819
|
|
|
|
|
|
Valuation Allowance
|
$(14,781)
|
$(756)
|
|
|
|
|
|
Deferred Tax Liabilities
|
|
|
|
Goodwill and intangibles
|
$(70)
|
$(900)
|
|
Depreciation and amortization
|
(28)
|
(307)
|
|
Other
|
(33)
|
(76)
|
|
Net deferred tax assets
|
$-
|
$1,780
|
In accordance with FASB’s guidance regarding uncertain tax
positions, the Company recognizes income tax benefits in its
financial statements only when it is more likely than not that the
tax positions creating those benefits will be sustained by the
taxing authorities based on the technical merits of those tax
positions. At July 1, 2016 the Company did not have any uncertain
tax positions. The Company’s 2011-2015 tax years remain open
to audit in most jurisdictions.
The Company’s policy is to recognize interest expense and
penalties as a component of general and administrative
expenses.
The provision for income taxes compared with income taxes based on
the federal statutory tax rate of 34% follows (in
thousands):
|
|
For the Fiscal Year Ended
|
|
|
|
|
July 1, 2016
|
June 26, 2015
|
June 27, 2014
|
|
|
(in thousands)
|
||
|
United States Federal tax at statutory rate
|
$(12,004)
|
$796
|
$(530)
|
|
State taxes (net of federal benefit)
|
(1,686)
|
160
|
(49)
|
|
Permanent items
|
12
|
22
|
(340)
|
|
Goodwill Impairment
|
1,194
|
-
|
-
|
|
Change in tax rates
|
(44)
|
(7)
|
21
|
|
Tax Credits
|
-
|
-
|
(28)
|
|
Change in valuation allowance
|
13,738
|
0
|
(1)
|
|
Other
|
57
|
(35)
|
(115)
|
|
Income tax (benefit) expense from continuing
operations
|
$1,267
|
$936
|
$(1,043)
|
|
Income tax benefit, current discontinued operations
|
-
|
-
|
(189)
|
|
Income tax benefit, deferred discontinued operations
|
-
|
-
|
324
|
|
Total income tax (benefit) expense
|
$1,267
|
$936
|
$(908)
|
NOTE 18 - EMPLOYEE SAVINGS AND STOCK OWNERSHIP PLAN
The Company continues to maintain the Versar, Inc. 401(k) Plan
(“401(k) Plan”), which permits voluntary participation
upon employment. The 401(k) Plan was adopted in accordance with
Section 401(k) of the Internal Revenue Code.
Under the 401(k) Plan, participants may elect to defer up to 50% of
their salary through contributions to the plan, which are invested
in selected mutual funds. The Company matches 100% of the first 3%
and 50% of the next 2% of the employee-qualified contributions for
a total match of 4%. The employer contribution is made in the
Company’s cash. In fiscal years 2015, 2014, and 2013 the
Company made cash contributions of $1.0 million. All contributions
to the 401(k) Plan vest immediately.
In January 2005, the Company established an Employee Stock Purchase
Plan (“ESPP”) under Section 423 of the United States
Internal Revenue Code. The ESPP was amended and restated in
November 2014, for an extended term expiring July 31, 2024. The
ESPP allows eligible employees of the Company and its designated
affiliates to purchase, through payroll deductions, shares of
common stock of the Company from the open market. The Company will
not reserve shares of authorized but unissued common stock for
issuance under the ESPP. Instead, a designated broker will purchase
shares for participants on the open market. Eligible employees may
purchase the shares at a discounted rate equal to 95% of the
closing price of the Company’s shares on the NYSE MKT on the
purchase date.
NOTE 19 – COMMITMENTS AND CONTINGENCIES
Lease Obligations
The Company leases approximately 213,000 square feet of office
space, as well as data processing and other equipment under
agreements expiring through 2021. Minimum future obligations under
operating and capital leases are as follows:
|
Fiscal Year Ended
|
Total Amount
|
|
|
|
|
2017
|
$2,948
|
|
2018
|
2,968
|
|
2019
|
2,701
|
|
2020
|
2,023
|
|
2021
|
1,792
|
|
Thereafter
|
1,554
|
|
Total
|
$13,986
|
Certain of the lease payments are subject to adjustment for
increases in utility costs and real estate taxes. Total office
rental expense approximated $2.9 million, $3.2 million, and $2.6
million, for fiscal years 2016, 2015, and 2014, respectively. Lease
concessions and other tenant allowances are amortized over the life
of the lease on a straight line basis. For leases with fixed rent
escalations, the total lease costs including the fixed rent
escalations are totaled and the total rent cost is recognized on a
straight line basis over the life of the lease.
Disallowed Costs
Versar has a substantial number of U.S. Government contracts, and
certain of these contracts are cost reimbursable. Costs incurred on
these contracts are subject to audit by the Defense Contract Audit
Agency (“DCAA”). All fiscal years through 2010 have
been audited and closed. Management believes that the effect of
disallowed costs, if any, for the periods not yet audited and
settled with DCAA will not have a material adverse effect on the
Company’s Consolidated Balance Sheets or Consolidated
Statements of Operations. The Company accrues a liability from the
DCAA audits if needed. As of both July 1, 2016 and June 26, 2015,
the accrued liability for such matters was immaterial.
Legal Proceedings
Versar and its subsidiaries are parties from time to time to
various legal actions arising in the normal course of business. The
Company believes that any ultimate unfavorable resolution of any
currently ongoing legal actions will not have a material adverse
effect on its consolidated financial condition and results of
operations.
NOTE 20 – SUBSEQUENT EVENT(S)
On September 30, 2016, Versar filed a Form 12b-25 with the SEC
indicating that the Company was delaying the filing of its Annual
Report on Form 10-K for the year ended July 1, 2016. On October 13,
2016, the Company notified the Exchange that the Form 10-K would be
delayed beyond the extended filing period afforded by Rule
12b-25.
On October 17, 2016 the Company received a letter from the Exchange
in which the Exchange determined that the Company was not in
compliance with Sections 134 and 1101 of the Exchange’s
Company Guide (the Company Guide) due to the Company’s
failure to timely file its Annual Report on Form 10-K with the SEC
for the year ended July 1, 2016. The letter also stated that this
failure was a material violation of the Company’s listing
agreement with the Exchange and unless the Company took prompt
corrective action, the Exchange may suspend and remove the
Company’s securities from the Exchange. The Exchange also
informed the Company that it must submit a plan by November 16,
2016 advising the Exchange of actions the Company has taken or will
take to regain compliance with the Company Guide by January 17,
2017. If the Exchange accepted the plan, the Company would be
subject to periodic monitoring for compliance. If the Company
failed to submit a plan, or if the submitted plan was not accepted
by the Exchange, delisting proceedings would commence. Furthermore,
if the plan was accepted, but the Company was not in compliance
with the Company Guide by January 17, 2017, or if the Company does
not make progress consistent with the plan, the Exchange may
initiate delisting proceedings.
On November 14, 2016, Versar filed a Form 12b-25 with the SEC
indicating that the Company was delaying the filing of its
Quarterly Report on Form 10-Q for the three months ended September
30, 2016.
On December 15, 2016, the Company received a letter from the
Exchange indicating that the Exchange has accepted the
Company’s plan and extension request and granted the Company
an extended plan period through May 31, 2017 to restore compliance
under the Company Guide. The staff of the Exchange will review the
Company periodically for compliance with the initiatives outlined
in its plan. If the Company is not in compliance with the continued
listing standards by May 31, 2017 or if the Company does not make
progress consistent with the plan during the plan period, the
Exchange staff has indicated that it would initiate delisting
proceedings as appropriate.
On February 13, 2017, Versar filed a Form 12b-25 with the SEC
indicating that the Company was delaying the filing of its
Quarterly Report on Form 10-Q for the six months ended December 30,
2016.
The Company intends to file the delinquent documents to satisfy the
timeline outlined by the Exchange discussed above.
In September 2016, the Company entered into a contract with the
Army Reserve to provide staff augmentation services. Management
expects this contract to operate at a loss. During September, the
Company recorded a loss of $0.6 million related to this contract
for the base period of nine months. The Army Reserve exercised its
option to extend the contract for an additional year effective
April 1, 2017. Management expects this extension to also operate at
a loss and intends to record a charge of $1.1 million during its
fiscal fourth quarter of 2017.
Subsequent events have been evaluated through March 27, 2017 which
is the date the financial statements were available to be issued.
Management did not identify any events requiring recording or
disclosure in the financial statements for the year ended July 1,
2016, except those described above.
Item 9. Changes in and Disagreements with Accountants on Accounting
and Financial Disclosure
None.
Item 9A. Controls and Procedures
Disclosure Controls and Procedures
Evaluation of the effectiveness of the design and operation of the
Company’s “disclosure controls and procedures”
(as defined in Rule 13a-15(e) under the Securities Exchange Act of
1934, as amended (the Exchange Act)) was carried out as of July 1,
2016, the last day of the fiscal period covered by this report.
This evaluation was made by the Company’s Chief Executive
Officer and Chief Financial Officer. Based upon this evaluation,
the Company’s Chief Executive Officer and Chief Financial
Officer have concluded that, as a result of the material weakness
in internal control over financial reporting discussed below, the
Company’s disclosure controls and procedures (a) are not
effective to ensure that information required to be disclosed by
the Company in reports filed or submitted under the Exchange Act is
timely recorded, processed, summarized and reported and (b) do not
fully include controls and procedures designed to ensure that
information required to be disclosed by the Company in reports
filed or submitted under the Exchange Act is accumulated and
communicated to the Company’s management, including its Chief
Executive Officer and Chief Financial Officer, as appropriate to
allow timely decisions regarding required disclosure.
Management’s Annual Report on Internal Control over Financial
Reporting
Management is responsible for establishing and maintaining adequate
internal control over financial reporting for the Company. Internal
control over financial reporting is defined in Rule 13a-15(f) and
15d-15(f) promulgated under the Exchange Act as a process designed
by, or under the supervision of, the Company’s principal
executive and principal financial officers and effected by the
Company’s board of directors, management and other personnel,
to provide reasonable assurance regarding the reliability of
financial reporting and the preparation of financial statements for
external purposes in accordance with generally accepted accounting
principles and includes those policies and procedures
that:
●
Pertain to the maintenance of records that in reasonable detail
accurately and fairly reflect the transactions and dispositions of
the assets of the Company;
●
Provide reasonable assurance that transactions are recorded as
necessary to permit preparation of financial statements in
accordance with generally accepted accounting principles, and that
receipts and expenditures of the Company are being made only in
accordance with authorizations of management and directors of the
Company; and
●
Provide reasonable assurance regarding prevention or timely
detection of unauthorized acquisition, use or disposition of the
Company’s assets that could have a material effect on the
financial statements.
Because of its inherent limitations, internal control over
financial reporting may not prevent or detect misstatements.
Projections of any evaluation of effectiveness to future periods
are subject to the risk that controls may become inadequate because
of changes in conditions, or that the degree of compliance with the
policies or procedures may deteriorate.
Internal control over financial reporting cannot provide absolute
assurance of achieving financial reporting objectives because of
its inherent limitations. Internal control over financial reporting
is a process that involves human diligence and compliance and is
subject to lapses in judgment and breakdowns resulting from human
failure. Internal control over financial reporting can also be
circumvented by collusion or improper management override. Because
of such limitations, there is a risk that material misstatements
may not be prevented or detected on a timely basis by internal
control over financial reporting. However, these inherent
limitations are known features of the financial reporting process.
Therefore, it is possible to design into the process safeguards to
reduce, though not eliminate, this risk.
The Company’s management, including the Chief Executive
Officer and Chief Financial Officer, assessed the effectiveness of
the Company’s internal control over financial reporting as of
July 1, 2016. In making this assessment, the Company’s
management used the criteria set forth by the Committee of
Sponsoring Organizations of the Treadway Commission’s
Internal Control-Integrated Framework (2013
Framework).
Based on our assessment and as a result of the material weakness in
internal control over financial reporting discussed below,
management has concluded that, as of July 1, 2016, the
Company’s internal control over financial reporting was not
effective based on those criteria.
Material Weakness in Internal Control Over Financial
Reporting
As previously reported, during the third quarter of fiscal 2016,
after consultation with the Company’s independent auditors,
management of the Company concluded that due to sustained delay in
contract awards and contract funding and the direct impact on the
Company’s results of operations, coupled with the continued
decrease in the Company’s stock price, the goodwill in the
Company’s ECM and PSG segments was impaired and recognized
impairment charges of $18.8 million. Management then concluded that
a material weakness existed as a result of management not
recognizing that the third quarter results could have accelerated
the triggering event with regard to undertaking Step 1 of the
impairment analysis, rather than following its normal practice of
conducting such an analysis during the Company’s fourth
quarter. The Company did not maintain sufficient resources to
provide the appropriate level of accounting knowledge and
experience regarding certain complex, non-routine transactions and
technical accounting matters and lacked adequate controls regarding
training in the relevant accounting guidance, review and
documentation of such transactions, such as identifying the
triggering factors for an impairment analysis, in accordance with
GAAP. A material weakness is a deficiency, or combination of
deficiencies in internal controls over financial reporting that
results in a reasonable possibility that a material misstatement of
our annual or interim financial statements will not be prevented or
detected on a timely basis. To address this weakness, the Company
has developed a remediation plan, which includes retaining an
independent accounting firm to provide expert advice to identify
and account for non-routine, complex transactions and facilitate
resolution of such issues. While the Company has developed and is
implementing these substantive procedures, the material weakness
will not be considered remediated until these improvements have
been fully implemented, tested and are operating effectively for an
adequate period of time. As a result, management concluded that as
of July 1, 2016, sufficient time had not occurred since remediation
efforts commenced for the material weakness to be fully remediated
and thus a material weakness continued to exist at such date.
Therefore, the Company did not have effective internal control over
financial reporting and therefore did not have effective disclosure
controls and procedures.
Attestation Report of the Independent Registered Public Accounting
Firm
This Annual Report does not include an attestation report of the
Company’s independent registered public accounting firm
regarding internal control over financial reporting. Internal
control over financial reporting was not subject to attestation by
the Company’s independent registered public accounting firm
pursuant to a permanent exemption granted under Section 989G of the
Dodd-Frank Wall Street Reform and Consumer Protection Act for
smaller reporting companies that permits the Company to provide
only management’s report in this Annual Report.
Changes in Internal Control over Financial Reporting
An independent accounting firm was retained to provide expert
advice to identify and account for non-routine, complex
transactions and facilitate resolution of such issues and the
Company implemented the remediation plan discussed above. There
were no other changes made to the Company’s internal control
over financial reporting identified in connection with the
evaluation of such internal control that occurred during the
Company’s fourth quarter of fiscal 2016 that have materially
affected, or are reasonably likely to materially affect, the
Company’s internal control over financial
reporting.
Item 9B. Other Information
None.
PART III
Item 10. Directors, Executive Officers and Corporate
Governance
|
NAME
|
|
SERVED AS DIRECTOR
|
|
|
|
|
|
Robert L. Durfee, Ph.D
|
|
1969 to the present
|
|
|
|
|
|
|
Co-founder of the
Company; Executive Vice President of the Company from 1986 to June
2004; President of GEOMET Technologies, LLC, a subsidiary of the
Company, from 1991 to June 2004. Age 81.
Dr.
Durfee is a highly experienced executive. His prior roles at
Versar, including as one of the Company’s founders and as
President of a subsidiary GEOMET Technologies, LLC, give him unique
insight into the Company’s businesses, particularly those
aspects of environmental compliance, munitions disposal and control
of hazardous or toxic materials.
|
|
|
|
|
|
|
|
|
|
|
James L. Gallagher
|
|
2000 to the present
|
|
|
|
|
|
|
President,
Gallagher Consulting Group since September 1999; President of
Westinghouse Government and Environmental Services from 1996 to
1999; Executive Vice President of Westinghouse Government and
Environmental Services from 1994 to 1996; Vice President and
General Manager of Westinghouse Government, Operations Business
Unit from 1992 to 1994. Age 80.
Mr.
Gallagher served as a highly experienced executive of a leading
environmental and energy unit of a Fortune 500 company. With his
significant financial, business, operations and contracting
background, Mr. Gallagher has provided expert leadership to the
Board’s Audit Committee. His experience in construction
management and outsourcing of large government facilities is
important to two of the Company’s core businesses. As a
former consultant to the U.S. Department of Energy, Mr. Gallagher
is able to provide knowledge of markets and client needs in the
energy sector.
|
|
|
|
|
|
|
|
|
|
|
Amoretta M. Hoeber
|
|
2000 to the present
|
|
|
|
|
|
|
President, AMH
Consulting since 1992; Director, Strategic Planning of TRW Federal
Systems Group and TRW Environmental Safety Systems, Inc. from 1986
to 1992; Deputy Under Secretary, U.S. Army from 1984 to 1986;
Principal Deputy Assistant Secretary, U.S. Army from 1981 to 1984.
Age 74.
Ms.
Hoeber’s experience in government contracting, strategic
planning and business development brings a unique perspective to
the core Versar businesses as well as an understanding of the
strategic planning process to advise Versar as it develops its key
business competencies. Her extensive network and membership in
several key U.S. government advisory boards also give her insight
into the needs and priorities of Versar’s biggest client
group, the U.S. government, specifically the U.S. Department of
Defense.
|
|
|
NAME
|
|
SERVED AS DIRECTOR
|
|
|
|
|
|
Paul J. Hoeper
|
|
2001 to the present
|
|
|
|
|
|
|
Business
consultant since February 2001; Assistant Secretary of the Army for
Acquisition, Logistics and Technology from May 1998 to January
2001; Deputy Under Secretary of Defense, International and
Commercial Programs, from March 1996 to May 1998; President of
Fortune Financial from 1994 to January 1996. Age 71.
Mr.
Hoeper’s experience as a merchant banker and senior
Department of Defense official, plus his service as a director of
several public companies, provide organizational, financial and
business experience to the Board. Since leaving the government, Mr.
Hoeper has been an active participant and presenter at conferences
focusing on general corporate governance and the specific
governance needs of companies, like Versar, that focus on
government contracts. Mr. Hoeper’s participation in various
government advisory groups and institutions enhances his leadership
of the Board and enables him to contribute in a meaningful way to
the strategic and risk management tasks of the Board.
|
|
|
|
|
|
|
|
|
|
|
Amir A. Metry, Ph.D
|
|
2002 to the present
|
|
|
|
|
|
|
Business
consultant since 1995; part-time Versar employee from 1995 to April
2002; Founding Principal of ERM Program Management Corp. from 1989
to 1995; Vice President of Roy F. Weston from 1981 to 1989. Age
75.
Dr.
Metry’s prior business experience in the United States and
overseas and ongoing charitable work in Egypt and the Sudan provide
Versar with international business experience in an area that has
become its largest business segment. Dr. Metry’s experience
includes launching new business and operations in the Middle East,
Europe and the Pacific Rim. Also, Dr. Metry’s many years of
experience and present business relationships in engineering and
environmental businesses enhances his leadership on organizational
and compensation issues faced by Versar.
|
|
|
|
|
|
|
|
|
|
|
Anthony L. Otten
|
|
2008 to the present
|
|
|
|
|
|
|
Chief
Executive Officer of Versar since February 2010; Director of Orion
Energy Systems, Inc. since August 2015; Managing Member of
Stillwater, LLC from July 2009 to February 2010; Director of New
Stream Capital, LLC and Operating Partner of New Stream Asset
Funding, LLC from 2007 to June 2009; Managing Member of Stillwater,
LLC from 2004 to 2007; Principal of Grisanti, Galef and Goldress,
Inc. from 2001 to 2004. Age 60.
Mr.
Otten, as Chief Executive Officer, brings the perspective and input
of the senior management team to the Board discussions. As former
chief executive officer of a number of companies, senior financial
manager and entrepreneur, he brings a strategic vision with
practical operating and financial implications to the Board’s
discussions.
|
|
|
NAME
|
|
SERVED AS DIRECTOR
|
|
|
|
|
|
Frederick M. Strader
|
|
2014 to the present
|
|
|
|
|
|
|
Business
consultant since 2013. Director of HDT Global from January to
September 2016; President and Chief Executive Officer of Textron
Systems, Inc. from January 2010 to December 2012; Executive Vice
President and Chief Operating Officer of Textron Systems, Inc. from
January 2008 to December 2009; President and Chief Executive
Officer of United Industrial Corporation from August 2003 to
December 2007; Chief Operating Officer and Executive Vice President
of United Industrial Corporation from 2001 to 2003. Prior to 2001,
he spent 21 years at United Defense, L.P. and its former parent,
FMC Corporation, in a variety of finance, strategy, operations and
general management positions. Retired U.S. Army Reserve officer and
member of the Army Acquisition Corps. Age 64.
Mr.
Strader’s experience in government contracting, leadership
and management of public companies, and service as a board member
provide him with unique insight and experience for the Board. Mr.
Strader is a highly experienced executive who has led several
companies serving the Department of Defense and other government
agencies. He also has significant experience in finance and the
government acquisition process which enable him to provide valuable
input for Versar’s strategic direction.
|
|
|
|
|
|
|
|
|
|
|
Jeffrey A. Wagonhurst
|
|
2011 to the present
|
|
|
|
|
|
|
President and
Chief Operating Officer of Versar since February 2010; Executive
Vice President, Program Management Group of Versar from May 2009 to
February 2010; Senior Vice President of Versar from September 2006
to May 2009; joined Versar as Army Program Manager in February
1999; retired from government service in May 1997 as a Colonel
after a 30 year career with the U.S. Army. Age 69.
Mr.
Wagonhurst is an experienced business executive and leader who
brings the perspective and input of Versar’s operational
management to the Board’s discussions. As a long time Versar
executive and senior military officer, he provides a perspective
and insight from Versar’s largest client, the U.S. Department
of Defense.
Our
Corporate Governance Guidelines provide that each director nominee
must be under the age of 72 at the time of their election to the
Board and should not have served as a director for more fifteen
(15) years. However these requirements do not apply to any director
who was serving at the time of adoption of the guidelines in July
1, 2008.
|
|
Executive Officers of the Registrant
The current executive officers of Versar, their ages as of March 1,
2017, their current offices or positions and their business
experience for at least the past five years are set forth
below.
|
Anthony L. Otten
|
60
|
Chief Executive Officer
|
|
Jeffrey A. Wagonhurst
|
69
|
President and Chief Operating Officer
|
|
Cynthia A. Downes
|
55
|
Executive Vice President, Chief Financial Officer, Treasurer and
Principal Accounting Officer
|
|
James D. Villa
|
54
|
Senior Vice President, General Counsel, Secretary and Chief
Compliance Officer
|
|
Linda M. McKnight
|
68
|
Senior Vice President of Business Development
|
|
Rob A. Biedermann
|
56
|
Senior Vice President of Engineering and Construction
Management
|
|
Wendell A. Newton
|
59
|
Senior Vice President of Professional Services
|
|
Suzanne J. Bates
|
45
|
Senior Vice President of Environmental Services
|
Anthony L.
Otten, BS, MPP, joined
Versar as Chief Executive Officer (CEO) in February 2010. Prior to
becoming CEO, he had served on Versar's Board of Directors for two
years as an independent board member. Mr. Otten served as Managing
Member of Stillwater, LLC from July 2009 to February 2011, as an
Operating Partner of New Stream Asset Funding, LLC from 2007 to
June 2009 and Managing Member of Stillwater, LLC from 2004 to 2007.
Mr. Otten has a Bachelor of Science degree from the Massachusetts
Institute of Technology and a Masters in Public Policy from
Harvard’s Kennedy School of Government. Mr. Otten is an
outside member of the board for Orion Energy Systems, Inc. (NASDAQ:
OESX).
Jeffrey A.
Wagonhurst, BS, MBC, MBA,
MNSS, joined Versar in February 1999 as an Army Program Manager. In
2001, he was elected Vice President of Human Resources and
Facilities. In September 2006, he was elected Senior Vice President
to lead our former Program Management business unit (now ECM). In
May 2009, Mr. Wagonhurst was promoted to Executive Vice President,
Program Management Group. In February 2010, Mr. Wagonhurst was
promoted to President and Chief Operating Officer of Versar. Mr.
Wagonhurst concluded his 30 year career with the U.S. Army and
retired in May 1997 as a Colonel. He commanded a Combat Engineer
Brigade and Battalion during his service as well as previously
serving as a Deputy District Commander of the Mobile District, U.S.
Army Corps of Engineers.
Cynthia A.
Downes, BS, MBA, CPA,
joined Versar in April 2011 as Executive Vice President, Chief
Financial Officer, Treasurer, and Principal Accounting Officer.
From April 2009 to April 2011, Ms. Downes was Vice President and
Chief Financial Officer of Environmental Design International, an
engineering firm, based in Chicago, specializing in environmental
and civil engineering. From January 2007 to April 2009, she was
Vice President of Finance of GDI Advanced Protection Solutions and
from 2005 to 2007, she was a consultant at Huron Consulting Group,
Inc. Ms. Downes also spent 15 years at Tetra Tech, ultimately
serving as Vice-President and Chief Financial Officer of Tetra
Tech, EM Inc.
James D.
Villa, B.A. J.D., joined
Versar in March 2014 as Senior Vice President, General Counsel,
Secretary, and Chief Compliance Officer. From 2011 to 2014, he
served as Vice President and General Counsel of Colonial Parking,
Inc. From 2006 to 2010, he served as Vice President and Chief
Counsel of AOL, Inc., where he had responsibility for litigation
and regulatory matters. Prior to joining AOL, Mr. Villa was a Trial
Attorney in the Antitrust Division of the United States Department
of Justice and also served as a Special Assistant United States
Attorney in the Eastern District of Virginia. Mr. Villa was
formerly in private practice with several different law firms in
Washington, D.C. Mr. Villa served as a Captain in the United States
Army Reserve and served in Saudi Arabia and Kuwait in support of
Operations Desert Shield and Desert Storm. He has a Bachelor of
Arts degree from the University of Michigan and a Juris Doctor
degree from the University of Michigan Law
School.
Linda M.
McKnight, AA, joined
Versar in April 2013 as Director of Business Development. In May of
2013, she was elected as Senior Vice President in charge of
business development and strategy. Ms. McKnight has more than 29
years of experience in sales and marketing for environmental,
engineering, construction, and logistics services in both domestic
and international markets. She has held senior management sales
positions with Tetra Tech and Kellogg Brown & Root (KBR) over
the past 24 years. From 2010 to 2013, she provided business
development consulting to firms focused on enhancing internal sales
processes to grow environmental and engineering services to federal
clients. Ms. McKnight is a Fellow and active member in the Society
of American Military Engineers and serves on the Board of the
Society's Academy of Fellows. She is the Immediate Past President
of Women in Defense, Capital Chapter.
Rob A.
Biedermann, BS, MS,
joined Versar in May of 2010 serving as the Afghanistan In-Country
Program Manager. In July 2011, he was assigned as the Program
Manager for Versar’s Tooele Chemical Demilitarization Project
completing the project and demobilization in June 2012. In July
2012, Mr. Biedermann was appointed Vice President and assumed
responsibility for Domestic Operations of the Engineering and
Construction Management Group. Mr. Biedermann was elected to Senior
Vice President in August 2013. He served in the US Army for 12
years departing in 1997 as a Corps of Engineers Major having served
in Operations Desert Shield and Storm while assigned to the
249th
Engineer Combat Battalion
(Heavy), the 101st
Airborne Division (Air Assault),
the 555th
Combat Engineer Group and Mobile
District, US Army Corps of Engineers. He served as the Construction
Operations Manager and General Manager for JB Rodgers | Kinetics
from June of 1997 to March of 2003 managing revenues up to $210
million. From 2003 to 2010, Mr. Biedermann served as the Chief
Operating Officer and President of JB Henderson Construction, Inc.
of Albuquerque, NM managing operations with revenues of up to $100
million. From October 1998 to March 2010, he was a Labor Arbitrator
for the Sheet Metal and Air Conditioning Contractor’s
National Association and elected as an Executive Board Member in
October, 2008.
Wendell
Newton, BS, joined Versar
in July 2014 as Senior Vice President of the Professional Services
Group. From February 1999 to July 2014, Mr. Newton was the
Executive Vice President, Chief Operating Officer and one of the
three shareholders of J.M. Waller Associates, Inc. (JMWA). Mr.
Newton brings more than twenty-five years of experience in
leadership and management in the areas of contracts, operations,
finance, project management, human resources, and business
development. During his 15-year tenure with JMWA, Mr. Newton was
responsible for the executive leadership of the national
environmental, facilities and logistics consulting and management
groups. He served as senior-level management and provided oversight
of environmental and compliance projects as well as projects
involving development of facility requirements, master plans, land
use and infrastructure plans. He developed and executed capital
resource management plans including division and group annual
budgets and the management of the technical services support staff.
Mr. Newton also served as Vice President for JMWA Division managing
the company's professional services resources world-wide and
providing oversight to nearly 300 engineering, scientific,
management and professional support staff who serve JMWA federal
client base.
Suzanne
Bates, B.S., M.S., joined
Versar in September 2013 as a senior program manager and lead
operations manager. Currently, Suzanne serves as Senior Vice
President and Group Manager for Versar’s Environmental
Services Group. Prior to joining Versar, Suzanne served as the
Environmental Group Lead for Geo-Marine, Inc., (GMI) leading
programs and projects focused on the Department of Defense and
other federal agencies. She is a graduate of Texas A&M
University-Corpus Christi with a Bachelor of Science degree in
biology and chemistry and a Master of Science degree in marine
sciences.
For the purpose of calculating the aggregate market value of the
voting stock of Versar held by non-affiliates as shown on the cover
page of this report, it has been assumed that the directors and
executive officers of the Company and the Company’s 401(k)
Plan are the only affiliates of the Company. However, this is not
an admission that all such persons are, in fact, affiliates of the
Company.
Section 16(a) Beneficial Ownership Reporting
Compliance
Section 16(a) of
the Securities Exchange Act of 1934 (the “Exchange
Act”) requires Versar’s executive officers, directors
and persons who beneficially own more than 10% of Versar’s
Common Stock to file initial reports of ownership and reports of
changes in ownership with the SEC. Based solely on Versar’s
review of such reports furnished to Versar, Versar believes that
all reports required to be filed by persons subject to Section
16(a) of the Exchange Act, and the rules and regulations
thereunder, during fiscal 2016, were timely filed.
Audit Committee and Audit Committee Financial Expert
The
Audit Committee, which the Board has determined is composed
exclusively of non-employee directors who are independent, as
defined by the NYSE MKT LLC (“NYSE MKT”) listing
standards and the rules and regulations of the SEC, consisted of
Mr. Gallagher (Chair), Dr. Durfee, Mr. Hoeper and Mr. Strader
during fiscal 2016.
The
Committee’s primary responsibilities, pursuant to a written
charter, which is posted on the Company's website at www.versar.com
under Corporate Governance (located under the
“Investors” tab), are to provide oversight of the
Company’s accounting and financial controls, review the scope
of and procedures to be used in the annual audit, review the
financial statements and results of the annual audit, and retain,
and evaluate the performance of, the independent accountants and
the Company’s financial and accounting personnel. The Board
of Directors has determined that Mr. Strader qualifies as an Audit
Committee Financial Expert as such term is defined under Item
407(d)(5) of Regulation S-K and is independent as noted
above.
Code of Business Ethics and Conduct
The Company’s Board has adopted a Code of
Business Ethics and Conduct, most recently restated in April 2016,
that applies to all directors and employees, including the
Company’s principal executive officer, principal financial
officer, principal accounting officer and controller. The Code of
Business Ethics and Conduct is posted on the Company’s web
site
www.versar.com under
Corporate Governance (located under the “Investors”
tab). The Company intends to disclose on its website any amendments
or modifications to the Code of Business Ethics and Conduct and any
waivers granted under this Code to its principal executive officer,
principal financial officer, principal accounting officer or
controller or persons performing similar functions. In fiscal 2016
and through the date of this Annual Report, no waivers have been
requested or granted.
Item 11. Executive Compensation
COMPENSATION DISCUSSION AND ANALYSIS
Overview
The
following Compensation Discussion and Analysis reviews the
executive compensation program, policies and decisions of the
Company’s Compensation Committee with respect to the
Company’s executive officers listed in the Summary
Compensation Table below (the “Named Executive
Officers”). For fiscal 2016, the named executive officers
are:
|
Name
|
|
Position
|
|
Anthony L.
Otten
|
|
Chief
Executive Officer
|
|
Jeffrey A.
Wagonhurst
|
|
President and
Chief Operating Officer
|
|
Cynthia A.
Downes
|
|
Executive Vice
President, Chief Financial Officer and Treasurer
|
|
James
D. Villa
|
|
Senior
Vice President, General Counsel, Secretary and Chief Compliance
Officer
|
|
Linda
M. McKnight
|
|
Senior
Vice President, Business Development
|
Executive Compensation Philosophies and Policies
The
compensation philosophy of the Compensation Committee (the
“Committee”) is built on the principles of pay for
performance, stock ownership and alignment of management interests
with the long-term interest of the Shareholders. The
Committee’s executive compensation policies are designed to
provide competitive levels of compensation that integrate pay with
performance, recognize individual initiative and achievements and
assist the Company in attracting and retaining qualified executive
officers. The target levels of new executive officers’
overall compensation are intended to be aligned with and
benchmarked against compensation in the professional services
industry for similar executives. In addition, the Committee seeks
to provide a clear and transparent executive compensation process
that reflects the understanding, input and decision factors that
make the compensation and incentive system a valuable tool to
increase Shareholder value.
The
Company’s executive compensation program includes three
components:
●
Base Salary – Salaries are benchmarked against those paid to
other executives in the professional services industry as
determined based on information provided from time to time by the
Committee’s compensation consultant, as described
below.
●
Long-Term Equity
Incentive Awards – The purpose of this element of the
Company’s executive compensation program is to link the
Company’s most senior managers’ compensation with the
long-term interests of the Company’s Shareholders, as well as
the performance of the Company in a single fiscal year. Long-term
incentive awards may be granted to named executive officers and
other employees usually in the form of restricted stock or
restricted stock units from a pool established under an incentive
pay for performance plan at the beginning of each fiscal year by
the Committee and approved by the Board. The Committee bases its
decision to grant such awards, if a pool is established, on the
individual’s performance and potential to contribute to the
creation of Shareholder value. In February 2015, the Committee
approved a Long-Term Incentive Compensation Program under which
long-term incentive awards in the form of restricted stock units
may be granted to the Company’s Chief Executive Officer,
President/Chief Operating Officer and Chief Financial Officer based
on a formula if the Company achieves certain defined growth in
diluted earnings per share each year. The Long-Term Incentive
Compensation Program is effective from fiscal 2015 through fiscal
2017. The Company had a similar program that operated for fiscal
2011 through 2014.
●
Non-Equity
Incentive Plan Compensation – Non-equity incentive plan
compensation is paid in cash pursuant to the above-noted incentive
pay for performance plan and seeks to reward performance achieved
during the applicable fiscal year. This pay for performance
incentive plan balances the short-term and long-term needs of the
Company. Under the non-equity incentive plan compensation element
of the plan, a cash incentive pool is recommended each fiscal year
upon the Company’s attainment of certain financial targets
set by the Board. If the Company meets the targets, the Committee
then determines the allocation of a pre-determined portion of the
cash incentive pool among the executive officers based on each
executive officer’s position and individual contribution to
the Company’s performance. Each executive officer’s
performance is measured against financial, profitability, growth,
strategic and operational goals consistent with the Company’s
business plan. For the immediate future, greater emphasis is
focused on the short-term well-being of Versar in determining the
allocation of cash awards to executive officers.
Impact of 2015 “Say on Pay” Advisory Vote.
We
provided our shareholders with an advisory “say on pay”
vote on the compensation of our named executive officers at our
2015 Annual Meeting of Shareholders. We received approximately
83.6% support in such vote. The Compensation Committee evaluated
the results of this vote when making the determinations described
herein and, as a result, the Compensation Committee has continued
to apply substantially similar effective principles and philosophy
it has used in previous years in determining executive compensation
and made no material changes in fiscal 2016. The Compensation
Committee will continue to consider shareholder concerns and
feedback in the future.
Incentive Compensation Philosophy and Policies
Incentive Compensation Pay For Performance Plan
The
Committee annually establishes a company-wide Incentive
Compensation Pay For Performance Plan (“Incentive
Plan”) at its first meeting held during the fiscal year. The
Incentive Plan is based on a set of general principles that apply
to all elements of compensation and establish the rules for
awarding non-equity incentive plan compensation and stock-based
compensation. The Incentive Plan consists of two parts: the first
part is a written Incentive Compensation Plan, which was adopted in
September 2010 and, the second part consists of annual general
principles and guidelines for incentive compensation, including
performance criteria, defined incentive groups and the target
percentages of the pool to be allocated to each group for the
fiscal year. The guidelines applicable to all elements of the
Company’s compensation program and that apply directly to the
Incentive Plan each year include:
●
The senior
management team’s compensation is linked to Versar’s
profitability, growth and strategic position;
●
The Incentive
Plan’s key concept, pay for performance, balances short-term
needs and long-term goals of the Company and the senior management
team;
●
The Pay For
Performance concept is applicable to all elements of compensation,
including base salary and merit increases, non-equity incentive
plan compensation and restricted stock awards;
●
The Incentive Plan
is simple, rational, consistent and based on agreed-upon measurable
parameters;
●
The Incentive Plan
is based upon the Company’s achievement of certain levels of
pre-tax income; and
●
The Incentive Plan
is driven by a combination of metrics, depending on the level of
management. The intent is that all levels of senior management have
a significant portion of their compensation tied to the
Company’s performance.
For
fiscal 2016, the Committee determined that individual Incentive
Plan awards would be based 10% to 60% on financial goals
emphasizing the short-term well-being of Versar and 40% to 90% upon
meeting strategic growth and sustainability goals of Versar over a
longer period.
Restricted Stock
Awards. Awards of
restricted stock or restricted stock units (“restricted
stock”) take into account both past performance and the need
to provide the executive officers, other managers and key employees
with an incentive to drive future performance of the Company.
Restricted stock is also used as an incentive for future
performance and long-term retention and commitment to the
Company’s future. Restricted stock awards are currently made
under the Company’s 2010 Stock Incentive Plan. While this
Plan allows the use of stock options and other forms of stock-based
awards, the Committee has determined that all awards will currently
be in the form of restricted stock and restricted stock units,
because restricted stock provides an opportunity to tie
employees’ incentives to the growth of Shareholder value
while potentially having less of an impact than stock options from
an accounting standpoint on the earnings of the
Company.
In the
fiscal 2016 Incentive Plan, the number of restricted shares
available for award was based on the same measure used to establish
the size of the cash bonus pool, subject to a minimum and maximum
award range. For fiscal 2016, the minimum pool for restricted stock
awards was set at 25,000 shares and the maximum pool was 150,000
shares. Shares of restricted stock are awarded from the pool in the
discretion of the Compensation Committee. The Incentive Plan for
fiscal 2017 follows the same format as the previous year, and the
minimum pool will be 25,000 shares and the maximum pool will be
175,000 shares.
Non-Equity Incentive Plan
Compensation. Under
the Incentive Plan, if the Company meets the minimum pre-tax income
targets set in advance by the Board, then a non-equity incentive
plan compensation pool is created. For fiscal 2016, the Board set
the sole criteria for the creation of the non-equity incentive plan
compensation pool as the Company’s pre-tax income. The
minimum goal for fiscal 2016 was $4.1 million in pre-tax income,
with a non-equity incentive plan compensation pool of $400,000 at
that level. The non-equity incentive plan compensation pool was
designed to increase as pre-tax income reached higher levels so
that at $6.2 million of pre-tax income, a $1.6 million non-equity
incentive plan compensation pool would be created. An executive
officer’s participation in the pool, if any, is based on
achievement of individually designed performance criteria. For
fiscal 2017, the Board has again adopted a pre-tax income target
for the non-equity incentive plan compensation pool. At this time,
the Company believes that disclosure of the fiscal 2017 pre-tax
income target could cause competitive harm to the Company’s
business. While the Company believed that the fiscal 2017 target
was challenging but attainable when adopted, based on performance
to date in fiscal 2017, the Company does not anticipate a bonus
pool will be created.
The
fiscal 2016 non-equity incentive plan compensation pool was divided
into six (6) levels: Executive Team, Senior Vice Presidents, Vice
Presidents, Directors, Supervisors below Director Level and
Non-Supervisors. There
are varying percentages of participation by each group. If the
Named Executive Officers and other senior managers are entitled to
non-equity incentive plan compensation, the Committee will
determine the allocation of non-equity incentive plan compensation
among the named executive officers and other senior managers from
the pools established for each category of employee, based on each
executive officer’s or manager’s position, contribution
to the Company including the achievement of established financial,
strategic direction and leadership performance goals, and
information regarding mid-range bonuses paid by others in the
professional services industry based on information provided by its
compensation consultant discussed below. The Incentive Plan for
fiscal 2017 also divides the incentive groups into six (6) levels:
Executive Team; Senior Vice Presidents, Vice Presidents, Directors,
Supervisors below Director Level and Non-Supervisors.
Long-Term Incentive Compensation Program
On
February 3, 2015, the Committee approved the Versar, Inc. 2015
Long-Term Incentive Compensation Program (the “LTICP”)
adopted under the Company’s 2010 Stock Incentive Plan (the
“2010 Plan”). The LTICP was effective as of June 28,
2014. The LTICP provides for the creation for each of fiscal 2015,
2016 and 2017 of a performance pool equal to 30% of the amount by
which the Company’s diluted earnings per share exceeds that
fiscal year’s target diluted earnings per share (which will
be $0.299 for the 2015 Performance Period, $0.329 for the 2016
Performance Period and $0.362 for the 2017 Performance Period),
times the weighted average number of the Company’s common
stock outstanding, on a diluted basis (the “LTICP
Pool”). The LTICP Pool shall in no event be less than zero
for any fiscal year. To the extent that the LTICP Pool is zero in
any fiscal year covered by the LTICP, no LTICP Pool will be created
for the subsequent fiscal year.
In any
year that an LTICP Pool is created, each participant in the LTICP
may receive a restricted stock award pursuant to the 2010 Plan. The
number of shares of restricted stock received by each participant
will be calculated by multiplying the LTICP Pool by each
participant’s designated percentage and then dividing the
result by the fair market value of the Company’s common stock
on the last day of the fiscal year to which the award relates. Each
participant must be employed by the Company on the date the award
amounts are determined in order to be eligible to receive an award,
except as specified by the LTICP. The participants in the LTICP are
the Company’s Chief Executive Officer, President/Chief
Operating Officer and Chief Financial Officer and their
participation percentages are 60%, 25% and 15%, respectively,
subject to change by the Compensation Committee for any fiscal
year.
One
third of the restricted shares granted from the LTICP Pool will
vest immediately following the Compensation Committee meeting at
which such award is confirmed, and the remaining restricted shares
will vest in equal proportions on the first and second
anniversaries of the valuation date applicable to the restricted
share award. Such restricted stock shall be forfeited if employment
is terminated prior to vesting upon the terms set forth in the
award agreement. Any unvested restricted shares will be subject to
accelerated vesting if the Company’s board of directors
determines in its discretion that the award recipients have
complied with the terms of and objectives as set forth in the
LTICP. Further, vesting will be suspended in any year in which the
LTICP Pool is equal to zero or, in periods following fiscal 2017,
if the Company fails to achieve the performance measures then
established for that fiscal year. If in a succeeding performance
period, as defined by the LTICP, an LTICP Pool is created, the
previously suspended restricted stock awards will vest.
Participation in the LTICP will generally cease upon termination of
a participant’s service with the Company provided that if a
participant’s service with the Company is terminated without
cause, or by the participant for good reason, or as a result of
retirement, death or disability after the end of a fiscal year but
before the receipt of restricted shares under the LTICP has been
determined, such participant will continue to participate and
receive restricted shares from the LTICP Pool for the then
completed fiscal year as if a continuing employee of the Company at
that time. Upon a Change in Control, as defined by the 2010 Plan,
all participation in the LTICP will cease and no further awards
will occur. However, upon a Change in Control, any unvested
restricted shares previously granted pursuant to the LTICP will
immediately vest.
Compensation Process
Incentive Compensation Pay For Performance Plan
As
noted above, in establishing the annual Incentive Plan, the
Committee annually reviews the overall compensation of senior
management, as well as the size and composition of the non-equity
portion and stock-based award portion of the Incentive Plan at the
beginning of each fiscal year.
At the
same time, the Committee gathers data regarding the Company’s
performance during the immediately preceding fiscal year to
determine the awards to be made under the Incentive Plan for that
then completed fiscal year.
In
making its compensation decisions, the Committee has historically,
and again in fiscal 2016, engaged the services of Steve Parker of
HR-3D, a compensation consulting firm. Annually, Mr. Parker
compiles information from publicly available compensation surveys
and benchmarks, including those prepared by Willis Towers Watson,
Radford Surveys & Consulting, and Culpepper and Associates,
Inc., regarding companies in the professional services industry.
The compilation prepared by Mr. Parker for fiscal 2016 included
benchmarked compensation data for different executive levels of
professional services companies of various sizes and in various
geographic locations, but did not include the names of the
individual companies whose salary data is utilized to compile the
survey data. The publicly available compensation surveys and
benchmarks used to prepare the compilation were chosen by Mr.
Parker based on general direction from the Committee. Under the
direction of Dr. Metry, Mr. Parker provided detailed information by
type of executive position for fiscal 2016 focused on professional
service companies with revenues in a range similar to that targeted
by Versar over the same period. The compilation included an average
of the mid-range of salaries and bonus percentages for the various
executive levels within the professional services industry. In
making compensation decisions, the Committee’s goal is to
over time provide for executives’ salaries and bonuses within
a particular range based on averages as supported by the
compilation.
The
Committee also considers the accounting and tax impact to the
Company of the proposed compensation. Section 162(m) of the
Internal Revenue Code has not been a relevant factor in the
Committee’s compensation decisions to date, because the
levels of compensation historically paid to the executive officers
have been substantially below the $1 million threshold set forth in
Section 162(m). If the Committee were to consider compensation
increases sufficient to reach this threshold, it would seek advice
regarding application and impact of Section 162(m). In setting
compensation, the Committee also considers ways to minimize the
adverse tax consequences from the impact of Section 409A of
the Internal Revenue Code. If an executive officer is entitled to
nonqualified deferred compensation benefits, as defined by and
subject to Section 409A, and such benefits do not comply with
Section 409A, such executive officer would be subject to
adverse tax treatment (including accelerated income recognition in
the first year that benefits are no longer subject to a substantial
risk of forfeiture) and a 20% penalty tax. Versar’s
compensation plans and programs are, in general, designed to comply
with the requirements of Section 409A so as to avoid possible
adverse tax consequences.
Long-Term Incentive Compensation Program
The
Committee annually reviews the LTICP in order to determine if the
mechanics of the plan, including the calculation of the LTICP Pool
and the vesting schedule of awards, remain appropriate, and to
determine if the participants in the pool and their respective
participation percentages should be modified. Otherwise, as the
process in which awards are granted under the terms of the LTICP is
fixed pursuant to the terms of the LTICP, the Committee has no
further discretion with respect to awards under the
LTICP.
Compensation Decisions
Base Salary
For
current executive officers, the Committee intends to focus on
providing significant incentive compensation to drive the
Company’s performance rather than annual base salary
increases, except as required in the case of misaligned salary
levels or as deemed necessary following review of the
executives’ overall compensation packages supported by
surveys conducted by Mr. Parker of executive compensation at
similar companies in the professional services industry. After
discussion of survey data included in the Company’s annual
executive compensation analysis with Mr. Parker and
consideration of the Company’s current financial situation,
the Committee determined not to make any changes to base salaries,
and has sought to reduce other prerequisites as
appropriate.
Stock Based Awards (including Long-Term Incentive Compensation
Program)
Restricted stock
or restricted stock units may be awarded to executive officers
pursuant to the terms of the annual Incentive Plan and the LTICP if
the specified criteria are met. In fiscal 2016, the Company did not
achieve the targets necessary to trigger the award of restricted
stock or restricted stock units under the 2016 Incentive Plan and
the LTICP.
The
Committee did however approve certain discretionary grants of
restricted stock units to executive officers as set out
below.
As was
reported in the Company’s Proxy Statement for its 2015 Annual
Shareholders’ Meeting, the Company did not achieve the
targets necessary to trigger the award of restricted stock or
restricted stock units under the 2015 Incentive Plan and the LTICP.
However, on September 1, 2015, after review of the
Company’s overall performance and the efforts made by
management with respect to achieving certain goals of the Company
and in order to provide further incentives for improved performance
in the future, the Committee approved the following grants of
restricted stock units to named executive officers: Mr. Otten,
13,300 shares, Mr. Wagonhurst, 6,700 shares, Ms. Downes,
6,000 shares, Mr. Villa 2,700 shares and Ms. McKnight 2,700
shares. Fifty percent of these restricted stock units vest on each
of the immediately succeeding two anniversaries of the date of
grant until fully vested.
Further, the
Committee approved an additional grant of restricted share units to
each of the named executive officers on February 1, 2016 as
follows: Mr. Otten, 18,000 shares, Mr. Wagonhurst 5,000
shares, Ms. Downes 9,000 shares, Mr. Villa 3,000 shares
and Ms. McKnight 5,000 shares. Fifty percent of these
restricted stock units vest on each of the immediately succeeding
two anniversaries of the date of grant until fully vested Such
grants were made to recognize the contributions of these
individuals and to incent them to continue their performance on
behalf of the Company.
Non-Equity Incentive Plan Compensation
In
fiscal 2016, the Company did not achieve the targets necessary to
trigger the accrual of a bonus pool under the 2016 Incentive Plan.
Thus, no non-equity incentive plan compensation was paid to the
named executive officers for fiscal 2016.
Summary Compensation Table
The
following table presents compensation information earned by the
Company’s Principal Executive Officer, Principal Financial
Officer, each of the Company’s three other most highly
compensated executive officers during the fiscal year ended July 1,
2016, and compared with the two prior years. We refer to these
executive officers as our named executive officers in this Annual
Report.
|
Name and Principal Position
|
Year
|
Salary
($)(1)
|
Bonus
($)
|
Stock Awards ($)(2)
|
All Other
Compensation
($)(3)
|
Total
($)
|
|
Anthony L.
Otten
Chief
Executive Officer
|
2016
|
375,000
|
-
|
84,305
|
36,775
|
496,080
|
|
2015
|
331,068
|
-
|
-
|
20,196
|
351,264
|
|
|
2014
|
325,000
|
-
|
16,252
|
16,802
|
358,054
|
|
|
Jeffrey A.
Wagonhurst
President and
Chief Operating Officer
|
2016
|
270,000
|
-
|
32,585
|
30,923
|
339,508
|
|
2015
|
261,154
|
-
|
-
|
19,390
|
280,544
|
|
|
2014
|
263,285(4)
|
-
|
13,000
|
17,422
|
293,707
|
|
|
Cynthia A.
Downes
Executive Vice
President and Chief Financial Officer
|
2016
|
230,000
|
-
|
40,170
|
23,161
|
293,331
|
|
2015
|
230,000
|
-
|
-
|
14,723
|
244,724
|
|
|
2014
|
230,000
|
-
|
11,499
|
13,669(5)
|
255,168
|
|
|
James
D. Villa
Senior
Vice President,
General Counsel
and Chief Compliance Officer
|
2016
|
210,000
|
-
|
22,763
|
18,210
|
250,973
|
|
2015
|
210,000
|
-
|
-
|
16,940
|
226,940
|
|
|
-
|
-
|
-
|
-
|
-
|
-
|
|
|
Linda
M. McKnight
Senior
Vice President,
Business
Development
|
2016
|
200,000
|
-
|
20,385
|
21,271
|
241,656
|
|
2015
|
200,000
|
-
|
-
|
13,681
|
213,681
|
|
|
-
|
-
|
-
|
-
|
-
|
-
|
|
|
|
|
|
|
|
|
|
(1)
Includes regular
base salary earnings for fiscal 2016, 2015 and 2014.
(2)
Amounts shown are
the aggregate grant date fair value of time-based restricted stock
unit awards computed in accordance with FASB ASC
Topic 718.
(3)
Consists of the
following: Any severance payments, payments for accrued personal
time off after leaving the Company, Company paid life insurance,
Company paid disability, executive medical reimbursement, and
Company match to employee’s 401(k) Plan
contribution.
(4)
Includes $2,500
for payout of personal time off in excess of 200 hours and $785 for
service achievement
(5)
As previously
reported included $51,167 for relocation expenses which actually
were paid in a prior year.
Grants of Plan Based Awards
|
Name
|
Grant Date
|
Estimate Future Payouts Under Non-Equity Incentive Plan Awards
(1)
|
All Other Stock Awards: Number of Shares of Stock or
Units
|
Grant Date Fair Value of Stock and Option Awards
($)(2)
|
||
|
Threshold
($)
|
Target
($)
|
Maximum
($)
|
||||
|
Anthony L.
Otten
|
|
210,000
|
262,500
|
450,000
|
|
|
|
|
9/1/15
|
|
|
|
13,300
|
40,565
|
|
|
2/1/16
|
|
|
|
18,000
|
43,740
|
|
Jeffrey A.
Wagonhurst
|
|
108,000
|
135,000
|
162,000
|
|
|
|
|
9/1/15
|
|
|
|
6,700
|
20,435
|
|
|
2/1/16
|
|
|
|
5,000
|
12,150
|
|
Cynthia A.
Downes
|
|
82,800
|
103,500
|
124,200
|
|
|
|
|
9/1/15
|
|
|
|
6,000
|
18,300
|
|
|
2/1/16
|
|
|
|
9,000
|
21,870
|
|
James
D. Villa
|
|
58,800
|
73,500
|
88,200
|
|
|
|
|
9/1/15
|
|
|
|
2,700
|
8,235
|
|
|
2/1/16
|
|
|
|
3,000
|
7,290
|
|
Linda
M. McKnight
|
|
56,000
|
70,000
|
84,000
|
|
|
|
|
9/1/15
|
|
|
|
2,700
|
8,235
|
|
|
2/1/16
|
|
|
|
5,000
|
12,150
|
(1)
Amounts represent
the threshold (payment made if performance criteria met at 80%
level for fiscal year), target (payment made if the performance
criteria are met for the fiscal year) and maximum payouts (payment
made if the performance criteria are exceeded for the fiscal year)
under the 2016 Incentive Plan. No amounts were earned by the Named
Executive Officers during fiscal 2016 as the performance criteria
was not achieved at the minimum level.
(2)
The amounts in
this column do not represent amounts the named executive officers
received or are entitled to receive. Rather, the reported amounts
represent the grant date fair values of the awards. The grant date
fair value is determined in accordance with FASB ASC Topic 718 by
multiplying the number of shares underlying the units granted by
the closing price of the Company's Common Stock on the grant
date.
Outstanding Equity Awards at Fiscal Year-End
|
Name
|
Option Awards
|
Stock Awards
|
|||
|
Number of Securities Underlying Unexercised Options (#)
Exercisable
|
Option Exercise Price
($)
|
Option Expiration Date
|
Number of Shares or Units of Stock That Have Not
Vested
(#)
|
Market Value of Shares or Units of Stock That Have Not Vested
($)
|
|
|
Anthony L.
Otten
|
0
|
-
|
-
|
31,300
|
38,812
|
|
Jeffrey A.
Wagonhurst
|
0
|
-
|
-
|
11,700
|
14,508
|
|
Cynthia A.
Downes
|
0
|
-
|
-
|
15,000
|
18,000
|
|
James
D. Villa
|
0
|
-
|
-
|
7,575
|
9,393
|
|
Linda
M. McKnight
|
0
|
-
|
-
|
7,000
|
9,548
|
(1)
Based on the Fair
Market Value of the Company’s Common Stock (based on the
closing price for the Common Stock on the NYSE MKT) on July 1,
2016.
Stock Vested
|
Name
|
Number of Shares Acquired on Vesting (#)(2)
|
Value Realized on Vesting ($)(1)
|
|
Anthony L.
Otten
|
6,650
|
10,706.50
|
|
Jeffrey A.
Wagonhurst
|
3,350
|
5,393.50
|
|
Cynthia A.
Downes
|
3,000
|
4,830.00
|
|
James
D. Villa
|
1,350
|
2,173.50
|
|
Linda
M. McKnight
|
1,350
|
2,173.50
|
(1)
Calculated by
multiplying the number of shares by the fair market value of the
Company’s Common Stock (based on the closing price for the
Common Stock on the NYSE MKT) on the date of vesting.
(2)
Represents the
shares that vested on September 2, 2016 from the restricted stock
unit award granted on September 2, 2015.
Director Compensation Fiscal Year 2016
During
fiscal 2016, each of the Company’s non-employee directors
received an annual fee consisting of $8,000 in cash, plus the grant
of 8,500 shares of restricted stock, all of which vest over a
one-year period. Each non-employee director was paid an attendance
fee of $1,400 in cash for each meeting of the Board or of its
committees for which the director was physically present and $700
in cash for each meeting attended telephonically. In addition, the
Chairs of the Audit, Compensation and Nominating & Governance
Committees were paid an additional $6,000 a year in cash as
compensation for increased responsibility and work required in
connection with those positions. The non-employee Chairman of the
Board was paid an additional $15,000 in cash and was granted an
additional 6,000 shares of restricted stock for additional
responsibilities and efforts on behalf of the Company.
|
Name
(1)
|
Fees Earned or Paid in Cash ($)(2)
|
Stock Awards
($) (3)
|
Total ($)
|
|
Paul
J. Hoeper
|
39,100
|
40,170
|
79,270
|
|
Robert
L. Durfee
|
26,900
|
24,720
|
51,620
|
|
James
L. Gallagher
|
30,100
|
24,720
|
54,820
|
|
Amoretta M.
Hoeber
|
30,100
|
24,720
|
54,820
|
|
Amir
A. Metry
|
30,100
|
24,720
|
54,820
|
|
Frederick M.
Strader
|
26,200
|
24,720
|
50,920
|
(1)
Anthony L. Otten
and Jeffrey A. Wagonhurst are not included in this table because as
employees of Versar, they receive no extra compensation for their
service as directors. Their compensation for fiscal 2016 is shown
on the Summary Compensation Table included herein
above.
(2)
Includes all fees
earned or paid for services as a director in fiscal 2016, including
annual retainer, committee or Board chair fees and meeting
fees.
(3)
Represents the
grant date fair value of shares of restricted stock granted in
fiscal 2016 which is the amount recognized for financial reporting
purposes in accordance with Financial Accounting Standards Board
(“FASB”) Accounting Standards Codification Topic 718
(“Topic 718”). In accordance with Topic 718, the grant
date fair value of each share of restricted stock is based on the
closing price of Versar's Common Stock on the date of the grant,
November 10, 2015 for all stock awards, which was $3.09 per share.
Restricted stock awarded to Directors in fiscal 2016 vested on
November 14, 2016, the day before the anticipated first annual
meeting of shareholders after the date of grant.
At the
end of fiscal 2016, the non-employee directors owned the following
number of unvested shares of restricted stock:
|
NAME
|
Unvested Restricted Stock Awards
|
|
Paul
J. Hoeper
|
14,500
|
|
Robert
L. Durfee
|
8,500
|
|
James
L. Gallagher
|
8,500
|
|
Amoretta M.
Hoeber
|
8,500
|
|
Amir
A. Metry
|
8,500
|
|
Frederick M.
Strader
|
8,500
|
Change in Control Agreements
On
September 1, 2015, the Company amended the change in controls
severance agreements with Mr. Otten, Mr. Wagonhurst, Ms. Downes,
Ms. McKnight and Mr. Villa and extended the term of the change in
control agreements until September 13, 2017. The agreements provide
that there is a “change in control” upon the occurrence
of the first of the following events: an acquisition of a
controlling interest (defined as 25% or more of the combined voting
power of the Company’s then outstanding securities); if
during the term of the agreement, individuals serving on the board
at the time of the agreement, or their approved replacements, cease
to constitute a majority of the board; a merger approval (subject
to exceptions listed in the agreement); a sale of all or
substantially all of the Company’s assets; a complete
liquidation or dissolution of the Company, or a going private
transaction. If a potential change in control occurs during the
term, the termination date is automatically extended to the later
of the existing termination date or the date that is six months
from the date of the potential change in control. If a change in
control occurs during the term, the termination date will not apply
and the agreement will terminate only on the last day of the 24th
calendar month beginning after the calendar month in which the
change in control occurred. Under each of the agreements, severance
benefits are payable to an executive officer if, during the term of
the agreement and following a change in control, the
executive’s employment is terminated by the Company without
cause (other than as a result of his death or disability) or if the
executive resigns for good reason (identified as a result of change
in title, salary reduction, or change in geographic location).
Severance benefits will also be triggered if, after a potential
change in control, but before an actual change in control, the
executive’s employment is terminated without cause or the
executive resigns for good reason, if the termination is at the
direction of a person who has entered into an agreement with the
Company that will result in a change in control, or the event
constituting good reason is at the direction of such a person.
Finally, benefits will be triggered if a successor to the Company
fails to assume the agreement. Severance benefits include: (i) a
lump sum cash payment equal to two times the executive’s
annual base salary, or, if higher, the annual base salary in effect
immediately before the change in control, potential change in
control or good reason event; (ii) a lump sum cash payment equal to
two times the higher of the amounts paid to the executive under any
existing bonus or incentive plan in the calendar year preceding the
termination of his employment or the calendar year in which the
change in control occurred; (iii) a lump sum payment for any
amounts accrued under any other incentive plan; (iv) a continuation
for 24 months of the life, disability and accident benefits the
executive was receiving before the end of his employment; (v) a
continuation for 18 months of the health and dental insurance
benefits he or she was receiving before the end of his or her
employment; (vi) a lump sum payment of $16,000 in lieu of medical
benefits made available by the Company to its officers; (vii) all
unvested options will immediately vest and remain exercisable of
the longest period of time permitted by the applicable stock option
plan; and (viii) all unvested restricted stock awards will
immediately vest. Further, the Company may provide certain medical
benefits to retired executive officers who serve as chief executive
officer, president, executive vice president, senior vice
president, corporate vice president, or a Board-elected vice
president. A termination following a change in control will be
deemed retirement for purposes of the provision of these medical
benefits.
The
following table estimates and summarizes potential payments and
benefits, other than the benefits ordinarily available to salaried
employees, that Mr. Otten would have received had his employment
been terminated on the last day of fiscal 2016 under the
circumstances described below.
|
|
Salary
$
|
Bonus
$
|
Benefits
$(1)
|
|
Termination or
resignation following a change of control
|
750,000
|
0
|
37,694
|
|
Termination or
resignation following a potential change of control
|
750,000
|
0
|
37,694
|
|
Successor fails to
assume the contract
|
750,000
|
0
|
37,694
|
(1)
Payment for
benefit costs paid by the Company on behalf of Mr. Otten that are
not generally available to other employees for insurance and
medical benefits calculated based on current applicable
premiums.
The
following table estimates and summarizes potential payments and
benefits, other than the benefits ordinarily available to salaried
employees, that Mr. Wagonhurst would have received had his
employment been terminated on the last day of fiscal 2016 under the
circumstances described below.
|
|
Salary
$
|
Bonus
$
|
Benefits
$(1)
|
|
Termination or
resignation following a change of control
|
540,000
|
0
|
31,334
|
|
Termination or
resignation following a potential change of control
|
540,000
|
0
|
31,334
|
|
Successor fails to
assume the contract
|
540,000
|
0
|
31,334
|
(1)
Payment for
benefit costs paid by the Company on behalf of Mr. Wagonhurst that
are not generally available to other employees for insurance and
medical benefits calculated based on current applicable
premiums.
The
following table estimates and summarizes potential payments and
benefits, other than the benefits ordinarily available to salaried
employees, that Ms. Downes would have received had her employment
been terminated on the last day of fiscal 2016 under the
circumstances described below.
|
|
Salary
$
|
Bonus
$
|
Benefits
$(1)
|
|
Termination or
resignation following a change of control
|
460,000
|
0
|
31,526
|
|
Termination or
resignation following a potential change of control
|
460,000
|
0
|
31,526
|
|
Successor fails to
assume the contract
|
460,000
|
0
|
31,526
|
(1)
Payment for
benefit costs paid by the Company on behalf of Ms. Downes that are
not generally available to other employees for insurance and
medical benefits calculated based on current applicable
premiums.
The
following table estimates and summarizes potential payments and
benefits, other than the benefits ordinarily available to salaried
employees, that Mr. Villa would have received had his employment
been terminated on the last day of fiscal 2016 under the
circumstances described below.
|
|
Salary
$
|
Bonus
$
|
Benefits
$(1)
|
|
Termination or
resignation following a change of control
|
420,000
|
0
|
19,139
|
|
Termination or
resignation following a potential change of control
|
420,000
|
0
|
19,139
|
|
Successor fails to
assume the contract
|
420,000
|
0
|
19,139
|
(1)
Payment for
benefit costs paid by the Company on behalf of Mr. Villa that are
not generally available to other employees for insurance and
medical benefits calculated based on current applicable
premiums.
The
following table estimates and summarizes potential payments and
benefits, other than the benefits ordinarily available to salaried
employees, that Ms. McKnight would have received had her employment
been terminated on the last day of fiscal 2016 under the
circumstances described below.
|
|
Salary
$
|
Bonus
$
|
Benefits
$(1)
|
|
Termination or
resignation following a change of control
|
400,000
|
0
|
24,816
|
|
Termination or
resignation following a potential change of control
|
400,000
|
0
|
24,816
|
|
Successor fails to
assume the contract
|
400,000
|
0
|
24,816
|
(1)
Payment for
benefit costs paid by the Company on behalf of Ms. McKnight that
are not generally available to other employees for insurance and
medical benefits calculated based on current applicable
premiums.
Risk Oversight
Management of risk
is the direct responsibility of the Company’s CEO and the
senior management team. The Board has oversight responsibility
focusing on key enterprise risk management issues and evaluating
the risk mitigation processes established by senior
management.
Versar
faces a variety of enterprise risks, including legislative and
regulatory risk, liquidity risk, compliance risk and operational
risk. The Board believes that an effective risk management process
should (1) identify in a timely fashion the material risks facing
the Company, (2) communicate to the Board the relevant information
regarding senior executive management strategies and their
associated risks, (3) implement appropriate and responsive risk
management strategies consistent with the Company’s risk
profile, and (4) integrate risk management throughout the
Company’s decision-making processes.
In
addition to the formal compliance program, the Board and senior
management promote a corporate culture that incorporates risk
management into the Company’s corporate strategy and daily
operations. The Board also continually works, with the input of
senior management, to assess and analyze the most likely areas of
future risk for the Company. We believe that the Board’s
leadership structure, including strong Board committee chairs and
open communication between senior management and directors,
promotes effective oversight of Versar’s risk management
program.
During
fiscal 2016, the Compensation Committee considered the impact of
the Company’s executive compensation policies and practices,
and the incentives created by its policies and practices, on the
Company’s risk profile, and concluded that such policies and
practices do not motivate imprudent risk taking. In addition, the
Committee periodically reviews all of the Company’s
compensation policies and procedures, including the incentives they
create, and factors that may reduce the likelihood of excessive
risk taking, to determine whether they present a significant risk
to the Company. In conducting this review, the Committee also
reviews the compensation program for any design features which have
been identified by experts as having the potential to encourage
excessive risk-taking, including:
●
excessive focus on equity;
●
compensation mix overly weighted toward annual
incentives;
●
highly leveraged payout curves and uncapped payouts;
●
unreasonable goals and thresholds; and
●
steep payout cliffs at performance levels that may encourage
short-term business decisions to meet payout
thresholds.
In
reaching its conclusion, the Committee identified several features
of its compensation program that reduce the likelihood of excessive
risk taking:
●
the Company’s program and policies are designed to provide a
balanced mix of cash and restricted equity, annual and longer-term
incentives;
●
maximum payout levels for non-equity incentive plan compensation
are capped based on a review of the Company’s economic
position and prospects, as well as the benchmarking of compensation
offered by comparable companies; and
●
the Committee has discretion to alter, including to reduce,
incentive plan payouts or make discretionary awards.
Item 12. Security Ownership of Certain Beneficial Owners and
Management and Related Stockholder Matters
Stock Ownership of Certain
Beneficial Owners
The
table below sets forth, as of March 1, 2016, the only persons known
by the Company to be the beneficial owners of more than 5% of the
outstanding shares of Common Stock.
|
Name and Address of
Beneficial Owner
|
Amount and Nature of Beneficial Ownership
|
Percent of Class of Stock
|
|
Ariel
Investments, LLC (1)
200 E.
Randolph Drive, Suite 200
Chicago, IL
60601
|
1,765,373
|
17.8
|
|
Wedbush, Inc.
(2)
1000
Wilshire Boulevard
Los
Angeles, California 90017
|
698,514
|
7.00
|
|
Dr.
Robert L. Durfee (3)
6850
Versar Center
Springfield, VA
22151
|
596,948
|
5.99
|
|
Illinois
Municipal Retirement Fund (4)
2211
York Road, Suite 500
Oak
Brook, IL 60523
|
557,335
|
5.6
|
(1)
The information
with respect to the shares of Common Stock held by Ariel
Investments, LLC (“Ariel”) is based on a filing made on
Schedule 13G/A on February 14, 2017 with the U.S. Securities
and Exchange Commission (the “SEC”) by Ariel. Ariel
reports sole voting power as to 1,032,735 shares and sole
dispositive power as to 1,765,373 such shares.
(2)
The information
with respect to the shares of Common Stock held by Wedbush, Inc. is
based on filings made on Schedule 13G/A on February 15, 2017
with the SEC by Wedbush, Inc., Edward W. Wedbush and
Wedbush Securities, Inc. (collectively,
“Wedbush”) filing as a group. Wedbush reports that
Wedbush, Inc. has sole voting and sole dispositive power as
to 218,268 shares. Edward W. Wedbush has the sole voting
and sole dispositive power as to 365,255 shares. Wedbush
Securities, Inc. has sole voting and sole dispositive power as to
zero shares. Wedbush, Inc. has shared voting and dispositive
power as to 218,268 shares. Edward W. Wedbush has shared voting
power as to 583,523 and shared dispositive power as to 698,514
shares. Wedbush Securities, Inc. has shared voting power
as to 218,268 shares and shared dispositive power as to
328,259.
(3)
For a description
of the nature of the beneficial ownership of Dr. Durfee, see
“Stock Ownership of Directors and Officers” below. The
information with respect to shares of Common Stock held by Dr.
Durfee is based upon filings with the SEC and information supplied
by Dr. Durfee.
(4)
The information
with respect to the shares of Common Stock held by Illinois
Municipal Retirement Fund (“IMRF”) is based on filings
made on Schedule 13G on February 11, 2013 with the SEC by IMRF.
IMRF reports sole voting and shared dispositive power with respect
to all such shares.
Stock Ownership of Directors and Officers
The
following table sets forth certain information regarding the
ownership of Versar's Common Stock by the Company’s Directors
and each named executive officer listed in the Summary Compensation
Table, each nominee for Director and the Company's Directors and
executive officers as a group, as of March 1,
2016.
|
Individual or Group
|
Shares of Common Stock Beneficially Owned as of March 1, 2016
(1)
|
|
|
Number (5)
|
Percent
|
|
|
Paul
J. Hoeper
|
95,590
|
*
|
|
Robert
L. Durfee
|
596,948
|
5.99
|
|
James
L. Gallagher
|
58,390
|
*
|
|
Amoretta M.
Hoeber
|
56,790
|
*
|
|
Amir
A. Metry
|
74,519
|
*
|
|
Anthony L. Otten
(2)
|
119,442
|
1.20
|
|
Frederick M.
Strader
|
25,000
|
*
|
|
Jeffrey A.
Wagonhurst
|
82,346
|
*
|
|
Cynthia A. Downes
(3)
|
33,035
|
*
|
|
James
D. Villa (4)
|
21,180
|
*
|
|
Linda
M. McKnight
|
21,498
|
*
|
|
All
directors and executive officers as a group (11 persons)
(4)
|
1,184,738
|
11.91
|
* =
Less than 1%
(1)
For the purposes
of this table, beneficial ownership has been determined in
accordance with the provisions of Rule 13d-3 under the Securities
and Exchange Act, as amended. The table includes all unvested
shares of restricted stock and restricted stock units owned by the
individual.
(2)
Mr. Otten is a Trustee of Versar Inc.’s 401(k) Plan and as
such, he has shared investment power as to 223,880 shares and
shared voting power as to 223,880 shares held by this plan. Mr. Otten
disclaims beneficial ownership of the plan shares arising solely
from his position as Trustee, none of which are included in the
above table.
(3)
Ms. Downes is a
Trustee of Versar Inc.’s 401(k) Plan and as such she has
shared investment power over 223,880 shares and shared voting power over
223,880 shares held by this plan. Ms. Downes disclaims beneficial
ownerships of the plan shares arising solely from her position as
Trustee, none which are included in the above table.
(4)
Mr. Villa is a
Trustee of Versar Inc.’s 401(k) Plan and as such he has
shared investment power over 223,880 shares and a shared voting
power over 223,880 shares held by this plan. Mr. Villa disclaims
beneficial ownerships of the plan shares arising solely from his
position as Trustee, none of which are included in the above
table.
(5)
Excludes shares
held by Versar Inc.’s 401(k) Plan as described in notes 3 and
5. Includes restricted stock units that have not yet
vested.
Item 13. Certain Relationships and Related Transactions, and
Director Independence
The
Company does not generally engage in related party transactions
with its directors or executive officers or their affiliates. If a
proposed related transaction arises, the Company will present such
a transaction to the full Board for its review and
approval.
The
Board believes that independent directors must constitute a
substantial majority of the Board. The Board has determined that
all of the following six (6) non-employee directors in fiscal 2016
are independent directors: Paul J. Hoeper, Robert L. Durfee, James
L. Gallagher, Amoretta M. Hoeber, Amir A. Metry and Frederick M.
Strader. Throughout fiscal 2016, all Board members, except Mr.
Otten and Mr. Wagonhurst, met the NYSE MKT and SEC standards for
independence.
Item 14. Principal Accountant Fees and Services
Pre-Approval of Independent Auditor Fees and Services
Policy
The
Audit Committee has adopted a pre-approval policy for services and
fees by its registered public accounting firm. Pursuant to this
policy, the Audit Committee is required to pre-approve the audit
and non-audit services to be performed by the independent
registered public accounting firm in order to assure that the
provision of such services does not impair the firm’s
independence. The services and estimated fees are presented to the
Audit Committee for consideration in the following categories:
Audit, Audit-Related, Tax and All Other (each as defined in
Schedule 14A of the Securities Exchange Act of 1934). All services by Grant
Thornton rendered in fiscal 2016 and 2015 received prior approval
by the Audit Committee. The Committee expects that all services
performed by Urish Popeck in fiscal 2017 will be subject to
pre-approval by the Audit Committee.
Audit Fees
In
fiscal 2016 and 2015, Versar paid Grant Thornton $400,260 and
$281,360, respectively, for quarterly reviews and the annual fiscal
year audit. Versar also made payments of $9,567 and $4,879 in
fiscal 2016 and 2015 to SGV &
Co. for audit services in the Philippines. Versar paid Grant
Thornton $22,754 and $36,614 for audit services in the United
Kingdom in fiscal 2016 and 2015. During fiscal 2017 the Company
changed independent auditors from Grant Thornton to Urish Popeck
& Co. for our fiscal 2016 audit. We paid Urish Popeck $210,000
to complete our fiscal 2016 audit.
Audit-Related Fees
Versar
paid Grant Thornton $75,953 in fiscal 2016 and $137,467 in fiscal
2015 for audit-related fees for assurance and related
services.
Tax Fees
In
fiscal 2016 and 2015, Versar paid $158,445 and $249,182,
respectively, to Grant Thornton for federal and state tax
compliance services. Versar paid $4,686 and $1,318 in fiscal 2016
and 2015 to SGV & Co. for tax advisory services in the
Philippines.
All Other Fees
In
fiscal 2016 and 2015, Versar paid $25,351 and $36,815, respectively, to
Grant Thornton for various tax consulting, including acquisition
accounting advice. In fiscal 2016, Versar paid Grant Thornton
$4,686 for various tax consulting and stamp duty filings in the
United Kingdom.
PART IV
Item 15. Exhibits and Financial Statement Schedules
(1) Financial Statements:
The following consolidated financial statements of Versar, Inc. and
Subsidiaries are included as part of this report on Form 10-K in
Item 8. Financial Statements and Supplementary Data.
a. Report of Independent Registered Public Accounting
Firm
b. Consolidated Balance Sheets as of July 1, 2016 and June
26, 2015
c. Consolidated Statements of Operations for the Years Ended
July 1, 2016, June 26, 2015, and June 27, 2014.
d. Consolidated Statements of Comprehensive Income (Loss) for
the Years Ended July 1, 2016, June 26, 2015, and June 27,
2014.
e. Consolidated
Statements of Changes in Stockholders’ Equity for the Years
Ended July 1, 2016, June 26, 2015, and June 27, 2014.
f. Consolidated Statements of Cash Flows for the Years Ended
July 1, 2016, June 26, 2015, and June 27, 2014.
g. Notes to Consolidated Financial Statements
(2)
Financial Statement Schedules:
a. Schedule II - Valuation and Qualifying Accounts for the
Years Ended July 1, 2016, June 26, 2015, and June 27,
2014.
All other schedules, except those listed above, are omitted because
they are not applicable or the required information is shown in the
consolidated financial statements or notes thereto.
The exhibits to this Form 10-K are set forth in a separate Exhibit
Index which is included on pages 64 through 67 of this
report.
Exhibit Index
|
Item No
|
Description
|
Reference
|
|
|
|
|
|
|
|
|
|
3.1
|
Restated Certificate of Incorporation of Versar, Inc. filed on
September 25, 1986
|
(L)
|
|
|
|
|
|
3.2
|
Certificate of Amendment of Restated Certificate of Incorporation
of Versar, Inc. filed on December 24, 1996
|
(L)
|
|
|
|
|
|
3.3
|
Certificate of Amendment of Restated Certificate of Incorporation
of Versar, Inc. filed on January 26, 1999
|
(L)
|
|
|
|
|
|
3.4
|
Second Amended and Restated By-laws of Versar, Inc. Specimen of
Certificate of Common Stock of Versar, Inc. (A)
|
(B)
|
|
|
|
|
|
4.1
|
Versar, Inc. Restated Employee 401(k) Plan
|
(C)
|
|
|
|
|
|
4.2
|
Amendment to the Versar, Inc. Restated Employee 401(k) Plan
implementing automatic enrollment unless the participant makes a
contrary election
|
(C)
|
|
|
|
|
|
4.3
|
Amendment merging the Advent 401(k) Profit Sharing Plan and Trust
to the Versar, Inc. Restated Employee 401(k) Plan
|
(C)
|
|
|
|
|
|
4.4
|
Amendment to the Versar, Inc. Restated Employee 401(k) Plan
implementing 1% automatic annual increase of deferral amount to all
participants under 6% deferral rate effective January 1, 2013 until
it reached the maximum cap of 6%
|
(C)
|
|
|
|
|
|
4.5
|
Amendment to the Versar, Inc. Restated Employee 401(k) Plan
excluding employees who are already eligible to participate in the
Charron Construction Consulting, Inc. 401(k) Plan
|
(C)
|
|
|
|
|
|
4.6
|
Amendment to the Versar, Inc. Restated Employee 401(k) Plan adding
Roth Deferrals in the Contribution types and merging the Charron
Construction Consulting, Inc. 401(k) Plan with and into the
Plan
|
(C)
|
|
|
|
|
|
10.1
|
Executive Tax and Investment Counseling Program
|
(A)
|
|
|
|
|
|
10.2
|
Form of Indemnification Agreement*
|
(F)
|
|
|
|
|
|
10.3
|
Change in Control Severance Agreement
between Anthony L. Otten and Versar, Inc. effective as of May
24, (G)
2011*
|
(E)
|
|
|
|
|
|
10.4
|
2010 Stock Incentive Plan*
|
(G)
|
|
|
|
|
|
10.4.1
|
Form of Restricted Share Award Agreement*
|
(G)
|
|
10.4.2
|
Form of Performance Stock Award Agreement*
|
(G)
|
|
|
|
|
|
10.4.3
|
Form of Deferral Election Agreement for Deferred Share
Units*
|
(G)
|
|
|
|
|
|
10.4.4
|
Form of Stock Option Award Agreement*
|
(G)
|
|
|
|
|
|
10.4.5
|
Form of Stock Appreciation Right Award Agreement*
|
(G)
|
|
|
|
|
|
10.4.6
|
Form of Restricted Stock Unit Award Agreement*
|
(G)
|
|
|
|
|
|
10.5
|
Change in Control Severance Agreement between Cynthia A. Downes and
Versar, Inc. effective as of September 8, 2011*
|
(H)
|
|
|
|
|
|
10.6
|
Amendment to Change in Control Severance Agreement dated March 9,
2012 between Versar, Inc. and Anthony L. Otten*
|
(D)
|
|
|
|
|
|
10.7
|
Versar, Inc. 2012 Long-Term Incentive Compensation
Program*
|
(I)
|
|
|
|
|
|
10.8
|
Amended and Restated Loan and Security Agreement date September 13,
2012 between the Registrant, certain of the Registrant’s
subsidiaries and United Bank
|
(M)
|
|
|
|
|
|
10.9
|
Amended and Restated Revolving Commercial Note dated September 14,
2012
|
(N)
|
|
|
|
|
|
10.10
|
Change in Control Severance Agreement between Versar, Inc. and
Anthony L. Otten
|
(J)
|
|
|
|
|
|
10.11
|
Change in Control Severance Agreement between Versar, Inc. and
Jeffrey A. Wagonhurst
|
(J)
|
|
|
|
|
|
10.12
|
Change in Control Severance Agreement between Versar, Inc. and
Cynthia A. Downes
|
(J)
|
|
|
|
|
|
10.13
|
Change in Control Severance Agreement between Versar, Inc. and
Linda M. McKnight
|
(J)
|
|
|
|
|
|
10.14
|
Change in Control Severance Agreement between Versar, Inc. and
James D. Villa
|
(K)
|
|
|
|
|
|
10.15
|
Loan Agreement, dated September 30, 2015, by and among Versar, Inc.
and Bank of America, N.A.
|
(O)
|
|
|
|
|
|
10.16
|
Security Agreement, dated September 30, 2015, by and among Versar,
Inc. and GEO-Marine, Inc., Versar International, Inc., J.M. Waller
Associates, Inc. and Bank of America, N.A.
|
(O)
|
|
|
|
|
|
21
|
Subsidiaries of the Registrant
|
|
|
|
|
|
|
23.1
|
Consent of Independent Registered Public Accounting Firm,
Urish Popeck & Co., LLC
|
|
|
|
|
|
|
23.2
|
Consent of Independent Registered Public Accounting Firm, Grant
Thornton LLP
|
|
|
|
|
|
|
31.1
|
Certifications by Anthony L. Otten, Chief Executive Officer
Pursuant to Securities Exchange Rule 13a-14
|
|
|
|
|
|
|
31.2
|
Certifications by Cynthia A. Downes, Exec. Vice President, Chief
Financial Officer and Treasurer pursuant to Securities Exchange
Rule 13a-14
|
|
|
|
|
|
|
32.1
|
Certifications Pursuant to 18 U.S.C. Section 1350, as adopted
pursuant to Section 906 Of the Sarbanes-Oxley Act of 2002, for the
period ending July 1, 2016 by Anthony L. Otten, Chief Executive
Officer
|
|
|
|
|
|
|
32.2
|
Certifications Pursuant to 18 U.S.C. Section 1350, as adopted
pursuant to Section 906 Of the Sarbanes-Oxley Act of 2002, for the
period ending July 1, 2016 by Cynthia A. Downes, Exec. Vice
President, Chief Financial Officer and Treasurer
|
|
|
|
|
|
|
101+
|
The following materials from Versar Inc.’s Annual Report on
Form 10-K for the fiscal year ended July 1, 2016, formatted in XBRL
(Extensible Business Reporting Language): (i) Consolidated Balance
Sheets as of July 1, 2016, June 29, 2014; (ii) Consolidated
Statements of Operations for the years ended June 29, 2012; (iii)
Consolidated Statements of Comprehensive Income (Loss) for the
years ended June 27, 2014 and June 29, 2012; (iv) Consolidated
Statements of Changes in Stockholders’ Equity for the years
ended June 27, 2014 and June 29, 2012; (v) Consolidated Statements
of Cash Flows for the years ended July 1, 2016, June 29, 2012,;
(vi) Schedule II — Valuation and Qualifying Accounts; and
(vi) Notes to Consolidated Financial Statements, tagged as blocks
of text
|
|
|
(A)
|
Incorporated by reference to the similarly numbered exhibit to the
Registrant’s Form S-1 Registration Statement effective
November 20, 1986.
|
|
|
|
|
(B)
|
Incorporated by reference to the exhibit to the Registrant’s
Form 8-K filed with the Commission on February 17,
2010.
|
|
|
|
|
(C)
|
Incorporated by reference to exhibits 4.1 through 4.6 to the
Registrant’s Form S-8 Registration Statement filed with the
Commission on March 22, 2013.
|
|
|
|
|
(D)
|
Incorporated by reference to exhibit 10.30 to the
Registrant’s Form 10-K Annual Report for the fiscal year
ended June 27, 2014 filed with the Commission on September 18,
2012.
|
|
|
|
|
(E)
|
Incorporated by reference to exhibit 10.1 to the Registrant’s
Form 10-Q filed with the Commission on November 8,
2010.
|
|
|
|
|
(F)
|
Incorporated by reference to exhibit 10.1 to the Registrant’s
Form 8-K filed with the Commission on May 11, 2009.
|
|
|
|
|
(G)
|
Incorporated by reference to exhibits 4.1 through 4.7 to the
Registrant’s Form S-8 filed with the Commission on February
15, 2011.
|
|
|
|
|
(H)
|
Incorporated by reference to exhibit 10.1 to the Registrant’s
Form 8-K filed with the Commission on September 13,
2011.
|
|
|
|
|
(I)
|
Incorporated by reference to exhibit 10.1 to the Registrant’s
Form 8-K filed with the Commission on May 9, 2012.
|
|
|
|
|
(J)
|
Incorporated by reference to exhibits 10.35 through 10.37 and
exhibit 10.40 to the Registrant’s Form 8-K filed with the
Commission on September 18, 2013.
|
|
|
|
|
(K)
|
Incorporated by reference to exhibit 10.1 to the Registrant’s
Form 8-K filed with the Commission on May 14, 2014.
|
|
|
|
|
(L)
|
Incorporated by reference to exhibit 3.1 to the Registrant’s
Form 10-K filed with the Commission on September 10,
2014.
|
|
|
|
|
(M)
|
Incorporated by reference to exhibit 10.34 to the
Registrant’s Form 8-K filed with the Commission on
September 17, 2012.
|
|
|
|
|
(N)
|
Incorporated by reference to exhibit 10.33 to the
Registrant’s Form 8-K filed with the Commission on
September 17, 2012.
|
|
|
|
|
(O)
|
Incorporated by reference to exhibit 10.1 to the Registrant’s
Form 8-K filed with the Commission on October 6,
2015.
|
|
|
|
|
(P)
|
Incorporated by reference to exhibit 10.2 to the Registrant’s
Form 8-K filed with the Commission on October 6,
2015.
|
__________________________________________________
* Indicates management contract or compensatory plan or
arrangement.
SIGNATURES
Pursuant to the requirements of Section 13 or 15(d) of the
Securities Exchange Act of 1934, the registrant has duly caused
this report to be signed on its behalf by the undersigned,
thereunto duly authorized.
|
|
VERSAR, INC.
|
|
|
|
|
|
|
|
|
Date:
March 28, 2017
|
By:
|
/s/
Paul J. Hoeper
|
|
|
|
|
Paul
J. Hoeper
|
|
|
|
|
Chairman and
Director
|
|
Pursuant to the requirements of the Securities Exchange Act of
1934, this report has been signed below by the following persons on
behalf of the registrant in the capacities and on the dates
indicated.
|
Signature
|
|
Title
|
|
Date
|
|
|
|
|
|
|
|
/s/
Paul J. Hoeper
|
|
Chairman and
Director
|
|
March
28, 2017
|
|
Paul
J. Hoeper
|
|
|
|
|
|
|
|
|
|
|
|
/s/
Anthony L. Otten
|
|
Chief
Executive Officer and Director
|
|
March
28, 2017
|
|
Anthony L.
Otten
|
|
|
|
|
|
|
|
|
|
|
|
/s/
Cynthia A. Downes
|
|
Executive Vice President, Chief Financial Officer, Treasurer, and
Principal Accounting Officer
|
|
March
28, 2017
|
|
Cynthia A.
Downes
|
|
|
|
|
|
|
|
|
|
|
|
/s/
Frederick M. Strader
|
|
Director
|
|
March
28, 2017
|
|
Frederick M.
Strader
|
|
|
|
|
|
|
|
|
|
|
|
/s/
Robert L. Durfee
|
|
Director
|
|
March
28, 2017
|
|
Robert
L. Durfee
|
|
|
|
|
|
|
|
|
|
|
|
/s/
James L. Gallagher
|
|
Director
|
|
March
28, 2017
|
|
James
L. Gallagher
|
|
|
|
|
|
|
|
|
|
|
|
/s/
Amoretta M. Hoeber
|
|
Director
|
|
March
28, 2017
|
|
Amoretta M.
Hoeber
|
|
|
|
|
|
|
|
|
|
|
|
/s/
Amir A. Metry
|
|
Director
|
|
March
28, 2017
|
|
Amir
A. Metry
|
|
|
|
|
|
|
|
|
|
|
|
/s/
Jeffrey A. Wagonhurst, Sr.
|
|
Director
|
|
March
28, 2017
|
|
Jeffrey A.
Wagonhurst, Sr.
|
|
|
|
|
Schedule II
VERSAR, INC. AND SUBSIDIARIES
Valuation and Qualifying Accounts
|
|
BALANCE AT BEGINNING OF YEAR
|
ADDITIONS CHARGED TO COSTS AND EXPENSES
|
CHARGEOFFS
|
BALANCE AT END OFYEAR
|
|
Allowance for Doubtful Accounts
|
|
|
|
|
|
2016
|
$616,000
|
$890,000
|
$(505,000)
|
$1,001,000
|
|
2015
|
$643,000
|
$138,000
|
$(165,000)
|
$616,000
|
|
2014
|
$1,529,000
|
$340,000
|
$(1,226,000)
|
$643,000
|
|
|
|
|
|
|
|
Deferred Tax Valuation Allowance
|
|
|
|
|
|
2016
|
$756,000
|
$14,025,000
|
$-
|
$14,781,000
|
|
2015
|
$595,000
|
$161,000
|
$-
|
$756,000
|
|
2014
|
$167,000
|
$428,000
|
$-
|
$595,000
|