Attached files
| file | filename |
|---|---|
| EX-32.1 - EX-32.1 - RLJ ENTERTAINMENT, INC. | rlje-ex321_7.htm |
| EX-31.2 - EX-31.2 - RLJ ENTERTAINMENT, INC. | rlje-ex312_9.htm |
| EX-31.1 - EX-31.1 - RLJ ENTERTAINMENT, INC. | rlje-ex311_8.htm |
| EX-23.1 - EX-23.1 - RLJ ENTERTAINMENT, INC. | rlje-ex231_10.htm |
| EX-21.1 - EX-21.1 - RLJ ENTERTAINMENT, INC. | rlje-ex211_6.htm |
UNITED STATES
SECURITIES AND EXCHANGE COMMISSION
Washington, D.C. 20549
FORM 10-K
|
☒ |
ANNUAL REPORT PURSUANT TO SECTION 13 OR 15(d) OF THE SECURITIES EXCHANGE ACT OF 1934 for the Fiscal Year Ended December 31, 2016 |
OR
|
☐ |
TRANSITION REPORT PURSUANT TO SECTION 13 OR 15(d) OF THE SECURITIES EXCHANGE ACT OF 1934 |
For the Transition Period from To
Commission File Number 001-35675

RLJ ENTERTAINMENT, INC.
(Exact name of registrant as specified in its charter)
|
Nevada |
45-4950432 |
|
(State or other jurisdiction of incorporation) |
(I.R.S. Employer Identification Number) |
8515 Georgia Avenue, Suite 650, Silver Spring, Maryland, 20910
(Address of principal executive offices, including zip code)
(301) 608-2115
(Registrant’s telephone number, including area code)
Securities registered pursuant to Section 12(b) of the Act:
|
|
Title of Each Class: |
|
Name of Each Exchange on Which Registered: |
|
|
|
Common Stock, par value $0.001 |
|
NASDAQ Capital Market |
|
Securities registered pursuant to Section 12(g) of the Act:
Warrants to purchase Common Stock
Indicate by check mark if the registrant is a well-known seasoned issuer, as defined in Rule 405 of the Securities Act. YES ☐ NO ☒
Indicate by check mark if the registrant is not required to file report pursuant to Section 13 or Section 15(d) of the Act. YES ☐ NO ☒
Indicate by check mark whether the registrant (1) has filed all reports required to be filed by Section 13 or 15(d) of the Securities Exchange Act of 1934 during the preceding 12 months (or for such shorter period that the registrant was required to file such reports), and (2) has been subject to such filing requirements for the past 90 days. YES ☒ NO ☐
Indicate by check mark whether the registrant has submitted electronically and posted on its corporate Web site, if any, every Interactive Data File required to be submitted and posted pursuant to Rule 405 of Regulation S-T during the preceding 12 months (or for such shorter period that the registrant was required to submit and post such files). YES ☒ NO ☐
Indicate by check mark if disclosure of delinquent filers pursuant to Item 405 of Regulation S-K is not contained herein, and will not be contained, to the best of the registrant’s knowledge, in definitive proxy or information statements incorporated by reference in Part III of this Form 10-K or any amendment to this Form 10-K. ☐
Indicate by check mark whether the registrant is a large accelerated filer, an accelerated filer, a non-accelerated filer, or a smaller reporting company. See the definitions of “large accelerated filer,” “accelerated filer” and “smaller reporting company” in Rule 12b-2 of the Exchange Act. (Check one):
|
Large accelerated filer |
☐ |
|
|
Accelerated filer |
☐ |
|
Non-accelerated filer |
☐ |
(Do not check if a smaller reporting company) |
|
Smaller reporting company |
☒ |
Indicate by check mark whether the registrant is a shell company (as defined in Rule 12b-2 of the Exchange Act). YES ☐ NO ☒
The aggregate market value of the voting stock held by non-affiliates computed on June 30, 2016, based on the sales price of $1.95 per share: Common Stock - $6,066,670. All directors and executive officers have been deemed, solely for the purpose of the foregoing calculation, to be “affiliates” of the registrant; however, this determination does not constitute an admission of affiliate status for any of these shareholders.
The number of shares outstanding of the registrant’s common stock as of March 16, 2017: 5,342,586
DOCUMENTS INCORPORATED BY REFERENCE
None.
Form 10-K Annual Report
For The Year Ended December 31, 2016
TABLE OF CONTENTS
|
|
|
|
|
4 |
|
|
|
|
|
|
|
|
|
|
ITEM 1. |
|
|
4 |
|
|
|
ITEM 1A. |
|
|
17 |
|
|
|
ITEM 1B. |
|
|
23 |
|
|
|
ITEM 2. |
|
|
24 |
|
|
|
ITEM 3. |
|
|
24 |
|
|
|
ITEM 4. |
|
|
24 |
|
|
|
|
|
|
|
|
|
|
|
|
|
25 |
|
|
|
|
|
|
|
|
|
|
ITEM 5. |
|
|
25 |
|
|
|
ITEM 6. |
|
|
26 |
|
|
|
ITEM 7. |
|
Management’s Discussion and Analysis of Financial Condition and Results of Operations |
|
26 |
|
|
ITEM 7A. |
|
|
43 |
|
|
|
ITEM 8. |
|
|
44 |
|
|
|
ITEM 9. |
|
Changes in and Disagreements with Accountants on Accounting and Financial Disclosure |
|
85 |
|
|
ITEM 9A. |
|
|
85 |
|
|
|
ITEM 9B. |
|
|
86 |
|
|
|
|
|
|
|
|
|
|
|
|
|
87 |
|
|
|
|
|
|
|
|
|
|
ITEM 10. |
|
|
87 |
|
|
|
ITEM 11. |
|
|
92 |
|
|
|
ITEM 12. |
|
Security Ownership of Certain Beneficial Owners and Management and Related Stockholder Matters |
|
96 |
|
|
ITEM 13. |
|
Certain Relationships and Related Transactions and Director Independence |
|
99 |
|
|
ITEM 14. |
|
|
102 |
|
|
|
|
|
|
|
|
|
|
|
|
|
103 |
|
|
|
|
|
|
|
|
|
|
ITEM 15. |
|
|
103 |
|
|
|
ITEM 16. |
|
|
106 |
|
|
|
|
|
|
|
|
|
|
|
|
107 |
||
|
|
|
|
|
|
|
|
Certifications |
|
|
|
|
|
This Annual Report on Form 10-K for the year ended December 31, 2016 (or Annual Report) includes forward-looking statements that involve risks and uncertainties within the meaning of the Private Securities Litigation Reform Act of 1995. Other than statements of historical fact, all statements made in this Annual Report are forward-looking, including, but not limited to, statements regarding industry prospects, future results of operations or financial position, and statements of our intent, belief and current expectations about our strategic direction, prospective and future results and condition. In some cases, forward-looking statements may be identified by words such as “will,” “should,” “could,” “may,” “might,” “expect,” “plan,” “possible,” “potential,” “predict,” “anticipate,” “believe,” “estimate,” “continue,” “future,” “intend,” “project” or similar words.
Forward-looking statements involve risks and uncertainties that are inherently difficult to predict, which could cause actual outcomes and results to differ materially from our expectations, forecasts and assumptions. Factors that might cause such differences include, but are not limited to:
|
|
• |
Our financial performance, including our ability to achieve improved results from operations and improved earnings before income tax, depreciation and amortization, non-cash royalty expense, interest expense, non-cash exchange gains and losses on intercompany accounts, goodwill impairments, severance costs, change in fair value of stock warrants and other derivatives, stock-based compensation, basis-difference amortization in equity earnings of affiliate and dividends received from affiliate in excess of equity earnings of affiliate (or Adjusted EBITDA); |
|
|
• |
Our expectation that revenues and financial performance of our digital channels will continue to grow and have a positive effect on our liquidity, cash flows and operating results; |
|
|
• |
The effects of limited cash liquidity on operational performance; |
|
|
• |
Our obligations under the credit agreement; |
|
|
• |
Our ability to satisfy financial ratios; |
|
|
• |
Our ability to generate sufficient cash flows from operating activities; |
|
|
• |
Our ability to fund planned capital expenditures and development efforts; |
|
|
• |
Our inability to gauge and predict the commercial success of our programming; |
|
|
• |
Our ability to maintain relationships with customers, employees and suppliers, including our ability to enter into revised payment plans, when necessary, with our vendors that are acceptable to all parties; |
|
|
• |
Our ability to realize anticipated synergies and other efficiencies in connection with the AMC transaction; |
|
|
• |
Delays in the release of new titles or other content; |
|
|
• |
The effects of disruptions in our supply chain; |
|
|
• |
The loss of key personnel; |
|
|
• |
Our public securities’ limited liquidity and trading; or |
|
|
• |
Our ability to meet the NASDAQ Capital Market continuing listing standards and maintain our listing. |
You should carefully consider and evaluate all of the information in this Annual Report, including the risk factors listed above and elsewhere, including “Item 1A. Risk Factors” below. If any of these risks occur, our business, results of operations and financial condition could be harmed, the price of our common stock could decline and you may lose all or part of your investment, and future events and circumstances could differ significantly from those anticipated in the forward-looking statements contained in this Annual Report. Unless otherwise required by law, we undertake no obligation to release publicly any updates or revisions to any such forward-looking statements that may reflect events or circumstances occurring after the date of this Annual Report.
3
Overview
RLJ Entertainment, Inc. (RLJE or the Company) is a premium digital channel company serving distinct audiences through its proprietary subscription-based digital channels (or Digital Channels), Acorn TV and UMC or Urban Movie Channel, which have consistently maintained a 100% year-over-year growth rate since launch in 2011 and 2015, respectively. Acorn TV features high-quality British and International mysteries and dramas. UMC showcases quality urban programming including feature films, documentaries, original series, stand-up comedy and other exclusive content for African-American and urban audiences. RLJE exclusively controls, co-produces, and owns a large library of British Dramas, Independent Feature Films and Urban content. RLJE content IP ownership includes a 64% equity participation in Agatha Christie Ltd. (or ACL). RLJE’s IP licensing and media distribution operations support its Digital Channels by increasing program flow and monetizing content across all windows of exploitation.
RLJE was incorporated in Nevada in April 2012. On October 3, 2012, we completed the business combination of RLJE, Image Entertainment, Inc. (or Image) and Acorn Media Group, Inc. (or Acorn Media or Acorn), which is referred to herein as the “Business Combination.” We have a direct presence in North America, the United Kingdom (or U.K.) and Australia with strategic sublicense and distribution relationships covering Europe, Asia and Latin America. The use of “we,” “our” or “us” within this Annual Report is referring to RLJE and its subsidiaries.
Acorn TV was launched in July 2011 and features mysteries, dramas, and comedies from Britain and beyond with exclusive premieres of popular series including Agatha Christie’s Poirot, Foyle’s War, Doc Martin, A Place to Call Home, Agatha Raisin, and Brokenwood Mysteries. Acorn TV can be accessed through Apple TV, iPhone, iPad, Android devices, Roku, Fire TV, Samsung SmartTVs, Opera devices and online at www.acorn.tv.
The following table shows quarterly subscriber growth which approximates 100% year-over-year for Acorn TV.
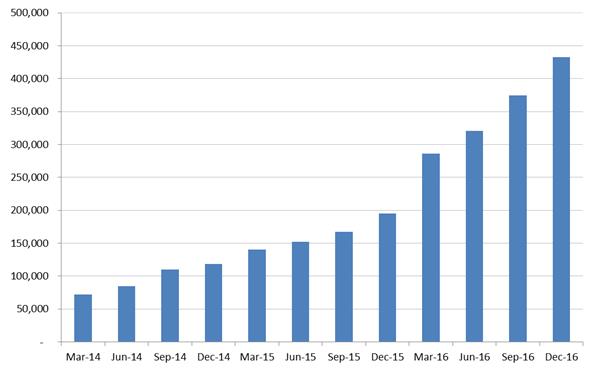
4
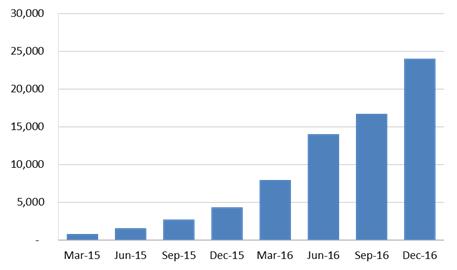
UMC was launched in 2015 targeting a broad range of urban/African-American households in the United States (or U.S). The channel provides compelling African-American and urban-focused content in an underserved streaming environment to an interested audience. The channel leverages our current urban content library along with investments in new content in the form of licensing acquisitions, which premiere on UMC such as: #Lucky Number, Knucklehead, Nina, Second Coming, Like Cotton Twines, Breaking a Monster, No Regrets and Another Man Will. UMC can be accessed through Apple TV, iPhone, iPad, Roku, FireTV, Samsung SmartTVs, Opera devices and online at www.UMC.tv.
The following table shows quarterly subscriber growth which approximates 300% year-over-year for UMC.
Our Digital Channels continue to perform strongly on Amazon Channels, an add-on streaming video service available to Amazon Prime customers. This strategic expansion into third-party distribution of our digital streaming services offers us a significant increase in addressable audience and brand awareness. All platforms offer a 7-day free trial to attract new subscribers.
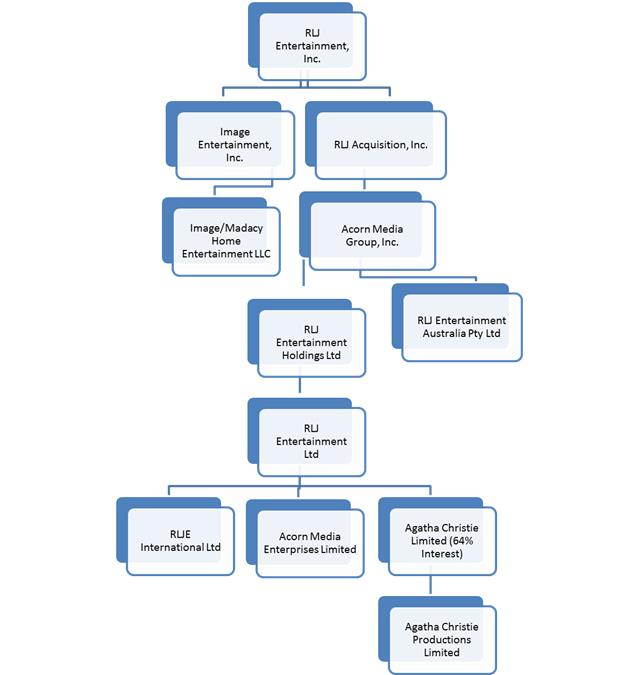
RLJE manages and develops our intellectual property rights on British drama and mysteries via RLJ Entertainment Ltd. and its subsidiaries (collectively RLJE UK, see company chart below). Our owned content includes 28 Foyle’s War made-for-TV films; multiple instructional Acacia titles; and through our 64% ownership interest of ACL, the Agatha Christie library. ACL is home to some of the world’s greatest literary works of mystery fiction, including Murder on the Orient Express, Death on the Nile and And Then There Were None and includes publishing and TV/film rights to iconic sleuths such as Hercule Poirot and Miss Marple. The Agatha Christie library contains a variety of short story collections, more than 80 novels, 19 plays and a film library of over 100 made-for-television films. In 2014, ACL published its first book, The Monogram Murders, since the death of Agatha Christie and has subsequently published its second, Closed Casket, in 2016. Our television productions are typically financed by the pre-sale of certain distribution rights, typically being international TV distribution rights, as well as tax credits. The pre-sale of these rights, alongside the realization of tax incentives, allows RLJE UK to reduce production risks.
We acquire content rights in various categories, with particular focus on British mysteries and dramas, urban-themed programming and full-length motion pictures. We acquire this content in two ways:
|
|
• |
Through long-term exclusive licensing agreements where we secure multiple rights to third-party programs. Generally, the rights we secure include broadcast, theatrical, digital (transactional and streaming), and physical (DVD and Blu-ray), and; |
|
|
• |
Through development, production and ownership of original drama television programming through our wholly-owned U.K. subsidiary, Acorn Media Enterprises Limited (or AME) and our 64%-owned subsidiary, ACL. |
We control an extensive program library in genres such as British mysteries and dramas, urban/African-American, action/thriller and horror, fitness/lifestyle and long-form documentaries.
We monetize our library content through carefully managed distribution windows across multiple platforms including:
|
|
• |
Broadcast/cable channels; |
|
|
• |
Digital distribution formats, which are subscription video on demand (or SVOD); |
5
|
|
• |
Ad-supported video on demand (or AVOD); |
|
|
• |
Download-to-rent and electronic sell through (or EST), and; |
|
|
• |
DVD and Blu-ray retail and online ecommerce. |
We market our products through a multi-channel strategy encompassing:
|
|
• |
Proprietary subscription-based digital platforms, Acorn TV and UMC, (our Digital Channels segment); |
|
|
• |
The licensing of original program offerings through our wholly-owned subsidiary, AME and our 64%-owned subsidiary, ACL (our Intellectual Property Licensing or IP Licensing segment); and |
|
|
• |
Wholesale distribution through digital, mobile, broadcast, cable partners, ecommerce and brick and mortar and traditional print catalog and ecommerce offerings (our Wholesale Distribution segment). |
6
A summary of our significant corporate entities and structure is as follows:
Strategic Growth of the Company
We expect to increase our subscriber growth to one million subscribers within 24 months. To that end, our growth initiatives include the following:
|
|
• |
Expand the geographical footprints of our Digital Channels; |
|
|
• |
Enhance our subscribers’ experience through continued improved apps and digital platforms; |
|
|
• |
Continue to provide unique, appealing, exclusive and high-quality titles and; |
|
|
• |
Acquire long-term and exclusive broad exploitation rights for finished programs across key genres. |
7
To achieve the full potential growth of our Digital Channels, we have realigned our IP Licensing and Wholesale Distribution businesses to support the growth and profitability of Acorn TV and UMC. We are leveraging the proprietary content output from Agatha Christie Ltd. to strengthen the association of Acorn TV with the Agatha Christie brand. We are leveraging the Wholesale Distribution business for Acorn in the acquisition of broader content rights for Acorn TV and we are creating a secondary SVOD window for our feature films on UMC. Additionally, we are expanding the distribution footprint of Acorn TV and UMC, growing our marketing support and continuing to strengthen internal operational capabilities to understand our audiences.
Our business model minimizes production and box-office risks by acquiring finished products with long-term rights over multiple platforms. We strive to maximize the full value of our program library by pursuing the development and acquisition of content and by actively managing all windows of exploitation. We undertake co-production opportunities through AME to secure greater rights control and exclusive windows for SVOD distribution on our Digital Channels.
We believe that the convergence of television and the internet will promote the continued migration of consumers from bundled offering to a la carte subscription benefitting digital OTT platforms like Acorn TV and UMC. As a result, we have aligned our goals to (i) continue to develop unique brands that appeal to and capture dedicated audiences, (ii) develop strong content offerings that consumers are willing to pay for and (iii) provide superior service. Our goal is to continue to develop strong brands that create a destination that promotes consumer loyalty and maximizes our audiences’ experience.
Investments in Content
Our business model relies on developing and acquiring content that satisfies the desire of niche audiences for high quality entertainment within specific genres. We then monetize content across all platforms through carefully orchestrated windows of distribution. When developing content, we develop new treatments from the intellectual property (or IP) we own. We also acquire finished programs through long-term exclusive contracts. We invest in content offerings that we believe will meet or exceed management’s 20% return-on-investment (or ROI) threshold. Our definition of ROI is the return on investment over the life of the investment (generally 7 - 10 years), and it is calculated by dividing estimated content earnings by its initial investment. Content earnings are calculated by estimating the future earnings, which is after subtracting costs (including overhead) necessary to maintain the investment, and discounting the earnings using a risk-appropriate rate.
RLJE invests approximately $30 million to $40 million annually in content. These investments are added to our balance sheet as either content investments or payments on royalty and distribution obligations. Content investments are expensed through the statement of operations as either content amortization or as royalty expense. Management is focused on content investments that generate high financial returns and have strong strategic value to our Digital Channels and Wholesale Distribution business. Management exited content genres and content agreements that were either not profitable, not meeting our financial goals, or areas where we could not acquire comprehensive long-term distribution rights or control over the content. Additionally, management completed the re-alignment of our investment across key genres, mainly British mystery and dramas, urban, action-thriller, horror and documentaries.
8
Our investments in content provide us with significant cash flows and generate working capital, which are continuously re-deployed to acquire or produce new content and fund strategic initiatives. Some of the key programs in 2016 and planned releases for 2017 are as follows:
|
|
British Mystery and Drama • Agatha Christie’s And Then There Were None • The Fall, Series 2 • Murdoch Mysteries, Season 9 and A Merry Murdoch Christmas • A Place to Call Home, Season 3 • Humans • Vera, Set 6 and Sets 1-5 Collection • Agatha Raisin • Brokenwood Mysteries, Series 2 • Miss Fisher’s Murder Mysteries, Series 1-3 Collection • New Tricks, Season 12 • Close to the Enemy • The Level • Suspects, Series 1 & 2 • Janet King, Series 2: Invisible Wound • Wentworth, Season 1 • Irish R.M., The Complete Collection
|
|
|
|
||
|
|
Urban • Nina |
|
|
Feature Films • I.T. • Kickboxer • Bone Tomahawk • Criminal Activities • Dog Eat Dog |
|
• Sin Seer • Curveball • Breaking a Monster • Knucklehead
|
|
|
||
|
|
||


9
|
Horror • Kill or Be Killed • The Hoarder • The Mind’s Eye • The Haunting of Alice D • All Hallow’s Eve 2 • Uncaged • Painkillers • Monsterland • Condemned
|
|

|
|
DocumentarY • Soundbreaking • Britain’s Bloody Crown
|
|

|
|
|
|
2017 Planned Releases • Once Upon a Time in Venice • Bushwick • The Osiris Child • Prisoner X • Line of Duty, Series 4 • Murdoch Mysteries, Season 10 • Midsomer Murders, Series 19 • Humans, Series 2 • Agatha Christie’s The Witness for the Prosecution • Loch Ness • The Fall, Series 3 • Brokenwood Mysteries, Series 3 • A Place to Call Home, Season 4 • David E. Talbert’s Another Man Will • Like Cotton Twines
|

10
Our Primary Brands
We focus on high-quality British mystery and drama television, action and thriller independent feature films and diverse urban content, and documentary lines. Titles are segmented into genre-based, franchise and content program lines and are exploited through our various brands. Our brands are as follows:
|
|
|
Known for specializing in the best of British television, Acorn Media Group (or Acorn) monetizes high-quality dramas and mysteries via our digital channel Acorn TV in the U.S. and Canada and to the broadcast/cable and home video windows within the North American, U.K. and Australian markets. In addition to consistently strong national PR, our primary marketing to consumers is through Acorn TV offering viewers over 1,800 hours of high-quality content including exclusive premieres of popular series like A Place to Call Home, Murdoch Mysteries, Agatha Raisin, Doc Martin and Agatha Christie’s Poirot. We further leverage the Acorn brand through a marketing and wholesale partnership with direct-to-consumer specialist Universal Screen Arts (or USA). USA purchases wholesale inventory from us and pays us a license fee for the exclusive right to publish a branded Acorn direct-to-consumer catalog and website (acornonline.com), which market and sell Acorn content on DVD and Blu-ray alongside complementary merchandise. Our Acorn brand generates revenues that are reported in the Digital Channels (Digital Channels revenues), IP Licensing (Agatha Christie revenues) and Wholesale Distribution segments (home video and digital download sales).
|


RLJE UK provides us access to new content as a permanent presence in the U.K. television programming community, and manages and develops our intellectual property rights. Our owned content includes the Agatha Christie branded library, through our 64% ownership interest in ACL acquired in February 2012. The bestselling novelist of all time, Agatha Christie has sold more than 2 billion books, and her work contains a variety of short story collections, more than 80 novels, 19 plays and a film library of over 100 TV productions. Acorn is known for mystery and drama franchises and has been releasing TV movie adaptations featuring Agatha Christie’s two most famous characters, Hercule Poirot and Miss Marple, for over a decade; both series ranking among our all-time bestselling lines. Through ACL, we manage the vast majority of Agatha Christie publishing and television/film assets worldwide and across all mediums and actively develop new content and productions. In addition to film and television projects, in 2014, ACL published its first book, The Monogram Murders, since the death of Agatha Christie and has subsequently published its second, Closed Casket, in 2016. The Agatha Christie family retains a 36% holding, and James Prichard, Agatha Christie’s great-grandson, remains Chairman of ACL.
|
|
|
UMC, or Urban Movie Channel, was created by Robert L. Johnson, Chairman of RLJ Entertainment and founder of Black Entertainment Television (BET). UMC is a premium subscription-based service which features quality urban content showcasing feature films, documentaries, original series, stand-up comedy and other exclusive content for African American and urban audiences. New titles include live stand-up specials like Gary Owen: I Agree With Myself, and performances featuring The Daily Show host Trevor Noah and comedic rock star Kevin Hart; comedy films including #Lucky Number starring Method Man; dramas including Knucklehead starring Emmy Award winning actress Alfre Woodard and Gbenga Akinnagbe and Second Coming starring Golden Globe Award winner Idris Elba and Nadine Marshall; including Tim Reid Presents: The Legacy Documentary Series; action/thrillers including The Sin Seer starring Isaiah Washington and Lisa Arrindell Anderson; and stage play productions including David E. Talbert’s Another Man Will. Select UMC content is also monetized in the home video window in partnership with the RLJE brand. |

11
|
|
|
RLJ Entertainment (or RLJE) is a leading film and television licensee focusing on action, thriller, horror independent feature films and urban content in partnership with our digital channel UMC. RLJE licenses exclusive long-term exploitation rights across all distribution channels, with terms ranging generally from 5 to 25 years. RLJE content is currently distributed primarily in the U.S. and Canada through theatrical, broadcast/cable, physical and digital platforms. In 2014, we began to exploit RLJE content in the U.K. and Australia. Our RLJE titles that generated the highest amount of revenues in 2016 were I.T., Kickboxer, Bone Tomahawk and Criminal Activities. All of the revenues generated by the RLJE brand are included in our Wholesale Distribution segment. |

Trademarks
We currently use several registered trademarks including: RLJ Entertainment, Acorn, Acorn Media, Acorn TV and UMC - Urban Movie Channel. We also currently use registered trademarks through our 64%-owned subsidiary ACL including: Agatha Christie, Miss Marple and Poirot.
The above-referenced trademarks, among others, are registered with the U.S. Patent and Trademark Office and various international trademark authorities. In general, trademarks remain valid and enforceable as long as the marks are used in connection with the related products and services and the required registration renewals are filed. We believe our trademarks have value in the marketing of our products. It is our policy to protect and defend our trademark rights.
Segments
Management views the operations of the Company based on three distinct reporting segments: (1) proprietary subscription-based digital channels (or Digital Channels); (2) Intellectual Property Licensing (or IP Licensing); and (3) Wholesale Distribution. Operations and net assets that are not associated with any of these operating segments are reported as “Corporate” when disclosing and discussing segment information. The Digital Channels segment distributes film and television content through our Digital Channels, Acorn TV and UMC. The IP Licensing segment includes intellectual property rights that we own, produce and then exploit worldwide in various formats including DVD, Blu-ray, digital (download-to-rent and EST), TV VOD (cable and satellite), broadcast, streaming and licensing. Our Wholesale Distribution segments consist of the acquisition, content enhancement and worldwide exploitation of exclusive content in the same markets as our owned content. The Wholesale Distribution segment exploits the content to third parties such as Amazon, Best Buy, Costco, iTunes, Netflix, Target and Walmart.
Net revenues by reporting segment for the periods presented are as follows:
|
|
|
Years Ended December 31, |
|
|||||
|
(In thousands) |
|
2016 |
|
|
2015 |
|
||
|
Digital Channels |
|
$ |
16,262 |
|
|
$ |
7,542 |
|
|
IP Licensing |
|
|
168 |
|
|
|
3,107 |
|
|
Wholesale Distribution |
|
|
63,808 |
|
|
|
88,321 |
|
|
Total revenues |
|
$ |
80,238 |
|
|
$ |
98,970 |
|
Assets for each reporting segment and Corporate, excluding assets of discontinued operations, as of December 31, 2016 and 2015 are as follows:
|
|
|
December 31, |
|
|||||
|
(In thousands) |
|
2016 |
|
|
2015 |
|
||
|
Digital Channels |
|
$ |
5,941 |
|
|
$ |
1,489 |
|
|
IP Licensing |
|
|
18,648 |
|
|
|
22,707 |
|
|
Wholesale Distribution |
|
|
102,748 |
|
|
|
114,221 |
|
|
Corporate |
|
|
8,643 |
|
|
|
5,341 |
|
|
|
|
$ |
135,980 |
|
|
$ |
143,758 |
|
12
Digital Channels
A summary of the Digital Channels segment’s revenues and expenses is as follows:
|
|
|
Years Ended December 31, |
|
|||||
|
(In thousands) |
|
2016 |
|
|
2015 |
|
||
|
Revenue |
|
$ |
16,262 |
|
|
$ |
7,542 |
|
|
Operating costs and expenses |
|
|
(9,297 |
) |
|
|
(8,230 |
) |
|
Depreciation and amortization |
|
|
(618 |
) |
|
|
(763 |
) |
|
Digital Channels segment contribution |
|
$ |
6,347 |
|
|
$ |
(1,451 |
) |
The Digital Channels segment exploits much of the same film and television content as the Wholesale Distribution segment but exploits the content directly in the U.S. to consumers through various proprietary SVOD channels. To date, we have two primary Digital Channels, which are Acorn TV and UMC. We are continually rolling-out new content on our Digital Channels and attracting new subscribers. As of December 31, 2016, Acorn TV and UMC had over 430,000 and 20,000 subscribers, respectively, compared to 195,000 and approximately 5,000 subscribers, respectively, at December 31, 2015.
On June 24, 2016, we entered into a licensing agreement with Universal Screen Arts (or USA) whereby USA took over our Acorn U.S. catalog/ecommerce business and became the official, exclusive, direct-to-consumer seller of Acorn product in the U.S. During the quarter, we also ceased electronic email distribution of our Acacia catalogs. As a result of these actions, we have classified the U.S. catalog/ecommerce business as discontinued operations.
IP Licensing
A summary of the IP Licensing segment’s revenues and expenses is as follows:
|
|
|
Years Ended December 31, |
|
|||||
|
(In thousands) |
|
2016 |
|
|
2015 |
|
||
|
Revenue |
|
$ |
168 |
|
|
$ |
3,107 |
|
|
Operating costs and expenses |
|
|
(554 |
) |
|
|
(2,276 |
) |
|
Depreciation and amortization |
|
|
(134 |
) |
|
|
(143 |
) |
|
Share in ACL earnings |
|
|
3,078 |
|
|
|
2,217 |
|
|
IP Licensing segment contribution |
|
$ |
2,558 |
|
|
$ |
2,905 |
|
Our IP Licensing segment includes owned intellectual property that is either acquired or created by us and is licensed for exploitation worldwide. The operating activities primarily consist of our 100% interest in Foyle’s War Series 8 and Series 9, as well as certain distribution rights pertaining to content acquired from ACL. Our IP Licensing segment does not include revenues generated or costs incurred from the exploitation of Foyle’s War Series by our Wholesale Distribution segment. Also included is our 64% interest in ACL. ACL is accounted for using the equity method of accounting given the voting control of the Board of Directors by the minority shareholder. Gross margin percentages generated from content that is owned is generally higher than margins realized from content that is not owned.
As part of our growth strategy, we plan to continue to produce and own more intellectual property with an emphasis in British mysteries and dramas and urban programming.
Wholesale Distribution
A summary of the Wholesale Distribution segment’s revenues and expenses is as follows:
|
|
|
Years Ended December 31, |
|
|||||
|
(In thousands) |
|
2016 |
|
|
2015 |
|
||
|
Revenue |
|
$ |
63,808 |
|
|
$ |
88,321 |
|
|
Operating costs and expenses |
|
|
(60,169 |
) |
|
|
(83,656 |
) |
|
Depreciation and amortization |
|
|
(1,714 |
) |
|
|
(2,715 |
) |
|
Goodwill impairment |
|
|
— |
|
|
|
(30,260 |
) |
|
Wholesale Distribution segment contribution |
|
$ |
1,925 |
|
|
$ |
(28,310 |
) |
13
The Wholesale Distribution segment consists of acquisition of content, content enhancement and worldwide exploitation of exclusive content in various formats to third parties such as Amazon, Best Buy, Comcast, Costco, iTunes, Netflix, Target and Walmart. We market and exploit our exclusive content through agreements that generally range from 5 to 25 years in duration.
While standard DVD comprise a significant portion of our revenues within this segment, Blu-ray titles and related revenues continue to increase given the format’s growing acceptance. We believe that the affordability of larger screen high-definition television or HDTV and ease of use as an entertainment hub in consumer households will continue to accelerate the conversion from standard DVD to Blu-ray formats for all demographics. We also believe there is an opportunity for us to realize increased revenues from customers of Acorn branded British mystery and drama product who will be converting their standard DVD collection to Blu-ray. It is expected that future revenues generated from DVD and Blu-ray sales will decline and sale of content to consumers through digital, streaming video and downloading will increase in future years.
We engage in the exclusive licensing of the digital rights to our library of audio and video content. The demand for the types of programming found in our library continues to increase as new digital retailers enter the online marketplace. We seek to differentiate ourselves competitively by being a one-stop source for these retailers who desire a large and diverse collection of entertainment represented by our digital library. We enter into non-exclusive arrangements with retail and consumer-direct entities whose business models include the digital delivery of content. We continue to add video to our growing library of exclusive digital rights. The near-term challenges faced by all digital retailers are to develop ways to increase consumer awareness and integrate this awareness into their buying and consumption habits. Some of our digital retailers include Amazon, Comcast, Google Play, iTunes, Microsoft Xbox, Sony PlayStation and Vudu. We also license content to SVOD accounts like Amazon, Hulu, and Netflix in both exclusive and non-exclusive arrangements.
We further exploit our product in the ‘traditional’ VOD channels, wherein consumers pay a fee to watch programming via their cable or satellite operators. This business model has expanded in recent years to include exclusive windows for VOD monetization prior to other channels of exploitation. For example, a high-profile release may be released on VOD prior to theatrical exploitation. In that instance, we would receive higher price points and better placement with our VOD providers. Our partners in the VOD space include AT&T/Dish, Comcast, DirecTV, iNDemand, Verizon and Vubiquity. We also exploit our product to cable networks in the United States. Traditionally, our Acorn product has been sold to PBS or its affiliated stations, while our feature-length product has been sold to a wide array of customers. These cable networks include HBO, Ovation, Showtime and Starz.
Outside North America and the U.K., we sublicense distribution in the areas of home entertainment, television and digital through distribution partners such as Universal Music Group International, Universal Pictures Australia and Warner Music Australia, each of which pays us a royalty for their distribution of our products.
Outsourced Services
Under a Distribution Services and License Agreement with Sony Pictures Home Entertainment (or SPHE), SPHE acts as our exclusive manufacturer in North America to meet our hard good manufacturing requirements (DVD and Blu-ray) and to provide related fulfillment and other logistics services in exchange for certain fees. Our agreement with SPHE expires in August 2019. Under our relationship with SPHE, we are responsible for the credit risk from the end customer with respect to accounts receivable and also the risk of inventory loss with respect to the inventory they manage on our behalf.
In addition to conventional manufacturing, we also utilize SPHE’s capability to manufacture-on-demand (or MOD). MOD services are provided for replication of slower moving titles, which helps avoid replicating larger minimum quantities of certain titles, and can be used for direct-to-consumer sales as needed. Under our agreement, SPHE also provides certain operational services at our direction, including credit and collections, merchandising, returns processing and certain IT functions.
We believe the SPHE agreement provides us with several significant advantages, including:
|
|
• |
The ability to sell directly to key accounts such as Best Buy, Redbox, Target and Walmart, which eliminates other third-party distributor fees, provides incremental revenues, higher gross margins and the ability to better manage retail inventories; |
|
|
• |
Access to SPHE’s point-of-sale reporting systems to better manage replenishment of store inventories on a daily basis; and |
|
|
• |
Access to SPHE’s extensive scan-based trading network that features product placement in over 20,000 drug and grocery outlets. |
14
We also outsource certain post-production and creative services necessary to prepare a disc master for manufacturing and packaging/advertising materials for marketing of our products. Such services include:
|
|
• |
Packaging design; |
|
|
• |
DVD/Blu-ray authoring and compression; |
|
|
• |
Menu design; |
|
|
• |
Video master quality control; |
|
|
• |
Music clearance; and |
|
|
• |
For some titles, the addition of enhancements, such as: |
|
|
• |
multiple audio tracks; |
|
|
• |
commentaries; |
|
|
• |
foreign language tracks; |
|
|
• |
behind-the-scenes footage; and |
|
|
• |
interviews. |
In the U.S., we outsource our video delivery, streaming services and cloud hosting for our web portfolio and Digital Channels.
In the U.K., we have a fulfillment and logistics services arrangement with Sony DADC UK Limited, which is similar to the arrangement we have with SPHE in North America. Australian fulfilment and logistics are provided by Regency Media Pty Ltd.
Marketing and Sales
Our in-house marketing department manages promotional efforts across a wide range of off-line and online platforms. Our marketing efforts include:
|
|
• |
Prominent retail merchandising for DVD/Blu-ray and digital releases (i.e., endcaps in retail stores like Walmart or Barnes & Noble or promotion on main category sections of digital retailers like iTunes or Amazon Video); |
|
|
• |
National and/or targeted public relations campaigns for consumer and trade press; |
|
|
• |
Point-of-sale advertising through our retail partners like Amazon or Barnes & Noble; |
|
|
• |
Social Media marketing (native and paid media) and other online advertising (PPC or pay per click display banner ads or video ads); |
|
|
• |
Email blasts promoting new releases to consumers and trade partners; |
|
|
• |
Print advertising in trade and consumer publications; |
|
|
• |
Television, outdoor, in-theater and radio advertising campaigns; |
|
|
• |
Dealer incentive programs; and |
|
|
• |
Trade show exhibits. |
RLJE maintains its own sales force and has a direct selling relationship with the majority of its broadcast and cable/satellite partners, and retail customers. We sell our programs to broadcasters, cable and satellite providers, traditional and specialty retailers, digital retailers, rental outlets, wholesale distributors and through alternative exploitation efforts, which includes direct-to-consumer print catalogs, proprietary ecommerce websites, direct-response campaigns, subscription service/club sales, proprietary SVOD subscription channels, home shopping television channels, other non-traditional sales channels, kiosks and sub-distributors. Examples of our key broadcast/cable/satellite partners are DirecTV, Comcast, Dish Networks, Charter, Verizon, HBO, Starz and public television stations. Examples of our key retail customers (including DVD/Blu-ray and digital retailers) are Amazon, Best Buy Co., Costco, Target, Walmart, iTunes, Vudu and Google Play. Examples of our key rental/subscription customers are Hulu, Netflix and Redbox. Examples of our key retail distribution partners who distribute to retailers on our behalf in the U.S. are Alliance Entertainment and Ingram Entertainment. Examples of key international retail and broadcast distribution partners are All3Media and ITV Global Enterprises.
15
We also focus on special-market sales channels, to take advantage of our large and diverse catalog and to specifically target niche sales opportunities. Examples of our key specialty retail distribution partners include Midwest Tapes who distributes to libraries across the country and Waxworks who distributes to other specialty retailers including museums. Another special-market channel is scanned-based trading in conjunction with SPHE.
Additionally, in connection with our Distribution Services and License Agreement with SPHE, SPHE agreed to perform certain sales and inventory management functions at Best Buy, Target, Redbox and Walmart. By using SPHE, we benefit from having a major studio present RLJE’s product alongside its own releases, which include well known motion pictures. SPHE is our primary vendor of record for shipments of physical product to North American retailers and wholesalers, and as the vendor of record, they are responsible for collecting these receivables and remitting these proceeds to us. In the U.K., similar services are provided by Sony DADC UK Limited.
Customer Concentration
For the year ended December 31, 2016, sales to Amazon accounted for 15.3% of our net revenues. We do not have any other customers that accounted for more than 10.0% of our net revenues for the year. Our top five customers accounted for approximately 47.8% of our net revenues for 2016, which includes Amazon. At December 31, 2016, Netflix, SPHE and Amazon accounted for approximately 29.3%, 25.4% and 16.7%, respectively, of our gross accounts receivable.
Competition
We face competition from other independent distribution companies, major motion picture studios and broadcast and internet outlets in securing exclusive content distribution rights. We also face competition from online and direct-to-consumer retailers, as well as alternative forms of leisure entertainment, including video games, the internet and other computer-related activities. The success of any of our products depends upon consumer acceptance of a given program in relation to current events as well as the other products released into the marketplace at or around the same time. Consumers can choose from a large supply of competing entertainment content from other suppliers. Many of these competitors are larger than us. Our DVD and Blu-ray products compete for a finite amount of brick-and-mortar retail and rental shelf space. Sales of digital downloading, streaming, VOD and other broadcast formats are largely driven by what is visually available to the consumer, which can be supported by additional placement fees or previous sales success. Programming is available online, delivered to smartphones, tablets, laptops personal computers, or direct to the consumers’ TV set through multiple internet-ready devices, cable or satellite VOD and other subscription-based digital channels. According to Pew Research based on a survey conducted in late 2016, 51% of U.S. adults own a tablet. We face increasing competition as these platforms continue to grow and programming providers enter into distribution agreements for a wider variety of formats.
Our ability to continue to successfully compete in our markets is largely dependent upon our ability to develop and secure unique and appealing content, and to anticipate and respond to various competitive factors affecting the industry, including new or changing product formats, changes in consumer preferences, regional and local economic conditions, discount pricing strategies and competitors’ promotional activities.
Industry Trends
According to The Digital Entertainment Group (or DEG), consumer home entertainment spending in calendar 2016 exceeded $18 billion, up slightly from 2015. This slight increase was driven by the 16.4% increase in total digital spending showing that consumers are continuing to build their digital film libraries.
Digital-format revenues include EST, VOD and subscription-based streaming. EST revenues for 2016 increased by 5% compared to 2015. VOD revenues increased 6% in 2016 compared to 2015. Total subscription VOD increased by 22% in 2016 compared to 2015.
DEG reported that in 2016 the number of U.S. households with Blu-ray playback devices, including set-top boxes and game consoles, was 88 million. DEG also reported that the number of households with HDTV is now more than 112 million, including 16 million 4K Ultra HD TVs.
According to PricewaterhouseCoopers LLP’s Global Entertainment and Media Outlook for 2015 to 2019, consumer spending for the overall physical home entertainment segment in the U.S. is projected to decline at a 9.4% compound annual rate over the 2015‑2019 period to approximately $5.3 billion in 2019. While the decline in consumer spending on physical home entertainment continues, it is substantially offset by the increase in consumer spending on electronic home video, primarily as a result of the growth of over-the-top (OTT) digital channels and SVOD services. Consumer spending in the U.S. on electronic distribution is projected to increase at a 14.6% compound annual rate over the 2015-2019 period, reaching $16.5 billion in 2019.
16
Employees
As of March 1, 2017, we had 69 U.S.-based employees, primarily at our Maryland and California locations. We had 23 employees at our U.K. and Australia locations. Our employees are primarily employed on a full-time basis.
Available Information
Under the menu “Investors—SEC Filings” on our website at www.rljentertainment.com, we provide free access to our Annual Reports on Form 10-K, Quarterly Reports on Form 10-Q, Current Reports on Form 8-K and all amendments to those reports as soon as reasonably practicable after such material is electronically filed with or furnished to the SEC. The information contained on our website is not incorporated herein by reference and should not be considered part of this Annual Report.
Risks Relating to Our Liquidity and Credit Agreement
Our Credit Agreement contains covenants that may limit the way we conduct business. Our Credit Agreement contains various covenants limiting our ability to:
|
|
• |
incur or guarantee additional indebtedness; |
|
|
• |
grant security interests in any property; |
|
|
• |
pay dividends and make other restricted payments; |
|
|
• |
make investments; |
|
|
• |
enter into merger or acquisition transactions; |
|
|
• |
sell assets; and |
|
|
• |
enter into transactions with affiliates. |
These covenants may have an impact on our ability to raise additional debt or equity financing, compete effectively or take advantage of new business opportunities.
Our Credit Agreement includes covenants that require us to maintain specified financial ratios. Our ability to satisfy those financial ratios can be affected by events beyond our control, and we cannot be certain we will satisfy those ratios. Although we are currently in compliance with such financial ratios, there is no assurance that our financial results during the current fiscal year will enable us to meet these ratios or that the lender under the Credit Agreement will agree to modify these ratios in the future should we be unable to comply with them.
Our Credit Agreement provides that an “event of default” will occur under a number of circumstances, including (i) the failure to make payments when due, (ii) acceleration of payment obligations under other agreements, (iii) the failure to comply with the financial ratios and other covenants, (iv) breach of a representation or warranty in a material respect, (v) bankruptcy, (vi) judgments against RLJE or any of its subsidiaries over $250,000 individually or $500,000 in the aggregate at any time, (vii) a change of control, or (viii) a default under the investment documents with AMC. If an event of default occurs, the lender under our Credit Agreement may, unless we are able to negotiate an amendment, forbearance or waiver, require us to repay all amounts then outstanding under the Credit Agreement, which would have a material adverse effect on our liquidity, business, results of operations and financial condition.
We may not be able to generate the amount of cash needed to fund our future operations. Our ability to fund planned capital expenditures and development efforts will depend on our ability to generate cash in the future. Our ability to generate cash is in part subject to general economic, financial, competitive, regulatory and other factors that are beyond our control. We cannot assure you that our business will generate sufficient cash flow from operations to fund our liquidity needs.
Our liquidity depends on our cash-on-hand, operating cash flows and ability to collect cash receipts. At December 31, 2016, our cash and cash equivalents were approximately $7.8 million. Under the Credit Agreement, we are required to maintain $1.0 million of cash for the fiscal year ending December 31, 2016; $2.0 million for the fiscal year ending December 31, 2017 and $3.5 million for the fiscal year ending December 31, 2018 and all fiscal years thereafter for the term of the agreement. We rely on our cash-on-hand, operating cash flows and ability to collect cash receipts to fund our operations and meet our financial obligations. Delays or any failure to collect our trade accounts receivable would have a negative effect on our liquidity and could lead to an event of default under the Credit Agreement.
17
We have pledged our intellectual property assets to secure our Credit Agreement, and this represents a risk to our business, results of operations and financial condition. In order to secure the financing necessary to operate our business, we pledged all of our intellectual property rights as collateral to secure our obligations under the Credit Agreement. If we were to default on our obligations under the Credit Agreement, we could forfeit our intellectual property and, thereby, a primary source of revenue. This could have a material adverse effect on our business, results of operations and financial condition.
We may not be able to generate sufficient cash to service all our indebtedness, and we may be forced to take other actions, which may or may not be successful, to satisfy our obligations under our indebtedness. Our ability to make scheduled payments under our senior secured Credit Agreement depends on our financial and operating performance, which is subject to prevailing economic and competitive conditions and to certain financial, business and other factors beyond our control. We cannot assure you that we will maintain a level of cash flows from operating activities sufficient to permit us to pay the principal and interest due under the Credit Agreement or any future debt agreement. If our cash flows and capital resources are insufficient to fund our debt service and other obligations, we could face substantial liquidity problems and could be forced to reduce or delay capital expenditures and development efforts, sell assets or operations, seek additional capital or restructure or refinance our indebtedness. We cannot assure you that we would be able to take any of these actions, that these actions would be successful and permit us to meet our scheduled debt service obligations or that these actions would be permitted under the terms of our existing or future debt agreements, including the Credit Agreement.
Risks Relating to Our Business
We have limited working capital and limited access to financing. Our cash requirements, at times, may exceed the level of cash generated by operations. Accordingly, we may have limited working capital.
Our ability to obtain adequate additional financing on satisfactory terms may be limited. With respect to debt financing, our Credit Agreement restricts us from incurring additional indebtedness. With respect to equity financing, our ability to sell our equity securities depends on general market conditions, including the demand for our common stock. We may be unable to raise capital through the sale of equity securities, and if we were able to sell equity, our existing stockholders could experience substantial dilution. If adequate financing is not available at all or is unavailable on acceptable terms, we may find we are unable to fund expansion, continue offering products and services, take advantage of acquisition opportunities, develop or enhance services or products, or respond to competitive pressures in the industry.
Our business requires a substantial investment of capital. The production, acquisition and distribution of programming require a significant amount of capital. Capital available for these purposes will be reduced to the extent that we are required to use funds otherwise budgeted for capital investment to fund our operations. Curtailed content investment over a sustained period could have a material adverse effect on future operating results and cash flows. Further, a significant amount of time may elapse between our expenditure of funds and the receipt of revenues from our television programs or motion pictures. This time lapse requires us to fund a significant portion of our capital requirements from our operating cash flow and from other financing sources. Although we intend to continue to mitigate the risks of our production exposure through pre-sales to broadcasters and distributors, tax credit programs, government and industry programs, co-financiers and other sources, we cannot assure you that we will continue to successfully implement these arrangements or that we will not be subject to substantial financial risks relating to the production, acquisition, completion and release of new television programs and motion pictures. In addition, if we increase (through internal growth or acquisition) our production slate or our production budgets, we may be required to increase overhead and/or make larger up-front payments to talent and, consequently, bear greater financial risks. Any of the foregoing could have a material adverse effect on our business, financial condition, operating results, liquidity and prospects.
Our inability to gauge and predict the commercial success of our programming could adversely affect our business, results of operations and financial condition. Operating in the entertainment industry involves a substantial degree of risk. Each video program or feature film is an individual artistic work, and its commercial success is primarily determined by unpredictable audience reactions. The commercial success of a title also depends upon the quality and acceptance of other competing programs or titles released into the marketplace, critical reviews, the availability of alternative forms of entertainment and leisure activities, general economic conditions and other tangible and intangible external factors, all of which are subject to change and cannot be predicted. Timing is also sometimes relevant to a program’s success, especially when the program concerns a recent event or historically relevant material (e.g., an anniversary of a historical event which focuses media attention on the event and accordingly spurs interest in related content). Our success depends in part on the popularity of our content and our ability to gauge and predict it. Even if a film achieves success during its initial release, the popularity of a particular program and its ratings may diminish over time. Our inability to gauge and predict the commercial success of our programming could materially adversely affect our business, results of operations and financial condition.
18
We may be unable to recoup advances paid to secure exclusive distribution rights. Our most significant costs and cash expenditures relate to acquiring content for exclusive distribution. Most agreements to acquire content require upfront advances against royalties or net profits participations expected to be earned from future distribution. The amount we are willing to advance is derived from our estimate of net revenues that will be realized from our distribution of the title. Although these estimates are based on management’s knowledge of current events and actions management may undertake in the future, actual results will differ from those estimates. If sales do not meet our original estimates, we may (i) not recognize the expected gross margin or net profit, (ii) not recoup our advances or (iii) record accelerated amortization and/or fair value write-downs of advances paid. We recorded impairments related to our investments in content of $2.8 million during 2016 and $3.2 million during 2015.
Our inability to maintain relationships with our program suppliers and vendors may adversely affect our business. We receive a significant amount of our revenue from the distribution of content for which we already have exclusive agreements with program suppliers. However, titles which have been financed by us may not be timely delivered as agreed or may not be of the expected quality. Delays or inadequacies in delivery of titles, including rights clearances, could negatively affect the performance of any given quarter or year. In addition, results of operations and financial condition may be materially adversely affected if:
|
|
• |
We are unable to renew our existing agreements as they expire; |
|
|
• |
Our current program suppliers do not continue to support digital, DVD or other applicable format in accordance with our exclusive agreements; |
|
|
• |
Our current content suppliers do not continue to license titles to us on terms acceptable to us; or |
|
|
• |
We are unable to establish new beneficial supplier relationships to ensure acquisition of exclusive or high-profile titles in a timely and efficient manner. |
Disputes over intellectual property rights could adversely affect our business, results of operations and financial condition. Our sales and net revenues depend heavily on the exploitation of intellectual property owned by us or third parties from whom we have licensed intellectual property. Should a dispute arise over, or a defect be found in, the chain of title in any of our key franchises, this could result in either a temporary suspension of distribution or an early termination of our distribution license. This could have a material adverse impact on our business, results of operations and financial condition.
We, and third parties that manage portions of our secure data, are subject to cybersecurity risks and incidents. Our direct-to-consumer business involves the storage and transmission of customers' personal information, shopping preferences and credit card information, in addition to employee information and our financial and strategic data. The protection of our customer, employee and company data is vitally important to us. While we have implemented measures to prevent security breaches and cyber incidents, any failure of these measures and any failure of third parties that assist us in managing our secure data could materially adversely affect our business, financial condition and results of operations.
A high rate of product returns may adversely affect our business, results of operations and financial condition. As with the major studios and other independent companies in this industry, we experience a relatively high level of product returns as a percentage of our revenues. Our allowances for sales returns may not be adequate to cover potential returns in the future, particularly in the case of consolidation within the home-video retail marketplace, which when it occurs tends to result in inventory consolidation and increased returns. We have experienced a high rate of product returns over the past three years. We expect a relatively high rate of product returns to continue, which may materially adversely affect our business, results of operations and financial condition.
We depend on third-party shipping and fulfillment companies for the delivery of our products. If these companies experience operational difficulties or disruptions, our business could be adversely affected. We rely on SPHE, our distribution facilitation and manufacturing partner in North America, and Sony DADC UK Limited in the U.K. to determine the best delivery method for our products. These partners rely entirely on arrangements with third-party shipping companies, principally Federal Express and UPS, for small package deliveries and less-than-truckload service carriers for larger deliveries, for the delivery of our products. The termination of arrangements between our partners and one or more of these third-party shipping companies, or the failure or inability of one or more of these third-party shipping companies to deliver products on a timely or cost-efficient basis from our partners to our customers, could disrupt our business, reduce net sales and harm our reputation. Furthermore, an increase in the amount charged by these shipping companies could negatively affect our gross margins and earnings.
Economic weakness may adversely affect our business, results of operations and financial condition. An economic downturn would have a significant negative effect on our revenues. As consumers reduce spending and scale back purchases of our products, we may experience higher product returns and lower sales, which would adversely affect our revenues and results of operations. Although domestic consumer spending has been strong over the last few years, weak consumer demand for our products may occur and may adversely affect our business, results of operations and financial condition.
19
Our high concentration of sales to and receivables from relatively few customers (and use of a third-party to manage collection of substantially all packaged goods receivables) may result in significant uncollectible accounts receivable exposure, which may adversely affect our liquidity, business, results of operations and financial condition. During 2016, sales to Amazon accounted for 15.3% of our net revenues. Our top five customers accounted for approximately 47.8% of our net revenues for 2016, which includes Amazon. At December 31, 2016, Netflix, SPHE and Amazon accounted for approximately 29.3%, 25.4% and 16.7%, respectively, of our gross accounts receivable.
We may be unable to maintain favorable relationships with our retailers and distribution facilitators including SPHE and Sony DADC UK Limited. Further, our retailers and distribution facilitators may be adversely affected by economic conditions. If we lose any of our top customers or distribution facilitators, or if any of these customers reduces or cancels a significant order, it could have a material adverse effect on our liquidity, business, results of operations and financial condition.
We face credit exposure from our retail customers and may experience uncollectible receivables from these customers should they face financial difficulties. If these customers fail to pay their accounts receivable, file for bankruptcy or significantly reduce their purchases of our programming, it would have a material adverse effect on our business, financial condition, results of operations and liquidity.
A high concentration of our gross accounts receivables is attributable to SPHE and Sony DADC UK Limited, as they are our vendor of record for shipments of physical product to North American and U.K. retailers and wholesalers. As part of our arrangement with our distribution facilitation partners, SPHE and Sony DADC UK Limited collect the receivables from our end customers, provide us with monthly advance payments on such receivables (less a reserve), and then true up the accounts receivables accounting quarterly. While we remain responsible for the credit risk from the end customer, if SPHE or Sony DADC UK Limited should fail to adequately collect and pay us the accounts receivable they collect on our behalf, whether due to inadequate processes and procedures, inability to pay, bankruptcy or otherwise, our financial condition, results of operations and liquidity would be materially adversely affected.
We do not control the timing of dividends paid by ACL, which could negatively impact our cash flow. Although we hold a 64% interest in ACL, we do not control the board of directors of ACL. The members of the Agatha Christie family, who hold the remaining 36% interest in ACL, have the right to appoint the same number of directors as us and, in the event of deadlock on any decision of the board, also have a second or casting vote exercised by their appointee as chairman of ACL, which allows them to exercise control of ACL’s board of directors.
Under English law, the amount, timing and form of payment of any dividends or other distributions is a matter for ACL’s board of directors to determine, and, as a result, we cannot control when these distributions are made. If ACL’s board of directors decides not to authorize distributions, our revenue and cash flow may decrease, materially adversely affecting our business, results of operations, liquidity and financial condition.
Our business plan and future growth depend in part on our ability to commercialize the IP owned by ACL based on commissions for new programming from broadcasters, over whom we have no control. If we are unable to successfully implement this strategy, the results of operations and financial condition could be materially adversely affected. Our financial condition and results of operation will depend, in part, on our ability to commercialize the IP owned by ACL. Whether we are able to successfully commercialize the IP owned by ACL, including the creation of new content, will depend, in part, on ACL obtaining commissions for new programming from broadcasters (such as ITV, BBC and Sky in the U.K., and Fox, Disney and other studios in the U.S.). The ability to obtain commissions for new programming from broadcasters will depend on many factors outside of our control, including audience preferences and demand, financial condition of the broadcasters, the broadcasters’ budgets and access to financing, competitive pressures and the impact of actual and projected general economic conditions. We cannot guarantee that we will be able to obtain such commissions for new programming within our anticipated timeframe or at all. Without such commissions for new programming, we may not be able to successfully commercialize the IP of ACL in a timely or cost-effective manner, if at all. Failure to obtain commissions for new programming could adversely affect our market share, revenue, financial condition, results of operations, relationships with our distributors and retailers and our ability to expand our market, all of which would materially adversely affect our business, revenues and financial results.
The synergies and other efficiencies anticipated in connection with the transaction with AMC may not be realized. We expect, in conjunction with AMC, to pursue the aggregation of proprietary subscription video on demand activities and economies of scale with respect to manufacturing, sales and distribution of physical products. Although we believe that realizing these synergies would be beneficial to both us and AMC, the parties have not entered into a contract to pursue or otherwise implement these synergies. Accordingly, there is a risk that we and AMC may not agree on the means or terms to implement these synergies or that AMC, whether due to differing business interests or other reasons, may not pursue these synergies in the manner or at the level we desire. AMC has investments in other media companies which may conflict or compete with our business. In addition, the
20
integration of these operations will be a complex, costly and time-consuming process. As a result, we will be required to devote significant management attention and resources to integrating these operations.
We depend on key and highly skilled personnel to operate our business, and if we are unable to retain our current personnel or hire additional personnel, our ability to develop and successfully market our business could be harmed. Our success continues to depend to a significant extent on our ability to identify, attract, hire, train and retain qualified professional, creative, technical and managerial personnel. Moreover, we believe that our success greatly depends on the contributions of our Chairman, Robert L. Johnson, executive officers including Chief Executive Officer, Miguel Penella, Chief Financial Officer, Nazir Rostom, and other key executives. Although we have employment agreements with Messrs. Penella and Rostom, any of our employees may terminate their employment relationship with us at any time, and their knowledge of our business and industry would be extremely difficult to replace. The loss of any key employees or the inability to attract or retain qualified personnel could delay the acquisition of content and harm the market's perception of us. Competition for the caliber of talent required to acquire and exploit content continues to increase. If we are unable to attract and retain the qualified personnel we need to succeed, our business, results of operations and financial condition could suffer.
We face risks from doing business internationally. We exploit and derive revenues from television programs and feature films outside the U.S., directly in the U.K. and in Australia, and through various third-party licensees elsewhere. As a result, our business is subject to certain risks inherent in international business, many of which are beyond our control. These risks include:
|
|
• |
Laws and policies affecting trade, investment and taxes, including laws and policies relating to the repatriation of funds and withholding taxes, and changes in these laws; |
|
|
• |
Changes in local regulatory requirements, including restrictions on content, differing cultural tastes and attitudes; |
|
|
• |
Differing degrees of protection for intellectual property; |
|
|
• |
Financial instability and increased market concentration of buyers in foreign television markets, including in European pay television markets; |
|
|
• |
The instability of foreign economies and governments; |
|
|
• |
Fluctuating foreign exchange rates; and |
|
|
• |
War and acts of terrorism. |
Events or developments related to these and other risks associated with international trade could adversely affect our revenues from non-U.S. sources, which could have a material adverse effect on our business, financial condition, operating results, liquidity and prospects.
Changes to existing accounting pronouncements or taxation rules or practices may affect how we conduct our business and affect our reported results of operations. New accounting pronouncements or tax rules and varying interpretations of accounting pronouncements or taxation practice have occurred and may occur in the future. A change in accounting pronouncements or interpretations or taxation rules or practices can have a significant effect on our reported results and may even affect our reporting of transactions completed before the change is effective. Changes to existing rules and pronouncements, future changes, if any, or the questioning of current practices or interpretations may materially adversely affect our reported financial results or the way we conduct our business.
Changes in, or interpretations of, tax rules and regulations, and changes in geographic operating results, may adversely affect our effective tax rates. We are subject to income taxes in the U.S. and foreign tax jurisdictions. Our future effective tax rates could be affected by changes in tax laws or the interpretation of tax laws, by changes in the amount of revenue or earnings that we derive from international sources in countries with high or low statutory tax rates, or by changes in the valuation of our deferred tax assets and liabilities. Unanticipated changes in our tax rates could affect our future results of operations.
In addition, we may be subject to examination of our income tax returns by federal, state and foreign tax jurisdictions. We regularly assess the likelihood of outcomes resulting from possible examinations to determine the adequacy of our provision for income taxes. In making such assessments, we exercise judgment in estimating our provision for income taxes. While we believe our estimates are reasonable, we cannot assure you that final determinations from any examinations will not be materially different from those reflected in our historical income tax provisions and accruals. Any adverse outcome from any examinations may have a material adverse effect on our business and operating results.
21
Risks Relating to Our Industry
Our revenues and results of operations may fluctuate significantly. Our results of operations are difficult to predict and depend on a variety of factors. Our results of operations depend significantly upon the commercial success of the television programming and feature films that we exploit, which cannot be predicted with certainty. In particular, the underperformance of the VOD or SVOD window of one or more motion pictures in any period may cause our revenue and earnings results for that period (and potentially, subsequent periods) to be less than anticipated, in some instances to a significant extent. Accordingly, our results of operations may fluctuate significantly from period to period, and the results of any one period may not be indicative of the results for any future periods.
Our results of operations also fluctuate due to the timing, mix, number and availability of our broadcast, home entertainment and theatrical motion picture releases, as well as license periods for our content. Our operating results may increase or decrease during a particular period or year due to differences in the number and/or mix of films released compared to the corresponding period in the prior year.
Revenues from the sale of DVDs are declining. During calendar 2016, the standard DVD marketplace experienced the tenth straight year-over-year decline for the category since the format debuted in 1997. We estimate that approximately 51% of our current net revenue base is generated from the sale of physical goods, which include the revenues from the sale of DVDs. The continued maturation of the standard DVD format may continue to adversely affect our business, results of operations and financial condition.
Decreasing retail prices for DVDs may negatively affect our revenues and gross profit margins. The home entertainment programming market in which we compete is rapidly evolving and intensely competitive. Many of our competitors, including major studios, are increasingly offering programming, particularly DVD programming, at lower prices. They may be able to produce or secure content on more favorable terms and may be able to adopt more aggressive pricing policies than we can. While we strive to improve our operating efficiencies and leverage our fixed costs so that we can afford to pass along these savings to our customers in the form of lower prices, the industry trend of lowering prices may, over time, lead to lower sales, decreased profit margins or decreased overall revenues.
Decreasing retail shelf space for our industry may limit sales of our programming, which may adversely affect our business, results of operations and financial condition. We face increasing competition from major motion picture studios and other independent content suppliers for limited retail shelf space, which space has been shrinking in absolute terms as brick and mortar retailers have fewer stores and lower budgets for the home-video space within their stores. Our exclusive content competes for a finite amount of shelf space against a large and diverse supply of entertainment content from other suppliers. New releases generally exceed several hundred titles a week. We believe this competition can be especially challenging for independent labels like us, because the new releases of major studios often have extremely high visibility, greater marketing support and sales projections in the millions of units, which typically require much more shelf space to support.
Shelf space limitations at our brick and mortar retail customers are exacerbated by the increasing popularity of the high-definition format, Blu-ray. The combination of standard discs, premium discs and special-edition boxed sets across two formats means that a release can come in as many six different configurations. With the possible exception of our most popular new release titles and top-selling catalog titles, it can be a challenge to obtain the product placement necessary to maximize sales, particularly among the limited number of major retailers who comprise our core brick and mortar customers. The continued retailer trend toward greater visibility for titles at the expense of quantity (i.e., “face out” rather than “spine out” placement) has the effect of reducing the total number of titles actually carried by a retailer.
We cannot accurately predict the overall effect shifting audience tastes, technological change or the availability of alternative forms of entertainment may have on distributors. In addition to uncertainty regarding the DVD market, there is uncertainty as to whether other developing distribution channels and formats, such as VOD and internet distribution of television and films, will attain expected levels of public acceptance, or if such channels or formats are accepted by the public, whether we will be successful in exploiting the business opportunities they provide. Moreover, to the extent that these emerging distribution channels and formats gain popular acceptance, the demand for delivery through DVDs may decrease.
Risks Relating to Our Stock
Our stock price may be subject to substantial volatility, and stockholders may lose all or a substantial part of their investment. Our common stock currently trades on the Nasdaq Capital Market (NASDAQ). There is limited public float, and trading volume historically has been low and sporadic, making it difficult to buy or sell our stock. As a result of the low trading volume, the market price for our common stock may not necessarily be a reliable indicator of our fair market value. The price at which our common stock trades may fluctuate as a result of a number of factors, including the number of shares available for sale in the market,
22
quarterly variations in our operating results, actual or anticipated announcements of new releases by us or competitors, the gain or loss of significant customers, changes in the estimates of our operating performance, fluctuations in the fair value of our common stock warrant liability and market conditions in our industry and the economy as a whole.
If we fail to meet all applicable continued listing requirements of the Nasdaq Capital Market and Nasdaq determines to delist our common stock, the delisting could adversely affect the market liquidity of our common stock and subject us to additional trading restrictions and regulations. Companies listed on The NASDAQ Stock Market, or NASDAQ, are subject to delisting for, among other things, failure to maintain a minimum closing bid price per share of $1.00 for 30 consecutive business days or failure to maintain a minimum stockholders’ equity of $2.5 million.
We cannot assure you that we will be able to meet these or other continued listing requirements of NASDAQ. If our common stock loses its status on The NASDAQ Capital Market, our common stock would likely trade in the over-the-counter market. In addition, in the event our common stock is delisted, broker-dealers have certain regulatory burdens imposed upon them, which may discourage broker-dealers from effecting transactions in our common stock, further limiting the liquidity of our common stock. These factors could result in lower prices and larger spreads in the bid and ask prices for our common stock. Such delisting from The NASDAQ Capital Market and declines in our share price could also greatly impair our ability to raise additional necessary capital through equity or debt financing and could significantly increase the ownership dilution to shareholders caused by our issuing equity in financing or other transactions.
Any future issuances of equity may significantly affect the market price of our common stock. Future issuances of substantial amounts of our common stock, including shares that we may issue upon conversion or redemption of outstanding preferred stock, exercise of outstanding warrants, or conversion of other convertible securities, if any, could adversely affect the market price of our common stock. The amount of common stock issuable upon redemption of our preferred stock, although subject to a floor price, is not fixed in all circumstances, and therefore the actual amount of common stock issuable upon redemption cannot currently be determined. Similarly, the amount of common stock issuable upon exercise of one of the three warrants issued to AMC is not fixed in all circumstances, and therefore the actual amount of common stock issuable upon exercise cannot currently be determined. Further, if we raise additional funds through the issuance of common stock or securities convertible into or exercisable for common stock, our stockholders may experience substantial dilution and the price of our common stock may fall. New equity securities issued may also have greater rights, preferences or privileges than our existing common stock.
Additional authorized shares of common stock available for issuance may adversely affect the market. We are authorized to issue 250,000,000 shares of our common stock. As of March 1, 2017, we had 5,342,586 shares of our common stock outstanding, excluding shares issuable upon conversion of our outstanding preferred stock and exercise of our outstanding warrants. As of March 1, 2017, we had outstanding preferred stock convertible into approximately 11,604,000 shares of our common stock, including dividends, at a conversion price of $3.00 per share and warrants to purchase 1,454,628 shares of common stock at $1.50 per share, warrants to purchase 150,000 shares of common stock at $2.37 per share, warrants to purchase 21,500,000 shares of common stock at $3.00 and warrants to purchase 7,013,897 shares of our common stock at a price of $36.00 per share, respectively. To the extent the shares of common stock are issued, preferred stock is converted or warrants are exercised, holders of our common stock will experience dilution.
Provisions in our amended and restated articles of incorporation and Nevada law may inhibit a takeover of us, which could limit the price investors might be willing to pay in the future for our common stock and could entrench management. Our amended and restated articles of incorporation contain provisions that may discourage unsolicited takeover proposals that stockholders may consider to be in their best interests. These provisions include the ability of the board of directors to designate the terms of and issue new series of preferred shares, which may make more difficult the removal of management and may discourage transactions that otherwise could involve payment of a premium over prevailing market prices for our securities.
We are also subject to anti-takeover provisions under Nevada law, which could delay or prevent a change of control. Together these provisions may make more difficult the removal of management and may discourage transactions that otherwise could involve payment of a premium over prevailing market prices for our securities.
None.
23
RLJE’s principal executive office is located in Silver Spring, Maryland. We also maintain offices in Woodland Hills, California; London, England and Sydney, Australia with varying terms and expiration dates. All locations are leased. A summary of our locations is as follows:
|
Location |
|
Primary Purpose |
|
Lease Expiration |
|
Reporting Segment (1) |
|
Silver Spring, MD |
|
Executive Office/Administrative/Sales/ Content Acquisition |
|
November 15, 2020 |
|
Corporate/ |
|
Woodland Hills, CA |
|
Administrative/Sales/Content Acquisition |
|
June 30, 2021 |
|
Digital Channels/
|
|
London, England |
|
Content Development and Production/Sales/ Administration for the U.K. |
|
July 1, 2018 |
|
Digital Channels/IP Licensing/
|
|
Sydney, Australia |
|
Sales/Administration |
|
Month-to-month |
|
Wholesale Distribution |
|
|
(1) |
The segment descriptions above reflect the location’s primary activity. |
We believe that our current offices are adequate to meet our business needs, and our properties and equipment have been well maintained.
In the normal course of business, we are subject to proceedings, lawsuits and other claims, including proceedings under government laws and regulations relating to content ownership and copyright matters. While it is not possible to predict the outcome of these matters, it is the opinion of management, based on consultations with legal counsel, that the ultimate disposition of known proceedings will not have a material adverse effect on our financial condition, results of operations or liquidity.
Not applicable.
24
|
ITEM 5. |
MARKET FOR REGISTRANT’S COMMON EQUITY, RELATED STOCKHOLDER MATTERS AND ISSUER PURCHASES OF EQUITY SECURITIES |
Market Information
Our common stock is traded on The NASDAQ Capital Market® under the symbol “RLJE” and our warrants are quoted on the Over-The-Counter Bulletin Board (or OTCBB) under the symbol “RLJEW.” The table below presents the quarterly high and low closing sales prices of our common stock and warrants as reported by NASDAQ and the OTCBB, respectively.
|
|
|
Common Stock |
|
|
Warrants |
|
||||||||||
|
|
|
High |
|
|
Low |
|
|
High |
|
|
Low |
|
||||
|
2016 |
|
|
|
|
|
|
|
|
|
|
|
|
|
|
|
|
|
First quarter |
|
$ |
2.97 |
|
|
$ |
1.41 |
|
|
$ |
0.00 |
|
|
$ |
0.00 |
|
|
Second quarter |
|
$ |
2.70 |
|
|
$ |
1.58 |
|
|
$ |
0.00 |
|
|
$ |
0.00 |
|
|
Third quarter |
|
$ |
2.90 |
|
|
$ |
1.88 |
|
|
$ |
0.00 |
|
|
$ |
0.00 |
|
|
Fourth quarter |
|
$ |
2.28 |
|
|
$ |
1.34 |
|
|
$ |
0.00 |
|
|
$ |
0.00 |
|
|
|
|
|
|
|
|
|
|
|
|
|
|
|
|
|
|
|
|
2015 |
|
|
|
|
|
|
|
|
|
|
|
|
|
|
|
|
|
First quarter |
|
$ |
6.66 |
|
|
$ |
4.32 |
|
|
$ |
0.10 |
|
|
$ |
0.08 |
|
|
Second quarter |
|
$ |
4.77 |
|
|
$ |
0.85 |
|
|
$ |
0.08 |
|
|
$ |
0.00 |
|
|
Third quarter |
|
$ |
4.95 |
|
|
$ |
1.03 |
|
|
$ |
0.10 |
|
|
$ |
0.00 |
|
|
Fourth quarter |
|
$ |
3.96 |
|
|
$ |
1.42 |
|
|
$ |
0.01 |
|
|
$ |
0.00 |
|
Stockholders
As of December 31, 2016, there were:
|
|
• |
5,240,085 shares of our common stock outstanding, which were held by approximately 295 holders of record; |
|
|
• |
warrants to purchase 20,000,000 shares of our common stock at a price of $3.00 per share held by AMC Networks; |
|
|
• |
warrants to purchase 7,013,897 shares of our common stock at a price of $36.00 per share held by approximately 30 holders of record; and |
|
|
• |
warrants to acquire 1,454,628 shares of common stock at a price of $1.50 per share; 150,000 shares of common stock at a price of $2.37 per share, and 1,500,000 shares of our common stock at a price of $3.00 per share held by approximately 14 holders of record. |
The number of holders of record does not include the number of persons whose securities are in nominee or “street name” accounts through brokers.
Dividend Policy
We have not paid any cash dividends on our common stock to date. The payment of cash dividends in the future will be dependent upon our revenues and earnings, if any, capital requirements and general financial condition. The payment of any dividends will be within the discretion of our board of directors at such time. It is the present intention of our board of directors to retain all earnings, if any, for use in our business operations and, accordingly, our board of directors does not anticipate declaring any dividends in the foreseeable future. In addition, our AMC Credit Agreement restricts our ability to pay dividends on our common stock. For more information on these restrictions, please refer to Note 10, Debt of our consolidated financial statements and in the Liquidity and Capital Resources sections of Management’s Discussion and Analysis of Financial Condition and Results of Operations (or MD&A).
Securities Authorized for Issuance Under Equity Compensation Plans
See table under Part III, Item 12, Security Ownership of Certain Beneficial Owners and Management and Related Stockholder Matters in the Equity Compensation Plan Information section.
Additional information with respect to the shares of our common stock that may be issued under our existing stock-based compensation plans is disclosed in our consolidated financial statements in Note 14, Stock-Based Compensation.
25
Item 6. Selected Financial Data is not required for smaller reporting companies.
The following discussion and analysis of our financial condition and results of operations contains forward-looking statements that involve risks and uncertainties, such as statements of our plans, objectives, expectations and intentions. As described under the heading "Forward-Looking Statements" of this Annual Report, our actual results could differ materially from those anticipated in our forward-looking statements. Factors that could contribute to such differences include those discussed elsewhere in this Annual Report, including in Item 1A of this Annual Report under the heading “Risk Factors.” You should not place undue reliance on our forward-looking statements, which apply only as of the date of this Annual Report. Except as may be required under federal law, we undertake no obligation to update publicly any forward-looking statements for any reason, even if new information becomes available or other events occur.
You should read the following discussion and analysis in conjunction with our consolidated financial statements and related footnotes included in Item 8 of this Annual Report.
OVERVIEW
General
RLJ Entertainment, Inc. (RLJE or the Company) is a premium digital channel company serving distinct audiences through its proprietary subscription-based digital channels (or Digital Channels), Acorn TV and UMC or Urban Movie Channel, and a direct presence in North America, the United Kingdom (or U.K.) and Australia with strategic sublicense and distribution relationships covering Europe, Asia and Latin America. RLJE was incorporated in Nevada in April 2012. On October 3, 2012, we completed the business combination of RLJE, Image Entertainment, Inc. (or Image) and Acorn Media Group, Inc. (or Acorn Media), which is referred to herein as the “Business Combination.” Acorn Media includes its U.K. subsidiaries RLJ Entertainment Ltd, Acorn Media Enterprises Limited (or AME), and RLJE International Ltd (collectively, RLJE UK), as well as RLJ Entertainment Australia Pty Ltd (or RLJE Australia). In February 2012, Acorn Media acquired a 64% ownership of Agatha Christie Limited (or ACL). References to Image include its wholly-owned subsidiary Image/Madacy Home Entertainment, LLC. “We,” “our” or “us” refers to RLJE and its subsidiaries unless otherwise noted. Our principal executive offices are located in Silver Spring, Maryland, with an additional location in Woodland Hills, California. We also have international offices in London, England and Sydney, Australia.
We strive to be a preferred source and destination for entertainment for a variety of distinct audiences with particular and special programming interests. We acquire, develop and exploit television, film and other media content across all platforms of distribution. We actively manage all windows of exploitation to optimize the reach of our promotional efforts and maximize the value of our releases.
We acquire content rights in various categories, with particular focus on British mysteries and dramas, urban programming and full-length independent motion pictures. We also develop, produce and own original programming through our wholly-owned subsidiary, AME, and our 64%-owned subsidiary, ACL. We control an extensive program library in genres such as British mysteries and dramas, urban/African-American, action/thriller and horror, fitness/lifestyle and long-form documentaries.
We market our products through a multi-channel strategy encompassing (1) direct relations with consumers via proprietary subscription-based Digital Channels (Digital Channels segment); (2) the licensing of original drama and mystery content managed and developed through our wholly-owned subsidiary, AME, and our 64%-owned subsidiary, ACL, (IP Licensing segment); and (3) wholesale exploitation through partners covering broadcast and cable, digital, online and retail outlets (Wholesale Distribution segment). As a result, we view our operations based on these three distinctive reporting segments. Operations and net assets that are not associated with any of these stated segments are reported as “Corporate” when disclosing and discussing segment information. Our Digital Channels segment consists of our subscription-based digital streaming channels. The IP Licensing segment includes intellectual property rights that we own or create and then sublicense for exploitation worldwide. Our Wholesale Distribution segment consist of the acquisition, content enhancement and worldwide exploitation of exclusive content in various formats, including broadcast, DVD and Blu-ray and digital (which include VOD, SVOD, streaming and downloading). We also sublicense certain distribution rights to others to cover territories outside the U.S., the U.K. and Australia. Our Wholesale Distribution segment also includes our U.K. mail-order catalog and ecommerce businesses.
AME manages and develops our intellectual property rights on British drama and mysteries. Our owned content includes 28 Foyle’s War made-for-TV films; multiple instructional Acacia titles; and through our 64% ownership interest of ACL, the vast
26
majority of the Agatha Christie library. ACL is home to some of the world’s greatest works of mystery fiction, including Murder on the Orient Express and Death on the Nile and includes all development rights to iconic sleuths such as Hercule Poirot and Miss Marple. The Agatha Christie library includes a variety of short story collections, more than 80 novels, 19 plays and a film library of over 100 made-for-television films. In 2014, ACL published its first book since the death of Agatha Christie, The Monogram Murders. In September 2016, ACL released another new book, Closed Casket.
The IP Licensing and Wholesale Distribution segments exploit content primarily through third-party vendors. Our wholesale partners are broadcasters, digital outlets and major retailers in the U.S., Canada, United Kingdom and Australia, including, among others: Amazon, Barnes & Noble, Comcast, Costco, DirecTV, Hulu, iTunes, Netflix, PBS, Showtime, Starz, Target and Walmart. We work closely with our wholesale partners to outline and implement release and promotional campaigns customized to the different audiences we serve and the program genres we exploit. We have a catalog of owned and long-term licensed content that is segmented into brands such as Acorn (British drama/mystery, including content produced by ACL), RLJE Films (independent feature films, action/thriller horror), Urban Movie Channel (or UMC) (urban), Acacia (fitness), and Athena (documentaries).
On June 24, 2016, we entered into a licensing agreement with Universal Screen Arts (or USA) whereby USA took over our Acorn U.S. catalog/ecommerce business becoming the official, exclusive, direct-to-consumer seller of Acorn product in the U.S. During the quarter ended June 30, 2016, we also electronically distributed our last Acacia catalogs. As a result of these actions, we have classified the U.S. catalog/ecommerce business as discontinued operations. During 2015 and the first quarter of 2016, these businesses were included in our Direct Channels segment. In the fourth quarter of 2016, we reclassified our remaining U.K. catalog/ecommerce business from Digital Channels to our Wholesale Distribution segment to reflect adjustments we made internally in terms of how we are viewing and managing our operations after the disposal of our U.S. ecommerce/catalog business. The reclassification for both our U.S. and U.K. catalog and ecommerce businesses were made retroactively for all periods presented.
Revenue Sources
Net revenues by reporting segment as a percentage of total net revenues for the periods presented are as follows:
|
|
|
Years Ended December 31, |
|
|||||
|
(In thousands) |
|
2016 |
|
|
2015 |
|
||
|
Digital Channels |
|
|
20.3 |
% |
|
|
7.6 |
% |
|
IP Licensing (1) |
|
|
0.2 |
% |
|
|
3.1 |
% |
|
Wholesale Distribution |
|
|
79.5 |
% |
|
|
89.3 |
% |
|
Total revenues |
|
|
100.0 |
% |
|
|
100.0 |
% |
|
(1) |
Reported net revenues exclude revenues generated by our 64% owned subsidiary, ACL, which is accounted for under the equity method of accounting. |
Revenues by geographical area as a percent of the total revenues are as follows:
|
|
|
Years Ended December 31, |
|
|||||
|
(In thousands) |
|
2016 |
|
|
2015 |
|
||
|
United States |
|
|
84.9 |
% |
|
|
81.2 |
% |
|
United Kingdom |
|
|
13.9 |
% |
|
|
16.8 |
% |
|
Other |
|
|
1.2 |
% |
|
|
2.0 |
% |
|
Total revenues |
|
|
100.0 |
% |
|
|
100.0 |
% |
Digital Channels Segment
Our Digital Channels segment currently operates in the U.S. and comprises approximately one-fifth of our overall revenue base. The Digital Channels segment revenues are derived from our online, proprietary, subscriber-based SVOD channels, Acorn TV and UMC. During 2016, revenues from our Digital Channels totaled $16.3 million, which represents an increase of $8.7 million when compared to 2015.
27
IP Licensing Segment
Our television drama productions are generally financed by the pre-sale of the initial broadcast license rights. Revenues reported in this segment include the initial broadcast license revenue, generally from the U.K. territory, and sublicense revenue for other territories outside the U.S., U.K. and Australia.
Wholesale Distribution Segment
DVD and Blu-ray
Our primary source of revenues within the Wholesale Distribution segment continues to be from the exploitation of exclusive content on DVD and Blu-ray through third-party vendors such as Amazon, Best Buy, Costco, Target and Walmart.
Digital, VOD and Broadcast
Revenues derived from digital and broadcast exploitation of our content continue to grow as a percentage of revenues. Net revenues derived from digital, VOD, third-party SVOD and broadcast exploitation account for approximately 34.9% of the segment’s revenues in 2016 versus 32.6% in 2015. This is consistent with consumer adoption trends. As retailers continue to offer consumer-friendly devices that make access to these on-demand services easier, including allowing consumption on portable devices such as smartphones and tablets, we believe we are well-positioned to capture business in this growing distribution channel. Some of our digital retailers include Amazon, Google Play, Hulu, iTunes, Microsoft Xbox, Netflix, Overdrive, Shudder (AMC) Sony PlayStation, Vimeo, Vudu and YouTube. Our partners in the VOD space include AT&T, Cablevision, Comcast, DirecTV, Dish, iNDemand, Verizon and Vubiquity.
Other Licensing
We continue our efforts to acquire more programming with international rights. Our key sublicensing partners, that cover territories outside the U.S., the U.K. and Australia, are with Universal Music Group International, Universal Pictures Australia and Warner Music Australia. To date, most of the feature films we have acquired do not include rights outside of North America. However, given our presence in the United Kingdom and Australia, we are focusing our efforts to acquire more programming in all English-language markets. When appropriate, we now seek the greatest variety of distribution rights regarding acquired content in the greatest variety of formats. We believe that this will allow us to further diversify revenue streams.
Cost Structure
Our most significant costs and cash expenditures relate to acquiring or producing content for exclusive exploitation. We generally acquire programming through exclusive license or distribution agreements, under which we either (1) pay royalties or (2) receive distribution fees and pay net profits after recoupment of our upfront costs. Upon entering into a typical license (royalty) agreement, we pay an advance based on the estimated expected future net profits. Once the advance payment has been recouped, we pay royalties to the content suppliers quarterly based on the net revenues collected from the previous quarter. Under a typical exclusive distribution agreement, we may pay upfront fees, which are expressed as advances against future net profits. Once the advance and any other costs incurred are recouped, we pay the content supplier their share of net cash-profits, which is after our distribution fee, from the prior quarter’s exploitation.
In addition to advances, upfront fees and production costs, the other significant expenditures we incur are:
|
|
• |
DVD/Blu-ray authoring and replication and digitalization of program masters; |
|
|
• |
Packaging; |
|
|
• |
Advertising, promotion and marketing funds provided to wholesale partners; |
|
|
• |
Domestic shipping costs from self-distribution of exclusive content; |
|
|
• |
Content hosting and delivery costs associate with our Digital Channels; |
|
|
• |
Personnel; and |
|
|
• |
Interest. |
We strive to achieve long-term, sustainable growth and profitability with a target return on investment (ROI) of 20% or more on new content acquisitions. This financial target is based on all up-front expenses associated with the acquisition and release of a title, including advances and development costs, and is calculated after allocating overhead costs.
28
We also seek to maximize our operational cash flow and profitability by closely managing our marketing and discretionary expenses, and by actively negotiating and managing collection and payment terms.
Highlights
Highlights for the year ended December 31, 2016 and other significant events are as follows:
|
|
• |
Our Digital Channels paying subscribers increased by 125.1% from 203,000 to 457,000 in 2016. |
|
|
• |
Revenues from our Digital Channels segment increased 115.6% to $16.3 million. After costs of sales and operating expenses, our Digital Channels segment contributed $6.3 million of income from continuing operations for the current period compared to a loss from continuing operations of $1.5 million for the same period last year. |
|
|
• |
Gross profit increased by 18.4% to $26.4 million and gross margin increased to 32.9% for the year ended December 31, 2016 compared to 22.5% for the year ended December 31, 2015. The improvements in gross profit and gross margin are primarily attributable to the growth of our proprietary Digital Channels, which deliver a higher profit margin. |
|
|
• |
Net loss was $21.9 million for the year compared to a net loss last year of $55.0 million. The improvement is primarily driven by a goodwill impairment charge recognized last year with no similar impairments this year. |
|
|
• |
Adjusted EBITDA improved $5.1 million to $13.1 million for 2016. This primarily reflects improved operating results due to increased gross margins attributable to our Digital Channels segment, increased equity earnings from affiliate (Agatha Christie Ltd.) and reduced selling expenses. |
|
|
• |
In October 2016 and January 2017, we refinanced our senior debt and repaid our subordinated notes, respectively. After repayment of our prior loans and expenses, we received net proceeds of $7.4 million. Our new senior loan facility improves our debt servicing payment by lowering our cash interest rate by 800 basis points and requiring no principal payments until June 2019. |
The highlights above and the discussion below are intended to identify some of our more significant results and transactions during 2016 and should be read in conjunction with our consolidated financial statements and related discussions within this Annual Report.
Results of Operations
A summary of our results of operations is presented below for the years ended December 31, 2016 and 2015, as disclosed in our consolidated financial statements in Item 8, Financial Statements and Supplementary Data, herein referred to as our “consolidated financial statements.” Our consolidated financial statements have been prepared in accordance with accounting principles generally accepted in the United States of America (or U.S. GAAP).
|
|
|
Years Ended December 31, |
|
|||||
|
(In thousands) |
|
2016 |
|
|
2015 |
|
||
|
Revenues |
|
$ |
80,238 |
|
|
$ |
98,970 |
|
|
Costs of sales |
|
|
53,847 |
|
|
|
76,686 |
|
|
Gross profit |
|
|
26,391 |
|
|
|
22,284 |
|
|
Operating expenses |
|
|
30,096 |
|
|
|
63,058 |
|
|
Loss from operations |
|
|
(3,705 |
) |
|
|
(40,774 |
) |
|
Equity earnings of affiliate |
|
|
3,078 |
|
|
|
2,217 |
|
|
Interest expense, net |
|
|
(8,400 |
) |
|
|
(9,968 |
) |
|
Change in fair value of stock warrants and other derivatives |
|
|
(4,573 |
) |
|
|
1,373 |
|
|
Loss on extinguishment of debt |
|
|
(3,549 |
) |
|
|
— |
|
|
Other expense |
|
|
(1,293 |
) |
|
|
(1,402 |
) |
|
Provision for income taxes |
|
|
(155 |
) |
|
|
(165 |
) |
|
Loss from continuing operations, net of income taxes |
|
|
(18,597 |
) |
|
|
(48,719 |
) |
|
Loss from discontinued operations, net of income taxes |
|
|
(3,277 |
) |
|
|
(6,261 |
) |
|
Net loss |
|
$ |
(21,874 |
) |
|
$ |
(54,980 |
) |
29
Revenues
A summary of net revenues by segment for the years ended December 31, 2016 and 2015 is as follows:
|
|
|
Years Ended December 31, |
|
|||||
|
(In thousands) |
|
2016 |
|
|
2015 |
|
||
|
Digital Channels |
|
$ |
16,262 |
|
|
$ |
7,542 |
|
|
Intellectual Property |
|
|
168 |
|
|
|
3,107 |
|
|
Wholesale Distribution Revenue: |
|
|
|
|
|
|
|
|
|
U.S. |
|
|
51,834 |
|
|
|
72,868 |
|
|
International |
|
|
11,974 |
|
|
|
15,453 |
|
|
Total Wholesale Distribution |
|
|
63,808 |
|
|
|
88,321 |
|
|
Total Revenues |
|
$ |
80,238 |
|
|
$ |
98,970 |
|
Revenues for the year ended December 31, 2016 decreased $18.7 million when compared to the year ended December 31, 2015. The decrease in revenues is primarily driven by our Wholesale Distribution and IP Licensing segments, which declined by $24.5 million $2.9 million, respectively. These decreases were partially offset by a $8.7 million increase in revenues from our Digital Channels segment.
The increase in revenues in our Digital Channels segment primarily results from the 120.5% growth in subscribers to our Acorn TV channel. During 2016, we launched our Digital Channels on Amazon Channels, an add-on streaming video service available to Amazon Prime customers. This strategic expansion into third-party distribution of our digital streaming services resulted in significant subscriber growth. In addition, we are continually featuring new content on our Digital Channels, which we believe is a key factor in attracting new subscribers for all of our channels.
The decline in our IP Licensing revenues was due to our release of a new ACL title last year, Partners in Crime, with no similar release this year. Our Wholesale Distribution segment’s revenue decline is attributable to decreases in U.S. revenues of $21.0 million and decreases in international revenues of $3.5 million. Wholesale Distribution segment’s revenues decreased because of less content being released during the current period compared to the same period last year and increased returns. We had fewer large releases this year compared to several large releases last year. Our Wholesale Distribution segment’s revenues were also down due to a decline in demand for DVDs as more digital programming becomes available on demand.
Cost of Sales (“COS”) and Gross Margins
A summary of COS by segment and overall gross margins for the years ended December 31, 2016 and 2015 is as follows:
|
|
|
Years Ended December 31, |
|
|||||
|
(In thousands) |
|
2016 |
|
|
2015 |
|
||
|
Digital Channels |
|
$ |
4,929 |
|
|
$ |
4,449 |
|
|
IP Licensing |
|
|
158 |
|
|
|
1,954 |
|
|
Wholesale Distribution |
|
|
48,760 |
|
|
|
70,283 |
|
|
Total COS |
|
$ |
53,847 |
|
|
$ |
76,686 |
|
|
Gross Margin |
|
$ |
26,391 |
|
|
$ |
22,284 |
|
|
Gross Margin % |
|
|
32.9 |
% |
|
|
22.5 |
% |
COS decreased by $22.8 million to $53.8 million for 2016 compared to the same period in 2015. The decrease in COS is attributed to lower revenues in our Wholesale Distribution and IP Licensing segments and lower step-up amortization resulting from the Business Combination. Our step-up amortization was $3.6 million and $5.0 million for the years ended December 31, 2016 and 2015, respectively. The decrease in step-up amortization is attributable to lower revenues from titles that were acquired prior to our Business Combination. As time passes, step-up amortization decreases. Impairment charges recorded for content investments and inventories total $4.6 million and $4.7 million for the years ended December 31, 2016 and 2015, respectively. Impairment charges and step-up amortization are recorded in our Wholesale Distribution segment.
As a percentage of revenues, our gross margin improved to 32.9% for 2016 compared to 22.5% for 2015. The improvement is primarily attributable to our Digital Channels segment. Revenues from this segment account for 20.3% of our total revenues
30
during 2016 as compared to 7.6% of total revenues during 2015. The margin in our Wholesale Distribution segment improved partially due to better performing titles this year compared to last year.
Operating Expenses (“SG&A”)
The following table includes a summary of the components of SG&A:
|
|
|
Years Ended December 31, |
|
|||||
|
(In thousands) |
|
2016 |
|
|
2015 |
|
||
|
Selling expenses |
|
$ |
9,298 |
|
|
$ |
10,915 |
|
|
General and administrative expenses |
|
|
17,841 |
|
|
|
17,746 |
|
|
Depreciation and amortization |
|
|
2,957 |
|
|
|
4,137 |
|
|
Goodwill impairment |
|
|
— |
|
|
|
30,260 |
|
|
Total operating expenses |
|
$ |
30,096 |
|
|
$ |
63,058 |
|
SG&A decreased by $33.0 million for the year ended December 31, 2016, compared to the same period in 2015. The decrease is primarily due to a $30.3 million goodwill impairment charge recorded in with no similar charge in 2016. The 2015 goodwill impairment charge is attributable to our Wholesale Distribution segment. Selling expenses decreased $1.6 million due to a reduction in our sales force and lower theatrical expenses during 2016 compared to 2015 as we had more theatrical releases last year.
Equity Earnings of Affiliate
Equity earnings of affiliate (which is ACL) increased $0.9 million for the year ended December 31, 2016 to $3.1 million when compared to 2015. During 2016, ACL’s gross profit (revenues less film cost amortization) was higher in 2016 when compared to 2015. The increases are a result of higher publishing revenues due to new publishing contracts entered into and generally improved publishing royalty rates on existing contracts. Improved margins were partially offset by increased general, administrative and other expenses, as well as increased income taxes.
Interest Expense
Interest expense decreased $1.6 million for the year ended December 31, 2016, as compared to 2015. The decrease is a result of reduced interest rates on our senior debt combined with lower average outstanding debt balances during the years. During April 2015, we made an accelerated principal payment of $10.0 million on our senior secured debt and reduced the interest rate on our subordinated debt.
Change in Fair Value of Stock Warrants and Other Derivatives
The change in the fair value of our warrant and other derivative liabilities impacts the statement of operations. A decrease in the fair value of the liabilities results in the recognition of income, while an increase in the fair value of the liabilities results in the recognition of expense. Changes in fair value are primarily driven by changes in our common stock price and its volatility. During 2016, we recognized expense of $4.6 million due to changes in the fair value of our stock warrants and other derivative liabilities. During 2015, we recognized income of $1.4 million due to changes in the fair value of our stock warrants and other derivative liabilities.
Loss on Extinguishment of Debt
Upon repaying our previous credit facility and entering into the AMC Credit Agreement, on October 14, 2016, we recognized a $3.6 million loss from the early extinguishment of debt, which is reported separately within our statement of operations. This loss primarily represents the unamortized debt discount and deferred financing costs at the time of repayment and a prepayment penalty of $0.8 million.
31
Other Expense
Other expense mostly consists of foreign currency gains and losses resulting primarily from advances and loans by our U.S. subsidiaries to our foreign subsidiaries that have not yet been repaid. Our foreign currency gains and losses are primarily impacted by changes in the exchange rate of the British Pound Sterling (or the Pound) relative to the U.S. dollar (or the Dollar). As the Pound strengthens relative to the Dollar, we recognized other income; and as the Pound weakens relative to the Dollar, we recognize other expense. During 2016 and 2015, the Pound weakened relative to the dollar and we recognized foreign currency losses of $1.5 million $1.1 million, respectively.
Income Taxes
We have fully reserved our net U.S. deferred tax assets, and such tax assets may be available to reduce future income taxes payable should we have U.S. taxable income in the future. To the extent such deferred tax assets relate to net operating losses (or NOL) carryforwards, the ability to use our NOL carryforwards against future earnings will be subject to applicable carryforward periods and limitations subsequent to a change in ownership. As of December 31, 2016, we had NOL carryforwards for federal and state income tax purposes of approximately $111.6 million and $69.5 million, respectively.
We recorded income tax expense of $0.2 million for each of the years ended December 31, 2016 and 2015. Our tax provision consists primarily of a deferred tax provision for certain deferred tax liabilities and a current tax provision for our U.K. operations. We are recording a deferred tax provision and liability for our equity earnings of affiliate (ACL). These earnings will be taxable in the U.K., when and if we dispose of our investment. In 2015, we also reversed a previously recognized deferred liability related to goodwill amortization that was being provided for tax purposes. Because of the goodwill impairment recognized, the deferred liability was reversed and is no longer being recognized for financial statement purposes. This reversal resulted in a reduction to our tax expense in 2015 of $0.4 million. We are providing current income tax expense on pre-tax income from our consolidated U.K. subsidiaries at an effective tax rate of approximately 20%. We are not providing a current tax provision (benefit) on our U.S. operations, other than for certain state minimum taxes, which are not material.
Loss from Discontinued Operations, Net of Income Taxes
Our loss from discontinued operations decreased as our U.S. catalog/ecommerce business was winding down during 2016. For the years ended December 31, 2016 and 2015, our losses were $3.2 million and $6.3 million, respectively. Discontinued operations revenues were $7.8 million and $25.9 million for the years ended December 31, 2016 and 2015, respectively. The transition of our U.S. catalog/ecommerce business to USA completed during 2016.
Adjusted EBITDA
Management believes Adjusted EBITDA to be a meaningful indicator of our performance that provides useful information to investors regarding our financial condition and results of operations because it removes material non-cash items that allows investors to analyze the operating performance of the business using the same metric management uses. The exclusion of non-cash items better reflects our ability to make investments in the business and meet obligations. Presentation of Adjusted EBITDA is a non-GAAP financial measure commonly used in the entertainment industry and by financial analysts and others who follow the industry to measure operating performance. Management uses this measure to assess operating results and performance of our business, perform analytical comparisons, identify strategies to improve performance and allocate resources to our business segments. While management considers Adjusted EBITDA to be an important measure of comparative operating performance, it should be considered in addition to, but not as a substitute for, net income and other measures of financial performance reported in accordance with U.S. GAAP. Not all companies calculate Adjusted EBITDA in the same manner and the measure, as presented, may not be comparable to similarly-titled measures presented by other companies.
32
The following table includes the reconciliation of our consolidated U.S. GAAP net loss to our consolidated Adjusted EBITDA:
|
|
|
Years Ended December 31, |
|
|||||
|
(In thousands) |
|
2016 |
|
|
2015 |
|
||
|
Net loss |
|
$ |
(21,874 |
) |
|
$ |
(54,980 |
) |
|
Interest expense |
|
|
8,400 |
|
|
|
9,968 |
|
|
Provision for income tax |
|
|
155 |
|
|
|
165 |
|
|
Depreciation and amortization |
|
|
2,957 |
|
|
|
4,137 |
|
|
Goodwill impairment |
|
|
— |
|
|
|
30,260 |
|
|
Basis-difference amortization in equity earnings of affiliate |
|
|
484 |
|
|
|
546 |
|
|
ACL dividends in excess of earnings |
|
|
— |
|
|
|
537 |
|
|
Change in fair value of stock warrants and other derivatives |
|
|
4,573 |
|
|
|
(1,373 |
) |
|
Stock-based compensation |
|
|
1,010 |
|
|
|
302 |
|
|
Restructuring |
|
|
5,938 |
|
|
|
447 |
|
|
Loss from discontinued operations |
|
|
3,277 |
|
|
|
6,261 |
|
|
Foreign currency exchange loss on intercompany accounts |
|
|
1,487 |
|
|
|
1,111 |
|
|
Non-cash royalty expense |
|
|
6,681 |
|
|
|
10,608 |
|
|
Adjusted EBITDA |
|
$ |
13,088 |
|
|
$ |
7,989 |
|
During 2016, we changed how we are computing our Adjusted EBITDA. Previously, we were adding back content amortization and royalty expense and deducting cash invested in content to arrive at an Adjusted EBITDA. We have now aligned our adjusted EBITDA definition to our peers in our industry and to the definition in our credit agreement. The revised Adjusted EBITDA adds back our non-cash royalty expense, which consists of step-up amortization and impairments on content that was acquired as of the Business Combination. For comparative purposes, we provided revised 2015 Adjusted EBITDA calculation.
Adjusted EBITDA increased by $5.1 million for the year ended December 31, 2016 compared to the same period last year. The increase reflects our improved operating results from continuing operations after adjusting for the above non-cash expenses. The improvement is also a result of an increased restructuring adjustment in 2016 when compared to 2015. The 2016 restructuring adjustment includes our loss on extinguishment of debt and related transaction costs. The adjustment also includes severance payments and related expenses totaling $2.1 million, which consist entirely of personnel costs that have been eliminated as a result of our restructuring activities.
BALANCE SHEET ANALYSIS
Assets
Total assets at December 31, 2016 and 2015, were $136.0 million and $150.6 million, respectively. The decline of $14.6 million in assets is mostly attributed to (i) a $6.9 million decrease in assets from discontinued operations, (ii) a $4.3 million decrease in accounts receivable due to collection efforts and declining wholesale revenue, (iii) a $2.1 million decrease inventories primarily due fewer title release in 2016, and (iv) a $3.6 million decline in our investment in ACL, which was primarily due to a weakening Pound relative to the U.S. dollar. Offsetting these declines is an increase in cash resulting from our October 2016 debt refinancing.
A summary of assets by segment is as follows:
|
|
|
December 31, |
|
|||||
|
(In thousands) |
|
2016 |
|
|
2015 |
|
||
|
Digital Channels |
|
$ |
5,941 |
|
|
$ |
1,489 |
|
|
IP Licensing |
|
|
18,648 |
|
|
|
22,707 |
|
|
Wholesale Distribution |
|
|
102,748 |
|
|
|
114,221 |
|
|
Corporate |
|
|
8,643 |
|
|
|
5,341 |
|
|
|
|
$ |
135,980 |
|
|
$ |
143,758 |
|
33
Liabilities and Equity
The decline of liabilities and equity of $14.6 million is mostly attributed to the net loss of $21.9 million for the year ended December 31, 2016, that is included in accumulated deficit; partially offset an increase in senior debt of $8.1 million. Before adjusting for debt discounts and offering costs, our senior debt increased from $56.9 million as of December 31, 2015 to $65.0 million as of December 31, 2016.
Liquidity and Capital Resources
Liquidity
A summary of our cash flow activities is as follows:
|
|
|
Years Ended December 31, |
|
|||||
|
(In thousands) |
|
2016 |
|
|
2015 |
|
||
|
Net cash used in operating activities |
|
$ |
(1,484 |
) |
|
$ |
(9,160 |
) |
|
Net cash used in investing activities |
|
|
(1,428 |
) |
|
|
(1,811 |
) |
|
Net cash provided by financing activities |
|
|
6,462 |
|
|
|
8,818 |
|
|
Effect of exchange rate changes on cash |
|
|
(246 |
) |
|
|
21 |
|
|
Net increase (decrease) in cash |
|
|
3,304 |
|
|
|
(2,132 |
) |
|
Cash at beginning of year |
|
|
4,530 |
|
|
|
6,662 |
|
|
Cash at end of year |
|
$ |
7,834 |
|
|
$ |
4,530 |
|
At December 31, 2016 and 2015, our cash balances were approximately $7.8 million and $4.5 million, respectively. During the year ended December 31, 2016, our cash position was impacted by the following:
|
|
• |
We incurred a net use of cash of $1.5 million resulting from our operating activities. Last year, our net cash used in operating activities was $9.2 million. The improvement in operating cash flows was primarily attributable to less cash spent on content. During 2016, we spent $33.9 million on content compared to $38.9 million for the prior year. We continue to have significant short-term vendor debts, which are past due and which we are in the process of paying off by making increased cash payments or modifying payment terms in the short term. Bringing our vendor trade payables current continues to constrain our liquidity. During 2016, our accounts payable and accrued liabilities decreased by $11.1 million. In 2015, we were able to reduce accounts payable and accrued liabilities by $0.9 million. |
|
|
• |
Our quarterly results are typically affected by: (a) the timing and release dates of key productions, (b) the seasonality of our Wholesale Distribution business which is 32% to 35% weighted to the fourth quarter and (c) the increased investment in content during the first half of the year, yet investments are impacted by liquidity. |
Our reported cash flow activities include the impacts of our discontinued operations. During the years ended 2016 and 2015, our discontinued operations required a net use of cash from operating activities of $3.8 million and $4.0 million, respectively, and a net use of cash from investing activities of $5,000 and $0.4 million, respectively
The aggregate cash used in operating and investing activities during the year ended December 31, 2016 was provided by our financing activities. For the year ended December 31, 2016, significant factors affecting cash provided by or used in our investing and financing activities were:
|
|
• |
We received net cash proceeds from the AMC Credit Agreement of $64.2 million when refinancing our senior debt. The proceeds received were used to repay our prior senior secured term notes of $56.9 million, including accrued interest, and transaction expenses of approximately $1.7 million, which includes a prepayment penalty of $0.8 million. |
|
|
• |
We made capital expenditures of $1.4 million. |
We continue to experience liquidity constraints as we have several competing demands on our available cash and cash that may be generated from operations, including past-due vendor payables, which are currently about $12.1 million. These past-due payables are largely a result of significant past-due vendor payables acquired in 2012 when purchasing Image. As we work to catch up on the acquired past-due payables, we have fallen behind on other payables. We continue to work with our vendors to make payment arrangements that are agreeable with them and that give us flexibility in terms of when payments will be made. Additionally, we must maintain a certain level of expenditures to acquire new content that allows us to generate revenues and margins sufficient to meet our obligations.
34
During 2016, we realized significant growth in our Digital Channels segment. Our Digital Channels segment revenues increased 116% to $16.3 million during 2016. By way of comparison, our channel revenues increased 83% during 2015. After cost of sales and operating expenses, our Digital Channels segment contributed $6.3 million of income from continuing operations for 2016 compared to a loss of $1.5 million last year. Our expectation is that our Digital Channels will continue to grow, however there is no assurance that this will occur. If the channels grow at a rate that is similar to 2016, then 2017 should be a transformational year in terms of liquidity, cash flow and operating results.
On October 14, 2016, we refinanced our senior debt. In January 2017, we amended our senior debt and borrowed an additional $8.0 million. We received net proceeds of $7.4 million, which we used to repay our subordinated notes payable. In addition to providing us liquidity, the new senior loan facility helps us address our liquidity constraints going forward in three ways: (1) it bears a substantially lower cash-interest rate that is approximately 800 basis points lower than before, (2) there are no required principal payments until 2019, and (3) the financial covenants have been reset to less restrictive levels that provide us the necessary flexibility to invest in our operations.
In 2016, we also took actions to improve our operating results and Adjusted EBITDA by exiting certain non-core operations that have been generating losses. During December 2015, we approved and started implementing a plan to close our Acacia catalog operations. The last Acacia print catalogs were circulated in January 2016 and electronic email distribution continued through May 2016. Further, on June 24, 2016, we entered into a licensing agreement to outsource the U.S. Acorn catalog/ecommerce business to USA (see our Discontinued Operations disclosure above). During 2016, our U.S. catalog/ecommerce business was fully transitioned to USA and we do not anticipate future losses from this line of business.
We believe that our current cash at December 31, 2016, combined with our additional borrowing in January 2017 will be sufficient to meet our operating liquidity, capital expenditure and debt repayment requirements for at least the next one year from the date of issuance of these financial statements. However, there can be no assurances that we will be successful in realizing improved results from operations including improved Adjusted EBITDA, generating sufficient cash flows from operations or agreeing with vendors on revised payment terms.
Capital Resources
Cash
As of December 31, 2016, we had cash of $7.8 million, as compared to $4.5 million as of December 31, 2015.
Senior Term Notes
On October 14, 2016, we entered into a $65.0 million Credit and Guaranty Agreement (the AMC Credit Agreement) with Digital Entertainment Holdings LLC, a wholly owned subsidiary of AMC Networks Inc. (or AMC). The proceeds received were used to repay our prior senior secured term notes of $55.1 million, including accrued interest, and transaction expenses of approximately $1.7 million, which includes a prepayment penalty of $0.8 million. The AMC Credit Agreement consists of (i) a term loan tranche in the principal amount of $5.0 million (or Tranche A Loan), which was due October 14, 2017, but was recently amended to June 30, 2019, and (ii) a term loan tranche in the principal amount of $60.0 million (or Tranche B Loan) of which 25% is due after five years, 50% is due after six years and the remaining 25% is due after seven years. The Tranche A Loan bears interest at a rate of 7.0% per annum and the Tranche B Loan bears interest at a rate of 6.0% per annum. Interest is payable quarterly whereby 4.0% is payable in cash and the balance is payable in shares of common stock determined using a per-share value of $3.00 per share. The loan is secured by a lien on substantially all of our consolidated assets.
Subject to certain customary exceptions, the AMC Credit Agreement requires mandatory prepayments if we were to receive proceeds from asset sales, insurance, debt issuance or the exercise of the AMC Warrants. We may also make voluntary prepayments. Prepayments of the Tranche B Loan (either voluntary or mandatory) are subject to a prepayment premium of 3.0% if principal is repaid on or before October 14, 2018, and 1.5% if principal is repaid after October 14, 2018 but on or before October 14, 2019. No prepayment premium is due for amounts prepaid after October 14, 2019.
The AMC Credit Agreement contains certain financial and non-financial covenants. Financial covenants are assessed annually and are based on Consolidated Adjusted EBITDA, as defined in the AMC Credit Agreement. Financial covenants vary by fiscal year and generally become more restrictive over time.
35
Financial covenants include the following:
|
|
|
December 31, 2016 |
|
December 31, 2017 |
|
December 31, 2018 |
|
Thereafter |
|
Leverage Ratios: |
|
|
|
|
|
|
|
|
|
Senior debt-to-Adjusted EBITDA |
|
6.00 : 1.00 |
|
5.50 : 1.00 |
|
3.50 : 1.00 |
|
2.50 : 1.00 |
|
Total debt-to-Adjusted EBITDA |
|
6.75 : 1.00 |
|
6.00 : 1.00 |
|
5.00 : 1.00 |
|
4.00 : 1.00 |
|
Fixed charge coverage ratio |
|
1.00 : 1.00 |
|
1.00 : 1.00 |
|
2.00 : 1.00 |
|
2.00 : 1.00 |
The AMC Credit Agreement contains events of default that include, among others, non-payment of principal, interest or fees, violation of covenants, inaccuracy of representations and warranties, bankruptcy and insolvency events, material judgments, cross defaults to certain other contracts (including, for example, business arrangements with our U.S. distribution facilitation partner and other material contracts) and indebtedness and events constituting a change of control or a material adverse effect in any of our results of operations or conditions (financial or otherwise). The occurrence of an event of default would increase the applicable rate of interest and could result in the acceleration of our obligations under the AMC Credit Agreement.
The AMC Credit Agreement imposes restrictions on such items as encumbrances and liens, payments of dividends, other indebtedness, stock repurchases, capital expenditures and entering into new lease obligations. Additional covenants restrict our ability to make certain investments, such as loans and equity investments, or investments in content that are not in the ordinary course of business. Pursuant to the AMC Credit Agreement, we must maintain at all times a cash balance of $1.0 million for 2016, $2.0 million in cash for 2017 and $3.5 million in cash for all years thereafter. As of December 31, 2016, we were in compliance with all covenants as stipulated in the AMC Credit Agreement.
When repaying the previous credit facility on October 14, 2016, we recognized a $3.6 million loss from the early extinguishment of debt, which is reported separately within our statement of operations. This loss primarily represents the unamortized debt discount and deferred financing costs at the time of repayment of our prior credit facility and prepayment penalty of $0.8 million.
On January 30, 2017, we amended the AMC Credit Agreement and borrowed an additional $8.0 million, thereby increasing our Tranche A loan from $5.0 million to $13.0 million. We also changed the maturity date for our Tranche A loan from October 14, 2017 to June 30, 2019. The additional $8.0 million borrowed was used to repay our obligations under the subordinated notes payable. When doing so, we did not incur a prepayment penalty. This amendment also changed certain debt covenant ratios to reflect the extended maturity date and the increase of the Tranche A loan balance. These amended terms are reflected in the above tables and disclosures.
Subordinated Notes Payable
In October 2012, we issued unsecured subordinated promissory notes in the aggregate principal amount of $14.8 million to the selling preferred stockholders of Image (or Subordinated Note Holders). On May 20, 2015, and in connection with the sale of preferred stock and warrants, the Subordinated Note Holders exchanged approximately $8.5 million of subordinated notes for 8,546 shares of preferred stock and warrants to acquire approximately 855,000 shares of common stock. The notes bore interest at 12.0% per annum, except for a two-year period ending December 31, 2016, whereby the interest rate was adjusted to 1.5% per annum. Each year, we paid 45% of the interest due in cash and added the remaining of 55% to the subordinated note balance. On January 31, 2017, we repaid these subordinated notes and accrued interest in full.
Preferred Stock
On May 20, 2015, we closed a transaction in which we sold 31,046 shares of preferred stock and warrants to acquire 3.1 million shares of common stock for $22.5 million in cash and the exchange of $8.5 million in subordinated notes. Of the preferred shares and warrants sold, 16,500 shares of preferred stock and warrants to acquire 1.7 million shares of common stock were sold to certain board members or their affiliated companies. We used $10.0 million of the cash proceeds from this sale to make partial payment on our senior notes payable and approximately $1.9 million for prepayment penalties, legal and accounting fees, which include fees associated with our registration statement filed in July 2015 and other expenses associated with the transaction. The balance of the net cash proceeds was used for content investment and working capital purposes. Of the fees incurred, $0.9 million was recorded against the proceeds received, $0.5 million was recorded as additional debt discounts, $0.2 million was included as interest expense and the balance was included in other expense.
In connection with the sale of our preferred stock on May 20, 2015, the holders of the preferred stock appointed two board members temporarily increasing the board to 11 members. On June 4, 2015, four board members resigned thus reducing the board size to seven members, which we committed to when issuing the preferred stock.
36
On October 14, 2016 and concurrent with the close of the AMC Credit Agreement, we amended our preferred stock such that we were able to classify our preferred stock and its embedded conversion feature within our shareholders’ equity (deficit). Prior to the amendment, our preferred stock and its embedded conversion feature were recorded on our consolidated balance sheet outside of shareholders equity (deficit). The amended terms are disclosed below.
The preferred stock has the following rights and preferences:
|
|
• |
Rank – the preferred stock ranks higher than other company issued equity securities in terms of distributions, dividends and other payments upon liquidation. |
|
|
• |
Dividends – the preferred stock is entitled to cumulative dividends at a rate of 8% per annum of a preferred share’s stated value ($1,000 per share plus any unpaid dividends). The first dividend payment is due July 1, 2017 and then payments are to be made quarterly thereafter. At our discretion, dividend payments are payable in either cash, or if we satisfy certain equity issuance conditions, in shares of common stock. Pursuant to the October 14, 2016 amended terms, if we don’t satisfy equity issuance conditions, then we may elect to accrue the value of the dividend and add it to the preferred share’s stated value. |
|
|
• |
Conversion – at the preferred stockholder’s discretion, each share of preferred stock is convertible into 333.3 shares of our common stock, subject to adjustment for any unpaid dividends. Prior to the October 14, 2016 amendment, the conversion rate was subject to anti-dilution protection for offerings consummated at a per-share price of less than $3.00 per common share. This down-round provision was removed as part of the October 14, 2016 amendment. |
|
|
• |
Mandatory Redemption – unless previously converted, on May 20, 2020, at our option we will either redeem the preferred stock with (a) cash equal to $1,000 per share plus any unpaid dividends (Redemption Value), or (b) shares of common stock determined by dividing the Redemption Value by a conversion rate equal to the lower of (i) the conversion rate then in effect (which is currently $3.00) or (ii) 85% of the then trading price, as defined, of our common stock. As part of the October 14, 2016 amendment, a floor was established for all but 16,500 shares of preferred stock such that the redemption ratio cannot be below $0.50 per common share. For the 16,500 shares of preferred stock, a floor of $2.49 was already in place and remained unchanged. If we were to redeem with shares of common stock, the actual number of shares that would be issued upon redemption is not determinable as the number is contingent upon the then trading price of our common stock. Generally, if we were to redeem with shares, the number of common shares needed for redemption increases as our common stock price decreases. Because of the October 14, 2016 amendment, the maximum number of common shares issuable upon redemption is determinable given the redemption conversion floors. If we elect to redeem with shares of common stock, and we fail to meet certain conditions with respect to the issuance of equity, then we would be subject to a 20% penalty of the maturity redemption price, payable in either cash or shares of common stock. This penalty is subject to, and therefore possibly limited by, a $0.50 per share floor. |
|
|
• |
Voting – except for certain matters that require the approval of the preferred stockholders, such as changes to the rights and preferences of the preferred stock, the preferred stock does not have voting rights. However, the holders of the preferred stock are entitled to appoint two board members and, under certain circumstances, appoint a third member. |
We are increasing (or accreting) the carrying balance of our preferred stock up to its redemption value using the effective interest-rate method over a period of time beginning from the issuance of May 20, 2015 to the required redemption date of May 20, 2020. During the years ended December 31, 2016 and 2015, we recognized accretion of $4.3 million and $2.6 million, respectively. Accretion includes cumulative preferred dividends. As of December 31, 2016, the accumulated unpaid dividends on preferred stock were $4.2 million. During the years ended December 31, 2016 and 2015, accumulated unpaid dividends increased by $2.7 million (or $88.60 per share of preferred stock) and $1.6 million (or $50.60 per share of preferred stock), respectively
On July 9, 2015, we filed a registration statement with the Securities and Exchange Commission to register the shares issuable upon conversion of the preferred stock and exercise of the 2015 Warrants. The registration statement was declared effective in July 2015. We will use our best efforts to keep the registration statement effective. If we are in default of the registration rights agreement, and as long as the event of default is not cured, then we are required to pay, in cash, partial liquidation damages, which in total are not to exceed 6% of the aggregated subscription amount of $31.0 million.
RELATED PARTY TRANSACTIONS
In the ordinary course of business we enter into transactions with related parties, primarily our equity method investee and entities owned and controlled by the Chairman of our Board of Directors. Information regarding transactions and amounts with related parties is discussed in Note 22, Related Party Transactions of our consolidated financial statements.
37
NEW ACCOUNTING AND REPORTING PRONOUNCEMENTS
A summary of the accounting pronouncement issued but, not required to be adopted for the preparation of our current financial statements is as follows:
In May 2014, the FASB Financial Accounting Standards Board (“FASB”) issued Accounting Standard Update (“ASU”) No. 2014-09, Revenue from Contracts with Customers, as a new Topic, (ASC) Topic 606. The new revenue recognition standard provides a five-step analysis of transactions to determine when and how revenue is recognized. The core principle is that a company should recognize revenue to depict the transfer of promised goods or services to customers in an amount that reflects the consideration to which the entity expects to be entitled in exchange for those goods or services. In August 2015, the FASB issued ASU No. 2015-14, Revenue from Contracts with Customers: Deferral of the Effective Date, which deferred the effective date of the new revenue standard for periods beginning after December 15, 2016 to December 15, 2017, with early adoption permitted but not earlier than the original effective date. This ASU must be applied retrospectively to each period presented or as a cumulative-effect adjustment as of the date of adoption. We are considering the alternatives of adoption of this ASU and we are conducting our review of the likely impact to the existing portfolio of customer contracts entered into prior to adoption. After completing our review, we will continue to evaluate the effect of adopting this guidance upon the Company’s results of operations, cash flows and financial position. Currently, we do not expect the adoption of this ASU to have a material impact on our financial statements except that there are significant additional reporting requirements under the new standard.
In February 2016, the FASB issued ASU No. 2016-02, Leases. This ASU establishes a right-of-use (ROU) model that requires a lessee to record a ROU asset and a lease liability on the balance sheet for all leases with terms longer than 12 months. Leases will be classified as either finance or operating, with classification affecting the pattern of expense recognition in the income statement. This ASU is effective for fiscal years beginning after December 15, 2018, including interim periods within those fiscal years. A modified retrospective transition approach is required for lessees for capital and operating leases existing at, or entered into after, the beginning of the earliest comparative period presented in the financial statements, with certain practical expedients available. We are currently evaluating the impact of the pending adoption of this new standard on our financial statements and we have yet to determine the overall impact this ASU is expected to have. The likely impact will be one of presentation only on our consolidated balance sheet. Our leases currently consist of operating leases with varying expiration dates through 2021 and annual rent expense is approximately $1.7 million.
In March 2016, the FASB issued ASU 2016-06, Derivatives and Hedging (Topic 815). This ASU is related to the embedded derivative analysis for debt instruments with contingent call or put options. This ASU clarifies that an exercise contingency does not need to be evaluated to determine whether it relates only to interest rates or credit risk. Instead, the contingent put or call option should be evaluated for possible bifurcation as a derivative in accordance with the four-step decision sequence detailed in FASB ASC 815-15, without regard to the nature of the exercise contingency. This ASU is effective for fiscal years, and for interim periods within those fiscal years, beginning after December 15, 2016. Early adoption is permitted. We are currently evaluating the impact of this ASU on our financial statements.
In March 2016, the FASB issued ASU 2016-08, Revenue from Contracts with Customers (Topic 606). This ASU is related to reporting revenue gross versus net, or principal versus agent considerations. This ASU is meant to clarify the guidance in ASU 2014-09, Revenue from Contracts with Customers, as it pertains to principal versus agent considerations. Specifically, the guidance addresses how entities should identify goods and services being provided to a customer, the unit of account for a principal versus agent assessment, how to evaluate whether a good or service is controlled before being transferred to a customer, and how to assess whether an entity controls services performed by another party. This ASU has the same effective date as the new revenue standard, which is effective for fiscal years, and for interim periods within those fiscal years, beginning after December 15, 2017. We are evaluating the effect and methodology of adopting this new accounting guidance upon our results of operations, cash flows and financial position. We have begun to consider the alternatives of adoption of this ASU, and have started our review of the likely impact to the existing portfolio of customer contracts entered into prior to adoption. We will also continue to evaluate the effect of adopting this guidance upon our results of operations, cash flows and financial position. Currently, we do not expect the adoption of this ASU to have a material impact on our financial statements except that there are significant additional reporting requirements under the new standard.
In March 2016, the FASB issued ASU 2016-09, Compensation-Stock Compensation (Topic 718). This ASU is related to simplifications of employee share-based payment accounting. This pronouncement eliminates the APIC pool concept and requires that excess tax benefits and tax deficiencies be recorded in the income statement when awards are settled. The pronouncement also addresses simplifications related to statement of cash flows classification, accounting for forfeitures and minimum statutory tax withholding requirements. This ASU is effective for fiscal years, and for interim periods within those fiscal years, beginning after December 15, 2016. Early adoption is permitted. This ASU will not have a material impact on our financial statements.
38
In April 2016, the FASB issued ASU 2016-10, Revenue from Contracts with Customers (Topic 606): Identifying Performance Obligations and Licensing. This ASU is meant to clarify the guidance in FASB ASU 2014-09, Revenue from Contracts with Customers. Specifically, the guidance addresses an entity’s identification of its performance obligations in a contract, as well as an entity’s evaluation of the nature of its promise to grant a license of intellectual property and whether or not that revenue is recognized over time or at a point in time. This ASU has the same effective date as the new revenue standard, which is effective for fiscal years, and for interim periods within those fiscal years, beginning after December 15, 2017. We are considering the alternatives of adoption of this ASU and we continue to review the likely impact to the existing portfolio of customer contracts entered into prior to adoption. We will continue to evaluate the effect of adopting this guidance upon our results of operations, cash flows and financial position. We do not expect the adoption of this ASU to have a material impact on our financial statements except that there are significant additional reporting requirements under the new standard.
In May 2016, the FASB issued ASU 2016-11, Revenue Recognition (Topic 605) and Derivatives and Hedging (Topic 815): Rescission of SEC Guidance Because of Accounting Standards Updates 2014-09 and 2014-16 Pursuant to Staff Announcements at the March 3, 2016 EITF Meeting. This ASU rescinds SEC paragraphs pursuant to two SEC Staff Announcements at the March 3, 2016 Emerging Issues Task Force (EITF) meeting. Specifically, registrants should not rely on the following SEC Staff Observer comments upon adoption of Topic 606: (1) Revenue and Expense Recognition for Freight Services in Process, which is codified in paragraph 605-20-S99-2; (2) Accounting for Shipping and Handling Fees and Costs, which is codified in paragraph 605-45-S99-1; (3) Accounting for Consideration Given by a Vendor to a Customer (including Reseller of the Vendor’s Products), which is codified in paragraph 605-50-S99-1; and (4) Accounting for Gas-Balancing Arrangements (i.e., use of the “entitlements method”), which is codified in paragraph 932-10-S99-5. This ASU becomes effective upon adoption of ASU 2014-09, which is effective for fiscal years, and for interim periods within those fiscal years, beginning after December 15, 2017. We have not yet begun to consider the alternatives of adoption of this ASU or its impact on our financial statements.
In May 2016, the FASB issued ASU 2016-12, Revenue from Contracts with Customers (Topic 606): Narrow-Scope Improvements and Practical Expedients. This ASU does not change the core principle of the guidance in Topic 606. Instead, the amendments provide clarifying guidance in a few narrow areas and add some practical expedients to the guidance. This ASU has the same effective date as the new revenue standard, which is effective for fiscal years, and for interim periods within those fiscal years, beginning after December 15, 2017. We are currently evaluating the impact of the pending adoption of this new standard on our financial statements. We are considering the alternatives of adoption of this ASU. Currently, we do not expect the adoption of this ASU to have a material impact on our financial statements except that there are significant additional reporting requirements under the new standard.
In June 2016, the FASB issued ASU 2016-13, Financial Instruments - Credit Losses (Topic 326): Measurement of Credit Losses on Financial Instruments. The amendments in this ASU replace the incurred loss impairment methodology in current U.S. GAAP with a methodology that reflects expected credit losses and requires consideration of a broader range of reasonable and supportable information to inform credit loss estimates. This ASU is effective for fiscal years, and for interim periods within those fiscal years, beginning after December 15, 2019. We have not adopted this ASU and currently we have determined there to be no impact of this ASU on our financial statements and related disclosures.
In August 2016, the FASB issued ASU 2016-15, Statement of Cash Flows (Topic 230): Classification of Certain Cash Receipts and Cash Payments. The new guidance is intended to reduce diversity in practice in how transactions are classified in the statement of cash flows. This ASU is effective for fiscal years, and for interim periods within those fiscal years, beginning after December 15, 2017. Early adoption is permitted. We are currently evaluating the impact of this ASU on our financial statements and currently we have determined there to be no impact of this ASU on our financial statements and related disclosures.
In January 2017, the FASB issued 2017-03, Accounting Changes and Error Corrections (Topic 250) and Investments - Equity Method and Joint Ventures (Topic 323): Amendments to SEC Paragraphs Pursuant to Staff Announcements at the September 22, 2016 and November 17, 2016 EITF Meetings. The amendments in this ASU add language to the SEC Staff Guidance in relation to ASU 2014-09, Revenue from Contracts with Customers (Topic 606), ASU 2016-02, Leases (Topic 842), and ASU 2016-13, Financial Instruments - Credit Losses (Topic 326). This ASU provides the SEC Staff view that a registrant should consider additional quantitative and qualitative disclosures related to the previously mentioned ASUs in connection with the status and impact of their adoption. We adopted this ASU during the current quarter 2016. Since this update intended to add disclosures related to certain ASUs, the adoption of this standard did not have a material impact on our financial statements.
In January 2017, the FASB issued 2017-04, Intangibles - Goodwill and Other (Topic 350): Simplifying the Test for Goodwill Impairment. The amendments in this ASU simplify the subsequent measurement of goodwill by eliminating Step 2 from the goodwill impairment test and eliminating the requirement for a reporting unit with a zero or negative carrying amount to perform a qualitative assessment. Instead, under this pronouncement, an entity would perform its annual, or interim, goodwill impairment test by comparing the fair value of a reporting unit with its carrying amount and would recognize an impairment change for the amount by which the
39
carrying amount exceeds the reporting unit’s fair value; however, the loss recognized is not to exceed the total amount of goodwill allocated to that reporting unit. In addition, income tax effects will be considered, if applicable. This ASU is effective for fiscal years, and interim periods within those fiscal years, beginning after December 15, 2019. Early adoption is permitted. We are currently evaluating the impact of this ASU on our financial statements and related disclosures.
CRITICAL ACCOUNTING POLICIES AND ESTIMATES
Our consolidated financial statements are prepared in accordance with U.S. GAAP, which requires management to make estimates, judgments and assumptions that affect the amounts reported in our consolidated financial statements. Management considers an accounting policy to be critical if it is important to our financial condition and results of operations, and if it requires significant judgment and estimates on the part of management in its application. The development and selection of these critical accounting policies have been determined by management and the related disclosures have been reviewed with the Audit Committee of our Board of Directors. We consider the following accounting policies to be critical in the preparation of our consolidated financial statements:
Revenue Recognition
Revenue Recognition
Revenues from our Digital Channels are recognized on a straight-line basis over the subscription period once the subscription has been activated.
Revenues from home video exploitation, which includes IP Licensing and Wholesale Distribution revenues, are recognized upon meeting the recognition requirements of the Financial Accounting Standards Board Accounting Standards Codification (or ASC) 926, Entertainment—Films and ASC 605, Revenue Recognition. We generate our IP Licensing and Wholesale Distribution revenues primarily from the exploitation of acquired or produced content rights through various distribution channels. The content is monetized in DVD format to wholesalers, licensed to broadcasters including cable companies and digital platforms like Amazon and Netflix, and exploited through other windows such as VOD. Revenue is presented net of sales returns, rebates, unit price adjustments, sales return reserves, sales discounts and market development fund reserves. Revenues from our U.K. catalog sales are recognized, net of an allowance for estimated returns, once payment has been received from the customer and the items ordered have been shipped.
Revenues from home video exploitation are recognized net of an allowance for estimated returns, as well as related costs, in the period in which the product is available for sale by our wholesale partners (at the point that title and risk of loss transfer to the customer, which is generally upon receipt by the customer and in the case of new releases, after “street date” restrictions lapse). Rental revenues under revenue sharing arrangements are recognized when we are entitled to receipts and such receipts are determinable. Revenues from domestic and international broadcast licensing and home video sublicensing, as well as associated costs, are recognized when the programming is available to the licensee and all other recognition requirements are met such as the broadcaster is free to air the programming. Fees received in advance of availability, usually in the case of advances received from international home video sub-licensees and for broadcast programming, are deferred until earned and all revenue recognition requirements have been satisfied. Provisions for sales returns and uncollectible accounts receivable are provided at the time of sale.
Revenues from home video exploitation are recognized net of an allowance for estimated returns, as well as related costs, in the period in which the product is available for sale by our customers (at the point that title and risk of loss transfer to the customer, which is generally upon receipt by the customer and in the case of new releases, after “street date” restrictions lapse). Rental revenues under revenue sharing arrangements are recognized when we are entitled to receipts and such receipts are determinable. Revenues from domestic and international broadcast licensing and home video sublicensing, as well as associated costs, are recognized when the programming is available to the licensee and all other recognition requirements are met such as the broadcaster is free to air the programming. Fees received in advance of availability, usually in the case of advances received from international home video sub-licensees and for broadcast programming, are deferred until earned and all revenue recognition requirements have been satisfied. Provisions for sales returns and uncollectible accounts receivable are provided at the time of sale.
Allowances for Sales Returns
For each reporting period, we evaluate product sales and accounts receivable to estimate their effect on revenues due to product returns, sales allowances and other credits given, and delinquent accounts. Our estimates of product sales that will be returned and the amount of receivables that will ultimately be collected require the exercise of judgment and affect reported revenues and net earnings. In determining the estimate of product sales that will be returned, we analyze historical returns (quantity of returns and time to receive returned product), historical pricing and other credit data, current economic trends, and changes in customer demand and acceptance of our products, including reorder activity. Based on this information, we reserve a percentage of each dollar of product sales where
40
the customer has the right to return such product and receive a credit. Actual returns could differ from our estimates and current provisions for sales returns and allowances, resulting in future charges to earnings. Estimates of future sales returns and other credits are subject to substantial uncertainty. Factors that could negatively impact actual returns include retailer financial difficulties, the perception of comparatively poor retail performance in one or several retailer locations, limited retail shelf space at various times of the year, inadequate advertising or promotions, retail prices being too high for the perceived quality of the content or other comparable content, the near-term release of similar titles, and poor responses to package designs. Underestimation of product sales returns and other credits would result in an overstatement of current revenues and lower revenues in future periods. Conversely, overestimation of product sales returns would result in an understatement of current revenues and higher revenues in future periods.
Investments in Content
Investments in content include the unamortized costs of completed and uncompleted films and television programs that were acquired or produced. Within the carrying balance of investments in content are development and production costs for films and television programs which are acquired or produced.
Acquired Distribution Rights and Produced Content
Royalty and Distribution Fee Advances – When acquiring titles, we often make a royalty and distribution fee advances that represent a fixed minimum payments made to program suppliers for exclusive content distribution rights. A program supplier’s share of exclusive program distribution revenues is retained by us until the share equals the advance(s) paid to the program supplier plus recoupable costs. Thereafter, any excess is paid to the program supplier. In the event of an excess, we also record, as content amortization and royalties – a component of cost of sales, an amount equal to the program supplier’s share of the net distribution revenues.
Original Production Costs – For films and television programs produced by RLJE, original production costs include all direct production and financing costs, as well as production overhead.
Unamortized content investments for our |Digital Channels are charged to content amortization and royalties using the straight-line method over the license term for which the content is available to the Digital Channels.
For IP Licensing and Wholesale Distribution, unamortized content investments are charged to content amortization and royalties as revenues are earned in the same ratio that current period revenue for a title or group of titles bears to the estimated remaining unrecognized ultimate revenue for that title.
Ultimate revenue includes estimates over a period not to exceed ten years following the date of initial release, or for episodic television series a period not to exceed 10 years from the date of delivery of the first episode or, if still in production, five years from the date of delivery of the most recent episode, if later.
Investments in content are stated at the lower of amortized cost or estimated fair value. The valuation of investments in content is reviewed on a title-by-title basis, when an event or change in circumstances indicates that the fair value of a film or television program is less than its unamortized cost. Additional amortization is recorded in the amount by which the unamortized costs exceed the estimated fair value of the film or television program. Estimates of future revenue involve measurement uncertainty and it is therefore possible that reductions in the carrying value of investment in films and television programs may be required as a consequence of changes in management’s future revenue estimates.
Content programs in progress include the accumulated costs of productions, which have not yet been completed, and advances on content not yet received from program suppliers. We begin to amortize these investments once the content has been released.
Production Development Costs
The costs to produce licensed content for domestic and international exploitation include the cost of converting film prints or tapes into the optical disc format. Depending on the platform for which the content is being exploited, costs may include menu design, authoring, compression, subtitling, closed captioning, service charges related to disc manufacturing, ancillary material production, product packaging design and related services. These costs are capitalized as incurred. A percentage of the capitalized production costs are amortized to expense based upon: (i) a projected revenue stream resulting from distribution of new and previously released content related to such production costs; and (ii) management’s estimate of the ultimate net realizable value of the production costs. Estimates of future revenues are reviewed periodically and amortization of production costs is adjusted accordingly. If estimated future revenues are not sufficient to recover the unamortized balance of production costs, such costs are reduced to their estimated fair value.
41
Inventories
For each reporting period, we review the value of inventories on hand to estimate the recoverability through future sales. Values in excess of anticipated future sales are recorded as obsolescence reserve. Inventories consist primarily of packaged goods for sale, which are stated at average cost, as well as componentry.
Goodwill and Other Intangible Assets
Goodwill
Goodwill represents the excess of acquisition costs over the tangible and identifiable intangible assets acquired and liabilities assumed in a business acquisition. Goodwill is recorded at our reporting units, which are consolidated into our reporting segments. Goodwill is not amortized but is reviewed for impairment annually on October 1st of each year or between the annual tests if an event occurs or circumstances change that indicates it is more-likely-than-not that the fair value of a reporting unit is less than its carrying value. The impairment test follows a two-step approach. The first step determines if the goodwill is potentially impaired, and the second step measures the amount of the impairment loss, if necessary. Under the first step, goodwill is considered potentially impaired if there are subjective characteristics that suggest that goodwill is impaired or quantitatively when the fair value of the reporting unit is less than the reporting unit’s carry amount, including goodwill. Under the second step, the impairment loss is then measured as the excess of recorded goodwill over the fair value of the goodwill, as calculated. Determining the fair value requires various assumptions and estimates, which include consideration of the future, projected operating results and cash flows. Such projections could be different than actual results. Should actual results be significantly less than estimates, the value of our goodwill could be impaired in future periods.
Other Intangible Assets
Other intangible assets are reported at their estimated fair value, when acquired, less accumulated amortization. The majority of our intangible assets were recognized as a result of the Business Combination. As such, the fair values of our intangibles were recorded in 2012 when applying purchase accounting. Additions since the 2012 Business Combination are limited to software expenditures related to our websites and various digital platforms such as Roku and AppleTV. Similar to how we account for internal-use software development, costs incurred to develop and implement our websites and digital platforms are capitalized in accordance with ASC 350-50, Website Development Costs. Website operating costs are expensed as incurred. Costs incurred for upgrades and enhancements that provide additional functionality are capitalized.
Amortization expense of our other intangible assets is generally computed by applying the straight-line method, or based on estimated forecasted future revenues as stated below, over the estimated useful lives of trade names (11 to 15 years), websites and digital platforms (three years), supplier contracts (seven years), customer relationships (five years), options on future content (seven years) and leases (two years). The recorded value of our customer relationships is amortized on an accelerated basis over five years, with approximately 60% being amortized over the first two years (through 2014), 20% during the third year and the balance ratably over the remaining useful life. The recorded value of our options on future content is amortized based on forecasted future revenues, whereby approximately 50% is being amortized over the first two years (through 2014), 25% during the third year and the balance in decreasing amounts over the remaining four years.
Additional amortization expense is provided on an accelerated basis when the useful life of an intangible asset is determined to be less than originally expected. Other intangible assets are reviewed for impairment when an event or circumstance indicates the fair value is lower than the current carrying value.
Warrant and Other Derivative Liabilities
We have warrants outstanding to purchase 30.1 million shares of our common stock. Warrants issued in 2012 to acquire 7.0 million shares of common stock contain a provision whereby the exercise price will be reduced if RLJE is reorganized as a private company. Because of this provision, these warrants are accounted for as a derivative liability in accordance with ASC 815-40, Contracts in Entity’s Own Equity. Derivative liability warrants are carried on our consolidated balance sheet at their fair value with changes in fair value being included in the consolidated statement of operations as a separate component of other income (expense).
In May 2015, we issued additional warrants to acquire 3.1 million shares of our common stock. We were accounting for these warrants as a derivative liability because, among other provisions, the warrants contained a provision that allows the warrant holders to sell their warrants back to us, at their discretion, at a cash purchase price equal to the warrants’ then fair value, upon the consummation of certain fundamental transactions, such as a business combination or other change-in-control transactions. In October 2016, the 2015 warrants were amended and they are now being accounted for within shareholders’ equity (deficit).
42
In October 2016, we issued three separate warrants to our senior lender to acquire a total of 20.0 million shares of our common stock. For one of these warrants issued to acquire 5.0 million shares of common stock, we are accounting for the warrant as a derivative liability because the warrant contains a provision that may increase the number of shares acquirable for no additional consideration. This increase is contingent upon the number of shares of common stock outstanding at the time of exercise.
Our preferred stock is convertible into shares of common stock at an exchange rate equal to 333.3 shares of common stock for each share of preferred stock, subject to adjustment for any unpaid dividends. The conversion rate is subject to certain anti-dilution protections. Those protections did include an adjustment for offerings consummated at a per-share price of less than $3.00 per common share. Because of this potential adjustment to the conversion rate, we had bifurcated the conversion feature from its host instrument (a preferred share) and we were accounting for the conversion feature as a derivative liability. In October 2016, we amended the conversion feature to avoid liability accounting and as such we now account for the conversion feature as part of the host instrument.
Income Taxes
We account for income taxes pursuant to the provisions of ASC 740, Income Taxes, whereby deferred tax assets and liabilities are recognized for the future tax consequences attributable to differences between the financial statement carrying amount of existing assets and liabilities and their respective tax bases and the future tax benefits derived from operating loss and tax credit carryforwards. We provide a valuation allowance on our deferred tax assets when it is more likely than not that such deferred tax assets will not be realized.
ASC 740 requires that we recognize in the consolidated financial statements the effect of a tax position that is more likely than not to be sustained upon examination based on the technical merits of the position. The first step is to determine whether or not a tax benefit should be recognized. A tax benefit will be recognized if the weight of available evidence indicates that the tax position is more likely than not to be sustained upon examination by the relevant tax authorities. The recognition and measurement of benefits related to our tax positions requires significant judgment as uncertainties often exist with respect to new laws, new interpretations of existing laws, and rulings by taxing authorities. Differences between actual results and our assumptions, or changes in our assumptions in future periods, are recorded in the period they become known. For tax liabilities, we recognize accrued interest related to uncertain tax positions as a component of income tax expense, and penalties, if incurred, are recognized as a component of operating expense.
Off-Balance Sheet Arrangements
We typically acquire content via separately executed licensing or distribution agreements with content suppliers. These contracts generally require that we make advance payments before the content is available for exploitation. Advance payments are generally due prior to and upon delivery of the related content. To the extent payment is not due until delivery has occurred, we do not recognize our payment obligations under our licensing and distribution agreements prior to the content being delivered. As of December 31, 2016, we had entered into licensing and distribution agreement for which we are obligated to pay $7.9 million once the related content has been delivered.
CONTRACTUAL COMMITMENTS
A table with our contractual commitments is not required for smaller reporting companies within our MD&A. For information regarding our contractual commitments refer to Note 10, Debt and Note 21, Commitment and Contingencies to our consolidated financial statements.
Item 7A. Quantitative and Qualitative Disclosures about Market Risk is not required for smaller reporting companies.
43
44
RLJ ENTERTAINMENT, INC. AND SUBSIDIARIES
Report of Independent Registered Public Accounting Firm
Board of Directors and Stockholders
RLJ Entertainment, Inc.
Silver Spring, Maryland
We have audited the accompanying consolidated balance sheets of RLJ Entertainment, Inc. (“Company”) as of December 31, 2016 and 2015, and the related consolidated statements of operations, comprehensive loss, changes in shareholders’ equity (deficit), and cash flows for the years then ended. These financial statements are the responsibility of the Company’s management. Our responsibility is to express an opinion on these financial statements based on our audits.
We conducted our audits in accordance with the standards of the Public Company Accounting Oversight Board (United States). Those standards require that we plan and perform the audit to obtain reasonable assurance about whether the financial statements are free of material misstatement. The Company is not required to have, nor were we engaged to perform, an audit of its internal control over financial reporting. Our audits included consideration of internal control over financial reporting as a basis for designing audit procedures that are appropriate in the circumstances, but not for the purpose of expressing an opinion on the effectiveness of the Company’s internal control over financial reporting. Accordingly, we express no such opinion. An audit also includes examining, on a test basis, evidence supporting the amounts and disclosures in the financial statements, assessing the accounting principles used and significant estimates made by management, as well as evaluating the overall financial statement presentation. We believe that our audits provide a reasonable basis for our opinion.
In our opinion, the consolidated financial statements referred to above present fairly, in all material respects, the financial position of RLJ Entertainment, Inc. at December 31, 2016 and 2015, and the results of its operations and its cash flows for the years then ended, in conformity with accounting principles generally accepted in the United States of America.
As discussed in note 1 to the consolidated financial statements, the Company changed its method of presentation of debt issuance costs in 2016 due to the adoption of Financial Accounting Standards Board Accounting Standards Update (“ASU”) 2015-03, Interest—Imputation of Interest (Subtopic 835-30): Simplifying the Presentation of Debt Issuance Costs. This change was applied retrospectively to all periods presented.
/s/ BDO USA, LLP
BDO USA, LLP
Los Angeles, California
March 23, 2017
45
RLJ ENTERTAINMENT, INC.
As of December 31, 2016 and 2015
|
|
|
December 31, |
|
|||||
|
(In thousands, except share data) |
|
2016 |
|
|
2015 |
|
||
|
ASSETS |
|
|
|
|
|
|
|
|
|
Cash |
|
$ |
7,834 |
|
|
$ |
4,530 |
|
|
Accounts receivable, net |
|
|
19,569 |
|
|
|
23,886 |
|
|
Inventories, net |
|
|
6,215 |
|
|
|
8,325 |
|
|
Investments in content, net |
|
|
60,737 |
|
|
|
60,407 |
|
|
Prepaid expenses and other assets |
|
|
798 |
|
|
|
833 |
|
|
Property, equipment and improvements, net |
|
|
1,336 |
|
|
|
1,815 |
|
|
Equity investment in affiliate |
|
|
16,491 |
|
|
|
20,098 |
|
|
Other intangible assets, net |
|
|
9,309 |
|
|
|
9,233 |
|
|
Goodwill |
|
|
13,691 |
|
|
|
14,631 |
|
|
Assets of discontinued operations |
|
|
— |
|
|
|
6,870 |
|
|
Total assets |
|
$ |
135,980 |
|
|
$ |
150,628 |
|
|
LIABILITIES AND SHAREHOLDERS' EQUITY (DEFICIT) |
|
|
|
|
|
|
|
|
|
Accounts payable and accrued liabilities |
|
$ |
11,995 |
|
|
$ |
16,370 |
|
|
Accrued royalties and distribution fees |
|
|
55,614 |
|
|
|
51,552 |
|
|
Deferred revenue |
|
|
2,152 |
|
|
|
1,203 |
|
|
Debt, net of discounts and debt issuance costs |
|
|
42,053 |
|
|
|
61,250 |
|
|
Deferred tax liability |
|
|
1,715 |
|
|
|
1,839 |
|
|
Stock warrant and other derivative liabilities |
|
|
9,763 |
|
|
|
10,678 |
|
|
Liabilities of discontinued operations |
|
|
— |
|
|
|
7,560 |
|
|
Total liabilities |
|
|
123,292 |
|
|
|
150,452 |
|
|
Commitments and contingencies (see Note 21) |
|
|
|
|
|
|
|
|
|
Redeemable convertible preferred stock |
|
|
— |
|
|
|
21,346 |
|
|
Shareholders' Equity (Deficit): |
|
|
|
|
|
|
|
|
|
Redeemable convertible preferred stock, $0.001 par value, 1,000,000 shares authorized; 31,046 shares issued and 30,198 shares outstanding at December 31, 2016 and 31,046 shares issued and outstanding at December 31, 2015; liquidation preference of $34,366 at December 31, 2016 and $32,617 at December 31, 2015 |
|
|
38,708 |
|
|
|
— |
|
|
Common stock, $0.001 par value, 250,000,000 shares authorized, 5,240,085 shares issued and outstanding at December 31, 2016 and 4,717,324 shares issued and outstanding at December 31, 2015 |
|
|
5 |
|
|
|
5 |
|
|
Additional paid-in capital |
|
|
106,059 |
|
|
|
85,400 |
|
|
Accumulated deficit |
|
|
(127,388 |
) |
|
|
(105,514 |
) |
|
Accumulated other comprehensive loss |
|
|
(4,696 |
) |
|
|
(1,061 |
) |
|
Total shareholders' equity (deficit) |
|
|
12,688 |
|
|
|
(21,170 |
) |
|
Total liabilities and shareholders' equity (deficit) |
|
$ |
135,980 |
|
|
$ |
150,628 |
|
See accompanying notes to consolidated financial statements.
46
RLJ ENTERTAINMENT, INC.
CONSOLIDATED STATEMENTS OF OPERATIONS
Years Ended December 31, 2016 and 2015
|
|
|
Years Ended December 31, |
|
|||||
|
(In thousands, except per share data) |
|
2016 |
|
|
2015 |
|
||
|
Revenues |
|
$ |
80,238 |
|
|
$ |
98,970 |
|
|
Cost of sales |
|
|
|
|
|
|
|
|
|
Content amortization and royalties |
|
|
36,946 |
|
|
|
54,030 |
|
|
Manufacturing and fulfillment |
|
|
16,901 |
|
|
|
22,656 |
|
|
Total cost of sales |
|
|
53,847 |
|
|
|
76,686 |
|
|
Gross profit |
|
|
26,391 |
|
|
|
22,284 |
|
|
|
|
|
|
|
|
|
|
|
|
Selling expenses |
|
|
9,298 |
|
|
|
10,915 |
|
|
General and administrative expenses |
|
|
17,841 |
|
|
|
17,746 |
|
|
Depreciation and amortization |
|
|
2,957 |
|
|
|
4,137 |
|
|
Goodwill impairment |
|
|
— |
|
|
|
30,260 |
|
|
Total operating expenses |
|
|
30,096 |
|
|
|
63,058 |
|
|
LOSS FROM CONTINUING OPERATIONS |
|
|
(3,705 |
) |
|
|
(40,774 |
) |
|
|
|
|
|
|
|
|
|
|
|
Equity earnings of affiliate |
|
|
3,078 |
|
|
|
2,217 |
|
|
Interest expense, net |
|
|
(8,400 |
) |
|
|
(9,968 |
) |
|
Change in fair value of stock warrants and other derivatives |
|
|
(4,573 |
) |
|
|
1,373 |
|
|
Loss on extinguishment of debt |
|
|
(3,549 |
) |
|
|
— |
|
|
Other expense |
|
|
(1,293 |
) |
|
|
(1,402 |
) |
|
LOSS FROM CONTINUING OPERATIONS BEFORE PROVISION FOR INCOME TAXES |
|
|
(18,442 |
) |
|
|
(48,554 |
) |
|
Provision for income taxes |
|
|
(155 |
) |
|
|
(165 |
) |
|
LOSS FROM CONTINUING OPERATIONS, NET OF INCOME TAXES |
|
|
(18,597 |
) |
|
|
(48,719 |
) |
|
LOSS FROM DISCONTINUED OPERATIONS, NET OF INCOME TAXES |
|
|
(3,277 |
) |
|
|
(6,261 |
) |
|
NET LOSS |
|
|
(21,874 |
) |
|
|
(54,980 |
) |
|
Accretion on preferred stock |
|
|
(4,301 |
) |
|
|
(2,626 |
) |
|
NET LOSS ATTRIBUTABLE TO COMMON SHAREHOLDERS |
|
$ |
(26,175 |
) |
|
$ |
(57,606 |
) |
|
Net loss per common share attributable to common shareholders: |
|
|
|
|
|
|
|
|
|
Continuing operations |
|
$ |
(4.97 |
) |
|
$ |
(12.08 |
) |
|
Discontinued operations |
|
|
(0.72 |
) |
|
|
(1.47 |
) |
|
Basic and diluted net loss per common share attributable to common shareholders |
|
$ |
(5.69 |
) |
|
$ |
(13.55 |
) |
|
|
|
|
|
|
|
|
|
|
|
Weighted average shares outstanding: |
|
|
|
|
|
|
|
|
|
Basic and diluted |
|
|
4,603 |
|
|
|
4,251 |
|
See accompanying notes to consolidated financial statements.
47
RLJ ENTERTAINMENT, INC.
CONSOLIDATED STATEMENTS OF COMPREHENSIVE LOSS
Years Ended December 31, 2016 and 2015
|
|
|
Years Ended December 31, |
|
|||||
|
(In thousands) |
|
2016 |
|
|
2015 |
|
||
|
Net loss |
|
$ |
(21,874 |
) |
|
$ |
(54,980 |
) |
|
Other comprehensive loss: |
|
|
|
|
|
|
|
|
|
Foreign currency translation loss |
|
|
(3,635 |
) |
|
|
(332 |
) |
|
Total comprehensive loss |
|
$ |
(25,509 |
) |
|
$ |
(55,312 |
) |
See accompanying notes to consolidated financial statements.
48
RLJ ENTERTAINMENT, INC.
CONSOLIDATED STATEMENTS OF CHANGES IN SHAREHOLDERS’ EQUITY (DEFICIT)
Years Ended December 31, 2016 and 2015
|
|
|
|
|
|
|
Common Stock |
|
|
|
|
|
|
|
|
|
|
|
|
|
|
Treasury Stock |
|
|
|
|
|
||||||||||
|
(In thousands) |
|
Preferred Stock |
|
|
Shares |
|
|
Par Value |
|
|
Additional Paid-in Capital |
|
|
Accumulated Deficit |
|
|
Accumulated Other Comprehensive Income (Loss) |
|
|
Shares |
|
|
At Cost |
|
|
Total Equity |
|
|||||||||
|
Balance at January 1, 2015 |
|
$ |
— |
|
|
|
4,445 |
|
|
$ |
5 |
|
|
$ |
87,715 |
|
|
$ |
(50,534 |
) |
|
$ |
(729 |
) |
|
|
130 |
|
|
$ |
— |
|
|
$ |
36,457 |
|
|
Issuance of restricted common stock for services |
|
|
— |
|
|
|
435 |
|
|
|
1 |
|
|
|
— |
|
|
|
— |
|
|
|
— |
|
|
|
(293 |
) |
|
|
— |
|
|
|
1 |
|
|
Forfeiture of restricted common stock |
|
|
— |
|
|
|
(17 |
) |
|
|
— |
|
|
|
— |
|
|
|
— |
|
|
|
— |
|
|
|
17 |
|
|
|
— |
|
|
|
— |
|
|
Forfeiture of founder shares |
|
|
— |
|
|
|
(146 |
) |
|
|
(1 |
) |
|
|
1 |
|
|
|
— |
|
|
|
— |
|
|
|
146 |
|
|
|
— |
|
|
|
— |
|
|
Accretion on preferred stock |
|
|
— |
|
|
|
— |
|
|
|
— |
|
|
|
(2,626 |
) |
|
|
— |
|
|
|
|
|
|
|
— |
|
|
|
|
|
|
|
(2,626 |
) |
|
Stock-based compensation |
|
|
— |
|
|
|
— |
|
|
|
— |
|
|
|
310 |
|
|
|
— |
|
|
|
— |
|
|
|
— |
|
|
|
— |
|
|
|
310 |
|
|
Foreign currency translation |
|
|
— |
|
|
|
— |
|
|
|
— |
|
|
|
— |
|
|
|
— |
|
|
|
(332 |
) |
|
|
— |
|
|
|
— |
|
|
|
(332 |
) |
|
Net loss |
|
|
— |
|
|
|
— |
|
|
|
— |
|
|
|
— |
|
|
|
(54,980 |
) |
|
|
— |
|
|
|
— |
|
|
|
— |
|
|
|
(54,980 |
) |
|
Balance at December 31, 2015 |
|
|
— |
|
|
|
4,717 |
|
|
|
5 |
|
|
|
85,400 |
|
|
|
(105,514 |
) |
|
|
(1,061 |
) |
|
|
— |
|
|
|
— |
|
|
|
(21,170 |
) |
|
Issuance of restricted common stock for services |
|
|
— |
|
|
|
217 |
|
|
|
— |
|
|
|
— |
|
|
|
— |
|
|
|
— |
|
|
|
(6 |
) |
|
|
— |
|
|
|
— |
|
|
Forfeiture of restricted common stock |
|
|
— |
|
|
|
(6 |
) |
|
|
— |
|
|
|
— |
|
|
|
— |
|
|
|
— |
|
|
|
6 |
|
|
|
— |
|
|
|
— |
|
|
Conversion of preferred stock |
|
|
— |
|
|
|
312 |
|
|
|
— |
|
|
|
1,232 |
|
|
|
— |
|
|
|
— |
|
|
|
— |
|
|
|
— |
|
|
|
1,232 |
|
|
Accretion on preferred stock |
|
|
354 |
|
|
|
— |
|
|
|
— |
|
|
|
(4,301 |
) |
|
|
— |
|
|
|
— |
|
|
|
— |
|
|
|
— |
|
|
|
(3,947 |
) |
|
Preferred stock amendment |
|
|
38,354 |
|
|
|
— |
|
|
|
— |
|
|
|
4,415 |
|
|
|
— |
|
|
|
— |
|
|
|
— |
|
|
|
— |
|
|
|
42,769 |
|
|
Issuance of warrants |
|
|
— |
|
|
|
— |
|
|
|
— |
|
|
|
18,268 |
|
|
|
— |
|
|
|
— |
|
|
|
— |
|
|
|
— |
|
|
|
18,268 |
|
|
Stock-based compensation |
|
|
— |
|
|
|
— |
|
|
|
— |
|
|
|
1,045 |
|
|
|
— |
|
|
|
— |
|
|
|
— |
|
|
|
— |
|
|
|
1,045 |
|
|
Foreign currency translation |
|
|
— |
|
|
|
— |
|
|
|
— |
|
|
|
— |
|
|
|
— |
|
|
|
(3,635 |
) |
|
|
— |
|
|
|
— |
|
|
|
(3,635 |
) |
|
Net loss |
|
|
— |
|
|
|
— |
|
|
|
— |
|
|
|
— |
|
|
|
(21,874 |
) |
|
|
— |
|
|
|
— |
|
|
|
— |
|
|
|
(21,874 |
) |
|
Balance at December 31, 2016 |
|
$ |
38,708 |
|
|
|
5,240 |
|
|
$ |
5 |
|
|
$ |
106,059 |
|
|
$ |
(127,388 |
) |
|
$ |
(4,696 |
) |
|
|
— |
|
|
$ |
— |
|
|
$ |
12,688 |
|
See accompanying notes to consolidated financial statements.
49
RLJ ENTERTAINMENT, INC.
CONSOLIDATED STATEMENTS OF CASH FLOWS
Years Ended December 31, 2016 and 2015
|
|
|
Years Ended December 31, |
|
|||||
|
(In thousands) |
|
2016 |
|
|
2015 |
|
||
|
CASH FLOWS FROM OPERATING ACTIVITIES: |
|
|
|
|
|
|
|
|
|
Net loss |
|
$ |
(21,874 |
) |
|
$ |
(54,980 |
) |
|
Adjustments to reconcile net loss to net cash used in operating activities: |
|
|
|
|
|
|
|
|
|
Equity earnings of affiliate |
|
|
(3,078 |
) |
|
|
(2,217 |
) |
|
Content amortization and royalties |
|
|
37,151 |
|
|
|
54,624 |
|
|
Depreciation and amortization |
|
|
4,025 |
|
|
|
5,956 |
|
|
Goodwill impairment |
|
|
— |
|
|
|
30,260 |
|
|
Deferred tax provision |
|
|
316 |
|
|
|
(70 |
) |
|
Foreign currency exchange loss |
|
|
1,487 |
|
|
|
1,111 |
|
|
Fair value adjustment of stock warrant and other derivative liabilities |
|
|
4,573 |
|
|
|
(1,373 |
) |
|
Non-cash interest expense |
|
|
2,436 |
|
|
|
3,001 |
|
|
Loss on extinguishment of debt |
|
|
3,549 |
|
|
|
— |
|
|
Stock-based compensation expense |
|
|
1,045 |
|
|
|
310 |
|
|
Loss on disposal of fixed assets |
|
|
206 |
|
|
|
— |
|
|
Dividends received from affiliate |
|
|
3,282 |
|
|
|
3,300 |
|
|
Changes in assets and liabilities: |
|
|
|
|
|
|
|
|
|
Accounts receivable, net |
|
|
4,761 |
|
|
|
(7,859 |
) |
|
Inventories, net |
|
|
4,247 |
|
|
|
2,190 |
|
|
Investments in content, net |
|
|
(33,927 |
) |
|
|
(38,868 |
) |
|
Prepaid expenses and other assets |
|
|
1,146 |
|
|
|
(564 |
) |
|
Accounts payable and accrued liabilities |
|
|
(11,080 |
) |
|
|
(921 |
) |
|
Deferred revenue |
|
|
251 |
|
|
|
(3,060 |
) |
|
Net cash used in operating activities |
|
|
(1,484 |
) |
|
|
(9,160 |
) |
|
CASH FLOWS FROM INVESTING ACTIVITIES: |
|
|
|
|
|
|
|
|
|
Capital expenditures |
|
|
(1,428 |
) |
|
|
(1,811 |
) |
|
Net cash used in investing activities |
|
|
(1,428 |
) |
|
|
(1,811 |
) |
|
CASH FLOWS FROM FINANCING ACTIVITIES: |
|
|
|
|
|
|
|
|
|
Proceeds from AMC credit agreement, net of transaction costs of $778 |
|
|
64,222 |
|
|
|
— |
|
|
Proceeds from issuance of preferred stock and warrants |
|
|
— |
|
|
|
22,500 |
|
|
Repayment of senior debt |
|
|
(56,938 |
) |
|
|
(12,449 |
) |
|
Payment of preferred stock and warrant issuance costs |
|
|
— |
|
|
|
(783 |
) |
|
Prepayment penalty to extinguish debt |
|
|
(822 |
) |
|
|
— |
|
|
Payment of senior debt modification costs |
|
|
— |
|
|
|
(450 |
) |
|
Net cash provided by financing activities |
|
|
6,462 |
|
|
|
8,818 |
|
|
EFFECT OF EXCHANGE RATE CHANGES ON CASH |
|
|
(246 |
) |
|
|
21 |
|
|
NET INCREASE (DECREASE) IN CASH: |
|
|
3,304 |
|
|
|
(2,132 |
) |
|
Cash at beginning of year |
|
|
4,530 |
|
|
|
6,662 |
|
|
Cash at end of year |
|
$ |
7,834 |
|
|
$ |
4,530 |
|
See accompanying notes to consolidated financial statements.
50
RLJ ENTERTAINMENT, INC.
NOTES TO CONSOLIDATED FINANCIAL STATEMENTS
|
Note 1. |
description of business |
Description of Business
RLJ Entertainment, Inc. (RLJE or the Company) is a premium digital channel company serving distinct audiences through its proprietary subscription-based digital channels (or Digital Channels), Acorn TV and UMC or Urban Movie Channel, and a direct presence in North America, the United Kingdom (or U.K.) and Australia with strategic sublicense and distribution relationships covering Europe, Asia and Latin America. RLJE was incorporated in Nevada in April 2012. On October 3, 2012, we completed the business combination of RLJE, Image Entertainment, Inc. (or Image) and Acorn Media Group, Inc. (or Acorn Media), which is referred to herein as the “Business Combination.” Acorn Media includes its U.K. subsidiaries RLJ Entertainment Ltd (or RLJE Ltd.), Acorn Media Enterprises Limited (or AME), and RLJE International Ltd (collectively, RLJE UK), as well as RLJ Entertainment Australia Pty Ltd (or RLJE Australia). In February 2012, Acorn Media acquired a 64% ownership of Agatha Christie Limited (or ACL). References to Image include its wholly-owned subsidiary Image/Madacy Home Entertainment, LLC. “We,” “our” or “us” refers to RLJE and its subsidiaries unless otherwise noted. Our principal executive offices are located in Silver Spring, Maryland, with an additional location in Woodland Hills, California. We also have international offices in London, England and Sydney, Australia.
We acquire content rights in various categories including, British mysteries and dramas, urban programming and full-length independent motion pictures. We acquire this content in two ways:
|
|
• |
through long-term exclusive licensing agreements where we secure multiple rights to third-party programs and; |
|
|
• |
through development, production and ownership of original drama television programming through our wholly-owned subsidiary, AME, and our 64%-owned equity method investee, ACL. |
We market our products through a multi-channel strategy encompassing (1) direct relations with consumers via proprietary subscription-based video on demand (or SVOD) digital channels (our Digital Channels segment); (2) the licensing of original drama and mystery content managed and developed through our wholly-owned subsidiary, AME, and our majority-owned subsidiary, ACL, (our Intellectual Property, or IP, Licensing segment); and (3) exploitation through partners covering broadcast/cable, digital, mobile, ecommerce and brick and mortar outlets (our Wholesale Distribution segment).
Our Digital Channels segment includes the sale of video content directly to consumers through our digital channels, such as Acorn TV and UMC or Urban Movie Channel.
On June 24, 2016, we entered into a licensing agreement with Universal Screen Arts (or USA) whereby USA took over our Acorn U.S. catalog/ecommerce business becoming the official, exclusive, direct-to-consumer seller of Acorn product in the U.S. During the year, we also ceased electronic email distribution of our Acacia catalogs. As a result of these actions, we have classified the U.S. catalog/ecommerce business as discontinued operations.
The IP Licensing segment includes intellectual property rights that we own or create and then sublicense for exploitation worldwide. Our Wholesale Distribution segment consists of the acquisition, content enhancement and worldwide exploitation of exclusive content in various formats, including broadcast (which includes cable and satellite), DVD, Blu-ray, digital, video-on-demand (or VOD), SVOD, downloading and sublicensing. The Wholesale Distribution segment exploits content through third-party vendors, which we also refer to as wholesale partners.
Our wholesale partners are broadcasters, digital outlets and major retailers in the United States of America (or U.S.), Canada, U.K. and Australia, including, among others, Amazon, Barnes & Noble, Costco, DirecTV, Hulu, iTunes, Netflix, PBS, Showtime, Starz, Target and Walmart.
RLJE’s management evaluates business performance based on these three distinctive reporting segments: (1) Digital Channels, (2) IP Licensing and (3) Wholesale Distribution. Operations and net assets that are not associated with any of these stated segments are reported as “Corporate” when disclosing and discussing segment information.
Basis of Presentation
The accompanying audited consolidated financial statements and related footnotes have been prepared in accordance with accounting principles generally accepted in the United States of America (or U.S. GAAP) and with the Securities and Exchange
51
Commission’s (or SEC) instructions for the Form 10-K. The preparation of financial statements in conformity with U.S. GAAP requires estimates and assumptions that affect the reported amounts within our consolidated financial statements. Although we believe that these estimates to be reasonably accurate, actual amounts may differ.
Principles of Consolidation
The operations of ACL are subject to oversight by ACL’s Board of Directors. The investment in ACL is accounted for using the equity method of accounting given the voting control of the Board of Directors by the minority shareholder. We have included our share of ACL’s operating results as a separate line item in our consolidated financial statements.
Our consolidated financial statements include the accounts of all majority-owned subsidiary companies, except for ACL. We carry our investment in ACL as a separate asset on our consolidated balance sheet at cost adjusted for our share of the equity in undistributed earnings. Except for dividends and changes in ownership interest, we report changes in equity in undistributed earnings of ACL as “Equity earnings of affiliate” in our consolidated statements of operations. All intercompany transactions and balances have been eliminated.
Reclassifications and Adoption of Accounting Pronouncement
During 2016, we reclassified our U.S. catalog/ecommerce business assets, liabilities and operating results and presented them separately as discontinued operations in our consolidated balance sheets and statements of operations. We made this reclassification retroactively for all periods presented. As necessary, our footnote disclosures have been updated to reflect this reclassification. Prior to being classified as a discontinued operation, our U.S. catalog/ecommerce business was included in our Direct-to-Consumer segment, which we are now referring to as Digital Channels.
For segment reporting purposes, we also reclassified our remaining U.K. catalog/e-commerce business from Digital Channels to Wholesale Distribution. This reclassification reflects adjustments that we made internally in terms of how we are viewing and managing our operations after the disposal of our U.S. ecommerce/catalog business. This change has been reflected through retroactive reclassification of prior period information.
Certain amounts reported previously in our consolidated financial statements have been reclassified or adjusted to be comparable with the classifications used for our 2016 consolidated financial statements. We are now reporting technology infrastructure costs associated with delivering our digital channels within cost of sales as manufacturing and fulfillment. For the year ended December 31, 2015, we reclassified $1.7 million of these costs from selling expenses to cost of sales in our consolidated statement of operations.
On January 1, 2016, we retroactively adopted the guidance of Accounting Standards Update (or ASU) No. 2015-03, Interest – Imputation of Interest (the Update) issued by the Financial Accounting Standards Board (or FASB). We are now presenting issuance costs related to a recognized debt liability in our balance sheet as a direct deduction from the carrying amount of that debt liability, consistent with debt discounts. As of December 31, 2015, we reclassified $0.8 million of unamortized debt issuance costs from prepaid expenses and other to debt, net of discounts and debt issuance costs on our consolidated balance sheet. The adoption of ASU No. 2015-3 did not affect our results of operations.
In October 2016 and concurrent with our private placement with AMC Networks Inc. (see Note 10, Debt), we amended our redeemable convertible preferred stock, including its embedded conversion feature, and the common stock warrants that were held by our preferred stockholders such that the amended securities are now being accounted for as part of shareholders’ equity (deficit). Prior to this amendment, the securities were being accounted for as either liabilities or as temporary equity, which is after liabilities but before shareholders’ equity (deficit). This reclassification resulted in us increasing our shareholders’ equity by $42.8 million in 2016.
Reverse Stock Split
We filed an amendment to our Amended and Restated Articles of Incorporation to effect a one-for-three reverse common stock split, which was effective June 24, 2016. We implemented the reverse stock split to maintain compliance with the listing requirements of the NASDAQ Capital Market. All share numbers and per-share amounts, including net loss per common share, presented in our consolidated financial statements and notes reflect the one-for-three reverse stock split applied on a retroactive basis. In addition, we retroactively reclassified total par value of $9,000 from common stock to additional paid-in capital.
52
Discontinued Operations
During December 2015, we committed to a plan to stop circulating our Acacia catalogs and to liquidate the catalog’s inventory. The last Acacia print catalogs were circulated in January 2016 and electronic email distribution continued through May 2016. On June 24, 2016, we entered into a licensing agreement to outsource our U.S. Acorn catalog and ecommerce business to USA. USA began selling Acorn video content during the third quarter of 2016.
Under the licensing agreement, USA became the official, exclusive, direct-to-consumer seller of U.S. Acorn product through catalogs and ecommerce. As such, USA received the rights to the Acorn catalog and related website for an 18-month period, subject to certain automatic renewals. To facilitate the transfer of the catalog to USA, we granted USA access to the catalog’s customer list and the Acorn brand. Going forward, we will also endeavor to provide USA with an exclusivity period for new Acorn releases. USA is responsible for all costs associated with their efforts. On an annual basis, USA will purchase from us a minimum of $1.2 million of inventory (Acorn video content) at pricing that is consistent with wholesale pricing. We also agreed to a one-time transfer of certain existing inventory to USA at cost. Further, we have been given meaningful consultation rights regarding sales prices of Acorn content listed in the catalog. Sales to USA began during the third quarter of 2016.
In addition to purchasing inventory from us, USA makes royalty payments to us for the various rights we have licensed. The royalty payments are not expected to be material. Further, all customer and marketing data obtained during the license period shall be jointly owned by both companies. During 2016, our Wholesale Distribution segment recognized revenues of $0.8 million from its sale of inventory to USA.
We consider the outsourcing of the U.S. Acorn catalog to be a major strategic shift in our business. Future revenues and gross margins from our outsourced operations will decrease. However, operating profits will increase as we have historically incurred significant selling expenses that will be eliminated. Upon circulating the last Acacia catalog and entering into the licensing agreement with USA during the quarter ended June 30, 2016, we classified the U.S. catalog/ecommerce business (Acacia and U.S. Acorn catalogs) as discontinued operations.
Major classes of line items constituting loss from discontinued operations, net of income taxes are:
|
|
|
Years Ended December 31, |
|
|||||
|
(In thousands) |
|
2016 |
|
|
2015 |
|
||
|
Revenues |
|
$ |
7,778 |
|
|
$ |
25,947 |
|
|
Cost of Sales |
|
|
|
|
|
|
|
|
|
Royalty expense |
|
|
(205 |
) |
|
|
(594 |
) |
|
Manufacturing and fulfillment |
|
|
(6,249 |
) |
|
|
(15,781 |
) |
|
Selling expenses |
|
|
(2,280 |
) |
|
|
(12,513 |
) |
|
General and administrative expenses |
|
|
(1,066 |
) |
|
|
(1,501 |
) |
|
Depreciation and amortization |
|
|
(1,068 |
) |
|
|
(1,819 |
) |
|
Loss on disposal of fixed assets |
|
|
(187 |
) |
|
|
— |
|
|
Loss before provision for income taxes |
|
|
(3,277 |
) |
|
|
(6,261 |
) |
|
Provision for income taxes |
|
|
— |
|
|
|
— |
|
|
Loss from discontinued operations, net of income taxes |
|
$ |
(3,277 |
) |
|
$ |
(6,261 |
) |
There are no income taxes allocable to the discontinued operations as the discontinued operations reside in the U.S. for which there is no tax provision as a result of the overall U.S. operating loss for tax purposes.
53
Carrying amounts of major classes of assets and liabilities included as part of discontinued operations are:
|
|
|
December 31, |
|
|||||
|
(In thousands) |
|
2016 |
|
|
2015 |
|
||
|
Accounts receivable, net |
|
$ |
— |
|
|
$ |
1,111 |
|
|
Inventories, net |
|
|
— |
|
|
|
2,417 |
|
|
Prepaid expenses and other assets |
|
|
— |
|
|
|
1,136 |
|
|
Property, equipment and improvements, net |
|
|
— |
|
|
|
670 |
|
|
Other intangible assets, net |
|
|
— |
|
|
|
1,536 |
|
|
Total assets of discontinued operations |
|
$ |
— |
|
|
$ |
6,870 |
|
|
|
|
|
|
|
|
|
|
|
|
Accounts payable and accrued liabilities |
|
$ |
— |
|
|
$ |
6,863 |
|
|
Deferred revenue |
|
|
— |
|
|
|
697 |
|
|
Total liabilities of discontinued operations |
|
$ |
— |
|
|
$ |
7,560 |
|
During 2016, we assessed the remaining useful lives of property, equipment and improvements and other intangible assets held by the discontinued operations. As a result, we recorded accelerated depreciation and amortization of $0.3 million during 2016. Because USA is licensing our customer list, for which we retained a shared ownership, we made no changes as to how we are amortizing our other intangible assets.
During 2016, we provided lay-off notices to our U.S. catalog/ecommerce business employees and recorded severance charges of $0.3 million.
In September 2016, we vacated our office space in Minnesota. Our lease in Minnesota requires us to make average monthly payments of $12,500 through June 2022. We subleased our office space effective October 1, 2016. As a result we incurred a loss on this sublease of $0.2 million primarily pertaining to leasehold improvements and other fixed assets that we provided to the subtenant for no additional consideration.
Operating and investing cash flows of the discontinued operations are as follows:
|
|
|
Years Ended December 31, |
|
|||||
|
(In thousands) |
|
2016 |
|
|
2015 |
|
||
|
CASH FLOWS FROM OPERATING ACTIVITIES: |
|
|
|
|
|
|
|
|
|
Net loss from discontinued operations |
|
$ |
(3,277 |
) |
|
$ |
(6,261 |
) |
|
Adjustments to reconcile net loss to net cash used in operating activities of discontinued operations: |
|
|
|
|
|
|
|
|
|
Royalty expense |
|
|
205 |
|
|
|
594 |
|
|
Depreciation and amortization |
|
|
1,068 |
|
|
|
1,819 |
|
|
Loss on disposal of assets |
|
|
187 |
|
|
|
— |
|
|
Stock-based compensation expense |
|
|
35 |
|
|
|
8 |
|
|
Changes in assets and liabilities: |
|
|
|
|
|
|
|
|
|
Accounts receivable, net |
|
|
937 |
|
|
|
(369 |
) |
|
Inventories, net |
|
|
2,417 |
|
|
|
175 |
|
|
Investments in content, net |
|
|
(205 |
) |
|
|
(594 |
) |
|
Prepaid expenses and other assets |
|
|
1,011 |
|
|
|
(409 |
) |
|
Accounts payable and accrued liabilities |
|
|
(5,528 |
) |
|
|
714 |
|
|
Deferred revenue |
|
|
(697 |
) |
|
|
342 |
|
|
Net cash used in operating activities of discontinued operations |
|
$ |
(3,847 |
) |
|
$ |
(3,981 |
) |
|
CASH FLOWS FROM INVESTING ACTIVITIES: |
|
|
|
|
|
|
|
|
|
Capital expenditures |
|
$ |
(5 |
) |
|
$ |
(352 |
) |
|
Net cash used in investing activities of discontinued operations |
|
$ |
(5 |
) |
|
$ |
(352 |
) |
54
Liquidity
For the years ended December 31, 2016 and 2015, we recognized a net loss of $21.9 million and $55.0 million, respectively. We used cash in operating activities of $1.5 million and $9.2 million during 2016 and 2015, respectively. At December 31, 2016, our cash balance was $7.8 million. At December 31, 2016, we had $42.1 million of term debt outstanding (see Note 10, Debt). We continue to experience liquidity constraints as we have several competing demands on our available cash and cash that may be generated from operations, including past-due vendor payables which are currently about $12.1 million. These past-due payables are largely a result of significant past-due vendor payables acquired in 2012 when purchasing Image. As we work to catch up on the acquired past-due payables, we have fallen behind on other payables. We continue to work with our vendors to make payment arrangements that are agreeable with them and that give us flexibility in terms of when payments will be made. Additionally, we must maintain a certain level of expenditures to acquire new content that allows us to generate revenues and margins sufficient to meet our obligations.
During 2016, we realized significant growth in our digital channels. Our channel revenues increased 116% to $16.3 million during 2016 (see Note 3, Segment Information). By way of comparison, our channel revenues increased 83% during 2015. After cost of sales and operating expenses, our Digital Channels segment contributed $6.3 million of income from continuing operations for 2016 compared to a loss of $1.5 million last year. Our expectation is that our digital channels will continue to grow, however there is no assurance that this will occur.
On October 14, 2016, we refinanced our senior debt (see Note 10, Debt). In January 2017, we amended our senior debt and borrowed an additional $8.0 million. We received net proceeds of $7.4 million, which we used to repay our subordinated notes payable. In addition to providing us liquidity, the new senior loan facility helps us address our liquidity constraints going forward in three ways: (1) it bears a substantially lower cash-interest rate that is approximately 800 basis points lower than before, (2) there are no required principal payments until 2019, and (3) the financial covenants have been reset to less restrictive levels that provide us the necessary flexibility to invest in our operations.
In 2016, we also took actions to improve our operating results and Adjusted EBITDA by exiting certain non-core operations that have been generating losses. During December 2015, we approved and started implementing a plan to close our Acacia catalog operations. The last Acacia print catalogs were circulated in January 2016 and electronic email distribution continued through May 2016. Further, on June 24, 2016, we entered into a licensing agreement to outsource the U.S. Acorn catalog/ecommerce business to USA (see our Discontinued Operations disclosure above). During 2016, our U.S. catalog/ecommerce business was fully transitioned to USA and we do not anticipate future losses from this line of business.
We believe that our current cash at December 31, 2016, combined with our additional borrowing in January 2017 will be sufficient to meet our operating liquidity, capital expenditure and debt repayment requirements for at least the next one year from the date of issuance of these financial statements. However, there can be no assurances that we will be successful in realizing improved results from operations including improved Adjusted EBITDA, generating sufficient cash flows from operations or agreeing with vendors on revised payment terms.
|
NOTE 2. |
SUMMARY OF SIGNIFICANT ACCOUNTING POLICIES |
Use of Estimates
The preparation of our consolidated financial statements in conformity with U.S. GAAP requires management to make estimates and assumptions that affect the amounts reported in the financial statements. The significant areas requiring the use of management estimates are related to provisions for lower-of-cost or market inventory write-downs, accounts receivable allowances and provision for doubtful accounts and sales returns reserves, valuation of deferred taxes, valuation of warrants, goodwill impairments, and ultimate projected revenues of our film library, which impact amortization of investments in content and related impairment assessments. Although these estimates are based on management’s knowledge of current events and actions management may undertake in the future, actual results may ultimately differ materially from those estimates.
Revenues and Receivables
Revenue Recognition
Revenues from our digital channels are recognized on a straight-line basis over the subscription period once the subscription has been activated.
Revenues from home video exploitation, which includes IP Licensing and Wholesale Distribution revenues, are recognized upon meeting the recognition requirements of the Financial Accounting Standards Board Accounting Standards Codification (or ASC) 926, Entertainment—Films and ASC 605, Revenue Recognition. We generate our IP Licensing and Wholesale Distribution revenues
55
primarily from the exploitation of acquired or produced content rights through various distribution channels. The content is monetized in DVD format to wholesalers, licensed to broadcasters including cable companies and digital platforms like Amazon and Netflix, and exploited through other windows such as VOD. Revenue is presented net of sales returns, rebates, unit price adjustments, sales return reserves, sales discounts and market development fund reserves. Revenues from our U.K. catalog sales are recognized, net of an allowance for estimated returns, once payment has been received from the customer and the items ordered have been shipped.
Revenues from home video exploitation are recognized net of an allowance for estimated returns, as well as related costs, in the period in which the product is available for sale by our wholesale partners (at the point that title and risk of loss transfer to the customer, which is generally upon receipt by the customer and in the case of new releases, after “street date” restrictions lapse). Rental revenues under revenue sharing arrangements are recognized when we are entitled to receipts and such receipts are determinable. Revenues from domestic and international broadcast licensing and home video sublicensing, as well as associated costs, are recognized when the programming is available to the licensee and all other recognition requirements are met such as the broadcaster is free to air the programming. Fees received in advance of availability, usually in the case of advances received from international home video sub-licensees and for broadcast programming, are deferred until earned and all revenue recognition requirements have been satisfied. Provisions for sales returns and uncollectible accounts receivable are provided at the time of sale.
Allowances for Sales Returns
For each reporting period, we evaluate product sales and accounts receivable to estimate their effect on revenues due to product returns, sales allowances and other credits given, and delinquent accounts. Our estimates of product sales that will be returned and the amount of receivables that will ultimately be collected require the exercise of judgment and affect reported revenues and net earnings. In determining the estimate of product sales that will be returned, we analyze historical returns (quantity of returns and time to receive returned product), historical pricing and other credit data, current economic trends, and changes in customer demand and acceptance of our products, including reorder activity. Based on this information, we reserve a percentage of each dollar of product sales where the customer has the right to return such product and receive a credit. Actual returns could differ from our estimates and current provisions for sales returns and allowances, resulting in future charges to earnings. Estimates of future sales returns and other credits are subject to substantial uncertainty. Factors that could negatively impact actual returns include retailer financial difficulties, the perception of comparatively poor retail performance in one or several retailer locations, limited retail shelf space at various times of the year, inadequate advertising or promotions, retail prices being too high for the perceived quality of the content or other comparable content, the near-term release of similar titles, and poor responses to package designs. Underestimation of product sales returns and other credits would result in an overstatement of current revenues and lower revenues in future periods. Conversely, overestimation of product sales returns would result in an understatement of current revenues and higher revenues in future periods.
Allowances Received From Vendors
In accordance with ASC 605-50, Revenue Recognition—Customer Payments and Incentives, we classify consideration received as a reduction in cost of sales in the accompanying statements of operations unless the consideration represents reimbursement of a specific, identifiable cost incurred by us in selling the vendor’s product.
Shipping Revenues and Expenses
In accordance with ASC 605-45, Revenue Recognition—Principal Agent Considerations, we classify amounts billed to customers for shipping fees as revenues, and classify costs related to shipping as cost of sales in the accompanying consolidated statements of operations.
Market Development Funds
In accordance with ASC 605-50, Revenue Recognition—Customer Payment and Incentives, market development funds, including funds for specific product positioning, taken as a deduction from payment for purchases by customers are classified as a reduction to revenues.
Investments in Content
Investments in content include the unamortized costs of completed and uncompleted films and television programs that were acquired or produced. Within the carrying balance of investments in content are development and production costs for films and television programs which are acquired or produced.
56
Acquired Distribution Rights and Produced Content
Royalty and Distribution Fee Advances – When acquiring titles, we often make royalty and distribution fee advances that represent fixed minimum payments made to program suppliers for exclusive content distribution rights. A program supplier’s share of exclusive program distribution revenues is retained by us until the share equals the advance(s) paid to the program supplier plus recoupable costs. Thereafter, any excess is paid to the program supplier. In the event of an excess, we also record, as content amortization and royalties – a component of cost of sales, an amount equal to the program supplier’s share of the net distribution revenues.
Original Production Costs – For films and television programs produced by RLJE, original production costs include all direct production and financing costs, as well as production overhead.
Unamortized content investments for our digital channels are charged to content amortization and royalties using the straight-line method over the license term for which the content is available to the digital channels.
For IP Licensing and Wholesale Distribution, unamortized content investments are charged to content amortization and royalties as revenues are earned in the same ratio that current period revenue for a title or group of titles bears to the estimated remaining unrecognized ultimate revenue for that title.
Ultimate revenue includes estimates over a period not to exceed ten years following the date of initial release, or for episodic television series a period not to exceed 10 years from the date of delivery of the first episode or, if still in production, five years from the date of delivery of the most recent episode, if later.
Investments in content are stated at the lower of amortized cost or estimated fair value. The valuation of investments in content is reviewed on a title-by-title basis, when an event or change in circumstances indicates that the fair value of a film or television program is less than its unamortized cost. Additional amortization is recorded in the amount by which the unamortized costs exceed the estimated fair value of the film or television program. Estimates of future revenue involve measurement uncertainty and it is therefore possible that reductions in the carrying value of investment in films and television programs may be required as a consequence of changes in management’s future revenue estimates.
Content programs in progress include the accumulated costs of productions, which have not yet been completed, and advances on content not yet received from program suppliers. We begin to amortize these investments once the content has been released.
Production Development Costs
The costs to produce licensed content for domestic and international exploitation include the cost of converting film prints or tapes into the optical disc format. Depending on the platform for which the content is being exploited, costs may include menu design, authoring, compression, subtitling, closed captioning, service charges related to disc manufacturing, ancillary material production, product packaging design and related services. These costs are capitalized as incurred. A percentage of the capitalized production costs are amortized to expense based upon: (i) a projected revenue stream resulting from distribution of new and previously released content related to such production costs; and (ii) management’s estimate of the ultimate net realizable value of the production costs. Estimates of future revenues are reviewed periodically and amortization of production costs is adjusted accordingly. If estimated future revenues are not sufficient to recover the unamortized balance of production costs, such costs are reduced to their estimated fair value.
Inventories
For each reporting period, we review the value of inventories on hand to estimate the recoverability through future sales. Values in excess of anticipated future sales are recorded as obsolescence reserve. Inventories consist primarily of packaged goods for sale, which are stated at average cost, as well as componentry.
Goodwill and Other Intangible Assets
Goodwill
Goodwill represents the excess of acquisition costs over the tangible and identifiable intangible assets acquired and liabilities assumed in a business acquisition. Goodwill is recorded at our reporting units, which are consolidated into our reporting segments. Goodwill is not amortized but is reviewed for impairment annually on October 1st of each year or between the annual tests if an event occurs or circumstances change that indicates it is more-likely-than-not that the fair value of a reporting unit is less than its carrying value. The impairment test follows a two-step approach. The first step determines if the goodwill is potentially impaired, and the
57
second step measures the amount of the impairment loss, if necessary. Under the first step, goodwill is considered potentially impaired if there are subjective characteristics that suggest that goodwill is impaired or quantitatively when the fair value of the reporting unit is less than the reporting unit’s carry amount, including goodwill. Under the second step, the impairment loss is then measured as the excess of recorded goodwill over the fair value of the goodwill, as calculated. Determining the fair value requires various assumptions and estimates, which include consideration of the future, projected operating results and cash flows. Such projections could be different than actual results. Should actual results be significantly less than estimates, the value of our goodwill could be impaired in future periods.
During 2015, we recognized goodwill impairments of $30.3 million (see Note 9, Goodwill and Other Intangible Assets). We did not recognize goodwill impairments during 2016.
Other Intangible Assets
Other intangible assets are reported at their estimated fair value, when acquired, less accumulated amortization. The majority of our intangible assets were recognized as a result of the Business Combination. As such, the fair values of our intangibles were recorded in 2012 when applying purchase accounting. Additions since the 2012 Business Combination are limited to software expenditures related to our websites and various digital platforms such as Roku and AppleTV. Similar to how we account for internal-use software development, costs incurred to develop and implement our websites and digital platforms are capitalized in accordance with ASC 350-50, Website Development Costs. Website operating costs are expensed as incurred. Costs incurred for upgrades and enhancements that provide additional functionality are capitalized.
Amortization expense of our other intangible assets is generally computed by applying the straight-line method, or based on estimated forecasted future revenues as stated below, over the estimated useful lives of trade names (11 to 15 years), websites and digital platforms (three years), supplier contracts (seven years), customer relationships (five years), options on future content (seven years) and leases (two years). The recorded value of our customer relationships is amortized on an accelerated basis over five years, with approximately 60% being amortized over the first two years (through 2014), 20% during the third year and the balance ratably over the remaining useful life. The recorded value of our options on future content is amortized based on forecasted future revenues, whereby approximately 50% is being amortized over the first two years (through 2014), 25% during the third year and the balance in decreasing amounts over the remaining four years.
Additional amortization expense is provided on an accelerated basis when the useful life of an intangible asset is determined to be less than originally expected. Other intangible assets are reviewed for impairment when an event or circumstance indicates the fair value is lower than the current carrying value.
As described in Note 9, Goodwill and Other Intangible Assets, during 2015, we recorded accelerated amortization expense totaling $1.3 million related to our brand name assets. During 2016 and 2015, we did not recognize any impairment on our other intangible assets.
Warrant and Other Derivative Liabilities
We have warrants outstanding to purchase 30.1 million shares of our common stock (see Note 12, Stock Warrants). Warrants issued in 2012 to acquire 7.0 million shares of common stock contain a provision whereby the exercise price will be reduced if RLJE is reorganized as a private company. Because of this provision, we account for these warrants as a derivative liability in accordance with ASC 815-40, Contracts in Entity’s Own Equity. Derivative liability warrants are carried on our consolidated balance sheet at their fair value with changes in fair value being included in the consolidated statement of operations as a separate component of other income (expense).
In May 2015, we issued additional warrants to acquire 3.1 million shares of our common stock. We were accounting for these warrants as a derivative liability because, among other provisions, the warrants contained a provision that allows the warrant holders to sell their warrants back to us, at their discretion, at a cash purchase price equal to the warrants’ then fair value, upon the consummation of certain fundamental transactions, such as a business combination or other change-in-control transaction. In October 2016, the 2015 warrants were amended and they are now being accounted for within shareholders’ equity (deficit).
In October 2016, we issued three separate warrants to our senior lender to acquire a total of 20.0 million shares of our common stock. For one of these warrants issued to acquire 5.0 million shares of common stock, we are accounting for the warrant as a derivative liability because the warrant contains a provision that may increase the number of shares acquirable for no additional consideration. This increase is contingent upon the number of shares of common stock outstanding at the time of exercise.
58
Our preferred stock is convertible into shares of common stock at an exchange rate equal to 333.3 shares of common stock for each share of preferred stock, subject to adjustment for any unpaid dividends. The conversion rate is subject to certain anti-dilution protections. Those protections did include an adjustment for offerings consummated at a per-share price of less than $3.00 per common share. Because of this potential adjustment to the conversion rate, we had bifurcated the conversion feature from its host instrument (a preferred share) and we were accounting for the conversion feature as a derivative liability. In October 2016, we amended the conversion feature to avoid liability accounting and as such we now account for the conversion feature as part of the host instrument.
Income Taxes
We account for income taxes pursuant to the provisions of ASC 740, Income Taxes, whereby deferred tax assets and liabilities are recognized for the future tax consequences attributable to differences between the financial statement carrying amount of existing assets and liabilities and their respective tax bases and the future tax benefits derived from operating loss and tax credit carryforwards. We provide a valuation allowance on our deferred tax assets when it is more likely than not that such deferred tax assets will not be realized. We have a valuation allowance against 100% of our net deferred tax assets.
ASC 740 requires that we recognize in the consolidated financial statements the effect of a tax position that is more likely than not to be sustained upon examination based on the technical merits of the position. The first step is to determine whether or not a tax benefit should be recognized. A tax benefit will be recognized if the weight of available evidence indicates that the tax position is more likely than not to be sustained upon examination by the relevant tax authorities. The recognition and measurement of benefits related to our tax positions requires significant judgment as uncertainties often exist with respect to new laws, new interpretations of existing laws, and rulings by taxing authorities. Differences between actual results and our assumptions, or changes in our assumptions in future periods, are recorded in the period they become known. For tax liabilities, we recognize accrued interest related to uncertain tax positions as a component of income tax expense, and penalties, if incurred, are recognized as a component of operating expense.
Our foreign subsidiaries are subject to income taxes in their respective countries, as well as U.S. Federal and state income taxes. The income tax payments they make outside the U.S. may give rise to foreign tax credits that we may use to offset taxable income in the United States.
Foreign Currency Translation
The consolidated financial statements are presented in our reporting currency, which is the U.S. dollar. For the foreign subsidiaries whose functional currency is other than the U.S. dollar (the British Pound Sterling or GBP for RLJE UK and AME; and Australian dollar for RLJE Australia), balance sheet accounts, other than equity accounts, are translated into U.S. dollars at exchange rates in effect at the end of the period and income statement accounts are translated at average monthly exchange rates. Equity accounts are translated at historical rates. Translation gains and losses are included as a separate component of equity. Gains and losses from foreign currency denominated transactions are included in our consolidated statement of operations as a component of other income (expense).
Fair Value of Financial Instruments
The carrying amount of our financial instruments, which principally include cash, trade receivables, accounts payable and accrued expenses, approximates fair value due to the relative short maturity of such instruments. The carrying amount of our debt under our senior credit agreement approximates its fair value as it bears interest at market rates of interest after taking into consideration the debt discounts. The carrying amount of our subordinated debt approximates its fair value given its short-term maturity date, which takes into consideration that the debt was repaid in January 2017.
59
ASC 820 defines fair value, establishes a framework for measuring fair value under U.S. GAAP and enhances disclosures about fair value measurements. Fair value is defined under ASC 820 as the exchange price that would be received for an asset or paid to transfer a liability (an exit price) in the principal or most advantageous market for the asset or liability in an orderly transaction between market participants on the measurement date. Valuation techniques used to measure fair value under ASC 820 must maximize the use of observable inputs and minimize the use of unobservable inputs. The standard describes a fair-value hierarchy based on three levels of inputs, of which the first two are considered observable and the last unobservable, that may be used to measure fair value as follows:
Level 1—Quoted prices in active markets for identical assets or liabilities.
Level 2—Inputs other than Level 1 that are observable, either directly or indirectly, such as quoted prices for similar assets or liabilities; quoted prices in markets that are not active; or other inputs that are observable or can be corroborated by observable market data for substantially the full term of the assets or liabilities.
Level 3—Unobservable inputs that are supported by little or no market activity and that are significant to the fair value of the assets or liabilities.
Our recurring fair value measurements of stock warrants and other derivative liabilities and our non-recurring fair value measurements of investments in content are disclosed in Note 15, Fair Value Measurements. Our non-recurring fair value measurement of goodwill is disclosed in Note 9, Goodwill and Other Intangible Assets.
Concentrations of Credit Risk
Financial instruments which potentially subject RLJE to concentrations of credit risk consist primarily of deposit accounts and trade accounts receivable. RLJE maintains bank accounts at financial institutions, which at times may exceed amounts insured by the Federal Deposit Insurance Corporation (or FDIC) and Securities Investor Protection Corporation (or SIPC). We place our cash with several financial institutions which are reputable and therefore bear minimal credit risk. RLJE has never experienced any losses related to these balances.
With respect to trade receivables, we perform ongoing credit evaluations of our customers’ financial conditions and limit the amount of credit extended when deemed necessary but generally require no collateral.
Major Customers and Distribution Facilitators
We have a high concentration of net revenues from relatively few customers, the loss of which may adversely affect our liquidity, business, results of operations, and financial condition. During 2016, sales reported within our Wholesale Distribution segment to Amazon accounted for 15.3% of our net revenues. Our top five customers accounted for 47.8% of net revenues during the same period. During 2015, sales to Amazon and Walmart accounted for 21.7% and 12.6%, respectively, of our net revenues. Our top five customers accounted for approximately 54.8% of our net revenues for the same period.
We may be unable to maintain favorable relationships with our retailers and distribution facilitators such as, Sony Pictures Home Entertainment (or SPHE) and Sony DADC UK Limited. Further, our retailers and distribution facilitators may be adversely affected by economic conditions. If we lose any of our top customers, or if any of these customers reduces or cancels a significant order, it could have a material adverse effect on our liquidity, business, results of operations, and financial condition.
Our high concentration of sales to relatively few customers (and use of a third-party to manage collection of substantially all packaged goods receivables) may result in significant uncollectible accounts receivable exposure, which may adversely affect our liquidity, business, results of operations and financial condition. As of December 31, 2016, Netflix, SPHE and Amazon accounted for approximately 29.3%, 25.4% and 16.7%, respectively, of our gross accounts receivable. At December 31, 2015, SPHE and Netflix accounted for approximately 38.4% and 22.1%, respectively, or our gross accounts receivable.
Property, Equipment and Improvements
Property, equipment and improvements are stated at cost less accumulated depreciation and amortization. Major renewals and improvements are capitalized; minor replacements, maintenance and repairs are expensed as incurred. Internal-use software development costs are capitalized if the costs were incurred while in the application development stage, or if the costs were for upgrades and enhancements that provide additional functionality. Training and data-conversion costs are expensed as incurred. We cease capitalizing software costs and start depreciating the software once the project is substantially complete and ready for its intended use.
60
Depreciation and amortization are computed by applying the straight-line method over the estimated useful lives of the furniture, fixtures and equipment (3 to 5 years), and software (3 to 5 years). Leasehold improvements are amortized over the shorter of the useful life of the improvement or the life of the related leases (7 years).
Impairment of Long-Lived Assets
We review long-lived and specific, definite-lived, identifiable intangible assets for impairment whenever events or changes in circumstances indicate the carrying amount of an asset may not be recoverable. An impairment loss of the excess of the carrying value over fair value would be recognized when estimated undiscounted future cash flows expected to result from the use of the asset and its eventual disposition is less than its carrying amount. We have no intangible assets with indefinite useful lives.
Leases
We lease all of the office space utilized for our operations. All of our leases are operating leases in nature. A majority of our leases have fixed incremental increases over the lease terms, which are recognized on a straight-line basis over the term of the lease.
Equity Method Investments
We use the equity method of accounting for investments in companies in which we do not have voting control but where we do have the ability to exert significant influence over operating decisions of the companies. Our equity method investments are periodically reviewed to determine whether there has been a loss in value that is other than a temporary decline.
Debt Discounts
The difference between the principal amount of our debt and the amount recorded as the liability represents a debt discount. The carrying amount of the liability is accreted up to the principal amount through the amortization of the discount, using the effective interest method, to interest expense over the expected term of the debt.
Advertising Costs
Our advertising expense consists of expenditures related to advertising in trade and consumer publications, product brochures and catalogs, booklets for sales promotion, radio advertising and other promotional costs. In accordance with ASC 720-35, Other Expenses—Advertising Costs, and ASC 340-20, Other Assets and Deferred Costs—Capitalized Advertising Costs, we expense advertising costs in the period in which the advertisement first takes place. Product brochures and catalogs and various other promotional costs are capitalized and amortized over the expected period of future benefit, but generally not exceeding six months. Advertising and promotion expense are included as a component of selling expenses. For the years ended December 31, 2016 and 2015, advertising expense was $2.8 million and $4.1 million, respectively.
Stock Options and Restricted Stock Awards
We expense our stock-based awards in accordance with ASC 718, Compensation—Stock Compensation. ASC 718 establishes standards with respect to the accounting for transactions in which an entity exchanges its equity instruments for goods or services, or incurs liabilities in exchange for goods or services, that are based on the fair value of the entity’s equity instruments, focusing primarily on accounting for transactions in which an entity obtains employee services in share-based payment transactions. ASC 718 requires entities to measure the cost of employee services received in exchange for an award of equity instruments based on the grant-date fair value of the award (with limited exceptions) and recognize the cost over the period during which an employee is required to provide service in exchange for the award. Expense recognized is not reduced by estimated forfeitures as forfeitures have been immaterial.
Earnings/Loss per Common Share
Basic earnings/loss per share is computed using the weighted-average number of common shares outstanding during the period. Diluted earnings per share are computed using the combination of dilutive common share equivalents and the weighted-average shares outstanding during the period. For the periods reporting a net loss, diluted loss per share is equivalent to basic loss per share, as inclusion of common share equivalents would be anti-dilutive.
61
Recently Issued Accounting Standards
In May 2014, the FASB Financial Accounting Standards Board (“FASB”) issued Accounting Standard Update (“ASU”) No. 2014-09, Revenue from Contracts with Customers, as a new Topic, (ASC) Topic 606. The new revenue recognition standard provides a five-step analysis of transactions to determine when and how revenue is recognized. The core principle is that a company should recognize revenue to depict the transfer of promised goods or services to customers in an amount that reflects the consideration to which the entity expects to be entitled in exchange for those goods or services. In August 2015, the FASB issued ASU No. 2015-14, Revenue from Contracts with Customers: Deferral of the Effective Date, which deferred the effective date of the new revenue standard for periods beginning after December 15, 2016 to December 15, 2017, with early adoption permitted but not earlier than the original effective date. This ASU must be applied retrospectively to each period presented or as a cumulative-effect adjustment as of the date of adoption. We are considering the alternatives of adoption of this ASU and we are conducting our review of the likely impact to the existing portfolio of customer contracts entered into prior to adoption. After completing our review, we will continue to evaluate the effect of adopting this guidance upon our results of operations, cash flows and financial position. Currently, we do not expect the adoption of this ASU to have a material impact on our financial statements except that there are significant additional reporting requirements under the new standard.
In February 2016, the FASB issued ASU No. 2016-02, Leases. This ASU establishes a right-of-use (ROU) model that requires a lessee to record a ROU asset and a lease liability on the balance sheet for all leases with terms longer than 12 months. Leases will be classified as either finance or operating, with classification affecting the pattern of expense recognition in the income statement. This ASU is effective for fiscal years beginning after December 15, 2018, including interim periods within those fiscal years. A modified retrospective transition approach is required for lessees for capital and operating leases existing at, or entered into after, the beginning of the earliest comparative period presented in the financial statements, with certain practical expedients available. We are currently evaluating the impact of the pending adoption of this new standard on our financial statements and we have yet to determine the overall impact this ASU is expected to have. The likely impact will be one of presentation only on our consolidated balance sheet. Our leases currently consist of operating leases with varying expiration dates through 2021 and annual rent expense is approximately $1.7 million.
In March 2016, the FASB issued ASU 2016-06, Derivatives and Hedging (Topic 815). This ASU is related to the embedded derivative analysis for debt instruments with contingent call or put options. This ASU clarifies that an exercise contingency does not need to be evaluated to determine whether it relates only to interest rates or credit risk. Instead, the contingent put or call option should be evaluated for possible bifurcation as a derivative in accordance with the four-step decision sequence detailed in FASB ASC 815-15, without regard to the nature of the exercise contingency. This ASU is effective for fiscal years, and for interim periods within those fiscal years, beginning after December 15, 2016. Early adoption is permitted. We are currently evaluating the impact of this ASU on our financial statements.
In March 2016, the FASB issued ASU 2016-08, Revenue from Contracts with Customers (Topic 606). This ASU is related to reporting revenue gross versus net, or principal versus agent considerations. This ASU is meant to clarify the guidance in ASU 2014-09, Revenue from Contracts with Customers, as it pertains to principal versus agent considerations. Specifically, the guidance addresses how entities should identify goods and services being provided to a customer, the unit of account for a principal versus agent assessment, how to evaluate whether a good or service is controlled before being transferred to a customer, and how to assess whether an entity controls services performed by another party. This ASU has the same effective date as the new revenue standard, which is effective for fiscal years, and for interim periods within those fiscal years, beginning after December 15, 2017. We are evaluating the effect and methodology of adopting this new accounting guidance upon our results of operations, cash flows and financial position. We have begun to consider the alternatives of adoption of this ASU, and have started our review of the likely impact to the existing portfolio of customer contracts entered into prior to adoption. We will also continue to evaluate the effect of adopting this guidance upon our results of operations, cash flows and financial position. Currently, we do not expect the adoption of this ASU to have a material impact on our financial statements except that there are significant additional reporting requirements under the new standard.
In March 2016, the FASB issued ASU 2016-09, Compensation-Stock Compensation (Topic 718). This ASU is related to simplifications of employee share-based payment accounting. This pronouncement eliminates the APIC pool concept and requires that excess tax benefits and tax deficiencies be recorded in the income statement when awards are settled. The pronouncement also addresses simplifications related to statement of cash flows classification, accounting for forfeitures and minimum statutory tax withholding requirements. This ASU is effective for fiscal years, and for interim periods within those fiscal years, beginning after December 15, 2016. Early adoption is permitted. This ASU will not have a material impact on our financial statements.
In April 2016, the FASB issued ASU 2016-10, Revenue from Contracts with Customers (Topic 606): Identifying Performance Obligations and Licensing. This ASU is meant to clarify the guidance in FASB ASU 2014-09, Revenue from Contracts with Customers. Specifically, the guidance addresses an entity’s identification of its performance obligations in a contract, as well as an
62
entity’s evaluation of the nature of its promise to grant a license of intellectual property and whether or not that revenue is recognized over time or at a point in time. This ASU has the same effective date as the new revenue standard, which is effective for fiscal years, and for interim periods within those fiscal years, beginning after December 15, 2017. We are considering the alternatives of adoption of this ASU and we continue to review the likely impact to the existing portfolio of customer contracts entered into prior to adoption. We will continue to evaluate the effect of adopting this guidance upon our results of operations, cash flows and financial position. We do not expect the adoption of this ASU to have a material impact on our financial statements except that there are significant additional reporting requirements under the new standard.
In May 2016, the FASB issued ASU 2016-11, Revenue Recognition (Topic 605) and Derivatives and Hedging (Topic 815): Rescission of SEC Guidance Because of Accounting Standards Updates 2014-09 and 2014-16 Pursuant to Staff Announcements at the March 3, 2016 EITF Meeting. This ASU rescinds SEC paragraphs pursuant to two SEC Staff Announcements at the March 3, 2016 Emerging Issues Task Force (EITF) meeting. Specifically, registrants should not rely on the following SEC Staff Observer comments upon adoption of Topic 606: (1) Revenue and Expense Recognition for Freight Services in Process, which is codified in paragraph 605-20-S99-2; (2) Accounting for Shipping and Handling Fees and Costs, which is codified in paragraph 605-45-S99-1; (3) Accounting for Consideration Given by a Vendor to a Customer (including Reseller of the Vendor’s Products), which is codified in paragraph 605-50-S99-1; and (4) Accounting for Gas-Balancing Arrangements (i.e., use of the “entitlements method”), which is codified in paragraph 932-10-S99-5. This ASU becomes effective upon adoption of ASU 2014-09, which is effective for fiscal years, and for interim periods within those fiscal years, beginning after December 15, 2017. We have not yet begun to consider the alternatives of adoption of this ASU or its impact on our financial statements.
In May 2016, the FASB issued ASU 2016-12, Revenue from Contracts with Customers (Topic 606): Narrow-Scope Improvements and Practical Expedients. This ASU does not change the core principle of the guidance in Topic 606. Instead, the amendments provide clarifying guidance in a few narrow areas and add some practical expedients to the guidance. This ASU has the same effective date as the new revenue standard, which is effective for fiscal years, and for interim periods within those fiscal years, beginning after December 15, 2017. We are currently evaluating the impact of the pending adoption of this new standard on our financial statements. We are considering the alternatives of adoption of this ASU. Currently, we do not expect the adoption of this ASU to have a material impact on our financial statements except that there are significant additional reporting requirements under the new standard.
In June 2016, the FASB issued ASU 2016-13, Financial Instruments - Credit Losses (Topic 326): Measurement of Credit Losses on Financial Instruments. The amendments in this ASU replace the incurred loss impairment methodology in current U.S. GAAP with a methodology that reflects expected credit losses and requires consideration of a broader range of reasonable and supportable information to inform credit loss estimates. This ASU is effective for fiscal years, and for interim periods within those fiscal years, beginning after December 15, 2019. We have not adopted this ASU and currently we have determined there to be no impact of this ASU on our financial statements and related disclosures.
In August 2016, the FASB issued ASU 2016-15, Statement of Cash Flows (Topic 230): Classification of Certain Cash Receipts and Cash Payments. The new guidance is intended to reduce diversity in practice in how transactions are classified in the statement of cash flows. This ASU is effective for fiscal years, and for interim periods within those fiscal years, beginning after December 15, 2017. Early adoption is permitted. We are currently evaluating the impact of this ASU on our financial statements and currently we have determined there to be no impact of this ASU on our financial statements and related disclosures.
In January 2017, the FASB issued 2017-03, Accounting Changes and Error Corrections (Topic 250) and Investments - Equity Method and Joint Ventures (Topic 323): Amendments to SEC Paragraphs Pursuant to Staff Announcements at the September 22, 2016 and November 17, 2016 EITF Meetings. The amendments in this ASU add language to the SEC Staff Guidance in relation to ASU 2014-09, Revenue from Contracts with Customers (Topic 606), ASU 2016-02, Leases (Topic 842), and ASU 2016-13, Financial Instruments - Credit Losses (Topic 326). This ASU provides the SEC Staff view that a registrant should consider additional quantitative and qualitative disclosures related to the previously mentioned ASUs in connection with the status and impact of their adoption. We adopted this ASU during the current quarter 2016. Since this update intended to add disclosures related to certain ASUs, the adoption of this standard did not have a material impact on our financial statements.
In January 2017, the FASB issued 2017-04, Intangibles - Goodwill and Other (Topic 350): Simplifying the Test for Goodwill Impairment. The amendments in this ASU simplify the subsequent measurement of goodwill by eliminating Step 2 from the goodwill impairment test and eliminating the requirement for a reporting unit with a zero or negative carrying amount to perform a qualitative assessment. Instead, under this pronouncement, an entity would perform its annual, or interim, goodwill impairment test by comparing the fair value of a reporting unit with its carrying amount and would recognize an impairment change for the amount by which the carrying amount exceeds the reporting unit’s fair value; however, the loss recognized is not to exceed the total amount of goodwill allocated to that reporting unit. In addition, income tax effects will be considered, if applicable. This ASU is effective for fiscal years,
63
and interim periods within those fiscal years, beginning after December 15, 2019. Early adoption is permitted. We are currently evaluating the impact of this ASU on our financial statements and related disclosures.
|
Note 3. |
Segment Information |
In accordance with the requirements of the ASC 280 “Segment Reporting,” selected financial information regarding our reportable business segments, Digital Channels, IP Licensing and Wholesale Distribution, is presented below. Our reportable segments are determined based on the distinct nature of their operation. Each segment is a strategic business unit that is managed separately and either exploits our content over a different business model (subscription based vs. transactional) or acquires content differently. Our Digital Channels segment consists of our proprietary digital streaming channels. Our IP Licensing segment includes intellectual property (or content) owned or created by us, other than certain fitness related content, that is licensed for exploitation worldwide. The IP Licensing segment also includes our investment in ACL. Our Wholesale Distribution segment consists of the acquisition, enhancement and worldwide exploitation through our wholesale partners of exclusive content in various formats, including DVD, Blu-ray, digital, broadcast (including cable and satellite), VOD, streaming video, downloading and sublicensing. Our Wholesale Distribution segment also includes our U.K. mail-order catalog and ecommerce businesses.
Management currently evaluates segment performance based primarily on revenues and operating income (loss), including earnings from ACL. Operating costs and expenses attributable to our Corporate segment include only those expenses incurred by us at the parent corporate level, which are not allocated to our reporting segments and include costs associated with RLJE’s corporate functions such as finance and accounting, human resources, legal and information technology departments. Interest expense, change in the fair value of stock warrants and other derivatives, other income (expense) and provision for income taxes are evaluated by management on a consolidated basis and are not allocated to our reportable segments.
The following tables summarize the segment contribution for the years ended December 31, 2016 and 2015:
|
|
|
Year Ended December 31, 2016 |
|
|||||||||||||||||
|
(In thousands) |
|
Digital Channels |
|
|
IP Licensing |
|
|
Wholesale Distribution |
|
|
Corporate |
|
|
Total |
|
|||||
|
Revenues |
|
$ |
16,262 |
|
|
$ |
168 |
|
|
$ |
63,808 |
|
|
$ |
— |
|
|
$ |
80,238 |
|
|
Operating costs and expenses |
|
|
(9,297 |
) |
|
|
(554 |
) |
|
|
(60,169 |
) |
|
|
(10,966 |
) |
|
|
(80,986 |
) |
|
Depreciation and amortization |
|
|
(618 |
) |
|
|
(134 |
) |
|
|
(1,714 |
) |
|
|
(491 |
) |
|
|
(2,957 |
) |
|
Share in ACL earnings |
|
|
— |
|
|
|
3,078 |
|
|
|
— |
|
|
|
— |
|
|
|
3,078 |
|
|
Segment contribution |
|
$ |
6,347 |
|
|
$ |
2,558 |
|
|
$ |
1,925 |
|
|
$ |
(11,457 |
) |
|
$ |
(627 |
) |
|
|
|
Year Ended December 31, 2015 |
|
|||||||||||||||||
|
(In thousands) |
|
Digital Channels |
|
|
IP Licensing |
|
|
Wholesale Distribution |
|
|
Corporate |
|
|
Total |
|
|||||
|
Revenues |
|
$ |
7,542 |
|
|
$ |
3,107 |
|
|
$ |
88,321 |
|
|
$ |
— |
|
|
$ |
98,970 |
|
|
Operating costs and expenses |
|
|
(8,230 |
) |
|
|
(2,276 |
) |
|
|
(83,656 |
) |
|
|
(11,185 |
) |
|
|
(105,347 |
) |
|
Depreciation and amortization |
|
|
(763 |
) |
|
|
(143 |
) |
|
|
(2,715 |
) |
|
|
(516 |
) |
|
|
(4,137 |
) |
|
Goodwill impairment |
|
|
— |
|
|
|
— |
|
|
|
(30,260 |
) |
|
|
— |
|
|
|
(30,260 |
) |
|
Share in ACL earnings |
|
|
— |
|
|
|
2,217 |
|
|
|
— |
|
|
|
— |
|
|
|
2,217 |
|
|
Segment contribution |
|
$ |
(1,451 |
) |
|
$ |
2,905 |
|
|
$ |
(28,310 |
) |
|
$ |
(11,701 |
) |
|
$ |
(38,557 |
) |
Operating costs and expenses exclude costs related to depreciation and amortization, as well as goodwill impairments, which are separately presented in the tables above. The above results also exclude our discontinued operations.
During 2016, we reclassified our U.K. mail-order catalog and ecommerce businesses into our Wholesale Distribution segment. As a result, for 2016 and 2015 we reclassified revenues of $1.7 million and $2.1 million, respectively, operating costs and expenses of $2.1 million and $2.7 million, respectively, and depreciation and amortization of $0.1 million and $0.1 million, respectively.
64
A reconciliation of total segment loss to loss before provision for income taxes is as follows:
|
|
|
Years Ended December 31, |
|
|||||
|
(In thousands) |
|
2016 |
|
|
2015 |
|
||
|
Total segment loss |
|
$ |
(627 |
) |
|
$ |
(38,557 |
) |
|
Interest expense, net |
|
|
(8,400 |
) |
|
|
(9,968 |
) |
|
Change in fair value of stock warrants and other derivatives |
|
|
(4,573 |
) |
|
|
1,373 |
|
|
Loss on extinguishment of debt |
|
|
(3,549 |
) |
|
|
— |
|
|
Other expense |
|
|
(1,293 |
) |
|
|
(1,402 |
) |
|
Loss before provision for income taxes |
|
$ |
(18,442 |
) |
|
$ |
(48,554 |
) |
Total revenue by geographical location is as follows:
|
|
|
Years Ended December 31, |
|
|||||
|
(In thousands) |
|
2016 |
|
|
2015 |
|
||
|
United States |
|
$ |
68,096 |
|
|
$ |
80,409 |
|
|
United Kingdom |
|
|
11,117 |
|
|
|
16,616 |
|
|
Other |
|
|
1,025 |
|
|
|
1,945 |
|
|
Net revenues |
|
$ |
80,238 |
|
|
$ |
98,970 |
|
Revenues are attributed to geographical locations based on where our customers reside.
Total assets for each segment primarily include accounts receivable, inventory and investments in content. The Corporate segment primarily includes assets not fully allocated to a segment including consolidated cash accounts, certain prepaid assets and fixed assets used across all segments.
Total assets by segment, excluding assets of discontinued operations, are as follows:
|
|
|
December 31, |
|
|||||
|
(In thousands) |
|
2016 |
|
|
2015 |
|
||
|
Digital Channels |
|
$ |
5,941 |
|
|
$ |
1,489 |
|
|
IP Licensing |
|
|
18,648 |
|
|
|
22,707 |
|
|
Wholesale Distribution |
|
|
102,748 |
|
|
|
114,221 |
|
|
Corporate |
|
|
8,643 |
|
|
|
5,341 |
|
|
|
|
$ |
135,980 |
|
|
$ |
143,758 |
|
During the year ended December 31, 2016, we had capital expenditures of $1.7 million, which includes $0.3 million that was accrued for in accounts payable. The capital expenditures by segment during 2016 were $1.4 million and $0.3 million for the Digital Channels and Corporate segments, respectively. During the year ended December 31, 2015, we had capital expenditures of $1.2 million, which includes $0.1 million that was accrued for in accounts payable. The capital expenditures by segment during 2015 were $0.8 million, $0.1 million, $0.1 million and $0.2 million for the Digital Channels, IP Licensing, Wholesale Distribution and Corporate segments, respectively.
Long-lived assets by geographical location are as follows:
|
|
|
December 31, |
|
|||||
|
(In thousands) |
|
2016 |
|
|
2015 |
|
||
|
United States |
|
$ |
75,742 |
|
|
$ |
73,637 |
|
|
United Kingdom |
|
|
25,177 |
|
|
|
31,901 |
|
|
Other |
|
|
645 |
|
|
|
646 |
|
|
Total long-lived assets |
|
$ |
101,564 |
|
|
$ |
106,184 |
|
65
Long-lived assets include goodwill, other intangibles assets, equity investment in ACL, investments in content and property, equipment and improvements.
|
Note 4. |
EQUITY EARNINGS OF AFFILIATE |
In February 2012, Acorn Media acquired a 64% interest in ACL for total purchase consideration of £13.7 million or approximately $21.9 million excluding direct transaction costs. The acquisition gave Acorn Media a majority ownership of ACL’s extensive works including a variety of short story collections, more than 80 novels, 19 plays and a film library of over 100 made-for-television films.
We account for our investment in ACL using the equity method of accounting because (1) Acorn Media is only entitled to appoint one-half of ACL’s board members and (2) in the event the board is deadlocked, the chairman of the board, who is appointed by the directors elected by the minority shareholders, casts a deciding vote.
As of the Business Combination, our 64% share of the difference between ACL’s fair value and the amount of underlying equity in ACL’s net assets was approximately $18.7 million. This step-up basis difference is primarily attributable to the fair value of ACL’s copyrights, which expire in 2046. We are amortizing the basis difference through 2046 using the straight-line method. Basis-difference amortization is recorded against our share of ACL’s net income in our consolidated statements of operations; however this amortization is not included within ACL’s financial statements.
A summary of the ACL investment account is as follows:
|
(In thousands) |
|
|
|
|
|
Investment balance at December 31, 2014 |
|
$ |
22,281 |
|
|
Share of income before basis-difference amortization |
|
|
2,763 |
|
|
Dividends received |
|
|
(3,300 |
) |
|
Basis-difference amortization |
|
|
(546 |
) |
|
Translation adjustment |
|
|
(1,100 |
) |
|
Investment balance at December 31, 2015 |
|
|
20,098 |
|
|
Share of income before basis-difference amortization |
|
|
3,562 |
|
|
Dividends received |
|
|
(3,282 |
) |
|
Basis-difference amortization |
|
|
(484 |
) |
|
Translation adjustment |
|
|
(3,403 |
) |
|
Investment balance at December 31, 2016 |
|
$ |
16,491 |
|
The following summarized financial information is derived from financial statements of ACL as of December 31, 2016 and 2015 (balance sheets), and for the years ended December 31, 2016 and 2015 (income statements):
|
|
|
December 31, |
|
|||||
|
(In thousands) |
|
2016 |
|
|
2015 |
|
||
|
Cash |
|
$ |
3,592 |
|
|
$ |
4,296 |
|
|
Film costs |
|
|
2,040 |
|
|
|
8,073 |
|
|
Other assets |
|
|
6,883 |
|
|
|
6,962 |
|
|
Production obligation payable |
|
|
— |
|
|
|
(1,674 |
) |
|
Deferred revenues |
|
|
(3,687 |
) |
|
|
(8,511 |
) |
|
Other liabilities |
|
|
(2,778 |
) |
|
|
(2,022 |
) |
|
Equity |
|
$ |
6,050 |
|
|
$ |
7,124 |
|
|
|
|
Years Ended December 31, |
|
|||||
|
(In thousands) |
|
2016 |
|
|
2015 |
|
||
|
Revenues |
|
$ |
19,463 |
|
|
$ |
23,534 |
|
|
Film cost amortization |
|
|
(7,916 |
) |
|
|
(14,114 |
) |
|
General, administrative and other expenses |
|
|
(4,641 |
) |
|
|
(4,198 |
) |
|
Income from operations |
|
$ |
6,906 |
|
|
$ |
5,222 |
|
|
Net income |
|
$ |
5,491 |
|
|
$ |
4,128 |
|
66
Balance sheet amounts have been translated from the GBP to U.S. dollar using the December 31, 2016 and 2015 exchange rates. Income statement amounts have been translated from the GBP to U.S. dollar using the average exchange rate for each of the years presented.
|
Note 5. |
Accounts Receivable |
Accounts receivable are primarily derived from: (1) subscription revenues, which are processed by merchant banks or our channel partners such as Amazon, that have not cleared our bank as of period end, (2) video content we license to broadcast, cable/satellite providers and digital subscription platforms like Netflix, and (3) the sale of physical content to retailers and wholesale distributors, who ship to mass retail, and U.K. ecommerce and catalog sales. Our accounts receivable typically trends with retail seasonality.
|
|
|
December 31, |
|
|||||
|
(In thousands) |
|
2016 |
|
|
2015 |
|
||
|
Digital Channels |
|
$ |
2,200 |
|
|
$ |
160 |
|
|
Wholesale Distribution |
|
|
22,231 |
|
|
|
30,663 |
|
|
Accounts receivable before allowances and reserves |
|
|
24,431 |
|
|
|
30,823 |
|
|
Less: reserve for returns |
|
|
(4,817 |
) |
|
|
(6,677 |
) |
|
Less: allowance for doubtful accounts |
|
|
(45 |
) |
|
|
(260 |
) |
|
Accounts receivable, net |
|
$ |
19,569 |
|
|
$ |
23,886 |
|
Wholesale Distribution receivables are partially billed and collected by our U.S. distribution facilitation partner, Sony Pictures Home Entertainment, or SPHE. Each quarter, SPHE preliminarily settles their portion of our wholesale receivables assuming a timing lag on collections and an average-return rate. When actual returns differ from the amounts previously assumed, adjustments are made that give rise to payables and receivables between us and SPHE. Amounts vary and tend to be seasonal following our sales activity. As of December 31, 2016, we owed our distribution partner $5.6 million for receivables settled as of year-end; and as of December 31, 2015, our distribution partner owed us $0.8 million for receivables settled as of year-end. The Wholesale Distribution receivables are reported net of amounts owed to the distribution partner as amounts are offset against each other when settling.
As of December 31, 2016 and 2015, the net Wholesale Distribution receivables with SPHE were $4.3 million and $11.1 million, respectively, which is included in accounts receivable.
|
Note 6. |
Inventories |
Inventories are summarized as follows:
|
|
|
December 31, |
|
|||||
|
(In thousands) |
|
2016 |
|
|
2015 |
|
||
|
Packaged discs |
|
$ |
5,601 |
|
|
$ |
7,557 |
|
|
Packaging materials |
|
|
452 |
|
|
|
753 |
|
|
Other merchandise (1) |
|
|
162 |
|
|
|
15 |
|
|
Inventories, net |
|
$ |
6,215 |
|
|
$ |
8,325 |
|
|
|
(1) |
Other merchandise consists of third-party products, primarily gifts, jewelry and home accents. |
For each reporting period, we review the value of inventories on hand to estimate the recoverability through future sales. Values in excess of anticipated future sales are booked as obsolescence reserve. Our obsolescence reserve was $10.0 million and $11.4 million as of December 31, 2016 and 2015, respectively. We reduce our inventories with adjustments for lower of cost or market valuation, shrinkage, excess quantities and obsolescence. During the years ended December 31, 2016 and 2015, we recorded impairment charges of $1.8 million and $1.5 million, respectively. These charges are included in cost of sales as manufacturing and fulfillment cost.
67
|
NOTE 7. |
PROPERTY, EQUIPMENT AND IMPROVEMENTS |
Property, equipment and improvements are summarized as follows:
|
|
|
December 31, |
|
|||||
|
(In thousands) |
|
2016 |
|
|
2015 |
|
||
|
Furniture, fixtures and equipment |
|
$ |
1,174 |
|
|
$ |
1,431 |
|
|
Software |
|
|
2,042 |
|
|
|
1,865 |
|
|
Leasehold improvements |
|
|
486 |
|
|
|
530 |
|
|
Property, equipment and improvements |
|
|
3,702 |
|
|
|
3,826 |
|
|
Less: accumulated depreciation and amortization |
|
|
(2,366 |
) |
|
|
(2,011 |
) |
|
Property, equipment and improvements, net |
|
$ |
1,336 |
|
|
$ |
1,815 |
|
During the years ended December 31, 2016 and 2015, we recorded no impairment to property, equipment and improvements. Depreciation expense was 0.7 million for the year ended December 31, 2016 and 0.8 million for the year ended December 31, 2015.
|
Note 8. |
InvestmentS in CONTENT |
Investments in content are as follows:
|
|
|
December 31, |
|
|||||
|
(In thousands) |
|
2016 |
|
|
2015 |
|
||
|
Released |
|
$ |
48,593 |
|
|
$ |
53,378 |
|
|
Completed, not released |
|
|
8,453 |
|
|
|
5,936 |
|
|
In-production |
|
|
3,691 |
|
|
|
1,093 |
|
|
Investments in content, net |
|
$ |
60,737 |
|
|
$ |
60,407 |
|
Investments in content are stated at the lower of unamortized cost or estimated fair value. The valuation of investments in content is reviewed on a title-by-title basis when an event or change in circumstances indicates that the fair value of content is less than its unamortized cost. Impairment charges for the years ended December 31, 2016 and 2015 were $2.8 million and $3.2 million, respectively. Impairments are included in cost of sales as part of content amortization and royalties.
In determining the fair value of content (Note 15, Fair Value Measurements), we employ a discounted cash flows (or DCF) methodology. Key inputs employed in the DCF methodology include estimates of ultimate revenue and costs, as well as a discount rate. The discount rate utilized in the DCF analysis is based on a market participant’s weighted average cost of capital plus a risk premium representing the risk associated with producing a particular type of content.
Our estimated future amortization for investments in content is as follows:
|
(In thousands) |
|
|
|
|||||
|
Period |
|
Estimated Amortization |
|
|
Percentage |
|
||
|
1 Year |
|
$ |
15,591 |
|
|
|
32.1 |
% |
|
2 - 3 Years |
|
|
16,410 |
|
|
|
33.8 |
% |
|
4 - 5 Years |
|
|
8,671 |
|
|
|
17.8 |
% |
|
6 - 7 Years |
|
|
4,560 |
|
|
|
9.4 |
% |
|
Thereafter |
|
|
3,361 |
|
|
|
6.9 |
% |
|
|
|
$ |
48,593 |
|
|
|
100.0 |
% |
68
|
Note 9. |
Goodwill and other Intangible Assets |
Goodwill
Goodwill by segment is as follows:
|
(In thousands) |
|
Digital Channels |
|
|
Wholesale Distribution |
|
|
Total |
|
|||
|
Goodwill balance as of January 1, 2015 |
|
$ |
1,855 |
|
|
$ |
43,036 |
|
|
$ |
44,891 |
|
|
Impairment loss during the year |
|
|
— |
|
|
|
(30,260 |
) |
|
|
(30,260 |
) |
|
Goodwill balance as of December 31, 2015 |
|
|
1,855 |
|
|
|
12,776 |
|
|
|
14,631 |
|
|
Foreign currency translation adjustment |
|
|
— |
|
|
|
(940 |
) |
|
|
(940 |
) |
|
Goodwill balance as of December 31, 2016 |
|
$ |
1,855 |
|
|
$ |
11,836 |
|
|
$ |
13,691 |
|
|
Accumulated impairment losses as of December 31, 2016 |
|
$ |
(981 |
) |
|
$ |
(30,260 |
) |
|
$ |
(31,241 |
) |
Of the goodwill initially recognized, approximately $22.3 million is being amortized over 15 years for tax purposes giving rise to a future tax deduction.
Goodwill was tested for impairment for the periods presented and we recognized impairment losses of $30.3 million in our Wholesale Distribution segment during 2015. We did not impair our goodwill in 2016.
During the fourth quarter of 2015, our Wholesale Distribution segment performance, primarily in the U.S., was below its forecast for the quarter. Also, during that quarter, we adjusted our 2016 forecast downward to reflect our continued liquidity constraints and the impact these constraints have had on our ability to invest in future content. We considered these decreases to be a triggering event and hired a valuation firm to fair value our U.S. Wholesale Distribution reporting unit, which held the majority of our goodwill. The valuation firm valued our U.S. Wholesale Distribution reporting unit using both the market approach (by using comparable businesses) and the income approach. Significant inputs were the selection of comparable companies, our five-year forecast and a risk-appropriate discount rate of 18%. The results of the valuation were that our U.S. Wholesale Distribution reporting unit had a fair value that was less than its carrying value, primarily because the unit held $38.9 million of recorded goodwill. Management assessed the amount of implied goodwill within this reporting unit and concluded that $30.3 million of its goodwill was impaired.
Other Intangibles
A summary of our intangibles and accumulated amortization are as follows:
|
|
|
December 31, 2016 |
|
|||||||||
|
(In thousands) |
|
Gross Carrying Amount |
|
|
Accumulated Amortization |
|
|
Net |
|
|||
|
Trade name |
|
$ |
9,875 |
|
|
$ |
(3,671 |
) |
|
$ |
6,204 |
|
|
Customer relationships |
|
|
9,290 |
|
|
|
(8,512 |
) |
|
|
778 |
|
|
Websites and digital platforms |
|
|
2,480 |
|
|
|
(933 |
) |
|
|
1,547 |
|
|
Supplier contracts |
|
|
1,590 |
|
|
|
(965 |
) |
|
|
625 |
|
|
Option for future content |
|
|
900 |
|
|
|
(745 |
) |
|
|
155 |
|
|
|
|
$ |
24,135 |
|
|
$ |
(14,826 |
) |
|
$ |
9,309 |
|
|
|
|
December 31, 2015 |
|
|||||||||
|
(In thousands) |
|
Gross Carrying Amount |
|
|
Accumulated Amortization |
|
|
Net |
|
|||
|
Trade name |
|
$ |
9,875 |
|
|
$ |
(2,602 |
) |
|
$ |
7,273 |
|
|
Customer relationships |
|
|
520 |
|
|
|
(429 |
) |
|
|
91 |
|
|
Websites and digital platforms |
|
|
3,863 |
|
|
|
(3,115 |
) |
|
|
748 |
|
|
Supplier contracts |
|
|
1,720 |
|
|
|
(868 |
) |
|
|
852 |
|
|
Option for future content |
|
|
900 |
|
|
|
(631 |
) |
|
|
269 |
|
|
Leases |
|
|
400 |
|
|
|
(400 |
) |
|
|
— |
|
|
|
|
$ |
17,278 |
|
|
$ |
(8,045 |
) |
|
$ |
9,233 |
|
In connection with the USA licensing agreement covering our U.S. catalog business, USA licensed the right to use our U.S. direct-to-consumer customer list. Going forward, future sales of product inventory to USA will be part of our Wholesale Distribution
69
segment. In 2016, we transferred our U.S. customer-list asset (which is included in customer relationships in the above table) to our Wholesale Distribution segment as this asset will be realized through sales to USA. As of December 31, 2015, this asset was included in discontinued operations and its unamortized balance was $1.5 million
Amortization expense for the years ended December 31, 2016 and 2015 was $2.3 million and $3.4 million, respectively. Costs incurred to develop, upgrade or enhance functionality of websites and digital platform software are capitalized while maintenance and operating costs are expensed as incurred. During the years ended December 31, 2016 and 2015, we capitalized $1.4 million and $0.5 million of costs related to our websites and digital platform software, respectively.
During the third quarter of 2015, we committed to using the RLJE brand for all new feature-film content. We continue to brand all previously released feature-film content with the Image brand. As a result of this change, we reassessed the useful life of our Image brand and concluded that the brand's life had been reduced to a trailing eight-year period, with a disproportionate amount of brand benefit being realized during the first three years. As a result, we changed our amortization assumptions. We were amortizing the carrying value of our Image trade name on a straight-line basis over 15 years, with 12 years remaining. Since 2015, we are amortizing the carrying value of our Image trade name over the remaining eight years with increased amortization in the earlier years. We recognized $0.5 million of accelerated amortization within our Wholesale Distribution segment during 2015. We assessed whether the Image brand was impaired during 2015 and concluded that the estimated future cash flows from the Image brand exceed the brand’s carrying value; therefore we did not recognize an impairment charge.
During the fourth quarter of 2015, we committed to and began implementing a plan to exit our Acacia catalog business, which diminished the value of our Acacia brand. As a result, we re-assessed the recoverability and the remaining useful life of our Acacia brand and recognized $0.8 million of accelerated amortization within our Wholesale Distribution segment during 2015. When reaching this conclusion, we considered the future revenues forecasted from this brand and an appropriate royalty rate that would be owed had we not owned the brand. This charge effectively reduced the carrying value of this brand name asset to zero.
During 2015, as a result of the above changes in estimates related to the accelerated amortization of trade names, our loss from continuing operations and net loss after discontinued operations each increased by a total of $1.3 million and our basic and diluted loss per share increased by $0.31.
As of December 31, 2016, the remaining amortization by year for intangible assets is as follows:
|
(In thousands) |
|
|
|
|
|
Year Ended December 31, |
|
Amount |
|
|
|
2017 |
|
$ |
2,585 |
|
|
2018 |
|
|
1,698 |
|
|
2019 |
|
|
1,073 |
|
|
2020 |
|
|
631 |
|
|
2021 |
|
|
546 |
|
|
Thereafter |
|
|
2,776 |
|
|
|
|
$ |
9,309 |
|
70
|
Note 10. |
Debt |
Debt consists of the following:
|
|
|
Maturity |
|
Interest |
|
|
December 31, |
|
||||||
|
(In thousands) |
|
Date |
|
Rate |
|
|
2016 |
|
|
2015 |
|
|||
|
Senior secured term notes with AMC: |
|
|
|
|
|
|
|
|
|
|
|
|
|
|
|
Tranche A Loan |
|
June 30, 2019 |
|
|
7.0% |
|
|
$ |
5,000 |
|
|
$ |
— |
|
|
Tranche B Loan |
|
Beginning October 14, 2021 |
|
|
6.0% |
|
|
|
60,000 |
|
|
|
— |
|
|
Prior senior secured term notes |
|
Repaid October 14, 2016 |
|
LIBOR + 10.64% |
|
|
|
— |
|
|
|
56,938 |
|
|
|
Less: debt discount |
|
|
|
|
|
|
|
|
(31,565 |
) |
|
|
(4,234 |
) |
|
Total senior-term notes, net of discount |
|
|
|
|
|
|
|
|
33,435 |
|
|
|
52,704 |
|
|
Subordinated notes payable to prior Image Shareholders |
|
Repaid January 31, 2017 |
|
1.5% through 2016 then 12% |
|
|
|
8,618 |
|
|
|
8,546 |
|
|
|
Debt, net of discount |
|
|
|
|
|
|
|
$ |
42,053 |
|
|
$ |
61,250 |
|
Future minimum principal payments as of December 31, 2016 are as follows:
|
|
|
|
|
|
|
Subordinated |
|
|
|
|
|
|
|
(In thousands) |
|
Senior Notes |
|
|
Notes |
|
|
Total |
|
|||
|
2017 |
|
$ |
— |
|
|
$ |
8,618 |
|
|
$ |
8,618 |
|
|
2018 |
|
|
— |
|
|
|
— |
|
|
|
— |
|
|
2019 |
|
|
5,000 |
|
|
|
— |
|
|
|
5,000 |
|
|
2020 |
|
|
— |
|
|
|
— |
|
|
|
— |
|
|
2021 |
|
|
15,000 |
|
|
|
— |
|
|
|
15,000 |
|
|
Thereafter |
|
|
45,000 |
|
|
|
— |
|
|
|
45,000 |
|
|
|
|
$ |
65,000 |
|
|
$ |
8,618 |
|
|
$ |
73,618 |
|
Senior Term Notes
On October 14, 2016, we entered into a $65.0 million Credit and Guaranty Agreement (the AMC Credit Agreement) with Digital Entertainment Holdings LLC, a wholly owned subsidiary of AMC Networks Inc. (or AMC). Concurrent with entering into the AMC Credit Agreement, we also issued AMC three warrants (the AMC Warrants) to acquire a total of 20.0 million shares of our common stock at $3.00 per share. The entering of the AMC Credit Agreement, the issuance of the AMC Warrants and the associated transactions are referred to as the AMC Transaction.
The proceeds received from the AMC Credit Agreement were used to repay our prior senior secured term notes of $55.1 million, including accrued interest, and transaction expenses of approximately $1.7 million, which includes a prepayment penalty of $0.8 million. The AMC Credit Agreement consists of (i) a term loan tranche in the principal amount of $5.0 million (or Tranche A Loan), which was due October 14, 2017, but was amended in 2017 to June 30, 2019, and (ii) a term loan tranche in the principal amount of $60.0 million (or Tranche B Loan) of which 25% is due after five years, 50% is due after six years and the remaining 25% is due after seven years. The Tranche A Loan bears interest at a rate of 7.0% per annum and the Tranche B Loan bears interest at a rate of 6.0% per annum. Interest is payable quarterly whereby 4.0% is payable in cash and the balance is payable in shares of common stock determined using a per-share value of $3.00 per share. The loan is secured by a lien on substantially all of our consolidated assets.
Subject to certain customary exceptions, the AMC Credit Agreement requires mandatory prepayments if we were to receive proceeds from asset sales, insurance, debt issuance or the exercise of the AMC Warrants (see Note12, Stock Warrants). We may also make voluntary prepayments. Prepayments of the Tranche B Loan (either voluntary or mandatory) are subject to a prepayment premium of 3.0% if principal is repaid on or before October 14, 2018, and 1.5% if principal is repaid after October 14, 2018 but on or before October 14, 2019. No prepayment premium is due for amounts prepaid after October 14, 2019.
71
The AMC Credit Agreement contains certain financial and non-financial covenants. Financial covenants are assessed annually and are based on Consolidated Adjusted EBITDA, as defined in the AMC Credit Agreement. Financial covenants vary by fiscal year and generally become more restrictive over time.
Financial covenants include the following:
|
|
|
December 31, 2016 |
|
December 31, 2017 |
|
December 31, 2018 |
|
Thereafter |
|
Leverage Ratios: |
|
|
|
|
|
|
|
|
|
Senior debt-to-Adjusted EBITDA |
|
6.00 : 1.00 |
|
5.50 : 1.00 |
|
3.50 : 1.00 |
|
2.50 : 1.00 |
|
Total debt-to-Adjusted EBITDA |
|
6.75 : 1.00 |
|
6.00 : 1.00 |
|
5.00 : 1.00 |
|
4.00 : 1.00 |
|
Fixed charge coverage ratio |
|
1.00 : 1.00 |
|
1.00 : 1.00 |
|
2.00 : 1.00 |
|
2.00 : 1.00 |
The AMC Credit Agreement contains events of default that include, among others, non-payment of principal, interest or fees, violation of covenants, inaccuracy of representations and warranties, bankruptcy and insolvency events, material judgments, cross defaults to certain other contracts (including, for example, business arrangements with our U.S. distribution facilitation partner and other material contracts) and indebtedness and events constituting a change of control or a material adverse effect in any of our results of operations or conditions (financial or otherwise). The occurrence of an event of default would increase the applicable rate of interest and could result in the acceleration of our obligations under the AMC Credit Agreement.
The AMC Credit Agreement imposes restrictions on such items as encumbrances and liens, payments of dividends, other indebtedness, stock repurchases, capital expenditures and entering into new lease obligations. Additional covenants restrict our ability to make certain investments, such as loans and equity investments, or investments in content that are not in the ordinary course of business. Pursuant to the AMC Credit Agreement, we must maintain at all times a cash balance of $1.0 million for 2016, $2.0 million in cash for 2017 and $3.5 million in cash for all years thereafter. As of December 31, 2016, we were in compliance with all covenants as stipulated in the AMC Credit Agreement.
When repaying the previous credit facility on October 14, 2016, we recognized a $3.5 million loss from the early extinguishment of debt, which is reported separately within our statement of operations. This loss primarily represents the unamortized debt discount and deferred financing costs at the time of repayment of our prior credit facility and prepayment penalty of $0.8 million.
Concurrent with entering into the AMC Credit Agreement, we issued AMC the AMC Warrants to acquire shares of our common stock at $3.00 per share. The first warrant is for 5.0 million shares of common stock and expires on October 14, 2021. The second warrant is for 10.0 million shares of common stock and expires on October 14, 2022. The third warrant is for 5.0 million shares of common stock, subject to adjustment, and expires on October 14, 2023. The AMC Warrants are subject to certain standard anti-dilution provisions, and may be exercised on a non-cash basis at AMC’s discretion.
The third warrant (the AMC Tranche C Warrant) contains a provision that may increase the number of shares acquirable upon exercising, for no additional consideration payable by AMC, such that the number of shares acquirable upon exercise is equal to the sum of (i) at least 50.1% of our then outstanding shares of common stock, determined on a fully diluted basis, less (ii) the sum of 15.0 million shares and the equity interest shares issued in connection with the AMC Credit Agreement. This provision provides AMC the ability to acquire at least 50.1% of our common stock for $60.0 million, provided that all warrants are exercised and AMC elects not to exercise on a non-cash basis. The third warrant with this guarantee provision is being accounted for as a derivative liability.
Pursuant to the terms of the AMC Transaction, AMC is entitled to designate two director nominees. In connection with the closing, AMC designated John Hsu and Arlene Manos, and the Board appointed them to be members of the Board.
On January 30, 2017, we amended the AMC Credit Agreement and borrowed an additional $8.0 million, thereby increasing our Tranche A loan from $5.0 million to $13.0 million. We also changed the maturity date for our Tranche A loan from October 14, 2017 to June 30, 2019. The additional $8.0 million borrowed was used to repay our obligations under the subordinated notes payable. When doing so, we did not incur a prepayment penalty. This amendment also changed certain debt covenant ratios to reflect the extended maturity date and the increase of the Tranche A loan balance. These amended terms are reflected in the above tables and disclosures.
Subordinated Notes Payable
In October 2012, we issued unsecured subordinated promissory notes in the aggregate principal amount of $14.8 million to the selling preferred stockholders of Image (or Subordinated Note Holders). On May 20, 2015, and in connection with the sale of preferred stock and warrants, the Subordinated Note Holders exchanged approximately $8.5 million of subordinated notes for 8,546
72
shares of preferred stock and warrants to acquire 855,000 shares of common stock (see Note 12, Stock Warrants). The notes bore interest at 12.0% per annum, except for a two-year period ending December 31, 2016, whereby the interest rate was adjusted to 1.5% per annum. Each year, we paid 45% of the interest due in cash and added the remaining of 55% to the subordinated note balance. On January 31, 2017, we repaid these subordinated notes and accrued interest in full.
|
Note 11. |
REDEEMABLE CONVERTIBLE PREFERRED STOCK |
On May 20, 2015, we closed a transaction in which we sold 31,046 shares of preferred stock and warrants to acquire 3.1 million shares of common stock for $22.5 million in cash and the exchange of $8.5 million in subordinated notes. Of the preferred shares and warrants sold, 16,500 shares of preferred stock and warrants to acquire 1.7 million shares of common stock were sold to certain board members or their affiliated companies. We used $10.0 million of the cash proceeds from this sale to make partial payment on our senior notes payable and approximately $1.9 million for prepayment penalties, legal and accounting fees, which include fees associated with our registration statement filed in July 2015 and other expenses associated with the transaction. The balance of the net cash proceeds was used for content investment and working capital purposes. Of the fees incurred, $0.9 million was recorded against the proceeds received, $0.5 million was recorded as additional debt discounts, $0.2 million was included as interest expense and the balance was included in other expense.
In connection with the sale of our preferred stock on May 20, 2015, the holders of the preferred stock appointed two board members temporarily increasing the board to 11 members. On June 4, 2015, four board members resigned thus reducing the board size to seven members, which we committed to when issuing the preferred stock.
On October 14, 2016 and concurrent with the close of our AMC Credit Agreement, we amended our preferred stock such that we were able to classify our preferred stock and its embedded conversion feature within our shareholders’ equity (deficit). Prior to the amendment, our preferred stock and its embedded conversion feature were recorded on our consolidated balance sheet outside of shareholders equity (deficit). The amended terms are disclosed below.
The preferred stock has the following rights and preferences:
|
|
• |
Rank – the preferred stock ranks higher than other company issued equity securities in terms of distributions, dividends and other payments upon liquidation. |
|
|
• |
Dividends – the preferred stockholders are entitled to cumulative dividends at a rate of 8% per annum of a preferred share’s stated value ($1,000 per share plus any unpaid dividends). The first dividend payment is due July 1, 2017 and then payments are to be made quarterly thereafter. At our discretion, dividend payments are payable in either cash, or if we satisfy certain equity issuance conditions, in shares of common stock. Pursuant to the October 14, 2016 amended terms, if we don’t satisfy equity issuance conditions, then we may elect to accrue the value of the dividend and add it to the preferred share’s stated value. |
|
|
• |
Conversion – at the preferred stockholder’s discretion, each share of preferred stock is convertible into 333.3 shares of our common stock, subject to adjustment for any unpaid dividends. Prior to the October 14, 2016 amendment, the conversion rate was subject to anti-dilution protection for offerings consummated at a per-share price of less than $3.00 per common share. This down-round provision was removed as part of the October 14, 2016 amendment. |
|
|
• |
Mandatory Redemption – unless previously converted, on May 20, 2020, at our option we will either redeem the preferred stock with (a) cash equal to $1,000 per share plus any unpaid dividends (Redemption Value), or (b) shares of common stock determined by dividing the Redemption Value by a conversion rate equal to the lower of (i) the conversion rate then in effect (which is currently $3.00) or (ii) 85% of the then trading price, as defined, of our common stock. As part of the October 14, 2016 amendment, a floor was established for all but 16,500 shares of preferred stock such that the redemption ratio cannot be below $0.50 per common share. For the 16,500 shares of preferred stock, a floor of $2.49 was already in place and remained unchanged. If we were to redeem with shares of common stock, the actual number of shares that would be issued upon redemption is not determinable as the number is contingent upon the then trading price of our common stock. Generally, if we were to redeem with shares, the number of common shares needed for redemption increases as our common stock price decreases. Because of the October 14, 2016 amendment, the maximum number of common shares issuable upon redemption is determinable given the redemption conversion floors. If we elect to redeem with shares of common stock, and we fail to meet certain conditions with respect to the issuance of equity, then we would be subject to a 20% penalty of the maturity redemption price, payable in either cash or shares of common stock. This penalty is subject to, and therefore possibly limited by, a $0.50 per share floor. |
73
|
|
• |
Voting – except for certain matters that require the approval of the preferred stockholders, such as changes to the rights and preferences of the preferred stock, the preferred stock does not have voting rights. However, the holders of the preferred stock are entitled to appoint two board members and, under certain circumstances, appoint a third member. |
We are increasing (or accreting) the carrying balance of our preferred stock up to its redemption value using the effective interest-rate method over a period of time beginning from the issuance date of May 20, 2015 to the required redemption date of May 20, 2020. During the years ended December 31, 2016 and 2015, we recognized accretion of $4.3 million and $2.6 million, respectively. Accretion includes cumulative preferred dividends. As of December 31, 2016, the accumulated unpaid dividends on preferred stock were $4.2 million. During the years ended December 31, 2016 and 2015, accumulated unpaid dividends increased by $2.7 million (or $88.60 per share of preferred stock) and $1.6 million (or $50.60 per share of preferred stock), respectively.
During 2016, two preferred shareholders converted a total of 849 shares of preferred stock and $0.1 million of accumulated dividends into 312,000 shares of common stock.
On July 9, 2015, we filed a registration statement with the Securities and Exchange Commission to register the shares issuable upon conversion of the preferred stock and exercise of the 2015 Warrants (see Note 12, Stock Warrants). The registration statement was declared effective in July 2015. We will use our best efforts to keep the registration statement effective. If we are in default of the registration rights agreement, and as long as the event of default is not cured, then we are required to pay, in cash, partial liquidation damages, which in total are not to exceed 6% of the aggregated subscription amount of $31.0 million.
|
Note 12. |
Stock Warrants |
RLJE had the following warrants outstanding:
|
|
|
December 31, 2016 |
||||||||
|
(In thousands, except per share data) |
|
Shares |
|
|
Weighted-Average Exercise Price |
|
|
Weighted-Average Remaining Life |
||
|
AMC Unregistered Warrants |
|
|
20,000 |
|
|
$ |
3.00 |
|
|
5.8 years |
|
2015 Warrants: |
|
|
|
|
|
|
|
|
|
|
|
Unregistered warrants |
|
|
3,105 |
|
|
$ |
2.27 |
|
|
3.4 years |
|
2012 Warrants: |
|
|
|
|
|
|
|
|
|
|
|
Registered warrants |
|
|
5,125 |
|
|
$ |
36.00 |
|
|
0.8 year |
|
Sponsor warrants |
|
|
1,272 |
|
|
$ |
36.00 |
|
|
0.8 year |
|
Unregistered warrants |
|
|
617 |
|
|
$ |
36.00 |
|
|
0.8 year |
|
|
|
|
30,119 |
|
|
|
|
|
|
|
Concurrent with entering into the AMC Credit Agreement, we also issued AMC three warrants (the AMC Warrants) to acquire shares of our common stock at $3.00 per share. The first warrant is for 5.0 million shares of common stock and expires on October 14, 2021. The second warrant is for 10.0 million shares of common stock and expires on October 14, 2022. The third warrant is for 5.0 million shares of common stock, subject to adjustment, and expires on October 14, 2023. The AMC Warrants are subject to certain standard anti-dilution provisions, and may be exercised on a non-cash basis at AMC’s discretion.
The third warrant (the AMC Tranche C Warrant) contains a provision that may increase the number of shares acquirable upon exercising, for no additional consideration payable by AMC, such that the number of shares acquirable upon exercise is equal to the sum of (i) at least 50.1% of our then outstanding shares of common stock, determined on a fully diluted basis, less (ii) the sum of 15.0 million shares and the equity interest shares issued in connection with the AMC Credit Agreement. This provision provides AMC the ability to acquire at least 50.1% of our common stock for $60.0 million, provided that all warrants are exercised and AMC elects not to exercise on a non-cash basis. The third warrant with this guarantee provision is being accounted for as a derivative liability.
On May 20, 2015 and concurrent with our preferred stock placement, we issued warrants to our preferred stock holders to acquire 3.1 million shares of our common stock (the 2015 Warrants). The warrants have term of five years. On October 14, 2016 and in connection with the AMC Credit Agreement, we amended the anti-dilution and redemption provisions of the warrants to conform to the terms of the amended preferred stock. Because of the AMC transaction and the then-existing terms of the 2015 Warrants, the warrant exercise price was reduced from $4.50 to $3.00; however, the exercise price was further reduced down to $1.50 for warrants to acquire 1.5 million shares of common stock, and down to $2.37 for warrants to acquire 150,000 shares of
74
common stock. Because of the October 14, 2016 amendment, we began accounting for the 2015 Warrants as equity awards and reclassified the carrying balance of the warrants to shareholders’ equity (deficit).
On October 3, 2012, we issued warrants with a term of five years that provide the warrant holder the right to acquire one share of our common stock for $36.00 per share (the 2012 Warrants). The warrants are redeemable by us for $0.03 per warrant share if our common stock trades at $52.50 or more per share for 20 out of 30 trading days. The warrants contain standard anti-dilution provisions.
The 2012 Warrants contain a provision whereby the exercise price will be reduced if RLJE reorganized as a private company. The reduction in exercise price depends upon the amount of other consideration, if any, received by the warrant holders in the reorganization and how many years after the Business Combination reorganization is consummated. Generally, the reduction in exercise price would be between $18.00 and $27.00 assuming no additional consideration was received. Because of this adjustment provision, the 2012 Warrants are being accounted for as a derivative liability.
|
NOTE 13. |
EQUITY |
Our articles of incorporation authorize us to issue up to 250 million shares of common stock and one million shares of preferred stock, par value $0.001 per share. As of December 31, 2016, there were 5,240,085 shares of common stock issued and outstanding. As of December 31, 2015, there were 4,717,324 shares issued and outstanding.
On October 3, 2012, in connection with the consummation of the Business Combination, RLJE and certain Image and Acorn Media selling shareholders entered into an amended and restated registration rights agreement (the “Registration Rights Agreement”), in which RLJE agreed to use its best efforts to register certain of its securities held by the stockholders who are a party to the Registration Rights Agreement under the Securities Act of 1933, as amended (the “Securities Act”). Such stockholders are entitled to make up to three demands, excluding short form registration demands, that RLJE register certain of its securities held by them for sale under the Securities Act. In addition, such stockholders have the right to include their securities in other registration statements filed by RLJE. At December 31, 2016, no demand had been received.
As shares of common stock are forfeited, they become treasury shares. Forfeiture of shares occurs when directors or employees, who hold compensatory restricted stock, resign or stop working for us prior to achieving required vesting conditions, or when performance conditions are not met regardless of continued employment or service. Treasury shares are available to RLJE for future grants or issuances of shares at our discretion. At December 31, 2016 and 2015, we did not hold any treasury shares.
|
Note 14. |
Stock-Based Compensation |
Equity Compensation Plan
As of December 31, 2016 and 2015, we had one equity compensation plan. The 2012 Incentive Compensation Plan of RLJ Entertainment, Inc. (the Incentive Plan) was approved by the shareholders of RLJ Acquisition, Image and Acorn Media on September 20, 2012. The Incentive Plan is administered by the compensation committee of our Board of Directors. On December 4, 2015, our stockholders approved an amendment to the Incentive Plan whereby the compensation committee may grant awards totaling a maximum of 2,081,385 shares. The compensation committee may award options, stock appreciation rights, restricted stock awards, restricted stock unit awards, bonus stock and awards in lieu of obligations, dividend equivalents, performance awards and other stock-based awards (as those terms are defined in the Incentive Plan). No person may be granted (i) options or stock appreciation rights with respect to more than 250,000 shares or (ii) restricted stock, restricted stock units, performance shares and/or other stock-based awards with respect to more than 250,000 shares. In addition, no person may be granted awards worth more than $1.0 million of grant date fair value with respect to any 12-month Performance Period (as that term is defined in the Incentive Plan) or $2.0 million with respect to any Performance Period that is more than 12 months. The maximum term allowed for an option is 10 years and a stock award shall either vest or be forfeited not more than 10 years from the date of grant.
At December 31, 2016 and 2015, there were 1,109,046 and 1,511,389 shares, respectively, available for future grants under the Incentive Plan.
Restricted Stock-Based Compensation Grants
Compensation expense relating to the restricted stock awards for the years ended December 31, 2016 and 2015 was $1.0 million and $0.3 million, respectively. Unrecognized stock-based compensation expense relating to these restricted stock awards of approximately $0.6 million at December 31, 2016 is expected to be expensed ratably over the remaining vesting period through March 2019. The weighted average remaining vesting period for non-vested shares is 1.1 years. Compensation expense related to restricted stock awards is included in general and administrative expenses. On June 30, 2015, we allowed 19,075 shares of common stock to
75
vest that were granted to those board members who resigned on June 4, 2015 (see Note 11, Redeemable Convertible Preferred Stock). We accounted for this as a modification of vesting provisions and revalued these shares as of June 30, 2015. This revaluation resulted in a reduction in share-based compensation expense of $0.1 million during the year ended December 31, 2015.
During the year ended December 31, 2016, 418,805 shares of restricted stock-based awards were granted. Of the awards granted, 216,982 restricted stock awards were granted to executive officers and directors and 201,823 restricted stock units were granted to employees. The shares were fair valued using our closing stock price of $1.92 per share on the grant date, for a total value of approximately $0.8 million, which will be expensed over the vesting period as a component of general and administrative expenses. The restricted stock awards will vest over a three-year period for executive officers and a one-year period for directors. The restricted stock units will vest over a three-year period for employees. The vesting of restricted stock-based awards is subject to the achievement of certain service criteria. The awards may be subject to further forfeitures if the employee or director terminates his or her service during the vesting period. All shares of restricted stock participate in dividends, if declared prior to their vesting date.
Restricted stock award activity under the Incentive Plan for the year ended December 31, 2016, and changes during the year then ended are presented below:
|
(In thousands, except per share data) |
|
Service Shares |
|
|
Performance Shares |
|
||||||||||
|
Restricted Stock-Based Compensation Award Activity |
|
Shares |
|
|
Weighted- Average Grant Date Fair Value |
|
|
Shares |
|
|
Weighted- Average Grant Date Fair Value |
|
||||
|
Non-vested shares at January 1, 2016 |
|
|
436 |
|
|
$ |
2.48 |
|
|
|
6 |
|
|
$ |
16.36 |
|
|
Granted |
|
|
419 |
|
|
$ |
1.92 |
|
|
|
— |
|
|
$ |
— |
|
|
Vested |
|
|
(436 |
) |
|
$ |
2.48 |
|
|
|
— |
|
|
$ |
— |
|
|
Forfeited |
|
|
(10 |
) |
|
$ |
1.92 |
|
|
|
(6 |
) |
|
$ |
16.36 |
|
|
Non-vested shares at December 31, 2016 |
|
|
409 |
|
|
$ |
1.92 |
|
|
|
— |
|
|
$ |
— |
|
During the year ended December 31, 2015, 434,750 shares of restricted common stock were granted. Of the shares granted, 158,669 shares were granted to executive officers and directors and 276,081 shares were granted to other members of management. The shares were fair valued using our closing stock price on the date of grant with a range of $2.07 to $3.66 per share, for a total value of approximately $1.0 million. These restricted shares will vest and be expensed over a one-year period as a component of general and administrative expenses.
Restricted stock award activity under the Incentive Plan for the year ended December 31, 2015, and changes during the year then ended are presented below:
|
(In thousands, except per share data) |
|
Service Shares |
|
|
Performance Shares |
|
||||||||||
|
Restricted Stock-Based Compensation Award Activity |
|
Shares |
|
|
Weighted- Average Grant Date Fair Value |
|
|
Shares |
|
|
Weighted- Average Grant Date Fair Value |
|
||||
|
Non-vested shares at January 1, 2015 |
|
|
60 |
|
|
$ |
12.39 |
|
|
|
19 |
|
|
$ |
15.27 |
|
|
Granted |
|
|
435 |
|
|
$ |
2.28 |
|
|
|
— |
|
|
$ |
— |
|
|
Vested |
|
|
(55 |
) |
|
$ |
10.95 |
|
|
|
— |
|
|
$ |
— |
|
|
Forfeited |
|
|
(4 |
) |
|
$ |
13.38 |
|
|
|
(13 |
) |
|
$ |
14.67 |
|
|
Non-vested shares at December 31, 2015 |
|
|
436 |
|
|
$ |
2.48 |
|
|
|
6 |
|
|
$ |
16.36 |
|
|
Note 15. |
Fair Value Measurements |
Warrant Liability
Stock Warrant and Other Derivative Liabilities
Of our outstanding warrants, certain warrants are accounted for as derivative liabilities, which require us to carry them on our consolidated balance sheet at their fair value. Our derivative liability warrants consist of the AMC Tranche C Warrant to acquire 5.0 million shares of common stock and our 2012 Warrants to acquire 7.0 million shares of common stock. Prior to the amendment on October 14, 2016, our 2015 Warrants for 3.1 million shares of common stock and the preferred stock’s embedded conversion feature were being accounted for as derivative liabilities as well.
76
We determined the fair value of the AMC Tranche C warrant using a lattice model, which is classified as Level 3 within in the fair-value hierarchy. Inputs to the model include our publicly-traded stock price, our stock volatility, the risk-free interest rate and contractual terms of the warrant (which are remaining life of the warrant, exercise price and assumptions pertaining to increasing the number of acquirable shares of common stock to achieve 50.1% ownership). We use the closing stock price of our common stock to compute stock volatility. To quantify and value the possibility of increasing the number of acquirable shares, management took into consideration its current capital structure, the impact of the 20% penalty if we were to fail to meet certain equity issuance conditions, and management’s best estimates of the likelihood of being subject to the 20% penalty. The AMC Tranche C warrant was valued at $13.2 million on October 14, 2016, and then at $9.8 million as of December 31, 2016.
The fair value of our 2012 Warrants is immaterial as of December 31, 2016. As of December 31, 2016, 2015 and 2014, the fair value of the 2012 Warrants, which was determined using a Monte Carlo simulation model, was $0, $36,000 and $601,000, respectively. Because the warrants are so far out-of-the-money (exercise price is $36.00 per share) and as they approach their expiration date (which is October 2017) their fair value has been decreasing and is now effectively zero.
Prior to the October 14, 2016 amendment, we were using a lattice model to value the 2015 Warrants, which was classified as Level 3 within the fair-value hierarchy. Inputs to the model were stock volatility, contractual warrant terms (which were remaining life of the warrant and the exercise price), the risk-free interest rate and management’s assessment of the likelihood of doing a down-round transaction. As of October 13, 2016, December 31, 2015 and when issued on May 20 2015, the 2015 Warrants were fair valued at $4.4 million, $2.2 million and $2.1 million, respectively.
Prior to the October 14, 2016 amendment, we were using the lattice model to value the preferred stock’s embedded conversion feature, which was classified as Level 3 within the fair-value hierarchy. Inputs to the model were stock volatility, contractual terms (which were remaining life of the conversion option and the conversion rate), the risk-free interest rate and management’s assessment of the likelihood of doing a down-round transaction. As of October 13, 2016, December 31, 2015 and when issued on May 20, 2015, the embedded conversion feature was fair valued at $14.0 million, $8.4 million and $9.4 million, respectively.
The following tables represent the valuation of our warrant and other derivative liabilities within the fair-value hierarchy:
|
|
|
December 31, 2016 |
|
|||||||||||||
|
(In thousands) |
|
Level 1 |
|
|
Level 2 |
|
|
Level 3 |
|
|
Total |
|
||||
|
Stock warrants |
|
$ |
— |
|
|
$ |
— |
|
|
$ |
9,763 |
|
|
$ |
9,763 |
|
|
Embedded conversion feature |
|
$ |
— |
|
|
$ |
— |
|
|
$ |
— |
|
|
$ |
— |
|
|
|
|
December 31, 2015 |
|
|||||||||||||
|
(In thousands) |
|
Level 1 |
|
|
Level 2 |
|
|
Level 3 |
|
|
Total |
|
||||
|
Stock warrants |
|
$ |
— |
|
|
$ |
— |
|
|
$ |
2,252 |
|
|
$ |
2,252 |
|
|
Embedded conversion feature |
|
$ |
— |
|
|
$ |
— |
|
|
$ |
8,426 |
|
|
$ |
8,426 |
|
The following tables include a roll-forward of activity for our warrant and other derivative liabilities classified within Level 3 of the fair-value hierarchy:
|
|
|
Year Ended December 31, 2016 |
|
|||||||||||||
|
(In thousands) |
|
Level 1 |
|
|
Level 2 |
|
|
Level 3 |
|
|
Total |
|
||||
|
Stock warrants at December 31, 2015 |
|
$ |
— |
|
|
$ |
— |
|
|
$ |
2,252 |
|
|
$ |
2,252 |
|
|
Issuance of warrants |
|
|
— |
|
|
|
— |
|
|
|
13,220 |
|
|
|
13,220 |
|
|
Change in fair value |
|
|
— |
|
|
|
— |
|
|
|
(1,294 |
) |
|
|
(1,294 |
) |
|
Amount reclassified to shareholders' equity (deficit) |
|
|
— |
|
|
|
— |
|
|
|
(4,415 |
) |
|
|
(4,415 |
) |
|
Stock warrants at December 31, 2016 |
|
$ |
— |
|
|
$ |
— |
|
|
$ |
9,763 |
|
|
$ |
9,763 |
|
|
|
|
Year Ended December 31, 2016 |
|
|||||||||||||
|
(In thousands) |
|
Level 1 |
|
|
Level 2 |
|
|
Level 3 |
|
|
Total |
|
||||
|
Embedded conversion feature at December 31, 2015 |
|
$ |
— |
|
|
$ |
— |
|
|
$ |
8,426 |
|
|
$ |
8,426 |
|
|
Change in fair value |
|
|
— |
|
|
|
— |
|
|
|
5,867 |
|
|
|
5,867 |
|
|
Amount reclassified to shareholders' equity (deficit) |
|
|
— |
|
|
|
— |
|
|
|
(13,998 |
) |
|
|
(13,998 |
) |
|
Amount reclassified to shareholders' equity (deficit) upon conversion |
|
|
— |
|
|
|
— |
|
|
|
(295 |
) |
|
|
(295 |
) |
|
Embedded conversion feature at December 31, 2016 |
|
$ |
— |
|
|
$ |
— |
|
|
$ |
— |
|
|
$ |
— |
|
77
|
|
|
Year Ended December 31, 2015 |
|
|||||||||||||
|
(In thousands) |
|
Level 1 |
|
|
Level 2 |
|
|
Level 3 |
|
|
Total |
|
||||
|
Stock warrants at December 31, 2014 |
|
$ |
— |
|
|
$ |
— |
|
|
$ |
601 |
|
|
$ |
601 |
|
|
Issuance of warrants |
|
|
— |
|
|
|
— |
|
|
|
2,067 |
|
|
|
2,067 |
|
|
Change in fair value |
|
|
— |
|
|
|
— |
|
|
|
(416 |
) |
|
|
(416 |
) |
|
Stock warrants December 31, 2015 |
|
$ |
— |
|
|
$ |
— |
|
|
$ |
2,252 |
|
|
$ |
2,252 |
|
|
|
|
Year Ended December 31, 2015 |
|
|||||||||||||
|
(In thousands) |
|
Level 1 |
|
|
Level 2 |
|
|
Level 3 |
|
|
Total |
|
||||
|
Embedded conversion feature at December 31, 2014 |
|
$ |
— |
|
|
$ |
— |
|
|
$ |
— |
|
|
$ |
— |
|
|
Issuance of embedded conversion feature |
|
|
— |
|
|
|
— |
|
|
|
9,383 |
|
|
|
9,383 |
|
|
Change in fair value |
|
|
— |
|
|
|
— |
|
|
|
(957 |
) |
|
|
(957 |
) |
|
Embedded conversion feature at December 31, 2015 |
|
$ |
— |
|
|
$ |
— |
|
|
$ |
8,426 |
|
|
$ |
8,426 |
|
Investments in Content
When events and circumstances indicate that investments in content are impaired, we determine the fair value of the investment; and if the fair value is less than the carrying amount, we recognize additional amortization expense equal to the excess. Our non‑recurring fair value measurement information of assets and liabilities is classified in the tables below:
|
|
|
Year Ended December 31, 2016 |
|
|||||||||||||||||
|
(In thousands) |
|
Level 1 |
|
|
Level 2 |
|
|
Level 3 |
|
|
Total |
|
|
Loss |
|
|||||
|
Investments in content |
|
$ |
— |
|
|
$ |
— |
|
|
$ |
1,398 |
|
|
$ |
1,398 |
|
|
$ |
2,822 |
|
|
|
|
Year Ended December 31, 2015 |
|
|||||||||||||||||
|
(In thousands) |
|
Level 1 |
|
|
Level 2 |
|
|
Level 3 |
|
|
Total |
|
|
Loss |
|
|||||
|
Investments in content |
|
$ |
— |
|
|
$ |
— |
|
|
$ |
4,677 |
|
|
$ |
4,677 |
|
|
$ |
3,174 |
|
During the years ended December 31, 2016 and 2015, the investments in content were impaired by $2.8 million and $3.2 million, respectively. In determining the fair value of our investments in content, we employ a DCF methodology. Key inputs employed in the DCF methodology include estimates of a film's ultimate revenue and costs as well as a discount rate. The discount rate utilized in the DCF analysis is based on our weighted average cost of capital plus a risk premium representing the risk associated with producing a particular film or television program. As the primary determination of fair value is determined using a DCF model, the resulting fair value is considered a Level 3 measurement.
|
Note 16. |
Net Loss per Common Share Data |
The following is a reconciliation of the numerators and denominators used in computing basic and diluted net loss per common share for the years ended December 31, 2016 and 2015:
|
|
|
Years Ended December 31, |
|
|||||
|
(In thousands, except per share data) |
|
2016 |
|
|
2015 |
|
||
|
Basic and diluted: |
|
|
|
|
|
|
|
|
|
Net loss attributable to common shareholders |
|
$ |
(26,175 |
) |
|
$ |
(57,606 |
) |
|
Denominator - basic and diluted: |
|
|
|
|
|
|
|
|
|
Weighted-average common shares outstanding – basic |
|
|
4,603 |
|
|
|
4,251 |
|
|
Effect of dilutive securities |
|
|
— |
|
|
|
— |
|
|
Weighted-average common shares outstanding – diluted |
|
|
4,603 |
|
|
|
4,251 |
|
|
Net loss per common share: |
|
|
|
|
|
|
|
|
|
Basic and diluted |
|
$ |
(5.69 |
) |
|
$ |
(13.55 |
) |
We have outstanding warrants to acquire 30.1 million and 10.1 million shares of common stock as of December 31, 2016 and 2015, respectively, that are not included in the computation of diluted net loss per common share as the effect would be anti-dilutive. For the year ended December 31, 2015, we have weighted average outstanding shares of approximately 12,000 which were held by founding shareholders and forfeited in January 2015, that are not included in the computation of basic or diluted net loss per share as
78
the effect would be anti-dilutive. For the years ended December 31, 2016 and 2015, we have weighted average unvested shares of approximately 404,000 and 78,000 shares, respectively, of compensatory restricted common stock and restricted common stock units, that are not included in the computation of diluted net loss per share as the effect would be anti-dilutive.
When dilutive, we include in our computation of diluted loss per share the number of shares of common stock that is acquirable upon conversion of the preferred stock by applying the as-converted method per ASC 260, Earnings per Share. For the years ended December 31, 2016 and 2015, we excluded approximately 11.5 million and 10.9 million shares of common stock that are acquirable upon conversion of the preferred stock as they were anti-dilutive.
|
Note 17. |
Income Taxes |
RLJE files income tax returns in the U.S. Federal jurisdiction and various state jurisdictions. Our subsidiaries in the United Kingdom and Australia continue to file income tax returns in their foreign jurisdictions.
Income taxes are accounted for under the asset and liability method. Deferred tax assets and liabilities are recognized for the future tax consequences attributable to differences between the financial statement carrying amounts of existing assets and liabilities and their respective tax bases and operating loss and tax credit carryforwards. Deferred tax assets and liabilities are measured using enacted tax rates expected to apply to taxable income in the years in which those temporary differences are expected to be recovered or settled. We must assess the likelihood that our deferred tax assets will be recovered from future taxable income and, to the extent that it is more likely than not that such deferred tax assets will not be realized, we must establish a valuation allowance.
As of December 31, 2016, we have a valuation allowance against 100% of our deferred tax assets, which are composed primarily of net operating loss (or NOL) carryforwards that were either acquired in the Business Combination or generated in the years following. Even though we have reserved all of these net deferred tax assets for book purposes, we would still be able to utilize them to reduce future income taxes payable should we have future taxable earnings. To the extent our deferred tax assets relate to NOL carryforwards, the ability to use such NOLs against future earnings will be subject to applicable carryforward periods. As of December 31, 2016, we had NOL carryforwards for Federal and state tax purposes of approximately $111.6 million and approximately $69.5 million, respectively, which are available to offset taxable income through 2036. Our NOL carryforwards begin to expire in 2017. NOL carryforwards that were acquired in the Business Combination reflect our assessment of an annual limitation on the utilization of these carryforwards due to ownership change limitations as required by Section 382 of the Internal Revenue Code of 1986, as amended (the “Code”), as well as similar state limitations.
Income tax expense is summarized below:
|
|
|
Years Ended December 31, |
|
|||||
|
(In thousands) |
|
2016 |
|
|
2015 |
|
||
|
Current |
|
|
|
|
|
|
|
|
|
Federal |
|
$ |
— |
|
|
$ |
— |
|
|
State |
|
|
(17 |
) |
|
|
87 |
|
|
Foreign |
|
|
(144 |
) |
|
|
148 |
|
|
|
|
|
(161 |
) |
|
|
235 |
|
|
Deferred |
|
|
|
|
|
|
|
|
|
Federal |
|
|
— |
|
|
|
(389 |
) |
|
State |
|
|
— |
|
|
|
(21 |
) |
|
Foreign |
|
|
316 |
|
|
|
340 |
|
|
|
|
|
316 |
|
|
|
(70 |
) |
|
Total Tax Expense |
|
$ |
155 |
|
|
$ |
165 |
|
Loss from continuing operations before provision for income taxes is as follows:
|
|
|
Years Ended December 31, |
|
|||||
|
(In thousands) |
|
2016 |
|
|
2015 |
|
||
|
Domestic |
|
$ |
(20,234 |
) |
|
$ |
(49,403 |
) |
|
Foreign |
|
|
1,792 |
|
|
|
849 |
|
|
|
|
$ |
(18,442 |
) |
|
$ |
(48,554 |
) |
79
The tax effects of temporary differences that give rise to a significant portion of the net deferred tax assets and liabilities are presented below:
|
|
|
December 31, |
|
|||||||||||||
|
|
|
2016 |
|
|
2015 |
|
||||||||||
|
(In thousands) |
|
U.S. Federal and State |
|
|
Foreign |
|
|
U.S. Federal and State |
|
|
Foreign |
|
||||
|
Deferred tax assets |
|
|
|
|
|
|
|
|
|
|
|
|
|
|
|
|
|
Intangible assets |
|
$ |
9,066 |
|
|
$ |
— |
|
|
$ |
8,965 |
|
|
$ |
— |
|
|
Provision for lower of cost or market inventory write- downs |
|
|
2,452 |
|
|
|
— |
|
|
|
2,717 |
|
|
|
— |
|
|
Net operating loss carryforwards |
|
|
41,384 |
|
|
|
984 |
|
|
|
32,380 |
|
|
|
737 |
|
|
Allowance for sales returns |
|
|
1,223 |
|
|
|
— |
|
|
|
1,541 |
|
|
|
— |
|
|
Allowance for doubtful accounts receivable |
|
|
17 |
|
|
|
— |
|
|
|
97 |
|
|
|
— |
|
|
Marketing discounts and price protection reserves |
|
|
905 |
|
|
|
— |
|
|
|
1,925 |
|
|
|
— |
|
|
Tax credits carryforwards |
|
|
2,942 |
|
|
|
— |
|
|
|
4,583 |
|
|
|
— |
|
|
Other |
|
|
247 |
|
|
|
— |
|
|
|
614 |
|
|
|
12 |
|
|
Deferred tax assets |
|
|
58,236 |
|
|
|
984 |
|
|
|
52,822 |
|
|
|
749 |
|
|
Less valuation allowance |
|
|
(57,623 |
) |
|
|
(984 |
) |
|
|
(50,682 |
) |
|
|
(737 |
) |
|
Deferred tax assets |
|
|
613 |
|
|
|
— |
|
|
|
2,140 |
|
|
|
12 |
|
|
Deferred tax liabilities |
|
|
|
|
|
|
|
|
|
|
|
|
|
|
|
|
|
Warrant and other derivative liabilities |
|
|
(432 |
) |
|
|
— |
|
|
|
(2,140 |
) |
|
|
— |
|
|
Equity income in ACL |
|
|
— |
|
|
|
(1,715 |
) |
|
|
— |
|
|
|
(1,851 |
) |
|
Other |
|
|
(181 |
) |
|
|
— |
|
|
|
— |
|
|
|
— |
|
|
Deferred tax liabilities |
|
|
(613 |
) |
|
|
(1,715 |
) |
|
|
(2,140 |
) |
|
|
(1,851 |
) |
|
Net deferred tax assets and liabilities |
|
$ |
— |
|
|
$ |
(1,715 |
) |
|
$ |
— |
|
|
$ |
(1,839 |
) |
A reconciliation of income tax benefit based on the federal statutory rate to actual income tax expense (benefit) is as follows:
|
|
|
Years Ended December 31, |
|
|||||
|
(In thousands) |
|
2016 |
|
|
2015 |
|
||
|
Expected federal income tax benefit at 34% on continuing operations |
|
$ |
(6,270 |
) |
|
$ |
(16,508 |
) |
|
Expected state income tax benefit on continuing operations, net of federal benefit |
|
|
(711 |
) |
|
|
(1,664 |
) |
|
Expected federal and state income tax benefit on discontinued operations |
|
|
(1,240 |
) |
|
|
(2,343 |
) |
|
Current state income taxes |
|
|
(17 |
) |
|
|
87 |
|
|
Change in effective tax rates for state taxes |
|
|
(319 |
) |
|
|
— |
|
|
Nondeductible expenses |
|
|
31 |
|
|
|
4,718 |
|
|
Change in valuation allowance for U.S. tax purposes only |
|
|
6,941 |
|
|
|
14,845 |
|
|
Foreign income taxes, including change in valuation allowance |
|
|
172 |
|
|
|
488 |
|
|
Change in prior year deferred taxes and other |
|
|
1,568 |
|
|
|
542 |
|
|
Total tax expense |
|
$ |
155 |
|
|
$ |
165 |
|
Our significant tax returns are filed in the following jurisdictions: United States, United Kingdom and in the following states: Maryland and California. The tax years for 2009 through 2016 remain open to examination. We are not currently under examination by any of the jurisdictions where we file significant tax returns. We believe that our tax filing positions and deductions will be sustained if audited and we do not anticipate any adjustments that would result in a material adverse effect on our financial condition, results of operations, or cash flow. Therefore, no reserves for uncertain tax positions have been recorded.
80
|
Note 18. |
statements of cash flows |
Supplemental Disclosures
|
|
|
Years Ended December 31, |
|
|||||
|
(In thousands) |
|
2016 |
|
|
2015 |
|
||
|
SUPPLEMENTAL DISCLOSURES OF CASH FLOW INFORMATION: |
|
|
|
|
|
|
|
|
|
Cash paid during the year for: |
|
|
|
|
|
|
|
|
|
Interest |
|
$ |
5,156 |
|
|
$ |
7,997 |
|
|
Income taxes |
|
$ |
43 |
|
|
$ |
338 |
|
|
Non-cash investing and financing activities: |
|
|
|
|
|
|
|
|
|
Subordinated notes payable exchanged for preferred stock and warrants |
|
$ |
— |
|
|
$ |
8,546 |
|
|
Reclassification of deferred financing costs from prepaid expenses and other assets to debt, net of discounts |
|
$ |
832 |
|
|
$ |
— |
|
|
Reclassification of derivative liabilities and redeemable convertible preferred stock to shareholders' equity (deficit) |
|
$ |
42,769 |
|
|
$ |
— |
|
|
Interest payable on subordinated notes converted to principal |
|
$ |
72 |
|
|
$ |
— |
|
|
Accretion on preferred stock |
|
$ |
4,301 |
|
|
$ |
2,626 |
|
|
Preferred stock and derivative liability converted into common stock |
|
$ |
1,232 |
|
|
$ |
— |
|
|
Preferred stock issuance costs accrued for in accounts payable and accrued liabilities |
|
$ |
— |
|
|
$ |
95 |
|
|
Capital expenditures accrued for in accounts payable and accrued liabilities |
|
$ |
322 |
|
|
$ |
76 |
|
|
NOTE 19. |
SEVERANCE |
During the year ended December 31, 2015, we incurred severance charges of $0.5 million. During the year ended December 31, 2016, we recognized additional severance charges of $0.5 million of which $0.3 million is included in discontinued operations. Severance charges that are not part of discontinued operations are recorded as a component of general and administrative expense.
|
Note 20. |
Employee Benefits |
Effective October 3, 2012, we established the RLJ Entertainment 401(k) Plan, a defined contribution 401(k) plan for the benefit of employees meeting certain eligibility requirements. Under the plan, participants may contribute a portion of their earnings on a pre-tax basis. Employee contributions are forwarded to the plan administrator and invested in various funds at the discretion of the employee. RLJE matches a portion of those contributions based upon the employee’s compensation status in accordance with the U.S. Internal Revenue Code. Our U.S. sponsor plan contributes up to four percent depending on the employee’s contribution beginning one month after the date of hire. Our U.K. subsidiary sponsor plan contributes between three to seven percent to employees beginning after a probationary period of three months. Our Australia subsidiary sponsor plan contributes 9.5 percent to employees beginning at the date of hire.
During the years ended December 31, 2016 and 2015, we incurred compensation expenses related to these plans of $0.4 million and $0.5 million, respectively.
81
|
Note 21. |
Commitments and Contingencies |
Operating Leases
RLJE’s principal executive office is located in Silver Spring, Maryland. We also maintain offices in Woodland Hills, California; London, England and Sydney, Australia with varying terms and expiration dates. All locations are leased. In addition, we have subleased our Stillwater, Minnesota, location associated with our discontinued operations. A summary of our locations is as follows:
|
Location |
Primary Purpose |
Lease Expiration |
Reporting Segment (1) |
|
Silver Spring, MD |
Executive Office/Administrative/Sales/ Content Acquisition |
November 15, 2020 |
Corporate/ |
|
Woodland Hills, CA |
Administrative/Sales/Content Acquisition |
June 30, 2021 |
Digital Channels/
|
|
London, England |
Content Development and Production/Sales/ Administration for the U.K. |
July 1, 2018 |
Digital Channels/IP Licensing/
|
|
Sydney, Australia |
Sales/Administration |
Month-to-month |
Wholesale Distribution |
|
|
(1) |
The segment descriptions above reflect the location’s primary activity. |
Future minimum annual rental payments include amounts we are obligated to pay under the leases described above and on space associated with discontinued operations that we began subleasing in 2016. The sublease is in effect through the end of the lease term in July 2022. Beginning in March 2017, our obligations for the subleased space are entirely offset by sublease income. We received no sublease income in 2016. Future minimum annual rental payments by year under noncancelable operating leases at December 31, 2016, are as follows:
|
(In thousands) |
|
|
|
|
|
|
|
|
|
Year Ended December 31, |
|
Lease Commitment |
|
|
Sublease Income |
|
||
|
2017 |
|
$ |
1,291 |
|
|
$ |
146 |
|
|
2018 |
|
|
1,172 |
|
|
|
178 |
|
|
2019 |
|
|
1,017 |
|
|
|
182 |
|
|
2020 |
|
|
1,032 |
|
|
|
186 |
|
|
2021 |
|
|
450 |
|
|
|
189 |
|
|
Thereafter |
|
|
91 |
|
|
|
112 |
|
|
|
|
$ |
5,053 |
|
|
$ |
993 |
|
Rent expense was $1.7 million and $1.8 million, for the years ended December 31, 2016 and 2015, respectively.
82
Employment Agreements
At December 31, 2016, our future contractual obligations under three employment agreements are summarized below. Included in the amounts below are any minimum bonus or agreed-upon amounts to be paid within the employment contracts over the next five years as long as the employee continues to be an employee in good standing and meets the performance criteria within the individual employment agreements. One of the four employment agreements does not have an expiration date and is included in each of the five years presented below.
|
(In thousands) |
|
|
|
|
|
Year Ended December 31, |
|
Employment Contracts |
|
|
|
2017 |
|
$ |
1,095 |
|
|
2018 |
|
|
1,025 |
|
|
2019 |
|
|
889 |
|
|
2020 |
|
|
750 |
|
|
2021 |
|
|
750 |
|
|
|
|
$ |
4,509 |
|
Future Royalty Obligations
At December 31, 2016, our future obligations for royalty advances, minimum royalty guarantees and exclusive distribution fee guarantees under the terms of our existing licenses and exclusive distribution agreements that have an off balance sheet commitment total $7.9 million. To the extent payment is not due until delivery has occurred, these commitments will be recognized in 2017 upon the earlier of payment or upon delivery of content by the content supplier.
Legal Proceedings
In the normal course of business, we are subject to proceedings, lawsuits and other claims, including proceedings under government laws and regulations relating to content ownership and copyright matters. While it is not possible to predict the outcome of these matters, it is the opinion of management, based on consultations with legal counsel, that the ultimate disposition of known proceedings will not have a material adverse impact on our financial position, results of operations or liquidity.
|
NOTE 22. |
RELATED PARTY TRANSACTIONS |
Equity Investments in Affiliate
We charged ACL overhead and personnel costs for the years ended December 31, 2016 and 2015, of approximately $0.1 million and $1.0 million, respectively. Amounts were recorded as a reduction in general and administrative expenses in the accompanying consolidated statements of operations. During 2015, ACL began incurring most of their personnel and related support costs directly opposed to these costs being incurred by us and then charged to ACL.
ACL paid dividends to RLJE Ltd. of $3.3 million and $3.3 million during the years ended December 31, 2016 and 2015, respectively. Dividends received were recorded as a reduction to the ACL investment account.
During 2016 and 2015, we paid ACL $0.7 million and $2.7 million, respectively, for the distribution rights to three titles, two of which have been released as of December 31, 2016 and one title which will be released in 2017. As we recognize revenues from these titles, and all other titles, we amortize our content advances resulting in the recognition of content amortization and royalty expense. During 2016 and 2015, content amortization and royalty expense recognized for these titles was $0.5 million and $1.3 million, respectively. As of December 31, 2016 and 2015, our remaining unamortized content advances for these titles are $1.7 million and $1.5 million, respectively.
Foreign Currency
We recognize foreign currency gains and losses, as a component of other expense, on amounts lent by Acorn Media to AME and RLJE Australia. As of December 31, 2016, Acorn Media had lent its U.K. subsidiaries approximately $7.3 million and its Australian subsidiary approximately $3.2 million. Amounts lent will be repaid in U.S. dollars based on available cash. Movement in exchange rates between the U.S. dollar and the functional currencies (which are the British Pound Sterling and the Australian dollar) of those subsidiaries that were lent the monies will result in foreign currency gains and losses. During the years ended December 31, 2016 and 2015, we recognized foreign currency losses of $1.5 million and $1.1 million, respectively.
83
The RLJ Companies, LLC
On June 27, 2013, The RLJ Companies, LLC (whose sole manager and voting member is the chairman of our board of directors) purchased from one of our vendors $3.5 million of contract obligations that we owed to the vendor. These obligations were payable by us to the vendor through September 5, 2013. Pursuant to the purchase, The RLJ Companies, LLC has become the account creditor with respect to these accounts. These accounts have not been otherwise modified. These purchased liabilities are included in accrued royalties and distribution fees in the accompanying consolidated balance sheets as of December 31, 2016 and 2015.
Sale of Preferred Stock and Warrants
On May 20, 2015, certain former board members and their affiliate companies, including RLJ SPAC Acquisition, LLC which is owned by the chairman of our board of directors, purchased 16,500 shares of preferred stock and warrants to acquire 1.7 million shares of common stock from us for $16.5 million.
|
NOTE 23. |
SUBSEQUENT EVENT |
First Amendment to Credit and Guaranty Agreement
On January 30, 2017, we amended the AMC Credit Agreement and borrowed and additional $8.0 million (see Note 10, Debt). We used the proceeds to repay our subordinated term notes.
Stock-Based Compensation
On March 13, 2017, the Compensation Committee, subject to the receipt of subsequent shareholder approval, approved the award to our chief executive officer of a stock-based compensation package consisting of the following:
|
|
• |
an option to purchase 700,000 shares of common stock with an exercise price of $2.3999 per share vesting in two years, |
|
|
• |
an option to purchase 700,000 shares of common stock with an exercise price of $3.00 per share vesting in four years, |
|
|
• |
300,000 restricted stock units vesting in four equal annual installments, and |
|
|
• |
performance-based stock units with a target award of 500,000 shares of common stock, but no more than 1,000,000 shares, vesting according to specified financial performance criteria and upon confirmation by the Compensation Committee of the satisfaction of such performance criteria based upon our audited financial statements for 2017, 2018, 2019 and 2020. |
Stock compensation expense for the options and performance-based stock units will be calculated using the Black-Scholes model, and stock compensation expense for the restricted stock units will be calculated based upon the last closing price of the common stock on the date of grant.
84
None.
Disclosure Controls and Procedures
We maintain disclosure controls and procedures that are designed to ensure that information required to be disclosed in the reports that we file or submit under the Securities Exchange Act of 1934, as amended (or Exchange Act), is recorded, processed, summarized and reported within the time periods specified in the SEC’s rules and forms, and that such information is accumulated and communicated to our management, including our principal executive and principal financial officers, or persons performing similar functions, as appropriate to allow timely decisions regarding required disclosure. We periodically review the design and effectiveness of our disclosure controls and internal control over financial reporting. We make modifications to improve the design and effectiveness of our disclosure controls and internal control structure, and may take other corrective action, if our reviews identify a need for such modifications or actions.
As of the end of the period covered by this Annual Report on Form 10-K for the year ended December 31, 2016 (or Annual Report), we evaluated, under the supervision and with the participation of our Chief Executive Officer and Chief Accounting Officer, the effectiveness of our disclosure controls and procedures. Based on that evaluation, our Chief Executive Officer and our Chief Accounting Officer have concluded that our disclosure controls and procedures were effective as of the end of the period covered by this Annual Report.
Internal Control Over Financial Reporting
Management’s Annual Report on Internal Control Over Financial Reporting
Our management is responsible for establishing and maintaining adequate internal control over financial reporting for our Company. Our internal control over financial reporting is a process designed to provide reasonable assurance regarding the reliability of our financial reporting and the preparation of financial statements for external purposes in accordance with United States generally accepted accounting principles. Internal control over financial reporting includes policies and procedures that:
|
|
• |
Concern the maintenance of records that, in reasonable detail, accurately and fairly reflect the transactions and dispositions of our assets; |
|
|
• |
Provide reasonable assurance that (a) transactions are recorded as necessary to permit preparation of financial statements in accordance with generally accepted accounting principles and (b) that our receipts and expenditures are being recorded and made only in accordance with management’s authorizations; and |
|
|
• |
Provide reasonable assurance regarding prevention or timely detection of unauthorized acquisition, use or disposition of our assets. |
A control system, no matter how well designed and operated, can provide only reasonable, not absolute, assurance that the objectives of the control system are met. Because of the inherent limitations, internal controls over financial reporting may not prevent or detect misstatements. Projections of any evaluation of the effectiveness of internal control over financial reporting to future periods are subject to the risks that controls may become inadequate because of changes in conditions, or that the degree of compliance with the policies or procedures may deteriorate.
Management conducted an evaluation of the effectiveness of our internal control over financial reporting at December 31, 2016. In conducting this evaluation, management used the criteria set forth by the Committee of Sponsoring Organizations of the Treadway Commission in Internal Control—Integrated Framework– 2013. A material weakness is defined as, “a deficiency, or combination of deficiencies, in internal control over financial reporting (“ICFR”) such that there is a reasonable possibility that a material misstatement of the registrant’s annual or interim financial statements will not be prevented or detected on a timely basis.” A significant deficiency is, “a deficiency or a combination of deficiencies, in internal control over financial reporting that is less severe than a material weakness, yet important enough to merit attention by those responsible for oversight of the registrant’s financial reporting.”
Management had previously concluded that we had two material weaknesses since we failed to maintain an effective control environment and monitoring activities as a result of (1) an ineffective design of the process level controls associated with the review of content ultimates and (2) a failure to design or maintain effective process level controls over certain reconciliations and
85
management review. These two material weaknesses that were previously disclosed as of December 31, 2015 were remediated as of December 31, 2016. See “Item 9A. Controls and Procedures — Management’s Annual Report on Internal Control over Financial Reporting” contained in our annual report on Form 10-K for the fiscal year ended December 31, 2015 and “Item 4. Controls and Procedures” contained in the our subsequent quarterly reports on Form 10-Q during 2016, for disclosure of information about the material weaknesses that were reported as a result of our annual assessment as of December 31, 2015 and our remediation efforts of those material weaknesses. As disclosed in the quarterly reports on Form 10-Q for the first three quarters of 2016, we have implemented and executed our remediation plan. As disclosed in the quarterly report on Form 10-Q for the quarter ended September 30, 2016, we had begun to test the effectiveness of the control changes made. As of December 31, 2016 we completed our testing of effectiveness and have concluded that our material weaknesses were remediated.
This Annual Report does not include an attestation report of our registered public accounting firm regarding internal control over financial reporting. Management's report was not subject to attestation by our registered public accounting firm pursuant to rules that permit us to provide only management's report in this Annual Report.
Changes in Internal Control over Financial Reporting
Except for the remediation of material weaknesses discussed above, there has been no change in our internal control over financial reporting identified in connection with the evaluation required by Exchange Act Rules 13a-15(d) and 15d-15 that occurred during the fourth quarter period covered by this annual report that has materially affected, or is reasonably likely to materially affect, our internal control over financial reporting.
None.
86
Board Composition
As of March 15, 2017, our board of directors (or Board) was comprised of nine members as set forth in the table below. Each director elected holds office for a three-year term, until a successor is duly elected and qualified or until his earlier death, resignation or removal from office.
|
Name |
|
Director Since |
|
Age |
|
Principal Occupation and Business Experience During Past Five Years and Other Directorships |
|
|
|
|
|
|
|
|
|
Robert L. Johnson |
|
2012 |
|
70 |
|
Mr. Johnson was appointed as the Company’s chairman in October 2012. From November 2010 to October 2012, Mr. Johnson served as the chairman of the board of RLJ Acquisition, Inc., a special purpose acquisition company that created the Company. Mr. Johnson founded The RLJ Companies, an innovative business network that owns or holds interests in a diverse portfolio of companies in businesses operating in hotel real estate investment; private equity; financial services; asset management; automobile dealerships; sports and entertainment; and video lottery terminal (or VLT) gaming, and has served as its chairman since February 2003. Prior to forming The RLJ Companies, Mr. Johnson was founder and chief executive officer of Black Entertainment Television (or BET), which was acquired by Viacom Inc. in 2001. He continued to serve as chief executive officer of BET until February 2006. In July 2007, Mr. Johnson was named by USA Today as one of the “25 most influential business leaders of the past 25 years.” Mr. Johnson currently serves on the boards of directors of RLJ Lodging Trust (NYSE: RLJ), KB Home (NYSE: KBH), Lowe’s Companies, Inc. (NYSE: LOW) and Retirement Clearinghouse, LLC. He previously served as a director of Hilton Hotels Corporation, US Airways Group, Inc., General Mills, Inc. and IMG Worldwide, Inc., and a member of the board of trustees at The Johns Hopkins University. |
|
|
|
|
|
|
|
|
|
Miguel Penella |
|
2012 |
|
48 |
|
Mr. Penella was appointed as the Company’s Chief Executive Officer on January 18, 2013. From October 2012 until January 18, 2013, Mr. Penella served as Chief Operating Officer. Mr. Penella has served as a director of the Company since October 2012. From April 2007 to October 2012, Mr. Penella served as chief executive officer of Acorn Media Group, Inc., which was acquired by the Company in October 2012, where he oversaw operations and was the driving force behind the worldwide expansion of the Acorn brand, including the acquisition of 64% of Agatha Christie Limited and the launch of Acorn TV, the Company’s first proprietary subscription VOD channel (or SVOD). From 2004 to April of 2007, Mr. Penella was president of Acorn’s direct-to-consumer operations offering DVDs and other high quality products through catalogs and online marketing vehicles. Under his leadership, Acorn Media was transformed from a DVD distributor into a media company with a significant library of television dramas and mysteries, including intellectual property rights, and a nascent proprietary SVOD business. Mr. Penella came to Acorn from Time-Life where he rose in the ranks from circulation director of the catalog department to director of catalogs for the music division and then to vice president of customer marketing in 2001. Previously, he worked in catalog management for the National Direct Marketing Corporation and the National Wildlife Federation. |
87
|
Name |
|
Director Since |
|
Age |
|
Principal Occupation and Business Experience During Past Five Years and Other Directorships |
|
|
|
|
|
|
|
|
|
Tyrone Brown |
|
2012 |
|
74 |
|
Mr. Brown has served as a member of the Board since October 2012. Mr. Brown is a self-employed attorney. Since January 2014, Mr. Brown has served as Consulting Counsel at Wiley Rein, a Washington, DC law firm where he consults with the firm's clients on media and telecommunications matters. Mr. Brown was an initial investor and director in the successful re-launch after bankruptcy of IRIDIUM, the global mobile satellite system, serving as IRIDIUM’s vice chairman from January 2002 until a successful public offering in October 2009. Previously, he was the co-founder of District Cablevision, the DC cable television system, where he was president and a director from 1986 to February 1992. Mr. Brown also served as a director and principal outside counsel of Black Entertainment Television (or BET) until its successful public offering in 1991, and vice president and general counsel of Post-Newsweek Stations, the broadcast station subsidiary of the Washington Post Company, from 1971 to 1974. In addition to his entrepreneurial and business activities, Mr. Brown has practiced communications law at a number of major DC law firms and served as a law clerk for the late Chief Justice of the Supreme Court Earl Warren, as an aide to Senator Edmund Muskie and as an FCC Commissioner under the Carter Administration. |
|
|
|
|
|
|
|
|
|
Andor (Andy) M. Laszlo |
|
2012 |
|
50 |
|
Mr. Laszlo has served as a member of the Board since October 2012. Mr. Laszlo joined Sun Trust Robinson Humphrey in January 2014 where he serves as Managing Director and Head of Technology, Media & Communications Equity Origination. Mr. Laszlo served as a Managing Director at Lazard Capital Markets LLC (or LCM) from June 2010 to December 2013, where he served as Head of Corporate Underwriting and Head of Business Development. Prior to joining LCM, Mr. Laszlo served as a Senior Advisor to Sports Properties Acquisition Corp., a special purpose acquisition company focused on the sports, leisure and entertainment sectors, from November 2007 to April 2010. Between 1997 and 2007, Mr. Laszlo held various senior equity capital markets positions at both Lehman Brothers and Bank of America Securities. Mr. Laszlo was the Head of Media & Telecom equity capital markets for Bank of America Securities based in New York, NY. Prior to that, Mr. Laszlo was Head of Equity Syndicate and Head of Media & Telecom Equity Capital Markets at Lehman Brothers International (Europe), during which time he was based in London, England. In between his tenure at Lehman Brothers and Bank of America, Mr. Laszlo spent approximately one year as the Chief Operating Officer and Head of Business Development at Eagle Rock Capital Management, LLC, a New York-based multi-strategy hedge fund. Mr. Laszlo has been involved in transactions totaling more than $50 billion of equity issuance over the course of his career. Mr. Laszlo serves on the Advisory Board of Falconhead Capital Management, a private equity firm based in New York City. Previously, he served on the board of directors of Rita’s Franchise Company, a leading franchise company focused on frozen treats. Mr. Laszlo also previously served on the board of directors of Radar Detection Holdings Corp. (or Escort Radar), a leading designer, manufacturer and distributor of highway radar and laser detectors. Mr. Laszlo began his career as an attorney with Philadelphia, Pennsylvania-based Rawle & Henderson. |
|
|
|
|
|
|
|
|
88
Pursuant to the terms of the outstanding Preferred Stock, Wolverine, the holder of Series C-1 Preferred Stock designated John Ziegelman as a director, and Sudbury, the holder of Series C-2 Preferred Stock designated Dayton Judd as a director. Pursuant to the terms of the Investment Agreement with AMC Networks, Inc. (or AMC), AMC is entitled to designate two director nominees, and in connection with the closing under the AMC Transaction, AMC designated John Hsu and Arlene Manos, and the Board appointed
89
them to be members of the Board. Pursuant to a voting agreement between AMC and RLJ SPAC Acquisition LLC, Miguel Penella, Tyrone Brown, Dayton Judd, JH Evergreen Management, LLC, Sudbury Capital Fund, LP, Peter Edwards, Morris Goldfarb and certain other stockholders, who in the aggregate then held approximately 47% of the outstanding common stock, the stockholders party to this agreement agreed to vote their shares to elect AMC’s nominees to the Board until the earlier of the termination of the Investment Agreement or AMC is no longer a stockholder of the Company.
Executive Officers
The following table sets forth the name, age and position of each of our executive officers as of March 15, 2017.
|
Name |
|
Age |
|
Position |
|
Miguel Penella |
|
48 |
|
Chief Executive Officer |
|
Nazir Rostom |
|
41 |
|
Chief Financial Officer |
Biographical information for Mr. Penella is set forth above under “Board Composition.”
Mr. Rostom was appointed as the Company’s Chief Financial Officer in May 2016. From January 2014 to May 2016, Mr. Rostom served in senior and executive positions with GetWellNetwork, Inc. (or GWN), a healthcare solutions provider. He was GWN’s Vice President, Financial Planning and Analysis from January 2014 to February 2015, Acting Chief Financial Officer from March 2015 to September 2015 and was Vice President, Finance from October 2015 to May 2016. During his tenure, Mr. Rostom led various strategic financing, M&A activities, and financial planning and analysis at GWN. Prior to GWN, he was Director of Finance and Assistant Treasurer for GTT Communications, Inc. (or GTT, formerly Global Telecom and Technology, Inc.), from September 2011 to January 2014. Previous to GTT, Mr. Rostom led various structured financing deals in the capital markets at National Rural Utilities Electric Cooperative Finance Corporation and CapitalSource, Inc. Mr. Rostom began his career in investment banking at PriceWaterhouseCoopers, Securities LLC. Mr. Rostom is a Certified Public Accountant and a CFA Charterholder. He holds a MBA from Duke University and a Bachelor of Science in Business Administration from Georgetown University.
Section 16(a) Beneficial Ownership Reporting Compliance
Section 16(a) of the Securities Exchange Act requires RLJE’s directors, executive officers and the beneficial holders of more than 10% of a registered class of RLJE’s equity securities to file initial reports of ownership and changes in ownership of common stock and other equity securities of RLJE with the Securities and Exchange Commission (or SEC). Based solely on a review of copies of reports filed with the SEC and written representations by certain officers and directors, we believe that all of our officers, directors and stockholders subject to the reporting requirements of Section 16(a) filed all of their reports related to non-exempt transactions on a timely basis during the fiscal year ended December 31, 2016, except for one Form 4 for Mr. Penella, reporting one transaction, and one Form 4 for Mr. Nunis, reporting two transactions. We also believe these persons filed all of their reports related to exempt transactions on a timely basis with respect to the fiscal year ended December 31, 2016.
Code of Ethics and Governance Guidelines
We have a Code of Ethics and Business Conduct Policy that applies to all of our employees, including our principal executive officer and principal financial and accounting officer, and to our directors. We have posted the Code of Ethics and Business Conduct Policy under the menu “Investors – Corporate Governance” on our website at www.rljentertainment.com. If we waive any material portion of our Code of Ethics and Business Conduct Policy that applies to our principal executive officer or principal financial and accounting officer or amend the Code of Ethics and Business Conduct Policy (other than technical, administrative or other non-substantive amendments), we will disclose that fact on our website at www.rljentertainment.com within four business days.
Board Independence.
A discussion regarding Board independence is included in Item 13 below.
Committees of the Board
Audit Committee. The Company has an Audit Committee comprised of Messrs. Judd, Royster, and Laszlo (Chairman). The Board has determined that Messrs. Judd, Royster, and Laszlo are independent as that term is used in NASDAQ Marketplace Rule 5605 and in Rule 10A-3(b)(1) under the Securities Exchange Act of 1934 and that Mr. Royster is an “audit committee financial expert,” as that term is defined in Item 407(d)(5)(ii) of Regulation S-K.
90
Compensation Committee. The Company has a Compensation Committee comprised of Messrs. Brown (Chairman), Hsu, Laszlo, and Ziegelman and Ms. Manos, with Mr. Hsu and Ms. Manos appointed effective November 8, 2016. The Board has determined that Messrs. Brown, Hsu, Laszlo, and Ziegelman and Ms. Manos are independent as that term is used in NASDAQ Marketplace Rule 5605.
Nominations and Governance Committee. The entire Board acted as the Nominations and Governance Committee until November 8, 2016 when the Nominations and Governance Committee was revised to be composed of Ms. Manos and Messrs. Brown, Hsu, Judd, Laszlo, Ziegelman, and Royster (Chairman). The Board has determined that Ms. Manos and Messrs. Brown, Hsu, Judd, Laszlo, Ziegelman, and Royster are independent as that term is used in NASDAQ Marketplace Rule 5605.
91
Summary Compensation Table for Fiscal Year 2016
The following table sets forth the compensation of those persons who served as our principal executive officer, principal financial officer and our other executive officers (collectively, the Named Executive Officers) for the fiscal year ended on December 31, 2016.
|
Name & Principal Position |
|
Fiscal Year |
|
Salary ($) |
|
|
Bonus ($) |
|
|
Stock Awards ($) |
|
|
Option Awards ($) |
|
|
All Other Compensation ($) |
|
|
Total ($) |
|
||||||
|
Miguel Penella |
|
2016 |
|
$ |
515,000 |
|
|
$ |
50,000 |
|
|
$ |
176,302 |
|
|
$ |
— |
|
|
$ |
6,667 |
|
|
$ |
747,969 |
|
|
Chief Executive Officer |
|
2015 |
|
|
500,000 |
|
|
|
— |
|
|
|
198,806 |
|
|
|
— |
|
|
|
8,744 |
|
|
|
707,550 |
|
|
|
|
|
|
|
|
|
|
|
|
|
|
|
|
|
|
|
|
|
|
|
|
|
|
|
|
|
|
Nazir Rostom(3) |
|
2016 |
|
|
170,993 |
|
|
|
— |
|
|
|
64,001 |
|
|
|
— |
|
|
|
5,500 |
|
|
|
240,494 |
|
|
Chief Financial Officer |
|
|
|
|
|
|
|
|
|
|
|
|
|
|
|
|
|
|
|
|
|
|
|
|
|
|
|
|
|
|
|
|
|
|
|
|
|
|
|
|
|
|
|
|
|
|
|
|
|
|
|
|
|
|
|
Mark Nunis(3) |
|
2016 |
|
|
283,388 |
|
|
|
— |
|
|
|
4,800 |
|
|
|
— |
|
|
|
9,133 |
|
|
|
297,321 |
|
|
Chief Accounting Officer |
|
2015 |
|
|
274,587 |
|
|
|
— |
|
|
|
56,012 |
|
|
|
— |
|
|
|
10,400 |
|
|
|
340,999 |
|
|
(1) |
Fiscal year 2016 includes restricted stock awards of 91,824 shares for Mr. Penella and 33,334 shares for Mr. Rostom, and a restricted stock units award of 2,500 shares for Mr. Nunis, each vesting in three equal installments on March 31, 2017, 2018 and 2019. The amounts shown represent the total grant date fair value of the grant computed in accordance with FASB ASC Topic 718. |
Fiscal year 2015 includes restricted stock award grants of 289,341 shares for Mr. Penella and 81,520 shares for Mr. Nunis vesting in two equal installments on April 1, 2016 and October 1, 2016. The amounts shown represent the total grant date fair value of the grant computed in accordance with FASB ASC Topic 718.
|
(2) |
Fiscal year 2016 includes: |
|
|
(i) |
For Mr. Penella, Company 401(k) match of $6,667. |
|
|
(ii) |
For Mr. Rostom, Company 401(k) match of $5,500. |
|
|
(iii) |
For Mr. Nunis, Company 401(k) match of $9,133. |
Fiscal year 2015 includes:
|
|
(i) |
For Mr. Penella, Company 401(k) match of $8,744. |
|
|
(ii) |
For Mr. Nunis, Company 401(k) match of $10,400. |
|
(3) |
Mr. Rostom was employed for part of 2016, beginning May 18, 2016. When Mr. Rostom joined the Company, he replaced Mr. Nunis as the Company’s Principal Financial and Accounting Officer. |
Employment Agreements
We have entered into employment agreements with Messrs. Penella and Rostom.
Agreement with Mr. Penella
The agreement with Mr. Penella was effective as of July 18, 2013. Certain terms of the agreement are summarized below.
Term. Mr. Penella’s agreement provides that he will serve the Company as an employee under the terms of the agreement until terminated.
Base Compensation. The agreement provides for minimum annual base salary of $500,000, subject to any increase as determined by the Board.
Cash Bonus Opportunity. Mr. Penella has an opportunity to earn an annual bonus, based on achieving certain corporate performance levels to be established by the Board. The annual bonus is set by the Board annually by March 31, and the annual bonus amount, subject to achieving the applicable performance levels, will not be less than $250,000. The annual bonus is subject to the
92
Company achieving 97% of the earnings before income tax, depreciation, amortization, cash investment in content, interest expense, transaction and severance costs, warrants and stock-based compensation (or Adjusted EBITDA) or revenue targets proposed by management and approved and adopted by the Board, in its sole discretion.
Stock Grant. Mr. Penella was awarded 128,756 shares of restricted stock, with 64,378 shares vesting on March 1, 2014, 32,189 shares vesting on January 1, 2015 and 32,189 shares vesting on January 1, 2016. One-half of the shares subject to vesting on each of these dates were subject to an additional condition of the Company achieving 97% of the Adjusted EBITDA or revenue targets proposed by management and approved and adopted by the Board, in its sole discretion, for 2013, 2014 and 2015. These targets were not satisfied and the performance based shares for each of the above vest dates were forfeited.
Benefits. Mr. Penella is entitled to certain insurance, fringe and leave benefits generally available to senior executives of the Company. The agreement requires Mr. Penella to protect the confidentiality of the Company’s confidential information. It further provides that for one year after termination he will not engage in any business which is substantially similar to the Company’s business and that for two years after termination he will not seek to solicit or hire the Company’s employees.
Severance Benefits. The Company may terminate Mr. Penella’s employment for cause, without cause or upon death or disability, and Mr. Penella may terminate his employment for good reason or without cause. If Mr. Penella’s employment is terminated by the Company without cause (other than upon death or disability) or Mr. Penella terminate his employment for good reason, he would be entitled to receive, for 12 months following termination (the severance period), his base salary as in effect immediately prior to termination and a pro rata annual bonus based upon the Company’s performance for the year in which termination occurs, if 97% of the performance target levels are met. In addition, his benefits would continue for the severance period. Under the agreement, “cause” includes (a) material dishonesty, theft, misrepresentation, deceit or fraud, (b) negligence or insubordination (subject to certain rights of cure), (c) conviction for, or plea of nolo contendere to, a charge or commission of a felony or (d) material breach of the confidentiality, non-competition or non-solicitation provisions of the agreement (subject to certain rights of cure) and “good reason” includes (a) material diminution of Mr. Penella’s duties or responsibilities, (subject in either case to certain rights of cure), (b) a material breach by the Company of the agreement (subject to certain rights of cure) and (c) requiring Mr. Penella to relocate to an office on a regular basis that is more than 50 miles from the Company’s current principal executive offices.
Agreement with Mr. Rostom
The agreement with Mr. Rostom was effective as of May 18, 2016. Certain terms of the agreement are summarized below.
Term. Mr. Rostom’s agreement provides that he will serve the Company as an employee under the terms of the agreement until terminated.
Base Compensation. The agreement provides for minimum annual base salary of $275,000, subject to any increase as determined by the Board.
Cash Bonus Opportunity. Mr. Rostom has an opportunity to earn an annual bonus, based on achieving certain corporate performance levels to be established by the Board. The annual bonus is set by the Board annually by March 31, and the annual bonus amount, subject to achieving the applicable performance levels, will not be less than $68,750. The annual bonus is subject to the Company achieving 97% of the earnings before income tax, depreciation, amortization, cash investment in content, interest expense, transaction and severance costs, warrants and stock-based compensation (or Adjusted EBITDA) or revenue targets proposed by management and approved and adopted by the Board, in its sole discretion.
Stock Grant. Mr. Rostom was awarded 33,334 shares of restricted stock, with 11,111 shares vesting on March 31, 2017, 11,111 shares vesting on March 31, 2018 and 11,112 shares vesting on March 31, 2019.
Benefits. Mr. Rostom is entitled to certain insurance, fringe and leave benefits generally available to senior executives of the Company. The agreement requires Mr. Rostom to protect the confidentiality of the Company’s confidential information. It further provides that for one year after termination he will not engage in any business which is substantially similar to the Company’s business and that for two years after termination he will not seek to solicit or hire the Company’s employees.
Severance Benefits. The Company may terminate Mr. Rostom’s employment for cause, without cause or upon death or disability, and Mr. Rostom may terminate his employment for good reason or without cause. If Mr. Rostom’s employment is terminated by the Company without cause (other than upon death or disability) or Mr. Rostom terminate his employment for good reason, he would be entitled to receive, for 12 months following termination (the severance period), his base salary as in effect immediately prior to termination and a pro rata annual bonus based upon the Company’s performance for the year in which termination occurs, if 97% of the performance target levels are met. In addition, his benefits would continue for the severance period.
93
Under the agreement, “cause” includes (a) material dishonesty, theft, misrepresentation, deceit or fraud, (b) negligence or insubordination (subject to certain rights of cure), (c) conviction for, or plea of nolo contendere to, a charge or commission of a felony or (d) material breach of the confidentiality, non-competition or non-solicitation provisions of the agreement (subject to certain rights of cure) and “good reason” includes (a) material diminution of Mr. Rostom’s duties or responsibilities, (subject in either case to certain rights of cure), (b) a material breach by the Company of the agreement (subject to certain rights of cure) and (c) requiring Mr. Rostom to relocate to an office on a regular basis that is more than 50 miles from the Company’s current principal executive offices.
Outstanding Equity Awards at Fiscal Year End 2016
The following table includes all outstanding equity awards at December 31, 2016.
|
|
|
Option Awards |
|
|
Stock Awards |
|
||||||||||||||||||||||||||||||
|
Name |
|
Number of securities underlying unexercised options (#) exercisable |
|
|
Number of securities underlying exercised options (#) unexercisable |
|
|
Equity incentive plan awards: Number of securities underlying unexercised unearned options |
|
|
Option exercise price ($) |
|
|
Option exercise date |
|
|
Number of shares or units of stock that have not vested (#) |
|
|
Market value of shares or units of stock that have not vested ($) |
|
|
Equity incentive plan awards: Number of unearned shares, units or other rights that have not vested (#) |
|
|
Equity incentive plan awards: Market or payout value of unearned shares, units or other rights that have not vested ($) (1) |
|
|||||||||
|
Miguel Penella |
|
|
— |
|
|
|
— |
|
|
|
— |
|
|
$ |
— |
|
|
|
— |
|
|
|
— |
|
|
$ |
— |
|
|
|
91,824 |
|
|
$ |
146,918 |
|
|
Nazir Rostom |
|
|
— |
|
|
|
— |
|
|
|
— |
|
|
|
— |
|
|
|
— |
|
|
|
— |
|
|
|
— |
|
|
|
33,334 |
|
|
|
53,334 |
|
|
Mark Nunis |
|
|
— |
|
|
|
— |
|
|
|
— |
|
|
|
— |
|
|
|
— |
|
|
|
— |
|
|
|
— |
|
|
|
2,500 |
|
|
|
4,000 |
|
|
|
(1) |
The value of unearned shares is based upon the closing stock price at December 30, 2016 of $1.60 per share. |
Director Compensation
The non-employee members of our Board, Tyrone Brown, Dayton Judd, Andor (Andy) M. Laszlo, and Scott Royster receive an annual retainer of $50,000, paid quarterly, and an annual restricted stock award valued at $50,000. Arlene Manos, John Hsu and John Ziegelman have waived this compensation. In addition, the non-employee directors are reimbursed for reasonable travel expenses to attend Board or committee meetings. Employee directors receive no additional compensation for their service as directors.
For fiscal year 2016, each of our non-employee directors was each granted a restricted stock award, valued at $50,000, for 22,956 shares of common stock, based upon the five-day volume weighted average stock price of $2.1781 per share. The restricted stock awards were granted under our 2012 Incentive Compensation Plan on August 1, 2016 and vest 100% on July 31, 2017, provided the recipient continues to serve as a director.
94
Director Compensation Table for Fiscal Year 2016
The following table sets forth information regarding the compensation earned by our non-employee directors in fiscal year 2016:
|
Name |
|
Fees Earned or Paid in Cash ($) (1) |
|
|
Stock Awards ($) (2) |
|
|
Option Awards ($) |
|
|
All Other Compensation ($) |
|
|
Total ($) |
|
|||||
|
Tyrone Brown |
|
$ |
50,000 |
|
|
$ |
44,076 |
|
|
$ |
— |
|
|
$ |
— |
|
|
$ |
94,076 |
|
|
Robert L. Johnson |
|
|
250,000 |
|
|
|
— |
|
|
|
— |
|
|
|
— |
|
|
|
250,000 |
|
|
Dayton Judd |
|
|
50,000 |
|
|
|
44,076 |
|
|
|
— |
|
|
|
— |
|
|
|
94,076 |
|
|
Andor (Andy) M. Laszlo |
|
|
50,000 |
|
|
|
44,076 |
|
|
|
— |
|
|
|
— |
|
|
|
94,076 |
|
|
Scott Royster |
|
|
50,000 |
|
|
|
44,076 |
|
|
|
— |
|
|
|
— |
|
|
|
94,076 |
|
|
John Ziegelman |
|
|
— |
|
|
|
— |
|
|
|
— |
|
|
|
— |
|
|
|
— |
|
|
|
(1) |
For independent directors, represents retainer fee paid quarterly. For Mr. Johnson, represents compensation for non-executive chairman services. |
|
|
(2) |
Amount represents the grant date fair value for restricted stock awards granted during fiscal year 2016. The per share grant date fair value of each of the restricted stock awards for 22,956 shares was $1.92. As of fiscal year end 2016, these shares had not vested. |
95
|
ITEM 12. |
SECURITY OWNERSHIP OF CERTAIN BENEFICIAL OWNERS AND MANAGEMENT AND RELATED STOCKHOLDER MATTERS |
The following table sets forth certain information as of March 15, 2017, with respect to the beneficial ownership of shares of our common stock owned by (i) each person, who, to our knowledge based on Schedules 13D or 13G or other reports filed with the SEC, is the beneficial owner of more than 5% of our outstanding common stock, (ii) each person who is a director, (iii) each Named Executive Officer, and (iv) all of our directors and executive officers as a group.
|
Name of Beneficial Owner |
|
Shares of Common Stock Beneficially Owned (1) |
|
|
Percent of Common Stock (2) |
|
||
|
AMC Networks, Inc. (3) |
|
|
20,102,501 |
|
|
|
79.32 |
% |
|
RLJ SPAC Acquisition, LLC (4) |
|
|
9,442,820 |
|
|
|
67.95 |
% |
|
Robert L. Johnson (4) |
|
|
9,442,820 |
|
|
|
67.95 |
% |
|
JH Evergreen Management, LLC (5) |
|
|
4,353,700 |
|
|
|
59.45 |
% |
|
Wolverine Asset Management, LLC (6) |
|
|
533,724 |
|
|
|
9.99 |
% |
|
Sudbury Capital Fund, LP (7) |
|
|
1,265,448 |
|
|
|
19.86 |
% |
|
Dayton Judd (8) |
|
|
1,307,744 |
|
|
|
20.65 |
% |
|
Peter Edwards (9) |
|
|
658,351 |
|
|
|
11.37 |
% |
|
Morris Goldfarb (10) |
|
|
581,708 |
|
|
|
9.92 |
% |
|
Drawbridge Special Opportunities Fund LP (11) |
|
|
333,334 |
|
|
|
5.87 |
% |
|
GAMCO Investors, Inc. (12) |
|
|
408,100 |
|
|
|
7.64 |
% |
|
Miguel Penella (13) |
|
|
241,614 |
|
|
|
4.51 |
% |
|
Andor (Andy) M. Laszlo (14) |
|
|
47,680 |
|
|
* |
|
|
|
Tyrone Brown (14) |
|
|
47,013 |
|
|
* |
|
|
|
Scott Royster (14) |
|
|
43,898 |
|
|
* |
|
|
|
Nazir Rostom (15) |
|
|
33,334 |
|
|
* |
|
|
|
Mark Nunis (16) |
|
|
13,873 |
|
|
* |
|
|
|
John Hsu |
|
— |
|
|
— |
|
||
|
Arlene Manos |
|
— |
|
|
— |
|
||
|
John Ziegelman |
|
— |
|
|
— |
|
||
|
All directors and executive officers as a group (8 persons) |
|
|
11,093,370 |
|
|
|
73.93 |
% |
|
* |
Less than 1% |
Notes to Beneficial Ownership Table:
|
(1) |
Beneficial ownership is determined in accordance with SEC rules. For the number of shares beneficially owned by those listed above, we rely on information reported by each beneficial owner. Except as indicated by footnote below, each person named reportedly has sole voting and investment powers with respect to the common stock beneficially owned by that person, subject to applicable community property and similar laws. Except as indicated by footnote below, each owner’s mailing address is c/o RLJ Entertainment, Inc., 8515 Georgia Avenue, Suite 650, Silver Spring, Maryland 20910. |
|
(3) |
Information presented regarding AMC Networks, Inc. (or AMC) is based on the Form 4 filed on January 4, 2017, Form 3 filed on October 18, 2016 and the Schedule 13D filed on October 18, 2016. The reporting persons include (i) AMC Networks Inc., a Delaware corporation (or AMC), (ii) Rainbow Media Holdings LLC, a Delaware limited liability company, (iii) Rainbow Media Enterprises, Inc., a Delaware corporation, (iv) Rainbow Programming Holdings LLC, a Delaware limited liability company, (v) IFC Entertainment Holdings LLC, a Delaware limited liability company, and (vi) Digital Entertainment Holdings LLC, a Delaware limited liability company (or DEH). DEH is a direct wholly-owned subsidiary of IFC Entertainment Holdings LLC. IFC Entertainment Holdings LLC is a direct wholly-owned subsidiary of Rainbow Programming Holdings LLC. Rainbow Programming Holdings LLC is a direct wholly-owned subsidiary of Rainbow Media Enterprises, Inc. Rainbow Media Enterprises, Inc. is a direct wholly-owned subsidiary of Rainbow Media Holdings, LLC. Rainbow Media Holdings, LLC is a |
96
|
direct wholly-owned subsidiary of AMC. Includes 102,501 shares of common stock, warrants expiring October 14, 2021 exercisable at $3 per share to purchase 5,000,000 shares of common stock, warrants expiring October 14, 2022 exercisable at $3 per share to purchase 10,000,000 shares of common stock, and warrants expiring October 14, 2023 exercisable at $3 per share to purchase 5,000,000 shares of common stock, however the exercise price and number of shares for the warrants are subject to adjustment from time to time in order to prevent dilution of the purchase rights granted under the warrants. The warrant expiring on October 14, 2023 provides that the number of shares subject to the warrant shall be increased to the extent necessary to ensure that upon the full exercise of the Warrant, DEH will hold at least 50.1% of the outstanding equity securities of RLJE on a fully diluted basis (less the number of shares previously issued to DEH (i) upon the exercise of the warrants expiring on October 14, 2021 and October 14, 2022 and (ii) as interest payments pursuant to a credit agreement, dated October 14, 2016, between DEH and RLJE. The mailing address for AMC is 11 Penn Plaza, New York, NY 10001. |
|
(4) |
The RLJ Companies, LLC is the sole manager and is the sole voting member of RLJ SPAC Acquisition, LLC. Robert L. Johnson is the sole manager and the sole voting member of The RLJ Companies, LLC (collectively RLJ). Mr. Johnson disclaims beneficial ownership of these shares except to the extent of his pecuniary interest therein. Includes 888,831 shares of common stock, warrants expiring October 3, 2017 exercisable at $36 per share to purchase 1,272,223 shares of common stock, warrants expiring May 20, 2020 exercisable at $3.00 per share to purchase 1,500,000 shares of common stock and 15,000 shares of Series D-2 Convertible Preferred Stock with a conversion price of $3 per share into 5,781,766 shares of common stock, including accrued dividends. The mailing address for RLJ is 3 Bethesda Metro Center, Suite 1000, Bethesda, Maryland 20814. |
|
(5) |
Information presented regarding JH Evergreen Management, LLC (or JH Evergreen Management) is based solely on the Form 4/A filed on May 26, 2015, Schedule 13D filed on June 11, 2015, Schedule 13G/A filed on February 13, 2015 and Schedule 13G initially filed on October 15, 2012. The reporting persons include (i) JH Evergreen Management, a Delaware limited liability company; (ii) JH Partners Evergreen Fund, L.P., a Delaware limited partnership (or JH Evergreen); (iii) JH Investment Partners III, LP, A Delaware limited partnership (or JHIP III); (iv) JH Investment Partners GP Fund III, LLC, a Delaware limited liability company (or JHIP GP III); (v) Forrestal, LLC, a Delaware limited liability company (or Forrestal); and (vi) John C. Hansen. Includes 678,093 shares of common stock, warrants expiring October 3, 2017 exercisable at $36 per share to purchase 44,706 shares of common stock, warrants expiring May 20, 2020 exercisable at $1.50 per share to purchase 747,945 shares of common stock and 7,479.432 shares of Series D-1 Convertible Preferred Stock with a conversion price of $3 per share into 2,882,956 shares of common stock, including accrued dividends. The mailing address of JH Evergreen Management and the other affiliated filers is 451 Jackson Street, San Francisco, California 94111-1615. Mr. Hansen disclaimed beneficial ownership of such shares except to the extent of his pecuniary interest therein. |
|
(6) |
Information presented regarding Wolverine Asset Management, LLC (or Wolverine) is based on the Schedule 13D filed on June 1, 2015, Schedule 13D/A filed on October 13, 2015 and Schedule 13D/A filed on October 19, 2016. The securities reported herein were purchased for the account of Wolverine Flagship Fund Trading Limited, a private investment fund managed by Wolverine. The reporting persons include (i) Wolverine, an Illinois limited liability company, (ii) Wolverine Holdings, L.P., an Illinois limited partnership, (iii) Wolverine Trading Partners, Inc., an Illinois corporation, (iv) Christopher L. Gust, and (v) Robert R. Bellick. The amount set forth as the beneficial ownership takes into account the Ownership Limitation (as defined below). Without such Ownership Limitation, Wolverine’s beneficial ownership would be 1,948,595, which includes warrants expiring October 3, 2017 exercisable at $36 per share to purchase 6,790 shares of common stock, warrants expiring May 20, 2020 exercisable at $1.50 per share to purchase 400,000 shares of common stock and 4,000 shares of Series C-1 Convertible Preferred Stock with a conversion price of $3 per share into 1,541,805 shares of common stock, including accrued dividends. The reporting persons are prohibited from converting any Series C-1 Convertible Preferred Stock or exercising certain warrants if as a result the reporting persons would beneficially own more than 9.99% of the outstanding common stock (the “Ownership Limitation”). The mailing address for Wolverine and the other affiliated filers is 175 West Jackson Blvd., Suites 200 and 340 Chicago, Illinois 60604. |
|
(7) |
Information presented regarding Sudbury Capital Fund, LP (or Sudbury) is based on the Schedule 13D/A filed on May 27, 2015 and Schedule 13D/A filed on January 19, 2017. The reporting persons include (i) Sudbury Capital Fund, LP, a Delaware limited partnership and pooled investment vehicle (or SCF); (ii) Sudbury Holdings, LLC a Delaware limited liability company (or SH); (iii) Sudbury Capital Management, LLC a Delaware limited liability company and the investment adviser (or SCM); (iv) Sudbury Capital GP, LP, a Delaware limited partnership and the general partner of the pooled investment vehicle (or SCGP) and (v) Dayton Judd, the Managing Member of SCM and Partner and Manager of SCGP (collectively the reporting persons). Includes 96,715 shares of common stock, warrants expiring October 3, 2017 exercisable at $36 per share to purchase 127,098 shares of common stock, warrants expiring May 20, 2020 exercisable at $1.50 per share to purchase 200,000 shares of common stock, 2,000 shares of Series C-2 Convertible Preferred Stock with a conversion price of $3 per share into 770,903 shares of common stock, including accrued dividends, and 183.506 shares of Series D-1 Convertible Preferred Stock with a conversion price of $3 per share into 70,733 shares of common stock, including accrued dividends. The mailing address for Sudbury and the other affiliated filers is 878 S. Denton Tap Road, Suite 220, Coppell, TX 75019. |
97
|
(8) |
Includes 42,296 shares of common stock, of which 22,956 are subject to restricted stock awards, and indirect ownership of Sudbury Capital Fund, LP. |
|
(9) |
Information presented regarding Peter Edwards is based on the information provided in the Schedule 13G filed on February 12, 2016 and Schedule 13G/A filed on February 10, 2017. The mailing address of Mr. Edwards is 7400 Meadow Lane, Chevy Chase, MD 20815. Includes 213,116 shares of common stock, warrants expiring October 3, 2017 exercisable at $36 per share to purchase 202,509 shares of the common stock, warrants expiring May 20, 2020 exercisable at $2.37 per share to purchase 50,000 shares of common stock and 500 shares of Series D-2 Convertible Preferred Stock with a conversion price of $3 per share into 192,726 shares of common stock, including accrued dividends. |
|
(10) |
Information presented regarding Morris Goldfarb is based on the information provided in the Schedule 13G filed on February 12, 2016 and Schedule 13G/A filed on February 10, 2017. The mailing address of Mr. Goldfarb is c/o G-III Apparel Group, Ltd., 512 7th Avenue, 35th Floor, New York, NY 10018. Includes 62,922 shares of common stock, warrants expiring October 3, 2017 exercisable at $36 per share to purchase 33,334 shares of common stock, warrants expiring May 20, 2020 exercisable at $2.37 per share to purchase 100,000 shares of common stock and 1,000 shares of Series D-2 Convertible Preferred Stock with a conversion price of $3 per share into 385,452 shares of common stock, including accrued dividends. |
|
(11) |
Information presented regarding Drawbridge Special Opportunities Fund LP is based solely on the Schedule 13G filed by Fortress Investment Group LLC on October 15, 2012 filed on behalf of (i) Drawbridge Special Opportunities Fund LP, a Delaware limited partnership, directly owns warrants to acquire shares of the common stock as described herein; (ii) Drawbridge Special Opportunities GP LLC, a Delaware limited liability company, is the general partner of Drawbridge Special Opportunities Fund LP; (iii) Fortress Principal Investment Holdings IV LLC, a Delaware limited liability company, is the managing member of Drawbridge Special Opportunities GP LLC; (iv) Drawbridge Special Opportunities Advisors LLC, a Delaware limited liability company, is the investment manager of Drawbridge Special Opportunities Fund LP; (v) FIG LLC, a Delaware limited liability company, is the holder of all of the issued and outstanding interests of Drawbridge Special Opportunities Advisors LLC; (vi) Fortress Operating Entity I LP, a Delaware limited partnership, is the holder of all of the issued and outstanding interests of FIG LLC and Fortress Principal Investment Holdings IV LLC; (vii) FIG Corp., a Delaware corporation, is the general partner of Fortress Operating Entity I LP; and (viii) Fortress Investment Group LLC, a Delaware limited liability company, is the holder of all of the issued and outstanding shares of FIG Corp. Includes warrants expiring October 3, 2017 exercisable at $36 per share to purchase 333,334 shares of common stock. The mailing address of Drawbridge Special Opportunities Fund LP and the other affiliated filers is c/o Fortress Investment Group LLC, 1345 Avenue of the Americas, 46th Floor, New York, New York 10105, Attention: Chief Compliance Officer. |
|
(12) |
Information presented regarding GAMCO Investors, Inc. (or GBL) is based solely on the information provided in the Schedule 13D filed on February 6, 2017, Schedule 13D/A filed on February 17, 2017 and Schedule 13-D/A filed on March 16, 2017 by Mario J. Gabelli and various entities which he directly or indirectly controls or for which he acts as chief investment officer, including (i) GAMCO Asset Management Inc. (or GAMCO), a wholly-owned subsidiary of GBL, an investment adviser registered under the Investment Advisers Act of 1940, as amended (or Advisers Act); (ii) Gabelli & Company Investment Advisers, Inc. (or GCIA), a wholly owned subsidiary of Associated Capital Group, Inc., is an investment adviser registered under the Advisers Act; and (iii) Teton Advisors, an investment adviser registered under the Advisers Act. Mario Gabelli is the controlling stockholder, Chief Executive Officer and a director of GGCP and Chairman and Chief Executive Officer of GBL. He is the Executive Chairman of AC. Mario Gabelli is also a member of GGCP Holdings. Mario Gabelli is the controlling shareholder of Teton. GAMCO is a New York corporation and GBL, AC, GCIA, and Teton Advisors are Delaware corporations, each having its principal business office at One Corporate Center, Rye, New York 10580. |
|
(13) |
Includes 230,405 shares of common stock, of which 91,824 are subject to restricted stock awards, and warrants expiring October 3, 2017 exercisable at $36 per share to purchase 11,209 shares of common stock. Does not include an option to purchase 700,00 shares of common stock with an exercise price of $2.3999 per share vesting in two years, an option to purchase 700,000 shares of common stock with an exercise price of $3.00 per share vesting in four years, 300,000 restricted stock units vesting in four equal annual installments and performance-based stock units with a target award of 500,000 shares of common stock, but no more than 1,000,000 shares, vesting according to specified financial performance criteria and upon confirmation by the Compensation Committee of the satisfaction of such performance criteria based upon the Company’s audited financial statements for 2017, 2018, 2019 and 2020 |
|
(14) |
Includes 22,956 shares of common stock subject to restricted stock awards. |
|
(15) |
Represents 33,334 shares of common stock subject to restricted stock awards. |
|
(16) |
Includes 833 shares of common stock subject to restricted stock units expected to vest as of, or within, 60 days after March 15, 2017, subject to continued service. Does not include 1,667 shares of common stock subject to restricted stock units that will not vest as of, or within, 60 days after March 15, 2017. |
98
Equity Compensation Plan Information
The following table sets forth certain information as of December 31, 2016 with respect to our equity compensation plans (including individual compensation arrangements) under which our equity securities are authorized for issuance, aggregated by (i) all compensation plans previously approved by our security holders, and (ii) all compensation plans not previously approved by our security holders:
|
Plan Category |
|
Number of securities to be issued upon exercise of outstanding options, warrants and rights |
|
|
Weighted-average exercise price of outstanding options, warrants and rights |
|
|
Number of securities remaining available for future issuance under equity compensation plans (excluding securities referenced in the first column) (1) |
|
|||
|
Equity compensation plans approved by security holders |
|
|
191,573 |
|
|
$ |
— |
|
|
|
1,109,046 |
|
|
Equity compensation plans not approved by security holders: |
|
|
— |
|
|
|
— |
|
|
|
— |
|
|
Total |
|
|
191,573 |
|
|
$ |
— |
|
|
|
1,109,046 |
|
|
|
(1) |
Represents shares available for grant in the future under our 2012 Incentive Compensation Plan. |
Our policy on related-person transactions is included in our revised Code of Ethics and Business Conduct Policy, which has been reviewed and approved by the Board effective as of October 3, 2012. Our policy states that each executive officer, director or nominee for director will disclose to the Audit Committee of the Board the following information regarding a related-person transaction for review, approval or ratification by the Audit Committee: (i) the name of the related-person (as defined by Item 404(a) of Regulation S-K under the Securities Exchange Act), and if he or she is an immediate family member of an executive officer, director or nominee for director, the nature of such relationship; (ii) the related-person’s interest in the transaction; (iii) the approximate dollar value of the amount involved in the transaction; (iv) the approximate dollar value of the amount of the related-person’s interest in the transaction; and (v) in the case of indebtedness, the largest total amount of principal outstanding since the beginning of our last fiscal year, the amount of principal outstanding as of the latest practicable date, the amount of principal paid since the beginning of our last fiscal year, and the rate or amount of interest payable on the indebtedness.
The Audit Committee’s decision whether or not to approve or ratify the related-person transaction is made in light of its determination as to whether consummation of the transaction is believed by the Audit Committee to not be or have been contrary to our best interests. The Audit Committee may take into account the effect of a director’s related-person transaction on such person’s status as an independent member of our Board and eligibility to serve on Board committees under SEC and stock exchange rules, as applicable.
Credit Agreement Amendment
On October 14, 2016, we entered into the AMC Credit Agreement. See the description of the AMC Credit Agreement above at Management’s Discussion and Analysis of Financial Condition and Results of Operations Liquidity and Capital Resources – Capital Resources – Senior Term Notes.
On January 30, 2017, we entered into a First Amendment to the AMC Credit Agreement (or Amendment) with certain subsidiaries of the Company in their capacity as guarantors and AMC as administrative agent and lender under the AMC Credit Agreement. Terms used but not defined herein have the meanings set forth in the AMC Credit Agreement as amended by the Amendment.
The Amendment amended the AMC Credit Agreement by adding an incremental $8 million to the Tranche A Term Loan under the AMC Credit Agreement thereby increasing the aggregate principal amount of the Tranche A Term Loan from $5 million to $13 million. The Amendment also (i) extended the Tranche A Term Loan Maturity Date from October 14, 2017 to June 30, 2019; (ii) amended the definition of Consolidated Fixed Charges to reflect the extended maturity date of the Tranche A Term Loan and the repayment of the Company’s subordinated debt with the proceeds; (iii) increased the maximum Senior Leverage Ratio as of the last day of Fiscal Year ending December 31, 2018 from 2.75:1.00 to 3.50:1.00; and (iv) amended the definition of Consolidated Adjusted EBITDA.
99
The proceeds were used to prepay our obligations under the unsecured subordinated promissory notes we issued in October 2012 (or Subordinated Notes). As of December 31, 2016, the Subordinated Notes had an aggregate outstanding principal balance of $8.6 million, which was scheduled to amortize quarterly starting September 30, 2017, with final payment due July 31, 2018. The interest rate under the Subordinated Notes increased after January 1, 2017 from 1.5% to 12% per annum.
Preferred Stock and 2015 Warrants
On October 14, 2016, the Company closed on the exchange of 30,197.53 shares of preferred stock, convertible into 11,259,537 shares of common stock, and warrants to purchase 3,104,628 shares of common stock, in accordance with the terms described below. As part of this transaction, the Company exchanged (a) 4,000 shares of Series A-1 Convertible Preferred Stock for 4,000 shares of C-1 Convertible Preferred Stock with Wolverine Flagship Fund Trading Limited, (b) 2,000 shares of Series A-2 Convertible Preferred Stock for 2,000 shares of Series C-2 Convertible Preferred Stock with Sudbury Capital Fund, L.P., (c) 7,491.086 shares of Series B-1 Convertible Preferred Stock for 7,491.086 shares of Series D-1 Convertible Preferred Stock with JH Evergreen Management, LLC and its affiliates, (d) 183.506 shares of Series B-1 Preferred Stock for 183.506 shares of Series D-1 Preferred Stock with Sudbury Capital Fund, L.P., (e) 15,000 shares of Series B-2 Convertible Preferred Stock for 15,000 shares of Series D-2 Convertible Preferred Stock with RLJ SPAC Acquisition, LLC, an affiliate of Robert L. Johnson, (f) 500 shares of Series B-2 Convertible Preferred Stock for 500 shares of Series D-2 Convertible Preferred Stock with Peter Edwards and (g) 1,000 shares of Series B-2 Convertible Preferred Stock for 1,000 shares of Series D-2 Convertible Preferred Stock with Morris Goldfarb. In addition, the Company exchanged on a share-for-share basis with each of these investors warrants to purchase a number of shares of common stock equal to 30% of the shares of common stock initially issuable upon conversion of such investor’s shares of preferred stock (or 2015 Warrants). The AMC Transaction triggered the exercise price adjustment provision in the 2015 Warrants, and upon the closing of the AMC Transaction the exercise price per share of the 2015 Warrants was reduced from $4.50 to $3.00.
The amendments to the preferred stock are as follows:
|
|
• |
Dividends. Under the terms of the existing preferred stock, we were permitted to pay the required dividends in cash, or if we satisfied certain conditions upon the issuance of equity, in shares of common stock. The new preferred stock provides that, if we are not permitted to pay a required dividend on the preferred stock due to our failure to meet the conditions for the issuance of equity, we will be permitted to accrue the value of the dividend and add it to the stated value of the new preferred stock. |
|
|
• |
Conversion. The conversion rate of the existing preferred stock was set at the lower of (a) $3.00 per share (as adjusted for our June 24, 2016 reverse stock split) and 85% of the five-day average of the volume-weighted average price for the five trading days preceding conversion. For all but 16,500 shares of preferred stock held by RLJ SPAC Acquisition, LLC, Mr. Edwards and Mr. Goldfarb, a conversion rate floor of $0.50 was added to the new preferred stock. (A conversion rate floor of $2.49 remains unchanged for the 16,500 shares of preferred stock held by RLJ SPAC Acquisition, LLC, Mr. Edwards and Mr. Goldfarb.) |
|
|
• |
Redemption at the Maturity Date. Under the terms of the existing preferred stock, if we failed to meet certain conditions with respect to the issuance of equity, we were not permitted to settle the maturity redemption obligation by the issuance of shares of common stock. The new preferred stock permits us, in any event, to settle the preferred stock upon maturity with shares of common stock, but if an equity condition failure has occurred, we will pay a penalty equal to 20% of the maturity redemption price, payable in cash or in shares of common stock. If we elect to pay this penalty in shares of common stock, the number of shares will be determined by dividing the penalty amount by the market price of shares as of the maturity date, subject to a $0.50 per share floor. |
|
|
• |
Fundamental Transactions. The terms of the existing preferred stock provided that we may be required to redeem the preferred stock for cash following the occurrence of certain fundamental transactions involving the acquisition of the Company or a controlling interest in the Company. The new preferred stock limits the definition of fundamental transactions to transactions approved by the Company and excludes the AMC Transaction. |
|
|
• |
Anti-Dilution. The terms of the existing preferred stock provided that if we issue or agree to issue any shares of our common stock in a down round, as defined, the conversion price of the preferred stock will be reduced to the issuance price with respect to such issuance. The new preferred stock provides that the conversion price (and shares subject to the preferred stock) is only adjusted for upon the occurrence of a dilutive issuance (which is when shares are issued below fair value), and any adjustments shall only compensate for the dilution incurred by such issuance. |
The 2015 Warrants issued with the preferred stock have a term of five years and initially had an exercise price of $4.50 per share. The exercise price is subject to standard anti-dilution protection including adjustments for offerings consummated at a per-share price of less than the exercise price. Additionally, if we were to consummate certain fundamental transactions, such as a business combination or other change-in-control transactions, the warrant holders were entitled to require, under certain conditions, that we
100
repurchase the warrants with cash equal to the warrants’ then fair value as determined using the Black Scholes valuation model. In connection with the amendments to the preferred stock described above, we amended the anti-dilution and redemption provisions of the 2015 Warrants to conform to the terms of the new preferred stock.
As a result of the AMC Transaction and the existing anti-dilution provisions of the 2015 Warrants, the exercise price of the 2015 Warrants was reduced to $3.00 per share. In exchange for the holders’ consent to the amendments to the preferred stock and the 2015 Warrants and the AMC Transaction, the exercise price of the 2015 Warrants held by the holders of the Series A-1, A-2 and B-1 Preferred Stock was further reduced to $1.50 per share and the 2015 Warrants held by Mr. Goldfarb and Mr. Edwards in connection with their shares of Series B-2 Preferred Stock was further reduced to $2.37 per share (due to an existing floor on the reduction of the exercise price of their warrants). RLJ SPAC Acquisition, LLC waived further reduction of the warrant exercise price in connection with its shares of Series B-2 Preferred Stock such that the exercise price of its 2015 Warrants was set at $3.00 per share.
On July 9, 2015, we filed a registration statement with the Securities and Exchange Commission to register the shares issuable upon conversion of the preferred stock and exercise of the warrants. The registration statement was declared effective in July 2015. We will use our best efforts to keep the registration statement effective. If we are in default of the registration rights agreement, and as long as the event of default is not cured, then we are required to pay, in cash, partial liquidation damages, which in total are not to exceed 6% of the aggregated subscription amount of $31.0 million.
Subordinated Notes
Upon consummation of the Business Combination, we issued the Subordinated Notes in the aggregate principal amount of $14.8 million to the selling preferred stockholders of Image, which included JH Evergreen Management, LLC and its affiliates. The Subordinated Notes bore interest at 12% per annum, of which 5.4% was payable in cash annually, and at our discretion the balance was either paid through the issuance of shares of our common stock valued at their then-current market price, or accrued and added to principal, which was payable upon maturity. Effective on May 20, 2015, in connection with the issuance of the preferred stock, the holder of the Subordinated Notes (a) converted 50% of the outstanding balance of the Subordinated Notes into Series B-1 preferred stock, (b) amended the interest rate payable from 12% to 1.5% per annum for the 24-month period commencing on January 1, 2015, and then returning to 12% per annum thereafter, (c) agreed that 45% of the interest due would be payable in cash and the remainder of the accrued interest would be payable in the form of additional Subordinated Notes and (d) waived any existing defaults and events of default. The Subordinated Notes were scheduled to mature on October 3, 2018 or six months after the latest stated maturity of the senior debt issued pursuant to our senior credit facility.
On October 14, 2016, the holders of the Subordinated Notes, including JH Evergreen Management, LLC and its affiliates, holding $7,553,745.23 principal amount of Subordinated Notes, and Sudbury Capital Fund, L.P., holding $1,040,852.28 principal amount of Subordinated Notes, consented to the AMC Transaction and waived any existing events of default or any right to exercise remedies upon a change in control of the Company in connection with the issuance or subsequent exercise of the AMC Warrants. The payment terms of the Subordinated Notes were amended such that 25% of the principal amount outstanding on October 14, 2016 was due at the end of the quarters ending September 2017, December 2017 and March 2018, with the remaining outstanding principal due on the maturity date of the Subordinated Notes, which was July 31, 2018, instead of the entire principal amount being due upon maturity of the Subordinated Notes. We prepaid the Subordinated Notes in full on January 31, 2017 in connection with the Amendment to the AMC Credit Agreement.
Executive Waiver Agreement
In connection with the AMC Transaction, Miguel Penella, the Chief Executive Officer of the Company, Nazir Rostom, the Chief Financial Officer of the Company, the Company’s directors and certain other officers of the Company each entered into a waiver agreement with the Company acknowledging that the closing of the AMC Transaction, the execution of the underlying transaction documents and the issuance and any subsequent exercise of the AMC Warrants do not constitute a change of control for the purposes of any benefit or compensation plan, program, policy, agreement or other arrangement or obligation of the Company to such officer.
The RLJ Companies, LLC
On June 27, 2013, The RLJ Companies, LLC (whose sole manager and voting member is the chairman of our Board) purchased from one of our vendors $3.5 million of contract obligations that we owed to the vendor. These obligations were payable by us to the vendor through September 5, 2013. Pursuant to the purchase, The RLJ Companies, LLC has become the account creditor with respect to these accounts. These accounts have not been otherwise modified.
101
Director Independence
Our Board reviewed the NASDAQ independence standards with regard to our directors, including whether specified transactions or relationships existed during the past three years, between our directors, or certain family members or affiliates of our directors, and RLJE, any of its subsidiaries, certain other affiliates, or our independent registered public accounting firm. As a result of the review, our Board determined that Ms. Manos and Messrs. Brown, Hsu, Judd, Laszlo, Royster and Ziegelman are “independent” as that term is used in NASDAQ Marketplace Rule 5605. We do not know of any family relationships among or between any of our directors, executive officers, or key employees. With regard to the independence of our directors regarding committee independence, see Directors, Executive Officers and Corporate Governance – Committees of the Board above.
The following table summarizes the aggregate fees billed for professional services provided by BDO USA, LLP related to the fiscal years ended December 31, 2016 and 2015.
|
|
|
2016 |
|
|
2015 |
|
||
|
Audit Fees |
|
$ |
403,000 |
|
|
$ |
571,000 |
|
|
Audit-Related Fees |
|
|
— |
|
|
|
— |
|
|
Tax Fees |
|
|
84,000 |
|
|
|
— |
|
|
All Other Fees |
|
|
— |
|
|
|
— |
|
|
Total Fees |
|
$ |
487,000 |
|
|
$ |
571,000 |
|
Audit Fees. Audit fees consisted of fees billed for professional services rendered for: (i) the audit of our consolidated financial statements; (ii) the review of interim consolidated financial statements for our quarterly filings; and (iii) any services that are normally provided by our principal accountant in connection with statutory and regulatory filings or engagements.
Audit-Related Fees. There were no audit-related fees during the fiscal years ended December 31, 2016 and 2015.
Tax Fees. BDO USA, LLP provided tax advice and compliance services during fiscal year ended December 31, 2016 but did not provide tax planning for us in fiscal year ended December 31, 2015.
All Other Fees. There were no other fees during the fiscal years ended December 31, 2016 and 2015.
Policy on Audit Committee Pre-Approval of Audit and Permissible Non-Audit Services of Independent Registered Public Accounting Firm
Our Audit Committee’s policy is to pre-approve the audit and non-audit services provided by the independent registered public accounting firm, in order to assure that the provision of such services does not impair the auditor’s independence. As provided in our Audit Committee Charter, our Audit Committee believes that the combination of general pre-approval of certain types of audit services (e.g., quarterly reviews, annual audit and review of certain other documents filed with the SEC) and specific pre-approval of other services results in an effective and efficient procedure to pre-approve services performed by the independent registered public accounting firm. Unless a type of service to be provided by the independent registered public accounting firm has received general pre-approval, it will require specific pre-approval by the Audit Committee. In determining whether to grant general or specific pre-approval, our Audit Committee will consider whether such services are consistent with the applicable rules and regulations on auditor independence. The term of any pre-approval is 12 months from the date of pre-approval, unless the Audit Committee specifically provides for a different period. Pre-approval is generally provided for up to one year and any pre-approval is detailed as to the particular service or category of services and is generally subject to a specific budget. With respect to each proposed pre-approved service, the independent registered public accounting firm is required to provide to the Audit Committee detailed back-up documentation regarding the specific services to be provided.
All of the fees paid to BDO USA, LLP in fiscal 2016 and 2015 were pre-approved by the Audit Committee. Our Audit Committee also considered whether the provision of services other than those described above under the heading of “Audit Fees” were compatible with maintaining the independence of BDO USA, LLP.
102
|
(a) The following documents are filed as a part of this report: |
|
Page |
|
|
|
|
|
|
|
1. Financial Statements. |
|
|
|
|
|
|
|
|
|
|
Report of Independent Registered Public Accounting Firm |
|
45 |
|
|
Consolidated Balance Sheets as of December 31, 2016 and 2015 |
|
46 |
|
|
Consolidated Statements of Operations for the years ended December 31, 2016 and 2015 |
|
47 |
|
|
Consolidated Statements of Comprehensive Loss for the years ended December 31, 2016 and 2015 |
|
48 |
|
|
Consolidated Statements of Changes in Shareholders’ Equity (Deficit) for the years ended December 31, 2016 and 2015 |
|
49 |
|
|
Consolidated Statements of Cash Flows for the years ended December 31, 2016 and 2015 |
|
50 |
|
(b) |
Exhibits. |
|
3.1 |
|
Amended and Restated Articles of Incorporation of RLJ Entertainment, Inc. (incorporated by reference to Exhibit 3.1 to the Registrant’s Registration Statement on Form S‑4 (File No. 333-180714) filed on August 10, 2012). |
|
|
|
|
|
3.2 |
|
Form of Bylaws of RLJ Entertainment, Inc. (incorporated by reference to Exhibit 3.2 to Registrant’s Registration Statement on Form S‑4 (File No. 333-180714) filed on August 10, 2012). |
|
|
|
|
|
3.3 |
|
Amendment to Bylaws (incorporated by reference to Exhibit 3.1 to Current Report on Form 8-K (File No. 001-35675) filed on August 22, 2016). |
|
|
|
|
|
3.4 |
|
Amendment to Bylaws (incorporated by reference to Exhibit 3.1 to Current Report on Form 8-K (File No. 001-35675) filed on September 23, 2016). |
|
|
|
|
|
3.5 |
|
Certificate of Designation of Series C-1 Convertible Preferred Stock (incorporated by reference to Exhibit 3.1 to the Registrant’s Current Report on Form 8-K (File No. 001-35675) filed on October 17, 2016). |
|
|
|
|
|
3.6 |
|
Certificate of Designation of Series C-2 Convertible Preferred Stock (incorporated by reference to Exhibit 3.2 to the Registrant’s Current Report on Form 8-K (File No. 001-35675) filed on October 17, 2016). |
|
|
|
|
|
3.7 |
|
Certificate of Designation of Series D-1 Convertible Preferred Stock (incorporated by reference to Exhibit 3.3 to the Registrant’s Current Report on Form 8-K (File No. 001-35675) filed on October 17, 2016). |
|
|
|
|
|
3.8 |
|
Certificate of Designation of Series D-2 Convertible Preferred Stock (incorporated by reference to Exhibit 3.4 to the Registrant’s Current Report on Form 8-K (File No. 001-35675) filed on October 17, 2016). |
|
|
|
|
|
4.1 |
|
Specimen Common Stock certificate (incorporated by reference to Exhibit 4.1 to the Registrant’s Registration Statement on Form S‑4 (File No. 333-180714) filed on August 10, 2012). |
|
|
|
|
|
4.2 |
|
Specimen Warrant certificate (incorporated by reference to Exhibit 4.2 to the Registrant’s Registration Statement on Form S‑4 (File No. 333-180714) filed on August 10, 2012). |
|
|
|
|
|
4.3 |
|
Amended and Restated Warrant Agreement, dated as of February 1, 2015, by and between RLJ Entertainment, Inc., Computershare Inc. and Computershare Trust Company, N.A. (incorporated by reference to Exhibit 4.3 to the Registrant’s Annual Report on Form 10-K (File No. 001-35675) filed on May 8, 2015). |
|
|
|
|
|
4.4 |
|
Form of Common Stock Purchase Warrant (incorporated by reference to Exhibit 3.5 to the Registrant’s Current Report on Form 8-K (File No. 001-35675) filed on May 15, 2015). |
|
|
|
|
|
4.5 |
|
AMC Class A Warrant (incorporated by reference to Exhibit 10.2 to the Registrant’s Current Report on Form 8-K (File No. 001-35675) filed on October 17, 2016). |
|
|
|
|
|
4.6 |
|
AMC Class B Warrant (incorporated by reference to Exhibit 10.3 to the Registrant’s Current Report on Form 8-K (File No. 001-35675) filed on October 17, 2016). |
|
|
|
|
|
4.7 |
|
AMC Class C Warrant (incorporated by reference to Exhibit 10.4 to the Registrant’s Current Report on Form 8-K (File No. 001-35675) filed on October 17, 2016). |
|
|
|
|
103
|
4.8 |
|
Exchanged 2015 Warrant (incorporated by reference to Exhibit 10.7 to the Registrant’s Current Report on Form 8-K/A (File No. 001-35675) filed on October 19, 2016). |
|
|
|
|
|
10.1† |
|
RLJ Entertainment, Inc. 2012 Incentive Compensation Plan (incorporated by reference to Exhibit 10.3 to the Registrant’s Registration Statement on Form S‑4 (File No. 333-180714) filed on August 10, 2012). |
|
|
|
|
|
10.2 |
|
Amended and Restated Registration Rights Agreement, dated as of October 3, 2012, by and among RLJ Acquisition, Inc., RLJ Entertainment, Inc., JH Partners, LLC, JH Partners Evergreen Fund, LP, JH Investment Partners III, LP, JH Investment Partners GP Fund III, LLC, the shareholders of Acorn Media Group, Inc., Peter Edwards, as the Acorn Representative, RLJ SPAC Acquisition, LLC, William S. Cohen and Morris Goldfarb (incorporated by reference to Exhibit 10.3 to the Registrant’s Current Report on Form 8-K (File No. 001-35675) filed on October 10, 2012). |
|
|
|
|
|
10.3 |
|
First Amendment to Amended and Restated Registration Rights Agreement, dated as of June 27, 2013, by and among RLJ Entertainment, Inc., RLJ Acquisition, Inc., RLJ SPAC Acquisition, LLC, JH Partners, LLC, JH Partners Evergreen Fund, L.P., JH Investment Partners III, L.P., JH Investment Partners GP Fund III, LLC, and Wexford Spectrum Investors, LLC (incorporated by reference to Exhibit 10.4 to the Registrant’s Quarterly Report on Form 10-Q (File No. 001-35675) filed on August 5, 2013). |
|
|
|
|
|
10.4 |
|
Form of Indemnity Agreement, by and between RLJ Entertainment and each Indemnitee (incorporated by reference to Exhibit 10.4 to the Registrant’s Current Report on Form 8-K (File No. 001-35675) filed on October 10, 2012). |
|
|
|
|
|
10.5 |
|
Assignment, Assumption and Amendment Agreement, dated as of October 3, 2012, by and among RLJ Entertainment, Inc., RLJ Acquisition, Inc. and Continental Stock Transfer & Trust Company (incorporated by reference to Exhibit 10.5 to the Registrant’s Current Report on Form 8-K (File No. 001-35675) filed on October 10, 2012). |
|
|
|
|
|
10.6 |
|
Form of Unsecured Subordinated Promissory Note (incorporated by reference to Exhibit 10.6 to the Registrant’s Current Report on Form 8-K (File No. 001-35675) filed on October 10, 2012). |
|
|
|
|
|
10.7† |
|
Employment Agreement, dated as of July 18, 2013, by and between Miguel Penella and RLJ Entertainment, Inc. (incorporated by reference to Exhibit 10.1 to the Registrant’s Quarterly Report on Form 10-Q (File No. 001-35675) filed on November 7, 2013). |
|
|
|
|
|
10.8 |
|
Credit and Guaranty Agreement, dated as of September 11, 2014, by and among RLJ Entertainment, Inc., as Parent Borrower, and Subsidiaries of Parent Borrower, as Guarantors, the Lenders party hereto from time to time, McLarty Capital Partners SBIC, L.P., as Administrative Agent, Collateral Agent, Arranger, Bookmanager, and Syndication Agent, and Crystal Financial LLC as Documentation Agent (incorporated by reference to Exhibit 10.1 to the Registrant’s Quarterly Report on Form 10-Q (File No. 001-35675) filed on November 7, 2014). |
|
|
|
|
|
10.9 |
|
Securities Purchase Agreement, dated as of April 15, 2015, by and between RLJ Entertainment, Inc. and each purchaser identified on the signature page (incorporated by reference to Exhibit 10.1 to the Registrant’s Current Report on Form 8-K (File No. 001-35675) filed on April 16, 2015). |
|
|
|
|
|
10.10 |
|
First Amendment to Credit and Guaranty Agreement, dated as of April 15, 2015, by and among RLJ Entertainment, Inc., certain subsidiaries of RLJ Entertainment, Inc. as Guarantors, Various Lenders, MCP Opportunities LLC (as successor to McLarty Capital Partners SBIC, L.P.) as Administrative Agent and Collateral Agent, McLarty Capital Partners SBIC, L.P. as Arranger, Bookmanager, and Syndication Agent, and Crystal Financial LLC as Documentation Agent (incorporated by reference to Exhibit 10.2 to the Registrant’s Current Report on Form 8-K (File No. 001-35675) filed on April 16, 2015). |
|
|
|
|
|
10.11 |
|
Note Amendment Agreement, dated as of April 15, 2015, by and between RLJ Entertainment, Inc. and JH Investment Partners III, LP, JH Partners Evergreen Fund, LP, JH Investment Partners GP Fund III, LLC, Forrestal, LLC, Taylor Rettig, Theodore S. Green, John P. Avagliano, Ray Gagnon and Producers Sales Organization (incorporated by reference to Exhibit 10.3 to the Registrant’s Current Report on Form 8-K (File No. 001-35675) filed on April 16, 2015). |
|
|
|
|
|
10.12 |
|
Securities Purchase Agreement, dated as of May 14, 2015, by and between RLJ Entertainment, Inc. and each purchaser identified on the signature page (incorporated by reference to Exhibit 10.1 to the Registrant’s Current Report on Form 8-K (File No. 001-35675) filed on May 15, 2015). |
|
|
|
|
|
10.13 |
|
Registration Rights Agreement, dated as of May 14, 2015, by and between RLJ Entertainment, Inc. and each purchaser identified on the signature page (incorporated by reference to Exhibit 10.2 to the Registrant’s Current Report on Form 8-K (File No. 001-35675) filed on May 15, 2015). |
|
|
|
|
|
10.14† |
|
Employment Agreement, dated as of May 18, 2016, by and between Nazir Rostom and RLJ Entertainment, Inc. (incorporated by reference to Exhibit 10.1 to the Registrant’s Quarterly Report on Form 10-Q (File No. 001-35675) filed on August 15, 2016). |
|
|
|
|
104
|
10.15 |
|
Investment Agreement, dated August 19, 2016, by and between the Company and Digital Entertainment Holdings LLC (incorporated by reference to Exhibit 10.1 to the Registrant’s Quarterly Report on Form 8-K (File No. 001-35675) filed on August 22, 2016). |
|
|
|
|
|
10.16 |
|
Voting Agreement, dated August 19, 2016, by and between the Company and Digital Entertainment Holdings LLC (incorporated by reference to Exhibit 10.6 to the Registrant’s Quarterly Report on Form 8-K (File No. 001-35675) filed on August 22, 2016). |
|
|
|
|
|
10.17 |
|
Preferred Stock and Warrant Exchange Agreement for Series A-1 Convertible Preferred Stock (incorporated by reference to Exhibit 10.10 to the Registrant’s Quarterly Report on Form 8-K (File No. 001-35675) filed on August 22, 2016). |
|
|
|
|
|
10.18 |
|
Preferred Stock and Warrant Exchange Agreement for Series A-2 Convertible Preferred Stock (incorporated by reference to Exhibit 10.11 to the Registrant’s Quarterly Report on Form 8-K (File No. 001-35675) filed on August 22, 2016). |
|
|
|
|
|
10.19 |
|
Preferred Stock and Warrant Exchange Agreement for Series B-1 Convertible Preferred Stock (incorporated by reference to Exhibit 10.12 to the Registrant’s Quarterly Report on Form 8-K (File No. 001-35675) filed on August 22, 2016). |
|
|
|
|
|
10.20 |
|
Preferred Stock and Warrant Exchange Agreement for Series B-2 Convertible Preferred Stock (incorporated by reference to Exhibit 10.13 to the Registrant’s Quarterly Report on Form 8-K (File No. 001-35675) filed on August 22, 2016). |
|
|
|
|
|
10.21 |
|
Consent Agreement for Series B-1 Convertible Preferred Stock (incorporated by reference to Exhibit 10.14 to the Registrant’s Quarterly Report on Form 8-K (File No. 001-35675) filed on August 22, 2016). |
|
|
|
|
|
10.22 |
|
Subordinated Note Amendment Agreement (incorporated by reference to Exhibit 10.20 to the Registrant’s Quarterly Report on Form 8-K (File No. 001-35675) filed on August 22, 2016). |
|
|
|
|
|
10.23 |
|
Credit and Guaranty Agreement, dated October 14, 2016, by and among AMC, the Company, certain subsidiaries of the Company, and the Lenders party thereto from time to time (incorporated by reference to Exhibit 10.1 to the Registrant’s Current Report on Form 8-K (File No. 001-35675) filed on October 17, 2016). |
|
|
|
|
|
10.24 |
|
Form of Executed Waiver Agreement (incorporated by reference to Exhibit 10.7 to the Registrant’s Current Report on Form 8-K (File No. 001-35675) filed on August 22, 2016). |
|
|
|
|
|
10.25 |
|
Form of Executed Executive Waiver Agreement (incorporated by reference to Exhibit 10.8 to the Registrant’s Current Report on Form 8-K (File No. 001-35675) filed on August 22, 2016). |
|
|
|
|
|
10.26 |
|
Stockholders’ Agreement, dated October 14, 2016, by and among AMC, the Company, Robert L. Johnson, RLJ SPAC Acquisition LLC, Peter Edwards and Morris Goldfarb (incorporated by reference to Exhibit 10.5 to the Registrant’s Current Report on Form 8-K (File No. 001-35675) filed on October 17, 2016). |
|
|
|
|
|
10.27 |
|
Registration Rights Agreement, dated October 14, 2016, by and between the Company and AMC (incorporated by reference to Exhibit 10.6 to the Registrant’s Current Report on Form 8-K (File No. 001-35675) filed on October 17, 2016). |
|
|
|
|
|
10.28 |
|
First Amendment to Credit and Guaranty Agreement, dated January 30, 2017, by and among AMC, the Company, certain subsidiaries of the Company, and the Lenders party thereto from time to time (incorporated by reference to Exhibit 10.1 to the Registrant’s Quarterly Report on Form 8-K (File No. 001-35675) filed on February 1, 2017). |
|
|
|
|
|
14.1 |
|
Code of Ethics (incorporated by reference to Exhibit 14.1 to the Registrant’s Current Report on Form 8-K (File No. 001-35675) filed on October 10, 2012). |
|
|
|
|
|
21.1* |
|
Subsidiaries of the Registrant. |
|
|
|
|
|
23.1* |
|
Consent of BDO USA, LLP, Independent Registered Public Accounting Firm. |
|
|
|
|
|
31.1* |
|
Rule 13a-14(a)/15d-14(a) Certification of Chief Executive Officer. |
|
|
|
|
|
31.2* |
|
Rule 13a-14(a)/15d-14(a) Certification of Chief Financial Officer. |
|
|
|
|
|
32.1* |
|
Section 1350 Certification of Chief Executive Officer and Chief Financial Officer. |
|
|
|
|
|
101.INS* |
|
XBRL Instance Document. |
|
|
|
|
|
101.SCH* |
|
XBRL Taxonomy Extension Schema Document. |
|
|
|
|
|
101.CAL* |
|
XBRL Taxonomy Extension Calculation Linkbase Document. |
|
|
|
|
|
101.DEF* |
|
XBRL Taxonomy Extension Definition Linkbase Document. |
|
|
|
|
|
101.LAB* |
|
XBRL Taxonomy Extension Label Linkbase Document. |
105
|
|
|
|
|
101.PRE* |
|
XBRL Taxonomy Extension Presentation Linkbase Document. |
|
* |
Filed herewith. |
|
† |
Management contract or compensatory plan or arrangement. |
Not applicable.
106
Pursuant to the requirements of Section 13 or 15(d) of the Securities Exchange Act of 1934, the registrant has duly caused this report to be signed on its behalf by the undersigned, thereunto duly authorized.
|
|
|
RLJ ENTERTAINMENT, INC. |
|
|
|
A Nevada corporation |
|
|
|
|
|
Dated: March 23, 2017 |
|
/s/ MIGUEL PENELLA |
|
|
|
MIGUEL PENELLA |
|
|
|
Chief Executive Officer |
|
|
|
(Principal Executive Officer) |
|
|
|
|
|
Dated: March 23, 2017 |
|
/s/ NAZIR ROSTOM |
|
|
|
NAZIR ROSTOM |
|
|
|
Chief Financial Officer |
|
|
|
(Principal Financial and Accounting Officer) |
Pursuant to the requirements of the Securities Exchange Act of 1934, this report has been signed below by the following persons on behalf of the registrant and in the capacities and on the dates indicated.
|
Dated: March 23, 2017 |
|
/s/ MIGUEL PENELLA |
|
|
|
MIGUEL PENELLA |
|
|
|
Chief Executive Officer and Director |
|
|
|
(Principal Executive Officer) |
|
|
|
|
|
Dated: March 23, 2017 |
|
/s/ NAZIR ROSTOM |
|
|
|
NAZIR ROSTOM |
|
|
|
Chief Financial Officer |
|
|
|
(Principal Financial and Accounting Officer) |
|
|
|
|
|
Dated: March 23, 2017 |
|
/s/ ROBERT L. JOHNSON |
|
|
|
ROBERT L. JOHNSON |
|
|
|
Chairman of the Board |
|
|
|
|
|
Dated: March 23, 2017 |
|
/s/ TYRONE BROWN |
|
|
|
TYRONE BROWN |
|
|
|
Director |
|
|
|
|
|
Dated: March 23, 2017 |
|
/s/ JOHN HSU |
|
|
|
JOHN HSU |
|
|
|
Director |
|
|
|
|
|
Dated: March 23, 2017 |
|
/s/ DAYTON JUDD |
|
|
|
DAYTON JUDD |
|
|
|
Director |
|
|
|
|
|
Dated: March 23, 2017 |
|
/s/ ANDOR M. LASZLO |
|
|
|
ANDOR M. LASZLO |
|
|
|
Director |
107
|
|
|
|
|
Dated: March 23, 2017 |
|
/s/ ARLENE MANOS |
|
|
|
ARLENE MANOS |
|
|
|
Director |
|
|
|
|
|
Dated: March 23, 2017 |
|
/s/ SCOTT R. ROYSTER |
|
|
|
SCOTT R. ROYSTER |
|
|
|
Director |
|
|
|
|
|
Dated: March 23, 2017 |
|
/s/ JOHN ZIEGELMAN |
|
|
|
JOHN ZIEGELMAN |
|
|
|
Director |
108