Attached files
| file | filename |
|---|---|
| EX-32.2 - EXHIBIT 32.2 - Designer Brands Inc. | dsw-2017128exhibit322.htm |
| EX-32.1 - EXHIBIT 32.1 - Designer Brands Inc. | dsw-2017128exhibit321.htm |
| EX-31.2 - EXHIBIT 31.2 - Designer Brands Inc. | dsw-2017128exhibit312.htm |
| EX-31.1 - EXHIBIT 31.1 - Designer Brands Inc. | dsw-2017128exhibit311.htm |
| EX-24.1 - EXHIBIT 24.1 - Designer Brands Inc. | dsw-2017128exhibit241.htm |
| EX-23.1 - EXHIBIT 23.1 - Designer Brands Inc. | dsw-2017128exhibit231.htm |
| EX-21.1 - EXHIBIT 21.1 - Designer Brands Inc. | dsw-2017128exhibit211.htm |
UNITED STATES
SECURITIES AND EXCHANGE COMMISSION
Washington, D.C. 20549
FORM 10-K
(Mark One)
þ | ANNUAL REPORT PURSUANT TO SECTION 13 OR 15(d) OF THE SECURITIES EXCHANGE ACT OF 1934 |
For the Fiscal Year Ended January 28, 2017
or
o | TRANSITION REPORT PURSUANT TO SECTION 13 OR 15(d) OF THE SECURITIES EXCHANGE ACT OF 1934 |
For the transition period from | to | ||
Commission file number 1-32545
DSW INC. |
(Exact name of registrant as specified in its charter) |
Ohio | 31-0746639 | |
(State or other jurisdiction of incorporation or organization) | (I.R.S. Employer Identification No.) | |
810 DSW Drive, Columbus, Ohio | 43219 | |
(Address of principal executive offices) | (Zip Code) | |
Registrant's telephone number, including area code: (614) 237-7100
Securities registered pursuant to Section 12(b) of the Act:
Title of each class | Name of each exchange on which registered | |
Class A Common Shares, without par value | New York Stock Exchange | |
Securities registered pursuant to Section 12(g) of the Act: None
Indicate by check mark if the registrant is a well-known seasoned issuer, as defined in Rule 405 of the Securities Act. þ Yes o No | |||||||
Indicate by check mark if the registrant is not required to file reports pursuant to Section 13 or Section 15(d) of the Act. o Yes þ No | |||||||
Indicate by check mark whether the registrant (1) has filed all reports required to be filed by Section 13 or 15(d) of the Securities Exchange Act of 1934 during the preceding 12 months (or for such shorter period that the registrant was required to file such reports), and (2) has been subject to such filing requirements for the past 90 days. þ Yes o No | |||||||
Indicate by check mark whether the registrant has submitted electronically and posted on its corporate Web site, if any, every Interactive Data File required to be submitted and posted pursuant to Rule 405 of Regulation S-T (§ 232.405 of this chapter) during the preceding 12 months (or for such shorter period that the registrant was required to submit and post such files). þ Yes o No | |||||||
Indicate by check mark if disclosure of delinquent filers pursuant to Item 405 of Regulation S-K (§ 229.405) is not contained herein, and will not be contained, to the best of registrant's knowledge, in definitive proxy or information statements incorporated by reference in Part III of this Form 10-K or any amendment to this Form 10-K. þ | |||||||
Indicate by check mark whether the registrant is a large accelerated filer, an accelerated filer, a non-accelerated filer or a smaller reporting company. See definitions of "large accelerated filer," "accelerated filer" and "smaller reporting company" in Rule 12b-2 of the Exchange Act. | |||||||
Large accelerated filer | þ | Accelerated filer | o | ||||
Non-accelerated filer | o | (Do not check if a smaller reporting company) | Smaller reporting company | o | |||
Indicate by check mark whether the registrant is a shell company (as defined in Rule 12b-2 of the Exchange Act). o Yes þ No | |||||||
The aggregate market value of voting stock held by non-affiliates of the registrant computed by reference to the price at which such voting stock was last sold, as of July 30, 2016, was $1,625,827,325. | |||||||
Number of shares outstanding of each of the registrant's classes of common stock, as of March 17, 2017: 72,460,969 Class A Common Shares and 7,732,807 Class B Common Shares. | |||||||
DOCUMENTS INCORPORATED BY REFERENCE
Portions of the Registrant's definitive proxy statement relating to the 2017 Annual Meeting of Shareholders are incorporated by reference into Part III of this Annual Report on
Form 10-K.
DSW INC.
TABLE OF CONTENTS
Page | ||
PART I | ||
PART II | ||
PART III | ||
PART IV | ||
All references to "we," "us," "our," "DSW Inc.," or the "Company" in this Annual Report on Form 10-K mean DSW Inc. and its wholly owned subsidiaries. DSW refers to the DSW segment, which includes DSW stores and dsw.com. We own many trademarks and service marks. This Annual Report on Form 10-K may contain trademarks, trade dress, and tradenames of other companies. Use or display of other parties' trademarks, trade dress or tradenames is not intended to and does not imply a relationship with the trademark, trade dress or tradename owner.
i
DSW INC.
TABLE OF CONTENTS TO FINANCIAL STATEMENTS
Page | |
ii
Cautionary Statement Regarding Forward-Looking Information for Purposes of the "Safe Harbor" Provisions of the Private Securities Litigation Reform Act of 1995
Some of the statements in this Annual Report on Form 10-K contain forward-looking statements which reflect our current views with respect to, among other things, future events and financial performance. Examples of such forward-looking statements include references to our future expansion and our acquisitions. You can identify these forward-looking statements by the use of forward-looking words such as "outlook," "believes," "expects," "potential," "continues," "may," "should," "seeks," "approximately," "predicts," "intends," "plans," "estimates," "anticipates," or the negative version of those words or other comparable words. Any forward-looking statements contained in this Annual Report on Form 10-K are based upon current plans, estimates, expectations and assumptions relating to our operations, results of operations, financial condition, growth strategy and liquidity. The inclusion of this forward-looking information should not be regarded as a representation by us or any other person that the future plans, estimates or expectations contemplated by us will be achieved. Such forward-looking statements are subject to numerous risks, uncertainties and other factors that may cause actual results, performance or achievements to be materially different from any future results, performance or achievements expressed or implied by the forward-looking statements. In addition to other factors discussed elsewhere in this report, including those factors described under "Part I, Item 1A. Risk Factors," some important factors that could cause actual results, performance or achievements for DSW Inc. to differ materially from those discussed in forward-looking statements include, but are not limited to, the following:
• | our success in growing our store base and digital demand; |
• | our ability to protect our reputation; |
• | maintaining strong relationships with our vendors; |
• | our ability to anticipate and respond to fashion trends; |
• | our success in meeting customer expectations; |
• | disruption of our distribution and/or fulfillment operations; |
• | continuation of agreements and the financial condition of our affiliated business and international partners; |
• | our ability to successfully integrate Ebuys, Inc.; |
• | fluctuation of our comparable sales and quarterly financial performance; |
• | risks related to our information systems and data; |
• | failure to retain our key executives or attract qualified new personnel; |
• | our competitiveness with respect to style, price, brand availability and customer service; |
• | our reliance on our DSW Rewards program and marketing to drive traffic, sales and customer loyalty; |
• | uncertain general economic conditions; |
• | our reliance on foreign sources for merchandise and risks inherent to international trade; |
• | risks related to our handling of sensitive and confidential data; |
• | risks related to leases of our properties; |
• | risks related to prior and current acquisitions; |
• | risks related to future legislation, regulatory reform or policy changes; |
• | foreign currency exchange risk; and |
• | risks related to our cash and investments. |
If one or more of these or other risks or uncertainties materialize, or if our underlying assumptions prove to be incorrect, actual results, performance or achievements may vary materially from what we have projected. Furthermore, new factors emerge from time to time and it is not possible for management to predict all such factors, nor can management assess the impact of any such factor on the business or the extent to which any factor, or combination of factors, may cause results to differ materially from those contained in any forward-looking statement. Any forward-looking statement speaks only as of the date on which such statement is made, and, except as required by law, we undertake no obligation to update any forward-looking statement to reflect events or circumstances after the date on which such statement is made or to reflect the occurrence of unanticipated events.
iii
PART I
ITEM 1. | BUSINESS |
General
DSW Inc. was incorporated in the state of Ohio in 1969, and we opened our first DSW store in Dublin, Ohio in 1991. DSW is the destination for fabulous footwear and accessory brands at a great value every single day. With a breathtaking assortment of shoes, handbags and accessories for women, men and kids in 501 stores nationwide and on dsw.com, DSW strives to delight customers with finding the perfect shoe at an incredible price. Our DSW stores average approximately 21,000 square feet and carry approximately 22,000 pairs of shoes. In addition, our DSW Rewards loyalty program means shopping comes with perks; members earn points towards certificates every time they purchase. We believe this combination of assortment, convenience and value differentiates us from our competitors and appeals to consumers from a broad range of socioeconomic and demographic backgrounds.
As a segment of DSW Inc., the Affiliated Business Group ("ABG") partners with multi-category retailers to develop strategies and business models for targeted shoe assortments. ABG provides service to 395 store locations and e-commerce channels through leased partnerships with Stein Mart, Gordmans and Frugal Fannie's.
We also have an equity investment in Town Shoes Limited ("Town Shoes"). Town Shoes is the market leader in branded footwear in Canada, with sales of over $345 million Canadian dollars ("CAD") in fiscal 2016. As of January 28, 2017, Town Shoes operated 182 locations across Canada under The Shoe Company, Shoe Warehouse, Town Shoes and DSW banners, as well as an e-commerce site. In 2014, we entered into a licensing agreement with Town Shoes, which allows Town Shoes to use the DSW Designer Shoe Warehouse tradename for their new larger concept Canadian stores. As of January 28, 2017, there are 23 DSW Designer Shoe Warehouse stores in Canada.
We completed several transactions that supported our efforts to grow market share within footwear and accessories domestically and internationally. On March 4, 2016, we acquired Ebuys, Inc. ("Ebuys"), a leading off price footwear and accessories retailer operating in digital marketplaces. Ebuys sells products to customers located in North America, Europe, Australia and Asia. On August 2, 2016, we signed an agreement with the Apparel Group as an exclusive franchise partner in the Gulf Coast region of the Middle East. The agreement is expected to expand the DSW banner by up to 40 stores across the territory, both in malls and on high street locations within Saudi Arabia, Bahrain, Qatar, Kuwait, United Arab Emirates and Oman, with the first stores opening in fiscal 2017.
See our consolidated financial statements and the notes thereto in Item 8 of this Annual Report on Form 10-K for financial information about our two reportable segments: the DSW segment, which includes DSW stores and dsw.com, and the ABG segment. Additionally, a five year summary of certain financial and operational information is included in Item 6 of this Annual Report.
We follow a 52/53-week fiscal year that ends on the Saturday nearest to January 31 in each year. The periods presented in these financial statements and selected financial data are the fiscal years ended January 28, 2017 ("fiscal 2016"), January 30, 2016 ("fiscal 2015"), January 31, 2015 ("fiscal 2014"), February 1, 2014 ("fiscal 2013") and February 2, 2013 ("fiscal 2012"). Fiscal 2016, 2015, 2014 and 2013 each consisted of 52 weeks, while fiscal 2012 consisted of 53 weeks. Our next fiscal year ending February 3, 2018 ("fiscal 2017") will consist of 53 weeks.
Competitive Strengths
We are a leading footwear retailer with a history of growth and financial strength that is leveraging our operating model to gain market share. We believe that having a leading market position is driven by our competitive strengths: assortment, convenience and value.
Assortment
Our goal is to excite our customers with a competitive, compelling assortment of shoes and complementary accessories that fulfill a broad range of style and fashion preferences. DSW sells a large assortment of brand name, designer and private brand merchandise. We purchase directly from over 450 domestic and foreign vendors, primarily in-season footwear found in specialty and department stores and branded make-ups (shoes made exclusively for a retailer). We offer a broad assortment of handbags, hosiery, jewelry and other accessories which appeal to our brand and fashion conscious customers. We also make opportunistic and close-out purchases to offer value to our customers.
1
Our vendors include suppliers who manufacture their own merchandise, or supply merchandise manufactured by others, or both. Most of our domestic vendors import a large portion of their merchandise from abroad. We have quality control programs under which our buyers are involved in establishing standards for quality and fit, and our personnel examine incoming merchandise in regards to color, material and overall quality. As our sales volume grows, we believe there will continue to be adequate sources available to acquire a sufficient supply of quality merchandise in a timely manner and on satisfactory economic terms. Our top three vendors in the aggregate supply approximately 18% of our merchandise.
Our merchandising group continuously monitors current fashion trends, as well as historical sales trends, to identify popular styles and styles that may become popular in the upcoming season. We track performance and sales trends on a weekly basis and have a flexible buying process that allows us to reorder successful styles and cancel underperforming styles throughout each season. To keep our product mix fresh and on target, we test new fashions and actively monitor sell-through rates. We also identify new vendor and category opportunities. After a successful launch during fiscal 2016, we will continue to add new locations in fiscal 2017 that will bring DSW kids to close to 60% of the total chain.
We separate our DSW merchandise into three primary categories: women's footwear; men's footwear; and accessories and other (which includes kids' footwear). The following table sets forth the approximate percentages of DSW segment sales attributable to each merchandise category for the fiscal years below:
Fiscal | |||||||||
Category | 2016 | 2015 | 2014 | ||||||
Women's footwear | 69 | % | 69 | % | 69 | % | |||
Men's footwear | 22 | % | 22 | % | 22 | % | |||
Accessories and other | 9 | % | 9 | % | 9 | % | |||
Convenience
We provide our customers with the highest level of convenience based on our belief that customers should be empowered to control and personalize their shopping experiences.
In stores, our merchandise is displayed on the selling floor with self-service fixtures to enable customers to view and touch the merchandise. We believe this shopping experience provides our customers with maximum convenience as they are able to browse and try on merchandise without feeling rushed or pressured to make a purchasing decision. Merchandise is organized in a logical manner that groups together similar styles, such as dress, casual, seasonal and athletic merchandise, for easy browsing.
Our omni-channel capabilities create an endless aisle for the customer. Customers can order additional styles, sizes, widths and categories that can be fulfilled from other DSW stores, our fulfillment center or directly from our suppliers (referred to as "drop ship"). To further meet customer demand of how they receive products, we allow our customers the option to buy online, pickup in store and buy online, ship to store.
Value For Our Customers
Our buying organization aims to provide customers with high quality, in-season fashion styles at attractive prices compared to the sale prices found at specialty retailers and department stores. We have historically employed a consistent pricing strategy that provides customers with the same price on our merchandise from the day it arrives in store until it enters our planned clearance rotation. Our pricing strategy differentiates us from our competitors who usually price and promote merchandise at discounts available only for limited time periods. We find that customers appreciate shopping for everyday value when it is most convenient for them, rather than waiting for a sale event.
We provide additional value through our DSW Rewards loyalty program where members earn points towards discounts on future purchases. Members also receive promotional offers and gifts with purchase offers. We employ a variety of methods, including email, direct mail and social media, to communicate exclusive offers to our rewards customers. Through our co-branded credit card, DSW Rewards members earn points for any purchases made with the credit card, including transactions outside of DSW.
Approximately 24 million members are enrolled in our DSW Rewards program and have made at least one purchase over the course of the last two years. In fiscal 2016, shoppers in the loyalty program generated approximately 90% of DSW segment sales.
2
Growth Strategy
Our growth strategy is to strengthen our position as a leading footwear and accessories retailer by expanding into new markets with the right banners and store format, extending our customer reach through new categories, and creating a differentiated customer experience and strong value proposition. We will also continue utilizing our financial strength to invest in key initiatives.
Expanding Our Presence
We opened 34 DSW stores and closed one DSW store in fiscal 2016, and we plan to open approximately 15 to 17 DSW stores and close two to four DSW stores in fiscal 2017. With our stores increasingly playing a key role in supporting our strong online demand growth and increasing fulfillment of that demand, we are regularly evaluating our real estate strategy to optimize how we can best serve the customers' shopping preferences. When we decide to open a new store in either new or existing markets, our primary focus is on power strip centers. We also look to reposition existing stores as opportunities arise. Depending on the market, we also consider regional malls, lifestyle centers and urban street locations. In general, our evaluation of potential new stores integrates information on demographics, co-tenancy, retail traffic patterns, site visibility and accessibility, store size and configuration, and lease terms. Our real estate decision-making entails an analysis of underlying demand for our products through both physical and digital channels. Our analysis also looks at current penetration levels in markets we serve and our ability to deepen our market share and acquire new customers.
As of January 28, 2017, we operated 501 DSW stores in 43 states, the District of Columbia and Puerto Rico. The following table sets forth the number of our DSW stores by state and territory:
Location | Number of Stores | Location | Number of Stores | Location | Number of Stores | |||||||
Alabama | 6 | Louisiana | 4 | North Dakota | 1 | |||||||
Arizona | 10 | Maine | 1 | Ohio | 21 | |||||||
Arkansas | 1 | Maryland | 20 | Oklahoma | 3 | |||||||
California | 47 | Massachusetts | 17 | Oregon | 6 | |||||||
Colorado | 11 | Michigan | 20 | Pennsylvania | 25 | |||||||
Connecticut | 11 | Minnesota | 11 | Puerto Rico | 2 | |||||||
Delaware | 1 | Mississippi | 1 | Rhode Island | 2 | |||||||
Florida | 30 | Missouri | 5 | South Carolina | 3 | |||||||
Georgia | 16 | Nebraska | 3 | Tennessee | 8 | |||||||
Idaho | 1 | Nevada | 3 | Texas | 43 | |||||||
Illinois | 28 | New Hampshire | 2 | Utah | 3 | |||||||
Indiana | 12 | New Jersey | 19 | Virginia | 22 | |||||||
Iowa | 2 | New Mexico | 1 | Washington | 12 | |||||||
Kansas | 3 | New York | 37 | District of Columbia | 3 | |||||||
Kentucky | 4 | North Carolina | 10 | Wisconsin | 10 | |||||||
Total | 501 | |||||||||||
Through our investment in Town Shoes, we serve Canadian customers with great values on branded footwear and accessories within a variety of concepts, including DSW Designer Shoe Warehouse stores. As of January 28, 2017, there are 23 DSW Designer Shoe Warehouse stores in Canada. Through our franchise arrangement with the Apparel Group, we expect to expand DSW by up to 40 stores in the Gulf Coast region of the Middle East, both in malls and on high street locations, with the first stores opening in fiscal 2017. With our acquisition of Ebuys, we are expanding our presence into several fast-growing digital marketplaces that appeal to value-oriented customers.
Investment in Our Infrastructure
We continue to invest in systems in order to enhance our customers' experience, both in-store and online, which includes supporting our omni-channel capabilities. We are also enhancing systems for back-office support. Over the past few years, we have completed investments in our supply chain to support assortment planning, size replenishment and size optimization.
3
Our primary distribution center is located in an approximately 625,000 square foot facility in Columbus, Ohio. The distribution center operates to facilitate the prompt delivery of purchases and fast-selling footwear so we can take full advantage of each selling season. To further ensure prompt delivery, we engage a logistics service provider to receive orders originating from suppliers on the West Coast and some imports entering at a West Coast port of entry through a West Coast facility we utilize. Merchandise is transported either from the West Coast facility or our primary distribution center to our pool points and then on to stores.
Our order routing optimization system determines the best location to fulfill digitally demanded products, which allows us to optimize our operating profit. Orders originating online can be fulfilled from a store or our fulfillment center, which is also located in Columbus, Ohio. The fulfillment center processes orders, which are shipped to a customer's home or to a store when an order is placed through buy online, ship to store. Orders originating from a store that cannot be fulfilled immediately in that store can either be fulfilled from our ship from store capability, from the fulfillment center, or drop shipped from a vendors' warehouse.
In order to support the planned growth of Ebuys' operations, we are transitioning Ebuys' existing fulfillment centers into a single larger facility in Nashville, Tennessee that will double its supply chain capabilities.
Utilizing Our Financial Strength
Over the past five years, our net sales have grown at a compounded annual growth rate of 6%. In addition, we have consistently generated positive operating cash flows and profitable operating results. Our liquidity, strong vendor relationships and talented associates enable us to differentiate our assortment and run a profitable business compared to our peers.
We are committed to a disciplined process in capital allocation. We believe cash generated from operations, together with our cash and investments of $287.1 million as of January 28, 2017, is sufficient to maintain our ongoing operations, support seasonal working capital requirements, fund capital expenditures, and make quarterly dividend payments and opportunistic share repurchases. In addition, our strong balance sheet allows us to pursue inorganic growth through investments like Town Shoes and Ebuys.
Affiliated Business Group
The Affiliated Business Group partners with multi-category retailers to develop strategies and business models for targeted shoe assortments. We leverage our sourcing network to produce a merchandise assortment that meets the needs of our affiliated business customers. We have renewable supply agreements to provide merchandise for the shoe departments in Stein Mart, Gordmans, and Frugal Fannie's stores through December 2017, January 2019 and April 2018, respectively. As of January 28, 2017, we supplied merchandise to 288 Stein Mart stores and Steinmart.com, 106 Gordmans stores and Gordmans.com, and one Frugal Fannie's store. We continue to pursue opportunities for new affiliated business partners.
Additional Information
Competition
The retail footwear market is highly competitive with few barriers to entry. We compete against a diverse group of retailers, both small and large, including department stores, mall-based shoe stores, national chains, independent shoe retailers, single-brand specialty retailers, online shoe retailers, brand-oriented discounters, multi-channel specialty retailers and brand suppliers who sell directly to consumers. Many of our competitors generally offer a more limited assortment at higher initial prices in a less convenient format than DSW and without the benefits of the DSW Rewards program. In addition, we believe we successfully compete against retailers who have attempted to duplicate our format because they typically offer assortments with fewer recognizable brands and more styles from prior seasons, unlike DSW's current on-trend merchandise. We believe that our brick and mortar stores provide a competitive advantage by stimulating digital sales, driving growth in DSW segment sales and providing a convenient location for customers to pick up and return products ordered online, as well as serving as geographically appropriate shipment centers for our digitally demanded products.
4
Intellectual Property
We have registered a number of trademarks, service marks and domain names in the United States and internationally, including DSW®, DSW Shoe Warehouse® and DSW Designer Shoe Warehouse®. We licensed our DSW Designer Shoe Warehouse trademark to Town Shoes and the Apparel Group. We also have registered trademarks through our acquisition of Ebuys including Apparel Save®, ShoeMetro®, ShoeMetro.com® and SM ShoeMetro®. We believe our trademarks and service marks, especially those related to the DSW concept, have significant value and are important to building our name recognition. To protect our brand identity, we have also protected the DSW trademark in several foreign countries. We also hold patents related to our unique store fixtures, which gives us greater efficiency in stocking and operating those stores that currently have the fixtures. We aggressively protect our patented fixture designs, as well as our packaging, private brand names, store design elements, marketing slogans and graphics.
Associates
As of January 28, 2017, we employed approximately 12,600 associates. None of our associates are covered by any collective bargaining agreements. We offer competitive wages, paid time off, comprehensive medical and dental insurance, vision care, company-paid and supplemental life insurance programs, associate-paid long-term disability and company-paid short-term disability insurance and a 401(k) plan to our full-time associates and some of our part-time associates. We have not experienced any work stoppages, and we consider our relations with our associates to be good.
Seasonality
Our business is subject to seasonal merchandise trends driven by the change in weather conditions and our customers' interest in new seasonal styles. New spring styles are primarily introduced in the first quarter and new fall styles are primarily introduced in the third quarter.
Available Information
DSW Inc. electronically files reports with the Securities and Exchange Commission ("SEC"), including annual reports on Form 10-K, quarterly reports on Form 10-Q, current reports on Form 8-K, proxy statements and amendments to such reports. The public may read and copy any materials that DSW Inc. files with the SEC at:
SEC Public Reference Room
100 F Street N.E.
Washington, D.C. 20549
The public may obtain information on the operation at the SEC Public Reference Room by calling the SEC at 1-800-SEC-0330. The SEC also maintains a website that contains reports, proxy statements and other information regarding issuers that file electronically with the SEC at www.sec.gov. Additionally, information about DSW Inc., including its reports filed with or furnished to the SEC, is available through DSW Inc.'s website at www.dswinc.com. Such reports are accessible at no charge through DSW Inc.'s website and are made available as soon as reasonably practicable after such material is filed with or furnished to the SEC.
Copies of any of the above-referenced documents will also be made available, free of charge, upon written request to:
DSW Inc.
Investor Relations
810 DSW Drive
Columbus, OH 43219
We have included our website addresses throughout this report as textual references only. The information contained on our websites is not incorporated into this Form 10-K.
5
ITEM 1A. | RISK FACTORS |
In addition to the other information in this Annual Report on Form 10-K, shareholders or prospective investors should carefully consider the following risk factors when evaluating DSW Inc. If any of the events described below occurs, our business, financial condition, results of operations and future growth prospects could be negatively affected.
Risks Relating to Our Business
Our strategy of growing our store base and digital demand could strain our resources and have a material adverse effect on our business and financial performance.
Our continued and future growth in part depends on our ability to successfully open and operate new DSW stores on a profitable basis. We also continue to invest in our digital capabilities in order to deliver a high-quality, coordinated shopping experience for our customers, which requires substantial investment in technology. This continued growth could place increased demands on our financial, managerial, operational and administrative resources. We may not achieve our planned growth on a timely and profitable basis or achieve results in new locations similar to those achieved in existing locations in prior periods.
We plan to open approximately 15 to 17 DSW stores in fiscal 2017. Our ability to open and operate new DSW stores on a timely and profitable basis depends on many factors, including our ability to: identify suitable markets and sites for new store locations with financially stable co-tenants and landlords; negotiate acceptable lease terms; build-out or refurbish sites on a timely and effective basis; obtain sufficient levels of inventory to meet the needs of new stores; obtain sufficient financing and capital resources or generate sufficient operating cash flows from operations to fund growth; open new stores at costs not significantly greater than those anticipated; successfully open new DSW stores in markets in which we currently have few or no stores; control the costs of other capital investments associated with store openings; hire, train and retain qualified managers and store personnel; and successfully integrate new stores into our existing infrastructure, operations, management and distribution systems or adapt such infrastructure, operations and systems to accommodate our growth. As a result, we may be unable to open new stores at the rates expected or at all. If we fail to successfully implement our growth strategy, the opening of new DSW stores could be delayed or prevented, could cost more than anticipated and could divert resources from other areas of our business, any of which could have a material adverse effect on our business. To the extent that we open new DSW stores in our existing markets, we may experience reduced net sales in existing stores in those markets. As our store base increases, our stores will become more concentrated in the markets we serve. As a result, the number of customers and financial performance of individual stores may decline and the average sales per square foot at our stores may be reduced, which could have a material adverse effect on our business.
As we introduce enhancements to dsw.com and m.dsw.com, the DSW mobile site, we could experience downtime or other technical issues, which could have a material adverse effect on our business. In addition, the growth in digital demand could result in a diversion of traffic from our stores.
Our failure to protect our reputation could have a material adverse effect on our brands.
The value of our brand is largely dependent on the success of our merchandise assortment and our ability to provide a consistent, high quality customer experience. Any negative publicity about us or the significant brands we offer may reduce demand for our merchandise. Failure to comply with ethical, social, product, labor, health and safety, accounting or environmental standards could also jeopardize our reputation and potentially lead to various adverse consumer actions. Consumer actions could include boycotts and negative publicity through social or digital media. Public perception about us or the products we carry, whether justified or not, could impair our reputation, involve us in litigation, damage our brand and have a material adverse effect on our business.
We rely on our strong relationships with vendors to purchase brand name and designer merchandise at favorable prices. If these relationships were to be impaired, we may not be able to obtain a sufficient assortment of merchandise at attractive prices, and we may not be able to respond promptly to changing fashion trends, either of which could have a material adverse effect on our business and financial performance.
Our success depends, to a significant extent, on the willingness and ability of our vendors to supply us with sufficient inventory to stock our sales channels as we generally do not have long-term supply agreements or exclusive arrangements with any vendors. If we fail to maintain strong relationships with our existing vendors or to ensure the quality of merchandise they supply us, and if we cannot maintain or acquire new vendors of in-season brand name and designer merchandise, our ability to obtain a sufficient amount and variety of merchandise at favorable prices may be limited, which could have a negative impact
6
on our business. In addition, our inability to stock our sales channels with in-season merchandise at attractive prices could result in lower net sales and decreased customer interest in our sales channels, which could have a material adverse effect on our business. Further, if our merchandise costs increase due to increases incurred by our vendors in raw materials, energy, labor, or duties and taxes on imports, or other reasons, our ability to respond or the effect of our response could adversely affect our net sales or gross profit. During fiscal 2016, three key vendors together supplied approximately 18% of our merchandise. The loss of, or a reduction in, the amount and quality of merchandise supplied by any one of these vendors could have an adverse effect on our business. In addition, any negative brand image, wide-spread product defects, or negative publicity related to these three key vendors, or other vendors, could have an adverse effect on our brand reputation and on our business.
We may be unable to anticipate and respond to fashion trends, consumer preferences and changing customer expectations, which could have a material adverse effect on our business.
Our merchandising strategy is based on having the proper mix of products in each store to attract our target customers or having those products available via our omni-channel capabilities. This requires us to anticipate and respond to numerous and fluctuating variables in fashion trends and other conditions in the markets in which our stores are situated. A variety of factors will affect our ability to maintain the proper mix of products in each store, including: local economic conditions impacting customers' discretionary spending; unanticipated fashion trends; our ability to provide timely access to in-season merchandise at attractive prices; our success in distributing merchandise to our stores in an efficient manner; and changes in weather patterns, which in turn affect consumer preferences. If we are unable to anticipate and fulfill the merchandise needs of our customers, we may experience decreases in our net sales and may be forced to increase markdowns in relation to slow-moving merchandise, either of which could have a material adverse effect on our business.
Being an omni-channel retailer is a business necessity to meet changing customer experience expectations and an opportunity to create a competitive advantage. It is a business necessity because the DSW customer expects to be able to shop across all sales channels. The omni-channel strategy can also create distance between DSW and single channel competitors as well as multi-channel competitors who either do not operate in an omni-channel way or do not define omni-channel as broadly as DSW. In the event that our omni-channel strategy does not meet customer expectations, it may have a material adverse effect on our business.
The loss or disruption of our distribution and/or fulfillment centers could have a material adverse effect on our business and operations.
For our DSW stores and affiliated businesses, the majority of our inventory is shipped directly from suppliers to our distribution center in Columbus, Ohio and a West Coast facility operated by a third party, where the inventory is then processed, sorted and shipped to one of our pool locations located throughout the country and then on to the stores. Our inventory can also be shipped directly from our fulfillment center, also located in Columbus, Ohio, and supported by a third party, to our customers. Through our ship from store capability, our inventory is shipped directly from our DSW stores. Through our drop ship program, inventory is shipped from the vendors' warehouse directly to the customer. In order to support the planned growth of Ebuys' operations, we are transitioning Ebuys' existing fulfillment centers into a single larger facility in Nashville, Tennessee that will double its supply chain capabilities.
Our operating results depend on the orderly operation of our receiving and distribution process, which in turn depends on third-party vendors' adherence to shipping schedules and our effective management of our distribution facilities. We may not anticipate all the changing demands that our expanding operations will impose on our receiving and distribution system, and events beyond our control, such as disruptions in operations due to catastrophic events, labor disagreements, disruptions with the Ebuys' facility transition, or shipping problems, that may result in delays in the delivery of merchandise to our stores and customers. While we maintain business interruption and property insurance, in the event our distribution and fulfillment centers shut down for any reason or if we were to incur higher costs and longer lead times in connection with a disruption at our distribution and fulfillment centers, our insurance may not be sufficient to cover the impact to the business.
7
The discontinuation of the ABG business could have a material adverse effect on our business and financial performance.
On March 13, 2017, Gordmans, one of our affiliated partners in the ABG segment, filed for relief under Chapter 11 of the United States Bankruptcy Code and announced its plan to liquidate inventory and other assets. The ultimate outcome of the filing and liquidation sale is subject to the oversight and approval of the bankruptcy court. We are monitoring the status of the filing and are taking appropriate actions to maximize the recovery value of the inventory we own at Gordmans locations. As of January 28, 2017, inventory we owned at Gordmans locations was approximately $8.0 million at cost, we had a receivable balance due from Gordmans of $0.3 million, and net property and equipment located in their stores of approximately $0.3 million. Our current estimated annual after-tax loss as a result of Gordmans' actions is approximately $4.0 million to $8.0 million, which includes projected loss in operating profit, additional markdowns of inventory, and the write-down of other assets.
Our contractual termination date for the supply agreement with Stein Mart is December 2017. For fiscal 2016, the total sales from our ABG segment represented 6% of our total company net sales. With the anticipated loss of the Gordmans business, if Stein Mart were to terminate our supply agreement, close a significant number of stores or liquidate, it could have a material adverse effect on our business and financial performance. Further, we may not be able to proportionately reduce expenses compared to the reduction of net sales related to ABG.
We are constantly exploring new business opportunities and implementing initiatives. The failure to successfully execute our strategies may have a material adverse effect on our business, results of operations or financial condition.
The continued development and implementation of new business opportunities and strategies could distract management from our core business. During fiscal 2014, we acquired an equity interest in Town Shoes and entered into a licensing agreement, which allows Town Shoes to use the DSW Designer Shoe Warehouse tradename for their new larger concept Canadian stores. During fiscal 2016, we completed the acquisition of Ebuys and we signed an agreement with the Apparel Group as an exclusive franchise partner in the Gulf Coast region of the Middle East. In the event that we lose focus on our core business or are unsuccessful in the execution of our concept, it may have a material adverse effect on our business, results of operations or financial condition.
New acquisitions could disrupt our ongoing business and adversely impact our results of operations.
The integration of Ebuys may disrupt our business or divert the attention of our management. Achieving the expected benefits depends in large part on our successful integration of the Ebuys operations, systems and personnel with our own in a timely and efficient manner. We cannot ensure that all of our integration efforts will be completed as quickly as expected. Our operating results or financial condition may be adversely impacted by pre-existing claims or liabilities, both known and unknown. In addition, the integration process may strain our financial and managerial controls and reporting systems and procedures and may result in the diversion of management and financial resources from the core business objectives. There can be no assurance that we will successfully integrate our businesses or that we will realize the anticipated benefits of the acquisitions after we complete our integration efforts.
If our international franchisees do not run the stores according to our standards, our brand reputation could be negatively impacted.
We are exposed to risks through international relationships. During fiscal 2014, we entered into a licensing agreement that allows Town Shoes to use the DSW Designer Shoe Warehouse tradename for their new larger concept Canadian stores. During fiscal 2016, we signed a franchise agreement that will permit our franchisee to operate our DSW Designer Shoe Warehouse stores in the Gulf Coast region of the Middle East. Although we evaluated and selected our franchisee and will do so with further franchisees, our ability to impact the success of their operations is limited. Our franchisees may not run the stores according to our standards, which could have a material adverse effect on our brand reputation and our business. We are also subject to certain U.S. laws, including the Foreign Corrupt Practices Act, as well as compliance with the laws of foreign countries in which we operate. Violations of these laws could subject us to sanctions or other fines or penalties that could have a material adverse effect on our business.
8
Our sales and quarterly financial performance may fluctuate for a variety of reasons, including seasonal variability.
Our business is sensitive to consumer spending patterns, which in turn are subject to prevailing regional and national economic conditions and the general level of economic activity. Our comparable sales and quarterly results of operations have fluctuated in the past, and we expect them to continue to fluctuate in the future. A variety of other factors affect our sales and quarterly financial performance, including: uncertain macro-economic conditions and changes in the retail sales environment; changes in our merchandising strategy; timing and concentration of new DSW store openings and related new store and other start-up costs; expenses associated with new DSW stores, our omni-channel strategy and marketing expenses; changes in our merchandise mix; changes in and regional variations in demographic and population characteristics; timing of promotional events; seasonal fluctuations due to weather conditions; and actions by our competitors.
Accordingly, our results for any one fiscal quarter are not necessarily indicative of the results to be expected for any other quarter, and comparable sales for any particular future period may increase or decrease. Our future financial performance may fall below the expectations of securities analysts and investors.
In addition, our business is subject to seasonal merchandise trends when our customers' interest in new seasonal styles increases. New spring styles are introduced in the first quarter and new fall styles are introduced in the third quarter. As a result of seasonal merchandise trends, any factors negatively affecting us during these periods, including adverse weather, the timing and level of markdowns, fashion trends or unfavorable economic conditions, could have a material adverse effect on our business.
The loss or disruption of information technology services could affect our ability to implement our growth strategy and have a material adverse effect on our business.
Our information technology systems are an integral part of our growth strategy in efficiently operating our business, in managing operations and protecting against security risks related to our electronic processing and transmitting of confidential customer and associate data. The requirements to keep our information technology systems operating at peak performance may be higher than anticipated and could strain our capital resources, management of any system upgrades, implementation of new systems and the related change management processes required with new systems and our ability to protect ourselves from any future information security breaches. In addition, any significant disruption of our data center could have a material adverse effect on those operations dependent on those systems, most specifically, store operations, dsw.com, our distribution and fulfillment centers and our merchandising team. While we maintain business interruption and property insurance, in the event our data center was to be shut down, our insurance may not be sufficient to cover the impact to the business.
We accept orders through dsw.com and m.dsw.com, as well as the operations of Ebuys on various digital marketplaces. We are subject to various risks of operating online and mobile selling capabilities such as: the failure of our information technology infrastructure, including any third-party hardware or software, resulting in downtime or other technical issues; reliance on third-party logistics providers to deliver our products to customers; inability to respond to technological changes; violations of state or federal laws; credit card fraud; or other information security breaches. Failure to mitigate these risks could have a material adverse effect on our business.
We face security risks related to our electronic processing of sensitive and confidential customer and associate data. If our data is breached, it could damage our reputation and have a material adverse effect on our business.
Given the nature of our business, we collect, process and retain sensitive and confidential customer data. While we have removed all cardholder data from our environment by upgrading our systems, and despite our current security measures, our facilities and systems, and those of our third-party service providers, may be vulnerable to information security breaches, acts of vandalism, computer viruses or other similar attacks. An information security breach involving the disclosure of confidential data could damage our reputation and our customers' willingness to shop in our stores, on dsw.com and m.dsw.com, and subject us to possible legal liability. In addition, we may incur material remediation costs as a result of an information security breach, including liability for stolen customer or associate data, repairing system damage or providing credit monitoring or other benefits to customers or associates affected by the breach. While we have insurance, in the event we experience an information security breach, our insurance may not be sufficient to cover the impact to the business. Failure to mitigate these risks could have a material adverse effect on our business.
9
Our failure to retain our existing senior management team and to continue to attract qualified new personnel could adversely affect our business.
Our business requires disciplined execution at all levels of our organization, which requires an experienced and talented management team. If we were to lose the benefit of the experience, efforts and abilities of any of our key executives and buying personnel, our business could be adversely affected. We have entered into employment agreements with several key executives and also offer compensation packages designed to attract and retain talent. Furthermore, our ability to manage our expansion will require us to continue to train, motivate and develop our employees to maintain a high level of talent for future challenges and succession planning. Competition for these types of personnel is intense, and we may not be successful in attracting and
retaining the personnel required to grow and operate our business.
We are dependent on our DSW Rewards program and marketing to drive traffic, sales and loyalty, and any decrease in membership or purchases from members could have a material adverse effect on our business.
Customer traffic is influenced by our marketing and our DSW Rewards programs. DSW Rewards is a customer loyalty program that we rely on to drive customer traffic, sales and loyalty. DSW Rewards members earn reward certificates of discounts on future purchases. Approximately 24 million members are enrolled in our DSW Rewards program and have made at least one purchase over the course of the last two years. In fiscal 2016, shoppers in the DSW Rewards program generated approximately 90% of DSW segment sales. In the event that our DSW Rewards members do not continue to shop at DSW, we fail to add new members, the number of members decreases, or our marketing is not effective in driving customer traffic, this could have a material adverse effect on our business.
We are exposed to risk through leases of certain properties.
We have certain portions of our owned properties that are leased to unrelated parties, which provides rental income. The largest tenant's lease renewed for another two-year term in June 2015, but that tenant can terminate at any time with 60 days notice. In addition, we own an office space where we are the tenant under a ground lease that expires in 2024. We sublease the entire space to an unrelated third party at a rent that is lower than the rent for the ground lease. The sublease was renewed for a two-year term in June 2015, but that tenant can terminate at any time with 60 days notice. As a result of a previous merger, we provided a guarantee for a lease commitment that is scheduled to expire in 2024 of a location that has been leased to a third party. In the event that one or more of the third parties does not renew or terminates their arrangement, the foregoing circumstances or events could have a material adverse effect on our financial condition.
Risks Relating to the External Environment
We may be unable to compete in our highly competitive market, which could have a material adverse effect on our business.
The retail footwear market is highly competitive with few barriers to entry. We compete against a diverse group of retailers, both small and large, including department stores, mall-based shoe stores, national chains, independent shoe retailers, single-brand specialty retailers, online shoe retailers, brand-oriented discounters, multi-channel specialty retailers and brand suppliers who sell directly to consumers. Our success depends on our ability to remain competitive with respect to assortment, convenience and value. The performance of our competitors, as well as a change in their pricing policies as a result of the current economic environment, marketing activities and other business strategies, could have a material adverse effect on our business.
Internet and mobile networks have rapidly evolved while consumer receptiveness to shopping online has substantially increased. Competition from ecommerce and mobile players has significantly increased due to their ability to provide improved user experience, greater ease of buying goods, low or no shipping fees, faster shipping times and more favorable return policies. Businesses, including our suppliers, can easily launch online sites and mobile platforms at nominal costs by using commercially available software or partnering with any of a number of successful digital marketplace providers. Competitors with other revenue sources may also be able to devote more resources to marketing and promotional campaigns, adopt more aggressive pricing policies and devote more resources to website, mobile platforms and applications and systems development.
10
We rely on foreign sources for our merchandise, and our business is therefore subject to risks associated with international trade.
We purchase merchandise from domestic and foreign vendors. In addition, many of our domestic vendors import a large portion of their merchandise from abroad, primarily from China, Brazil and Italy. We believe that almost all the merchandise we purchased during fiscal 2016 was manufactured outside the United States, and the majority was manufactured in China. For this reason, we face risks inherent in purchasing from foreign suppliers, such as: economic and political instability in countries where these suppliers are located; international hostilities or acts of war or terrorism affecting the United States or foreign countries from which our merchandise is sourced; increases in shipping costs; transportation delays and interruptions, including increased inspections of import shipments by domestic authorities; work stoppages; U.S. laws affecting the importation of goods, including duties, tariffs and quotas and other non-tariff barriers; expropriation or nationalization; changes in foreign government administration and governmental policies; changes in import duties or quotas; compliance with trade and foreign tax laws; and local business practices, including compliance with foreign laws and with domestic and international labor standards.
We require our vendors to operate in compliance with applicable laws and regulations and our internal requirements. However, we do not control our vendors or their labor and business practices. The violation of labor or other laws by one of our vendors could have a material adverse effect on our business.
Future legislation, regulatory reform or policy changes could have a material adverse effect on our business.
Various federal corporate tax reform bills and other proposals have been or are currently under consideration. These proposals include, among other items: corporate income tax rate changes in varying, uncertain, or unspecified amounts; the reduction or elimination of certain corporate tax incentives; the disallowance of tax deductions for imported merchandise; border adjustments; tariffs on imports; an increase in customs duties; and the renegotiation of U.S. trade agreements. It is not clear whether, or to what extent, these proposals may be enacted. Any potential changes in tax and trade policies in the United States, and the potential corresponding actions by other countries, could have a material adverse effect on our business.
Uncertain economic conditions in the United States and other world events can adversely affect consumer confidence and consumer spending habits, which could result in reduced net sales.
Consumer spending habits, including spending for the footwear and accessories that we sell, are affected by, among other things: prevailing economic conditions; levels of employment; salaries and wage rates; prevailing interest rates; income tax rates and policies; consumer confidence; and consumer perception of economic conditions. In addition, consumer purchasing patterns may be influenced by consumers' disposable income. Consumer confidence is also affected by the domestic and international political environment. The outbreak or escalation of war, natural disasters, or the occurrence of terrorist acts or other hostilities in or affecting the United States, could lead to a decrease in spending by consumers. In an economic slowdown, we could experience lower net sales than expected on a quarterly or annual basis and be forced to delay or slow our expansion plans. Reduced net sales may result in reduced operating cash flows if we are not able to appropriately manage inventory levels or leverage expenses. These negative economic conditions could have a material adverse effect on our business.
Restrictions in our secured revolving credit facility and letter of credit agreement could limit our operational flexibility.
We have a $100 million secured revolving credit agreement and a $50 million letter of credit agreement with terms expiring in July 2018 and August 2018, respectively. The secured revolving credit agreement is secured by a lien on substantially all of our personal property assets and subsidiaries with certain exclusions and may be used to provide funds for general corporate purposes, to provide for ongoing working capital requirements, and to make permitted acquisitions. In addition, both the secured revolving credit agreement and the letter of credit agreement contain restrictive covenants relating to our management and the operation of our business. These covenants, among other things, limit or restrict our ability to grant liens on our assets, limit our ability to incur additional indebtedness, limit our capital expenditures to $200 million annually (the secured revolving credit agreement only), limit our ability to enter into transactions with affiliates and limit our ability to merge or consolidate with another entity. These covenants could restrict our operational flexibility, and any failure to comply with these covenants or our payment obligations would limit our ability to borrow under the secured revolving credit facility and, in certain circumstances, may allow the lenders thereunder to require repayment.
Our cash and investments are subject to risks that could affect the liquidity of these investments.
As of January 28, 2017, we had cash and investments of $287.1 million. A portion of these are held as cash in operating accounts that are with third-party financial institutions. While we regularly monitor the cash balances in our operating accounts
11
and when possible adjust the balances as appropriate to be within Federal Deposit Insurance Corporation insurance limits, these cash balances could be lost or inaccessible if the underlying financial institutions fail or are subject to other adverse conditions in the financial markets.
While we generally invest in lower risk investments, investment risk has been and may further be exacerbated by credit and liquidity issues that have affected various sectors of the financial markets. Our access to cash and investments, their earning potential or our ability to invest in highly rated, low risk investments may be impacted by adverse conditions in the U.S. financial markets. These market risks associated with our cash and investments could have a material adverse effect on our business.
Risks Relating to our Common Shares
Our amended articles of incorporation, amended and restated code of regulations and Ohio state law contain provisions that may have the effect of delaying or preventing a change in control of DSW Inc. This could adversely affect the value of our Common Shares.
Our amended articles of incorporation authorize our Board of Directors to issue up to 100,000,000 preferred shares and to determine the powers, preferences, privileges, rights, including voting rights, qualifications, limitations and restrictions on those shares, without any further vote or action by the shareholders. The rights of the holders of our Class A Common Shares will be subject to, and may be adversely affected by, the rights of the holders of any preferred shares that may be issued in the future. The issuance of preferred shares could have the effect of delaying, deterring or preventing a change in control and could adversely affect the voting power of our Common Shares.
In addition, provisions of our amended articles of incorporation, amended and restated code of regulations and Ohio law, together or separately, could discourage potential acquisition proposals, delay or prevent a change in control or limit the price that certain investors might be willing to pay in the future for our Common Shares. Among other things, these provisions establish a staggered board, require a supermajority vote to remove directors, and establish certain advance notice procedures for nomination of candidates for election as directors and for shareholder proposals to be considered at shareholders' meetings.
We do not expect a trading market for the Company's Class B Common Shares to develop and therefore any investment in the Class B Common Shares may be effectively illiquid, unless such shares are converted into the Company's Class A Common Shares.
There is currently no public market for the Company's Class B Common Shares. We do not intend to list the Class B Common Shares on any securities exchange or any automated quotation system. As a result, there can be no assurance that a secondary market will develop, and we do not expect any market makers to participate in a secondary market. Because the Class B Common Shares are not listed on a securities exchange or an automated quotation system, it may be difficult to obtain pricing information with respect to the shares. Accordingly, there may be a limited number of buyers if a holder decided to sell their Class B Common Shares. This may affect the price a holder would receive upon such sale. Alternatively, a holder of such shares could convert them into Class A Common Shares, on a share for share basis, prior to selling. However, such conversion could affect the timing of any such sale, which may in turn affect the price a holder may receive upon such sale.
The Schottenstein Affiliates, entities owned by or controlled by Jay L. Schottenstein, the executive chairman of the DSW Inc. Board of Directors, and members of his family, directly control or substantially influence the outcome of matters submitted for DSW Inc. shareholder votes, and their interests may differ from other shareholders.
As of January 28, 2017, the Schottenstein Affiliates have approximately 51% of the voting power of the Company's outstanding common shares. The Schottenstein Affiliates directly control or substantially influence the outcome of all matters submitted to DSW Inc.'s shareholders for approval, including the election of directors, approval of mergers or other business combinations, and acquisitions or dispositions of assets. The interests of the Schottenstein Affiliates may differ from or be opposed to the interests of other shareholders, and their level of ownership and voting power in the Company may have the effect of delaying or preventing a subsequent change in control that may be favored by other shareholders.
The Schottenstein Affiliates engage in a variety of businesses, including, but not limited to, business and inventory liquidations, apparel companies and real estate investments. Opportunities may arise in the area of potential competitive business activities that may be attractive to the Schottenstein Affiliates and us. Our amended and restated articles of incorporation provide that the Schottenstein Affiliates are under no obligation to communicate or offer any corporate opportunity to us. In addition, the Schottenstein Affiliates have the right to engage in similar activities as us, do business with our suppliers and customers, and, except as limited by agreement, employ or otherwise engage any of our officers or employees.
12
Risks Relating to our Equity Investment in Town Shoes Limited
We are exposed to investment risk with the acquisition of an equity interest in Town Shoes.
During fiscal 2014, we acquired an equity interest in Town Shoes. We are exposed to risk of the success of the Town Shoes business. We are also exposed to risk of adverse reactions to the transaction or changes to business relationships; competitive responses; inability to maintain key personnel and changes in general economic conditions in Canada. If Town Shoes fails to perform to our expectations, it could have a material adverse effect on our results of operations or financial condition.
We are exposed to foreign currency risk with the acquisition of an equity interest in Town Shoes.
As a result of our equity investment in Town Shoes, we are exposed to foreign currency rate risk. We currently do not utilize hedging instruments to mitigate foreign currency exchange risks. During fiscal 2015, we invested $100 million CAD in available-for-sale securities in Canada and, as a result, any gains or losses due to translation are recorded in other comprehensive income. If the funds are transferred to cash, we will be exposed to foreign currency rate risk due to the impact of the translation being recorded in our statement of operations.
ITEM 1B. | UNRESOLVED STAFF COMMENTS |
None.
ITEM 2. | PROPERTIES |
We own our corporate office headquarters and the DSW segment distribution center. As of January 28, 2017, all 501 DSW stores, our fulfillment center and our Ebuys distribution centers are leased or subleased, including 17 DSW stores and our fulfillment center that are leased or subleased from Schottenstein Affiliates. Most of the DSW store leases provide for a minimum annual rent plus a percentage of gross sales over specified breakpoints and are for a fixed term with options for extension periods, exercisable at our option. The lease for our fulfillment center expires in September 2022 and has two renewal options with terms of five years each. Our DSW segment distribution facility, our corporate office headquarters and our dsw.com fulfillment center are located in Columbus, Ohio. Our Ebuys distribution centers are located in San Diego, California and Nashville, Tennessee. Refer to Item 1. Business of this Annual Report on Form 10-K for the number of our DSW stores by state and territory.
ITEM 3. | LEGAL PROCEEDINGS |
The information set forth in Note 15, Commitments and Contingencies - Legal Proceedings, of the Consolidated Financial Statements of this Annual Report on Form 10-K is incorporated herein by reference.
ITEM 4. | MINE SAFETY DISCLOSURES |
Not Applicable.
PART II
ITEM 5. | MARKET FOR THE REGISTRANT'S COMMON EQUITY, RELATED STOCKHOLDER MATTERS AND ISSUER PURCHASES OF EQUITY SECURITIES |
Common Shares
Our Class A Common Shares are listed for trading under the ticker symbol "DSW" on the New York Stock Exchange ("NYSE"). There is currently no public market for the Company's Class B Common Shares, but the Class B Common Shares can be exchanged for the Company's Class A Common Shares at the election of the holder on a share for share basis. Holders of Class A Common Shares are entitled to one vote per share and holders of Class B Common Shares are entitled to eight votes per share on matters submitted to shareholders for approval. As of March 17, 2017, there were 192 holders of record of our Class A Common Shares and 28 holders of record of our Class B Common Shares. The number of holders of record is based upon the actual number of holders registered at such date and does not include holders of shares in "street names" or persons, partnerships, associates, corporations, or other entities identified in security position listings maintained by depositories. The following table sets forth the high and low prices of our Class A Common Shares as reported on the NYSE for each quarter in fiscal 2016 and 2015:
13
Fiscal 2016 | Fiscal 2015 | ||||||||||||||
Market Price | |||||||||||||||
High | Low | High | Low | ||||||||||||
First Quarter | $ | 29.53 | $ | 21.99 | $ | 39.58 | $ | 34.04 | |||||||
Second Quarter | 24.98 | 18.51 | 36.92 | 30.75 | |||||||||||
Third Quarter | 26.22 | 20.07 | 33.81 | 23.61 | |||||||||||
Fourth Quarter | 25.96 | 20.08 | 25.46 | 21.23 | |||||||||||
Dividends
The payment of any future dividends is at the discretion of our Board of Directors and is based on our future earnings, cash flow, financial condition, capital requirements, changes in taxation laws, general economic condition and any other relevant factors. It is anticipated that dividends will be declared on a quarterly basis. Our Credit Facility allows the payment of dividends by us or our subsidiaries, provided that we meet the minimum cash and investments requirement, as defined in our Credit Facility, of $125 million. The cash dividend was $0.20 per Class A Common Share and Class B Common Share for each quarter in fiscal 2016 and 2015.
Share Repurchase Program
On November 2, 2015, the Board of Directors approved an additional $200 million share repurchase program after the previous $150 million authorization was fully utilized. The share repurchase program may be suspended, modified or discontinued at any time, and we have no obligation to repurchase any amount of our common shares under the program. We will determine the amount of shares to repurchase based on generated and expected cash flow and cash usage needs, past and anticipated business performance and available alternative investment opportunities. Shares will be repurchased in the open market at times and in amounts based on price and market conditions.
The following table sets forth the Class A Common Share repurchases during the most recent quarter:
(a) Total Number of Shares Purchased | (b) Average Price Paid per Share | (c) Total Number of Shares Purchased as Part of Publicly Announced Programs | (d) Approximate Dollar Value of Shares that May Yet Be Purchased Under the Programs | ||||||||||
(in thousands, except per share amounts) | |||||||||||||
October 30, 2016 to November 26, 2016(1) | 351 | $ | 20.80 | 351 | $ | 33,469 | |||||||
November 27, 2016 to December 31, 2016(2) | 4 | $ | 24.45 | — | $ | 33,469 | |||||||
January 1, 2017 to January 28, 2017 | — | $ | — | — | $ | 33,469 | |||||||
355 | $ | 20.84 | 351 | ||||||||||
(1) | The total number of shares repurchased includes shares repurchased as part of publicly announced programs (the average price paid per share includes any broker commissions). |
(2) | The total number of shares repurchased relates to shares withheld in connection with tax payments due upon vesting of employee restricted stock awards. |
14
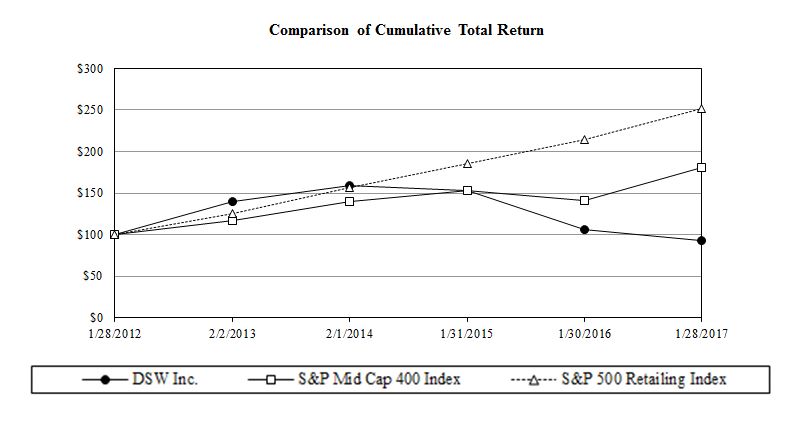
Performance Graph
The following graph compares our cumulative total shareholder return on our Class A Common Shares with the cumulative total returns of the Standard and Poor's ("S&P") MidCap 400 Index and the S&P Retailing Index, both of which are published indexes. The comparison of the cumulative total returns for each investment assumes that $100 was invested on January 28, 2012 and that all dividends were reinvested. This comparison includes the period ended January 28, 2012 through the period ended January 28, 2017.
Fiscal years ended | ||||||||||||||||||||||||
Company / Index | 1/28/2012 | 2/2/2013 | 2/1/2014 | 1/31/2015 | 1/30/2016 | 1/28/2017 | ||||||||||||||||||
DSW Inc. | $ | 100.00 | $ | 139.92 | $ | 158.89 | $ | 153.55 | $ | 106.43 | $ | 93.25 | ||||||||||||
S&P MidCap 400 Index | $ | 100.00 | $ | 116.75 | $ | 140.21 | $ | 153.24 | $ | 140.71 | $ | 181.17 | ||||||||||||
S&P 500 Retailing Index | $ | 100.00 | $ | 125.90 | $ | 156.47 | $ | 185.81 | $ | 214.72 | $ | 251.84 | ||||||||||||
15
ITEM 6. SELECTED FINANCIAL DATA
The following table sets forth various selected financial information. Such selected consolidated financial data should be read in conjunction with our Consolidated Financial Statements, including the notes thereto, set forth in Item 8 of this Annual Report on Form 10-K and Management's Discussion and Analysis of Financial Condition and Results of Operations set forth in Item 7 of this Annual Report on Form 10-K.
Fiscal(1) | |||||||||||||||||||
2016(2) | 2015 | 2014 | 2013 | 2012 | |||||||||||||||
(in thousands, except per share data, store count and per square foot data) | |||||||||||||||||||
Statement of Operations Data: | |||||||||||||||||||
Net sales | $ | 2,711,444 | $ | 2,620,248 | $ | 2,496,092 | $ | 2,368,668 | $ | 2,257,778 | |||||||||
Gross profit(3) | $ | 771,833 | $ | 768,369 | $ | 755,021 | $ | 739,287 | $ | 724,720 | |||||||||
Operating expenses | $ | (591,816 | ) | $ | (554,818 | ) | $ | (512,536 | ) | $ | (497,863 | ) | $ | (481,797 | ) | ||||
Operating profit | $ | 200,168 | $ | 213,551 | $ | 242,485 | $ | 241,424 | $ | 236,802 | |||||||||
Income from continuing operations, net of tax | $ | 124,535 | $ | 136,034 | $ | 153,027 | $ | 151,302 | $ | 145,186 | |||||||||
Income from discontinued operations, net of tax | $ | — | $ | — | $ | 272 | $ | — | $ | 1,253 | |||||||||
Net income | $ | 124,535 | $ | 136,034 | $ | 153,299 | $ | 151,302 | $ | 146,439 | |||||||||
Earnings per Share Data: | |||||||||||||||||||
Diluted earnings per share from continuing operations | $ | 1.52 | $ | 1.54 | $ | 1.69 | $ | 1.65 | $ | 1.60 | |||||||||
Diluted earnings per share from discontinued operations | $ | — | $ | — | $ | 0.00 | $ | — | $ | 0.01 | |||||||||
Diluted earnings per share | $ | 1.52 | $ | 1.54 | $ | 1.69 | $ | 1.65 | $ | 1.62 | |||||||||
Weighted average number of diluted shares outstanding | 82,135 | 88,501 | 90,612 | 91,901 | 90,606 | ||||||||||||||
Balance Sheet Data: | |||||||||||||||||||
Cash and investments(4) | $ | 287,091 | $ | 330,475 | $ | 447,128 | $ | 579,307 | $ | 409,890 | |||||||||
Inventory | $ | 499,995 | $ | 484,236 | $ | 450,836 | $ | 397,768 | $ | 393,794 | |||||||||
Total assets | $ | 1,428,476 | $ | 1,369,109 | $ | 1,438,243 | $ | 1,421,244 | $ | 1,262,103 | |||||||||
Total shareholders' equity | $ | 937,488 | $ | 904,924 | $ | 1,011,120 | $ | 998,544 | $ | 858,579 | |||||||||
Other Data: | |||||||||||||||||||
Comparable sales change(5) | (3.0 | )% | 0.8 | % | 1.8 | % | 0.2 | % | 5.5 | % | |||||||||
DSW stores (excluding licensed stores): | |||||||||||||||||||
Beginning of period | 468 | 431 | 394 | 364 | 326 | ||||||||||||||
New stores | 34 | 40 | 37 | 30 | 39 | ||||||||||||||
Closed stores | (1 | ) | (3 | ) | — | — | (1 | ) | |||||||||||
End of period | 501 | 468 | 431 | 394 | 364 | ||||||||||||||
DSW square footage(6) | 10,336 | 9,805 | 9,277 | 8,687 | 8,120 | ||||||||||||||
Average gross square footage(7) | 10,063 | 9,591 | 9,009 | 8,415 | 7,690 | ||||||||||||||
DSW segment net sales per average gross square foot(8) | $ | 246 | $ | 258 | $ | 261 | $ | 265 | $ | 276 | |||||||||
Number of affiliated business departments at the end of period | 395 | 379 | 371 | 356 | 344 | ||||||||||||||
Cash dividends per share | $ | 0.800 | $ | 0.800 | $ | 0.750 | $ | 0.375 | $ | 1.435 | |||||||||
16
____________
(1) | All fiscal years are based on a 52-week year, except for fiscal 2012, which is based on a 53-week year. |
(2) | Fiscal 2016 includes the results of operations of Ebuys, which we acquired on March 4, 2016. |
(3) | Gross profit is defined as net sales less cost of sales. Cost of sales includes the cost of merchandise, which includes markdowns and shrinkage, and expenses associated with distribution and fulfillment (including depreciation) and store occupancy (excluding depreciation and including store impairments). The calculation of gross profit varies across the retail industry and, as a result, the calculations of other retail companies may not be consistent with our calculation. |
(4) | Includes cash and cash equivalents, short-term and long-term investments. |
(5) | A store or affiliated shoe department is considered comparable when in operation for at least 14 months at the beginning of the fiscal year. Stores or affiliated business departments, as the case may be, are added to the comparable base at the beginning of the year and are dropped for comparative purposes in the quarter they are closed. Comparable sales includes sales from dsw.com. The calculation of comparable sales varies across the retail industry and, as a result, the calculations of other retail companies may not be consistent with our calculation. |
(6) | DSW square footage represents the total amount of square footage as of the end of the fiscal year for DSW stores only and does not include square footage of the distribution and fulfillment centers or the affiliated business departments. |
(7) | Average gross square footage represents the monthly average of square feet for DSW stores only for each period presented and consequently reflects the effect of opening stores in different months throughout the period. |
(8) | Net sales per average gross square foot is the result of dividing net sales for the DSW segment for the period presented by average gross square footage. |
17
ITEM 7. | MANAGEMENT'S DISCUSSION AND ANALYSIS OF FINANCIAL CONDITION AND RESULTS OF OPERATIONS |
This management's discussion and analysis of financial condition and results of operations contains forward-looking statements that involve various risks and uncertainties. See Cautionary Statement on page iii for a discussion of the uncertainties, risks and assumptions associated with these statements. You should read the following discussion in conjunction with our Consolidated Financial Statements, including the notes thereto, set forth in Item 8 of this Annual Report on Form 10-K. The results of operations for the periods reflected herein are not necessarily indicative of results that may be expected for future periods, and our actual results may differ materially from those discussed in the forward-looking statements as a result of various factors, including but not limited to those listed under Item 1A. Risk Factors of this Annual Report on Form 10-K and included elsewhere in this Annual Report on Form 10-K.
Executive Summary
We continue to focus on enhancing our offerings to the customer with a differentiated assortment by increasing the distortion towards growth categories while right sizing inventory and choice counts in other categories. By working closely with our vendors we are able to introduce new brands, improve sourcing costs and secure opportunistic buys. Beginning in fiscal 2016, we supplemented our branded assortment with compelling values from our exclusive private brands. We are now working with a new partner to further strengthen our private brand offerings. We continue to support our merchandising efforts with targeted marketing to highlight the compelling values we offer every day.
Recent investments have enabled us to better leverage our warehouse network. With our brick and mortar locations within 20 miles from 70% of our target population, we will continue to invest in new capabilities that provide a seamless shopping experience, such as the recent enhancements that allows customers to buy online, pickup in store and buy online, ship to store. We will dramatically elevate our digital experience with the much anticipated site redesign of dsw.com in fiscal 2017, which will integrate customer rewards information and product preferences into a new mobile-oriented and responsive site. Furthermore, we have partnered with a technology leader to develop a proprietary technology that will give our associates all the data they need at their fingertips to run our stores and serve our customers. With the acquisition of Ebuys, we have expanded our presence in the fast-growing digital marketplaces and have started building the infrastructure that will allow us to better leverage Ebuys’ platform in the coming years.
Financial Summary
Total net sales increased to $2.7 billion for fiscal 2016 from $2.6 billion for fiscal 2015. The 3.5% increase in total net sales was driven by the incremental sales from Ebuys, which was acquired during the beginning of fiscal 2016, and non-comparable store sales, partially offset by the 3.0% decrease in comparable sales.
In fiscal 2016, DSW's gross profit as a percentage of net sales was 28.5%, a decrease of 80 basis points from 29.3% in the previous year. The decrease in the gross profit rate was primarily driven by the addition of Ebuys during the current year at lower margins.
Net income for fiscal 2016 was $124.5 million, or $1.52 per diluted share, which included net favorable pre-tax adjustments of $12.4 million, or $0.09 per share, related to the acquisition of Ebuys, including a reduction of the contingent consideration liability, the amortization of intangibles, transaction costs, and inventory step-up costs, as well as pre-tax charges of $4.5 million, or $0.03 per share, from restructuring costs. Net income for fiscal 2015 was $136.0 million, or $1.54 per diluted share.
We have continued making investments in our business that support our long-term growth objectives. On March 4, 2016, we acquired Ebuys, a leading off price footwear and accessories retailer operating in digital marketplaces, for a total purchase price of $113.1 million. During fiscal 2016, we invested $87.6 million in capital expenditures compared to $103.9 million during fiscal 2015. Our capital expenditures during fiscal 2016 were primarily related to 34 new store openings, store remodels and business infrastructure. We plan to open approximately 15 to 17 stores in fiscal 2017.
As of January 28, 2017, we operated 501 DSW stores, dsw.com and shoe departments in 288 Stein Mart stores and Steinmart.com, 106 Gordmans stores and Gordmans.com, and one Frugal Fannie's store.
18
Results of Operations
The following represents selected components of our consolidated results of operations, expressed as percentages of net sales:
Fiscal | ||||||||
2016 | 2015 | 2014 | ||||||
Net sales | 100.0 | % | 100.0 | % | 100.0 | % | ||
Cost of sales | (71.5 | ) | (70.7 | ) | (69.8 | ) | ||
Gross profit | 28.5 | 29.3 | 30.2 | |||||
Operating expenses | (21.8 | ) | (21.2 | ) | (20.5 | ) | ||
Change in fair value of contingent consideration | 0.7 | — | — | |||||
Operating profit | 7.4 | 8.1 | 9.7 | |||||
Interest income, net | 0.1 | 0.1 | 0.2 | |||||
Non-operating income | 0.0 | 0.1 | — | |||||
Income from continuing operations before income taxes and income (loss) from Town Shoes | 7.5 | 8.3 | 9.9 | |||||
Income tax provision | (2.9 | ) | (3.2 | ) | (3.9 | ) | ||
Income (loss) from Town Shoes | 0.0 | 0.1 | 0.1 | |||||
Net income | 4.6 | % | 5.2 | % | 6.1 | % | ||
Fiscal 2016 Compared to Fiscal 2015 and Fiscal 2015 Compared to Fiscal 2014
Net Sales
Net sales for fiscal 2016 increased by 3.5% from fiscal 2015 and net sales for fiscal 2015 increased by 5.0% from fiscal 2014. The following summarizes the change in total net sales from the previous fiscal year:
Fiscal | |||||||||||
2016 | 2015 | 2014 | |||||||||
(in millions) | |||||||||||
Net sales for the previous fiscal year | $ | 2,620.2 | $ | 2,496.1 | $ | 2,368.7 | |||||
Increase (decrease) in comparable sales | (75.3 | ) | 19.5 | 40.0 | |||||||
Increase due to Ebuys sales | 83.8 | — | — | ||||||||
Net increase from non-comparable store sales and other changes | 82.7 | 104.6 | 87.4 | ||||||||
Total net sales | $ | 2,711.4 | $ | 2,620.2 | $ | 2,496.1 | |||||
The following summarizes net sales by segment:
Fiscal | |||||||||||
2016 | 2015 | 2014 | |||||||||
(in millions) | |||||||||||
DSW segment | $ | 2,478.0 | $ | 2,470.1 | $ | 2,352.5 | |||||
ABG segment | 149.6 | 150.1 | 143.6 | ||||||||
Other(1) | 83.8 | — | — | ||||||||
Total net sales | $ | 2,711.4 | $ | 2,620.2 | $ | 2,496.1 | |||||
(1) | Other represents net sales for Ebuys. |
19
The following summarizes our comparable sales change by reportable segment and in total:
Fiscal | ||||||||
2016 | 2015 | 2014 | ||||||
DSW segment | (2.9 | )% | 0.8 | % | 1.8 | % | ||
ABG segment | (3.7 | )% | 1.7 | % | 1.6 | % | ||
Total | (3.0 | )% | 0.8 | % | 1.8 | % | ||
Fiscal 2016 vs. Fiscal 2015- Our increase in total net sales was driven by the incremental sales from the acquisition of Ebuys as our non-comparable sales offset the decrease in comparable sales. During fiscal 2016, comparable transactions decreased by a low single digit and comparable average dollar sales also decreased by a low single digit in the DSW segment. Comparable sales for the DSW segment benefited by the ongoing reallocation within our footwear business towards key fashion and athletic trends and the launch of the kids category into half of the chain. This was offset by our commitment to reduce excess promotional activity during the holiday season as we planned lower sales and inventory levels that resulted in a significant improvement in markdowns during the fall season. Our recent technology and omni-channel investments drove growth in digital demand throughout the year. Sales for the ABG segment remained flat primarily as the result of comparable sales declines offset by the net addition of 16 new shoe departments in fiscal 2016.
Fiscal 2015 vs. Fiscal 2014- Our increase in total net sales for the DSW segment was the result of an increase in comparable sales, which includes an increase in digitally demanded sales, and non-comparable sales growth as a result of stores opened in fiscal 2014, as well as 37 net new DSW stores in fiscal 2015. During fiscal 2015, comparable transactions increased by a low single digit while comparable average dollar sales decreased by a low single digit in the DSW segment. The increase in total net sales for our ABG segment was primarily the result of comparable sales growth and the net addition of eight new shoe departments in fiscal 2015.
Gross Profit
Gross profit decreased as a percentage of net sales to 28.5% in fiscal 2016 from 29.3% in fiscal 2015 and 30.2% in fiscal 2014. The following presents each segment's gross profit, and the components, and total Company gross profit as a percentage of net sales:
Fiscal | ||||||||
2016 | 2015 | 2014 | ||||||
DSW segment merchandise margin | 43.1 | % | 42.8 | % | 43.7 | % | ||
Store occupancy expenses | (11.1 | ) | (10.7 | ) | (10.7 | ) | ||
Distribution and fulfillment expenses | (2.2 | ) | (2.1 | ) | (2.1 | ) | ||
DSW segment gross profit | 29.8 | % | 30.0 | % | 30.9 | % | ||
ABG segment merchandise margin | 42.4 | % | 41.1 | % | 42.4 | % | ||
Occupancy expenses | (20.4 | ) | (21.4 | ) | (21.5 | ) | ||
Distribution and fulfillment expenses | (1.1 | ) | (1.1 | ) | (1.1 | ) | ||
ABG segment gross profit | 20.9 | % | 18.6 | % | 19.8 | % | ||
Other segment merchandise margin - Ebuys | 28.8 | % | — | % | — | % | ||
Marketplace fees | (11.8 | ) | — | — | ||||
Distribution and fulfillment expenses | (13.2 | ) | — | — | ||||
Other segment gross profit - Ebuys | 3.8 | % | — | % | — | % | ||
Total Company gross profit | 28.5 | % | 29.3 | % | 30.2 | % | ||
Fiscal 2016 vs. Fiscal 2015- DSW segment merchandise margin increased 30 basis points, which was offset by increases in occupancy expenses of 40 basis points and distribution and fulfillment expenses of 10 basis points. Merchandise margin for the DSW segment increased as a percentage of net sales due to lower markdowns, partially offset by lower initial markup and the deleverage of shipping costs. Related to our ABG segment, gross profit increased 230 basis points due to higher initial markup and lower markdowns.
20
Fiscal 2015 vs. Fiscal 2014- DSW segment merchandise margin decreased 90 basis points while occupancy expenses and distribution and fulfillment expenses were flat year over year. Merchandise margin for the DSW segment decreased as a percentage of net sales due to higher markdowns, which were a result of unseasonably warm weather that created a challenging retail environment. Related to our ABG segment, gross profit decreased due to higher markdowns.
Operating Expenses
Fiscal 2016 vs. Fiscal 2015- Operating expenses as a percentage of net sales were 21.8% and 21.2% for fiscal 2016 and fiscal 2015, respectively. The increase as a percentage of net sales over the prior year was driven by increased marketing expenses and home office overhead, which includes the impact of Ebuys acquisition-related costs and restructuring expenses.
Fiscal 2015 vs. Fiscal 2014- Operating expenses as a percentage of net sales were 21.2% and 20.5% for fiscal 2015 and fiscal 2014, respectively. The increase as a percentage of net sales over the comparable prior year period was driven by increased marketing expenses and home office overhead.
Non-operating Income
We reported a foreign currency gain of $3.3 million related to the purchase of $100 million of cash denominated in CAD in fiscal 2015. As this was a cash transaction, the gain related to the purchase of the CAD cash was recorded in the consolidated statement of operations. Also during fiscal 2015, we then invested the cash denominated in CAD in available-for-sale securities denominated in CAD, with any foreign currency exchange gains or losses recorded within other comprehensive income.
Income (Loss) from Town Shoes
Income (loss) from Town Shoes includes our portion of the loss in Town Shoes' operations, offset by the interest income on the note receivable.
Income Taxes
Our effective tax rate for fiscal 2016 was 38.8% compared to 38.1% for fiscal 2015 and 38.6% for fiscal 2014. The effective tax rates reflect the impact of federal, state and local, and foreign taxes, as well as tax on the income or loss from Town Shoes.
Liquidity and Capital Resources
Overview
Our primary ongoing operating cash flow requirements are for inventory purchases, capital expenditures for new stores, improving our information technology systems and infrastructure growth. Our working capital and inventory levels typically build seasonally. We believe that we have sufficient financial resources and access to financial resources at this time. We are committed to a cash management strategy that maintains liquidity to adequately support the operation of the business, pursue our growth strategy and to withstand unanticipated business volatility. We believe that cash generated from our operations, together with our current levels of cash and investments as well as availability under our revolving credit facility, should be sufficient to maintain our ongoing operations, support seasonal working capital requirements, and fund capital expenditures related to projected business growth for the next 12 months and the foreseeable future.
Although our plan for continued expansion could place increased demands on our financial, managerial, operational and administrative resources and result in increased demands on management, we do not believe that our anticipated growth plan will have an unfavorable impact on our operations or liquidity.
Operating Activities
For fiscal 2016, our net cash provided by operations was $212.9 million compared to $242.7 million for fiscal 2015. The decrease in net cash provided by operating activities was primarily driven by lower net income when adjusted for non-cash activity, primarily the change in fair value of the contingent consideration liability. Net cash provided by operations in fiscal 2015 increased to $242.7 million from $197.0 million for fiscal 2014. The increase in net cash provided by operations was driven primarily by improvements made in managing our working capital.
21
Investing Activities
For fiscal 2016, our net cash used in investing activities was $24.3 million compared to $31.1 million for fiscal 2015. During fiscal 2016, we paid $87.6 million for capital expenditures, of which $40.8 million related to stores, $25.6 million related to technology and the remaining related to other business projects. During fiscal 2016, we had net sales of short-term and long-term investments of $124.8 million compared to $73.6 million during fiscal 2015. The net sales of investments were to fund our share repurchases, payment of dividends and the acquisition of Ebuys.
For fiscal 2015, cash used in investing activities amounted to $31.1 million compared to $105.5 million for fiscal 2014. During fiscal 2015, we paid $103.9 million for capital expenditures, of which $52.3 million related to stores, $28.2 million related to information technology and business infrastructure, and the remaining related to supply chain and other business projects. During fiscal 2015, we had net sales and maturities of short-term and long-term investments of $73.6 million compared to $69.8 million during fiscal 2014. Our net sales of investments were to fund our share repurchases and the payment of dividends.
Financing Activities
For fiscal 2016, 2015, and 2014, net cash used in financing activities of $110.5 million, $241.5 million and $144.8 million, respectively, was primarily related to the payment of dividends and the repurchase of Class A Common Shares under the share repurchase programs.
On November 2, 2015, the Board of Directors approved an additional $200 million share repurchase program after the previous $150 million authorization was fully utilized. The share repurchase program may be suspended, modified or discontinued at any time, and we have no obligation to repurchase any amount of our common shares under the program. We will determine the amount of shares to repurchase based on generated and expected cash flow and cash usage needs, past and anticipated business performance and available alternative investment opportunities. Shares will be repurchased in the open market at times and in amounts based on price and market conditions. As of January 28, 2017, we have repurchased a total of 12.6 million Class A Common Shares under the current and previous programs at a cost of $316.5 million, with $33.5 million remaining available.
Debt
$100 Million Secured Credit Facility- On August 2, 2013, we entered into a secured revolving credit agreement (the "Credit Facility"). The Credit Facility, together with the Letter of Credit Agreement (defined below), amended and restated the prior credit facility, dated June 30, 2010. The Credit Facility has a term of five years that will expire on July 31, 2018. The Credit Facility may be further increased by up to $50 million upon request subject to lender acceptance, financial condition and compliance with covenants. The Credit Facility is secured by a lien on substantially all of DSW Inc.'s personal property assets and its subsidiaries, with certain exclusions, and may be used to provide funds for general corporate purposes, to provide for ongoing working capital requirements and to make permitted acquisitions. Revolving credit loans bear interest under the Credit Facility at our option under: (a) a base rate option at a rate per annum equal to the highest of (i) the Federal Funds Open Rate (as defined in the Credit Facility), plus 0.5%, (ii) the Lender's prime rate, and (iii) the Daily LIBOR Rate (as defined in the Credit Facility) plus 1.0%, plus in each instance an applicable margin, which is between 1.00 and 1.25, based upon revolving credit availability; or (b) a LIBOR option at a rate equal to the LIBOR Rate (as defined in the Credit Facility), plus an applicable margin based upon our revolving credit availability. In addition, the Credit Facility contains restrictive covenants relating to the management and operation of our business. These covenants, among other things, limit or restrict our ability to grant liens on our assets, limit our ability to incur additional indebtedness, limit our ability to enter into transactions with affiliates and limit our ability to merge or consolidate with another entity. Our Credit Facility allows the payment of dividends by us or our subsidiaries, provided that we meet the minimum cash and investments requirement of $125 million, as defined in the Credit Facility. An additional covenant limits payments for capital expenditures to $200 million in any fiscal year. As of January 28, 2017, we had no outstanding borrowings under the Credit Facility with availability of $100 million and were in compliance with all covenants. Interest expense related to the Credit Facility includes fees, such as commitment and line of credit fees.
$50 Million Letter of Credit Agreement- Also on August 2, 2013, we entered into a letter of credit agreement (the "Letter of Credit Agreement"). The Letter of Credit Agreement provides for the issuance of letters of credit up to $50 million, with a term of five years that will expire on August 2, 2018. The facility for the issuance of letters of credit is secured by a cash collateral account containing cash in an amount equal to 103% of the face amount of any letter of credit extension (105% for extensions denominated in foreign currency) and is used for general corporate purposes. The Letter of Credit Agreement requires compliance with conditions precedent that must be satisfied prior to issuing any letter of credit or extension. In addition, the
22
Letter of Credit Agreement contains restrictive covenants relating to the management and operation of our business. These covenants, among other things, limit or restrict our ability to grant liens on our assets, limit our ability to incur additional indebtedness, limit our ability to enter into transactions with affiliates and limit our ability to merge or consolidate with another entity. An event of default may cause the applicable interest rate and fees to increase by 2% per annum. As of January 28, 2017, we were in compliance with all covenants.
As of January 28, 2017 and January 30, 2016, we had $3.8 million and $7.1 million, respectively, in outstanding letters of credit under the Letter of Credit Agreement, and $4.7 million and $7.7 million, respectively, in restricted cash on deposit as collateral under the Letter of Credit Agreement. The restricted cash balance is recorded in prepaid expenses and other current assets on the consolidated balance sheets.
Capital Expenditure Plans
We expect to spend approximately $66 million for capital expenditures in fiscal 2017, with half going into new stores and store remodels and the other half going into technology investments, including digital investments, and other business projects. Our future investments will depend primarily on the number of stores we open and remodel, infrastructure and information technology projects that we undertake and the timing of these expenditures. We plan to open approximately 15 to 17 DSW stores in fiscal 2017. During fiscal 2016, the average investment required to open a new DSW store was approximately $1.4 million, prior to construction and tenant allowances, which averaged $0.4 million. Of this amount, gross inventory typically accounted for $0.5 million, fixtures and leasehold improvements typically accounted for $0.7 million and new store advertising and other new store expenses typically accounted for $0.2 million.
Off-Balance Sheet Liabilities and Other Contractual Obligations
We do not have any material off-balance sheet arrangements as defined by Item 303(a)(4) of Regulation S-K. The following table presents a summary of our minimum contractual commitments and obligations as of January 28, 2017:
Payments due by Period | |||||||||||||||||||
Total | Less Than 1 Year | 1 - 3 Years | 3 -5 Years | More Than 5 Years | |||||||||||||||
(in thousands) | |||||||||||||||||||
Operating lease obligations(1) | $ | 1,255,212 | $ | 199,403 | $ | 369,059 | $ | 312,515 | $ | 374,235 | |||||||||
Construction commitments(2) | 1,825 | 1,825 | — | — | — | ||||||||||||||
Purchase obligations(3) | 23,602 | 8,128 | 12,254 | 3,220 | — | ||||||||||||||
Contingent consideration(4) | 46,109 | — | 20,841 | 25,268 | — | ||||||||||||||
Total | $ | 1,326,748 | $ | 209,356 | $ | 402,154 | $ | 341,003 | $ | 374,235 | |||||||||
(1) | Many of our operating leases require us to pay contingent rent based on sales, maintenance, insurance, and real estate taxes, which can vary year by year and are based almost entirely on actual amounts incurred. As such, they are not included in the lease obligations presented above. |
(2) | As of January 28, 2017, we have entered into various construction commitments, including items to be purchased for projects that were under construction or for which a lease has been signed. |
(3) | We are able to cancel many of our purchase obligations without payment or penalty, and therefore we have excluded such obligations. |
(4) | In connection with the Ebuys acquisition, we may be required to make future payments contingent upon the achievement of specified milestones. Amount and timing is based on our estimate of the payments towards the contingent consideration liability (undiscounted). |
We had no outstanding letters of credit as of January 28, 2017 that were not fully collateralized by cash deposits.
Recent Accounting Pronouncements
The information related to recent accounting pronouncements as set forth in Note 3, Significant Accounting Policies, of the Consolidated Financial Statements included in this Annual Report on Form 10-K is incorporated herein by reference.
23
Critical Accounting Policies and Estimates
As discussed in Note 3, Significant Accounting Policies, of the Consolidated Financial Statements included in this Annual Report on Form 10-K, the preparation of our consolidated financial statements in conformity with accounting principles generally accepted in the United States requires management to make estimates and assumptions that affect the reported amounts of assets and liabilities and disclosure of commitments and contingencies at the date of the consolidated financial statements and reported amounts of revenues and expenses during the reporting period. We base these estimates and judgments on factors we believe to be relevant, the results of which form the basis for making judgments about the carrying values of assets and liabilities that are not readily apparent from other sources. The process of determining significant estimates is fact-specific and takes into account factors such as historical experience, current and expected economic conditions, product mix, and in some cases, actuarial and appraisal techniques. We constantly re-evaluate these significant factors and make adjustments where facts and circumstances dictate.
While we believe that the factors considered provide a meaningful basis for the accounting policies applied in the preparation of the consolidated financial statements, we cannot guarantee that our estimates and assumptions will be accurate. As the determination of these estimates requires the exercise of judgment, actual results may differ from those estimates, and such differences may be material to our consolidated financial statements.
We believe the following represent the most significant accounting policies, critical estimates and assumptions, among others, used in the preparation of our consolidated financial statements:
Policy | Judgments and Estimates | Effect if Actual Results Differ from Assumptions |
Revenue Recognition. Revenues from merchandise sales are recognized upon customer receipt of merchandise, are net of estimated returns, exclude sales tax and are not recognized until collectability is reasonably assured. | For merchandise shipped from a store, the dsw.com fulfillment center or a supplier's warehouse, we estimate a time lag for shipments to record revenue when the customer receives the goods. | We believe a one day change in our estimate would not materially impact our revenue. |
As our merchandise sales are recognized net of returns, we use judgments and estimates for the amount of future returns we expect to receive. | If our sales return rate were to change by 100 basis points, it would not materially impact our revenue. | |
Cost of Sales and Merchandise Inventories. Merchandise inventories are stated at lower of cost or market, with the majority of our inventory determined using the retail inventory method. Under the retail inventory method, the valuation of inventories at cost and the resulting gross profits are determined by applying a calculated cost to retail ratio to the retail value of inventories. The cost of the inventory reflected on the balance sheet is decreased by charges to cost of sales at the time the retail value of the inventory is lowered through the use of markdowns, which are reductions in prices due to customers' perception of value. Hence, earnings are negatively impacted as the merchandise is marked down prior to sale. Markdowns establish a new cost basis for inventory. Changes in facts or circumstances do not result in the reversal of previously recorded markdowns or an increase in the newly established cost basis. | Markdowns require management to make assumptions regarding customer preferences, fashion trends and consumer demand. Inherent in the calculation of inventories are certain significant management judgments and estimates, including setting the original merchandise retail value, markdowns, and estimates of losses between physical inventory counts, or shrinkage, which combined with the averaging process within the retail inventory method, can significantly impact the ending inventory valuation at cost and the resulting gross profit. We record a reduction to inventories and a charge to cost of sales for shrinkage. Shrinkage is calculated as a percentage of sales from the last physical inventory date. Estimates are based on both historical experience as well as recent physical inventory results. | If the reduction to inventories for markdowns and shrink were to change by 10%, it would result in a corresponding change in cost of sales of approximately $4.2 million. |
24
Policy | Judgments and Estimates | Effect if Actual Results Differ from Assumptions |
Customer Loyalty Program. We maintain a customer loyalty program for DSW in which program members earn reward certificates that result in discounts on future purchases. Upon reaching the target-earned threshold, the members receive reward certificates for these discounts, which expire three months after being issued. We accrue the anticipated redemptions of the discount earned at the time of the initial purchase. | To estimate these costs, we make assumptions related to customer purchase levels and redemption rates based on historical experience. | If our redemption rate were to change by 100 basis points, it would not materially impact our financial statements. |
Investments. We evaluate our investments for impairment and whether impairment is other-than-temporary. Based on the nature of any impairments, we would record other-than-temporary impairments in earnings. The investment is written down to its current market value at the time the impairment is deemed to have occurred. | In determining whether impairment has occurred, we review information about the underlying investment that is publicly available and assess our ability to hold the securities for the foreseeable future. | Our total investments, including both short-term and long-term, as of January 28, 2017 were $176.4 million and we believe that our fair value estimates are reasonable. |
Contingent Consideration. We agreed to a contingent payment to the sellers of Ebuys based upon the achievement of certain negotiated future performance goals. We recorded a contingent consideration liability for this obligation at fair value based on our projections. | We estimate the contingent consideration liability based on projected performance of Ebuys compared to the performance goals. We present value the liability based on estimated payments over the performance period. | Our contingent consideration liability as of January 28, 2017 was $33.2 million. To the extent our future projections change, our ultimate payments may differ from our current estimates. |
Goodwill and impairment. We evaluate goodwill for impairment annually during our fourth quarter, or more frequently if an event occurs or circumstances change, such as material deterioration in performance or a significant and sustained decline in our stock price, that would indicate that impairment may exist. When evaluating goodwill for impairment, we may first perform a qualitative assessment to determine whether it is more likely than not that a reporting unit is impaired. If we do not perform a qualitative assessment, or if we determine that it is not more likely than not that the fair value of the reporting unit exceeds its carrying amount, we calculate the estimated fair value of the reporting unit. Fair value is the price a willing buyer would pay for the reporting unit and is typically calculated using a discounted cash flow model. For certain reporting units, where deemed appropriate, we may also utilize a market approach for estimating fair value. | When assessing goodwill for impairment, our decision to perform a qualitative impairment assessment for an individual reporting unit is influenced by a number of factors, including the significance of the excess of the reporting unit's estimated fair value over carrying value at the last assessment date and the amount of time in between quantitative fair value assessments and the date of acquisition. If we perform a quantitative assessment of an individual reporting unit's goodwill, our impairment calculations contain uncertainties as we are required to make assumptions and to apply judgment when estimating future cash flows, including projected revenue growth and operating income, as well as selecting an appropriate discount rate. Estimates of revenue growth and operating income are based on internal projections considering the reporting unit's past performance and forecasted growth, strategic initiatives, and the business environment impacting the reporting unit's performance. The discount rate is selected based on the estimated cost of capital for a market participant to operate the reporting unit in the region. These estimates are highly subjective, and our ability to realize the future cash flows used in our fair value calculations is affected by factors such as the success of strategic initiatives, changes in economic conditions, changes in our operating performance and changes in our business strategies. | As of January 28, 2017, we had $53.8 million in goodwill associated with Ebuys with the remaining goodwill of $25.9 million within the DSW segment. For fiscal 2016, we determined the fair value of our material reporting units were significantly in excess of their carrying values and a 10% decrease in fair value would not result in an impairment charge. Accordingly, we did not recognize any impairment charges during the current fiscal year. However, as we periodically reassess estimated future cash flows and asset fair values, changes in our estimates and assumptions may cause us to realize material impairment charges in the future. |
25
Policy | Judgments and Estimates | Effect if Actual Results Differ from Assumptions |
Asset Impairment of Long-lived Assets. We periodically evaluate the carrying amount of our long-lived assets, primarily property and equipment and finite lived intangible assets, when events and circumstances warrant such a review to ascertain if any assets have been impaired. The carrying amount of a long-lived asset or asset group is considered impaired when the carrying value of the asset or asset group exceeds the expected future cash flows from the asset. | Our reviews are conducted at the lowest identifiable level, which typically is at the store level for the majority of our property and equipment. The impairment loss recognized is the excess of the carrying amount of the asset or asset group over its fair value, based on projected discounted cash flows using a discount rate determined by management. Any impairment loss realized is generally included in cost of sales. | During fiscal 2016, we recognized an immaterial impairment charge. A 10% change in our projected cash flows would not result in a material amount of impairment charges. To the extent these future projections or our strategies change, the conclusion regarding impairment may differ from our current estimates. |
Accrual for Lease Obligations. We record a reserve for our future lease obligations when a store or office facility is abandoned due to closure or relocation. | Using our credit-adjusted risk-free rate to present value the liability, we estimate future lease obligations based on remaining lease payments, estimated or actual sublease income, and any other relevant factors. | As of January 28, 2017, we had an accrual related to an office facility of $7.3 million. A 10% change to our expected sublease rentals would result in a $1.3 million change to our estimate. |
Income Taxes. We determine the aggregate amount of income tax expense to accrue and the amount which will be currently payable based upon tax statutes of each jurisdiction we do business in. Deferred tax assets and liabilities, as a result of these timing differences, are reflected on our balance sheet for temporary differences that will reverse in subsequent years. A valuation allowance is established against deferred tax assets when it is more likely than not that some or all of the deferred tax assets will not be realized. We review and update our tax positions as necessary to add any new uncertain tax positions taken, or to remove previously identified uncertain positions that have been adequately resolved. Additionally, uncertain positions may be remeasured as warranted by changes in facts or law. | In making these estimates, we adjust income for items that are treated differently by the applicable taxing authorities. If we made these determinations on a different basis, our tax expense, assets and liabilities could be different. | As of January 28, 2017, we had a valuation allowance of $2.0 million and gross unrecognized tax benefits of $6.8 million. Although we believe that our estimates are reasonable, actual results could differ from these estimates resulting in an outcome that may be materially different from that which is reflected in our consolidated financial statements. |
Stock-based Compensation. We recognize compensation expense for stock-based awards on a straight-line basis over the requisite service period of the award for the awards that actually vest. | We use the Black-Scholes pricing model to value stock-based compensation expense for stock options, which requires us to estimate the expected term of the stock options and expected future stock price volatility over the expected term. We also estimate forfeitures for all stock-based awards. | During fiscal 2016, total stock-based compensation expense was $12.7 million. If our expected term estimate were to increase or decrease by one year, it would not materially impact our operating profit. |
ITEM 7A. | QUANTITATIVE AND QUALITATIVE DISCLOSURES ABOUT MARKET RISK |
We have market risk exposure related to interest rates and foreign currency exchange rates. Market risk is measured as the potential negative impact on earnings, cash flows or fair values resulting from a hypothetical change in interest rates or foreign currency exchange rates over the next year.
Interest Rate Risk
We hold available-for-sale investments. Our results of operations are not materially affected by changes in market interest rates. Also, as of January 28, 2017, we did not have borrowings under our Credit Facility and, consequently, did not have any material exposure to interest rate market risks during or at the end of this period. However, as any future borrowings under our Credit Facility will be at a variable rate of interest, we could potentially be impacted should we require significant borrowings in the future, particularly during a period of rising interest rates.
26
Foreign Currency Exchange Risk
The note receivable from Town Shoes is denominated in CAD. The functional and reporting currency of Town Shoes is CAD. As USD is our functional currency, we are required to translate the investment in and note receivable from Town Shoes into USD balances. Each quarter, the income or loss from Town Shoes is recorded in USD at the average exchange rate for the period. The note receivable from Town Shoes is translated in USD at the exchange rate prevailing at the balance sheet date. As we have designated the note receivable from Town Shoes as an investment of a long-term investment nature, we record the translation gains and losses arising from changes in exchange rates in other comprehensive income. In anticipation of funding the future purchase of the remaining interest in Town Shoes, we hold $100 million CAD in available-for-sale securities denominated in CAD, with any foreign currency exchange gains or losses recorded within other comprehensive income. A hypothetical 10% movement in the CAD exchange rate could result in a $14.7 million foreign currency translation fluctuation, which would be recorded in other comprehensive income.
We currently do not utilize hedging instruments to mitigate foreign currency exchange risks.
ITEM 8. | FINANCIAL STATEMENTS AND SUPPLEMENTARY DATA |
Our consolidated financial statements and the Report of Independent Registered Public Accounting Firm thereon are filed pursuant to this Item 8 and are included in this report beginning on page F-1.
ITEM 9. | CHANGES IN AND DISAGREEMENTS WITH ACCOUNTANTS ON ACCOUNTING AND FINANCIAL DISCLOSURE |
None.
ITEM 9A. | CONTROLS AND PROCEDURES |
Evaluation of Disclosure Controls and Procedures
We, under the supervision and with the participation of our management, including our Chief Executive Officer and Chief Financial Officer, performed an evaluation of the effectiveness of our disclosure controls and procedures (as defined in Rules 13a-15(e) and 15d-15(e) under the Securities Exchange Act of 1934, as amended (the "Exchange Act")). Based on that evaluation, our Chief Executive Officer and Chief Financial Officer concluded, as of the end of the period covered by this Annual Report, that such disclosure controls and procedures were effective.
Management's Report on Internal Control over Financial Reporting
Management is responsible for establishing and maintaining adequate internal control over financial reporting for us (as defined in Rules 13a-15(f) and 15d-15(f) under the Exchange Act). Our internal control over financial reporting is designed to provide reasonable assurance regarding the reliability of financial reporting and the preparation of financial statements in accordance with accounting principles generally accepted in the United States of America.
Management assessed the effectiveness of our internal control system as of January 28, 2017. In making its assessment, we used the criteria set forth by the Committee of Sponsoring Organizations of the Treadway Commission in Internal Control - Integrated Framework (2013). Based on this assessment, management concluded that our internal control over financial reporting, excluding Ebuys, were effective to provide reasonable assurance regarding the reliability of financial reporting. In accordance with guidance issued by the SEC, companies are permitted to exclude acquisitions from their final assessment of internal control over financial reporting during the year of the acquisition while integrating the acquired operations. Management's assessment of internal control over financial reporting excluded the internal controls of Ebuys, which we acquired on March 4, 2016, and whose results are included in our consolidated financial statements. Ebuys represented 3.1% of consolidated net sales for fiscal 2016 and 9.8% of consolidated total assets as of January 28, 2017.
Deloitte & Touche LLP, our independent registered public accounting firm, has issued an attestation report covering our internal control over financial reporting, as stated in its report on page F-1 of this Annual Report.
27
Changes in Internal Control over Financial Reporting
No change was made in our internal control over financial reporting during our most recent fiscal quarter that has materially affected, or is reasonably likely to materially affect, our internal control over financial reporting.
ITEM 9B. | OTHER INFORMATION |
None.
PART III
ITEM 10. | DIRECTORS, EXECUTIVE OFFICERS AND CORPORATE GOVERNANCE |
The information contained under the captions "EXECUTIVE OFFICERS," "ELECTION OF DIRECTORS" and "OTHER DIRECTOR INFORMATION, COMMITTEES OF DIRECTORS AND CORPORATE GOVERNANCE INFORMATION" in our definitive Proxy Statement for the 2017 Annual Meeting of Shareholders, to be filed with the SEC pursuant to Regulation 14A promulgated under the Exchange Act (the "Proxy Statement"), is incorporated herein by reference.
ITEM 11. | EXECUTIVE COMPENSATION |
The information contained under the captions "COMPENSATION OF MANAGEMENT," "OTHER DIRECTOR INFORMATION, COMMITTEES OF DIRECTORS AND CORPORATE GOVERNANCE INFORMATION," "REPORT OF THE COMPENSATION COMMITTEE" and "COMPENSATION DISCUSSION AND ANALYSIS" in the Proxy Statement is incorporated herein by reference. Notwithstanding the foregoing, the information contained in the Proxy Statement under the caption "REPORT OF THE COMPENSATION COMMITTEE" shall be deemed furnished, and not filed, in this Report on Form 10-K and shall not be deemed incorporated by reference into any filing we make under the Securities Act of 1933, as amended, or the Exchange Act.
ITEM 12. | SECURITY OWNERSHIP OF CERTAIN BENEFICIAL OWNERS AND MANAGEMENT AND RELATED STOCKHOLDER MATTERS |
The information contained under the caption "SECURITY OWNERSHIP OF CERTAIN BENEFICIAL OWNERS AND MANAGEMENT" in the Proxy Statement is incorporated herein by reference.
Equity Compensation Plan Information
The following table sets forth additional information, as of January 28, 2017, about our Class A Common Shares that may be issued upon the exercise of options and other rights under our existing equity compensation plans and arrangements, divided between plans approved by our shareholders and plans or arrangements not submitted to our shareholders for approval. The information includes the number of shares covered by, and the weighted average exercise price of, outstanding options, warrants and other rights and the number of shares remaining available for future grants, excluding the shares to be issued upon exercise of outstanding options, warrants and other rights.
Plan Category | (a) Number of securities to be issued upon exercise of outstanding options, warrants and rights (1) (2) (3) | (b) Weighted-average exercise price of outstanding options, warrants and rights(2) | (c) Number of securities remaining available for future issuance under equity compensation plans (excluding securities reflected in column (a))(3) | ||||||
Equity compensation plans approved by security holders | 4,710,902 | $ | 26.42 | 6,870,564 | |||||
Equity compensation plans not approved by security holders | N/A | N/A | N/A | ||||||
Total | 4,710,902 | $ | 26.42 | 6,870,564 | |||||
(1) | DSW Inc. 2005 Equity Incentive Plan |
(2) | Includes 3,798,854 shares issuable pursuant to the exercise of outstanding stock options, 350,988 shares issuable pursuant to restricted stock units, 250,049 shares issuable pursuant to performance-based restricted stock units and 311,011 shares issuable pursuant to director stock units. Since the restricted stock units, performance-based restricted stock units and |
28
director stock units have no exercise price, they are not included in the weighted average exercise price calculation in column (b).
(3) | DSW Inc. 2014 Equity Incentive Plan |
ITEM 13. | CERTAIN RELATIONSHIPS AND RELATED TRANSACTIONS, AND DIRECTOR INDEPENDENCE |
The information contained under the captions "CERTAIN RELATIONSHIPS AND RELATED TRANSACTIONS" and "OTHER DIRECTOR INFORMATION, COMMITTEES OF DIRECTORS AND CORPORATE GOVERNANCE INFORMATION" in the Proxy Statement is incorporated herein by reference.
ITEM 14. | PRINCIPAL ACCOUNTING FEES AND SERVICES |
The information contained under the caption "AUDIT AND OTHER SERVICE FEES" in the Proxy Statement is incorporated herein by reference.
PART IV
ITEM 15. | EXHIBITS, FINANCIAL STATEMENT SCHEDULES |
(a)(1) Financial Statements
The documents listed below are filed as part of this Form 10-K:
Page | |
Report of Independent Registered Public Accounting Firm | |
Consolidated Statements of Operations for the years ended January 28, 2017, January 30, 2016 and January 31, 2015 | |
Consolidated Statements of Comprehensive Income for the years ended January 28, 2017, January 30, 2016 and January 31, 2015 | |
Consolidated Balance Sheets as of January 28, 2017 and January 30, 2016 | |
Consolidated Statements of Shareholders' Equity for the years ended January 28, 2017, January 30, 2016 and January 31, 2015 | |
Consolidated Statements of Cash Flows for the years ended January 28, 2017, January 30, 2016 and January 31, 2015 | |
Notes to Consolidated Financial Statements | |
(a)(2) Consolidated Financial Statement Schedules:
Schedules not filed are omitted because of the absence of the conditions under which they are required or because the required information is included in the financial statements or the notes thereto.
(a)(3) and (b) Exhibits:
See Index to Exhibits which begins on page E-1.
(c) Additional Financial Statement Schedules:
None.
ITEM 16. | FORM 10-K SUMMARY |
None.
29
SIGNATURES
Pursuant to the requirements of Section 13 or 15(d) of the Securities Exchange Act of 1934, the Registrant has duly caused this report to be signed on its behalf by the undersigned, thereunto duly authorized.
DSW INC. | ||
March 23, 2017 | By: | /s/ Jared Poff |
Jared Poff, Senior Vice President and Chief Financial Officer (Principal Financial and Accounting Officer) | ||
Pursuant to the requirements of the Securities Exchange Act of 1934, this report has been signed by the following persons in the capacities and on the dates indicated.
Signature | Title | Date | ||
/s/ Roger Rawlins | Chief Executive Officer and Director | March 23, 2017 | ||
Roger Rawlins | (Principal Executive Officer) | |||
/s/ Jared Poff | Senior Vice President and Chief Financial Officer | March 23, 2017 | ||
Jared Poff | (Principal Financial and Accounting Officer) | |||
* | Executive Chairman of the Board and Director | March 23, 2017 | ||
Jay L. Schottenstein | ||||
* | Director | March 23, 2017 | ||
Joanne Zaiac | ||||
* | Director | March 23, 2017 | ||
Elaine J. Eisenman | ||||
* | Director | March 23, 2017 | ||
Carolee Lee | ||||
* | Director | March 23, 2017 | ||
Joanna T. Lau | ||||
* | Director | March 23, 2017 | ||
Joseph A. Schottenstein | ||||
* | Director | March 23, 2017 | ||
Harvey L. Sonnenberg | ||||
* | Director | March 23, 2017 | ||
Allan J. Tanenbaum | ||||
*By: | /s/ Jared Poff |
Jared Poff (Attorney-in-fact) | |
30
REPORT OF INDEPENDENT REGISTERED PUBLIC ACCOUNTING FIRM
To the Board of Directors and Shareholders of DSW Inc.
Columbus, Ohio
We have audited the accompanying consolidated balance sheets of DSW Inc. and subsidiaries (the "Company") as of January 28, 2017 and January 30, 2016, and the related consolidated statements of operations, comprehensive income, shareholders' equity, and cash flows for the years ended January 28, 2017, January 30, 2016 and January 31, 2015. We also have audited the Company's internal control over financial reporting as of January 28, 2017, based on criteria established in Internal Control - Integrated Framework (2013) issued by the Committee of Sponsoring Organizations of the Treadway Commission. The Company's management is responsible for these financial statements, for maintaining effective internal control over financial reporting, and for its assessment of the effectiveness of internal control over financial reporting, included in the accompanying Management’s Report on Internal Control over Financial Reporting. Our responsibility is to express an opinion on these financial statements and an opinion on the Company's internal control over financial reporting based on our audits.
As described in Management’s Report on Internal Control over Financial Reporting, management excluded from its assessment the internal control over financial reporting at Ebuys, Inc., which was acquired on March 4, 2016 and whose financial statements constitute 3.1% of consolidated net sales and 9.8% of consolidated total assets, included in the consolidated financial statements as of and for the fiscal year ended January 28, 2017. Accordingly, our audit did not include the internal control over financial reporting at Ebuys, Inc.
We conducted our audits in accordance with the standards of the Public Company Accounting Oversight Board (United States). Those standards require that we plan and perform the audit to obtain reasonable assurance about whether the financial statements are free of material misstatement and whether effective internal control over financial reporting was maintained in all material respects. Our audits of the financial statements included examining, on a test basis, evidence supporting the amounts and disclosures in the financial statements, assessing the accounting principles used and significant estimates made by management, and evaluating the overall financial statement presentation. Our audit of internal control over financial reporting included obtaining an understanding of internal control over financial reporting, assessing the risk that a material weakness exists, and testing and evaluating the design and operating effectiveness of internal control based on the assessed risk. Our audits also included performing such other procedures as we considered necessary in the circumstances. We believe that our audits provide a reasonable basis for our opinions.
A company's internal control over financial reporting is a process designed by, or under the supervision of, the company's principal executive and principal financial officers, or persons performing similar functions, and effected by the company's board of directors, management, and other personnel to provide reasonable assurance regarding the reliability of financial reporting and the preparation of financial statements for external purposes in accordance with generally accepted accounting principles. A company's internal control over financial reporting includes those policies and procedures that (1) pertain to the maintenance of records that, in reasonable detail, accurately and fairly reflect the transactions and dispositions of the assets of the company; (2) provide reasonable assurance that transactions are recorded as necessary to permit preparation of financial statements in accordance with generally accepted accounting principles, and that receipts and expenditures of the company are being made only in accordance with authorizations of management and directors of the company; and (3) provide reasonable assurance regarding prevention or timely detection of unauthorized acquisition, use, or disposition of the company's assets that could have a material effect on the financial statements.
Because of the inherent limitations of internal control over financial reporting, including the possibility of collusion or improper management override of controls, material misstatements due to error or fraud may not be prevented or detected on a timely basis. Also, projections of any evaluation of the effectiveness of the internal control over financial reporting to future periods are subject to the risk that the controls may become inadequate because of changes in conditions, or that the degree of compliance with the policies or procedures may deteriorate.
In our opinion, the consolidated financial statements referred to above present fairly, in all material respects, the financial position of DSW Inc. and subsidiaries as of January 28, 2017 and January 30, 2016, and the results of their operations and their cash flows for each of the years ended January 28, 2017, January 30, 2016 and January 31, 2015, in conformity with accounting principles generally accepted in the United States of America. Also, in our opinion, the Company maintained, in all material respects, effective internal control over financial reporting as of January 28, 2017, based on the criteria established in Internal Control- Integrated Framework (2013) issued by the Committee of Sponsoring Organizations of the Treadway Commission.
/s/ DELOITTE & TOUCHE LLP
Columbus, Ohio
March 23, 2017
F- 1
DSW INC.
CONSOLIDATED STATEMENTS OF OPERATIONS
(in thousands, except per share amounts)
Fiscal | |||||||||||
2016 | 2015 | 2014 | |||||||||
Net sales | $ | 2,711,444 | $ | 2,620,248 | $ | 2,496,092 | |||||
Cost of sales | (1,939,611 | ) | (1,851,879 | ) | (1,741,071 | ) | |||||
Operating expenses | (591,816 | ) | (554,818 | ) | (512,536 | ) | |||||
Change in fair value of contingent consideration | 20,151 | — | — | ||||||||
Operating profit | 200,168 | 213,551 | 242,485 | ||||||||
Interest expense | (238 | ) | (168 | ) | (108 | ) | |||||
Interest income | 2,379 | 3,630 | 3,229 | ||||||||
Interest income, net | 2,141 | 3,462 | 3,121 | ||||||||
Non-operating income | 338 | 3,178 | — | ||||||||
Income from continuing operations before income taxes and income (loss) from Town Shoes | 202,647 | 220,191 | 245,606 | ||||||||
Income tax provision | (78,853 | ) | (83,806 | ) | (96,392 | ) | |||||
Income (loss) from Town Shoes | 741 | (351 | ) | 3,813 | |||||||
Income from continuing operations | 124,535 | 136,034 | 153,027 | ||||||||
Income from discontinued operations, net of tax | — | — | 272 | ||||||||
Net income | $ | 124,535 | $ | 136,034 | $ | 153,299 | |||||
Basic and diluted earnings per share: | |||||||||||
Basic earnings per share from continuing operations | $ | 1.53 | $ | 1.55 | $ | 1.71 | |||||
Diluted earnings per share from continuing operations | $ | 1.52 | $ | 1.54 | $ | 1.69 | |||||
Basic earnings per share from discontinued operations | $ | — | $ | — | $ | 0.00 | |||||
Diluted earnings per share from discontinued operations | $ | — | $ | — | $ | 0.00 | |||||
Basic earnings per share | $ | 1.53 | $ | 1.55 | $ | 1.71 | |||||
Diluted earnings per share | $ | 1.52 | $ | 1.54 | $ | 1.69 | |||||
Weighted average shares used in per share calculations: | |||||||||||
Basic shares | 81,536 | 87,561 | 89,499 | ||||||||
Diluted shares | 82,135 | 88,501 | 90,612 | ||||||||
The accompanying Notes are an integral part of the Consolidated Financial Statements.
F- 2
DSW INC.
CONSOLIDATED STATEMENTS OF COMPREHENSIVE INCOME
(in thousands)
Fiscal | |||||||||||
2016 | 2015 | 2014 | |||||||||
Net income | $ | 124,535 | $ | 136,034 | $ | 153,299 | |||||
Other comprehensive income (loss), net of income taxes: | |||||||||||
Foreign currency translation gain (loss) | 6,831 | (14,076 | ) | (6,454 | ) | ||||||
Unrealized net gain (loss) on available-for-sale securities (net of tax expense (benefit) of ($15), $15 and $0, respectively) | 127 | (173 | ) | — | |||||||
Reclassification adjustment for net gains realized in net income for available-for-sale securities | (196 | ) | — | — | |||||||
Total other comprehensive income (loss), net of income taxes | 6,762 | (14,249 | ) | (6,454 | ) | ||||||
Total comprehensive income | $ | 131,297 | $ | 121,785 | $ | 146,845 | |||||
The accompanying Notes are an integral part of the Consolidated Financial Statements.
F- 3
DSW INC.
CONSOLIDATED BALANCE SHEETS
(in thousands)
January 28, 2017 | January 30, 2016 | ||||||
ASSETS | |||||||
Cash and cash equivalents | $ | 110,657 | $ | 32,495 | |||
Short-term investments | 98,530 | 226,027 | |||||
Accounts receivable | 18,456 | 15,437 | |||||
Accounts receivable from related parties | 550 | 27 | |||||
Inventories | 499,995 | 484,236 | |||||
Prepaid expenses and other current assets | 31,074 | 37,444 | |||||
Prepaid rent to related parties | 4 | 2 | |||||
Total current assets | 759,266 | 795,668 | |||||
Property and equipment, net | 375,251 | 374,241 | |||||
Long-term investments | 77,904 | 71,953 | |||||
Goodwill | 79,689 | 25,899 | |||||
Deferred income taxes | 14,934 | 21,815 | |||||
Long-term prepaid rent to related parties | 768 | 875 | |||||
Equity investment in Town Shoes | 15,830 | 21,188 | |||||
Note receivable from Town Shoes | 53,121 | 44,170 | |||||
Intangible assets | 35,108 | 46 | |||||
Other assets | 16,605 | 13,254 | |||||
Total assets | $ | 1,428,476 | $ | 1,369,109 | |||
LIABILITIES AND SHAREHOLDERS' EQUITY | |||||||
Accounts payable | $ | 185,497 | $ | 214,893 | |||
Accounts payable to related parties | 774 | 733 | |||||
Accrued expenses | 130,334 | 107,800 | |||||
Total current liabilities | 316,605 | 323,426 | |||||
Non-current liabilities | 141,179 | 140,759 | |||||
Contingent consideration liability | 33,204 | — | |||||
Total liabilities | $ | 490,988 | $ | 464,185 | |||
Commitments and contingencies | — | — | |||||
Shareholders' equity: | |||||||
Common shares paid in capital, no par value; 250,000 Class A Common Shares authorized, 85,038 and 84,396 issued, respectively; 72,447 and 74,185 outstanding, respectively; 100,000 Class B Common Shares authorized, 7,733 and 7,733 issued and outstanding, respectively | 946,351 | 930,011 | |||||
Preferred shares, no par value; 100,000 authorized; no shares issued or outstanding | — | — | |||||
Treasury shares, at cost, 12,591 and 10,211 outstanding, respectively | (316,531 | ) | (266,531 | ) | |||
Retained earnings | 346,602 | 287,140 | |||||
Basis difference related to acquisition of commonly controlled entity | (24,993 | ) | (24,993 | ) | |||
Accumulated other comprehensive loss | (13,941 | ) | (20,703 | ) | |||
Total shareholders' equity | 937,488 | 904,924 | |||||
Total liabilities and shareholders' equity | $ | 1,428,476 | $ | 1,369,109 | |||
The accompanying Notes are an integral part of the Consolidated Financial Statements.
F- 4
DSW INC.
CONSOLIDATED STATEMENTS OF SHAREHOLDERS' EQUITY
(in thousands)
Number of Shares | Common shares paid in capital | Treasury shares | Retained earnings | Basis difference related to acquisition of commonly controlled entity | Accumulated other comprehensive loss | Total | |||||||||||||||||||
Class A Common Shares | Class B Common Shares | Treasury Shares | |||||||||||||||||||||||
Balance, February 1, 2014 | 83,033 | 7,733 | 38 | $ | 890,698 | $ | (1,600 | ) | $ | 134,439 | $ | (24,993 | ) | $ | — | $ | 998,544 | ||||||||
Net income | — | — | — | — | — | 153,299 | — | — | 153,299 | ||||||||||||||||
Stock-based compensation expense | — | — | — | 10,495 | — | — | — | — | 10,495 | ||||||||||||||||
Stock-based compensation issuances and exercises | 631 | — | — | 3,471 | — | — | — | — | 3,471 | ||||||||||||||||
Repurchase of Class A Common Shares | (2,998 | ) | 2,998 | (85,338 | ) | (85,338 | ) | ||||||||||||||||||
Excess tax benefits related to stock-based compensation | — | — | — | 4,015 | — | — | — | — | 4,015 | ||||||||||||||||
Dividends paid ($0.75 per share) | — | — | — | — | — | (66,912 | ) | — | — | (66,912 | ) | ||||||||||||||
Other comprehensive income | — | — | — | — | — | — | — | (6,454 | ) | (6,454 | ) | ||||||||||||||
Balance, January 31, 2015 | 80,666 | 7,733 | 3,036 | $ | 908,679 | $ | (86,938 | ) | $ | 220,826 | $ | (24,993 | ) | $ | (6,454 | ) | $ | 1,011,120 | |||||||
Net income | — | — | — | — | — | 136,034 | — | — | 136,034 | ||||||||||||||||
Stock-based compensation expense | — | — | — | 13,501 | — | — | — | — | 13,501 | ||||||||||||||||
Stock-based compensation issuances and exercises | 694 | — | — | 5,108 | — | — | — | — | 5,108 | ||||||||||||||||
Repurchase of Class A Common Shares | (7,175 | ) | — | 7,175 | — | (179,593 | ) | — | — | — | (179,593 | ) | |||||||||||||
Excess tax benefits related to stock-based compensation | — | — | — | 2,723 | — | — | — | — | 2,723 | ||||||||||||||||
Dividends paid ($0.80 per share) | — | — | — | — | — | (69,720 | ) | — | — | (69,720 | ) | ||||||||||||||
Other comprehensive income | — | — | — | — | — | — | — | (14,249 | ) | (14,249 | ) | ||||||||||||||
Balance, January 30, 2016 | 74,185 | 7,733 | 10,211 | $ | 930,011 | $ | (266,531 | ) | $ | 287,140 | $ | (24,993 | ) | $ | (20,703 | ) | $ | 904,924 | |||||||
Net income | — | — | — | — | — | 124,535 | — | — | 124,535 | ||||||||||||||||
Stock-based compensation expense | — | — | — | 12,687 | — | — | — | — | 12,687 | ||||||||||||||||
Stock-based compensation issuances and exercises | 642 | — | — | 3,693 | — | — | — | — | 3,693 | ||||||||||||||||
Repurchase of Class A Common Shares | (2,380 | ) | — | 2,380 | — | (50,000 | ) | — | — | — | (50,000 | ) | |||||||||||||
Excess tax benefits (detriment) related to stock-based compensation | — | — | — | (40 | ) | — | — | — | — | (40 | ) | ||||||||||||||
Dividends paid ($0.80 per share) | — | — | — | — | — | (65,073 | ) | — | — | (65,073 | ) | ||||||||||||||
Other comprehensive income | — | — | — | — | — | — | — | 6,762 | 6,762 | ||||||||||||||||
Balance, January 28, 2017 | 72,447 | 7,733 | 12,591 | $ | 946,351 | $ | (316,531 | ) | $ | 346,602 | $ | (24,993 | ) | $ | (13,941 | ) | $ | 937,488 | |||||||
The accompanying Notes are an integral part of the Consolidated Financial Statements.
F- 5
DSW INC.
CONSOLIDATED STATEMENTS OF CASH FLOWS
(in thousands)
Fiscal | |||||||||||
2016 | 2015 | 2014 | |||||||||
Cash flows from operating activities: | |||||||||||
Net income | $ | 124,535 | $ | 136,034 | $ | 153,299 | |||||
Less: total income from discontinued operations, net of tax | — | — | (272 | ) | |||||||
Income from continuing operations | 124,535 | 136,034 | 153,027 | ||||||||
Adjustments to reconcile income from continuing operations to net cash provided by operating activities from continuing operations: | |||||||||||
Depreciation and amortization | 81,639 | 73,577 | 68,243 | ||||||||
Stock-based compensation expense | 12,687 | 13,501 | 10,495 | ||||||||
Deferred income taxes | 6,881 | 9,265 | (1,361 | ) | |||||||
Loss (income) from Town Shoes | (741 | ) | 351 | (3,813 | ) | ||||||
Change in fair value of contingent consideration | (20,151 | ) | — | — | |||||||
Loss on disposal of long-lived assets | 723 | 844 | 1,149 | ||||||||
Impairment of long-lived assets | 247 | 962 | 5,095 | ||||||||
Excess tax benefits related to stock-based compensation | — | (2,723 | ) | (4,015 | ) | ||||||
Amortization of investment discounts and premiums | 1,185 | 5,456 | 9,525 | ||||||||
Change in operating assets and liabilities: | |||||||||||
Accounts receivable | (2,206 | ) | 8,943 | 2,239 | |||||||
Inventories | 14,411 | (33,400 | ) | (53,068 | ) | ||||||
Prepaid expenses and other current assets | 3,884 | 1,782 | (3,959 | ) | |||||||
Accounts payable | (30,572 | ) | 38,031 | 7,083 | |||||||
Accrued expenses | 18,785 | (3,644 | ) | 908 | |||||||
Other | 1,599 | (6,328 | ) | 5,490 | |||||||
Net cash provided by operating activities from continuing operations | 212,906 | 242,651 | 197,038 | ||||||||
Cash flows used in investing activities: | |||||||||||
Cash paid for property and equipment | (87,580 | ) | (103,939 | ) | (98,126 | ) | |||||
Purchases of available-for-sale investments | (95,905 | ) | (279,735 | ) | (43,687 | ) | |||||
Purchases of held-to-maturity investments | — | — | (132,765 | ) | |||||||
Sales of available-for-sale investments | 220,744 | 353,344 | 48,590 | ||||||||
Maturities of held-to-maturity investments | — | — | 197,666 | ||||||||
Decrease (increase) in restricted cash | 3,023 | 3,798 | (5,328 | ) | |||||||
Equity investment in Town Shoes | — | 184 | (25,236 | ) | |||||||
Purchase of note receivable from Town Shoes and additional borrowings by Town Shoes | (4,795 | ) | (4,764 | ) | (46,596 | ) | |||||
Acquisition of Ebuys | (59,776 | ) | — | — | |||||||
Net cash used in investing activities from continuing operations | (24,289 | ) | (31,112 | ) | (105,482 | ) | |||||
Cash flows used in financing activities: | |||||||||||
Proceeds from exercise of stock options | 6,279 | 7,504 | 5,120 | ||||||||
Net change in vendor payment program | 925 | — | — | ||||||||
Cash paid for income taxes for stock-based compensation shares withheld | (2,586 | ) | (2,396 | ) | (1,649 | ) | |||||
Cash paid for treasury shares | (50,000 | ) | (179,593 | ) | (85,338 | ) | |||||
Dividends paid | (65,073 | ) | (69,720 | ) | (66,912 | ) | |||||
Excess tax benefits related to stock-based compensation | — | 2,723 | 4,015 | ||||||||
Net cash used in financing activities from continuing operations | (110,455 | ) | (241,482 | ) | (144,764 | ) | |||||
Net cash provided by operating activities from discontinued operations | — | — | 358 | ||||||||
Effect of exchange rate changes on cash balances | — | 3,267 | — | ||||||||
Net increase (decrease) in cash and cash equivalents | 78,162 | (26,676 | ) | (52,850 | ) | ||||||
Cash and cash equivalents, beginning of period | 32,495 | 59,171 | 112,021 | ||||||||
Cash and cash equivalents, end of period | $ | 110,657 | $ | 32,495 | $ | 59,171 | |||||
Supplemental disclosures of cash flow information: | |||||||||||
Cash paid during the period for income taxes | $ | 56,529 | $ | 72,851 | $ | 91,727 | |||||
Non-cash investing and financing activities: | |||||||||||
Property and equipment purchases not yet paid | $ | 8,882 | $ | 13,150 | $ | 5,178 | |||||
Ebuys contingent purchase price | $ | 53,355 | $ | — | $ | — | |||||
The accompanying Notes are an integral part of the Consolidated Financial Statements.
F- 6
1. | BUSINESS OPERATIONS |
DSW Inc., an Ohio corporation, together with its wholly-owned subsidiaries, is the destination for fabulous footwear brands and accessories at a great value every single day. We offer a wide assortment of brand name dress, casual and athletic footwear and accessories for women, men and kids. We conduct business in two reportable segments: the DSW segment ("DSW"), which includes DSW stores and dsw.com, and the Affiliated Business Group ("ABG") segment.
DSW separates its merchandise into three primary categories: women's footwear; men's footwear; and accessories and other (which includes kids' footwear). Previously, athletic footwear was shown as its own category and is now included in women's footwear and men's footwear, which reflects how our categories are presented in stores. The following table sets forth the approximate percentages of DSW segment sales attributable to each merchandise category:
Fiscal | ||||||
Category | 2016 | 2015 | 2014 | |||
Women's footwear | 69% | 69% | 69% | |||
Men's footwear | 22% | 22% | 22% | |||
Accessories and other | 9% | 9% | 9% | |||
The ABG segment partners with three other retailers to help build and optimize their in-store and online footwear businesses. ABG supplies merchandise for the shoe departments for Stein Mart, Gordmans, and Frugal Fannie's.
We also have an equity investment in Town Shoes Limited ("Town Shoes"). Town Shoes is the market leader in branded footwear in Canada, primarily under The Shoe Company, Shoe Warehouse, Town Shoes and DSW banners, as well as an e-commerce site. As of January 28, 2017, there are 23 DSW Designer Shoe Warehouse stores in Canada operated under a licensing agreement.
We completed several transactions that supported our efforts to grow market share within footwear and accessories domestically and internationally. On March 4, 2016, we acquired Ebuys, Inc. ("Ebuys"), a leading off price footwear and accessories retailer operating in digital marketplaces. Ebuys sells products to customers located in North America, Europe, Australia and Asia. On August 2, 2016, we signed an agreement with the Apparel Group as an exclusive franchise partner in the Gulf Coast region of the Middle East. The agreement will expand the DSW banner by up to 40 stores across the territory with the first stores planned to open in fiscal 2017.
Our fiscal year ends on the Saturday nearest to January 31. The periods presented in these financial statements are the fiscal years ended January 28, 2017 ("fiscal 2016"), January 30, 2016 ("fiscal 2015") and January 31, 2015 ("fiscal 2014"). Fiscal 2016, 2015 and 2014 each consisted of 52 weeks. Our next fiscal year ending February 3, 2018 ("fiscal 2017") will consist of 53 weeks. Unless otherwise stated, references to years in this report relate to fiscal years rather than calendar years.
2. ACQUISITION AND EQUITY INVESTMENT
Acquisition of Ebuys- On March 4, 2016, we acquired 100% ownership of Ebuys for cash and future amounts to be paid to the sellers of Ebuys contingent upon achievement of certain milestones. During fiscal 2016, we had purchase price adjustments based on working capital adjustments and measurement period adjustments of the contingent consideration liability, based on additional information about facts and circumstances that existed at the acquisition date that were obtained after that date. We also made various measurement period adjustments for the assets and liabilities acquired.
F- 7
The final purchase price and the allocation of the total consideration to the fair values of the assets and liabilities acquired consisted of the following:
Preliminary Purchase Price as of March 4, 2016 | Adjustments | Final Purchase Price as of January 28, 2017 | |||||||||
(in thousands) | |||||||||||
Purchase price: | |||||||||||
Cash consideration | $ | 60,411 | $ | (635 | ) | $ | 59,776 | ||||
Contingent consideration | 56,000 | (2,645 | ) | 53,355 | |||||||
$ | 116,411 | $ | (3,280 | ) | $ | 113,131 | |||||
Fair value of assets and liabilities acquired: | |||||||||||
Accounts and other receivables | $ | 1,623 | $ | (287 | ) | $ | 1,336 | ||||
Inventory | 30,152 | 18 | 30,170 | ||||||||
Other current assets | 191 | 335 | 526 | ||||||||
Property and equipment | 1,221 | 22 | 1,243 | ||||||||
Goodwill | 54,785 | (995 | ) | 53,790 | |||||||
Intangible assets | 41,301 | (2,600 | ) | 38,701 | |||||||
Accounts payable and other long-term liabilities | (12,862 | ) | 227 | (12,635 | ) | ||||||
$ | 116,411 | $ | (3,280 | ) | $ | 113,131 | |||||
The fair value of intangible assets includes $22.3 million for online retailer and customer relationships based on using the excess earnings method, $11.0 million for tradenames based on using the relief from royalty method, and $5.4 million for non-compete agreements based on using the with-and-without method. The categorization of the fair value framework used for these methods are considered Level 3 due to the subjective nature of the unobservable inputs used to determine the fair value.
The goodwill represents the intangible assets that do not qualify for separate recognition and is primarily the result of expected synergies, vertical integration as a market for selling aged inventory, online presence, and the acquired workforce. Goodwill related to this acquisition is deductible for income tax purposes.
During the fourth quarter of fiscal 2016, we also made fair value adjustments to the contingent consideration liability based on Ebuys' results of operations during the year and revised projections for the contingent periods. These adjustments were not considered measurement period adjustments and were recognized as an adjustment to income from operations. See Note 15, Commitments and Contingencies, for differences recognized between the final acquisition-date fair value and the estimated settlement of the obligation as of January 28, 2017.
The following table provides the supplemental unaudited pro forma net sales and net income of the combined entity had the acquisition date of Ebuys been the first day of our fiscal 2015 (pro forma results have not been presented for fiscal 2016 as the results would not have been materially different from those presented in our consolidated statements of operations):
Fiscal 2015 | |||
(in thousands) | |||
Net sales | $ | 2,699,770 | |
Net income | $ | 135,600 | |
The amounts in the supplemental pro forma earnings apply our accounting policies and reflect adjustments for additional depreciation and amortization that would have been charged assuming the same fair value adjustments to property and equipment and acquired intangibles had been applied on the first day of our fiscal 2015. These pro forma results are unaudited and are not necessarily indicative of results of operations that would have occurred had the acquisition actually occurred in the prior year period or indicative of the results of operations for any future period.
During fiscal 2016, our consolidated statements of operations included sales and net losses for Ebuys of $83.8 million and $5.6 million, respectively.
F- 8
Equity Investment in Town Shoes- In May 2014, we acquired a 49.2% interest in Town Shoes for $75.1 million Canadian dollars ("CAD") ($68.9 million United States Dollars ("USD")), which included the purchase of an unsecured subordinated note from Town Shoes issued on February 14, 2012 that earns payment-in-kind interest at 12% and matures on February 14, 2022. As of January 28, 2017, our ownership percentage was 46.3%. The dilution of our ownership is due to Town Shoes' employee exercise of stock options. Our ownership stake provides 50% voting control and board representation equal to the co-investor.
Additionally, the Town Shoe co-investor holds a put option to sell the remaining portion of the company in fiscal 2017 to DSW Inc., and for the subsequent two years. We hold a call option to purchase the remaining portion of the company in fiscal 2018, and for the subsequent two years, if the Town Shoe co-investor has not exercised their put option. During fiscal 2015, we purchased $100 million of cash denominated in CAD to take advantage of the strength of the dollar and in anticipation of funding the future purchase of the remaining interest in Town Shoes. As this was a cash transaction, we recorded $3.3 million in foreign currency exchange gains related to the purchase of the cash denominated in CAD within non-operating income. Also during fiscal 2015, we then invested the cash denominated in CAD in available-for-sale securities denominated in CAD, with any foreign currency exchange gains or losses recorded within other comprehensive income.
Activity related to our equity investment in Town Shoes was as follows:
Fiscal | |||||||
2016 | 2015 | ||||||
(in thousands) | |||||||
Equity investment in Town Shoes - beginning of period | $ | 21,188 | $ | 25,887 | |||
Acquisition costs adjustment | — | (184 | ) | ||||
Portion of Town Shoes loss | (4,592 | ) | (5,250 | ) | |||
Foreign currency translation adjustments, included in other comprehensive income (loss) | (486 | ) | 934 | ||||
Amortization of purchase price adjustments | (280 | ) | (199 | ) | |||
Equity investment in Town Shoes - end of period | $ | 15,830 | $ | 21,188 | |||
Activity related to our note receivable from Town Shoes was as follows:
Fiscal | |||||||
2016 | 2015 | ||||||
(in thousands) | |||||||
Note receivable from Town Shoes - beginning of period | $ | 44,170 | $ | 43,304 | |||
Payment-in-kind interest earned | 5,613 | 5,098 | |||||
Foreign currency translation adjustments, included in other comprehensive income (loss) | 2,770 | (4,232 | ) | ||||
Management service fee | 568 | — | |||||
Note receivable from Town Shoes - end of period | $ | 53,121 | $ | 44,170 | |||
Payment-in-kind interest earned is paid annually and is subsequently returned to Town Shoes as additional amounts borrowed under the terms of the note receivable.
3. | SIGNIFICANT ACCOUNTING POLICIES |
Principles of Consolidation- The consolidated financial statements include the accounts of DSW Inc. and its wholly-owned subsidiaries. All intercompany accounts and transactions have been eliminated in consolidation. All amounts are in USD, unless otherwise noted.
Use of Estimates- The preparation of financial statements in conformity with accounting principles generally accepted in the United States ("GAAP") requires management to make estimates and assumptions that affect the reported amounts of assets and liabilities and disclosure of contingent assets and liabilities at the date of the financial statements and reported amounts of revenues and expenses during the reporting period. Significant estimates are required as a part of sales returns, depreciation, amortization, inventory valuation, contingent consideration liability, customer loyalty program reserve, recoverability of long-lived assets and intangible assets, legal reserves, accrual for lease obligations and establishing reserves for self-insurance.
F- 9
Although these estimates are based on management's knowledge of current events and actions it may undertake in the future, actual results could differ from these estimates.
Sales and Revenue Recognition- Revenue from merchandise sales are recognized upon customer receipt of merchandise, are net of estimated returns, exclude sales tax and are not recognized until collectability is reasonably assured. Merchandise can be demanded from a store, dsw.com or m.dsw.com. The demand can be fulfilled from a store, the dsw.com fulfillment center or drop shipped from a supplier's warehouse. If the product is shipped to a customer from a store, the dsw.com fulfillment center or a supplier's warehouse, we defer revenue for a period of time representing a lag for shipments to be received by the customer. Revenue from shipping and handling is recorded in net sales while the related costs are included in cost of sales. Revenue from gift cards is deferred and recognized upon redemption of the gift card. Our policy is to recognize income from breakage of gift cards when the likelihood of redemption of the gift card is remote.
ABG supplies footwear, under supply arrangements, to three other retailers. Sales for these affiliated businesses are net of estimated returns and exclude sales tax. Pursuant to the agreements between us and the affiliated retailers (Stein Mart, Gordmans, and Frugal Fannie's), we are the exclusive supplier of shoes, both in-store and online, at the affiliated retailers. We assume the risks and rewards of ownership for product at all in-store locations and online, including risk of loss for delivery, returns, shrink up to a certain percentage, and loss of inventory value. Furthermore, we are responsible for the footwear assortment, inventory fulfillment, and pricing at all locations and online. We record the sales of merchandise at the point of sale to the end customer. The affiliated retailers provide the sales associates and retail space. We pay a percentage of net sales as rent, which is included in cost of sales as occupancy expense.
Ebuys sells products to customers through digital marketplaces and sales are recognized upon customer receipt of merchandise, are net of estimated returns, exclude sales tax and are not recognized until collectability is reasonably assured. As merchandise is demanded from the various marketplaces and fulfilled from distribution centers, we defer revenue for a period of time representing a lag for shipments to be received by the customer. Revenue from shipping and handling is recorded in net sales while the related costs are included in cost of sales.
Cost of Sales- In addition to the cost of merchandise, which includes the impact of markdowns and shrinkage, we include in cost of sales expenses associated with distribution and fulfillment, store occupancy for the DSW and ABG segments, and digital marketplace fees for Ebuys. Distribution and fulfillment expenses are comprised of labor costs, rent, depreciation, insurance, utilities, maintenance and other operating costs associated with the operations of the distribution and fulfillment centers. Distribution and fulfillment expenses also include the transportation of merchandise to the distribution and fulfillment centers, from the distribution center to stores and from the fulfillment center and from stores to the customer. Store occupancy expenses include impairment charges, rent, utilities, repairs, maintenance, insurance, janitorial costs, and occupancy-related taxes, but excludes depreciation.
Operating Expenses- Operating expenses include expenses related to store management and store payroll costs, advertising, ABG operations, store depreciation, new store costs, and corporate expenses. Corporate expenses include expenses related to buying, information technology, depreciation expense for corporate assets, marketing, legal, finance, outside professional services, customer service center expenses, payroll-related costs for associates, and amortization expense.
Stock-Based Compensation- We recognize compensation expense for awards of stock options, restricted stock units ("RSUs"), performance-based restricted stock units ("PSUs"), and director stock units ("DSUs") based on the fair value on the grant date and on a straight-line basis over the requisite service period for the awards that vest. Stock-based compensation is included in operating expenses in the consolidated statements of operations. For stock options, the fair value of the awards are estimated on the date of grant using the Black-Scholes pricing model. For RSUs, PSUs and DSUs, fair value is determined by multiplying the number of units granted by the grant date closing market price.
New Store Opening Costs- Costs associated with the opening of new stores are expensed as incurred. New store opening costs, primarily pre-opening rent and marketing expenses, were $5.9 million, $8.6 million and $8.7 million for fiscal 2016, 2015 and 2014, respectively.
Marketing Expense- The production cost of advertising is expensed when the advertising first takes place. All other marketing costs are expensed as incurred. Marketing costs were $76.7 million, $70.1 million and $59.9 million in fiscal 2016, 2015 and 2014, respectively.
F- 10
Other Operating Income- Other operating income consists primarily of income from consignment sales, rental income, income from gift card breakage and insurance proceeds, and is included in operating expenses in the consolidated statements of operations. Total other operating income in fiscal 2016, 2015 and 2014 was $18.8 million, $16.3 million and $17.3 million, respectively, including rental income of $4.4 million, $4.3 million and $4.5 million for fiscal 2016, 2015 and 2014, respectively.
Non-Operating Income- Non-operating income includes the translation effects of foreign currency as well as realized gains and losses related to our investment portfolio.
Income Taxes- We account for income taxes under the asset and liability method. We determine the aggregate amount of income tax expense to accrue and the amount which will be currently payable based upon tax statutes of each jurisdiction in which we do business. Deferred tax assets and liabilities are recognized for the future tax consequences attributable to temporary differences between the financial statement carrying amounts of existing assets and liabilities and respective tax bases and operating loss and tax credit carryforwards, as measured using enacted tax rates expected to be in effect in the periods where temporary differences are expected to be realized or settled. The effect on deferred tax assets and liabilities of a change in tax rates is recognized in income in the period that includes the enactment date. U.S. deferred income taxes are not provided on undistributed income of foreign subsidiaries where such earnings are considered to be permanently reinvested for the foreseeable future. A valuation allowance is provided when it is more likely than not that some portion or all of a deferred tax asset will not be realized. The ultimate realization of deferred tax assets is dependent upon the generation of future taxable income during the periods in which those temporary differences become realizable.
We review and update our tax positions as necessary to add any new uncertain tax positions taken, or to remove previously
identified uncertain positions that have been adequately resolved. Additionally, uncertain positions may be remeasured as
warranted by changes in facts or law. Accounting for uncertain tax positions requires estimating the amount, timing and
likelihood of ultimate settlement. Although we believe that these estimates are reasonable, actual results could differ from
these estimates.
Cash and Equivalents- Cash and equivalents represent cash, money market funds and credit card receivables that generally settle within three days. Amounts due from banks and digital payment processors for credit card receivables totaled $15.0 million and $16.0 million as of January 28, 2017 and January 30, 2016, respectively. We also review cash balances on a bank by bank basis to identify book overdrafts. Book overdrafts occur when the amount of outstanding checks exceed the cash deposited at a bank. We reclassify book overdrafts, if any, to accounts payable.
Restricted Cash- Restricted cash represents cash that is restricted as to withdrawal or usage. The restricted cash balance is recorded in prepaid expenses and other current assets on the consolidated balance sheets and primarily consists of a mandatory cash deposit with the lender for outstanding letters of credit.
Investments- We determine the balance sheet classification of investments at the time of purchase and evaluate the classification at each balance sheet date. All income generated from these investments is recorded as interest income. We evaluate our investments for impairment and whether impairment is other-than-temporary at each balance sheet date.
Accounts and Note Receivable- Accounts receivable are classified as current assets because the average collection period is generally shorter than one year. Accounts receivable are primarily construction and tenant allowance receivables from landlords and receivables from affiliated business partners. The note receivable from Town Shoes is classified as long-term as it matures in 2022. We monitor our exposure for credit losses based upon specific accounts receivable balances and record related allowances for doubtful accounts, where a risk of default has been identified.
Inventories- Merchandise inventories for the DSW and ABG segments are stated at the lower of cost or market, determined using the retail inventory method. The retail inventory method is commonly used in the retail industry. Under the retail inventory method, the valuation of inventories at cost and the resulting gross profits are determined by applying a calculated cost to retail ratio to the retail value of inventories. The cost of the inventory reflected on the balance sheet is decreased by charges to cost of sales at the time the retail value of the inventory is lowered through the use of markdowns, which are reductions in prices due to customers' perception of value. Hence, earnings are negatively impacted as the merchandise is marked down prior to sale. Markdowns establish a new cost basis for inventory. Changes in facts or circumstances do not result in the reversal of previously recorded markdowns or an increase in the newly established cost basis. Markdowns require management to make assumptions regarding customer preferences, fashion trends and consumer demand.
F- 11
Inherent in the calculation of inventories are certain significant management judgments and estimates, including setting the original merchandise retail value, markdowns, and estimates of losses between physical inventory counts, or shrinkage, which combined with the averaging process within the retail inventory method, can significantly impact the ending inventory valuation at cost and the resulting gross profit. We record a reduction to inventories and a charge to cost of sales for shrinkage. Shrinkage is calculated as a percentage of net sales from the last physical inventory date. Estimates are based on both historical experience as well as recent physical inventory results. Store physical inventory counts are generally taken on an annual basis.
Merchandise inventories for Ebuys are valued at the lower of cost or market based on a specific acquisition cost basis. We record a reduction to inventories and a charge to cost of sales for inventory we expect to sell below our cost. The lower of cost or market adjustments are based on an analysis of historical experience and aging of inventory and management's judgment regarding future demand and market conditions.
Concentration of Risks- Financial instruments, which principally subject us to concentration of credit risk, consist of cash and equivalents and investments. We invest excess cash when available through financial institutions in money market accounts and short-term and long-term investments. At times, such amounts invested through banks may be in excess of Federal Deposit Insurance Corporation insurance limits, and we mitigate the risk by utilizing multiple banks.
We are also subject to concentration of vendor risk. During each of fiscal 2016, 2015 and 2014, three key vendors together supplied approximately 18% of our merchandise.
Fair Value- Fair value is defined as the price that would be received to sell an asset or paid to transfer a liability in an orderly transaction between market participants at the measurement date. Assets and liabilities recorded at fair value are categorized using defined hierarchical levels related to the subjectivity associated with the inputs to fair value measurements as follows:
• Level 1 - Quoted prices in active markets for identical assets or liabilities.
• Level 2 - Quoted prices for similar assets or liabilities in active markets or inputs that are observable.
• Level 3 - Unobservable inputs in which little or no market activity exists.
Property and Equipment- Property and equipment are stated at cost less accumulated depreciation determined by the straight-line method over the expected useful life of assets. The net book value of property or equipment sold or retired is removed from the asset and related accumulated depreciation accounts with any resulting net gain or loss included in results of operations. The estimated useful lives by class of asset are as follows:
Buildings | 39 years |
Building and leasehold improvements | 3 to 20 years or the lease term if shorter |
Furniture, fixtures and equipment | 3 to 10 years |
Software | 5 to 10 years |
Internal Use Software Costs- Costs related to software developed or obtained for internal use are expensed as incurred until the application development stage has been reached. Once the application development stage has been reached, certain qualifying costs are capitalized until the software is ready for its intended use. During fiscal 2016, we adopted the Financial Accounting Standards Board ("FASB") Accounting Standards Update ("ASU") 2015-05 on a prospective basis. Based on ASU 2015-05, if a cloud computing arrangement includes a software license, the software license element of the arrangement is accounted for in a manner consistent with the acquisition of other software licenses. If the arrangement does not include a software license, the arrangement is accounted for as a service contract. The impact of adopting the standard was immaterial.
Asset Impairment and Long-Lived Assets- We periodically evaluate the carrying amount of our long-lived assets, primarily property and equipment and definite-lived intangible assets, when events and circumstances warrant such a review to ascertain if any assets have been impaired. The carrying amount of a long-lived asset or asset group is considered impaired when the carrying value of the asset or asset group exceeds the expected future cash flows from the asset or asset group. The reviews are conducted at the lowest identifiable level, which generally has been identified as the store level. The impairment loss recognized is the excess of the carrying value of the asset or asset group over its fair value, based on a discounted cash flow analysis using a discount rate determined by management. Should an impairment loss be realized, it will generally be included in cost of sales.
F- 12
Goodwill- We evaluate goodwill for impairment annually during our fourth quarter, or more frequently if an event occurs or circumstances change, such as material deterioration in performance or a significant and sustained decline in our stock price, that would indicate that impairment may exist. When evaluating goodwill for impairment, we may first perform a qualitative assessment to determine whether it is more likely than not that a reporting unit is impaired. If we do not perform a qualitative assessment, or if we determine that it is not more likely than not that the fair value of the reporting unit exceeds its carrying amount, we calculate the estimated fair value of the reporting unit. Fair value is the price a willing buyer would pay for the reporting unit and is typically calculated using a discounted cash flow model. For certain reporting units, where deemed appropriate, we may also utilize a market approach for estimating fair value. If the carrying amount of the reporting unit exceeds the estimated fair value, an impairment charge is recorded to reduce the carrying value to the estimated fair value. We have never recorded a goodwill impairment.
Intangible Assets- Definite-lived intangible assets are amortized by the straight-line method using 5 to 10 years for online retailer and customer relationships, 15 years for tradenames, and 5 years for non-compete agreements. Trademarks have an indefinite life and are not amortized.
Equity Investment in Town Shoes- We account for our investment in Town Shoes using the equity method as we exercise significant influence, but we do not have control. Under the equity method of accounting, we recognize our share of Town Shoes' net income or loss. The difference between the purchase price and our interest in Town Shoes' underlying net equity is comprised of intangible assets, both with definite and indefinite lives. The definite lived assets are favorable and unfavorable leases that are being amortized over the lives of the leases. Our share of net income or loss of Town Shoes, payment-in-kind interest from the note receivable from Town Shoes, and amortization of the definite lived intangible assets are included in income (loss) from Town Shoes on the consolidated statements of operations. Related income tax effects are included in the provision for income taxes. The investment in and note receivable from Town Shoes are required to be tested for impairment if there is determined to be an other-than-temporary loss in value.
Cost Method Investments- We account for investments using the equity method of accounting when we exercise significant influence over the investment. If we do not exercise significant influence, we account for the investment using the cost method of accounting. Cost method investments are included in other assets on the consolidated balance sheets.
Self-Insurance Reserves- We record estimates for certain health and welfare, workers' compensation and casualty insurance costs that are self-insured programs. Self-insurance reserves include actuarial estimates of both claims filed, carried at their expected ultimate settlement value, and claims incurred but not yet reported. The liability represents an estimate of the ultimate cost of claims incurred as of the balance sheet date. Estimates for self-insurance reserves are calculated utilizing claims development estimates based on historical experience and other factors. We have purchased stop loss insurance to limit our exposure on a per person basis for health and welfare and on a per claim basis for workers' compensation and general liability, as well as on an aggregate annual basis.
Customer Loyalty Program- We maintain a customer loyalty program for DSW where program members can earn reward certificates that result in discounts on future purchases. Upon reaching the target-earned point threshold, the members receive reward certificates for these discounts, which expire three months after being issued. We accrue the anticipated redemptions of the discount earned at the time points are earned. To estimate these costs, we make assumptions related to customer purchase levels and redemption rates based on historical experience.
Co-Branded Credit Card- We offer to our customers co-branded credit cards under a seven-year agreement with an issuing bank, which allows members to earn points within our customer loyalty program through purchases at DSW and anywhere that Visa is accepted. We provide marketing support for the co-branded credit card program. The issuing bank is the sole owner of the credit card accounts.
The revenue under this agreement is recorded to net sales in the DSW segment. We received an upfront signing bonus from the issuing bank, which is recognized on a straight-line basis over the life of the relationship. We receive ongoing payments from the issuing bank for new accounts activated, as well as payments for usage of the cards, which are recognized over the remaining life of the relationship on a cumulative catch-up basis.
F- 13
Accounting for Leases- Many of our operating leases contain predetermined fixed increases of the minimum rentals during the initial lease terms. For these leases, we recognize the related rental expense on a straight-line basis over the noncancelable terms of the lease. We record the difference between the amounts charged to expense and the rent paid as deferred rent and begin amortizing such deferred rent upon the delivery of the lease location by the lessor. In addition, we receive cash allowances from landlords, which are deferred and amortized on a straight-line basis over the noncancelable terms of the lease as a reduction of rent expense. Deferred rent and construction and tenant allowances are included in non-current liabilities on the consolidated balance sheets.
Accrual for Lease Obligations- We record a reserve when a store or office facility is abandoned due to closure or relocation. Using its credit-adjusted risk-free rate to present value the liability, we estimate future lease obligations based on remaining lease payments, estimated or actual sublease income, and any other relevant factors. On a quarterly basis, we reassess the reserve based on current market conditions. As of January 28, 2017 and January 30, 2016, we had an accrual related to an office facility of $7.3 million and $8.3 million, respectively, included in non-current liabilities on the consolidated balance sheets.
Common Shares- There is currently no public market for the Company's Class B Common Shares, but the Class B Common Shares can be exchanged for the Company's Class A Common Shares at the election of the holder on a share for share basis. Holders of Class A Common Shares are entitled to one vote per share and holders of Class B Common Shares are entitled to eight votes per share on matters submitted to shareholders for approval.
Share Repurchase Program- Under our current share repurchase program, we have a remainder authorized of $33.5 million of Class A Common Shares that may yet be purchased. The share repurchase program may be suspended, modified or discontinued at any time, and the Company has no obligation to repurchase any amount of its common shares under the program. Shares will be repurchased in the open market at times and in amounts considered appropriate based on price and market conditions.
Accumulated Other Comprehensive Income- Changes for the balances of each component of accumulated other comprehensive income ("AOCI") were as follows (all amounts are net of tax):
January 28, 2017 | January 30, 2016 | ||||||||||||||||||||||
Foreign Currency Translation | Available-for-Sale Securities | Total | Foreign Currency Translation | Available-for-Sale Securities | Total | ||||||||||||||||||
(in thousands) | |||||||||||||||||||||||
Net gains (losses) in AOCI - beginning of period | $ | (20,530 | ) | $ | (173 | ) | $ | (20,703 | ) | $ | (6,454 | ) | $ | — | $ | (6,454 | ) | ||||||
Other comprehensive income before reclassifications | 6,831 | 127 | 6,958 | (14,076 | ) | (173 | ) | (14,249 | ) | ||||||||||||||
Amounts reclassified from AOCI to non-operating income | — | (196 | ) | (196 | ) | — | — | — | |||||||||||||||
Other comprehensive income | 6,831 | (69 | ) | 6,762 | (14,076 | ) | (173 | ) | (14,249 | ) | |||||||||||||
Net gains (losses) in AOCI - End of period | $ | (13,699 | ) | $ | (242 | ) | $ | (13,941 | ) | $ | (20,530 | ) | $ | (173 | ) | $ | (20,703 | ) | |||||
Foreign Currency Translation and Transactions- Our available-for-sale securities, equity investment in Town Shoes, and note receivable from Town Shoes are denominated in CAD and translated into USD at exchange rates in effect at the balance sheet date. Each quarter, the income or loss from Town Shoes is recorded in USD at the average exchange rate for the period. Resulting translation adjustments are reported as a component of other comprehensive income. Gains or losses resulting from foreign currency transactions are included in operating expenses in the consolidated statements of operations.
Deferred Compensation Plans- We provide deferred compensation plans, including a 401(k) plan to eligible employees and a non-qualified deferred compensation plan for certain executives and members of the Board of Directors, that allow the participants to defer a portion their compensation, up to certain limits. We match employee deferrals to the 401(k) plan at 100% on the first 3% of eligible compensation deferred and 50% on the next 2% of eligible compensation deferred. Additionally, we may contribute a discretionary profit sharing amount to either plan each year, but have not for the past three fiscal years. During fiscal 2016, 2015 and 2014, we recognized contribution costs associated with the 401(k) plan of $4.2 million, $3.8 million and $3.2 million, respectively.
F- 14
Restructuring- During fiscal 2016, in an effort to improve our cost structure, we have incurred restructuring expenses comprising of severance, professional fees, and other costs of $4.5 million included in operating expenses in the consolidated statements of operations. As of January 28, 2017, $0.7 million is remaining in accrued expenses primarily related to unpaid severance costs.
Prior Period Reclassification- Certain prior period reclassifications were made to conform to the current period presentation. Intangible assets were reclassified from other assets and are presented separately in our consolidated balance sheets.
Recent Accounting Pronouncements- In May 2014, the FASB issued ASU 2014-09, Revenue from Contracts with Customers, which provides a single comprehensive accounting standard for revenue recognition for contracts with customers and supersedes current guidance. Under ASU 2014-09, companies will recognize revenue to depict the transfer of goods or services to customers in amounts that reflect the payment to which a company expects to be entitled in exchange for those goods or services. The standard also will require enhanced disclosures and provide more comprehensive guidance for transactions such as service revenue and contract modifications. The standard is effective for us in the first quarter of fiscal 2018. We have completed an assessment identifying areas of impact to our financial statements, including sales returns, licensing arrangements, gift cards, and our loyalty and co-branded credit card programs. We are currently evaluating changes to the timing of recognition, calculation of amounts and classification within our financial statements. For income from breakage of gift cards, which is currently recognized as a reduction to operating expenses when the redemption of the gift card is remote, the new standard will require classification within net sales recognized proportionately over the expected redemption period. Also upon adoption of the standard, we will no longer use the incremental cost method and record to cost of sales for our loyalty program, rather we will use a deferred revenue model. We are continuing our assessment, which may identify other impacts, and evaluating the transition methods for adoption.
In February 2016, the FASB issued ASU 2016-02, Leases, which will change how lessees account for leases. For most leases, a liability will be recorded on the balance sheet based on the present value of future lease obligations with a corresponding right-of-use asset. Primarily for those leases currently classified by us as operating leases, we will recognize a single lease cost on a straight line basis based on the combined amortization of the lease obligation and the right-of-use asset. Other leases will be required to be accounted for as financing arrangements similar to current accounting for capital leases. On transition, we will recognize and measure leases at the beginning of the earliest period presented using a modified retrospective approach. The standard is effective for us in the first quarter of fiscal 2019. Early application will be permitted for all entities upon issuance of the final standard. We will not early adopt ASU 2016-02 and we expect the standard will have a material impact to our consolidated balance sheets. We are continuing to assess and evaluate the full impact of the standard on our financial statements and developing an implementation plan.
In March 2016, the FASB issued ASU 2016-09, Improvements to Employee Share-Based Payment Accounting, which modifies the accounting for excess tax benefits and tax deficiencies associated with share-based payments, the accounting for forfeitures, and the classification of certain items on the consolidated statements of cash flows. ASU 2016-09 eliminates the requirement to recognize excess tax benefits in additional paid-in capital ("APIC"), and the requirement to evaluate tax deficiencies for APIC or income tax expense classification, and provides for these benefits or deficiencies to be recorded as an income tax expense or benefit. The standard was effective for us at the beginning of fiscal 2017. We do not expect the impact of this new standard to be material to our consolidated financial statements. For the consolidated statements of cash flows, excess tax benefits related to stock-based compensation will no longer be presented, on a retroactive basis, as a financing activity cash inflow or as an operating activity cash outflow.
In November 2016, the FASB issued ASU 2016-18, Statement of Cash Flows - Restricted Cash, which requires that the consolidated statements of cash flows provides the change in the total of cash, cash equivalents, and restricted cash or restricted cash equivalents. This will result in us no longer showing the changes in restricted cash balances as a component of cash flows from investing activities but instead include the balances of restricted cash with cash and cash equivalents for the beginning and end of the periods presented. The standard is effective for us in the first quarter of fiscal 2018, although we expect to early adopt at the same time we adopt ASU 2016-09.
F- 15
4. RELATED PARTY TRANSACTIONS
Accounts receivable, accounts payable, and prepaid expenses associated with related parties are separately presented on the consolidated balance sheets. Accounts receivable from and payables to related parties normally settle in the form of cash in 30 to 60 days.
Schottenstein Affiliates
As of January 28, 2017, the Schottenstein Affiliates, entities owned by or controlled by Jay L. Schottenstein, the executive chairman of our Board of Directors, and members of his family, beneficially owned approximately 19% of the Company's outstanding Common Shares, representing approximately 51% of the combined voting power. As of January 28, 2017, the Schottenstein Affiliates beneficially owned 7.3 million Class A Common Shares and 7.7 million Class B Common Shares.
Leases with Related Parties- We lease our fulfillment center and certain store locations owned by Schottenstein Affiliates. See Note 14, Leases, for rent expense and future minimum lease payment requirements associated with the Schottenstein Affiliates
Basis Difference Related to Acquisition of Commonly Controlled Entity- The basis difference related to acquisition of commonly controlled entity balance, as shown on our consolidated balance sheets, relates to a legal entity acquisition in fiscal 2012 from certain Schottenstein affiliates. The legal entity owned property that was previously leased by us. As this was a transaction between entities under common control, there was no adjustment to the historical cost carrying amounts of assets transferred to the Company. The difference between the historical cost carrying amounts and the consideration transferred was reflected as an equity transaction.
Other Purchases and Services- During fiscal 2016, 2015 and 2014, we had other purchases and services from Schottenstein Affiliates of $2.3 million, $1.1 million and $0.9 million, respectively.
Town Shoes
Our ownership percentage in Town Shoes was 46.3%, which provides us a 50% voting control and board representation equal to the co-investor, and is treated as an equity investment.
Management Agreement- During fiscal 2016, we entered into a management agreement with Town Shoes, under which we provided certain information technology and management services, and recognized income of $0.6 million.
License Agreement- We license the use of our tradename and trademark, DSW Designer Shoe Warehouse, to Town Shoes for a royalty fee based on a percentage of net sales from its Canadian DSW stores. The license is exclusive and non-transferable for use in Canada. During fiscal 2016 and 2015, we recognized $0.5 million and $0.3 million, respectively, of royalty fees, which are included in net sales. Royalty fees for fiscal 2014 were immaterial.
Other Purchases and Services- During fiscal 2016, Town had other purchases and services from us of $0.7 million with no activity for fiscal 2015 and 2014.
David Duong, CEO of Ebuys
On March 4, 2016, we acquired 100% ownership of Ebuys from its co-founders, including David Duong who is our current CEO of Ebuys, for cash and future amounts to be paid to the co-founders contingent upon achievement of certain milestones. See Note 15, Commitments and Contingencies, for the estimated fair value of the contingent consideration liability and changes recognized during fiscal 2016. David Duong will receive 50% of any future payments of the contingent consideration.
F- 16
5. EARNINGS PER SHARE
Basic earnings per share is based on net income and the weighted average of Class A and Class B Common Shares outstanding. Diluted earnings per share reflects the potential dilution of common shares adjusted for outstanding stock options, RSUs and PSUs calculated using the treasury stock method.
The following is a reconciliation of the number of shares used in the calculations of earnings per share:
Fiscal | ||||||||
2016 | 2015 | 2014 | ||||||
(in thousands) | ||||||||
Weighted average shares outstanding - Basic shares | 81,536 | 87,561 | 89,499 | |||||
Dilutive effect of stock-based compensation awards | 599 | 940 | 1,113 | |||||
Weighted average shares outstanding - Diluted shares | 82,135 | 88,501 | 90,612 | |||||
For fiscal 2016, 2015 and 2014, the number of potential shares that were not included in the computation of dilutive earnings per share because the effect would be anti-dilutive was approximately 3.1 million, 1.9 million and 1.1 million, respectively.
6. | STOCK-BASED COMPENSATION |
The DSW Inc. 2014 Long-Term Incentive Plan (the "Plan") provides for the issuance of stock-based compensation awards for eligible recipients. The Plan replaced the DSW Inc. 2005 Equity Incentive Plan but did not affect awards granted under that plan, some of which remain outstanding. The Plan covers stock options, RSUs, PSUs, DSUs and Stock Appreciation Rights. Eligible recipients include key employees of DSW Inc. and affiliates, as well as directors. The maximum number of shares of Class A Common Shares underlying awards which may be issued over the term of the Plan cannot exceed 8.5 million shares. As of January 28, 2017, 6.9 million shares of Class A Common Shares remain available for future grants under the Plan.
Stock-based compensation expense consisted of the following:
Fiscal | |||||||||||
2016 | 2015 | 2014 | |||||||||
(in thousands) | |||||||||||
Stock options | $ | 5,788 | $ | 5,532 | $ | 5,827 | |||||
Restricted stock units | 3,342 | 2,953 | 2,097 | ||||||||
Performance-based restricted stock units | 2,317 | 3,979 | 1,324 | ||||||||
Director stock units | 1,240 | 1,037 | 1,247 | ||||||||
$ | 12,687 | $ | 13,501 | $ | 10,495 | ||||||
Stock Options- Stock options are granted with an exercise price per share equal to the fair market value of our common stock on the grant date. Stock options generally vest 20% per year on a cumulative basis and remain exercisable for a period of 10 years from the date of grant.
F- 17
The fair value for stock option awards was estimated at the grant date using the Black-Scholes pricing model with the following weighted average assumptions for options granted:
Fiscal | |||||
2016 | 2015 | 2014 | |||
Assumptions: | |||||
Risk-free interest rate | 1.5% | 1.4% | 1.8% | ||
Expected volatility | 36.0% | 37.9% | 44.5% | ||
Expected option term | 5.4 years | 5.1 years | 5.4 years | ||
Dividend yield | 3.0% | 2.1% | 2.3% | ||
Other Data: | |||||
Weighted average grant date fair value | $6.58 | $8.87 | $11.82 | ||
The risk-free interest rate is based on the yield for U.S. Treasury securities for the expected term of the options at the grant date. Expected volatility is based on the historical volatility of the Company's Class A Common Shares. The expected term of options granted is derived from historical data of stock option exercises. The dividend yield assumption is based on the expectation of future dividend payouts.
Stock-based compensation expense is recognized only for those awards that are expected to vest, with forfeitures estimated at
the date of grant based on our historical experience and future expectations. The forfeiture rate will be revised, if necessary,
in subsequent periods if actual forfeitures materially differ from the amount estimated. As of January 28, 2017, the total compensation cost related to unvested options not yet recognized was approximately $12.0 million, with a weighted average expense recognition period remaining of 2.0 years.
The following table summarizes the activity for outstanding stock options for fiscal 2016:
Shares Subject to Options | Weighted Average Exercise Price per Share | Weighted Average Remaining Contractual Life | Aggregate Intrinsic Value | |||||||||
(in thousands) | (in years) | (in thousands) | ||||||||||
Outstanding - beginning of year | 3,849 | $ | 25.56 | |||||||||
Granted | 850 | $ | 26.89 | |||||||||
Exercised | (410 | ) | $ | 15.30 | ||||||||
Forfeited | (490 | ) | $ | 29.80 | ||||||||
Outstanding - end of year | 3,799 | $ | 26.42 | 6.6 years | $ | 6,317 | ||||||
Vested and expected to vest - end of year | 3,590 | $ | 26.21 | 6.5 years | $ | 6,317 | ||||||
Exercisable - end of year | 1,986 | $ | 23.31 | 4.9 years | $ | 6,317 | ||||||
The aggregate intrinsic value is calculated as the amount by which the fair value of the underlying common shares exceeds the option exercise price. The total intrinsic value of options exercised during fiscal 2016, 2015 and 2014 was $3.6 million, $8.9 million and $11.9 million, respectively. The total fair value of options that vested during fiscal 2016, 2015 and 2014 was $2.7 million, $3.7 million and $2.5 million, respectively.
Restricted Stock Units- Beginning in fiscal 2013, RSUs granted generally cliff vest over three years, and prior to fiscal 2013, RSUs granted cliff vest over four years. RSUs receive dividend equivalents in the form of additional RSUs, which are subject to the same restrictions and forfeiture provisions as the original award. The grant date fair value of RSUs is based on the closing market price of the Class A Common Shares on the date of the grant.
F- 18
The following table summarizes the activity for unvested RSUs for fiscal 2016:
Number of Shares | Weighted Average Grant Date Fair Value | |||||
(in thousands) | ||||||
Outstanding - beginning of year | 372 | $ | 31.83 | |||
Granted | 195 | $ | 26.52 | |||
Vested | (129 | ) | $ | 31.33 | ||
Forfeited | (87 | ) | $ | 29.97 | ||
Outstanding - end of year | 351 | $ | 29.60 | |||
The total fair value of RSUs that vested during fiscal 2016, 2015 and 2014 was $3.7 million, $2.0 million and $1.4 million, respectively. As of January 28, 2017, the total compensation cost related to unvested RSUs not yet recognized was $5.8 million, with a weighted average expense recognition period remaining of 1.7 years.
Performance-Based Restricted Stock Units- PSUs generally cliff vest over three years based upon the achievement of pre-established goals as of the end of the first year of the term. PSUs receive dividend equivalents in the form of additional PSUs, which are subject to the same restrictions and forfeiture provisions as the original award. Consistent with RSUs, the grant date fair value of PSUs is based on the closing market price of the Class A Common Shares on the date of grant.
The following table summarizes the activity for unvested PSUs for fiscal 2016:
Number of Shares | Weighted Average Grant Date Fair Value | |||||
(in thousands) | ||||||
Outstanding - beginning of year | 293 | $ | 28.70 | |||
Granted | 116 | $ | 26.62 | |||
Vested | (133 | ) | $ | 25.76 | ||
Forfeited | (26 | ) | $ | 30.18 | ||
Outstanding - end of year | 250 | $ | 29.46 | |||
The total fair value of PSUs that vested during fiscal 2016 and 2015 was $1.4 million and $1.7 million, respectively (no PSUs vested during fiscal 2014). As of January 28, 2017, the total compensation cost related to unvested PSUs not yet recognized was approximately $4.0 million, with a weighted average expense recognition period remaining of 1.7 years.
Director Stock Units- We issue stock units to directors who are not employees. Stock units are automatically granted to each director on the date of each annual meeting of shareholders based on the closing market price of the Class A Common Shares. In addition, each director eligible to receive compensation for board service may elect to have the cash portion of such compensation paid in the form of stock units. Stock units granted to directors vest immediately and directors are given the option to settle their units 30 days after the grant date, at a specified date more than 30 days following the grant date, or upon completion of service. Stock units granted to directors, which are not subject to forfeiture, are considered to be outstanding for the purposes of computing basic earnings per share.
The following table summarizes the activity for unvested DSUs for fiscal 2016:
Number of Shares | ||
(in thousands) | ||
Outstanding - beginning of year | 305 | |
Granted | 69 | |
Exercised | (63 | ) |
Outstanding - end of year | 311 | |
F- 19
7. INVESTMENTS
We hold available-for-sale investments in bonds and term notes. The classification of available-for-sale securities is based on our intention of the use of the investments. The unrealized holding gains or losses for the available-for-sale securities are reported in other comprehensive income. We account for our purchases and sales of investments on the trade date of the investment.
Investments consisted of the following:
Short-term Investments | Long-term Investments | ||||||||||||||
January 28, 2017 | January 30, 2016 | January 28, 2017 | January 30, 2016 | ||||||||||||
(in thousands) | |||||||||||||||
Available-for-sale Investments: | |||||||||||||||
Carrying value | $ | 98,793 | $ | 225,985 | $ | 77,882 | $ | 72,153 | |||||||
Unrealized gains included in accumulated other comprehensive income | 101 | 477 | 133 | 22 | |||||||||||
Unrealized losses included in accumulated other comprehensive loss | (364 | ) | (435 | ) | (111 | ) | (222 | ) | |||||||
$ | 98,530 | $ | 226,027 | $ | 77,904 | $ | 71,953 | ||||||||
8. FAIR VALUE MEASUREMENTS
Financial Assets and Liabilities- Financial assets and liabilities measured at fair value on a recurring basis consisted of the following:
January 28, 2017 | January 30, 2016 | ||||||||||||||||||||||||||||||
Total | Level 1 | Level 2 | Level 3 | Total | Level 1 | Level 2 | Level 3 | ||||||||||||||||||||||||
(in thousands) | |||||||||||||||||||||||||||||||
Financial Assets: | |||||||||||||||||||||||||||||||
Cash and cash equivalents | $ | 110,657 | $ | 110,657 | $ | — | $ | — | $ | 32,495 | $ | 32,495 | $ | — | $ | — | |||||||||||||||
Short-term investments | 98,530 | 2,446 | 96,084 | — | 226,027 | 2,127 | 223,900 | — | |||||||||||||||||||||||
Long-term investments | 77,904 | 431 | 77,473 | — | 71,953 | 181 | 71,772 | — | |||||||||||||||||||||||
Total Financial Assets | $ | 287,091 | $ | 113,534 | $ | 173,557 | $ | — | $ | 330,475 | $ | 34,803 | $ | 295,672 | $ | — | |||||||||||||||
Financial Liabilities: | |||||||||||||||||||||||||||||||
Contingent consideration | $ | 33,204 | $ | — | $ | — | $ | 33,204 | $ | — | $ | — | $ | — | $ | — | |||||||||||||||
Total Financial Liabilities | $ | 33,204 | $ | — | $ | — | $ | 33,204 | $ | — | $ | — | $ | — | $ | — | |||||||||||||||
The short-term and long-term investments categorized as Level 2 were valued using a market-based approach using inputs such as prices of similar assets in active markets. See Note 15, Commitments and Contingencies, for the estimated fair value (categorized as Level 3) of the contingent consideration liability and changes recognized during fiscal 2016.
We have financial assets and liabilities not required to be measured at fair value on a recurring basis, which primarily consist
of accounts receivables, note receivable from Town Shoes, and accounts payables. The carrying value of accounts receivables and accounts payables approximated their fair values due to their short-term nature. As of January 28, 2017, the fair value of the note receivable from Town Shoes was $45.7 million, compared to the carrying value of $53.1 million. As of January 30, 2016, the fair value of the note receivable from Town Shoes was $33.3 million, compared to the carrying value of $44.2 million. We estimated the fair value of the note receivable based upon current interest rates offered on similar instruments. The change in fair value is based on the change in comparable rates on similar instruments. Based on our intention and ability to hold the note until maturity or the exercise of the put/call option, the carrying value is not other-than-temporarily impaired.
F- 20
Non-Financial Assets- During fiscal 2016, 2015, and 2014, we recognized impairment losses primarily on store leasehold improvements in the DSW segment of $0.2 million, $1.0 million, and $5.1 million, respectively. We determined that the carrying value exceeded the expected future cash flows and recorded an impairment after determining fair value based on the discounted future cash flow analysis using a discount rate determined by management based on historical performance and expectations of future performance (Level 3 inputs). After the impairment losses were recorded, the remaining fair value of the assets are immaterial.
9. PROPERTY AND EQUIPMENT
Property and equipment consisted of the following:
January 28, 2017 | January 30, 2016 | ||||||
(in thousands) | |||||||
Land | $ | 1,110 | $ | 1,110 | |||
Buildings | 12,485 | 12,485 | |||||
Building and leasehold improvements | 393,505 | 368,879 | |||||
Furniture, fixtures and equipment | 408,653 | 365,703 | |||||
Software | 123,460 | 117,553 | |||||
Construction in progress | 27,456 | 27,588 | |||||
Total property and equipment | $ | 966,669 | $ | 893,318 | |||
Accumulated depreciation and amortization | (591,418 | ) | (519,077 | ) | |||
Property and equipment, net | $ | 375,251 | $ | 374,241 | |||
Construction in progress is comprised primarily of the construction of leasehold improvements and furniture and fixtures related to unopened stores and internal-use software under development.
10. INTANGIBLE ASSETS
Intangible assets consisted of the following:
January 28, 2017 | January 30, 2016 | ||||||||||||||||||||||
Cost | Accumulated Amortization | Net | Cost | Accumulated Amortization | Net | ||||||||||||||||||
(in thousands) | |||||||||||||||||||||||
Definite-lived: | |||||||||||||||||||||||
Online retailer and customer relationships | $ | 22,300 | $ | (2,072 | ) | $ | 20,228 | $ | — | $ | — | $ | — | ||||||||||
Tradenames | 11,096 | (672 | ) | 10,424 | — | — | — | ||||||||||||||||
Non-compete agreements | 5,400 | (990 | ) | 4,410 | — | — | — | ||||||||||||||||
Indefinite-lived: | |||||||||||||||||||||||
Trademarks | 46 | — | 46 | 46 | — | 46 | |||||||||||||||||
$ | 38,842 | $ | (3,734 | ) | $ | 35,108 | $ | 46 | $ | — | $ | 46 | |||||||||||
During fiscal 2016, amortization expense related to the definite-lived intangibles was $3.7 million. Over the next five years, we estimate amortization expense to be approximately $4.1 million each year.
F- 21
11. ACCRUED EXPENSES
Accrued expenses consisted of the following:
January 28, 2017 | January 30, 2016 | ||||||
(in thousands) | |||||||
Gift cards and merchandise credits | $ | 45,743 | $ | 43,446 | |||
Compensation | 17,132 | 8,042 | |||||
Taxes | 21,764 | 17,004 | |||||
Customer loyalty program | 11,502 | 10,084 | |||||
Other(1) | 34,193 | 29,224 | |||||
$ | 130,334 | $ | 107,800 | ||||
(1) | Other is comprised of deferred revenue, sales return allowance, and various other accrued expenses, including amounts owed under our vendor payment program described below. |
To better facilitate the processing efficiency of certain vendor payments, during fiscal 2016 we entered into a vendor payment
program with a payment processing intermediary. Under the vendor payment program, the intermediary makes regularly-scheduled payments to participating vendors and we, in turn, settle monthly with the intermediary. The net change in the outstanding balance is reflected as a financing activity in the statements of cash flows.
12. NON-CURRENT LIABILITIES
Non-current liabilities consisted of the following:
January 28, 2017 | January 30, 2016 | ||||||
(in thousands) | |||||||
Construction and tenant allowances | $ | 87,886 | $ | 86,777 | |||
Deferred rent | 37,779 | 37,650 | |||||
Other | 15,514 | 16,332 | |||||
$ | 141,179 | $ | 140,759 | ||||
13. | DEBT |
$100 Million Secured Credit Facility- On August 2, 2013, we entered into a secured revolving credit agreement (the "Credit Facility"). The Credit Facility, together with the Letter of Credit Agreement (defined below), amended and restated the prior credit facility, dated June 30, 2010. The Credit Facility has a term of five years that will expire on July 31, 2018. The Credit Facility may be further increased by up to $50 million upon request subject to lender acceptance, financial condition and compliance with covenants. The Credit Facility is secured by a lien on substantially all of DSW Inc.'s personal property assets and its subsidiaries, with certain exclusions, and may be used to provide funds for general corporate purposes, to provide for ongoing working capital requirements and to make permitted acquisitions. Revolving credit loans bear interest under the Credit Facility at our option under: (a) a base rate option at a rate per annum equal to the highest of (i) the Federal Funds Open Rate (as defined in the Credit Facility), plus 0.5%, (ii) the Lender's prime rate, and (iii) the Daily LIBOR Rate (as defined in the Credit Facility) plus 1.0%, plus in each instance an applicable margin, which is between 1.00 and 1.25, based upon revolving credit availability; or (b) a LIBOR option at a rate equal to the LIBOR Rate (as defined in the Credit Facility), plus an applicable margin based upon our revolving credit availability. In addition, the Credit Facility contains restrictive covenants relating to the management and operation of our business. These covenants, among other things, limit or restrict our ability to grant liens on our assets, limit our ability to incur additional indebtedness, limit our ability to enter into transactions with affiliates and limit our ability to merge or consolidate with another entity. Our Credit Facility allows the payment of dividends by us or our subsidiaries, provided that we meet the minimum cash and investments requirement of $125 million, as defined in the Credit Facility. An additional covenant limits payments for capital expenditures to $200 million in any fiscal year. As of January 28, 2017, we had no outstanding borrowings under the Credit Facility with availability of $100 million and were in compliance with all covenants. Interest expense related to the Credit Facility includes fees, such as commitment and line of credit fees.
F- 22
$50 Million Letter of Credit Agreement- Also on August 2, 2013, we entered into a letter of credit agreement (the "Letter of Credit Agreement"). The Letter of Credit Agreement provides for the issuance of letters of credit up to $50 million, with a term of five years that will expire on August 2, 2018. The facility for the issuance of letters of credit is secured by a cash collateral account containing cash in an amount equal to 103% of the face amount of any letter of credit extension (105% for extensions denominated in foreign currency) and is used for general corporate purposes. The Letter of Credit Agreement requires compliance with conditions precedent that must be satisfied prior to issuing any letter of credit or extension. In addition, the Letter of Credit Agreement contains restrictive covenants relating to the management and operation of our business. These covenants, among other things, limit or restrict our ability to grant liens on our assets, limit our ability to incur additional indebtedness, limit our ability to enter into transactions with affiliates and limit our ability to merge or consolidate with another entity. An event of default may cause the applicable interest rate and fees to increase by 2% per annum. As of January 28, 2017, we were in compliance with all covenants.
As of January 28, 2017 and January 30, 2016, we had $3.8 million and $7.1 million, respectively, in outstanding letters of credit under the Letter of Credit Agreement, and $4.7 million and $7.7 million, respectively, in restricted cash on deposit as collateral under the Letter of Credit Agreement. The restricted cash balance is recorded in prepaid expenses and other current assets on the consolidated balance sheets.
14. | LEASES |
We lease stores, our fulfillment centers and other facilities under various arrangements with related and unrelated parties. Such leases expire through 2030 and, in most cases, provide for renewal options. Generally, we are required to pay base rent, real estate taxes, maintenance, insurance and contingent rentals based on sales in excess of specified levels. Under ABG agreements, we pay contingent rent to affiliated retailers based on sales for the shoe departments we operate. Rent expense shown below for related parties relates to lease activity with entities owned by Schottenstein Affiliates.
Rent expense, excluding real estate taxes, maintenance and insurance, consisted of the following:
Fiscal | |||||||||||
2016 | 2015 | 2014 | |||||||||
(in thousands) | |||||||||||
Minimum rentals: | |||||||||||
Unrelated parties | $ | 172,483 | $ | 162,072 | $ | 147,771 | |||||
Related parties | 8,091 | 8,064 | 9,189 | ||||||||
Contingent rentals to unrelated parties | 30,172 | 30,021 | 31,499 | ||||||||
$ | 210,746 | $ | 200,157 | $ | 188,459 | ||||||
As of January 28, 2017, our future minimum lease payment requirements, reduced by minimum sublease rentals of $1.5 million due in the future under noncancelable subleases and excluding contingent rental payments, maintenance, real estate taxes, and the amortization of deferred rent and construction and tenant allowances, are as follows:
Total | Unrelated Parties | Related Parties | |||||||||
(in thousands) | |||||||||||
Fiscal 2017 | $ | 199,403 | $ | 189,985 | $ | 9,418 | |||||
Fiscal 2018 | 192,382 | 185,441 | 6,941 | ||||||||
Fiscal 2019 | 176,677 | 170,227 | 6,450 | ||||||||
Fiscal 2020 | 166,164 | 160,449 | 5,715 | ||||||||
Fiscal 2021 | 146,351 | 141,704 | 4,647 | ||||||||
Future fiscal years thereafter | 374,235 | 370,384 | 3,851 | ||||||||
$ | 1,255,212 | $ | 1,218,190 | $ | 37,022 | ||||||
F- 23
15. | COMMITMENTS AND CONTINGENCIES |
Contingent Consideration Liability- The contingent consideration liability resulted from the acquisition of Ebuys and is based on a defined earnings performance measure for fiscal years 2017, 2018 and 2019 with no defined maximum earn-out. The contingent consideration liability is based on our estimated fair value with any differences between the final acquisition-date fair value and the estimated settlement of the obligation, as remeasured each reporting period, being recognized as an adjustment to income from operations.
Activity for the contingent consideration liability was as follows:
Fiscal | |||
2016 | |||
(in thousands) | |||
Contingent consideration liability - final acquisition-date fair value | $ | 53,355 | |
Accretion in value | 6,674 | ||
Fair value adjustments(1) | (26,825 | ) | |
Contingent consideration liability - end of period | $ | 33,204 | |
(1) | Fair value was determined by using a discounted cash flow of the projected earnings performance measure with a discount rate of 13.7%. The categorization of the fair value framework used to price the liability is considered Level 3 due to the subjective nature of the unobservable inputs used to determine the fair value. |
Legal Proceedings- We are involved in various legal proceedings that are incidental to the conduct of our business. Although it is not possible to predict with certainty the eventual outcome of any litigation, we believe the amount of any potential liability with respect to current legal proceedings will not be material to the results of operations or financial condition. As additional information becomes available, we will assess any potential liability related to pending litigation and revise the estimates as needed.
Guarantee- As a result of a previous merger, we provided a guarantee for a lease commitment that is scheduled to expire in 2024 of a location that has been leased to a third party. If the third party does not pay the rent or vacates the premise, we may be required to make full rent payments to the landlord.
Contractual Obligations- As of January 28, 2017, we have entered into various construction commitments, including capital items to be purchased for projects that were under construction, or for which a lease has been signed. Our obligations under these commitments were $1.8 million as of January 28, 2017. In addition, we have entered into various noncancelable purchase and service agreements. The obligations under these agreements were $23.6 million as of January 28, 2017.
F- 24
16. INCOME TAXES
Income tax provision consisted of the following:
Fiscal | |||||||||||
2016 | 2015 | 2014 | |||||||||
(in thousands) | |||||||||||
Current: | |||||||||||
Federal | $ | 61,506 | $ | 64,416 | $ | 80,205 | |||||
Foreign | 954 | 941 | 716 | ||||||||
State and local | 9,149 | 9,186 | 16,832 | ||||||||
Total current tax expense | 71,609 | 74,543 | 97,753 | ||||||||
Deferred: | |||||||||||
Federal | 4,972 | 8,035 | (1,616 | ) | |||||||
Foreign | 674 | 817 | — | ||||||||
State and local | 1,598 | 411 | 255 | ||||||||
Total deferred tax expense | 7,244 | 9,263 | (1,361 | ) | |||||||
Income tax provision | $ | 78,853 | $ | 83,806 | $ | 96,392 | |||||
The following presents a reconciliation of the income tax provision at the U.S. federal statutory tax rate and the total tax provision:
Fiscal | |||||||||||
2016 | 2015 | 2014 | |||||||||
(in thousands) | |||||||||||
Income tax expense at federal statutory rate | $ | 71,186 | $ | 76,944 | $ | 87,297 | |||||
State and local taxes, net of federal benefit | 7,212 | 7,847 | 8,808 | ||||||||
Foreign | 802 | 1,031 | (405 | ) | |||||||
Other | (347 | ) | (2,016 | ) | 692 | ||||||
Income tax provision | $ | 78,853 | $ | 83,806 | $ | 96,392 | |||||
F- 25
The tax effects of temporary differences that give rise to significant portions of the deferred tax assets and liabilities are as follows:
January 28, 2017 | January 30, 2016 | ||||||
(in thousands) | |||||||
Deferred tax assets: | |||||||
State bonus depreciation | $ | 2,989 | $ | 3,558 | |||
Inventory | 9,298 | 7,961 | |||||
Construction and tenant allowances | 2,386 | 3,454 | |||||
Stock-based compensation | 11,216 | 10,799 | |||||
Equity earnings | 1,560 | 829 | |||||
Gift cards | 3,928 | 3,730 | |||||
Accrued expenses | 2,747 | 3,354 | |||||
Accrued rewards | 4,568 | 4,016 | |||||
Accrued rent | 18,007 | 18,212 | |||||
Other | 3,124 | 2,847 | |||||
59,823 | 58,760 | ||||||
Less: valuation allowance | (1,972 | ) | (1,250 | ) | |||
Total deferred tax assets, net of valuation allowance | 57,851 | 57,510 | |||||
Deferred tax liabilities: | |||||||
Property and equipment | (31,923 | ) | (32,215 | ) | |||
Change in fair value of contingent consideration | (8,075 | ) | — | ||||
Prepaid expenses and other | (2,919 | ) | (3,480 | ) | |||
Total deferred tax liabilities | (42,917 | ) | (35,695 | ) | |||
Net deferred tax asset | $ | 14,934 | $ | 21,815 | |||
We establish valuation allowances for deferred tax assets when the amount of expected future taxable income is not likely to support the use of the deduction or credit. The valuation allowance is related to a capital loss carryforward, state income tax credits and state income tax refunds.
As of January 28, 2017, U.S. taxes have not been provided on unremitted earnings of subsidiaries operating outside of the U.S. These earnings, which are considered to be invested indefinitely, would become subject to income tax if we elected to distribute these foreign earnings in the future. Determination of the amount of unrecognized deferred U.S. income tax liability on these unremitted earnings is not practicable.
Changes in gross unrecognized tax benefits were as follows:
Fiscal | |||||||||||
2016 | 2015 | 2014 | |||||||||
(in thousands) | |||||||||||
Unrecognized tax benefits - beginning of period | $ | 5,767 | $ | 5,073 | $ | 2,691 | |||||
Additions for tax positions taken in the current year | 2,513 | 2,109 | 2,494 | ||||||||
Reductions for tax positions taken in prior years: | |||||||||||
Changes in estimates | — | — | — | ||||||||
Lapses of applicable statutes of limitations | (475 | ) | (854 | ) | — | ||||||
Settlements | (1,032 | ) | (561 | ) | (112 | ) | |||||
Unrecognized tax benefits - end of period | $ | 6,773 | $ | 5,767 | $ | 5,073 | |||||
As of January 28, 2017, January 30, 2016 and January 31, 2015, unrecognized tax benefits of $4.8 million, $3.9 million and $3.4 million, respectively, of the total unrecognized tax benefits would affect the effective tax rate if recognized. While it is expected that the amount of unrecognized tax benefits will change in the next 12 months, any changes are not expected to have a material impact on our financial position, results of operations or cash flows. We recognize interest and penalties related to
F- 26
unrecognized tax benefits as a component of the income tax provision. Interest and penalties were not material for fiscal 2016, 2015 and 2014.
We are no longer subject to U.S federal income tax examination for years prior to fiscal 2014 and state income tax examinations for years prior to 2011. We have various state income tax returns in the process of examination. We estimate the range of possible changes that may result from any current and future tax examinations to be insignificant at this time.
17. | SEGMENT REPORTING |
Our two reportable segments, which are also operating segments, are the DSW segment, which includes DSW stores and dsw.com, and the ABG segment. Other primarily includes Ebuys and our investment in Town Shoes. The performance of each segment is based on gross profit, which is defined as net sales less cost of sales. We have determined that the Chief Operating Decision Maker ("CODM") is our Chief Executive Officer and we have identified such segments based on internal management reporting and responsibilities.
The following provides certain financial data by segment reconciled to the consolidated financial statements (total assets by segment are not presented as the CODM does not evaluate, manage or measure performance of segments using total assets):
DSW segment | ABG segment | Other | Total | ||||||||||
(in thousands) | |||||||||||||
Fiscal 2016 | |||||||||||||
Net sales | $ | 2,477,991 | 149,586 | 83,867 | $ | 2,711,444 | |||||||
Gross profit | $ | 737,423 | 31,229 | 3,181 | $ | 771,833 | |||||||
Cash paid for property and equipment | $ | 86,430 | 1,002 | 148 | $ | 87,580 | |||||||
Depreciation and amortization | $ | 76,776 | 726 | 4,137 | $ | 81,639 | |||||||
Goodwill | $ | 25,899 | — | 53,790 | $ | 79,689 | |||||||
Fiscal 2015 | |||||||||||||
Net sales | $ | 2,470,107 | 150,141 | — | $ | 2,620,248 | |||||||
Gross profit | $ | 740,402 | 27,967 | — | $ | 768,369 | |||||||
Cash paid for property and equipment | $ | 103,087 | 852 | — | $ | 103,939 | |||||||
Depreciation and amortization | $ | 72,734 | 843 | — | $ | 73,577 | |||||||
Goodwill | $ | 25,899 | — | — | $ | 25,899 | |||||||
Fiscal 2014 | |||||||||||||
Net sales | $ | 2,352,464 | 143,628 | — | $ | 2,496,092 | |||||||
Gross profit | $ | 726,630 | 28,391 | — | $ | 755,021 | |||||||
Cash paid for property and equipment | $ | 95,027 | 3,099 | — | $ | 98,126 | |||||||
Depreciation and amortization | $ | 67,514 | 729 | — | $ | 68,243 | |||||||
The DSW and ABG segments operate in the United States and its territories. Ebuys sells products to customers located in North America, Europe, Australia and Asia, and Town Shoes operates in Canada. Net sales realized from geographic markets outside of the United States have collectively been insignificant. Substantially all of our long-lived assets reside within the United States. No single customer accounts for ten percent or more of net sales.
F- 27
18. | QUARTERLY FINANCIAL DATA (UNAUDITED) |
The following tables contain selected quarterly consolidated financial data for fiscal 2016 and 2015 that have been prepared on the same basis as the accompanying audited consolidated financial statements and include all adjustments necessary for a fair presentation, in all material respects, of the information set forth therein on a consistent basis:
Fiscal 2016 Quarters Ended(1) (2) | |||||||||||||||
April 30, 2016 | July 30, 2016 | October 29, 2016 | January 28, 2017 | ||||||||||||
(in thousands, except per share data) | |||||||||||||||
Net sales | $ | 681,267 | $ | 658,944 | $ | 696,616 | $ | 674,617 | |||||||
Gross profit | $ | 204,357 | $ | 186,861 | $ | 211,780 | $ | 168,835 | |||||||
Operating profit | $ | 48,716 | $ | 39,607 | $ | 62,899 | $ | 48,946 | |||||||
Net income | $ | 30,014 | $ | 25,032 | $ | 38,963 | $ | 30,526 | |||||||
Diluted earnings per share(3) | $ | 0.36 | $ | 0.30 | $ | 0.47 | $ | 0.38 | |||||||
Fiscal 2015 Quarters Ended | |||||||||||||||
May 2, 2015 | August 1, 2015 | October 31, 2015 | January 30, 2016 | ||||||||||||
(in thousands, except per share data) | |||||||||||||||
Net sales | $ | 655,486 | $ | 627,206 | $ | 665,520 | $ | 672,036 | |||||||
Gross profit | $ | 213,058 | $ | 191,302 | $ | 198,966 | $ | 165,043 | |||||||
Operating profit | $ | 73,572 | $ | 59,581 | $ | 63,329 | $ | 17,069 | |||||||
Net income | $ | 47,366 | $ | 37,610 | $ | 39,295 | $ | 11,763 | |||||||
Diluted earnings per share(3) | $ | 0.53 | $ | 0.42 | $ | 0.44 | $ | 0.14 | |||||||
(1) | Fiscal 2016 includes the results of operations of Ebuys, which we acquired on March 4, 2016. |
(2) | As a result of the Ebuys acquisition, we incurred certain acquisition-related costs and recorded changes in the fair value of the contingent consideration liability. Also during fiscal 2016, in an effort to improve our cost structure, we incurred restructuring expenses comprising of severance, professional fees, and other costs. The following presents the acquisition-related items and the restructuring expenses: |
Fiscal 2016 Quarters Ended | |||||||||||||||
April 30, 2016 | July 30, 2016 | October 29, 2016 | January 28, 2017 | ||||||||||||
(in thousands) | |||||||||||||||
Acquisition related: | |||||||||||||||
Inventory step-up costs | $ | 160 | $ | 532 | $ | 532 | $ | 533 | |||||||
Transaction costs (adjustments) | $ | 2,157 | $ | 127 | $ | 4 | $ | (29 | ) | ||||||
Amortization of intangible assets | $ | 732 | $ | 1,098 | $ | 1,072 | $ | 832 | |||||||
Change in fair value of contingent consideration liability | $ | 1,445 | $ | 2,167 | $ | 1,469 | $ | (25,232 | ) | ||||||
Restructuring expenses | $ | — | $ | 2,727 | $ | 1,349 | $ | 467 | |||||||
(3) | The sum of the quarterly diluted earnings per share amounts may not equal the fiscal year amount due to rounding and the use of weighted average shares outstanding for each period. |
F- 28
19. SUBSEQUENT EVENTS
On February 28, 2017, the Board of Directors declared a quarterly cash dividend payment of $0.20 per share for both Class A and Class B Common Shares. The dividend will be paid on March 31, 2017 to shareholders of record at the close of business on March 17, 2017.
On March 13, 2017, Gordmans, one of our affiliated partners in the ABG segment, filed for relief under Chapter 11 of the United States Bankruptcy Code and announced its plan to liquidate inventory and other assets. The ultimate outcome of the filing and liquidation sale is subject to the oversight and approval of the bankruptcy court. We are monitoring the status of the filing and are taking appropriate actions to maximize the recovery value of the inventory we own at Gordmans locations. As of January 28, 2017, inventory we owned at Gordmans locations was approximately $8.0 million at cost, we had a receivable balance due from Gordmans of $0.3 million, and net property and equipment located in their stores of approximately $0.3 million. Our current estimated annual after-tax loss as a result of Gordmans' actions is approximately $4.0 million to $8.0 million, which includes projected loss in operating profit, additional markdowns of inventory, and the write-down of other assets.
F- 29
INDEX TO EXHIBITS
Exhibit No. | Description | |
2.1 | Agreement and Plan of Merger, dated February 8, 2011, among DSW Inc., DSW MS LLC, and Retail Ventures, Inc. Incorporated by reference to Exhibit 2.1 to Form 8-K/A (file no. 001-32545) filed February 25, 2011. | |
2.2 | Agreement of Purchase and Sale, dated October 31, 2012, among DSW Inc., 4300 East Fifth Avenue LLC, 4300 Venture 34910 LLC, and 4300 Venture 6729 LLC. Incorporated by reference to Exhibit 2.1 to Form 8-K (file no. 001-32545) filed November 1, 2012. | |
2.3## | Stock Purchase Agreement, dated February 16, 2016, among DSW Shoe Warehouse, Inc. and Ebuys, Inc. Incorporated by reference to Exhibit 2.1 to DSW's Form 8-K (file no. 001-32545) filed February 17, 2016. | |
3.1 | Amended and Restated Articles of Incorporation of DSW Inc. dated November 1, 2013. Incorporated by reference to Exhibit 3.1 to DSW's Form 8-K (file no. 001-32545) filed November 4, 2013. | |
3.2 | Amended and Restated Code of Regulations of the registrant. Incorporated by reference to Exhibit 3.2 to Form 10-K (file no. 001-32545) filed April 13, 2006. | |
4.1 | Specimen Class A Common Shares certificate. Incorporated by reference to the same exhibit to Form 10-K (file no. 001-32545) filed April 13, 2006. | |
10.1 | Corporate Services Agreement, dated June 12, 2002, between Retail Ventures and Schottenstein Stores Corporation. Incorporated by reference to Exhibit 10.6 to Retail Ventures' Form 10-Q (file no. 001-10767) filed June 18, 2002. | |
10.1.1 | Amendment to Corporate Services Agreement, dated July 5, 2005, among Retail Ventures, Schottenstein Stores Corporation and Schottenstein Management Company, together with Side Letter Agreement, dated July 5, 2005, among Schottenstein Stores Corporation, Retail Ventures, Inc., Schottenstein Management Company and DSW Inc. related thereto. Incorporated by reference to Exhibit 10.5 to Retail Ventures' Form 8-K (file no. 001-10767) filed July 11, 2005. | |
10.2# | Employment Agreement, dated March 4, 2005, between Deborah L. Ferrée and DSW Inc. Incorporated by reference to Exhibit 10.4 to Form S-1 (Registration Statement No. 333-123289) filed March 14, 2005. | |
10.2.1# | First Amendment to Employment Agreement, dated December 31, 2007, between Deborah L. Ferrée and DSW Inc. Incorporated by reference to Exhibit 10.2.1 to Form 10-K (file no. 001-32545) filed April 17, 2008. | |
10.2.2# | Second Amendment to Employment Agreement, dated February 12, 2016, between Deborah L. Ferrée and DSW Inc. Incorporated by reference to Exhibit 10.2.2 to Form 10-K (file no. 001-32545) filed March 24, 2016. | |
10.3# | DSW Inc. 2014 Long-Term Incentive Plan. Incorporated by reference to Appendix C to Form DEF 14A (file no. 001-32545) filed April 30, 2014. | |
10.3.1# | Form of Restricted Stock Units Award Agreement for Employees. Incorporated by reference to Exhibit 10.3.1 to Form 10-K (file no. 001-32545) filed March 26, 2015. | |
10.3.2# | Form of Stock Units for Automatic Grants to Non-employee Directors. Incorporated by reference to Exhibit 10.3.2 to Form 10-K (file no. 001-32545) filed March 26, 2015. | |
10.3.3# | Form of Nonqualified Stock Option Award Agreement for Employees. Incorporated by reference to Exhibit 10.3.3 to Form 10-K (file no. 001-32545) filed March 26, 2015. | |
10.3.4# | Form of Performance-Based Restricted Stock Units Award Agreement for Employees. Incorporated by reference to Exhibit 10.3.4 to Form 10-K (file no. 001-32545) filed March 26, 2015. | |
10.4 | $50,000,000 Revolving Credit Facility Amended and Restated Credit Agreement, between DSW Inc., as Borrower, and PNC Bank, National Association, as Lender dated August 2, 2013. Incorporated by reference to Exhibit 10.1 to Form 10-Q (file no. 001-32545) filed September 6, 2013. | |
10.5 | Cost Sharing Agreement, dated November 1, 2012, between 4300 East Fifth Avenue LLC and 810 AC LLC, a wholly owned subsidiary of DSW. Incorporated by reference to Exhibit 10.1 to Form 8-K filed November 1, 2012. | |
10.6# | DSW Inc. 2005 Cash Incentive Compensation Plan. Incorporated by reference to Appendix B to Form DEF 14A (file no. 001-32545) filed April 30, 2014. | |
10.7 | Lease, dated August 30, 2002, by and between Jubilee Limited Partnership, an affiliate of Schottenstein Stores Corporation, and Shonac Corporation, re: Troy, MI DSW store. Incorporated by reference to Exhibit 10.44 to Retail Ventures' Form 10-K (file no. 001-10767) filed April 29, 2004. | |
E-1
Exhibit No. | Description | |
10.7.1 | Assignment and Assumption Agreement, dated October 23, 2002, between Shonac Corporation, as assignor, and DSW Shoe Warehouse, Inc., as assignee re: Troy, MI DSW store. Incorporated by reference to Exhibit 10.29.1 to Retail Ventures' Form 10-K/A (file no. 001-10767) filed May 12, 2005. | |
10.8 | Lease, dated October 28, 2003, by and between JLP-RICHMOND LLC, an affiliate of Schottenstein Stores Corporation, and Shonac Corporation, re: Richmond, VA DSW store. Incorporated by reference to Exhibit 10.47 to Retail Ventures' Form 10-K (file no. 001-10767) filed April 29, 2004. | |
10.8.1 | Assignment and Assumption Agreement, dated December 18, 2003 between Shonac Corporation, as assignor, and DSW Shoe Warehouse, Inc., as assignee re: Richmond, VA DSW store. Incorporated by reference to Exhibit 10.31.1 to Retail Ventures' Form 10-K/A (file no. 001-10767) filed May 12, 2005. | |
10.9 | Lease, dated May 2000, by and between Jubilee-Richmond LLC, an affiliate of Schottenstein Stores Corporation, and DSW Shoe Warehouse, Inc. (as assignee of Shonac Corporation), re: Glen Allen, VA DSW store. Incorporated by reference to Exhibit 10.49 to Retail Ventures' Form 10-K (file no. 001-10767) filed April 14, 2005. | |
10.10 | Lease, dated February 28, 2001, by and between Jubilee-Springdale, LLC, an affiliate of Schottenstein Stores Corporation, and Shonac Corporation d/b/a DSW Shoe Warehouse, re: Springdale, OH DSW store. Incorporated by reference to Exhibit 10.50 to Retail Ventures' Form 10-K (file no. 001-10767) filed April 14, 2005. | |
10.10.1 | Assignment and Assumption Agreement, dated May 11, 2001, between Shonac Corporation, as assignor, and DSW Shoe Warehouse, Inc., as assignee re: Springdale, OH DSW store. Incorporated by reference to Exhibit 10.50.1 to Retail Ventures' Form 10-K/A (file no. 001-10767) filed May 12, 2005. | |
10.11 | Agreement of Lease, dated 1997, between Shoppes of Beavercreek Ltd., an affiliate of Schottenstein Stores Corporation, and Shonac corporation (assignee of Schottenstein Stores Corporation d/b/a Value City Furniture through Assignment of Tenant's Leasehold Interest and Amendment No. 1 to Agreement of Lease, dated February 28, 2001), re: Beavercreek, OH DSW store. Incorporated by reference to Exhibit 10.51 to Retail Ventures' Form 10-K (file no. 001-10767) filed April 14, 2005. | |
10.11.1 | Assignment and Assumption Agreement, dated May 11, 2001, between Shonac Corporation, as assignor, and DSW Shoe Warehouse, Inc., as assignee re: Beavercreek, OH DSW store. Incorporated by reference to Exhibit 10.51.1 to Retail Ventures' Form 10-K/A (file no. 001-10767) filed May 12, 2005. | |
10.12 | Lease, dated February 28, 2001, by and between JLP-Chesapeake, LLC, an affiliate of Schottenstein Stores Corporation, and Shonac Corporation, re: Chesapeake, VA DSW store. Incorporated by reference to Exhibit 10.52 to Retail Ventures' Form 10-K (file no. 001-10767) filed April 14, 2005. | |
10.12.1 | Assignment and Assumption Agreement, dated May 11, 2001, between Shonac Corporation, as assignor, and DSW Shoe Warehouse, Inc., as assignee re: Chesapeake, VA DSW store. Incorporated by reference to Exhibit 10.52.1 to Retail Ventures' Form 10-K/A (file no. 001-10767) filed May 12, 2005. | |
10.13 | Ground Lease Agreement, dated April 30, 2002, by and between Polaris Mall, LLC, a Delaware limited liability company, and Schottenstein Stores Corporation-Polaris LLC, an affiliate of Schottenstein Stores Corporation, as modified by Sublease Agreement, dated April 30, 2002, by and between Schottenstein Stores Corporation-Polaris LLC, as sublessor, and DSW Shoe Warehouse, Inc., as sublessee (assignee of Shonac Corporation), re: Columbus, OH (Polaris) DSW store. Incorporated by reference to Exhibit 10.53 to Retail Ventures' Form 10-K (file no. 001-10767) filed April 14, 2005. | |
10.13.1 | Assignment and Assumption Agreement, dated August 6, 2002, between Shonac Corporation, as assignor, and DSW Shoe Warehouse, Inc., as assignee, re: Columbus, OH (Polaris) DSW store. Incorporated by reference to Exhibit 10.53.1 to Retail Ventures' Form 10-K/A (file no. 001-10767) filed May 12, 2005. | |
10.14 | Lease, dated August 30, 2002, by and between JLP-Cary, LLC, an affiliate of Schottenstein Stores Corporation, and Shonac Corporation, re: Cary, NC DSW store. Incorporated by reference to Exhibit 10.54 to Retail Ventures' Form 10-K (file no. 001-10767) filed April 14, 2005. | |
10.14.1 | Assignment and Assumption Agreement, dated October 23, 2002, between Shonac Corporation, as assignor, and DSW Shoe Warehouse, Inc., as assignee, re: Cary, NC DSW store. Incorporated by reference to Exhibit 10.54.1 to Retail Ventures' Form 10-K/A (file No. 001-10767) filed May 12, 2005. | |
10.15 | Lease, dated August 30, 2002, by and between JLP-Madison, LLC, an affiliate of Schottenstein Stores Corporation, and Shonac Corporation, re: Madison, TN DSW store. Incorporated by reference to Exhibit 10.55 to Retail Ventures' Form 10-K (file no. 001-10767) filed April 14, 2005. | |
10.15.1 | Assignment and Assumption Agreement, dated October 23, 2002, between Shonac Corporation, as assignor, and DSW Shoe Warehouse, Inc., as assignee, re: Madison, TN DSW store. Incorporated by reference to Exhibit 10.55.1 to Retail Ventures' Form 10-K/A (file no. 001-10767) filed May 12, 2005. | |
10.16 | Sublease, dated May 2000, by and between Schottenstein Stores Corporation, as sublessor, and Shonac Corporation d/b/a DSW Shoe Warehouse, Inc., as sublessee, re: Pittsburgh, PA DSW store. Incorporated by reference to Exhibit 10.48 to Retail Ventures' Form 10-K (file no. 001-10767) filed April 14, 2005. | |
E-2
Exhibit No. | Description | |
10.16.1 | Assignment and Assumption Agreement, dated January 8, 2001, between Shonac Corporation, as assignor, and DSW Shoe Warehouse, Inc. as assignee, re: Pittsburgh, PA DSW store. Incorporated by reference to Exhibit 10.48.1 to Retail Ventures' Form 10-K/A (file no. 001-10767) filed May 12, 2005. | |
10.17 | Sublease Agreement, dated June 12, 2000, by and between Jubilee Limited Partnership, an affiliate of Schottenstein Stores Corporation, and Shonac Corporation, re: Fairfax, VA DSW store. Incorporated by reference to Exhibit 10.42 to Form S-1 (Registration Statement No. 333-123289) filed with the Securities and Exchange Commission on March 14, 2005 and amended on May 9, 2005, June 7, 2005, June 15, 2005 and June 29, 2005. | |
10.17.1 | Assignment and Assumption Agreement, dated January 8, 2001, between Shonac Corporation, as assignor, and DSW Shoe Warehouse, Inc., as assignee, re: Fairfax, VA DSW store. Incorporated by reference to the Exhibit 10.42.1 to Form S-1 (Registration Statement No. 333-123289) filed with the Securities and Exchange Commission on March 14, 2005 and amended on May 9, 2005, June 7, 2005, June 15, 2005 and June 29, 2005. | |
10.18 | Lease, dated March 1, 1994, between Jubilee Limited Partnership, an affiliate of Schottenstein Stores Corporation, and Value City Department Stores, Inc., as modified by First Lease Modification, dated November 1, 1994, re: Merrillville, IN DSW store. Incorporated by reference to Exhibit 10.44 to Retail Ventures' Form 10-K (file no. 001-10767) filed April 14, 2005. | |
10.18.1 | Assignment and Assumption Agreement, dated January 17, 2008, between Value City Department Stores LLC, as assignor, and DSW Shoe Warehouse, Inc., as assignee, re: Merrillville, IN DSW Store. Incorporated by reference to Exhibit 10.43.1 to Form 10-K (file no. 001-32545) filed April 17, 2008. | |
10.19 | Form of Indemnification Agreement between DSW Inc. and its officers and directors. Incorporated by reference to Exhibit 10.44 to Form S-1 (Registration Statement No. 333-123289) Amendment No. 4 filed June 27, 2005. | |
10.20 | Agreement of Lease, dated April 7, 2006, by and between JLP-Harvard Park, LLC, an affiliate of Schottenstein Stores Corporation, and DSW Inc., re: Chagrin Highlands, Warrendale, Ohio DSW store. Incorporated by reference to Exhibit 10.45 to Form 10-K (file no. 001-32545) filed April 13, 2006. | |
10.21 | Agreement of Lease, dated June 30, 2006, between JLPK – Levittown NY LLC, an affiliate of Schottenstein Stores Corporation and DSW Inc., re: Levittown, NY DSW store. Incorporated by reference to Exhibit 10.1 to Form 10-Q (file no. 001-32545) filed December 6, 2006. | |
10.22 | Agreement of Lease, dated November 27, 2006, between JLP – Lynnhaven VA LLC, an affiliate of Schottenstein Stores Corporation and DSW Inc., re: Lynnhaven, Virginia DSW store. Incorporated by reference to Exhibit 10.2 to Form 10-Q (file no. 001-32545) filed December 6, 2006. | |
10.23 | Management Agreement, dated November 1, 2012, between Schottenstein Property Group, LLC and 810 AC LLC, a wholly owned subsidiary of DSW. Incorporated by reference to Exhibit 10.2 to Form 8-K (file no. 001-32545) filed November 1, 2012. | |
10.24 | Amendment to Master Separation Agreement between DSW Inc. and Retail Ventures, Inc., dated May 26, 2011. Incorporated by reference to Exhibit 10.1 to Form 8-K (file No. 001-32545) filed May 26, 2011. | |
10.25 | Amended and Restated Supply Agreement dated May 30, 2006, between DSW Inc. and Stein Mart, Inc. Incorporated by reference to Exhibit 10.1 to Form 8-K (file no. 001-32545) filed June 5, 2006. | |
10.26# | Nonqualified Deferred Compensation Plan. Incorporated by reference to Exhibit 10.1 to Form 10-Q (file no. 001-32545) filed December 13, 2007. | |
10.27 | Agreement of Lease, dated October 1, 2007, between 4300 Venture 34910 LLC, an affiliate of Schottenstein Stores Corporation and eTailDirect LLC re: fulfillment center. Incorporated by reference to Exhibit 10.1 to Form 8-K (file no. 001-32545) filed March 6, 2008. | |
10.27.1 | Lease Amendment to Agreement of Lease, dated September 29, 2009, between 4300 Venture 34910 LLC, an affiliate of Schottenstein Stores Corporation and eTailDirect LLC re: fulfillment center. Incorporated by reference to Exhibit 10.1 to Form 10-Q (file no. 001-32545) filed December 3, 2009. | |
10.27.2 | Second Lease Amendment to Agreement of Lease, dated November 30, 2010, between 4300 Venture 34910 LLC, an affiliate of Schottenstein Stores Corporation and eTailDirect LLC re: fulfillment center. Incorporated by reference to Exhibit 10.56.2 to Form 10-K (file no. 001-32545) filed March 22, 2011. | |
10.28 | Guaranty by DSW Inc. to 4300 Venture 34910 LLC, an affiliate of Schottenstein Stores Corporation re: Lease, dated October 1, 2007 between 4300 Venture 34910 LLC, an affiliate of Schottenstein Stores Corporation and eTailDirect LLC re: new fulfillment center for the business of dsw.com. Incorporated by reference to Exhibit 10.5 to Form 8-K (file no. 001-32545) filed March 6, 2008. | |
E-3
Exhibit No. | Description | |
10.29# | Employment Agreement, dated March 27, 2009, between William L. Jordan and DSW Inc. Incorporated by reference to Exhibit 10.61 to Form 10-K (file no. 001-32545) filed April 1, 2009. | |
10.29.1# | First Amendment to Employment Agreement, dated November 9, 2015, between William L. Jordan and DSW Inc. Incorporated by reference to Exhibit 10.29.1 to Form 10-K (file no. 001-32545) filed March 24, 2016. | |
10.30 | Lease, dated August 26, 2010, by and between JLP Nashua NH LLC, an affiliate of Schottenstein Stores Corporation, and DSW Shoe Warehouse, Inc., re: Nashua, NH store. Incorporated by reference to Exhibit 10.1 to Form 10-Q (file no. 001-32545) filed December 1, 2010. | |
10.31 | Lease, dated July 19, 2000, by and between Jubilee Limited Partnership, an affiliate of Schottenstein Stores Corporation, and Value City Department Stores, Inc., as modified by Lease Modification Agreement, dated November 2, 2000, re: 3704 W. Dublin-Granville Rd., Columbus, OH DSW/Filene's combo store. Incorporated by reference to Exhibit 10.56 to Retail Ventures' Form 10-K (file no. 001-10767) filed April 14, 2005. | |
10.31.1 | Assignment and Assumption of Lease Agreement, dated January 22, 2008, between Value City Department Stores LLC, Retail Ventures, Inc. and Jubilee-Sawmill LLC, an affiliate of Schottenstein Stores Corporation, re: 3704 W. Dublin-Granville Rd., Columbus, OH DSW/Filene's combo store. Incorporated by reference to Exhibit 10.55.1 to Retail Ventures' Form 10-K (file no. 001-10767) filed April 25, 2008. | |
10.31.2 | Lease Amendment to Agreement of Lease, by and between Jubilee-Sawmill LLC, an Ohio limited liability company, successor in interest to Jubilee Limited Partnership ("Landlord"), and DSW Shoe Warehouse, Inc. Incorporated by reference to Exhibit 10.2 to Form 10-Q (file no. 001-32545) filed December 6, 2013. | |
10.32 | Consulting Agreement, dated January 10, 2013, between DSW Inc. and SB Capital Group, LLC. Incorporated by reference to Exhibit 10.45 to Form 10-K (file no. 001-32545) filed March 28, 2013. | |
10.33 | Third Lease Amendment to Agreement of Lease, dated March 1, 2013, between 4300 Venture 34910 LLC, a Schottenstein Affiliate, and eTailDirect LLC re: fulfillment center. Incorporated by reference to Exhibit 10.2 to Form 10-Q (file no. 001-32545) filed June 7, 2013. | |
10.34 | Letter of Credit Agreement, dated as of August 2, 2013 among, DSW Inc. as the lead borrower, Wells Fargo Bank, National Association, as L/C Issuer. Incorporated by reference to Exhibit 10.2 to Form 10-Q (file no. 001-32545) filed September 6, 2013. | |
10.34.1 | Amendment to Letter of Credit Agreement, dated as of January 11, 2016 among, DSW Inc. as the lead borrower and PNC Bank as the Lender. Incorporated by reference to Exhibit 10.35.1 to Form 10-K (file no.001-32545) filed March 24, 2016. | |
10.35# | Amended Employment Agreement, dated March 19, 2014, between Roger Rawlins and DSW Inc. Incorporated by reference to Exhibit 10.50 to Form 10-K (file no. 001-32545) filed March 27, 2014. | |
10.35.1# | Employment Agreement, dated December 21, 2015, between Roger Rawlins and DSW Inc. Incorporated by reference to Exhibit 10.1 to Form 8-K (file no. 001-32545) filed December 22, 2015. | |
10.36# | Summary of Director Compensation. Incorporated by reference to Exhibit 10.1 to Form 10-Q filed September 5, 2014. | |
10.36.1# | Amended Summary of Director Compensation. Incorporated by reference to Exhibit 10.37.1 to Form 10-K (file no. 001-32545) filed March 24, 2016. | |
10.37# | Employment Agreement, dated April 28, 2014, between Mary Meixelsperger and DSW Inc. Incorporated by reference to Exhibit 10.44 to Form 10-K (file no. 001-32545) filed March 26, 2015. | |
10.37.1# | First Amendment to Employment Agreement, dated February 12, 2016, between Mary Meixelsperger and DSW Inc. Incorporated by reference to Exhibit 10.38.1 to Form 10-K (file no. 001-32545) filed March 24, 2016. | |
10.38# | Employment Agreement, dated January 4, 2016, between Simon Nankervis and DSW Inc. Incorporated by reference to Exhibit 10.39 to Form 10-K (file no. 001-32545) filed March 24, 2016. | |
10.39# | Employment Agreement, dated July 20, 2016, between Jared Poff and DSW Inc. Incorporated by reference to Form 10-Q (file no.001-32545) filed September 1, 2016. | |
21.1* | List of Subsidiaries. | |
23.1* | Consent of Independent Registered Public Accounting Firm. | |
24.1* | Powers of Attorney. | |
E-4
Exhibit No. | Description | |
31.1* | Rule 13a-14(a)/15d-14(a) Certification - Principal Executive Officer. | |
31.2* | Rule 13a-14(a)/15d-14(a) Certification - Principal Financial Officer. | |
32.1* | Section 1350 Certification - Principal Executive Officer. | |
32.2* | Section 1350 Certification - Principal Financial Officer. | |
101* | XBRL Instance documents. | |
* | Filed herewith. |
# | Management contract or compensatory plan or arrangement. |
## Certain schedules to this agreement have been omitted pursuant to Item 602(b)(2) of Regulation S-K and DSW Inc. agrees to furnish supplementary to the Securities and Exchange Commission a copy of any omitted schedule.
E-5