Attached files
| file | filename |
|---|---|
| EX-32.0 - EX-32.0 - UNIVERSAL BIOSENSORS INC | d321670dex320.htm |
| EX-31.2 - EX-31.2 - UNIVERSAL BIOSENSORS INC | d321670dex312.htm |
| EX-31.1 - EX-31.1 - UNIVERSAL BIOSENSORS INC | d321670dex311.htm |
| EX-21 - EX-21 - UNIVERSAL BIOSENSORS INC | d321670dex21.htm |
Table of Contents
UNITED STATES
SECURITIES AND EXCHANGE COMMISSION
Washington, D.C. 20549
FORM 10-K
| ☒ | Annual Report Pursuant To Section 13 or 15(d) of the Securities Exchange Act of 1934 |
For the fiscal year ended December 31, 2016
OR
| ☐ | Transition Report Pursuant To Section 13 or 15(d) of the Securities Exchange Act of 1934 |
Commission File Number: 000-52607
Universal Biosensors, Inc.
(Exact name of registrant as specified in its charter)
| Delaware | 98-0424072 | |
| (State or other jurisdiction of incorporation or organization) |
(I.R.S. Employer Identification Number) |
| Universal Biosensors, Inc. 1 Corporate Avenue, Rowville, 3178, Victoria Australia |
Telephone: +61 3 9213 9000 | Not Applicable | ||
| (Address of principal executive offices) | (Registrant’s telephone number, including area code) |
(Zip Code) |
Securities registered pursuant to Section 12(b) of the Act: None
Securities registered pursuant to Section 12(g) of the Act:
Title of each class
Shares of Common Stock, par value US$0.0001 per share
Indicate by check mark if the registrant is a well-known seasoned issuer, as defined in Rule 405 of the Securities Act. Yes ☐ No ☒
Indicate by check mark if the registrant is not required to file reports pursuant to Section 13 or Section 15(d) of the Act. Yes ☐ No ☒
Indicate by check mark whether the registrant (1) has filed all reports required to be filed by Section 13 or 15(d) of the Securities Exchange Act of 1934 during the preceding 12 months (or for such shorter period that the registrant was required to file such reports), and (2) has been subject to such filing requirements for the past 90 days. Yes ☒ No ☐
Indicate by check mark whether the registrant has submitted electronically and posted on its corporate Web site, if any, every Interactive Data File required to be submitted and posted pursuant to Rule 405 of Regulation S-T (§232.405 of this chapter) during the preceding 12 months (or for such shorter period that the registrant was required to submit and post such files). Yes ☒ No ☐
Indicate by check mark if disclosure of delinquent filers pursuant to Item 405 of Regulation S-K is not contained herein, and will not be contained, to the best of registrant’s knowledge, in definitive proxy or information statements incorporated by reference in Part III of this Form 10-K or any amendment to this Form 10-K. ☐
Indicate by check mark whether the registrant is a large accelerated filer, an accelerated filer, a non-accelerated filer or a smaller reporting company. See definitions of “accelerated filer and large accelerated filer” in Rule 12b-2 of the Exchange Act:
| Large accelerated filer | ☐ | Accelerated filer | ☐ | |||
| Non-accelerated filer | ☐ (Do not check if a smaller reporting company) | Smaller reporting company | ☒ | |||
Indicate by check mark whether the registrant is a shell company (as defined in Rule 12b-2 of the Exchange Act). Yes ☐ No ☒
The approximate aggregate market value of voting and non-voting common equity held by non-affiliates of the registrant was A$35,886,472 (equivalent to US$26,649,294) as of June 30, 2016.
The number of shares outstanding of each of the registrant’s classes of common stock as of March 14, 2017:
| Title of Class |
Number of Shares | |
| Common Stock, par value US$0.0001 per share | 176,386,884 |
Documents incorporated by reference:
Certain information contained in the registrant’s definitive Proxy Statement for the 2017 annual meetings of stockholders, to be filed not later than 120 days after the end of the fiscal year covered by this report, is incorporated by reference into Part III hereof.
Information contained on pages F-2 through F-46 of our Annual Report to Stockholders for the fiscal year ended December 31, 2016 (our “2016 Annual Report”) is incorporated by reference in our response to Items 7, 7A, 8 and 9A of Part II.
Table of Contents
| Page | ||||||
| 3 | ||||||
| ITEM 1. |
4 | |||||
| ITEM 1A. |
11 | |||||
| ITEM 1B. |
21 | |||||
| ITEM 2. |
22 | |||||
| ITEM 3. |
23 | |||||
| ITEM 4. |
24 | |||||
| ITEM 5. |
25 | |||||
| ITEM 6. |
29 | |||||
| ITEM 7. |
MANAGEMENT’S DISCUSSION AND ANALYSIS OF FINANCIAL CONDITION AND RESULTS OF OPERATION |
30 | ||||
| ITEM 7A. |
31 | |||||
| ITEM 8. |
32 | |||||
| ITEM 9. |
CHANGES IN AND DISAGREEMENTS WITH ACCOUNTANTS ON ACCOUNTING AND FINANCIAL DISCLOSURE |
34 | ||||
| ITEM 9A. |
35 | |||||
| ITEM 9B. |
38 | |||||
| ITEM 10. |
39 | |||||
| ITEM 11. |
40 | |||||
| ITEM 12. |
SECURITY OWNERSHIP OF CERTAIN BENEFICIAL OWNERS AND MANAGEMENT AND RELATED STOCKHOLDER MATTERS |
41 | ||||
| ITEM 13. |
CERTAIN RELATIONSHIPS AND RELATED TRANSACTIONS, AND DIRECTOR INDEPENDENCE |
42 | ||||
| ITEM 14. |
43 | |||||
| ITEM 15. |
44 | |||||
| ITEM 16. |
48 | |||||
| 49 | ||||||
Unless otherwise noted, references on this Form 10-K to “Universal Biosensors”, the “Company,” “Group,” “we,” “our” or “us” means Universal Biosensors, Inc. (“UBI”) a Delaware corporation and, when applicable, its wholly owned Australian operating subsidiary, Universal Biosensors Pty Ltd (“UBS”) and its wholly owned Canadian operating subsidiary, Hemostasis Reference Laboratory Inc. (“HRL”). Our principal place of business is located at 1 Corporate Avenue, Rowville, Victoria 3178, Australia. Our telephone number is +61 3 9213 9000. Unless otherwise noted, all references in this Form 10-K to “$”, “A$” or “dollars” and dollar amounts are references to Australian dollars. References to “US$” are references to United States dollars. References to “CAD$” are references to Canadian dollars.
2
Table of Contents
This Form 10-K, together with other statements and information publicly disseminated by us, contains certain forward looking statements within the meaning of Section 27A of the Securities Act of 1933, as amended, and Section 21E of the Securities Exchange Act of 1934, as amended. We intend such forward-looking statements to be covered by the safe harbor provisions for forward-looking statements contained in the Private Securities Litigation Reform Act of 1995 and include this statement for purposes of complying with these safe harbor provisions. Such forward-looking statements involve known and unknown risks, uncertainties and other factors that may cause our, our customers and partners’ or our industry’s actual results, levels of activity, performance or achievements to be materially different from those anticipated by the forward-looking statements. All statements, other than statements of historical facts, are forward-looking statements. Forward-looking statements include, but are not limited to, statements about:
| • | our business and product development strategies; |
| • | our expectations with respect to collaborative, strategic or distribution arrangements; |
| • | our expectations with respect to the timing and amounts of revenues from our customers and partners; |
| • | our expectations with respect to the services we provide to, and the development projects we undertake for, our customers and partners; |
| • | our expectations with respect to regulatory submissions, approvals, market launches of products we develop or are involved in developing; |
| • | our expectations with respect to sales of products we develop or are involved in developing and the quantities of such products to be manufactured by us; |
| • | our expectations with respect to our research and development programs, the timing of product development and our associated research and development expenses; |
| • | the ability to protect our owned or licensed intellectual property; and |
| • | our estimates regarding our capital requirements, the sufficiency of our cash resources, our debt repayment obligations and our need for additional financing. |
The words “anticipates,” believes,” “continue,” “estimates,” “expects,” “intends,” “may,” “plans,” “potential,” “projects,” “should,” “will,” “would” and similar expressions are intended to identify forward-looking statements, although not all forward-looking statements contain these identifying words. You should not place undue reliance on these forward-looking statements, which apply only as of the date of this Form 10-K. The forward-looking statements included in this Form 10-K do not guarantee our future performance, and actual results could differ from those contemplated by these forward-looking statements. Actual results or events could differ materially from the plans, intentions and expectations disclosed in the forward-looking statements that we make. We undertake no obligation to update any forward-looking statement to reflect events or circumstances after the date on which the statement is made or to reflect the occurrence of unanticipated events. Factors that could cause or contribute to such differences include, but are not limited to, those discussed in cautionary statements throughout this Form 10-K, particularly those set forth in section “Item 1A - Risk Factors.” However, new factors emerge from time to time and it is not possible for us to predict which factors will arise. In addition, we cannot assess the impact of each factor on our business or the extent to which any factor, or combination of factors, may cause actual results to differ materially from those contained in any forward-looking statements. Except to the extent required by applicable law or regulation, we do not undertake to update or revise any forward-looking statements.
3
Table of Contents
The following discussion and analysis should be read in conjunction with our financial statements and related notes included elsewhere in this Form 10-K. This discussion and analysis contain forward-looking statements based upon current expectations that involve risks and uncertainties. Our actual results and the timing of events could differ materially from those anticipated in these forward-looking statements as a result of several factors, including those set forth in the section entitled “Item 1A - Risk Factors” and elsewhere in this Form 10-K.
Business overview
We are a specialist medical diagnostics company focused on the research, development and manufacture of in vitro diagnostic test devices for consumer and professional point-of-care use.
We were incorporated in the State of Delaware on September 14, 2001 and our shares of common stock in the form of CHESS Depositary Interests (“CDIs”) have been quoted on the Australian Securities Exchange (“ASX”) since December 13, 2006. Our securities are not currently traded on any other public market. Our wholly owned subsidiary and primary operating vehicle, Universal Biosensors Pty Ltd (“UBS”) was incorporated as a proprietary limited company in Australia on September 21, 2001. UBS conducts our primary research, development and manufacturing activities in Melbourne, Australia. A subsidiary of UBS, Hemostasis Reference Laboratory Inc. (“HRL”) was incorporated in British Columbia, Canada on November 30, 2016. On December 16, 2016, HRL acquired the Hemostasis Reference Laboratory business from LifeLabs, Inc. HRL conducts coagulation testing and calibration services for products we manufacture as well as for other international customers in Hamilton, Canada.
Our principal place of business is 1 Corporate Avenue, Rowville, Victoria 3178, Australia. Our principal telephone number in Australia is +61 3 9213 9000. Our agent for service in the United States is Corporation Service Company of 2711 Centerville Road, Suite 400, Wilmington, DE 19808, United States. HRL’s principal place of business is 15(H) Wing, Second Floor, 711 Concession Street, Hamilton, Ontario and its registered office is 310-318 Homer Street, Vancouver, British Columbia V6B 2V2, Canada. We also maintain a website at www.universalbiosensors.com and HRL maintains a website at www.hemostasislab.com. The information contained in, or that can be accessed through, our websites is not part of this Form 10-K.
We have rights to an extensive patent portfolio, with certain patents owned by UBS and a number licensed to UBS by LifeScan, Inc. and other third party licensors. Unless otherwise noted, references to “LifeScan” in this document are references collectively or individually to LifeScan, Inc., and/or LifeScan Europe, a division of Cilag GmbH International, both affiliates of Johnson and Johnson.
We are using our electrochemical cell technology platform to develop point-of-care testing systems for a number of different markets. Our current focus is as set out below:
| • | Coagulation testing market – We are working with Siemens Healthcare Diagnostics Inc. (“Siemens”) in relation to a range of products for the point-of-care coagulation testing market, pursuant to a Collaboration Agreement with Siemens (“Collaboration Agreement”). The first such product developed with Siemens, the Xprecia Stride™ Coagulation Analyzer, received CE mark approval on December 9, 2014 and US Food and Drug Administration (“FDA”) approval on October 4, 2016. The Xprecia Stride™ Coagulation Analyzer is now available in Europe, the Middle East, Africa, Asia Pacific, Latin America and Canada. Under the terms of a supply agreement with Siemens (“Supply Agreement”), UBS is the manufacturer of test strips for this product and two further tests still in development for Siemens. |
| • | Blood glucose – We provide services to LifeScan as required from time to time, pursuant to a Master Services and Supply Agreement (“Master Services and Supply Agreement”) and a development and research agreement (“Development and Research Agreement”) with LifeScan. |
| • | Other electrochemical-cell based tests – We are working on demonstrating the broader application of our technology platform. We may seek to enter into collaborative arrangements, strategic alliances or distribution agreements with respect to any products or technologies arising from this work. |
Our Strategy
We are a specialist medical diagnostics company focused on the research, development and manufacture of in vitro diagnostic test devices for consumer and professional point-of-care use. Key aspects of our strategy for generating shareholder value include:
| • | manufacturing products (test strips and analyzers) for our customers and future partners as required; |
4
Table of Contents
| • | undertaking research and development work for our customers and partners; |
| • | providing support services to our customers and partners; |
| • | extending our electrochemical cell technology and demonstrating the broader application of our technology platform for markets with significant commercial potential; and |
| • | seeking to enter into collaborative, strategic or distribution arrangements with other life sciences companies or other industry participants with respect to the development and commercialization of specific tests or specific fields. |
Plan of Operations for the Remainder of the Fiscal Year Ending December 2017
Our plan of operations over the remainder of the fiscal year ending December 2017 is to:
| • | manufacture products; |
| • | undertake research and development work for our customers and partners; |
| • | provide the necessary post-market support for our customers and partners; |
| • | demonstrate the broader application of our technology platform for markets with significant commercial potential, focusing initially on enzymatic, immunoassay and molecular diagnostic point-of-care tests; and |
| • | seek to enter into collaborative, strategic or distribution arrangements with other life sciences companies or other industry participants with respect to the development and commercialization of specific tests or specific fields. |
Financial information about segments
We operate in one segment. Our principal activities are the research, development and manufacture of in vitro diagnostic test devices for consumer and professional point-of-care use. Although our products are intended for sale worldwide, we operate predominantly in one geographical area, that being Australia. For details of our revenues, profit and loss and total assets, refer to our 2016 Annual Report.
Description of our business
We are a specialist medical diagnostics company focused on the research, development and manufacture of in vitro diagnostic test devices for consumer and professional point-of-care use.
Industry background
We operate in the high growth, point-of-care segment of the global in vitro diagnostics (IVD) industry. A large proportion of clinical diagnostics has historically been performed by trained personnel at dedicated or centralized testing sites including hospital laboratories and commercial pathology laboratories. Significant interest has developed in techniques and technologies that allow testing to be performed “on-the-spot” (in real time at the patient’s side). Point-of-care testing can be further divided into consumer self-testing or testing of patients by one of a variety of medical or laboratory professionals in locations such as clinics, physician’s office laboratories and emergency departments. While not all tests are suited to being performed at the point-of-care, we believe our electrochemical cell technology and other technologies could be a suitable platform for adapting a number of relevant central laboratory tests to a point-of-care format.
Point-of-care tests in development and partnering strategy
We are also working to demonstrate the broader application of our technology platform for markets with significant commercial potential across enzymatic, immunoassay and molecular diagnostic point-of-care tests. Our strategy is to apply the electrochemical cell technology to different fields and biomarkers and then to either enter into collaborative arrangements or strategic alliances with third parties to develop and commercialize products for those fields or, as the case may be, to complete the development of the products and commercialize them using distributors. To date, we have developed a blood glucose test with LifeScan and a coagulation PT-INR test with Siemens, both of which are now sold by LifeScan and Siemens, respectively. We intend to continue to work with Siemens to develop other test strip and reader products for the point-of-care coagulation market.
5
Table of Contents
Principal Products and Services
UBS is the manufacturer of PT-INR coagulation test strips for Siemens’ Xprecia StrideTM Coagulation Analyzer. We intend to continue to work with Siemens to develop a range of other products for the point-of-care coagulation testing market which UBS expects to manufacture once approved for sale. UBS also conducts research and development to demonstrate the broader application of our technology platform.
UBS provides LifeScan with research and development services from time to time. Between 2009 and 2013, UBS acted as a non-exclusive manufacturer of blood glucose test strips for LifeScan’s OneTouch Verio® blood glucose testing product. While UBS no longer manufactures the OneTouch Verio® blood glucose test strips for LifeScan, under the Master Services and Supply Agreement, UBS continues to be paid the quarterly service fee based on the number of OneTouch Verio® strips sold, irrespective of the manufacturer of the strips in consideration of services provided. At any time after the end of the quarter following receipt by us of US$45 million in quarterly service fees, LifeScan has the option to give notice of conversion of the quarterly service fees. In the event notice is given, LifeScan is only required to the pay the quarterly service fees for the remainder of LifeScan’s financial year in which the notice was given. In addition, after the end of that financial year, LifeScan must pay a one-time lump sum fee. This one-time lump sum service fee is calculated by multiplying the sum of all quarterly service fees for the relevant financial year in which notice is given by a multiplier (2.2x if notice is given in 2017 or 2x if notice is given in 2018 and beyond). As of December 31, 2016, we had receipted cumulative quarterly service fees of US$31.6 million. The service fees for the quarter ending December 31, 2016 amounted to US$3.1 million and remained unpaid as at balance date. The cumulative quarterly service fees receipted and accrued as at December 31, 2016 is US$34.7 million.
Facilities
Universal Biosensors Pty Ltd leases approximately 5,000 square meters of office, research and development and manufacturing facilities at 1 Corporate Avenue, Rowville in Melbourne, Australia. We have had ISO 13485 certification continuously at that site since May 2007. The lease for 1 Corporate Avenue expires on March 31, 2019 with an option to renew the lease for two further terms of five years each.
HRL leases approximately 482 square meters of office and laboratory facilities at 15(H) Wing, Second Floor, 711 Concession Street, Hamilton, Ontario. As part of the acquisition of the assets of the Hemostasis Reference Laboratory business, HRL was transferred ISO 13485:2003 and ISO 13485 certification, which has been held continuously at the site since May 15, 2014 and July 2011, respectively. The lease for 711 Concession Street expires on January 31, 2020 with 2 further options to renew each for 5 years. Either HRL or its landlord can terminate the lease early by giving 6 months’ notice.
Raw materials
Raw materials essential to our business are purchased worldwide in the ordinary course of business from numerous suppliers. In general, these materials are available from multiple sources. Certain of our products in development may be more reliant on sole sources of supply. We seek to enter into long term contracts of supply with respect to these materials and intend to develop mitigation strategies, which may include development work to enable substitute materials to be used.
Distribution
Siemens is responsible to the sales and distribution of its products. With respect to certain of our products in development, including our PT-INR test, part of our strategy is to establish distribution arrangements in the future.
Regulatory clearances
In all major territories of the world, regulatory clearances are required prior to marketing diagnostic tests. The regulatory clearance requirements vary from country to country and product to product, however, regulatory clearances typically require a satisfactory “technical file”, which provides the regulatory bodies with details of the design and previous testing of the product including safety and efficacy data as well as the details of the conduct of trials which show the suitability for use of the product at the point-of-care. Regulators also require demonstration of continuing compliance with an appropriate quality management system. There is no common international regulatory body and we, or our relevant customer or partner or distributor, would be required to submit for clearance to sell in each of the major jurisdictions in which we or our relevant customers and partners seeks to market products.
6
Table of Contents
For example, for Europe, a “Notified Body” assesses the quality system and product technical file, whereas in the United States, the Food and Drug Administration, or “FDA”, is the regulatory body responsible for the examination of the design and performance of the device and for assessment of our quality system.
In the case of point-of-care tests, there are often additional requirements that a manufacturer must meet such as an examination of certain aspects affecting test suitability for non-professional users. In Europe, certain codified standards describe the requirements of tests whilst in the United States, tests to be used by non-laboratory professionals must gain waiver status under the United States Clinical Laboratory Improvement Amendments of 1988. Amongst other clearances, we will also require clearance for export of medical devices from the Therapeutics Goods Administration, or “TGA”, in Australia.
If we are developing a product for a customer or partner, our customers and partners are generally responsible for obtaining and maintaining all applicable regulatory approvals and determining the location and timing for submissions for regulatory clearance. We may provide a supporting role in this process. We will however be responsible for the regulatory approvals of the products which we wish to take to market through distributors.
The importance and duration of all our patents, trademarks and licenses
We rely on a combination of patent, copyright, trademark and trade secret laws, as well as confidentiality agreements, to establish and protect our proprietary rights which in the aggregate we believe to be of material importance to us in the operation of our business. Our continued success depends to a large extent on our ability to protect and maintain our owned and licensed patents and patent applications, copyright, trademark and trade secrets.
Our point-of-care tests in development draw upon an extensive portfolio of patents and patent applications as well as know-how either owned by UBS or licensed to UBS. We patent the technology, inventions and improvements that we consider important to the development of our business.
We rely on the owned patent applications and the patents and patent applications licensed to us in the manufacture of the point-of-care diagnostic tests being developed by us and to enable us to grant rights to our customers and partners to commercialize products that we may develop.
Our owned and licensed patents extend for varying periods according to the date of patent filing or grant and the legal term of patents in the various countries where patent protection is obtained. The actual protection afforded by a patent, which can vary from country to country, depends upon the type of patent, the scope of its coverage and the availability of legal remedies in the country. Based on current product sales and our projects, the owned and licensed patents and patent applications that we consider most significant by virtue of their importance to our platform together with the last of the patents to expire within the patent family are set forth in the table below.
| Patent |
Expiration Year | |||
| Apparatus and Method for Electrochemical Protease Sensor (this patent family relates to a sensor to detect cleavage of an electrochemical substrate for use in measuring blood or plasma coagulation in assays such as prothrombin time and thrombin potential) | 2028 | |||
| Electrochemical On-Board Control Detection (this patent family relates to an on-board control system of a sensor, wherein the control system can test/verify the viability of the sensor) | 2030 | |||
| Electrochemical Cell (this patent family relates to a method and an electrochemical biosensor for determining the concentration of an analyte in a carrier) | 2022 | |||
| Electrochemical Method (this patent family provides an improved method and biosensor for determination of the concentration of an analyte in a carrier which provides improved accuracy, reliability and speed over prior techniques) | 2024 | |||
| Electrochemical Method for Measuring Chemical Reaction Rates (this patent family relates to the measurement of the progress of a chemical reaction that generates an electroactive reaction product that is subsequently detected at an electrode amperometrically or coulometrically) | 2023 | |||
| Electrochemical Cell Connector (this patent family relates to a connector to provide electrical connection between an electrochemical cell of a strip type sensor and meter circuitry) | 2026 | |||
7
Table of Contents
| Patent |
Expiration Year | |||
| Method and Apparatus for Rapid Electrochemical Analysis (this patent application relates to an improved method and apparatus for electrochemical analysis) | 2026 | |||
| Methods and Apparatus for Analyzing a Sample in the Presence of Interferents (this patent application relates to methods and apparatus for determining analyte concentrations in a rapid and accurate manner) | 2026 | |||
| System and Method for measuring an Analyte in a Sample (this patent relates to a method for measuring a temperature corrected glucose concentration over a temperature range) | 2029 | |||
| Systems and Methods for Discriminating Control Solution from a Physiological Sample (this patent application relates to systems and methods for discriminating between a control solution and blood sample) | 2028 | |||
| Systems and Methods of Discriminating Control Solution from a Physiological Sample (this patent application relates to systems and methods for discriminating between a control solution and a blood sample based on a summation of current values and comparing reference values to threshold values) | 2027 | |||
We intend to continue to file and prosecute patent applications when and where appropriate to attempt to protect our rights in our proprietary technologies.
Pursuant to our License Agreement with LifeScan, LifeScan is responsible for prosecution and maintenance of the patents and patent applications licensed to us by them. In the event that LifeScan elects not to proceed with the prosecution of a patent application licensed to us by them or discontinues the payment of fees, we have the right to assume and continue at our own expense the prosecution of any such patent or patent applications. We also license intellectual property from Siemens and SpeeDx Pty Ltd, who are both primarily responsible for the prosecution and maintenance of the patents and patent applications licensed to us by them.
Our ability to build and maintain our proprietary position for our technology and products will depend on our success in obtaining effective claims and those claims being enforced once granted and, with respect to intellectual property licensed to us, the licensee’s success in obtaining effective claims and those claims being enforced once granted. The patent positions of companies like ours are generally uncertain and involve complex legal and factual questions for which important legal principles remain unresolved. Some countries in which we or our customers or partners may seek approval to sell point-of-care tests that we have been involved in developing, may fail to protect our owned and licensed intellectual property rights to the same extent as the protection that may be afforded in the United States or Australia. Some legal principles remain unresolved and there has not been a consistent policy regarding the breadth or interpretation of claims allowed in patents in the United States, the United Kingdom, the European Union, Australia or elsewhere. In addition, the specific content of patents and patent applications that are necessary to support and interpret patent claims is highly uncertain due to the complex nature of the relevant legal, scientific and factual issues. Changes in either patent laws or in interpretations of patent laws in the United States, the United Kingdom, the European Union, Australia or elsewhere may diminish the value of our intellectual property or narrow the scope of our patent protection.
Seasonality
We do not expect sales of our products and services to be materially impacted by seasonality.
The practices of the registrant and the industry (respective industries) relating to working capital items.
The nature of the Company’s business requires it to maintain sufficient levels of inventory to meet contractually agreed delivery requirements of customers. The Company provides its customers with payment terms prevalent in the industry.
Dependence on single customer
We continue to receive a significant portion of our revenue from LifeScan. All revenue from products was recognized in connection with the manufacture of the test strips for Siemens’ Xprecia StrideTM Coagulation Analyzer.
8
Table of Contents
| Years Ended December 31, | ||||||||||||
| 2016 | 2015 | 2014 | ||||||||||
| A$ | A$ | A$ | ||||||||||
| Revenue from products |
584,550 | 1,323,564 | 215,486 | |||||||||
| Revenue from services |
18,246,267 | 15,451,414 | 9,314,198 | |||||||||
| Research and development tax incentive income |
7,562,172 | 9,224,349 | 9,935,083 | |||||||||
| Interest income |
201,096 | 242,574 | 260,904 | |||||||||
|
|
|
|
|
|
|
|||||||
| Total income |
26,594,085 | 26,241,901 | 19,725,671 | |||||||||
|
|
|
|
|
|
|
|||||||
| % of total income derived from - LifeScan |
68 | % | 49 | % | 34 | % | ||||||
|
- Siemens |
3 | % | 15 | % | 14 | % | ||||||
|
- Other |
29 | % | 36 | % | 52 | % | ||||||
Revenue from services is primarily represented by the receipt of the quarterly service fees from LifeScan. Our dependence on the quarterly service fees from LifeScan for a significant proportion of our revenue is likely to continue until we start to receive meaningful revenues from Siemens relating to the Xprecia StrideTM Coagulation Analyzer and other partnering and collaborative arrangements or strategic alliances with third parties and from the sale of our own products.
We did not have any significant backlog orders as of December 31, 2016 and 2015.
Competitive conditions of our business
Despite the Xprecia StrideTM Coagulation Analyzer being available in Europe, the Middle East, Africa, Asia Pacific, Latin America and Canada, our revenue is currently highly dependent on the success of the OneTouch Verio® blood glucose product we have developed with LifeScan. OneTouch Verio® was first launched in the Netherlands in January 2010 by LifeScan and has subsequently been launched in countries that represent over 90% of the world self-monitoring blood glucose market including North America, major European markets and Australia. LifeScan is responsible for all sales and marketing decisions and any decision to introduce the product to new territories and the timing of those decisions.
The global diabetes market place is intensely competitive and dominated by multinationals such as LifeScan, Roche, Abbott and Panasonic Healthcare. Changes to reimbursement of blood glucose monitoring supplies in the US market have further intensified pricing competition and margin pressures. In addition, in 2013, the International Standards Organization released new guidelines that increase the accuracy and performance requirements for blood glucose monitoring systems. Although OneTouch Verio® has been well received in the jurisdictions in which it has been launched, LifeScan controls the commercialization of the OneTouch Verio® product and we do not know whether customers will prefer it over competitive offerings, nor the rate at which it might continue to be adopted.
Siemens is responsible for all sales and marketing decisions with respect to the products we develop for them and for any decision to introduce the products to new territories and the timing of those decisions. In December 2014, Siemens received the CE mark approval for sale of the Xprecia StrideTM Coagulation Analyzer in Europe and initiated the European limited release of its first point-of-care coagulation testing device. On October 4, 2016, Siemens received regulatory clearance from the US FDA to sell the Xprecia Stride™ Coagulation Analyzer in the US.
The worldwide point-of-care coagulation testing market was estimated at around US$1.0 billion in 2014 and is forecast to grow by around 10% per annum to US$1.4 billion by 2018. The coagulation testing market is dominated by PT-INR testing, which represents around 70% of this market. Roche is currently the largest player in the point-of-care professional PT-INR testing market. Roche has a well established brand recognition, sales and marketing force, and has significant resources available to support its product.
Core to our business strategy is the extension of our intellectual property platform to enable other tests currently done in the central laboratory to be migrated to the point-of-care settings. Our belief is that much testing done in the central lab can more efficiently and profitably be performed at the point-of-care. With the exception of blood glucose testing, most point-of-care testing is currently conducted in professional settings. The healthcare professional has a choice and can request tests from a central laboratory, or services provider, or choose to have the test performed at the point-of-care. Thus we face competition not just from other companies active in the point-of-care space, but also the providers of testing who operate in centralized settings.
9
Table of Contents
Our research and development expenditure during the last three fiscal years were as follows:
| Years Ended December 31, | ||||||||||||
| 2016 | 2015 | 2014 | ||||||||||
| A$ | A$ | A$ | ||||||||||
| Research and development expenses |
14,987,462 | 19,120,842 | 16,616,051 | |||||||||
| Research and development tax incentive income |
(7,562,172 | ) | (9,224,349 | ) | (9,935,083 | ) | ||||||
|
|
|
|
|
|
|
|||||||
| 7,425,290 | 9,896,493 | 6,680,968 | ||||||||||
|
|
|
|
|
|
|
|||||||
We undertake our own research and development and on behalf of our customers and partners. Research and development activities undertaken on behalf of our customers and partners were A$7,125,162, A$9,014,377 and A$9,971,035 for the fiscal years ended 2016, 2015 and 2014, respectively.
Employees
At March 14, 2017, we had 83 full time employees in our facilities, spanning production, engineering, operations, quality and regulatory, research and development and administration.
Financial information about geographic areas
We operate in one segment. Our principal activities are research and development, commercial manufacture of approved medical or testing devices and the provision of services including contract research work. We operate predominantly in one geographical area, being Australia. Our total revenue as disclosed below is attributed to countries based on location of customer. Location has been determined generally based on contractual arrangements.
| Years Ended December 31, | ||||||||||||
| 2016 | 2015 | 2014 | ||||||||||
| A$ | A$ | A$ | ||||||||||
| Home country - Australia |
7,763,268 | 9,466,923 | 10,323,745 | |||||||||
|
|
|
|
|
|
|
|||||||
| Foreign countries |
||||||||||||
| - U.S.A. |
258,069 | 2,594,570 | 2,482,288 | |||||||||
| - Germany |
584,550 | 1,323,564 | 215,486 | |||||||||
| - Switzerland |
17,988,198 | 12,856,844 | 6,704,152 | |||||||||
|
|
|
|
|
|
|
|||||||
| Total - foreign countries |
18,830,817 | 16,774,978 | 9,401,926 | |||||||||
|
|
|
|
|
|
|
|||||||
| Total income |
26,594,085 | 26,241,901 | 19,725,671 | |||||||||
|
|
|
|
|
|
|
|||||||
Our material long-lived assets are all based in Australia.
Available Information
We file annual and quarterly reports, proxy statements and other information with the Securities and Exchange Commission (the “SEC”), copies of which are available on ASX. Stockholders may read and copy any reports, proxy and information statements or other information that we file at the SEC’s Public Reference Room at 100 F. Street, NE, Washington, D.C 20549. Please call the SEC at 1-800-SEC-0330 for further information about the public reference rooms. Our public filings (including our Annual Report on Form 10-K and proxy statement) are also available from commercial document retrieval services and at the website maintained by us at http://universalbiosensors.com and the SEC at http://www.sec.gov.
We provide without charge to each person solicited by the Proxy Statement a copy of our Annual Report on Form 10-K, including our financial statements but excluding the exhibits to Form 10-K other than Exhibit 13. The Annual Report includes a list of the exhibits that were filed with the Form 10-K, and we will furnish a copy of any such exhibit to any person who requests it upon the payment of our reasonable expenses in providing the requested exhibit. For further information, please contact our Company Secretary, Cameron Billingsley at +61 2 8115 9801 or write us at 1 Corporate Avenue, Rowville VIC 3178 Australia. You may also send an email to us at companysecretary@universalbiosensors.com.
10
Table of Contents
Investing in our shares or CDIs involves a high degree of risk. Before you invest in our shares or CDIs, you should understand the high degree of risk involved. You should carefully consider the following risks and other information in this Form 10-K, including our financial statements and related notes appearing elsewhere in this Form 10-K, before you decide to invest in our shares or CDIs. If any of the events described below actually occurs, our business, financial condition and operating results could be harmed. In such an event, the market price of our CDIs would likely decline and you could lose part or all of your investment.
Our products may not be successful in the marketplace.
Our success and the success of products that we are involved in developing is ultimately dependent on the level of market acceptance and sales of those products. Market acceptance will depend on, amongst other things, the ability to provide and maintain evidence of safety, efficacy and cost effectiveness of the products, the advantages and profile over competing products, the level of support from clinicians, the relative convenience and ease of use, cost-effectiveness compared to other products, the availability of reimbursement from national health authorities, the timing of market introduction and the success of marketing and sales efforts by our customers and partners. Additionally, it is difficult to determine the market opportunity for new technologies and our estimates may not accurately reflect the actual demand in the target markets.
Our commercial opportunity will be reduced or eliminated if the size of the market opportunity is less than we expect or if our competitors develop and commercialize products that are safer, more effective, more convenient, less expensive, or reach markets sooner or are marketed better than products that we are involved in developing.
The blood glucose test strips for the OneTouch Verio® product which we developed with LifeScan were first launched in the Netherlands in January 2010 and are now available in much of the world’s self-monitored blood glucose market including North America, major European markets and Australia. While market acceptance for OneTouch Verio® has been positive to date, there is no guarantee that the product will secure and maintain adequate market share in a timely fashion.
The coagulation test strips for the Xprecia StrideTM Coagulation Analyzer which we developed with Siemens were first released in Europe in December 2014. This product represents Siemens’ first entry into this point-of-care coagulation testing market and as such, there is no track record of market acceptance for the product. As such, there can be no guarantee this product will gain market share in a timely fashion (or at all) from the market’s largest player, Roche. Roche has a well established brand recognition, sales and marketing forces, and has significant resources available to support its product.
Likewise, we cannot be sure that any other products we are involved in developing with our customers and partners, such as the other test strip and reader products for the point-of-care coagulation markets that we are developing with Siemens or our own PT-INR test, will be successful in the marketplace or will secure and maintain adequate market share.
Our ability to be or maintain profitability in the future will be adversely affected if any of the products that we are involved in developing fail to achieve or maintain market acceptance or compete effectively in the market place. It would reduce or eliminate our revenues from product sales and/or manufacturing and have a material adverse effect on our business and financial position.
We are currently dependent on revenue from LifeScan.
UBI continues to receive revenue from coagulation test strip manufacturing on behalf of Siemens. Even though we expect this figure to grow significantly over time, the majority of our products and services revenue is currently derived from LifeScan. With effect from December 31, 2013, we no longer manufacture OneTouch Verio® blood glucose test strips for LifeScan, however, we are paid a quarterly service fee based on the number of strips sold. To date, our business has been dependent on the sales of the blood glucose test strips for the OneTouch Verio® product to partially fund our operations. Any changes in the level of test strip sales will directly affect the amount of the quarterly service fee paid by LifeScan and, as a result, our business.
LifeScan has the ability to terminate the obligation to pay quarterly service fees to us in certain situations set out in the Master Services and Supply Agreement or with the agreement of UBS.
11
Table of Contents
At any time after the end of the quarter following receipt by us of US$45 million in quarterly service fees, LifeScan has the option to give notice of conversion of the quarterly service fees. In the event notice is given, LifeScan is only required to the pay the quarterly service fees for the remainder of LifeScan’s financial year in which the notice was given. In addition, after the end of that financial year, LifeScan must pay a one-time lump sum fee. This one-time lump sum service fee is calculated by multiplying the sum of all quarterly service fees for the relevant financial year in which notice is given by a multiplier (2.2x if notice is given in 2017 or 2x if notice is given in 2018 and beyond). As of December 31, 2016, we had receipted cumulative quarterly service fees of US$31.6 million. The service fees for the quarter ending December 31, 2016 amounted to US$3.1 million and remained unpaid as at balance date. The cumulative quarterly service fees receipted and accrued as at December 31, 2016 is US$34.7 million. LifeScan may also terminate the obligation to pay quarterly service fees if certain other factors detailed in the Master Services and Supply Agreement arise, including LifeScan ceasing to sell the product, termination for breach, insolvency and bankruptcy, change of control and regulatory termination.
Although the Xprecia StrideTM Coagulation Analyzer was released in Europe in December 2014 and received regulatory clearance in October 2016 from the US FDA, the demand for the product is currently unknown. While there is no minimum commitment, if Siemens does not submit purchase orders for a certain amount of product, our manufacturing capacity may not be fully utilized. If this occurs, we will be faced with surplus capacity in our manufacturing operations and our revenues will decline. Further, Siemens may obtain the right to manufacture product or have a third party manufacture product on its behalf if certain events occur (for example, insolvency, failure to supply). The Supply Agreement with Siemens may also be terminated as a result of either party defaulting on its material obligations. If any of these circumstances arise, we would cease to have the potential to receive manufacturing revenues from the sale of product purchased by Siemens.
An important part of our strategy is to seek to enter into other collaborative arrangements or strategic alliances with respect to the development and commercialization of specific tests or in specific fields. Our dependence on LifeScan for a significant proportion of our revenue is likely to continue until we start to receive meaningful revenues from other collaborative arrangements or strategic alliances with third parties, such as our arrangement with Siemens, and/or until we receive meaningful revenues from our own products which we intend to commercialize through distributors.
Our current and future customers and partners may choose to utilize less of our research and development services. If the development and research work we undertake was materially reduced or ceased, we would lose an ongoing source of income which would have a material adverse effect on our business and financial position.
Our Credit Agreement has financial and non-financial covenants, and default of any covenant could materially adversely impact us.
On December 19, 2013 UBI and UBS entered into a credit agreement with Athyrium Opportunities Fund (A) LP, as administrative agent (the “Administrative Agent”) and as a lender, and Athyrium Opportunities Fund (B) LP as a lender (Athyrium A and Athyrium B together with any other lenders party thereto from time to time, the “Lenders”), which was amended on January 30, 2015, for a secured term loan of up to US$25,000,000 (the “Credit Agreement”). A first tranche loan of US$15,000,000 was drawn on December 2013 and a further two tranches each of US$5,000,000 were able to be drawn within 30 days of any fiscal quarter ending on or before July 31, 2015 in which UBS satisfied certain conditions. Even though these commercial conditions were satisfied, UBI elected not to draw down the additional US$10,000,000. Unless the facility is otherwise terminated earlier pursuant to the terms of the Credit Agreement, UBS is required to repay the outstanding principal amount of the loans drawn down, together with all accrued and unpaid interest thereon and all other obligations on December 19, 2018 (the “Maturity Date”). The Credit Agreement is secured by substantially all of the assets of UBS and UBI, including the stock in UBS held by UBI. The obligations of UBS under the Credit Agreement are guaranteed by UBI.
UBS’ ability to maintain compliance with the covenants in our Credit Agreement is dependent upon, among other things, our ability to continue to execute our business plans and our ability to generate cash from operations. The debt facility is subject to certain specified events of default, defaults relating to non-payment, breach of covenants or inaccuracy of representations and warranties, cross-defaults to other indebtedness, bankruptcy and insolvency defaults, material judgment defaults, regulatory defaults, the occurrence of a material adverse effect, or un-remedied material breach by UBS or UBI or termination of a key contract. The occurrence of an event of default could result in the amounts owing under the Credit Agreement, including all unpaid principal and interest being due and payable, and could result in the administrative agent enforcing its security over the assets of UBS and UBI. If the loans are accelerated or commitments terminated, we could face substantial liquidity problems and may be forced to dispose of material assets or operations, seek to obtain equity capital, or restructure or refinance our indebtedness. Such alternative measures
12
Table of Contents
may not be available or successful. Also, our debt covenants may limit our ability to dispose of material assets or operations or to restructure or refinance our indebtedness. Even if we are able to restructure or refinance our indebtedness, the economic terms may not be favorable to us. In addition, an event of default under our key commercial contracts could result in a cross-default under our Credit Agreement. All of the foregoing could have serious consequences to our financial condition and results of operations and could cause us to become bankrupt or insolvent.
Deviations from expected results of operations and/or expected cash requirements could result in a default under our Credit Agreement and/or adversely affect our financial condition and results of operations.
Our principal sources of liquidity are cash flows from operations, cash and cash equivalents and our existing debt facility. Our operating activities generally provide a proportion of cash to fund our working capital requirements and, together with borrowings under our debt facility, are expected to be sufficient to fund our operating needs and capital requirements for at least the next twelve months, based on current assumptions regarding the amount and timing of such expenditures and anticipated cash flows. Although we currently expect to remain in compliance with the Credit Agreement, based on our current expectations, any significant deviation in actual results from our expected results of operations, any significant deviation in the amounts or timing of material expenditures from current estimates, the termination of any of our key commercial contracts with LifeScan or Siemens, or other significant unanticipated expenses could result in a default under our Credit Agreement, have a material adverse effect on our financial condition and/or may result in the need for additional debt or equity financing.
Our debt covenants may affect our liquidity or limit our ability to complete acquisitions, incur debt, make investments, sell assets, merge or complete other significant transactions.
The Credit Agreement includes provisions that place limitations on a number of our activities, including but not limited to our ability to: incur additional debt; create liens on our assets or make guarantees; make certain investments or loans; pay dividends; dispose of or sell assets; or enter into acquisitions, mergers or similar transactions, without the consent of the Lenders. These consent requirements could restrict our ability to pursue opportunities to expand our business operations. We are required to maintain unrestricted cash of US$2,000,000 in a specified bank account at all times.
Our business strategy and revenue relies on our ability to enter collaborative arrangements with other companies and there is a risk that we will not be able to enter into collaborative arrangements with respect to our products.
Our business strategy involves demonstrating the broader application of our technology platform for a number of different products/technologies and then entering into collaborative arrangements, licensing agreements, strategic alliances or distribution arrangements for these products/technologies. We have not established any internal product sales and marketing capacity and to achieve commercial success we must enter into and maintain successful arrangements with others to sell, market and distribute products that we are involved in developing. We may not be able to enter into such collaborative arrangements, strategic alliances or distributions arrangements in a timely fashion and on acceptable terms, if at all. Our inability to enter such arrangements would be detrimental to our strategy, business and financial position. Our ability to enter into collaborative, strategic or distribution arrangements will suffer if the technologies developed by us are not perceived as being comparable or superior to established laboratory methods or other products.
If we are unable to enter collaborative or distribution arrangements with respect to certain of our products/technologies, we may have to change strategy, delay, reduce the scope of or eliminate some or all of our development programs or liquidate some or all of our assets or seek to raise additional capital. As a result, we may not be able to pursue what we consider to be worthwhile commercial opportunities and significant monies and management time invested may be rendered unproductive and worthless. Our inability to enter collaborative or strategic arrangements would thus have a material adverse effect on our business and financial position.
Entering collaborative arrangements with respect to our products will expose us to risks and uncertainties related to those collaborations and alliances.
To the extent we are able to enter into collaborative or strategic arrangements with respect to our products, we will be exposed to risks and uncertainties related to those arrangements. The customer or partner will generally make the key decisions on product choice, regulatory approvals, product launch, product manufacture and marketing and promotion. Decisions made by our partner with
13
Table of Contents
respect to the commercialization of the products we develop with them will significantly affect the extent and timing of revenues to us. For example, our partner may choose not to launch new products we develop, may choose to launch the products in a limited number of jurisdictions, may delay the launch of products, may undertake only limited sales and marketing efforts to commercialize the products, all of which would have a material adverse effect on our business and financial position. Collaborative arrangements, licensing agreements or strategic alliances will subject us to a number of risks, including the risk that:
| • | we do not control the amount and timing of resources that our strategic partners may devote to our products; |
| • | we do not control the decision to pursue a product, the timing of product launches and extent of marketing and sales activities; |
| • | our customer or partners may experience financial difficulties; |
| • | we may be required to relinquish important rights such as marketing and distribution rights; |
| • | business combinations or significant changes in a partner’s business strategy may also adversely affect a collaborator’s willingness or ability to complete its obligations under any arrangement; |
| • | a collaborator could independently move forward with a competing product developed either independently or in collaboration with others, including our competitors; and |
| • | collaborative arrangements are often terminated or allowed to expire, which would delay the development and may increase the cost of developing our products. |
Likewise, distribution arrangements will also expose us to a number of additional comparable risks, including that the distributor may not perform as required.
Allegedly defective design or the manufacture of allegedly defective products could potentially expose us to substantial costs, write-offs and reputational damage.
Allegedly defective designs or manufacture of allegedly defective products exposes us to the risk of product liability claims and product recalls. Any such claims have the potential to result in substantial costs, write-offs and potential delays in our shipment of product to customers, decreased demand for products and services, loss of revenue and cash flow, reputational damage, costs of related litigation, increases in our insurance premiums and increased scrutiny by regulatory agencies, claims by our customers and may trigger the dissolution of partnerships or collaborative relationships. The occurrence of certain of these events may trigger an event of default under our Credit Agreement. While we will seek to mitigate our loss by obtaining appropriate insurances and appropriate contractual protections, if we are unable to maintain our insurance at an acceptable cost or on acceptable terms with adequate coverage, or negotiate appropriate contractual protections or otherwise protect against potential product liability claims, we will be exposed to significant liabilities. Recalls would harm our business and compromise the performance of our obligations to our customers and would have a material adverse effect on our business and financial results and may result in claims by our customers or partners and may trigger the dissolution of partnerships or collaborative relationships. Any claim for damages by our customers or other claim against us could be substantial.
There are many elements to manufacturing products that can cause variability beyond acceptable limits. We may be required to discard defective products after we have incurred significant material and labor costs, resulting in manufacturing delays and delayed shipment to customers. Further, if our suppliers are unable to provide materials in conformance with specifications, we may be required to discard materials, which may also cause delays in the manufacture and shipment of products.
Reduced margins would have a material adverse effect on our business and financial position.
Our margins may be reduced and costs increased which would have a material adverse effect on our business and financial position. The primary factors that pose this risk include selling prices, increased manufacturing costs or currency fluctuations.
Increases in our costs to manufacturing products or conducting development work may decrease our margins or cause us to suffer a loss on the manufactured products. Additionally, we may suffer decreased margins due to the global reach of our business exposing us to market risk from changes in foreign currency exchange rates. The majority of our cash reserves are in US dollars and expenses are in Australian dollars, and we are exposed to foreign exchange exposure particularly when we have to convert our US dollar cash reserves into Australian dollars to fund our operations. Additionally, we use, from time to time, financial instruments, primarily foreign currency forward contracts to hedge certain forecasted foreign currency commitments arising from trade accounts receivables, trade accounts payable and fixed purchase obligations. These hedging activities are largely dependent upon the accuracy of our
14
Table of Contents
forecasts and as such, our foreign currency forward contracts may not cover our full exposure to exchange rate fluctuations. Although we believe our foreign exchange policies are reasonable and prudent under the circumstances, we may experience losses from un-hedged currency fluctuations, which could be significant. If our costs increase or our margins decrease, it would have an adverse effect on our business and financial position.
New product design and development and clinical testing is costly, labor intensive and the outcomes uncertain.
The design and development of different tests on our platform takes a number of years to complete, is costly and the outcomes are uncertain. Although development risk generally reduces the further a test is developed, the tests we develop have a significant degree of technical risk, and irrespective of the stage of development, design and development work and product validation, the development of the test may be unsuccessful or not warrant product commercialization. If development activities are unsuccessful, we may need to delay, reduce the scope of or eliminate some or all of our development programs and significant monies and management time invested may be rendered unproductive and worthless.
Our agreements with our product development and manufacturing customers to date have contained milestone based payments, many of which are payable upon the achievement of technical development milestones. Such milestone payments may not cover the cost of our research and development activities. In the event we are not successful in achieving the relevant development milestone, we will not receive the milestone payments associated with the milestone which would have an adverse effect on our revenue and financial position. Failure to achieve certain development milestones may have an impact on our covenants under the Credit Agreement. Furthermore, if we are unable to develop a product for a customer, it may eliminate an important revenue stream for us which may result in us not being profitable, or trigger dissolution of partnerships or collaborative relationships.
Diagnostic devices must be tested for safety and performance in laboratory and clinical trials before regulatory clearance for marketing is achieved. Such studies are costly, time consuming and unpredictable. Clinical trials may not be successful and marketing authorization may not be granted which may result in us not being profitable, or trigger dissolution of partnerships or collaborative relationships. The outcome of early clinical trials may not be predictive of the success of later clinical trials. Failed clinical trials may result in considerable investments of time and money being rendered unproductive and worthless.
Additionally, unanticipated trial costs or delays could cause substantial additional expenditure that is not reimbursed by a partner, cause us to miss milestones which trigger a financial payment or cause us or a partner to delay or modify our plans significantly. This would harm our business, financial condition and results of operations.
If we cannot maintain our intellectual property rights, our ability to make or develop point-of-care tests would be restricted or eliminated, and the value of our technology and diagnostic tests may be adversely affected.
Our ability to obtain proprietary rights, maintain trade secret protection and operate without infringing the proprietary rights of third parties is an integral part of our business.
A number of companies, universities and research institutions have or may be granted patents that cover technologies that we need to complete development of a particular product. We may choose or be required to seek licenses under third party patents which would be costly, may not be available on commercially acceptable terms, or at all. Further, we may be unaware of other third party patents or proprietary rights that are infringed by our point-of-care tests.
Much of our platform intellectual property rights are licensed to us from LifeScan. If we were to breach the License Agreement and LifeScan were to validly terminate the agreement in response, it would seriously restrict or eliminate our ability to develop and commercialize our existing and future tests which would have a material adverse effect on us as it would restrict or eliminate our existing commercialization opportunities. We also license other intellectual property from third parties as part of our other development efforts.
LifeScan and our other licensors have a considerable degree of control over the manner that the intellectual property licensed to us is maintained and protected and, as a result, we have reduced control with respect to the maintenance and protection of our licensed patent portfolio. LifeScan is responsible for the prosecution and maintenance of the intellectual property it licenses to us and we are largely dependent on them to defend proceedings or prosecute infringers. The same applies to our other licensors. Our business would be harmed if the licensed patents were infringed or misappropriated. Prosecuting third parties and defending ourselves against third-party claims would be costly, time consuming and divert management’s attention from our business, potentially leading to delays in our development or commercialization efforts. Additionally, if third parties made successful claims, we may be liable for substantial damages or license fees, be required to stop marketing the infringing product or take other actions that are adverse to our business.
15
Table of Contents
Risks associated with regulatory clearance and changes to regulation.
The products we are involved in developing are medical devices and therefore subject to extensive regulation in all major markets. The process of obtaining regulatory clearance is costly and time consuming and there can be no assurance that the required regulatory clearances will be obtained. Products cannot be commercially sold without regulatory clearance. We and our customers and partners may be unable to obtain the necessary clearances to sell or if the clearances are delayed, revoked or subject to unacceptable conditions, the product may not be able to be commercialized which would have a material adverse effect on us.
If we were required and able to change suppliers and third party contract manufacturers, applicable regulatory bodies may require new testing and compliance inspections and require that we demonstrate structural and functional comparability between the same products manufactured by different organizations, resulting in additional costs and potential delays which could be detrimental to our business.
Furthermore, regulation is ongoing and manufacturers and marketers of products are subject to continuous review and periodic inspections. Potentially costly responses may be required to be given by us and our customers including product modification, or post-marketing clinical trials as a condition of approval to further substantiate safety and efficacy or investigate issues of interest. If we or our customers fail to comply with applicable regulatory requirements it may result in fines, delays, suspensions of clearances, seizures, recalls of products, operating restrictions or criminal prosecutions and could have a material adverse effect on our operations. Any such regulatory action may also constitute an event of default under our Credit Agreement. Additionally, changes in existing regulations or the adoption of new regulations could make regulatory compliance by us more difficult in future and could hamper our ability to produce our products when we require.
Risks associated with suppliers.
Similar to most major manufacturers in our industry, we are dependent upon our suppliers for certain raw materials and components. We have preferred suppliers, making us vulnerable to supply disruption, which could harm our business and delay manufacturing operations. We seek to enter into long term contractual arrangements with certain of our suppliers, however we may not always be able to do so on acceptable terms. If our manufacturing requirements change, such long term contractual arrangements may cause us to have excess or obsolete inventory. We may not be able to guarantee the supply of certain of our materials which may in turn affect our ability to supply product to our customers. We may have difficulty locating alternative suppliers in a timely manner or on commercially acceptable terms, and switching components may require product redesign and further regulatory clearance which could significantly delay production. Likewise, our customers and partners are subject to supply risks which may delay their ability to supply customers with product which would impact our revenue and have a consequential adverse effect on our business and results of operations.
To the extent we agree to be responsible for manufacturing meters for any of our customers and partners, we anticipate that we will outsource the manufacture of these meters. There is no guarantee that we will be able to enter into any such arrangement on acceptable terms, if at all, and as a result there is a risk of lengthy and costly delays of bringing our products to market. Further, if our contract manufacturers fail to achieve and maintain required production yields or manufacturing standards, it could result in product withdrawals, delays, recalls, product liability claims and other problems that could seriously harm our business. Any meter shortages or manufacturing delays could result in delays or reduction in our revenues, with consequential adverse effect on our business and results of operations.
We face risks manufacturing product or providing services.
There are technical challenges to establishing and maintaining commercial manufacturing for products, including maintaining the consistency of our incoming raw materials, equipment design and automation, material procurement, production yields and quality control and assurance. We may fail to achieve and maintain required production yields or manufacturing standards which could result in financial loss, patient injury or death, product recalls or withdrawals, product shortages, delays or failures in product testing or delivery, breach of our agreements with any partner and other problems that could seriously harm our business.
16
Table of Contents
The success of our business is heavily dependent upon market factors such as growth of the point-of-care testing market and our ability to compete effectively within the highly competitive in vitro diagnostics market.
Our business success relies on the growth of both the existing and emerging point-of-care testing market. We cannot be sure that this market will grow as we anticipate. Such growth will require continued support and demand from payers, patients and healthcare professionals and the endorsement by professional bodies that influence the practice of medicine. Research and clinical data may not sufficiently support point-of-care testing, nor may the health economic benefits sufficiently support point-of-care testing as an alternative to current practice. Even if the data is compelling, significant resources may be required to educate users and change in practice may be slower and more costly than we anticipate. If point-of-care testing fails to be adopted at the rate we expect, the sector may remain unattractive to the size of partner we seek to attract and as a consequence, we may need to change our business model. This may require us to incur more cost and/or our anticipated growth will be adversely affected and our results will suffer.
We may face intense competition in development, marketing and selling point-of-care tests.
The market for in vitro diagnostics is intensely competitive, price sensitive and subject to rapid change. We and our customers and partners may be unable to accurately anticipate changes in the markets and the direction of technological innovation and the demands of end users, competitors may develop improved technologies and the market place may conclude that our products are obsolete. Our larger competitors enjoy several competitive advantages including significantly greater financial resources, greater brand recognition, greater expertise in conducting clinical trials, obtaining regulatory approvals and managing manufacturing operations, and greater experience in product sales and marketing. Early-stage companies may also prove to be significant competitors.
Competition will be faced from existing products as well as products in development. Point-of-care tests are likely to experience significant and continuing competition from traditional pathology laboratory based testing as well as other point-of-care tests. Our and our customers’ and partners’ commercial opportunity will be reduced or eliminated if competitors develop and commercialize safer, more effective, more convenient, or cheaper products, or reach the market sooner than we do. Any such developments adversely affecting the market for products developed by us may force us and our partners to reduce production or discontinue manufacturing which would cause our operating results to suffer. There can be no assurances given with respect to our or any partner’s ability to compete effectively in the competitive markets in which we operate.
Adverse economic conditions may harm our business.
Market and economic conditions have been challenging worldwide. Continuing concerns have led to increased market volatility and diminished expectations for world economies. These factors may include fluctuations in foreign exchange rates, inflation, interest rates, rate of economic growth, taxation laws, consumer spending, unemployment rates, government fiscal, monetary and regulatory policies and consumer and business sentiment. Any of these factors have the potential to cause costs to increase or revenues to decline. Continued turbulence in the US, Australian and other international markets and economies may adversely affect our ability to enter into collaborative arrangements, the behavior and financial condition of our current and any future customers and partners and the spending patterns of users of the products we are developing. This may adversely impact demand for our services and for products developed by us. In addition, economic conditions could also impact our suppliers, which may impact on their ability to provide us with materials and components which in turn may negatively impact our business.
Our operations may not be profitable.
Whilst we have made a small profit for the 2016 financial year, our operations may not be profitable in future. To date, we have funded our operations and capital expenditures from revenue from the sale of products and provision of services and with proceeds from the sale of our securities, government grants and rebates including the research and development tax incentive income and interest on investments. On December 19, 2013 we entered into the Credit Agreement which has provided debt financing for our business. We may, however, require additional capital to fund our business operations, which may not be available on acceptable commercial terms, or at all.
17
Table of Contents
We may not be able to raise capital or secure credit if and when required.
We may not be able to raise capital or secure further credit if and when required. If we are unable to raise capital or secure further credit when required, we may have to delay, reduce the scope of or eliminate some or all of our development programs or commercialization efforts or liquidate some or all of our assets.
We rely on government grants and rebates.
Our principal sources of liquidity are cash flows from operations (revenue from services and product sales) and our existing debt facility. We have also financed our business operations through government grants and rebates, including the tax incentive income. The research and development tax incentive is one of the key elements of the Australian Government’s support for Australia’s innovation system and if eligible, provides the recipient with a tax offset for research and development activities. For the year ended December 31, 2016 we recorded research and development tax incentive income receivable of $7.4 million. There have been recent proposals to change the structure of the innovation and research and development funding landscape in Australia which may or may not impact the research and development tax incentive income receivable for the 2016 financial year. For the 2017 financial year we are unlikely to qualify for the 45% refundable research and development tax offset. Under existing legislation, we will however qualify for the 40% non-refundable research and development tax offset. There can be no assurance that we will continue to qualify and be eligible for such incentives or that the Australian Government will continue to provide incentives, offsets, grants and rebates on similar terms or at all.
The loss of a key employee or the inability to recruit and retain high caliber staff to manage future anticipated growth could have a material adverse effect on our business.
As with most growth companies, our future success is substantially dependent on our key personnel. Certain key personnel would be difficult to replace and the loss of any such key personnel may adversely impact the achievement of our objectives. Our ability to operate successfully and manage the business depends significantly on attracting and retaining additional highly qualified personnel. The loss of any key personnel may be disruptive or have a material adverse effect on the future of our business. The competition for qualified employees in scientific research and medical diagnostic and laboratory industries is particularly intense and there are a limited number of persons with the necessary skills and experience.
Our primary development and manufacturing operations are conducted at a single location. Any disruption at our facility could adversely affect our operations and increase our expenses.
Our primary operations are conducted at our Corporate Avenue facility in Melbourne, Australia. We take precautions to safeguard our facilities, including security, health and safety protocols and maintain applicable insurance. However, we may be impacted by industrial action or operating equipment and facilities may not operate as intended or be unavailable as a result of unanticipated failures or other events outside of our control such as a natural disaster, fire, flood or earthquake or catastrophic breakdowns or deliberate acts of destruction. The occurrence of any of these events may restrict our ability to supply product or our ability to provide coagulation testing and calibration services, could cause substantial delays in our operations, damage or destroy our manufacturing and laboratory equipment or inventory, and cause us to incur additional expenses. The insurance we maintain against fires, floods, earthquakes and other natural disasters may not be adequate to cover our losses in any particular case.
Investors may be subject to Australian and/or US taxation.
The receipt of dividends by Australian tax resident security holders and any subsequent disposal of our securities by any such Australian tax resident may have both United States and Australian tax consequences depending upon their individual circumstances. This may result in a security holder being subject to tax in both jurisdictions and a tax credit may or may not be available in one jurisdiction to offset the tax paid in the other jurisdiction depending upon the security holder’s individual circumstances.
The price of our shares is highly volatile and could decline significantly.
Our shares of common stock in the form of CDIs were quoted on the ASX and began trading on December 13, 2006. The price of our shares is highly volatile and could decline significantly. The market price of our shares historically has been, and we expect will continue to be, subject to significant fluctuations over short periods of time. Some of the factors that may cause the market price of our common stock to fluctuate include:
| • | the entry into, or termination of, key agreements, including collaboration and supply agreements and licensing agreements; |
18
Table of Contents
| • | any inability to obtain additional financing on favorable terms to fund our operations and pursue our business plan if additional financing becomes necessary; |
| • | future sales of our common stock or debt or convertible debt securities or other capital-raising activities, and the terms of those issuances of securities; |
| • | future revenue streams from product sales, if any, by our collaborative partners, and the extent of demand for, and sales of, our products; |
| • | the initiation of material developments in, or conclusion of litigation to enforce or defend any of our intellectual property rights or otherwise; |
| • | our results of operations and financial condition, including our cash reserves, cash burn and cost level; |
| • | general and industry-specific economic and regulatory conditions that may affect our ability to successfully develop and commercialize products; |
| • | the loss of key employees; |
| • | the introduction of technological innovations or other products by our competitors; |
| • | sales of a substantial number of CDIs by our large stockholders; |
| • | changes in estimates or recommendations by securities analysts, if any, who cover our common stock; |
| • | issuance of shares by us, and sales in the public market of the shares issued, upon exercise of our outstanding warrants; and |
| • | period-to-period fluctuations in our financial results. |
For example, from the initial quotation of our shares in the form of CDIs on the Australian Securities Exchange on December 13, 2006 until March 14, 2017, the closing price per share of our shares ranged from a low of A$0.14 during May 2014 to a high of A$2.02 during the first quarter of the 2010 fiscal year and was A$0.39 on March 14, 2017. We may experience a material decline in the market price of our CDIs, regardless of our operating performance and therefore, a holder of our shares may not be able to sell those shares at or above the price paid by such holder for such shares. Sales by our larger shareholders may create volatility or impact how the value of our shares is perceived.
Class action litigation has been brought in the past against companies which have experienced volatility in the market price of their securities. We may become involved in this type of litigation in the future. Litigation of this type is often extremely expensive and diverts management’s attention and our resources.
Our securities are not currently traded on any United States public markets and there are currently restrictions on the ability of United States persons to acquire our securities on the ASX.
There is no public market for our shares in the United States or in any other jurisdiction other than Australia. We have not determined whether we will seek the quotation of our shares on any United States public trading market. Even if our shares are in the future listed on a United States public market, the liquidity of our shares may not improve, and the United States market price may not accurately reflect the price or prices at which purchasers or sellers would be willing to purchase or sell our common stock.
In addition, our securities are “restricted securities” as that term is defined in Rule 144 under the United States Securities Act of 1933, as amended (“Securities Act”). Restricted securities may be resold to U.S. persons as defined in Regulation S only if registered for resale or pursuant to an exemption from registration under the Securities Act. We have not agreed to register any of our common stock for resale by security holders.
We may be involved in litigation.
There has been substantial litigation and other proceedings in the medical diagnostic industries. Defending against litigation and other third party claims would be costly and time consuming and would divert management’s attention from our business, which could lead to delays in our development or commercialization efforts. If third parties are successful in their claims, we might have to pay substantial damages or take other actions that are adverse to our business.
19
Table of Contents
Changes in laws may adversely affect our business.
Our business and the business of our customers and partners are subject to the laws and regulations in a number of jurisdictions. Unforeseen changes in laws and government policy both in Australia, the EU, the US and elsewhere, could materially impact our’ operations, assets, contracts and profitability.
We are exposed to risks relating to evaluations of controls required by Section 404 of the Sarbanes-Oxley Act.
Changing laws, regulations and standards relating to corporate governance and public disclosure, including the Sarbanes-Oxley Act of 2002 (“Sarbanes-Oxley Act”) and related regulations implemented by the SEC, have substantially increased legal and financial compliance costs. We expect that our ongoing compliance with applicable laws and regulations, including the Securities Exchange Act of 1934 as amended (“Exchange Act”) and the Sarbanes-Oxley Act, will involve significant and potentially increasing costs. In particular, we must annually evaluate our internal controls systems to allow management to report on our internal controls. We must perform the system and process evaluation and testing (and any necessary remediation) required to comply with the management certification and, when applicable, auditor attestation requirements of Section 404 of the Sarbanes-Oxley Act. If we are not able to continue to satisfy the requirements of Section 404 adequately, we may be subject to sanctions or investigation by regulatory authorities, including the SEC. Any action of this type could adversely affect our financial results, investors’ confidence in our company and our ability to access capital markets, and could cause our stock price to decline.
A significant amount of our shares are controlled by individuals or voting blocks, and the interests of such individuals or voting blocks could conflict with those of the other stockholders.
Single stockholders with significant holdings or relatively small groups of stockholders have the power to influence matters requiring the approval of stockholders. Viburnum Funds Pty Ltd, as investment manager for its associated funds and entities holds a beneficial interest and voting power over approximately 15.51% of our shares. For details of our substantial stockholders and the interests of our directors, refer to “Item 12 — Security Ownership of Certain Beneficial Owners and Management and Related Stockholder Matters”.
We have never paid a dividend and we do not intend to pay dividends in the foreseeable future which means that holders of shares of common stock and CDIs may not receive any return on their investment from dividends.
To date, we have not declared or paid any cash dividends on our shares or CDIs and currently intend to retain any future earnings, if any, for funding growth. We do not anticipate paying any dividends in the foreseeable future.
Even if we were to declare or pay any cash dividends, we do not have any franking credits that will allow us to pass on tax paid at the company level to shareholders which can be used to reduce income tax paid on dividends by our shareholders.
Our success is reliant on the accuracy, reliability and proper use of sophisticated information processing systems and management information technology and the interruption in these systems could have a material adverse effect on our business, financial condition and results of operations.
Our success is reliant on the accuracy, reliability and proper use of sophisticated information processing systems and management information technology. Our information technology systems are designed and selected in order to facilitate the entering of order entry, customer billing, to maintain customer records, to provide product traceability, to accurately track purchases, to manage accounting, finance, administration and manufacturing, generate reports and provide customer service and technical support. Any interruption in these systems could have a material adverse effect on our business, financial condition and results of operations.
Provisions in our charter documents and under Delaware law could make the possibility of our acquisition, which may be beneficial for our stockholders, more difficult and may prevent attempts by our stockholders to replace or remove current management.
Provisions in our certificate of incorporation and our bylaws may delay or prevent an acquisition of us or a change in our management, and frustrate or prevent attempts by our stockholders to replace or remove our current management by making it more difficult to remove our current directors. Such provisions include:
| • | the division of our Board into classes whose terms expire at staggered intervals over a three year period and advance notice requirements for nominations to our Board and proposing matters that can be acted upon at shareholder meetings; |
20
Table of Contents
| • | the requirement that actions by our stockholders by written consent be unanimous; and |
| • | the ability of our Board to issue preferred stock. |
Limitation on Independent Registered Public Accounting Firm’s Liability.
The liability of PricewaterhouseCoopers (an Australian partnership which we refer to as PwC Australia), with respect to claims arising out of its audit report included in this Annual Report, is subject to the limitations set forth in the Professional Standards Act 1994 of New South Wales, Australia, as amended (the Professional Standards Act) and Chartered Accountants Australia and New Zealand (NSW) scheme adopted by Chartered Accountants Australia and New Zealand on 8 October 2014 and approved by the New South Wales Professional Standards Council pursuant to the Professional Standards Act (the NSW Accountants Scheme). For matters occurring on or prior to 7 October 2014, the liability of PwC Australia may be subject to the limitations set forth in predecessor schemes. The current NSW Accountants Scheme expires on 7 October 2019 unless further extended or replaced.
The Professional Standards Act and the NSW Accountants Scheme may limit the liability of PwC Australia for damages with respect to certain civil claims arising in, or governed by the laws of, New South Wales directly or vicariously from anything done or omitted to be done in the performance of its professional services for us, including, without limitation, its audits of our financial statements. The extent of the limitation depends on the timing of the relevant matter and is:
| • | in relation to matters occurring on or after 8 October 2013, a maximum liability for audit work of A$75 million; or |
| • | in relation to matters occurring on or prior to 7 October 2013, the lesser of (in the case of audit services) ten times the reasonable charge for the service provided and a maximum liability for audit work of A$75 million. |
The limitations do not apply to claims for breach of trust, fraud or dishonesty.
In addition, there is equivalent professional standards legislation in place in other states and territories in Australia and amendments have been made to a number of Australian federal statutes to limit liability under those statutes to the same extent as liability is limited under state and territory laws by professional standards legislation. Accordingly, liability for acts or omissions by PwC Australia in Australian states or territories other than New South Wales may be limited in a manner similar to that in New South Wales. These limitations of liability may limit recovery upon the enforcement in Australian courts of any judgement under US or other foreign laws rendered against PwC Australia based on or related to its audit report on our financial statements. Substantially all of PwC Australia’s assets are located in Australia. However, the Professional Standards Act and the NSW Accountants Scheme have not been subject to judicial consideration and therefore how the limitation might be applied by the courts and the effect of the limitation on the enforcement of foreign judgements are untested.
ITEM 1B. UNRESOLVED STAFF COMMENTS.
None.
21
Table of Contents
UBS leases approximately 5,000 square meters of office, research and development and manufacturing facilities at 1 Corporate Avenue, Rowville in Melbourne, Australia. The lease for the premises at 1 Corporate Avenue Rowville expires on March 31, 2019 with an option to renew the lease for two further terms of five years each.
We will manufacture our test strips using custom manufacturing equipment.
Depending on the number of strips required to be manufactured, it may become necessary in the future for us to acquire additional large scale equipment to satisfy manufacturing demand. If our existing facilities and equipment are fully utilized for the manufacture of test strips for one of our customers or our own products, we will need to secure additional or alternative facilities and establish additional large scale equipment sufficient to future manufacturing requirements.
HRL leases approximately 482 square meters of office and laboratory facilities at 15(H) Wing, Second Floor, 711 Concession Street, Hamilton, Ontario. The lease for 711 Concession Street expires on January 31, 2020 with 2 further options to renew each for 5 years. Either HRL or its landlord can terminate the lease early by giving 6 months’ notice.
22
Table of Contents
There are no material legal or arbitration proceedings pending against us.
23
Table of Contents
ITEM 4. MINE SAFETY DISCLOSURES
Not applicable.
24
Table of Contents
ITEM 5. MARKET FOR REGISTRANT’S COMMON EQUITY, RELATED STOCKHOLDER MATTERS
AND ISSUER PURCHASES OF EQUITY SECURITIES.
Market information
Our shares of common stock are not currently traded on any established United States public trading market. We have not determined whether we will seek the quotation of our shares of common stock on any United States public trading market. We cannot assure you that we will seek to be quoted on any United States public trading market or that we would meet any applicable listing requirements.
Our shares of common stock are traded on the ASX in the form of CHESS Depositary Interests, or CDIs, under the ASX trading code “UBI”. The Clearing House Electronic Subregister System, or “CHESS”, is an electronic system which manages the settlement of transactions executed on the ASX and facilitates the paperless transfer of legal title to ASX quoted securities. CHESS cannot be used directly for the transfer of securities of U.S. domiciled companies. CDIs are used as a method of holding and transferring the legal title of these securities on the ASX which are not able to be electronically traded in CHESS. CDIs are exchangeable, at the option of the holder, into shares of our common stock at a ratio of 1:1. The main difference between holding CDIs and holding the underlying securities (in this case our shares) is that a holder of CDIs has beneficial ownership of the equivalent number of our shares instead of legal title. Legal title is held by CHESS Depositary Nominees Pty Ltd, or CDN, and the shares are registered in the name of CDN and held by CDN on behalf of and for the benefit of the holders of CDIs. CDN is a wholly owned subsidiary of ASX.
Holders of CDIs who do not wish to have their trades settled in CDIs on the ASX may request that their CDIs be converted into shares, in which case legal title to the shares of common stock are transferred to the holder of the CDIs. Likewise, stockholders who wish to be able to trade on the ASX can do so by requesting that their shares be converted into CDIs and by lodging their applicable share certificate with our share registrar and signing a share transfer form with respect to the relevant shares. Our share registrar will then transfer the shares from the stockholder to CDN and establish a CDI holding in the name of the stockholder (now a CDI holder).
High and low sale prices of our CDIs on the ASX
The sale prices of our shares traded in the form of CDIs are quoted on the ASX in Australian dollars. Our CDIs were first quoted on the ASX on December 13, 2006. Twenty minute delayed trading prices of our CDIs are available through the ASX at www.asx.com.au.
The following tables sets forth, for the periods indicated, the highest and lowest market prices in Australian dollars for our CDIs reported on the ASX:
| High A$ | Low A$ | |||||
| Fiscal Year 2016 |
First Quarter | 0.47 | 0.31 | |||
| Second Quarter | 0.34 | 0.25 | ||||
| Third Quarter | 0.32 | 0.27 | ||||
| Fourth Quarter | 0.38 | 0.27 | ||||
| Fiscal Year 2015 |
First Quarter | 0.37 | 0.17 | |||
| Second Quarter | 0.37 | 0.22 | ||||
| Third Quarter | 0.43 | 0.30 | ||||
| Fourth Quarter | 0.49 | 0.35 | ||||
Security details
As of March 14, 2017, there were 176,386,884 shares of our common stock issued and outstanding and 18,893,669 employee options that are exercisable for an equivalent number of shares of common stock (11,941,626 of which were exercisable or exercisable within 60 days thereafter). All of our issued and outstanding shares of common stock are fully paid.
25
Table of Contents
Under applicable U.S. securities laws all of the shares of our common stock are “restricted securities” as that term is defined in Rule 144 under the Securities Act. Restricted securities may be resold to U.S. persons as defined in Regulation S only if registered or pursuant to an exemption from registration under the Securities Ac. We have not agreed to register any of our common stock for resale by security holders.
Holders
Currently, CDN holds the majority of our shares on behalf of and for the benefit of the holders of CDIs. The balance of the shares are held by certain of our employees generally as part of our restricted employee share scheme. Set out below is the aggregate number of our registered holders of CDIs and shares at the specific date below:
| Date | Total Number of Registered Holders |
Number of Holders that are United States Residents |
||||||
| At March 14, 2017 |
1,651 | 11 | ||||||
Dividends
To date, we have not declared or paid any cash dividends on our shares or CDIs and currently intend to retain any future earnings, if any, for funding growth. We do not anticipate paying any dividends in the foreseeable future.
Recent Sales of Unregistered Securities
| • | Warrants |
In connection with the Credit Agreement, we granted to the lenders warrants entitling the holders to purchase an aggregate total of 4,500,000 shares of our common stock at an exercise price of A$1.00 per share, exercisable at any time until December 19, 2020 (“Warrants”). The holder of a Warrant has the option to pay the exercise price in cash or by making a cashless exercise. The number of shares of common stock to be issued on exercise of the Warrants and/or the exercise price of the Warrants will be adjusted in certain circumstances including bonus issues, pro-rata issues and reorganizations of share capital.
The issue of the Warrants was made in reliance upon the exemption from registration pursuant to Rule 4(a)(2) of the Securities Act and Regulation D, promulgated thereunder. The lenders were “accredited investors,” as defined in Rule 501 promulgated under the Securities Act and no general solicitation or advertising was used in connection with the issuance of the Warrants. The holders of the Warrants may not re-sell any Warrants or shares issued upon exercise of the Warrants into the U.S. or to a U.S. person (as defined in the Securities Act and the rules promulgated thereunder) unless the resale of the securities is registered under the Securities Act or an exemption is available or within Australia for a period of one year after the date of issue of the relevant security.
26
Table of Contents
Exercise of Employee Stock Options
The table below sets forth the number of employee stock options exercised and the number of shares of common stock issued within the past three financial years. We issued these shares in reliance upon exemptions from registration under Regulation S under the Securities Act of 1933 on the basis that none of the recipient of such shares are “U.S. person” as such term is defined in Regulation S.
| Period Ending |
Number of Options Exercised and Corresponding Number of Shares Issued |
Option Exercise Price |
Proceeds Received (A$) |
|||||||
| 2014 |
||||||||||
| March, 2014 |
8,333 | A$0.00 | 0 | |||||||
|
|
|
|
|
|||||||
| 2015 |
||||||||||
| December, 2015 |
72,496 | US$0.26 | 26,127 | |||||||
|
|
|
|
|
|||||||
| 2016 |
||||||||||
| March, 2016 |
77,500 | A$0.00 | 0 | |||||||
|
|
|
|
|
|||||||
The funds raised have been and will be used for working capital requirements including the continued development of our existing pipeline of point-of-care tests and to identify and develop additional tests.
Restricted Employee Shares Issued to Employees
Our Employee Share Plan was adopted by the Board of Directors in 2009. The Employee Share Plan permits our Board to grant shares of our common stock to our employees and directors. The number of shares able to be granted is limited to the amount permitted to be granted at law, the ASX Listing Rules and by the limits on our authorized share capital in our certificate of incorporation. All our permanent full-time employees are eligible for shares under the Employee Share Plan. The Company currently proposes to issue A$1,000 worth of restricted shares of common stock to employees of the Company on a recurring basis, but no more frequently than annually. The restricted shares have the same terms of issue as our existing shares of common stock but are not able to be traded until the earlier of three years from the date on which the shares are issued or the date the relevant employee ceases to be an employee of the Company or any of its associated group of companies. We issue these shares in reliance upon exemptions from registration under Regulation S under the Securities Act on the basis that none of the recipient of such shares are “U.S. person” as such term is defined in Regulation S.
The table below sets forth the restricted shares issued by the Company within the past three financial years:
| Number of Restricted Shares Issued |
Market Value of Restricted Shares Issued (A$) |
|||||||
| June, 2014 |
2,040 | 1,000 | ||||||
| January, 2015 |
282,555 | 64,988 | ||||||
| July, 2015 |
4,347 | 1,000 | ||||||
| December, 2015 |
142,208 | 63,994 | ||||||
| February, 2016 |
15,000 | 6,000 | ||||||
| December, 2016 |
181,800 | 59,994 | ||||||
Restricted stock awards activity during the current period is as follows:
| Number of shares | Weighted average issue price (A$) |
Number of Securities Remaining for future issuance | ||||||||
| Balance at December 31, 2015 |
542,816 | 0.35 | (1) | |||||||
| Granted |
196,800 | 0.34 | ||||||||
| Release of restricted shares |
(164,036 | ) | 0.44 | |||||||
|
|
|
|
|
|||||||
| Balance at December 31, 2016 |
575,580 | 0.31 | ||||||||
|
|
|
|
|
|||||||
| (1) | The number of securities able to be granted is limited to the amount permitted to be granted at law, the ASX Listing Rules and by the limits on our authorized share capital in our amended and restated certificate of incorporation. The Listing Rules of ASX generally prohibits companies whose securities are quoted on ASX from issuing securities exceeding 15% of issued share capital in any 12 month period, without stockholder approval. |
27
Table of Contents
Purchases of Equity Securities by the Issuer and Affiliated Purchasers
There were no repurchases of equity securities in 2016.
Total Return Stock Performance Graph
The following line graph compares the cumulative total stockholder return on our common stock from December 31, 2011 through December 31, 2016 with the cumulative total return of a major market index and a published industry index. The graph below assumes an investment of A$100.00 on December 31, 2011 in our common stock, and compares its performance with the Standard and Poor’s/Australian Securities Exchange 200 Index and the Standard and Poor’s/Australian Securities Exchange Health Care 200 Index. We paid no dividends on our common stock during the period covered by the graph. The Indices included in the graph reflect a cumulative total return based upon the reinvestment of dividends of the stocks included in those indices. Measurement points are December 31, 2011 and the last trading day of each subsequent year end through December 31, 2016.
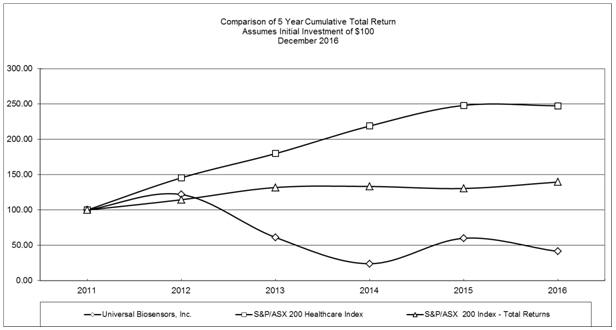
The comparisons shown in the graph above are based upon historical data. The stock price performance shown in the graph is not necessarily indicative of, nor is it intended to forecast, the potential future performance of our common stock. This graph shall not be deemed “filed” for purposes of Section 18 of the Exchange Act, or otherwise subject to the liabilities of that section, and will not be deemed incorporated by reference into any filing under the Securities Act, whether made before or after the date hereof, regardless of any general incorporation language in such filing.
28
Table of Contents
ITEM 6. SELECTED FINANCIAL DATA.
The following selected financial data should be read in conjunction with Item 7. “Management’s Discussion and Analysis of Financial Condition and Results of Operations” and consolidated financial statements and notes thereto contained in Item 8. “Financial Statements and Supplementary Data” of this report.
The following table represents our selected financial data for the dates and periods indicated.
| Years Ended December 31, | ||||||||||||||||||||
| 2016 | 2015 | 2014 | 2013 | 2012 | ||||||||||||||||
| A$ | A$ | A$ | A$ | A$ | ||||||||||||||||
| Revenue |
||||||||||||||||||||
| Revenue from products |
584,550 | 1,323,564 | 215,486 | 10,170,804 | 19,368,745 | |||||||||||||||
| Revenue from services |
18,246,267 | 15,451,414 | 9,314,198 | 4,918,868 | 10,277,698 | |||||||||||||||
|
|
|
|
|
|
|
|
|
|
|
|||||||||||
| Total revenue |
18,830,817 | 16,774,978 | 9,529,684 | 15,089,672 | 29,646,443 | |||||||||||||||
| Operating costs & expenses |
||||||||||||||||||||
| Cost of goods sold |
996,788 | 1,136,143 | 313,374 | 10,455,567 | 17,987,049 | |||||||||||||||
| Cost of services |
154,998 | 244,073 | 242,453 | 1,187,244 | 669,042 | |||||||||||||||
|
|
|
|
|
|
|
|
|
|
|
|||||||||||
| Total cost of goods sold & services |
1,151,786 | 1,380,216 | 555,827 | 11,642,811 | 18,656,091 | |||||||||||||||
|
|
|
|
|
|
|
|
|
|
|
|||||||||||
| Contribution from products & services |
17,679,031 | 15,394,762 | 8,973,857 | 3,446,861 | 10,990,352 | |||||||||||||||
| Other operating costs & expenses |
||||||||||||||||||||
| Research and development |
14,987,462 | 19,120,842 | 16,616,051 | 15,483,902 | 13,482,459 | |||||||||||||||
| General and administrative |
6,414,855 | 6,670,768 | 6,143,748 | 6,200,786 | 6,790,524 | |||||||||||||||
|
|
|
|
|
|
|
|
|
|
|
|||||||||||
| Total operating costs & expenses |
21,402,317 | 25,791,610 | 22,759,799 | 21,684,688 | 20,272,983 | |||||||||||||||
|
|
|
|
|
|
|
|
|
|
|
|||||||||||
| Loss from operations |
(3,723,286 | ) | (10,396,848 | ) | (13,785,942 | ) | (18,237,827 | ) | (9,282,631 | ) | ||||||||||
| Other income/(expense) |
||||||||||||||||||||
| Interest income |
201,096 | 242,574 | 260,904 | 499,970 | 437,171 | |||||||||||||||
| Interest expense |
(8,436 | ) | (15,106 | ) | (15,905 | ) | (22,640 | ) | (29,263 | ) | ||||||||||
| Financing costs |
(2,894,300 | ) | (3,308,068 | ) | (2,646,092 | ) | (797,126 | ) | 0 | |||||||||||
| Patent fees |
0 | 1,404,184 | (2,133,626 | ) | 0 | 0 | ||||||||||||||
| Marketing support payment |
0 | (2,804,000 | ) | 0 | 0 | 0 | ||||||||||||||
| Other |
7,675,202 | 8,300,848 | 9,004,534 | 6,923,816 | (256,499 | ) | ||||||||||||||
|
|
|
|
|
|
|
|
|
|
|
|||||||||||
| Total other income |
4,973,562 | 3,820,432 | 4,469,815 | 6,604,020 | 151,409 | |||||||||||||||
| Net income/(loss) before tax |
1,250,276 | (6,576,416 | ) | (9,316,127 | ) | (11,633,807 | ) | (9,131,222 | ) | |||||||||||
| Income tax benefit/(expense) |
0 | 0 | 0 | 0 | 0 | |||||||||||||||
|
|
|
|
|
|
|
|
|
|
|
|||||||||||
| Net income/(loss) |
1,250,276 | (6,576,416 | ) | (9,316,127 | ) | (11,633,807 | ) | (9,131,222 | ) | |||||||||||
|
|
|
|
|
|
|
|
|
|
|
|||||||||||
| Earnings per share |
||||||||||||||||||||
| Basic net income/(loss) per share |
0.01 | (0.04 | ) | (0.05 | ) | (0.07 | ) | (0.06 | ) | |||||||||||
| Average weighted number of shares - basic |
176,189,052 | 175,881,165 | 175,608,634 | 174,428,259 | 160,417,411 | |||||||||||||||
| Diluted net income/(loss) per share |
0.01 | (0.04 | ) | (0.05 | ) | (0.07 | ) | (0.06 | ) | |||||||||||
| Average weighted number of shares - diluted |
177,373,769 | 175,881,165 | 175,608,634 | 174,428,259 | 160,417,411 | |||||||||||||||
| Other comprehensive gain/(loss), net of tax: |
||||||||||||||||||||
| Foreign currency translation reserve |
109 | 0 | 0 | 0 | 0 | |||||||||||||||
| Reclassification for (gains)/losses realized in net income |
0 | 0 | 0 | 0 | (83,339 | ) | ||||||||||||||
|
|
|
|
|
|
|
|
|
|
|
|||||||||||
| Other comprehensive gain/(loss) |
109 | 0 | 0 | 0 | (83,339 | ) | ||||||||||||||
|
|
|
|
|
|
|
|
|
|
|
|||||||||||
| Comprehensive gain/(loss) |
1,250,385 | (6,576,416 | ) | (9,316,127 | ) | (11,633,807 | ) | (9,214,561 | ) | |||||||||||
|
|
|
|
|
|
|
|
|
|
|
|||||||||||
| Years Ended December 31, | ||||||||||||||||||||
| 2016 | 2015 | 2014 | 2013 | 2012 | ||||||||||||||||
| A$ | A$ | A$ | A$ | A$ | ||||||||||||||||
| Balance Sheet Data: |
|
|||||||||||||||||||
| Cash and cash equivalents |
20,402,322 | 14,350,307 | 16,329,829 | 23,742,422 | 23,649,417 | |||||||||||||||
| Total assets |
49,989,318 | 44,951,745 | 47,532,638 | 54,619,699 | 49,066,850 | |||||||||||||||
| Short term borrowings |
369,630 | 324,459 | 498,890 | 0 | 0 | |||||||||||||||
| Other liability |
3,129,306 | 3,453,710 | 2,133,626 | 0 | 0 | |||||||||||||||
| Long term secured loan |
20,286,827 | 19,868,560 | 17,499,194 | 15,857,966 | 0 | |||||||||||||||
| Total stockholders’ equity |
13,254,275 | 13,255,705 | 19,740,945 | 29,683,940 | 39,372,139 | |||||||||||||||
29
Table of Contents
ITEM 7. MANAGEMENT’S DISCUSSION AND ANALYSIS OF FINANCIAL CONDITION AND RESULTS OF OPERATIONS
The information required by this item is incorporated by reference to our 2016 Annual Report under the caption “Management’s Discussion and Analysis of Financial Condition and Results of Operations” on pages F2 to F16.
30
Table of Contents
ITEM 7A. QUANTITATIVE AND QUALITATIVE DISCLOSURES ABOUT MARKET RISK
As a “smaller reporting company,” we are not required to provide the information called for by this Item.
31
Table of Contents
ITEM 8. FINANCIAL STATEMENTS AND SUPPLEMENTARY DATA
We refer you to the “Consolidated Balance Sheets”, “Consolidated Statements of Comprehensive Income/(Loss)”, “Consolidated Statements of Changes in Stockholders’ Equity and Comprehensive Income/(Loss)”, “Consolidated Statements of Cash Flows”, and “Notes to Consolidated Financial Statements”, on pages F18 through F46, and “Report of Independent Registered Public Accounting Firm” on page F17 of our 2016 Annual Report.
Supplementary Financial Information
The following is a summary of the unaudited quarterly results of operations:
| Year ended December 31, 2016 | ||||||||||||||||
| Quarter Ended March 31 |
Quarter Ended June 30 |
Quarter Ended September 30 |
Quarter Ended December 31 |
|||||||||||||
| A$ | A$ | A$ | A$ | |||||||||||||
| Revenue |
||||||||||||||||
| Revenue from products |
183,480 | 0 | 0 | 401,070 | ||||||||||||
| Revenue from services |
4,913,739 | 5,401,513 | 3,287,296 | 4,643,719 | ||||||||||||
|
|
|
|
|
|
|
|
|
|||||||||
| Total revenue |
5,097,219 | 5,401,513 | 3,287,296 | 5,044,789 | ||||||||||||
| Operating costs & expenses |
||||||||||||||||
| Cost of goods sold |
187,144 | 53,425 | 31,899 | 724,320 | ||||||||||||
| Cost of services |
0 | 0 | 0 | 154,998 | ||||||||||||
|
|
|
|
|
|
|
|
|
|||||||||
| Total cost of goods sold & services |
187,144 | 53,425 | 31,899 | 879,318 | ||||||||||||
|
|
|
|
|
|
|
|
|
|||||||||
| Contribution from products & services |
4,910,075 | 5,348,088 | 3,255,397 | 4,165,471 | ||||||||||||
| Other operating costs & expenses |
||||||||||||||||
| Research and development |
4,999,752 | 2,878,405 | 3,947,392 | 3,161,913 | ||||||||||||
| General and administrative |
1,493,970 | 1,038,194 | 1,408,212 | 2,474,479 | ||||||||||||
|
|
|
|
|
|
|
|
|
|||||||||
| Total operating costs & expenses |
6,493,722 | 3,916,599 | 5,355,604 | 5,636,392 | ||||||||||||
|
|
|
|
|
|
|
|
|
|||||||||
| Profit/(loss) from operations |
(1,583,647 | ) | 1,431,489 | (2,100,207 | ) | (1,470,921 | ) | |||||||||
| Other income/(expense) |
||||||||||||||||
| Interest income |
25,241 | 25,628 | 89,669 | 60,558 | ||||||||||||
| Interest expense |
(2,812 | ) | (2,812 | ) | (2,812 | ) | 0 | |||||||||
| Financing costs |
(732,337 | ) | (719,096 | ) | (716,088 | ) | (726,779 | ) | ||||||||
| Patent fees |
0 | 0 | 0 | 0 | ||||||||||||
| Marketing support payment |
0 | 0 | 0 | 0 | ||||||||||||
| Other |
638,615 | (273,386 | ) | 567,155 | 6,742,818 | |||||||||||
|
|
|
|
|
|
|
|
|
|||||||||
| Total other income/(expense) |
(71,293 | ) | (969,666 | ) | (62,076 | ) | 6,076,597 | |||||||||
| Net income/(loss) before tax |
(1,654,940 | ) | 461,823 | (2,162,283 | ) | 4,605,676 | ||||||||||
| Income tax benefit/(expense) |
0 | 0 | 0 | 0 | ||||||||||||
|
|
|
|
|
|
|
|
|
|||||||||
| Net income/(loss) |
(1,654,940 | ) | 461,823 | (2,162,283 | ) | 4,605,676 | ||||||||||
|
|
|
|
|
|
|
|
|
|||||||||
| Earnings per share |
||||||||||||||||
| Basic net income/(loss) per share |
(0.01 | ) | 0.00 | (0.01 | ) | 0.03 | ||||||||||
| Diluted net income/(loss) per share |
(0.01 | ) | 0.00 | (0.01 | ) | 0.03 | ||||||||||
| Other comprehensive gain/(loss), net of tax: |
||||||||||||||||
| Foreign currency translation reserve |
0 | 0 | 0 | 109 | ||||||||||||
| Reclassification for gain/(loss) realized in net income |
0 | 0 | 0 | 0 | ||||||||||||
|
|
|
|
|
|
|
|
|
|||||||||
| Other comprehensive (loss)/gain |
0 | 0 | 0 | 109 | ||||||||||||
|
|
|
|
|
|
|
|
|
|||||||||
| Comprehensive gain/(loss) |
(1,654,940 | ) | 461,823 | (2,162,283 | ) | 4,605,785 | ||||||||||
|
|
|
|
|
|
|
|
|
|||||||||
32
Table of Contents
| Year ended December 31, 2015 | ||||||||||||||||
| Quarter Ended March 31 |
Quarter Ended June 30 |
Quarter Ended September 30 |
Quarter Ended December 31 |
|||||||||||||
| A$ | A$ | A$ | A$ | |||||||||||||
| Revenue |
||||||||||||||||
| Revenue from products |
72,117 | 344,289 | 552,617 | 354,541 | ||||||||||||
| Revenue from services |
3,037,820 | 4,006,580 | 5,445,093 | 2,961,921 | ||||||||||||
|
|
|
|
|
|
|
|
|
|||||||||
| Total revenue |
3,109,937 | 4,350,869 | 5,997,710 | 3,316,462 | ||||||||||||
| Operating costs & expenses |
||||||||||||||||
| Cost of goods sold |
67,140 | 273,026 | 458,644 | 337,333 | ||||||||||||
| Cost of services |
10,960 | 179,993 | 48,751 | 4,369 | ||||||||||||
|
|
|
|
|
|
|
|
|
|||||||||
| Total cost of goods sold & services |
78,100 | 453,019 | 507,395 | 341,702 | ||||||||||||
|
|
|
|
|
|
|
|
|
|||||||||
| Contribution from products & services |
3,031,837 | 3,897,850 | 5,490,315 | 2,974,760 | ||||||||||||
| Other operating costs & expenses |
||||||||||||||||
| Research and development |
4,941,983 | 4,952,733 | 4,987,015 | 4,239,111 | ||||||||||||
| General and administrative |
1,624,131 | 1,502,167 | 1,529,799 | 2,014,671 | ||||||||||||
|
|
|
|
|
|
|
|
|
|||||||||
| Total operating costs & expenses |
6,566,114 | 6,454,900 | 6,516,814 | 6,253,782 | ||||||||||||
|
|
|
|
|
|
|
|
|
|||||||||
| Profit/(loss) from operations |
(3,534,277 | ) | (2,557,050 | ) | (1,026,499 | ) | (3,279,022 | ) | ||||||||
| Other income/(expense) |
||||||||||||||||
| Interest income |
56,741 | 43,233 | 104,885 | 37,715 | ||||||||||||
| Interest expense |
(2,834 | ) | (7,084 | ) | (4,250 | ) | (938 | ) | ||||||||
| Financing costs |
(1,027,568 | ) | (752,544 | ) | (778,102 | ) | (749,854 | ) | ||||||||
| Patent fees |
0 | 0 | 0 | 1,404,184 | ||||||||||||
| Marketing support payment |
0 | 0 | 0 | (2,804,000 | ) | |||||||||||
| Other |
1,640,196 | 2,013,594 | 1,541,108 | 3,105,950 | ||||||||||||
|
|
|
|
|
|
|
|
|
|||||||||
| Total other income/(expense) |
666,535 | 1,297,199 | 863,641 | 993,057 | ||||||||||||
| Net loss before tax |
(2,867,742 | ) | (1,259,851 | ) | (162,858 | ) | (2,285,965 | ) | ||||||||
| Income tax benefit/(expense) |
0 | 0 | 0 | 0 | ||||||||||||
|
|
|
|
|
|
|
|
|
|||||||||
| Net loss |
(2,867,742 | ) | (1,259,851 | ) | (162,858 | ) | (2,285,965 | ) | ||||||||
|
|
|
|
|
|
|
|
|
|||||||||
| Earnings per share |
||||||||||||||||
| Basic net income/(loss) per share |
(0.02 | ) | (0.01 | ) | 0.00 | (0.01 | ) | |||||||||
| Diluted net income/(loss) per share |
(0.02 | ) | (0.01 | ) | 0.00 | (0.01 | ) | |||||||||
| Other comprehensive loss, net of tax: |
||||||||||||||||
| Unrealised gain/(loss) on derivative instruments |
0 | 0 | 0 | 0 | ||||||||||||
| Reclassification for gain/(loss) realized in net income |
0 | 0 | 0 | 0 | ||||||||||||
|
|
|
|
|
|
|
|
|
|||||||||
| Other comprehensive (loss)/gain |
0 | 0 | 0 | 0 | ||||||||||||
|
|
|
|
|
|
|
|
|
|||||||||
| Comprehensive loss |
(2,867,742 | ) | (1,259,851 | ) | (162,858 | ) | (2,285,965 | ) | ||||||||
|
|
|
|
|
|
|
|
|
|||||||||
33
Table of Contents
ITEM 9. CHANGES IN AND DISAGREEMENTS WITH ACCOUNTANTS ON ACCOUNTING AND FINANCIAL DISCLOSURE
None.
34
Table of Contents
ITEM 9A. CONTROLS AND PROCEDURES
Disclosure Controls and Procedures. At the end of the period covered by this report, the Company evaluated the effectiveness of the design and operation of its disclosure controls and procedures. The Company’s disclosure controls and procedures are designed to ensure that information required to be disclosed by the Company in the reports that it files or submits under the Exchange Act is recorded, processed, summarized and reported within the time periods specified in the SEC’s rules and forms. Disclosure controls and procedures include, without limitation, controls and procedures designed to ensure that information required to be disclosed by the Company in the reports that it files or submits under the Exchange Act is accumulated and communicated to the Company’s management, including its principal executive and principal financial officers, or persons performing similar functions, as appropriate to allow timely decisions regarding required disclosure. Andrew Denver, Executive Chairman, and Salesh Balak, Chief Financial Officer, reviewed and participated in this evaluation. Based on this evaluation, Messrs. Denver and Balak concluded that, as of the end of the period covered by this report, the Company’s disclosure controls and procedures were effective.
Changes in Internal Control over Financial Reporting. During the fiscal quarter ended December 31, 2016, there were no changes in the Company’s internal control over financial reporting identified in connection with the evaluation referred to above in this Item 9A that have materially affected, or are reasonably likely to materially affect, the Company’s internal control over financial reporting.
35
Table of Contents
MANAGEMENT’S REPORT ON INTERNAL CONTROL OVER FINANCIAL REPORTING
Our management is responsible for establishing and maintaining adequate internal control over financial reporting (as defined in Rule 13a-15(f) and 15d-15(e) under the Exchange Act). Our internal control over financial reporting is a process designed to provide reasonable assurance regarding the reliability of financial reporting and the preparation of financial statements for external purposes in accordance with generally accepted accounting principles and includes those policies and procedures that:
| • | Pertain to the maintenance of records that, in reasonable detail, accurately and fairly reflect the transactions and the dispositions of the assets of the Company; |
| • | Provide reasonable assurance that transactions are recorded as necessary to permit preparation of financial statements in accordance with generally accepted accounting principles, and that receipts and expenditures of the Company are being made only in accordance with authorizations of management and the board of directors of the Company; and |
| • | Provide reasonable assurance regarding prevention or timely detection of unauthorized acquisition, use, or disposition of the Company’s assets that could have a material effect on the financial statements. |
Because of its inherent limitations, internal control over financial reporting may not prevent or detect misstatements. Also, projections of any evaluations of effectiveness to future periods are subject to risk that controls may become inadequate because of changes in conditions or because of declines in the degree of compliance with the policies or procedures.
Our management, with the participation of the Principal Executive Officer and Principal Financial Officer, assessed the effectiveness of the Company’s internal control over financial reporting as of December 31, 2016. In making this assessment, the Company’s management used the criteria set forth by the Committee of Sponsoring Organizations of the Treadway Commission (“COSO”) in Internal Control-Integrated Framework (2013).
Based on this evaluation, our management, with the participation of the Principal Executive Officer and Principal Financial Officer, concluded that, as of December 31, 2016, our internal control over financial reporting was effective.
| /s/ Andrew Denver |
/s/ Salesh Balak | |||
| Andrew Denver | Salesh Balak | |||
| Principal Executive Officer | Principal Financial Officer |
March 21, 2017
36
Table of Contents
REPORT OF INDEPENDENT REGISTERED PUBLIC ACCOUNTING FIRM ON INTERNAL CONTROL OVER FINANCIAL REPORTING
Being a smaller reporting company, the Independent registered Public Accounting Firm is not required to test or report on the effectiveness of internal control over financial reporting.
37
Table of Contents
None.
38
Table of Contents
ITEM 10. DIRECTORS, EXECUTIVE OFFICERS AND CORPORATE GOVERNANCE.
The information required by this item regarding our directors and executive officers is incorporated by reference to our Definitive Proxy Statement to be filed with the SEC in connection with our Annual Meeting of Stockholders in 2017 (the “2017 Proxy Statement”) under the caption “Management of the Company.”
The information required by this item regarding “Compliance with Section 16(a) of the Exchange Act” is incorporated by reference to the 2017 Proxy Statement under the caption “Other Matters – Section 16(a) Beneficial Ownership Reporting Compliance.”
We have adopted our Code of Ethics for Senior Financial Officers, a code of ethics that applies to our Principal Executive Officer and Principal Financial Officer. This code of ethics may be accessed and reviewed through our website at www.universalbiosensors.com. We intend to satisfy any disclosure requirement under item 5.05 of Form 8-K regarding an amendment to, or waiver from, a provision of the Code of Ethics for our Principal Executive Officer and Principal Financial Officer, by posting such information on our website at www.universalbiosensors.com
The information regarding the procedures by which security holders may recommend nominees to our Board of Directors is incorporated by reference to the 2017 Proxy Statement under the caption “Management of the Company – Board Committees – Remuneration and Nomination Committee.” There have been no material changes to the procedures by which security holders may recommend nominees to our Board of Directors.
The information required by this item regarding our Audit and Compliance Committee is incorporated by reference to the 2017 Proxy Statement under the caption “Management of the Company – Board Committees – Audit and Compliance Committee.”
39
Table of Contents
ITEM 11. EXECUTIVE COMPENSATION.
The information required by this item is incorporated by reference to the 2017 Proxy Statement under the captions “Management of the Company – Compensation of Directors”, “Executive Compensation” and “Management of the Company – Board Committees – Compensation Committee Interlocks and Insider Participation.”
Discussions on the frequency of the shareholder advisory votes on executive compensation are incorporated by reference to the 2017 Proxy Statement under the caption “Executive Compensation”.
40
Table of Contents
ITEM 12. SECURITY OWNERSHIP OF CERTAIN BENEFICIAL OWNERS AND MANAGEMENT AND RELATED STOCKHOLDER MATTERS.
The information regarding the security ownership of certain beneficial owners and management is incorporated by reference to the 2017 Proxy Statement under the caption “Security Ownership of Certain Beneficial Owners and Management.”
The information regarding “Securities Authorized for Issuance under Equity Compensation Plans” is incorporated by reference to our 2017 Proxy Statement under the caption “Executive Compensation – Equity Compensation Plan Information.”
41
Table of Contents
ITEM 13. CERTAIN RELATIONSHIPS AND RELATED TRANSACTIONS, AND DIRECTOR INDEPENDENCE.
The information required by this item is incorporated by reference to the 2017 Proxy Statement under the caption “Certain Relationships and Related Transactions,” and “Management of the Company.”
42
Table of Contents
ITEM 14. PRINCIPAL ACCOUNTING FEES AND SERVICES.
The information required by this item is incorporated by reference to the 2017 Proxy Statement under the caption “Independent Public Accountants – Audit Fees.”
43
Table of Contents
ITEM 15. EXHIBITS, FINANCIAL STATEMENTS AND SCHEDULES.
| (a)(1) | Financial Statements | |||||
| The following financial statements are incorporated by reference from pages F-17 through F-46 of our Annual Report to Stockholders for the fiscal year ended December 31, 2016, as provided in Item 8 hereof: | ||||||
| F-17 | ||||||
| F-18 | ||||||
| F-19 | ||||||
| Consolidated Statements of Changes in Stockholders’ Equity and Comprehensive Income/(Loss) |
F-20 | |||||
| F-21 | ||||||
| F-22 | ||||||
| (a)(2) | Financial Statement Schedules – Schedule II—Valuation and Qualifying Accounts. All other schedules are omitted because of the absence of the conditions under which they are required or because the required information is included elsewhere in the financial statements. | |||||
(a)(3) and (b) Exhibits – Refer below.
| Exhibit Number |
Description | Location | ||
| 3.1 | Amended and restated articles of incorporation dated December 5, 2006. | Incorporated by reference to our General Form for Registration of Securities on Form 10 filed on April 30, 2007 as Exhibit 3.1. | ||
| 3.2 | Amended and restated by-laws dated December 5, 2006. | Incorporated by reference to our Amendment No. 5 to Form 10 filed on April 29, 2008 as Exhibit 3.2. | ||
| 10.1 | Amended and Restated License Agreement, between LifeScan, Inc. and Universal Biosensors Pty Ltd dated on August 29, 2011 and effective as of August 19, 2011. | Incorporated by reference to our Current Report on Form 8-K filed on August 30, 2011 as Exhibit 10.1. | ||
| 10.2 | Amended and Restated Development and Research Agreement between Cilag GmbH International and Universal Biosensors Pty Ltd dated on August 29, 2011 and effective as of August 19, 2011. | Incorporated by reference to our Current Report on Form 8-K filed on August 30, 2011 as Exhibit 10.2. | ||
| 10.3 | Form of indemnity agreement entered into with directors of us, our chief financial officer and company secretary | Incorporated by reference to our General Form for Registration of Securities on Form 10 filed on April 30, 2007 as Exhibit 10.3. | ||
| 10.4 | Lease of premises 1 Corporate Avenue, Rowville, Victoria, Australia by and between Universal Biosensors Pty Ltd and Heyram Properties Pty Ltd. | Incorporated by reference to our General Form for Registration of Securities on Form 10 filed on April 30, 2007 as Exhibit 10.5. | ||
| 10.5 | Employee Option Plan. | Incorporated by reference to our General Form for Registration of Securities on Form 10 filed on April 30, 2007 as Exhibit 10.7. | ||
| 10.6 | Employment agreement between Universal Biosensors Pty Ltd and Mr. Salesh Balak effective November 27, 2006. | Incorporated by reference to our General Form for Registration of Securities on Form 10 filed on April 30, 2007 as Exhibit 10.8. | ||
| 10.7 | Employment agreement between Universal Biosensors Pty Ltd and Mr. Garry Chambers effective April 1, 2006. | Incorporated by reference to our General Form for Registration of Securities on Form 10 filed on April 30, 2007 as Exhibit 10.9. | ||
| 10.8 | Employment agreement between Universal Biosensors Pty Ltd and Dr Ronald Chatelier dated April 1, 2006. | Incorporated by reference to our General Form for Registration of Securities on Form 10 filed on April 30, 2007 as Exhibit 10.10. | ||
44
Table of Contents
| 10.9 | Employment agreement between Universal Biosensors Pty Ltd and Dr Alastair Hodges effective April 1, 2006. | Incorporated by reference to our General Form for Registration of Securities on Form 10 filed on April 30, 2007 as Exhibit 10.11. | ||
| 10.10 | Employment agreement between Universal Biosensors Pty Ltd and Mr. Adrian Oates dated August 15, 2007. | Incorporated by reference to our Form 10-K filed on March 16, 2010 as Exhibit 10.12. | ||
| 10.11 | Amended and Restated Master Services and Supply Agreement (which amends and restates the Master Services and Supply Agreement by and between Universal Biosensors Pty. Ltd., Universal Biosensors, Inc., and LifeScan, Inc. dated October 29, 2007 filed on November 14, 2007 as Exhibit 10.1 to our Quarterly Report on Form 10-Q and the First Amendment to the Master Services and Supply Agreement filed on March 30, 2009 as Exhibit 10.14 to our Annual Report on Form 10-K). | Incorporated by reference to our Quarterly Report on Form 10-Q filed on August 7, 2009 as Exhibit 10.3. Confidentiality treatment has been granted for portions of this exhibit. These confidential portions have been omitted and were filed separately with the SEC. | ||
| 10.12 | Manufacturing Initiation Payment Addendum to Master Services and Supply Agreement (which is an addendum to the Amended and Restated Master Services and Supply Agreement filed on August 7, 2009 as Exhibit 10.3 to our Quarterly Report on Form 10-Q). | Incorporated by reference to our Quarterly Report on Form 10-Q filed on August 7, 2009 as Exhibit 10.4. Confidentiality treatment has been granted for portions of this exhibit. These confidential portions have been omitted and were filed separately with the SEC. | ||
| 10.13 | Collaboration Agreement between Universal Biosensors Pty Ltd and Siemens Healthcare Diagnostics Inc. dated September 9, 2011. | Incorporated by reference to our Quarterly Report on Form 10-Q filed on November 3, 2011 as Exhibit 10.20. Confidentiality treatment has been granted for portions of this exhibit. These confidential portions have been omitted and were filed separately with the SEC. | ||
| 10.14 | Statement of Work for MAP Feasibility Project between Universal Biosensors Pty Ltd, LifeScan, Inc. and Cilag GmbH International dated October 11, 2011. | Incorporated by reference to our Quarterly Report on Form 10-Q filed on November 3, 2011 as Exhibit 10.21. Confidentiality treatment has been granted for portions of this exhibit. These confidential portions have been omitted and were filed separately with the SEC. | ||
| 10.15 | Novation Agreement and First Amendment to the Amended and Restated Master Services and Supply Agreement between Universal Biosensors, Inc., Universal Biosensors Pty Ltd, LifeScan, Inc. and Cilag GmbH International dated October 11, 2011. | Incorporated by reference to our Quarterly Report on Form 10-Q filed on November 3, 2011 as Exhibit 10.22. | ||
| 10.16 | Second Amendment to the Amended and Restated Master Services and Supply Agreement between Universal Biosensors, Inc., Universal Biosensors Pty Ltd, LifeScan, Inc. and Cilag GmbH International dated October 11, 2011. | Incorporated by reference to our Quarterly Report on Form 10-Q filed on November 3, 2011 as Exhibit 10.23. Confidentiality treatment has been granted for portions of this exhibit. These confidential portions have been omitted and were filed separately with the SEC. | ||
| 10.17 | Employment agreement between Universal Biosensors Pty Ltd and Mr. Paul Wright effective March 1, 2011. | Incorporated by reference to our Current Report on Form 8-K filed on February 25, 2011 as Exhibit 10.1. | ||
45
Table of Contents
| 10.18 | Amendment to Collaboration Agreement between Universal Biosensors Pty Ltd and Siemens Healthcare Diagnostics, Inc. dated September 20, 2012. | Incorporated by reference to our Quarterly Report on Form 10-Q/A filed on February 4, 2013 as Exhibit 10.1. Confidentiality treatment has been granted for portions of this exhibit. These confidential portions have been omitted and were filed separately with the SEC. | ||
| 10.19 | Supply Agreement between Universal Biosensors Pty Ltd and Siemens Healthcare Diagnostics, Inc. dated September 20, 2012. | Incorporated by reference to our Quarterly Report on Form 10-Q/A filed on February 4, 2013 as Exhibit 10.2. Confidentiality treatment has been granted for portions of this exhibit. These confidential portions have been omitted and were filed separately with the SEC. | ||
| 10.20 | Supplemental Agreement – Reader Product Support Obligations and Responsibilities between Universal Biosensors Pty Ltd and Siemens Healthcare Diagnostics, Inc. dated September 20, 2012. | Incorporated by reference to our Quarterly Report on Form 10-Q/A filed on February 4, 2013 as Exhibit 10.3. Confidentiality treatment has been granted for portions of this exhibit. These confidential portions have been omitted and were filed separately with the SEC. | ||
| 10.21 | Credit Agreement dated December 19, 2013 by and among Athyrium Opportunities Fund (A) LP as Administrative Agent and a Lender, Universal Biosensors Pty Ltd as borrower, Universal Biosensors, Inc. as a Guarantor, and the other Lenders and Guarantors as party thereto from time to time. | Incorporated by reference to our Current Report on Form 8-K filed on December 20, 2013 as Exhibit 10.1. | ||
| 10.22 | Third Amendment to Amended and Restated Master Services and Supply Agreement by and among Universal Biosensors, Inc., Universal Biosensors Pty Ltd, and Cilag GmbH International. | Incorporated by reference to our Current Report on Form 8-K filed on December 20, 2013 as Exhibit 10.2. | ||
| 10.23 | Common Stock Purchase Warrant by and among Athyrium Opportunities Fund (A) LP and Universal Biosensors, Inc. | Incorporated by reference to our Current Report on Form 8-K filed on December 20, 2013 as Exhibit 10.3. | ||
| 10.24 | Common Stock Purchase Warrant by and among Athyrium Opportunities Fund (B) LP and Universal Biosensors, Inc. | Incorporated by reference to our Current Report on Form 8-K filed on December 20, 2013 as Exhibit 10.4. | ||
| 10.25 | Deed of Extension of Lease between Universal Biosensors Pty Ltd and Bowmayne Pty Ltd dated March 24, 2014. | Incorporated by reference to our Quarterly Report on Form 10-Q filed on April 25, 2014 as Exhibit 10.34. | ||
| 10.26 | Amendment dated January 30, 2015 to Credit Agreement by and among Athyrium Opportunities Fund (A) LP as Administrative Agent and a Lender, Universal Biosensors Pty Ltd as borrower, Universal Biosensors, Inc. as a Guarantor, and the other Lenders and Guarantors as party thereto from time to time. | Incorporated by reference to our Current Report on Form 8-K filed on February 2, 2015 as Exhibit 10.1. | ||
| 10.27 | Separation Agreement between the Company and Paul Wright dated February 18, 2016. | Incorporated by reference to our Current Report on Form 8-K filed on February 19, 2016 as Exhibit 10.1. | ||
| 10.28 | Employment Agreement between the Company and Andrew Denver, dated February 19, 2016. | Incorporated by reference to our Current Report on Form 8-K filed on February 19, 2016 as Exhibit 10.2. | ||
| 10.29 | Letter agreement entitled “Conditional Prepayment of Milestones and other amendments” between Universal Biosensors Pty Ltd and Siemens Healthcare Diagnostics Inc. dated March 9, 2016. | Incorporated by reference to our Quarterly Report on Form 10-Q filed on April 21, 2016 as Exhibit 10.2. | ||
46
Table of Contents
| 10.30 | Amendment to Collaboration Agreement between Universal Biosensors Pty Ltd and Siemens Healthcare Diagnostics Inc. dated March 9, 2016. | Incorporated by reference to our Current Report on Form 8-K filed on March, 2016 as Exhibit 99.1. | ||
| 13.0 | Annual Report. | Filed herewith. | ||
| 14.0 | Code of Ethics. | Incorporated by reference to our Annual Report on Form 10-K filed on March 28, 2008 as Exhibit 14.0. | ||
| 21.0 | List of Subsidiaries. | Filed herewith. | ||
| 24.0 | Power of Attorney. | Included on signature page. | ||
| 31.1 | Certification of Principal Executive Officer pursuant to Section 302 of the Sarbanes-Oxley Act. | Filed herewith. | ||
| 31.2 | Certification of Principal Financial Officer pursuant to Section 302 of the Sarbanes-Oxley Act. | Filed herewith. | ||
| 32.0 | Certification of Principal Executive Officer and Principal Financial Officer pursuant to Section 906 of the Sarbanes-Oxley Act. | Filed herewith. | ||
| 101 | The following materials from the Universal Biosensors, Inc. Annual Report on Form 10-K for the financial year ended December 31, 2016 formatted in Extensible Business Reporting Language (XBRL): (i) the Consolidated Condensed Balance Sheets, (ii) the Consolidated Condensed Statements of Comprehensive Income, (iii) the Consolidated Condensed Statements of Changes in Stockholder’s Equity, (iv) the Consolidated Condensed Statements of Cash Flows and (v) the Notes to Consolidated Condensed Financial Statements. | As provided in Rule 406T of Regulation S-T, this information is furnished herewith and not filed for purposes of Sections 11 and 12 of the Securities Act of 1933 and Section 18 of the Securities Exchange Act of 1934. | ||
47
Table of Contents
None.
48
Table of Contents
Pursuant to the requirements of Section 13 or 15(d) of the Securities Exchange Act of 1934, the registrant has duly caused this Form 10-K to be signed on its behalf by the undersigned, thereunto duly authorized.
| Universal Biosensors, Inc. | ||||||
| (Registrant) | ||||||
| Date: March 21, 2017 | By: | /s/ Andrew Denver | ||||
| Andrew Denver | ||||||
| Principal Executive Officer | ||||||
POWER OF ATTORNEY
Each person whose signature appears below hereby constitutes and appoints Andrew Denver and Salesh Balak and each of them, his or her attorneys-in-fact, each with the power of substitution, for him or her and in his or her name, place and stead, in any and all capacities, to sign any and all amendments to this report on Form 10-K, and to file the same, with all exhibits thereto and all documents in connection therewith, with the Securities and Exchange Commission, granting unto said attorneys-in-fact and agents, and each of them full power and authority to do and perform each and every act and all intents and purposes as he or she might or could do in person, hereby ratifying and confirming all that such attorneys in-fact and agents or any of them or his or their substitute or substitutes, may lawfully do or cause to be done by virtue thereof.
Pursuant to the requirements of the Securities Exchange Act of 1934, this report has been signed by the following on behalf of the registrant and in the capacities and on the dates indicated:
| Signature |
Title |
Date | ||
| /s/ Andrew Denver |
Executive Chairman and Chief Executive Officer | March 21, 2017 | ||
| Andrew Denver | (Principal Executive Officer) | |||
| /s/ Salesh Balak |
Chief Financial Officer | March 21, 2017 | ||
| Salesh Balak | (Principal Financial Officer and Principal Accounting Officer) | |||
| /s/ David Hoey |
Director | March 21, 2017 | ||
| David Hoey | ||||
| /s/ Denis Hanley |
Director | March 21, 2017 | ||
| Denis Hanley | ||||
| /s/ Judith Smith |
Director | March 21, 2017 | ||
| Judith Smith | ||||
| /s/ Marshall Heinberg |
Director | March 21, 2017 | ||
| Marshall Heinberg | ||||
| /s/ Craig Coleman |
Director | March 21, 2017 | ||
| Craig Coleman | ||||
49
Table of Contents
INDEX TO EXHIBITS
| Exhibit Number |
Description | Location | ||
| 3.1 | Amended and restated articles of incorporation dated December 5, 2006. | Incorporated by reference to our General Form for Registration of Securities on Form 10 filed on April 30, 2007 as Exhibit 3.1. | ||
| 3.2 | Amended and restated by-laws dated December 5, 2006. | Incorporated by reference to our Amendment No. 5 to Form 10 filed on April 29, 2008 as Exhibit 3.2. | ||
| 10.1 | Amended and Restated License Agreement, between LifeScan, Inc. and Universal Biosensors Pty Ltd dated on August 29, 2011 and effective as of August 19, 2011. | Incorporated by reference to our Current Report on Form 8-K filed on August 30, 2011 as Exhibit 10.1. | ||
| 10.2 | Amended and Restated Development and Research Agreement between Cilag GmbH International and Universal Biosensors Pty Ltd dated on August 29, 2011 and effective as of August 19, 2011. | Incorporated by reference to our Current Report on Form 8-K filed on August 30, 2011 as Exhibit 10.2. | ||
| 10.3 | Form of indemnity agreement entered into with directors of us, our chief financial officer and company secretary | Incorporated by reference to our General Form for Registration of Securities on Form 10 filed on April 30, 2007 as Exhibit 10.3. | ||
| 10.4 | Lease of premises 1 Corporate Avenue, Rowville, Victoria, Australia by and between Universal Biosensors Pty Ltd and Heyram Properties Pty Ltd. | Incorporated by reference to our General Form for Registration of Securities on Form 10 filed on April 30, 2007 as Exhibit 10.5. | ||
| 10.5 | Employee Option Plan. | Incorporated by reference to our General Form for Registration of Securities on Form 10 filed on April 30, 2007 as Exhibit 10.7. | ||
| 10.6 | Employment agreement between Universal Biosensors Pty Ltd and Mr. Salesh Balak effective November 27, 2006. | Incorporated by reference to our General Form for Registration of Securities on Form 10 filed on April 30, 2007 as Exhibit 10.8. | ||
| 10.7 | Employment agreement between Universal Biosensors Pty Ltd and Mr. Garry Chambers effective April 1, 2006. | Incorporated by reference to our General Form for Registration of Securities on Form 10 filed on April 30, 2007 as Exhibit 10.9. | ||
| 10.8 | Employment agreement between Universal Biosensors Pty Ltd and Dr Ronald Chatelier dated April 1, 2006. | Incorporated by reference to our General Form for Registration of Securities on Form 10 filed on April 30, 2007 as Exhibit 10.10. | ||
| 10.9 | Employment agreement between Universal Biosensors Pty Ltd and Dr Alastair Hodges effective April 1, 2006. | Incorporated by reference to our General Form for Registration of Securities on Form 10 filed on April 30, 2007 as Exhibit 10.11. | ||
| 10.10 | Employment agreement between Universal Biosensors Pty Ltd and Mr. Adrian Oates dated August 15, 2007. | Incorporated by reference to our Form 10-K filed on March 16, 2010 as Exhibit 10.12. | ||
| 10.11 | Amended and Restated Master Services and Supply Agreement (which amends and restates the Master Services and Supply Agreement by and between Universal Biosensors Pty. Ltd., Universal Biosensors, Inc., and LifeScan, Inc. dated October 29, 2007 filed on November 14, 2007 as Exhibit 10.1 to our Quarterly Report on Form 10-Q and the First Amendment to the Master Services and Supply Agreement filed on March 30, 2009 as Exhibit 10.14 to our Annual Report on Form 10-K). | Incorporated by reference to our Quarterly Report on Form 10-Q filed on August 7, 2009 as Exhibit 10.3. Confidentiality treatment has been granted for portions of this exhibit. These confidential portions have been omitted and were filed separately with the SEC. | ||
50
Table of Contents
| 10.12 | Manufacturing Initiation Payment Addendum to Master Services and Supply Agreement (which is an addendum to the Amended and Restated Master Services and Supply Agreement filed on August 7, 2009 as Exhibit 10.3 to our Quarterly Report on Form 10-Q). | Incorporated by reference to our Quarterly Report on Form 10-Q filed on August 7, 2009 as Exhibit 10.4. Confidentiality treatment has been granted for portions of this exhibit. These confidential portions have been omitted and were filed separately with the SEC. | ||
| 10.13 | Collaboration Agreement between Universal Biosensors Pty Ltd and Siemens Healthcare Diagnostics Inc. dated September 9, 2011. | Incorporated by reference to our Quarterly Report on Form 10-Q filed on November 3, 2011 as Exhibit 10.20. Confidentiality treatment has been granted for portions of this exhibit. These confidential portions have been omitted and were filed separately with the SEC. | ||
| 10.14 | Statement of Work for MAP Feasibility Project between Universal Biosensors Pty Ltd, LifeScan, Inc. and Cilag GmbH International dated October 11, 2011. | Incorporated by reference to our Quarterly Report on Form 10-Q filed on November 3, 2011 as Exhibit 10.21. Confidentiality treatment has been granted for portions of this exhibit. These confidential portions have been omitted and were filed separately with the SEC. | ||
| 10.15 | Novation Agreement and First Amendment to the Amended and Restated Master Services and Supply Agreement between Universal Biosensors, Inc., Universal Biosensors Pty Ltd, LifeScan, Inc. and Cilag GmbH International dated October 11, 2011. | Incorporated by reference to our Quarterly Report on Form 10-Q filed on November 3, 2011 as Exhibit 10.22. | ||
| 10.16 | Second Amendment to the Amended and Restated Master Services and Supply Agreement between Universal Biosensors, Inc., Universal Biosensors Pty Ltd, LifeScan, Inc. and Cilag GmbH International dated October 11, 2011. | Incorporated by reference to our Quarterly Report on Form 10-Q filed on November 3, 2011 as Exhibit 10.23. Confidentiality treatment has been granted for portions of this exhibit. These confidential portions have been omitted and were filed separately with the SEC. | ||
| 10.17 | Employment agreement between Universal Biosensors Pty Ltd and Mr. Paul Wright effective March 1, 2011. | Incorporated by reference to our Current Report on Form 8-K filed on February 25, 2011 as Exhibit 10.1. | ||
| 10.18 | Amendment to Collaboration Agreement between Universal Biosensors Pty Ltd and Siemens Healthcare Diagnostics, Inc. dated September 20, 2012. | Incorporated by reference to our Quarterly Report on Form 10-Q/A filed on February 4, 2013 as Exhibit 10.1. Confidentiality treatment has been granted for portions of this exhibit. These confidential portions have been omitted and were filed separately with the SEC. | ||
| 10.19 | Supply Agreement between Universal Biosensors Pty Ltd and Siemens Healthcare Diagnostics, Inc. dated September 20, 2012. | Incorporated by reference to our Quarterly Report on Form 10-Q/A filed on February 4, 2013 as Exhibit 10.2. Confidentiality treatment has been granted for portions of this exhibit. These confidential portions have been omitted and were filed separately with the SEC. | ||
| 10.20 | Supplemental Agreement – Reader Product Support Obligations and Responsibilities between Universal Biosensors Pty Ltd and Siemens Healthcare Diagnostics, Inc. dated September 20, 2012. | Incorporated by reference to our Quarterly Report on Form 10-Q/A filed on February 4, 2013 as Exhibit 10.3. Confidentiality treatment has been granted for portions of this exhibit. These confidential portions have been omitted and were filed separately with the SEC. | ||
51
Table of Contents
| 10.21 | Credit Agreement dated December 19, 2013 by and among Athyrium Opportunities Fund (A) LP as Administrative Agent and a Lender, Universal Biosensors Pty Ltd as borrower, Universal Biosensors, Inc. as a Guarantor, and the other Lenders and Guarantors as party thereto from time to time. | Incorporated by reference to our Current Report on Form 8-K filed on December 20, 2013 as Exhibit 10.1. | ||
| 10.22 | Third Amendment to Amended and Restated Master Services and Supply Agreement by and among Universal Biosensors, Inc., Universal Biosensors Pty Ltd, and Cilag GmbH International. | Incorporated by reference to our Current Report on Form 8-K filed on December 20, 2013 as Exhibit 10.2. | ||
| 10.23 | Common Stock Purchase Warrant by and among Athyrium Opportunities Fund (A) LP and Universal Biosensors, Inc. | Incorporated by reference to our Current Report on Form 8-K filed on December 20, 2013 as Exhibit 10.3. | ||
| 10.24 | Common Stock Purchase Warrant by and among Athyrium Opportunities Fund (B) LP and Universal Biosensors, Inc. | Incorporated by reference to our Current Report on Form 8-K filed on December 20, 2013 as Exhibit 10.4. | ||
| 10.25 | Deed of Extension of Lease between Universal Biosensors Pty Ltd and Bowmayne Pty Ltd dated March 24, 2014. | Incorporated by reference to our Quarterly Report on Form 10-Q filed on April 25, 2014 as Exhibit 10.34. | ||
| 10.26 | Amendment dated January 30, 2015 to Credit Agreement by and among Athyrium Opportunities Fund (A) LP as Administrative Agent and a Lender, Universal Biosensors Pty Ltd as borrower, Universal Biosensors, Inc. as a Guarantor, and the other Lenders and Guarantors as party thereto from time to time. | Incorporated by reference to our Current Report on Form 8-K filed on February 2, 2015 as Exhibit 10.1. | ||
| 10.27 | Separation Agreement between the Company and Paul Wright dated February 18, 2016. | Incorporated by reference to our Current Report on Form 8-K filed on February 19, 2016 as Exhibit 10.1. | ||
| 10.28 | Employment Agreement between the Company and Andrew Denver, dated February 19, 2016. | Incorporated by reference to our Current Report on Form 8-K filed on February 19, 2016 as Exhibit 10.2. | ||
| 10.29 | Letter agreement entitled “Conditional Prepayment of Milestones and other amendments” between Universal Biosensors Pty Ltd and Siemens Healthcare Diagnostics Inc. dated March 9, 2016. | Incorporated by reference to our Quarterly Report on Form 10-Q filed on April 21, 2016 as Exhibit 10.2. | ||
| 10.30 | Amendment to Collaboration Agreement between Universal Biosensors Pty Ltd and Siemens Healthcare Diagnostics Inc. dated March 9, 2016 | Incorporated by reference to our Current Report on Form 8-K filed on March, 2016 as Exhibit 99.1. | ||
| 14.0 | Code of Ethics. | Incorporated by reference to our Annual Report on Form 10-K filed on March 28, 2008 as Exhibit 14.0. | ||
| 21.0 | List of Subsidiaries. | Filed herewith. | ||
| 24.0 | Power of Attorney. | Included on signature page. | ||
| 31.1 | Certification of Principal Executive Officer pursuant to Section 302 of the Sarbanes-Oxley Act. | Filed herewith. | ||
| 31.2 | Certification of Principal Financial Officer pursuant to Section 302 of the Sarbanes-Oxley Act. | Filed herewith. | ||
52
Table of Contents
| 32.0 | Certification of Principal Executive Officer and Principal Financial Officer pursuant to Section 906 of the Sarbanes-Oxley Act. | Filed herewith. | ||
| 101 | The following materials from the Universal Biosensors, Inc. Annual Report on Form 10-K for the financial year ended December 31, 2016 formatted in Extensible Business Reporting Language (XBRL): (i) the Consolidated Condensed Balance Sheets, (ii) the Consolidated Condensed Statements of Comprehensive Income, (iii) the Consolidated Condensed Statements of Changes in Stockholder’s Equity, (iv) the Consolidated Condensed Statements of Cash Flows and (v) the Notes to Consolidated Condensed Financial Statements. | As provided in Rule 406T of Regulation S-T, this information is furnished herewith and not filed for purposes of Sections 11 and 12 of the Securities Act of 1933 and Section 18 of the Securities Exchange Act of 1934. | ||
53
Table of Contents
Universal Biosensors, Inc.
2016 Annual Report
Unless otherwise noted, references on this Annual Report to “Universal Biosensors”, the “Company,” “Group,” “we,” “our” or “us” means Universal Biosensors, Inc. (“UBI”) a Delaware corporation and, when applicable, its wholly owned Australian operating subsidiary, Universal Biosensors Pty Ltd (“UBS”), and UBS’ wholly owned Canadian operating subsidiary, Hemostasis Reference Laboratory Inc. (“HRL”).
F-1
Table of Contents
Management’s Discussion and Analysis of Financial Condition and Results of Operations
Universal Biosensors, Inc.
The following discussion and analysis of our financial condition and results of operations should be read in conjunction with our financial statements and related notes that appear elsewhere in this Annual Report. In addition to historical financial information, the following discussion contains forward-looking statements that reflect our plans, estimates and beliefs and other forward-looking information, including the types of forward looking statements described in our Form 10-K. Our (and our customer’s, partners’ and industry’s) actual results, levels of activity, performance or achievements may differ materially from those discussed in the forward-looking statements below and elsewhere in our Form 10-K. Factors that could cause or contribute to these differences include those discussed below and elsewhere in our Form 10-K, particularly in “Risk Factors.”
Our Business
We are a specialist medical diagnostics company focused on the research, development and manufacture of in vitro diagnostic test devices for consumer and professional point-of-care use. Key aspects of our strategy for increasing shareholder value include:
| • | manufacturing products (test strips and analyzers) for our customers and future partners as required; |
| • | undertaking research and development work for our customers and partners; |
| • | providing support services to our customers and partners; |
| • | extending our electrochemical cell technology and demonstrating the broader application of our technology platform for markets with significant commercial potential; |
| • | seeking to enter into collaborative, strategic or distribution arrangements with other life sciences companies or other industry participants with respect to the development and commercialization of specific tests or specific fields. |
Our plan of operations over the remainder of the fiscal year ending December 2017 is to:
| • | manufacture products; |
| • | undertake research and development work; |
| • | provide the necessary post-market support for our customers and partners; |
| • | demonstrate the broader application of our technology platform for markets with significant commercial potential, focusing initially on enzymatic, immunoassay and molecular diagnostic point-of-care tests; and |
| • | seek to enter into collaborative, strategic or distribution arrangements with other life sciences companies or other industry participants with respect to the development and commercialization of specific tests or specific fields. |
We were incorporated in the State of Delaware on September 14, 2001 and our shares of common stock in the form of CHESS Depositary Interests (“CDIs”) have been quoted on the Australian Securities Exchange (“ASX”) since December 13, 2006. Our securities are not currently traded on any other public market. Our wholly owned subsidiary and primary operating vehicle, UBS was incorporated as a proprietary limited company in Australia on September 21, 2001. UBS conducts our primary research, development and manufacturing activities in Melbourne, Australia. A subsidiary of UBS, Hemostasis Reference Laboratory Inc. (“HRL”) was incorporated in British Columbia, Canada on November 30, 2016. On December 16, 2016, HRL acquired the assets of the Hemostasis Reference Laboratory business from LifeLabs, Inc. HRL conducts coagulation testing and calibration services for products we manufacture as well as for other international customers in Hamilton, Canada.
We have rights to an extensive patent portfolio, with certain patents owned by UBS and a number licensed to UBS by LifeScan and other third party licensors. Unless otherwise noted, references to “LifeScan” in this document are references collectively or individually to LifeScan, Inc., and/or LifeScan Europe, a division of Cilag GmbH International, both affiliates of Johnson and Johnson.
We are using our electrochemical cell technology platform to develop point-of-care testing systems for a number of different markets. Our current focus is as set out below:
| • | Coagulation testing market – we are working with Siemens Healthcare Diagnostics, Inc. (“Siemens”) in relation to a range of products for the point-of-care coagulation testing market, pursuant to a Collaboration Agreement with Siemens (“Collaboration Agreement”). The first such product developed with Siemens, the Xprecia Stride™ Coagulation Analyzer, |
F-2
Table of Contents
Management’s Discussion and Analysis of Financial Condition and Results of Operations
Universal Biosensors, Inc.
| received CE mark approval on December 9, 2014 and US Food and Drug Administration (“FDA”) approval on October 4, 2016. The Xprecia Stride™ Coagulation Analyzer is now available in Europe, the Middle East, Africa, Asia Pacific, Latin America and Canada. Under the terms of a supply agreement with Siemens (“Supply Agreement”), UBS is the manufacturer of test strips for this product and two further tests still in development for Siemens. |
| • | Blood glucose – we provide services to LifeScan as required from time to time, pursuant to a Master Services and Supply Agreement (“Master Services and Supply Agreement”) and a development and research agreement (“Development and Research Agreement”) with LifeScan. |
| • | Other electrochemical-cell based tests – we are working on demonstrating the broader application of our technology platform. We may seek to enter into collaborative arrangements, strategic alliances or distribution agreements with respect to any products or technologies arising from this work. |
Results of Operations
Analysis of Consolidated Revenue
Strong sales of the OneTouch Verio® strips have resulted in our total revenue increasing over the past three years. Revenue from the sales of the OneTouch Verio® strips is recorded under the caption “Revenue from Services”.
Our total revenue during the 2016 financial year increased by 12% to A$18,830,817 compared to the 2015 financial year. Our 2015 total revenues increased by 76% to A$16,774,978 compared to the 2014 financial year.
Revenue from Products
The financial results of the PT-INR test strips we manufactured on behalf of Siemens during the respective periods are as follows:
| Years Ended December 31, | ||||||||||||
| 2016 | 2015 | 2014 | ||||||||||
| A$ | A$ | A$ | ||||||||||
| Revenue from products |
584,550 | 1,323,564 | 215,486 | |||||||||
| Cost of goods sold |
(996,788 | ) | (1,136,143 | ) | (313,374 | ) | ||||||
|
|
|
|
|
|
|
|||||||
| (412,238 | ) | 187,421 | (97,888 | ) | ||||||||
|
|
|
|
|
|
|
|||||||
| Gross margin |
-71 | % | 14 | % | -45 | % | ||||||
We commenced manufacture of the PT-INR test strips on behalf of Siemens during the third quarter of 2014. The movement in revenues is primarily volume driven. The revenues from the manufacture and sale of PT-INR strips to Siemens were initially low as Siemens were undertaking a limited marketing release of the product in Europe. The increase in revenues in 2015 was as a result of the full commercial launch by Siemens of the Xprecia StrideTM Coagulation Analyzer in Europe after successful completion of its limited release. There was a decline in revenue from Siemens in 2016 as they continued to sell inventory purchased from us in 2015. The production margin from the sale of our PT-INR strips is low and volatile, reflecting early stage production. This trend is also representative of a new product entrant within our industry. The sales program for Xprecia Stride™ is expected to expand in the 2017 financial year.
Revenue from Services
We provide various services to our customers and partners. The revenue is grouped into the following categories:
| • | Product enhancement – a quarterly service fee based on the number of strips sold by LifeScan which falls within a valid claim of certain LifeScan patents is payable to us as an ongoing reward for our services and efforts to enhance the product; |
| • | Contract research and development – we undertake contract research and development on behalf of our customers and partners; |
| • | Other services – ad-hoc services provided on an agreed basis according to our customers and partners requirements. |
F-3
Table of Contents
Management’s Discussion and Analysis of Financial Condition and Results of Operations
Universal Biosensors, Inc.
There are different arrangements for each service being provided. The net margin during the respective periods in relation to the provision of services is as follows:
| Years Ended December 31, | ||||||||||||
| 2016 | 2015 | 2014 | ||||||||||
| A$ | A$ | A$ | ||||||||||
| Revenue from services: |
||||||||||||
| Quarterly service fee |
17,850,001 | 12,828,861 | 6,448,033 | |||||||||
| Contract research and development |
0 | 1,955,340 | 1,750,486 | |||||||||
| Other services |
396,266 | 667,213 | 1,115,679 | |||||||||
|
|
|
|
|
|
|
|||||||
| 18,246,267 | 15,451,414 | 9,314,198 | ||||||||||
| Cost of services |
(154,998 | ) | (244,073 | ) | (242,453 | ) | ||||||
|
|
|
|
|
|
|
|||||||
| Net margin |
18,091,269 | 15,207,341 | 9,071,745 | |||||||||
|
|
|
|
|
|
|
|||||||
Quarterly service fee - The quarterly service fee from LifeScan increased by 39% during the 2016 financial year compared to the 2015 financial year and by 99% during the 2015 financial year when compared to the 2014 financial year, reflecting ongoing market penetration and growth.
The quarterly service fee for each quarter in a LifeScan financial year is calculated based on the number of OneTouch Verio® blood glucose test strips sold in such LifeScan financial year as follows: US$0.0125 per strip for the first 500 million strips sold in a financial year and US$0.0075 per strip for sales in excess of 500 million strips in such financial year. The 2015 financial year was the first year wherein the volume of OneTouch Verio® blood glucose test strips sold exceeded 500 million strips. Quarterly service fees are reported and paid by LifeScan in USD. Accordingly, revenues recognized by us from quarterly services fees paid by LifeScan were impacted by the movement of the AUD against the USD over the periods covered above. In the years ended December 31, 2016 and 2015, revenue from quarterly service fees were up 40% and 31%, respectively due to depreciation of AUD against USD.
LifeScan has the ability to buy out, or “convert,” its obligation to pay quarterly service fees to us in certain situations set out in the Master Services and Supply Agreement. At any time after the end of the quarter following receipt by us of an aggregate of US$45 million in quarterly service fees, LifeScan has the option to give notice of its election to convert its obligation to continue paying the quarterly service fees. In the event LifeScan delivers notice of conversion, LifeScan will remain obligated to pay the quarterly service fees for the remainder of LifeScan’s financial year in which the notice was given, and, after the end of that financial year, LifeScan must pay us a one-time lump sum fee to buy out its obligation to pay future quarterly service fees. The amount of this one-time lump sum service fee is calculated by multiplying the sum of all quarterly service fees for the LifeScan financial year in which notice of conversion is given, by the applicable multiplier for such financial year as set forth in the Master Services and Supply Agreement. If LifeScan gives notice of conversion during LifeScan’s 2017 financial year, the applicable multiplier is 2.2, and if LifeScan gives notice of conversion during LifeScan’s 2018 financial year or any subsequent LifeScan financial year, the applicable multiplier is 2.0. As of December 31, 2016, we had received aggregate quarterly service fees of US$31.6 million. The amount of the quarterly service fee for the quarter ended December 31, 2016 is US$3.1 million, which amount had not yet been paid as of December 31, 2016.
By way of illustration only:
| • | If the aggregate quarterly service fees received by us from LifeScan first exceed US$45 million in the second quarter of LifeScan’s 2017 financial year, then the earliest LifeScan could deliver notice of conversion to us is the third quarter of LifeScan’s 2017 financial year, and if LifeScan sells 2 billion strips in LifeScan’s 2017 financial year, then: |
| • | the total 2017 financial year quarterly service fees payable by LifeScan to us would equal US$17.5 million – i.e., 500,000,000*US$0.0125 + 1,500,000,000*US$0.0075; and |
F-4
Table of Contents
Management’s Discussion and Analysis of Financial Condition and Results of Operations
Universal Biosensors, Inc.
| • | the one-time lump sum fee that would be payable to us after the end of LifeScan’s 2017 financial year would equal US$38.5 million – i.e., US$17.5 million multiplied by 2.2; and |
| • | If the aggregate quarterly service fees received by us from LifeScan first exceed US$45 million in the fourth quarter of LifeScan’s 2017 financial year, then the earliest LifeScan could deliver notice of conversion to us is the first quarter of LifeScan’s 2018 financial year, and if LifeScan sells 2 billion strips in LifeScan’s 2018 financial year, then: |
| • | the total 2018 financial year quarterly service fees payable to us would equal US$17.5 million – i.e., 500,000,000*US$0.0125 + 1,500,000,000*US$0.0075; and |
| • | the one-time lump sum fee that would be payable to us after the end of LifeScan’s 2018 financial year would equal US$35.0 million – i.e., US$17.5 million multiplied by 2.0. |
The above scenarios and calculations are an illustration only intended to provide an example of how the conversion option would operate, and there can be no assurance as to when, if ever, we will have received an aggregate of US$45 million in quarterly service fees from LifeScan, or as to the number of OneTouch Verio® strips that LifeScan may sell in any financial year, or as to when, if ever, LifeScan will exercise its conversion option.
LifeScan’s obligation to pay quarterly service fees will also terminate if LifeScan terminates the Master Services and Supply Agreement for our uncured material breach, in the event of a change of control of our company, or for certain regulatory reasons.
Contract research and development - The nature and scope of contract research and development is determined by our customers and partners based upon their requirements and therefore our revenues and margins tend to fluctuate. We did not generate any revenue from contract research and development during 2016. Revenue from contract research and development related to services provided to Siemens during 2014 and 2015 were as follows:
| • | In December 2014, the Company delivered on its third milestone under the Collaboration Agreement with Siemens when it completed the development work of the Xprecia Stride™ Coagulation Analyzer and the product was launched by Siemens in Europe. Of the total amount of A$1,750,486 (equivalent to US$1,428,571) recognized as revenue from services in 2014 for this milestone, A$1,225,340 (equivalent to US$1.0 million) relates to the achievement of the milestone whilst the balance relates to a portion of the deferred US$3 million up-front payment allocated to these milestones. |
| • | In July 2015, the Company delivered on its fourth milestone when Siemens made a premarket 510(k) submission to the FDA for regulatory clearance to sell the Xprecia Stride™ Coagulation System in the US. Of the total amount of A$1,955,340 (equivalent to US$1,428,571) recognized as revenue from services in 2015 for this milestone, A$1,368,738 (equivalent to US$1,000,000) relates to the achievement of the milestone whilst the balance relates to a portion of the deferred US$3 million up-front payment allocated to these milestones. |
Other services - We generated revenues principally from Siemens based on work undertaken for them.
Contribution from Products & Services
The net contribution from our products and services is as follows:
| Years Ended December 31, | ||||||||||||
| 2016 | 2015 | 2014 | ||||||||||
| A$ | A$ | A$ | ||||||||||
| Quarterly service fees |
17,850,001 | 12,828,861 | 6,448,033 | |||||||||
| Manufacturing contribution |
(412,238 | ) | 187,421 | (97,888 | ) | |||||||
| Milestone payments |
0 | 1,955,340 | 1,750,486 | |||||||||
| Other services |
241,268 | 423,140 | 873,226 | |||||||||
|
|
|
|
|
|
|
|||||||
| Contribution from products & services |
17,679,031 | 15,394,762 | 8,973,857 | |||||||||
|
|
|
|
|
|
|
|||||||
The increase in period-to-period total contributions from products and services reflected in the table above is primarily represented by the growth in the quarterly service fee which has a 100% margin. The manufacturing contribution for financial
F-5
Table of Contents
Management’s Discussion and Analysis of Financial Condition and Results of Operations
Universal Biosensors, Inc.
years 2014 to 2016 represents sale of our PT-INR strips the production margin for which is low and volatile, reflecting early stage production. The third and the fourth Siemens milestones were delivered by us in December 2014 and July 2015, respectively. There were no milestones delivered by us in 2016. Contribution from other services fluctuated over the period due to our partners R&D services requirements.
The Australian consumer price index rose 1.5% over the twelve months to the December quarter 2016 and it did not have a material impact on our net sales, revenue and income.
Research and Development Expenses
Research and development expenses are related to the development of new technologies and products based on the electrochemical cell platform.
The Company conducts research and development activities to build an expanding portfolio of product-based revenues and cash flows and increase the value of UBI’s core technology assets. Research is focused on demonstrating technical feasibility of new technology applications. Development activity is focused on turning these technology platforms into commercial-ready product and represents the majority of the Company’s research and development expenses.
Research and development expenses consist of costs associated with research activities, as well as costs associated with our product development efforts, including pilot manufacturing costs. Research and development expenses include:
| • | consultant and employee related expenses, which include consulting fees, salaries and benefits; |
| • | materials and consumables acquired for the research and development activities; |
| • | external research and development expenses incurred under agreements with third party organizations and universities; and |
| • | facilities, depreciation and other allocated expenses, which include direct and allocated expenses for rent and maintenance of facilities, depreciation of leasehold improvements and equipment and laboratory and other supplies. |
Our principal research and development activities can be described as follows:
(a) Blood coagulation testing
In September 2011 we entered into a Collaboration Agreement with Siemens which was amended in September 2012 and March 2016, pursuant to which we will develop a range of test strips and reader products for the hospital point-of-care and alternative site coagulation testing markets. The first such product developed with Siemens, the Xprecia Stride™ Coagulation Analyzer, received CE mark approval on December 9, 2014 and US Food and Drug Administration (“FDA”) approval on October 4, 2016. The Xprecia Stride™ Coagulation Analyzer is now available in Europe, the Middle East, Africa, Asia Pacific, Latin America and Canada. In 2012, we entered into a Supply Agreement with Siemens under which we manufacture and supply the test strips for this product and will manufacture and supply the test strips for two further tests still in development with Siemens.
(b) DNA/RNA
We have undertaken some early stage feasibility work assessing the possibility of using DNA binding chemistries to build a low-cost test for DNA, RNA and as a possible alternative method for improving the sensitivity of protein assays. This concept work is at an early stage and may not yield any positive results. To enable us to access certain molecular diagnostic technology, we entered into a license with SpeeDx Pty Ltd (“SpeeDx”). SpeeDx is an Australian technology company focused on the development of catalytic nucleic acid enzymes for medical diagnostics and other applications.
F-6
Table of Contents
Management’s Discussion and Analysis of Financial Condition and Results of Operations
Universal Biosensors, Inc.
Research and development expenses for the respective periods are as follows:
| Years Ended December 31, | ||||||||||||
| 2016 | 2015 | 2014 | ||||||||||
| A$ | A$ | A$ | ||||||||||
| Research |
1,230,652 | 1,296,396 | 1,194,323 | |||||||||
| Development |
13,756,810 | 17,824,446 | 15,421,728 | |||||||||
|
|
|
|
|
|
|
|||||||
| Research and development expenses |
14,987,462 | 19,120,842 | 16,616,051 | |||||||||
|
|
|
|
|
|
|
|||||||
Depending on the scope of research and development activities we undertake and the stages of development of each of these activities, our research and development expenditure will fluctuate.
In converting an idea or a concept into a commercial product, a number of development stages are required. As an idea or concept is developed into a commercial-ready product, technical risk reduces, but the effort and cost expended increases. In our research and development program, the first phase is conducting exploratory research and feasibility studies. In this phase, the idea is investigated by a small focused team to establish the viability of the concept as the base for a product. Once this hurdle has been passed, the project enters the development phases, which include building prototype strips and instruments, finalizing the product design, carrying out extensive testing, creating the required documentation and developing or validating the product manufacturing processes. This requires a larger group of people and a higher use of materials compared to the research phase, so is typically more expensive, but necessary to be able to commercialize a product.
Research and development expenditure decreased by 22% during 2016 compared to 2015 and increased by 15% during 2015 compared to 2014. During these three years, our research and development activities were primarily focused around the blood coagulation platform. The increase in 2015 principally reflects the effort required to complete the latter stages of the development phase prior to launch of the various Siemens tests we are developing including our own PT-INR test for use in decentralized settings. In April 2016, we put the development of our own PT-INR self-testing device on hold in response to proposed regulatory changes and market factors which resulted in a decline in the level of our research and development expenditure spend in 2016.
Research and development expenses, net of the research and development tax incentive income for the respective periods are as follows:
| Years Ended December 31, | ||||||||||||
| 2016 | 2015 | 2014 | ||||||||||
| A$ | A$ | A$ | ||||||||||
| Research and development expenses |
14,987,462 | 19,120,842 | 16,616,051 | |||||||||
| Research and development tax incentive income |
(7,562,172 | ) | (9,224,349 | ) | (9,935,083 | ) | ||||||
|
|
|
|
|
|
|
|||||||
| 7,425,290 | 9,896,493 | 6,680,968 | ||||||||||
|
|
|
|
|
|
|
|||||||
Included in the research and development tax incentive income for the 2014, 2015 and 2016 financial years is an amount of A$1,735,083, A$24,349 and A$162,172, respectively which relates to research and development tax incentive income the Company received from the Australian Government for the years ended December 31, 2013, 2014 and 2015 following a change in the original estimate. We expect to receive A$7,400,000 as research and development tax incentive income for the 2016 financial year.
The non-cash components of depreciation and share based payments expense included in the research and development expenditure are as follows:
| Years Ended December 31, | ||||||||||||
| 2016 | 2015 | 2014 | ||||||||||
| A$ | A$ | A$ | ||||||||||
| Depreciation |
2,308,667 | 2,349,502 | 2,296,374 | |||||||||
| Share based payments |
(996,802 | ) | (48,750 | ) | (461,824 | ) | ||||||
|
|
|
|
|
|
|
|||||||
| 1,311,865 | 2,300,752 | 1,834,550 | ||||||||||
|
|
|
|
|
|
|
|||||||
The negative values in share based payments are as a result of reversal of expense due to forefeiture of the options which had not vested for departing employees.
F-7
Table of Contents
Management’s Discussion and Analysis of Financial Condition and Results of Operations
Universal Biosensors, Inc.
While we have a degree of control as to how much we spend on research and development activities in the future, we cannot predict what it will cost to complete our individual research and development programs successfully or when or if they will be commercialized. The timing and cost of any program is dependent upon achieving technical objectives, which are inherently uncertain.
In addition, our business strategy contemplates that we may enter into collaborative arrangements with third parties for one or more of our non-blood glucose programs. In the event that we are successful in securing such third party collaborative arrangements, the third party may direct the research and development activities and may contribute towards all or part of the cost of these activities, both of which will influence our research and development expenditure. Research and development activities undertaken on behalf of our customers and partners were A$7,125,162, A$9,014,377 and A$9,971,035, respectively for 2016, 2015 and 2014.
General and Administrative Expenses
General and administrative expenses currently consist principally of salaries and related costs, including stock option expense, for personnel in executive, business development, finance, accounting, information technology and human resources functions. Other general and administrative expenses include depreciation, repairs and maintenance, insurance, facility costs not otherwise included in research and development expenses, consultancy fees and professional fees for legal, audit and accounting services. General and administrative expenses are generally fixed in nature.
General and administrative expenses for the respective periods are as follows:
| Years Ended December 31, | ||||||||||||
| 2016 | 2015 | 2014 | ||||||||||
| A$ | A$ | A$ | ||||||||||
| General and administrative expenses |
6,414,855 | 6,670,768 | 6,143,748 | |||||||||
|
|
|
|
|
|
|
|||||||
General and administrative expenses decreased by 4% during 2016 compared to 2015 and increased by 9% during 2015 compared to 2014. Decrease in general and administrative expenses occurred as a result of reversal of options for departing employees and also reflect management’s ongoing efforts to restrict spending on non-core activities. Increase in general and administrative expenses during 2015 was primarily driven by increase in employee emoluments noting that shares and options, being non-cash costs, were issued to employees twice during the 2015 financial year. Shares and options issued in the first quarter of 2015 were however for the 2014 financial year.
The non-cash components of depreciation and share based payments expense included in the general and administrative expenditure are as follows:
| Years Ended December 31, | ||||||||||||
| 2016 | 2015 | 2014 | ||||||||||
| A$ | A$ | A$ | ||||||||||
| Depreciation |
125,309 | 126,438 | 124,093 | |||||||||
| Share based payments |
(321,007 | ) | (16,182 | ) | (166,044 | ) | ||||||
|
|
|
|
|
|
|
|||||||
| (195,698 | ) | 110,256 | (41,951 | ) | ||||||||
|
|
|
|
|
|
|
|||||||
The negative values in share based payments are as a result of reversal of expense due to forfeiture of the options which had not vested for departing employees.
Interest Income
Interest income decreased by 17% during 2016 compared to 2015 and decreased by 7% during 2015 compared to 2014. The decrease in interest income is generally attributable to the lower amount of funds available for investment in Australian currency and lower interest rates on offer. As at December 31, 2016, 74% (2015: 98% and 2014: 93%) of our funds were held in US denominated currency which currently does not produce any investment interest.
F-8
Table of Contents
Management’s Discussion and Analysis of Financial Condition and Results of Operations
Universal Biosensors, Inc.
| Years Ended December 31, | ||||||||||||
| 2016 | 2015 | 2014 | ||||||||||
| A$ | A$ | A$ | ||||||||||
| Interest income |
201,096 | 242,574 | 260,904 | |||||||||
|
|
|
|
|
|
|
|||||||
Interest Expense
Interest expense predominantly relates to interest being charged on a short-term borrowing initiated by the Company each year. These short-term loans are taken out every year to fund our insurance premiums and are repaid during the financial year. Decrease in interest expense is in line with the interest rate charged to us every year. The interest rates were 2.60%, 2.84% and 2.88% for the financial years 2016, 2015 and 2014, respectively.
| Years Ended December 31, | ||||||||||||
| 2016 | 2015 | 2014 | ||||||||||
| A$ | A$ | A$ | ||||||||||
| Interest expense |
8,436 | 15,106 | 15,905 | |||||||||
|
|
|
|
|
|
|
|||||||
Financing Costs
In December 2013, UBS accessed new capital via a US$25,000,000 loan facility of which US$15,000,000 was drawn in December 2013. The breakdown of the financing costs is as follows:
| Years Ended December 31, | ||||||||||||
| 2016 | 2015 | 2014 | ||||||||||
| A$ | A$ | A$ | ||||||||||
| Interest expense |
2,370,860 | 2,358,016 | 1,962,740 | |||||||||
| Other debt issuance costs |
523,440 | 950,052 | 683,352 | |||||||||
|
|
|
|
|
|
|
|||||||
| 2,894,300 | 3,308,068 | 2,646,092 | ||||||||||
|
|
|
|
|
|
|
|||||||
Interest expense relates to applicable interest of 10.5% levied on the loan. The debt issuance costs were recorded as deferred issuance costs and are amortized as interest expense, using the effective interest method, over the term of the loan. Increase in financing costs in 2015 when compared to 2014 are as a result of the costs incurred during the first quarter of 2015 in extending UBI’s option to draw down a further US$10 million until July 31, 2015. This has been recorded as “Other debt issuance costs” and includes a one-time fee of US$200,000 and a commitment fee of 2% of the unused borrowing commitment under the Credit Agreement. The commitment fee ceased to be charged as at July 31, 2015. As the loan is denominated in USD, interest expense and other charges relating to the loan are subject to variation with movements in exchange rates. In the years ended December 31, 2016 and 2015, the year-over-year foreign currency movements relative to the AUD dollar would have had a favourable impact (exclusive of hedging impact) on our reported results of A$408,135 and A$400,655, respectively.
Patent Fees
We have an obligation to pay 50% of the patent fees in respect of the patents we license from LifeScan which were paid by LifeScan prior to the date of the first commercial sale of a non-glucose product that falls under the licensed patents and 50% of the patent fees incurred by LifeScan in respect of such patents thereafter. This obligation was triggered with the first commercial sale of the Xprecia StrideTM Coagulation Analyzer by Siemens in December 2014. An amount of US$1.75 million was initially accrued in December 2014. However, the Company and LifeScan subsequently agreed to revise this amount to US$517,831 (equivalent to A$708,775) during the fourth quarter of 2015. The repayment of this amount to LifeScan, which commenced in November 2015, is being made over a 24 month period in equal monthly installments. The reimbursement of patent fees payable to LifeScan have been recorded as “Other liability” in consolidated balance sheets. As a result of the revision of the amount due to LifeScan, this resulted in reversal of the patent fees in 2014. This amount has been recorded as “Patent Fees” in the consolidated statements of comprehensive income.
F-9
Table of Contents
Management’s Discussion and Analysis of Financial Condition and Results of Operations
Universal Biosensors, Inc.
Marketing Support Payment
During 2009, LifeScan chose not to proceed with the registration of the then current product but to proceed with an enhanced product, called OneTouch Verio®, and acknowledged that there would be a delay as a result. As a result of this change, LifeScan agreed to pay additional amounts per strip manufactured by us in 2010 and 2011 up to a specified volume limit (“manufacturing initiation payments”). At the same time, we agreed to pay LifeScan a marketing support payment in each of the two years following the first year in which 1 billion strips are sold by LifeScan equal to 40% of the total manufacturing initiation payments made. LifeScan sold just over 900 million strips in the 2015 financial year. Management concluded that this loss contingency be accrued in 2015 as “Other liability” in the consolidated balance sheets as it is both probable and the amount can be reliably estimated. LifeScan has sold over a billion strips during the 2016 financial year. The total amount of marketing support payments to be paid to LifeScan is US$2,048,602 (equivalent to A$2,804,000).
Other
Recorded under this caption are research and development tax incentive income and foreign exchange movements.
The Company had recorded research and development tax incentive income of A$6,279,954 for 2013 but received an amount of $8,015,037 as research and tax development incentive income in September 2014. Of the A$9,935,083 research and development tax incentive recorded for the year ended December 31, 2014, A$1,735,083 relate to research and development tax incentive income the Company received from the Australian Government for the year ended December 31, 2013 following a change in original estimate. Similarly, included in the 2015 and 2016 research and development tax incentive income are amounts of A$24,349 and A$162,172, respectively which relates to prior years change in estimate of the research and development tax incentive income. The Company expects to receive and has recorded research and development tax incentive income of A$7,400,000 for 2016 in “Other current assets”. The remaining balance after the research and development tax incentive income for all years under this caption is primarily represented by foreign exchange movements arising from the settlement of foreign denominated transactions and from the translation at period-end exchange rates of monetary assets and liabilities denominated in foreign currencies.
The research and development tax incentive receivable has been recorded as “Other current assets” in the consolidated balance sheets.
The research and development tax incentive is one of the key elements of the Australian Government’s support for Australia’s innovation system. It was developed to assist businesses recover some of the costs of undertaking research and development. The research and development tax incentive provides a tax offset to eligible companies that engage in research and development activities.
Companies engaged in research and development may be eligible for either:
| • | a 45% refundable tax offset for entities with an aggregated turnover of less than A$20 million per annum, (the legislative rate for the tax year commencing July, 1 2016 will be reduced to 43.5%), or |
| • | a 40% non-refundable tax offset for all other entities (the legislative rate for the tax year commencing July, 1 2016 will be reduced to 38.5%). |
Critical Accounting Estimates and Judgments
Our consolidated financial statements are prepared in accordance with accounting principles generally accepted in the United States of America (“U.S. GAAP”). The preparation of these consolidated financial statements requires us to make estimates and assumptions that affect the reported amounts of assets, liabilities, income, costs and expenses, and related disclosures. We evaluate our estimates and assumptions on an ongoing basis. Our actual results may differ from these estimates.
We believe that of our significant accounting policies, which are described in the notes to our consolidated financial statements, the following accounting policies involve a greater degree of judgment and complexity. Accordingly, we believe that the following accounting policies are the most critical to aid in fully understanding and evaluating our consolidated financial condition and results of operations.
F-10
Table of Contents
Management’s Discussion and Analysis of Financial Condition and Results of Operations
Universal Biosensors, Inc.
(a) Revenue Recognition
The Company recognizes revenue when persuasive evidence of an arrangement exists, delivery has occurred, the sales price is fixed or determinable, and collection is reasonably assured. Product is considered delivered to the customer once it has been shipped and title and risk of loss have been transferred.
In addition, the Company enters into arrangements, which contain multiple revenue generating activities. The revenue for these arrangements is recognized as each activity is performed or delivered, based on the relative fair value and the allocation of revenue to all deliverables based on their relative selling price. In such circumstances, the Company uses a hierarchy to determine the selling price to be used for allocation of revenue to deliverables, vendor-specific objective evidence, third-party evidence of selling price and the Company’s best estimate of selling price. The Company’s process for determining its best estimate of selling price for deliverables without vendor-specific objective evidence or third-party evidence of selling price involves management’s judgment. The Company’s process considers multiple factors that may vary depending upon the unique facts and circumstances related to each deliverable.
(b) Stock-Based Compensation
We account for stock-based employee compensation arrangements using the modified prospective method as prescribed in accordance with the provisions of ASC 718 – Compensation – Stock Compensation.
Each of the inputs to the Trinomial Lattice model is discussed below.
Share Price and Exercise Price at Valuation Date
With the exception of Zero Exercise Price Employee Options (“ZEPOs”), the exercise price of the options granted has been determined using the closing price of our common stock trading in the form of CDIs on ASX at the time of grant of the options. The exercise price of ZEPOs is nil. The ASX is the only exchange upon which our securities are quoted.
Volatility
We applied volatility having regard to the historical price change of our shares in the form of CDIs available from the ASX.
Time to Expiry
All options granted under our share option plan have a maximum 10 year term and are non-transferable.
Risk Free Rate
The risk free rate which we applied is equivalent to the yield on an Australian government bond with a time to expiry approximately equal to the expected time to expiry on the options being valued.
(c) Income Taxes
We apply ASC 740 – Income Taxes which establishes financial accounting and reporting standards for the effects of income taxes that result from a company’s activities during the current and preceding years. Deferred tax assets and liabilities are recognized for the future tax consequences attributable to differences between the financial statement carrying amounts of existing assets and liabilities and their respective tax bases and operating loss and tax credit carry forwards. Deferred tax assets and liabilities are measured using enacted tax rates expected to apply to taxable income in the years in which those temporary differences are expected to be recovered or settled. The effect on deferred tax assets and liabilities of a change in tax rates is recognized in income in the period that includes the enactment date.
Where it is more likely than not that some portion or all of the deferred tax assets will not be realized the deferred tax assets are reduced by a valuation allowance. The valuation allowance is sufficient to reduce the deferred tax assets to the amount that is more likely than not to be realized.
F-11
Table of Contents
Management’s Discussion and Analysis of Financial Condition and Results of Operations
Universal Biosensors, Inc.
(d) Impairment of Long-Lived Assets
We review our capital assets for impairment whenever events or changes in business circumstances indicate that the carrying amount of the assets may not be fully recoverable. In performing the review, we estimate undiscounted cash flows from products under development that are covered by these patents and licenses. An impairment loss would be recognized when estimated undiscounted future cash flows expected to result from the use of the asset and its eventual disposition is less than the carrying amount of the asset. If the evaluation indicates that the carrying value of an asset is not recoverable from its undiscounted cash flows, an impairment loss is measured by comparing the carrying value of the asset to its fair value, based on discounted cash flows.
(e) Warrants
In connection with our US$15 million loan facility, we issued to the Lenders warrants entitling the holder to purchase up to an aggregate total of 4.5 million shares of UBI’s common stock in the form of CDIs at a price of A$1.00 per share. The fair value of the warrants to purchase common stock is estimated using the Trinomial Lattice model. Each of the inputs to the Trinomial Lattice model is discussed below.
Exercise Price at Valuation Date
The exercise price of the warrants has been determined as stated in the Credit Agreement. For further details, see Notes to Consolidated Financial Statements – Note 16, Summary of Significant Accounting Policies – Borrowings – Athyrium Credit Agreement.
Volatility
We applied volatility having regard to the historical price change of our shares in the form of CDIs available from the ASX.
Time to Expiry
The warrants have a term of seven years.
Risk Free Rate
The risk free rate which we applied is equivalent to the yield on an Australian government bond with a time to expiry approximately equal to the expected time to expiry on the warrants to purchase common stock being valued.
(f) Research and development tax incentive income
Research and development tax incentive income is recognized when there is reasonable assurance that the income will be received, the relevant expenditure has been incurred, and the consideration can be reliably measured. The research and development tax incentive is one of the key elements of the Australian Government’s support for Australia’s innovation system and is supported by legislative law primarily in the form of the Australian Income Tax Assessment Act 1997 as long as eligibility criteria are met.
Management has assessed the Company’s research and development activities and expenditures to determine which activities and expenditures are likely to be eligible under the tax incentive regime described above. At each period end management estimates the refundable tax offset available to the Company based on available information at the time. This estimate is also reviewed by external tax advisors on an annual basis.
F-12
Table of Contents
Management’s Discussion and Analysis of Financial Condition and Results of Operations
Universal Biosensors, Inc.
Financial Condition, Liquidity and Capital Resources
Net Financial Assets/(Liabilities)
Our net financial assets/(liabilities) position is shown below:
| Years Ended December 31, | ||||||||||||
| 2016 | 2015 | 2014 | ||||||||||
| A$ | A$ | A$ | ||||||||||
| Financial assets: |
||||||||||||
| Cash and cash equivalents |
20,402,322 | 14,350,307 | 16,329,829 | |||||||||
| Accounts receivables |
4,848,009 | 3,153,584 | 3,799,705 | |||||||||
|
|
|
|
|
|
|
|||||||
| Total financial assets |
25,250,331 | 17,503,891 | 20,129,534 | |||||||||
|
|
|
|
|
|
|
|||||||
| Debt: |
||||||||||||
| Short term borrowings |
369,630 | 324,459 | 498,890 | |||||||||
| Long term secured loan |
20,286,827 | 19,868,560 | 17,499,194 | |||||||||
|
|
|
|
|
|
|
|||||||
| Total debt |
20,656,457 | 20,193,019 | 17,998,084 | |||||||||
|
|
|
|
|
|
|
|||||||
| Net financial assets/(liabilities) |
4,593,874 | (2,689,128 | ) | 2,131,450 | ||||||||
|
|
|
|
|
|
|
|||||||
Since inception, we have financed our business primarily through the issuance of equity securities, funding from strategic partners, government grants and rebates (including the research and development tax incentive income), cash flows generated from operations, and the loan discussed below.
On December 19, 2013 we entered into the Credit Agreement which was subsequently amended in January 2015 with Lenders for a US$25 million secured term loan. The term loan has a maturity date of December 19, 2018 and bears interest at 10.5% per annum. Interest payments are due quarterly over the five-year term of the term loan and, other than as described elsewhere herein, we are not required to make payments of principal for amounts outstanding under the term loan until the Maturity Date. Subject to certain exceptions, the term loan is secured by substantially all of our assets, including our intellectual property. For further details, see Notes to Consolidated Financial Statements - Summary of Significant Accounting Policies – Borrowings – Athyrium Credit Agreement.
To a large extent, receipt of the research and development tax incentive income of A$9,362,172 in September 2016 and increase in quarterly service fees has resulted in an improvement to our net financial asset position. Note a major portion of our net financial assets/(liabilities) is denominated in USD, including the long term secured loan hence is subject to variation with movements in exchange rates.
We believe we have sufficient cash and cash equivalents to fund our operations for at least the next twelve months. Liquidity risk is the risk that the Company may encounter difficulty meeting obligations associated with financial liabilities. The Company manages liquidity risk through the management of its capital structure. The purpose of liquidity management is to ensure that there is sufficient cash to meet all the financial commitments and obligations of the Company as they come due. In managing the Company’s capital, management estimates future cash requirements by preparing a budget and a multi-year plan for review and approval by the Board. The budget is reviewed and updated periodically and establishes the approved activities for the next twelve months and estimates the costs associated with those activities. The multi-year plan estimates future activity along with the potential cash requirements and is based upon management’s assessment of current progress along with the expected results from the coming years’ activity. Budget to actual variances are prepared and reviewed by management and are presented on a regular basis to the Board of Directors.
The carrying value of the cash and cash equivalents and the accounts receivables approximates fair value because of their short-term nature.
We regularly review all our financial assets for impairment. There were no impairments recognized for the years ended December 31, 2016, 2015 and 2014.
Derivative Instruments and Hedging Activities
In determining fair value, we utilize valuation techniques that maximize the use of observable inputs and minimize the use of unobservable inputs to the extent possible as well as consider our own and counterparty credit risk. For the years ended December 31, 2016, 2015 and 2014, we did not have any assets or liabilities that utilize Level 3 inputs. The valuation of our foreign exchange derivatives is based on the market approach using observable market inputs, such as forward rates, and incorporates non-performance risk (the credit standing of the counterparty when the derivative is in a net asset position, and the credit standing of the Company when the derivative is in a net liability position). Our derivative assets are categorized as Level 2.
F-13
Table of Contents
Management’s Discussion and Analysis of Financial Condition and Results of Operations
Universal Biosensors, Inc.
We had no outstanding contracts as at December 31, 2016, 2015 and 2014, respectively. The fair value of these contracts at December 31, 2016, 2015 and 2014 were nil. During the years ended December 31, 2016, 2015 and 2014, we recognized gains of nil. No amount of ineffectiveness was recorded in earnings for these designated cash flow hedges for the years ended December 31, 2016, 2015 and 2014. For further details, see Notes to Consolidated Financial Statements – Note 2, Summary of Significant Accounting Policies.
Measures of Liquidity and Capital Resources
The following table provides certain relevant measures of liquidity and capital resources:
| Years Ended December 31, | ||||||||||||
| 2016 | 2015 | 2014 | ||||||||||
| A$ | A$ | A$ | ||||||||||
| Cash and cash equivalents |
20,402,322 | 14,350,307 | 16,329,829 | |||||||||
| Working capital |
29,302,615 | 24,041,164 | 23,779,492 | |||||||||
| Ratio of current assets to current liabilities |
5.93 : 1 | 6.03 : 1 | 4.66 : 1 | |||||||||
| Shareholders’ equity per common share |
0.08 | 0.08 | 0.11 | |||||||||
The movement in cash and cash equivalents and working capital during the above periods was primarily due to cash flows generated from/used in operations including outflows arising from the effort required to complete the development of the research and development products, servicing of the secured loan and the timing of payments and accruals in the ordinary course of business. The increased cash flows during 2016 are primarily a result of increased quarterly service fees from LifeScan, prepayment of milestones totaling US$3.75 million from Siemens and the receipt of the research and development tax incentive income of A$9,362,172 relating to the 2015 research and development spend.
We have not identified any collection issues with respect to receivables.
Summary of Cash Flows
| Years Ended December 31, | ||||||||||||
| 2016 | 2015 | 2014 | ||||||||||
| A$ | A$ | A$ | ||||||||||
| Cash provided by/(used in): |
||||||||||||
| Operating activities |
7,048,670 | (527,840 | ) | (7,468,062 | ) | |||||||
| Investing activities |
(1,272,160 | ) | (1,270,392 | ) | (947,386 | ) | ||||||
| Financing activities |
45,171 | (1,378,658 | ) | 261,742 | ||||||||
|
|
|
|
|
|
|
|||||||
| Net increase/(decrease) in cash and cash equivalents |
5,821,681 | (3,176,890 | ) | (8,153,706 | ) | |||||||
|
|
|
|
|
|
|
|||||||
The Company has generated positive cash flows in 2016.
Our net cash provided by or used in operating activities for all periods represents receipts offset by payments for our research and development projects including efforts involved in establishing and maintaining our manufacturing operations, interest on our long term secured loan and general and administrative expenditure. The continuous improvement in operating cash flows during the 2014 to 2016 financial years is primarily due to the increased receipts from quarterly service fees from LifeScan, receipt of milestone payments from Siemens and receipt of the research and development tax incentive income.
Our net cash used in investing activities for all periods is primarily for the purchase of various plant and equipment and for the various continuous improvement program we are undertaking.
F-14
Table of Contents
Management’s Discussion and Analysis of Financial Condition and Results of Operations
Universal Biosensors, Inc.
Our net cash used in financing activities principally represents financing charges made to the Lenders pursuant to the Credit Agreement.
Off-Balance Sheet Arrangement
The future minimum lease payments under non-cancellable operating leases (with initial or remaining lease terms in excess of one year) as of December 31, 2016 are:
| A$ | ||||
| Less than 1 year |
673,069 | |||
| 1 – 3 years |
941,608 | |||
| 3 – 5 years |
0 | |||
| More than 5 years |
0 | |||
|
|
|
|||
| Total minimum lease payments |
1,614,677 | |||
|
|
|
|||
The above relates to our operating lease obligations in relation to the lease of our premises and certain office equipment.
Contractual Obligations
Our future contractual obligations at December 31, 2016 were as follows:
| Payments Due By Period | ||||||||||||||||||||
| Total | Less than 1 year |
1 – 3 years | 3 – 5 years | More than 5 years |
||||||||||||||||
| A$ | A$ | A$ | A$ | A$ | ||||||||||||||||
| Asset Retirement Obligations (1) |
2,600,000 | 0 | 2,600,000 | 0 | 0 | |||||||||||||||
| Operating Lease Obligations (2) |
1,614,677 | 673,069 | 941,608 | 0 | 0 | |||||||||||||||
| Purchase Obligations (3) |
1,112,655 | 1,112,655 | 0 | 0 | 0 | |||||||||||||||
| Long term secured loan (4) |
20,286,827 | 0 | 20,286,827 | 0 | 0 | |||||||||||||||
| Financing costs (5) |
4,768,605 | 2,427,533 | 2,341,072 | 0 | 0 | |||||||||||||||
| Other liability (6) |
3,129,306 | 1,713,743 | 1,415,563 | 0 | 0 | |||||||||||||||
| Other Long-Term Liabilities on Balance Sheet (7) |
125,993 | 0 | 113,431 | 11,592 | 970 | |||||||||||||||
|
|
|
|
|
|
|
|
|
|
|
|||||||||||
| Total |
33,638,063 | 5,927,000 | 27,968,501 | 11,592 | 970 | |||||||||||||||
|
|
|
|
|
|
|
|
|
|
|
|||||||||||
| (1) | Represents legal obligations associated with the retirement and removal of long-lived assets. |
| (2) | Our operating lease obligations relate primarily to the lease of our premises. |
| (3) | Represents outstanding purchase orders |
| (4) | US$15 million payable to the lenders on maturity date pursuant to the Credit Agreement. |
| (5) | Interest payable to the lenders pursuant to the Credit Agreement |
| (6) | Represents patent fees and marketing support fees payable to LifeScan |
| (7) | Represents long service leave owing to the employees. |
Segments
We operate in one segment. Our principal activities are research and development, commercial manufacture of approved medical or testing devices and the provision of services including contract research work.
We operate predominantly in one geographical area, being Australia and continue to derive significant revenues from LifeScan.
The Company’s material long-lived assets are all based in Australia.
F-15
Table of Contents
Management’s Discussion and Analysis of Financial Condition and Results of Operations
Universal Biosensors, Inc.
Recent Accounting Pronouncements
See Notes to Consolidated Financial Statements – Note 2, Summary of Significant Accounting Policies.
Financial Risk Management
The overall objective of our financial risk management program is to seek to minimize the impact of foreign exchange rate movements and interest rate movements on our earnings. We manage these financial exposures through operational means and by using financial instruments. These practices may change as economic conditions change.
Foreign Currency Market Risk
We transact business in various foreign currencies, including U.S. dollars and Euros. We have established a foreign currency hedging program using forward contracts to hedge the net projected exposure for each currency and the anticipated sales and purchases in U.S. dollars and Euros. The goal of this hedging program is to economically guarantee or lock-in the exchange rates on our foreign exchange exposures. The Company does not hold or issue derivative financial instruments for trading purposes. However, derivatives that do not qualify for hedge accounting are accounted for as trading instruments.
The Company is currently using natural hedging to limit currency exposure.
Specifically, in relation to the secured term loan, we have established a program to reduce or even eliminate the impact of any foreign exchange exposure. The secured term loan is denominated in USD and the bullet repayment of US$15 million in December 2018 is to be made in USD as well. The goal is to build our USD cash reserves which will reduce our foreign exchange exposure until the cash reserves reach US$15 million at which time the foreign exchange exposure from the principal of our term loan will be eliminated. We expect to build our USD cash reserves from our US receipts to US$15 million before the secured term loan is repaid. On this basis, during the interim period, our foreign exchange exposure will only be to translation losses and there should not be any realised losses when the secured term loan is repaid.
The Company has recorded foreign currency transaction gains/(losses) of A$112,075, (A$959,343) and (A$918,479) in each of the years ended December 31, 2016, 2015 and 2014, respectively.
Interest Rate Risk
Since the majority of our investments are in cash and cash equivalents in U.S. or Australian dollars, our interest income is not materially affected by changes in the general level of U.S. and Australian interest rates. The primary objective of our investment activities is to preserve principal while at the same time maximizing the income we receive without significantly increasing risk. Our investment portfolio is subject to interest rate risk but due to the short duration of our investment portfolio, we believe an immediate 10% change in interest rates would not be material to our financial condition or results of operations.
Inflation
Our business is subject to the general risks of inflation. Our results of operations depend on our ability to anticipate and react to changes in the price of raw materials and other related costs over which we may have little control. Our inability to anticipate and respond effectively to an adverse change in the price could have a significant adverse effect on our results of operations. In the face of increasing costs, the Company strives to maintain its profit margins through cost reduction programs, productivity improvements and periodic price increases.
F-16
Table of Contents

Report of Independent Registered Public Accounting Firm
To the Board of Directors and Shareholders of Universal Biosensors, Inc.:
In our opinion, the accompanying consolidated balance sheets and the related consolidated statements of comprehensive income, changes in stockholders’ equity and comprehensive income and cash flows present fairly, in all material respects, the financial position of Universal Biosensors, Inc. and its subsidiaries as of December 31, 2016 and December 31, 2015, and the results of their operations and their cash flows for each of the three years in the period ended December 31, 2016 in conformity with accounting principles generally accepted in the United States of America. In addition, in our opinion, the financial statement schedule listed in the index appearing under Item 15(a)(2) present fairly, in all material respects, the information set forth therein when read in conjunction with the related consolidated financial statements. These financial statements and financial statement schedule are the responsibility of the Company’s management. Our responsibility is to express an opinion on these financial statements and financial statement schedule based on our audits. We conducted our audits of these financial statements in accordance with the standards of the Public Company Accounting Oversight Board (United States). Those standards require that we plan and perform the audit to obtain reasonable assurance about whether the financial statements are free of material misstatement. An audit includes examining, on a test basis, evidence supporting the amounts and disclosures in the financial statements, assessing the accounting principles used and significant estimates made by management, and evaluating the overall financial statement presentation. We believe that our audits provide a reasonable basis for our opinion.
PricewaterhouseCoopers
Sydney, Australia
March 21, 2017
PricewaterhouseCoopers, ABN 52 780 433 757
One International Towers Sydney, Watermans Quay, Barangaroo NSW 2000
T +61 2 8266 0000, F +61 2 8266 9999, www.pwc.com.au
F-17
Table of Contents
Consolidated Balance Sheets
| December 31, | December 31, | |||||||
| 2016 | 2015 | |||||||
| A$ | A$ | |||||||
| ASSETS |
||||||||
| Current assets: |
||||||||
| Cash and cash equivalents |
20,402,322 | 14,350,307 | ||||||
| Inventories, net |
839,250 | 355,268 | ||||||
| Accounts receivable |
4,848,009 | 3,153,584 | ||||||
| Prepayments |
1,078,335 | 1,408,943 | ||||||
| Other current assets |
8,074,384 | 9,555,441 | ||||||
|
|
|
|
|
|||||
| Total current assets |
35,242,300 | 28,823,543 | ||||||
| Non-current assets: |
||||||||
| Property, plant and equipment |
36,809,266 | 35,563,364 | ||||||
| Less accumulated depreciation |
(25,282,248 | ) | (22,655,162 | ) | ||||
|
|
|
|
|
|||||
| Property, plant and equipment - net |
11,527,018 | 12,908,202 | ||||||
|
|
|
|
|
|||||
| Other non-current assets |
3,220,000 | 3,220,000 | ||||||
|
|
|
|
|
|||||
| Total non-current assets |
14,747,018 | 16,128,202 | ||||||
|
|
|
|
|
|||||
| Total assets |
49,989,318 | 44,951,745 | ||||||
|
|
|
|
|
|||||
| LIABILITIES AND STOCKHOLDERS’ EQUITY |
||||||||
| Current liabilities: |
||||||||
| Accounts payable |
547,324 | 894,677 | ||||||
| Accrued expenses |
1,785,134 | 1,905,724 | ||||||
| Borrowings |
369,630 | 324,459 | ||||||
| Other liabilities |
1,713,743 | 354,387 | ||||||
| Employee entitlements provision |
1,523,854 | 1,303,132 | ||||||
|
|
|
|
|
|||||
| Total current liabilities |
5,939,685 | 4,782,379 | ||||||
| Non-current liabilities: |
||||||||
| Asset retirement obligations |
2,600,000 | 2,600,000 | ||||||
| Employee entitlements provision |
125,993 | 172,574 | ||||||
| Long term secured loan |
20,286,827 | 19,868,560 | ||||||
| Other liabilities |
1,415,563 | 3,099,323 | ||||||
| Deferred revenue |
6,366,975 | 1,173,204 | ||||||
|
|
|
|
|
|||||
| Total non-current liabilities |
30,795,358 | 26,913,661 | ||||||
|
|
|
|
|
|||||
| Total liabilities |
36,735,043 | 31,696,040 | ||||||
|
|
|
|
|
|||||
| Commitments and contingencies |
0 | 0 | ||||||
|
|
|
|
|
|||||
| Stockholders’ equity: |
||||||||
| Preferred stock, US$0.01 par value. Authorized 1,000,000 shares; issued and outstanding nil in 2016 (2015: nil) |
||||||||
| Common stock, US$0.0001 par value. Authorized 300,000,000 shares; issued and outstanding 176,386,884 shares in 2016 (2015: 176,112,584) |
17,639 | 17,611 | ||||||
| Additional paid-in capital |
93,167,465 | 94,419,308 | ||||||
| Accumulated deficit |
(80,882,902 | ) | (74,306,486 | ) | ||||
| Current year income/(loss) |
1,250,276 | (6,576,416 | ) | |||||
| Accumulated other comprehensive income |
(298,203 | ) | (298,312 | ) | ||||
|
|
|
|
|
|||||
| Total stockholders’ equity |
13,254,275 | 13,255,705 | ||||||
|
|
|
|
|
|||||
| Total liabilities and stockholders’ equity |
49,989,318 | 44,951,745 | ||||||
|
|
|
|
|
|||||
See accompanying notes to the financial statements
F-18
Table of Contents
Consolidated Statements of Comprehensive Income/(Loss)
| Years Ended December 31, | ||||||||||||
| 2016 | 2015 | 2014 | ||||||||||
| A$ | A$ | A$ | ||||||||||
| Revenue |
||||||||||||
| Revenue from products |
584,550 | 1,323,564 | 215,486 | |||||||||
| Revenue from services |
18,246,267 | 15,451,414 | 9,314,198 | |||||||||
|
|
|
|
|
|
|
|||||||
| Total revenue |
18,830,817 | 16,774,978 | 9,529,684 | |||||||||
| Operating costs & expenses |
||||||||||||
| Cost of goods sold |
996,788 | 1,136,143 | 313,374 | |||||||||
| Cost of services |
154,998 | 244,073 | 242,453 | |||||||||
|
|
|
|
|
|
|
|||||||
| Total cost of goods sold & services |
1,151,786 | 1,380,216 | 555,827 | |||||||||
| Contribution from products & services |
17,679,031 | 15,394,762 | 8,973,857 | |||||||||
| Other operating costs & expenses |
||||||||||||
| Research and development |
14,987,462 | 19,120,842 | 16,616,051 | |||||||||
| General and administrative |
6,414,855 | 6,670,768 | 6,143,748 | |||||||||
|
|
|
|
|
|
|
|||||||
| Total operating costs & expenses |
21,402,317 | 25,791,610 | 22,759,799 | |||||||||
|
|
|
|
|
|
|
|||||||
| Loss from operations |
(3,723,286 | ) | (10,396,848 | ) | (13,785,942 | ) | ||||||
| Other income/(expense) |
||||||||||||
| Interest income |
201,096 | 242,574 | 260,904 | |||||||||
| Interest expense |
(8,436 | ) | (15,106 | ) | (15,905 | ) | ||||||
| Financing costs |
(2,894,300 | ) | (3,308,068 | ) | (2,646,092 | ) | ||||||
| Patent fees |
0 | 1,404,184 | (2,133,626 | ) | ||||||||
| Marketing support payment |
0 | (2,804,000 | ) | 0 | ||||||||
| Other |
7,675,202 | 8,300,848 | 9,004,534 | |||||||||
|
|
|
|
|
|
|
|||||||
| Total other income |
4,973,562 | 3,820,432 | 4,469,815 | |||||||||
| Net income/(loss) before tax |
1,250,276 | (6,576,416 | ) | (9,316,127 | ) | |||||||
| Income tax benefit/(expense) |
0 | 0 | 0 | |||||||||
|
|
|
|
|
|
|
|||||||
| Net income/(loss) before tax |
$ | 1,250,276 | $ | (6,576,416 | ) | $ | (9,316,127 | ) | ||||
|
|
|
|
|
|
|
|||||||
| Earnings per share |
||||||||||||
| Basic net income/(loss) per share |
0.01 | (0.04 | ) | (0.05 | ) | |||||||
| Diluted net income/(loss) per share |
0.01 | (0.04 | ) | (0.05 | ) | |||||||
| Other comprehensive gain/(loss), net of tax: |
||||||||||||
| Foreign currency translation reserve |
109 | 0 | 0 | |||||||||
| Reclassification for gains realized in net income |
0 | 0 | 0 | |||||||||
|
|
|
|
|
|
|
|||||||
| Other comprehensive gain/(loss) |
109 | 0 | 0 | |||||||||
|
|
|
|
|
|
|
|||||||
| Comprehensive gain/(loss) |
1,250,385 | (6,576,416 | ) | (9,316,127 | ) | |||||||
|
|
|
|
|
|
|
|||||||
See accompanying notes to the financial statements.
F-19
Table of Contents
Consolidated Statements of Changes in Stockholders’ Equity and Comprehensive Income/(Loss)
| Ordinary shares | Additional Paid-in Capital |
Accumulated Deficit |
Accumulated Other Comprehensive Income |
Total Stockholders’ Equity |
||||||||||||||||||||
| Shares | Amount | |||||||||||||||||||||||
| A$ | A$ | A$ | A$ | A$ | ||||||||||||||||||||
| Balances at January 1, 2014 |
175,600,605 | 17,560 | 94,955,051 | (64,990,359 | ) | (298,312 | ) | 29,683,940 | ||||||||||||||||
| Net loss |
0 | 0 | 0 | (9,316,127 | ) | 0 | (9,316,127 | ) | ||||||||||||||||
| Exercise of stock options issued to employees |
8,333 | 0 | 0 | 0 | 0 | 0 | ||||||||||||||||||
| Shares issued to employees |
2,040 | 1 | 999 | 0 | 0 | 1,000 | ||||||||||||||||||
| Stock option expense |
0 | 0 | (627,868 | ) | 0 | 0 | (627,868 | ) | ||||||||||||||||
|
|
|
|
|
|
|
|
|
|
|
|
|
|||||||||||||
| Balances at December 31, 2014 |
175,610,978 | 17,561 | 94,328,182 | (74,306,486 | ) | (298,312 | ) | 19,740,945 | ||||||||||||||||
| Net loss |
0 | 0 | 0 | (6,576,416 | ) | 0 | (6,576,416 | ) | ||||||||||||||||
| Exercise of stock options issued to employees |
72,496 | 7 | 26,120 | 0 | 0 | 26,127 | ||||||||||||||||||
| Shares issued to employees |
429,110 | 43 | 129,938 | 0 | 0 | 129,981 | ||||||||||||||||||
| Stock option expense |
0 | 0 | (64,932 | ) | 0 | 0 | (64,932 | ) | ||||||||||||||||
|
|
|
|
|
|
|
|
|
|
|
|
|
|||||||||||||
| Balances at December 31, 2015 |
176,112,584 | 17,611 | 94,419,308 | (80,882,902 | ) | (298,312 | ) | 13,255,705 | ||||||||||||||||
| Net income |
0 | 0 | 0 | 1,250,276 | 0 | 1,250,276 | ||||||||||||||||||
| Other comprehensive income |
0 | 0 | 0 | 0 | 109 | 109 | ||||||||||||||||||
| Exercise of stock options issued to employees |
77,500 | 8 | (8 | ) | 0 | 0 | 0 | |||||||||||||||||
| Shares issued to employees |
196,800 | 20 | 65,974 | 0 | 0 | 65,994 | ||||||||||||||||||
| Stock option expense |
0 | 0 | (1,317,809 | ) | 0 | 0 | (1,317,809 | ) | ||||||||||||||||
|
|
|
|
|
|
|
|
|
|
|
|
|
|||||||||||||
| Balances at December 31, 2016 |
176,386,884 | 17,639 | 93,167,465 | (79,632,626 | ) | (298,203 | ) | 13,254,275 | ||||||||||||||||
|
|
|
|
|
|
|
|
|
|
|
|
|
|||||||||||||
See accompanying notes to the financial statements.
F-20
Table of Contents
Consolidated Statements of Cash Flows
| Years Ended December 31, | ||||||||||||
| 2016 | 2015 | 2014 | ||||||||||
| A$ | A$ | A$ | ||||||||||
| Cash flows from operating activities provided by/(used in): |
||||||||||||
| Net income/(loss) |
1,250,276 | (6,576,416 | ) | (9,316,127 | ) | |||||||
| Adjustments to reconcile net income/(loss) to net cash provided by/(used in) operating activities: |
||||||||||||
| Depreciation and amortization |
2,646,185 | 2,697,151 | 2,512,946 | |||||||||
| Share based payments expense |
(1,317,809 | ) | (64,932 | ) | (627,868 | ) | ||||||
| Loss on fixed assets disposal |
1,280 | 329 | 16,195 | |||||||||
| Unrealized foreign exchange losses |
(32,138 | ) | 953,010 | 718,336 | ||||||||
| Financing costs - amortization of warrants |
220,180 | 218,988 | 181,779 | |||||||||
| Change in assets and liabilities: |
||||||||||||
| Inventory |
(483,982 | ) | 42,182 | (393,243 | ) | |||||||
| Accounts receivable |
(1,694,425 | ) | 646,121 | (1,631,838 | ) | |||||||
| Prepaid expenses and other assets |
1,324,771 | (1,028,500 | ) | 126,095 | ||||||||
| Deferred revenue |
5,193,771 | (394,358 | ) | (348,270 | ) | |||||||
| Employee entitlements |
240,135 | 234,770 | 64,077 | |||||||||
| Accounts payable and accrued expenses |
(299,574 | ) | 2,743,815 | 1,229,856 | ||||||||
|
|
|
|
|
|
|
|||||||
| Net cash provided by/(used in) operating activities |
7,048,670 | (527,840 | ) | (7,468,062 | ) | |||||||
|
|
|
|
|
|
|
|||||||
| Cash flows from investing activities: |
||||||||||||
| Proceeds from sale of property, plant and equipment |
0 | 0 | 7,941 | |||||||||
| Purchases of property, plant and equipment |
(1,212,660 | ) | (1,270,392 | ) | (955,327 | ) | ||||||
| Payments to acquire business |
(59,500 | ) | 0 | 0 | ||||||||
|
|
|
|
|
|
|
|||||||
| Net cash used in investing activities |
(1,272,160 | ) | (1,270,392 | ) | (947,386 | ) | ||||||
|
|
|
|
|
|
|
|||||||
| Cash flows from financing activities: |
||||||||||||
| Proceeds from borrowings |
369,630 | 360,510 | 1,051,662 | |||||||||
| Repayment of borrowings |
(324,459 | ) | (534,941 | ) | (552,772 | ) | ||||||
| Borrowing costs |
0 | (1,230,354 | ) | (237,148 | ) | |||||||
| Proceeds from stock options exercised |
0 | 26,127 | 0 | |||||||||
|
|
|
|
|
|
|
|||||||
| Net cash provided by/(used in) financing activities |
45,171 | (1,378,658 | ) | 261,742 | ||||||||
|
|
|
|
|
|
|
|||||||
| Net increase/(decrease) in cash and cash equivalents |
5,821,681 | (3,176,890 | ) | (8,153,706 | ) | |||||||
| Cash and cash equivalent at beginning of period |
14,350,307 | 16,329,829 | 23,742,422 | |||||||||
| Effect of exchange rate fluctuations on the balances of cash held in foreign currencies |
230,334 | 1,197,368 | 741,113 | |||||||||
|
|
|
|
|
|
|
|||||||
| Cash and cash equivalents at end of period |
20,402,322 | 14,350,307 | 16,329,829 | |||||||||
|
|
|
|
|
|
|
|||||||
See accompanying notes to the financial statement
F-21
Table of Contents
Notes to Consolidated Financial Statements
(for the years ended December 31, 2014, 2015 and 2016)
| (1) | Basis of Presentation |
These consolidated financial statements are presented in accordance with “U.S. GAAP”. All amounts are expressed in Australian dollars (“AUD” or “A$”) unless otherwise stated.
The Company’s consolidated financial statements have been prepared assuming the Company will continue as a going concern. We rely largely on our existing cash and cash equivalents balance and operating cash flow to provide for the working capital needs of our operations. We believe we have sufficient cash and cash equivalents to fund our operations for at least the next twelve months. However, in the event, our financing needs for the foreseeable future are not able to be met by our existing cash and cash equivalents balance and operating cash flow, we would seek to raise funds through public or private equity offerings, debt financings, and through other means to meet the financing requirements. There is no assurance that funding would be available at acceptable terms, if at all.
| (2) | Summary of Significant Accounting Policies |
Principles of Consolidation
The consolidated financial statements include the financial statements of the Company and its wholly owned subsidiaries, UBS and HRL. All intercompany balances and transactions have been eliminated on consolidation.
Use of Estimates
The preparation of the consolidated financial statements requires management of the Company to make a number of estimates and assumptions relating to the reported amount of assets and liabilities and the disclosure of contingent assets and liabilities at the date of the consolidated financial statements and the reported amounts of revenues and expenses during the period. Significant items subject to such estimates and assumptions include the carrying amount of property, plant and equipment, deferred income taxes, asset retirement obligations and obligations related to employee benefits. Actual results could differ from those estimates.
Cash & Cash Equivalents
The Company considers all highly liquid investments purchased with an initial maturity of three months or less to be cash equivalents. For cash and cash equivalents, the carrying amount approximates fair value due to the short maturity of those instruments.
Short-Term Investments (Held-to-maturity)
Short-term investments constitute all highly liquid investments with term to maturity from three months to twelve months. The carrying amount of short-term investments is equivalent to their fair value.
Concentration of Credit Risk and Other Risks and Uncertainties
Cash and cash equivalents and accounts receivable consist of financial instruments that potentially subject the Company to concentration of credit risk to the extent of the amount recorded on the consolidated balance sheets. The Company’s cash and cash equivalents are primarily invested with one of Australia’s largest banks. The Company is exposed to credit risk in the event of default by the banks holding the cash or cash equivalents to the extent of the amount recorded on the consolidated balance sheets. The Company has not experienced any losses on its deposits of cash and cash equivalents. The Company has not identified any collectability issues with respect to receivables.
Derivative Instruments and Hedging Activities
Derivative financial instruments
The Company may use derivative financial instruments to hedge its exposure to foreign exchange arising from operating, investing and financing activities. The Company does not hold or issue derivative financial instruments for trading purposes. However, derivatives that do not qualify for hedge accounting are accounted for as trading instruments.
F-22
Table of Contents
Universal Biosensors, Inc.
Notes to Consolidated Financial Statements
(for the years ended December 31, 2014, 2015 and 2016)
Derivative financial instruments are recognized initially at fair value. Subsequent to initial recognition, derivative financial instruments are stated at fair value. The gain or loss on remeasurement to fair value is recognized immediately in the income statement. However, where derivatives qualify for hedge accounting, recognition of any resultant gain or loss depends on the nature of the item being hedged.
Cash flow hedges
Exposure to foreign exchange risks arises in the normal course of the Company’s business and it is the Company’s policy to use forward exchange contracts to hedge anticipated sales and purchases in foreign currencies. The amount of forward cover taken is in accordance with approved policy and internal forecasts.
Where a derivative financial instrument is designated as a hedge of the variability in cash flows of a recognized asset or liability, or a highly probable forecast transaction, the effective part of any unrealized gain or loss on the derivative financial instrument is recognized directly in equity. When the forecast transaction subsequently results in the recognition of a non-financial asset or non-financial liability, the associated cumulative gain or loss is removed from equity and included in the initial cost or other carrying amount of the non-financial asset or liability.
For cash flow hedges, other than those covered by the preceding statement, the associated cumulative gain or loss is removed from equity and recognized in the consolidated statements of comprehensive income in the same period or periods during which the hedged forecast transaction affects the consolidated statements of comprehensive income and on the same line item as that hedged forecast transaction. The ineffective part of any gain or loss is recognized immediately in the consolidated statements of comprehensive income.
When a hedging instrument expires or is sold, terminated or exercised, or the Company revokes designation of the hedge relationship but the hedged forecast transaction is still probable to occur, the cumulative gain or loss at that point remains in equity and is recognized in accordance with the above policy when the transaction occurs. If the hedged transaction is no longer expected to take place, then the cumulative unrealized gain or loss recognized in equity is recognized immediately in the consolidated statements of comprehensive income.
Derivative Instruments and Hedging Activities
In determining fair value, we utilize valuation techniques that maximize the use of observable inputs and minimize the use of unobservable inputs to the extent possible as well as consider our own and counterparty credit risk. For years ended December 31, 2014, 2015 and 2016, we did not have any assets or liabilities that utilize Level 3 inputs. The valuation of our foreign exchange derivatives are based on the market approach using observable market inputs, such as forward rates and incorporate non-performance risk (the credit standing of the counterparty when the derivative is in a net asset position, and the credit standing of the Company when the derivative is in a net liability position). Our derivative assets are categorized as Level 2. The fair value methodologies described as Level 2 and 3 inputs are defined elsewhere in these notes to the consolidated financial statements.
Inventory
Inventories are stated at the lower of cost or net realizable value. Net realizable value is the estimated selling price in the ordinary course of business less the estimated costs of completion and estimated costs necessary to dispose. Inventories are principally determined under the average cost method which approximates cost. Cost comprises direct materials, direct labour and an appropriate portion of variable and fixed overhead expenditure, the latter being allocated on the basis of normal operating capacity. Cost also includes the transfer from equity of any gains/losses on qualifying cash flow hedges relating to purchases of raw material. Costs of purchased inventory are determined after deducting rebates and discounts.
| Years Ended December 31, | ||||||||||||
| 2016 | 2015 | 2014 | ||||||||||
| A$ | A$ | A$ | ||||||||||
| Raw materials |
315,970 | 270,683 | 351,007 | |||||||||
| Work in progress |
523,280 | 52,841 | 46,443 | |||||||||
| Finished goods |
0 | 31,744 | 0 | |||||||||
|
|
|
|
|
|
|
|||||||
| 839,250 | 355,268 | 397,450 | ||||||||||
|
|
|
|
|
|
|
|||||||
F-23
Table of Contents
Universal Biosensors, Inc.
Notes to Consolidated Financial Statements
(for the years ended December 31, 2014, 2015 and 2016)
Receivables
Trade accounts receivable are recorded at the invoiced amount and do not bear interest. The allowance for doubtful accounts is the best estimate of the amount of probable credit losses in the existing accounts receivable. The allowance is determined based on a review of individual accounts for collectability, generally focusing on those accounts that are past due. The current year expense to adjust the allowance for doubtful accounts, if any, is recorded within general and administrative expenses in the consolidated statements of comprehensive income. Account balances are charged against the allowance when it is probable the receivable will not be recovered.
| Years Ended December 31, | ||||||||||||
| 2016 | 2015 | 2014 | ||||||||||
| A$ | A$ | A$ | ||||||||||
| Accounts receivable |
4,848,009 | 3,153,584 | 3,799,705 | |||||||||
| Allowance for doubtful debts |
0 | 0 | 0 | |||||||||
|
|
|
|
|
|
|
|||||||
| 4,848,009 | 3,153,584 | 3,799,705 | ||||||||||
|
|
|
|
|
|
|
|||||||
Property, Plant, and Equipment, net
Property, plant, and equipment are recorded at acquisition cost, less accumulated depreciation.
Depreciation on plant and equipment is calculated using the straight-line method over the estimated useful lives of the assets. The estimated useful life of machinery and equipment is 3 to 10 years. Leasehold improvements are amortized on the straight-line method over the shorter of the remaining lease term or estimated useful life of the asset. Maintenance and repairs are charged to operations as incurred, include normal services, and do not include items of a capital nature.
The Company receives Commonwealth of Australia grant monies under grant agreements to support its development activities, including in connection with the purchase of plant and equipment. Plant and equipment is presented net of the government grant. The grant monies are recognized against the acquisition costs of the related plant and equipment as and when the related assets are purchased.
Research and Development
Research and development expenses consist of costs incurred to further the Group’s research and product development activities and include salaries and related employee benefits, costs associated with clinical trial and preclinical development, regulatory activities, research-related overhead expenses, costs associated with the manufacture of clinical trial material, costs associated with developing a commercial manufacturing process, costs for consultants and related contract research, facility costs and depreciation. Research and development costs are expensed as incurred.
Research and development expenses for the respective periods are as follows:
| Years Ended December 31, | ||||||||||||
| 2016 | 2015 | 2014 | ||||||||||
| A$ | A$ | A$ | ||||||||||
| Research |
1,230,652 | 1,296,396 | 1,194,323 | |||||||||
| Development |
13,756,810 | 17,824,446 | 15,421,728 | |||||||||
|
|
|
|
|
|
|
|||||||
| Research and development expenses |
14,987,462 | 19,120,842 | 16,616,051 | |||||||||
|
|
|
|
|
|
|
|||||||
Income Taxes
The Company applies ASC 740 - Income Taxes which establishes financial accounting and reporting standards for the effects of income taxes that result from a company’s activities during the current and preceding years. Deferred tax assets and liabilities are recognized for the future tax consequences attributable to differences between the financial statement carrying amounts of existing assets and liabilities and their respective tax bases and operating loss and tax credit carry forwards. Deferred tax assets and liabilities are measured using enacted tax rates expected to apply to taxable income in the years in which those temporary differences are expected to be recovered or settled. The effect on deferred tax assets and liabilities of a change in tax rates is recognized in income in the period that includes the enactment date.
F-24
Table of Contents
Universal Biosensors, Inc.
Notes to Consolidated Financial Statements
(for the years ended December 31, 2014, 2015 and 2016)
Where it is more likely than not that some portion or all of the deferred tax assets will not be realized, the deferred tax assets are reduced by a valuation allowance. The valuation allowance is sufficient to reduce the deferred tax assets to the amount that is more likely than not to be realized. A reconciliation of the valuation and qualifying accounts is attached as Schedule ii.
We are subject to income taxes in the United States, Canada and Australia. U.S. federal income tax returns up to and including the 2015 financial year have been filed. In Australia, consolidated income tax returns up to and including the 2015 financial year have been filed. HRL will file its first tax return in Canada for the 2016 financial year.
Asset Retirement Obligations
Asset retirement obligations (“ARO”) are legal obligations associated with the retirement and removal of long-lived assets. ASC 410 – Asset Retirement and Environmental Obligations requires entities to record the fair value of a liability for an asset retirement obligation when it is incurred. When the liability is initially recorded, the Company capitalizes the cost by increasing the carrying amounts of the related property, plant and equipment. Over time, the liability increases for the change in its present value, while the capitalized cost depreciates over the useful life of the asset. The Company derecognizes ARO liabilities when the related obligations are settled.
The ARO is in relation to our premises where in accordance with the terms of the lease, the lessee has to restore part of the building upon vacating the premises.
Our overall ARO changed as follows:
| Years Ended December 31, | ||||||||||||
| 2016 | 2015 | 2014 | ||||||||||
| A$ | A$ | A$ | ||||||||||
| Opening balance at January 1 |
2,600,000 | 2,600,000 | 2,549,928 | |||||||||
| Accretion expense |
0 | 0 | 50,072 | |||||||||
|
|
|
|
|
|
|
|||||||
| Ending balance at December 31 |
2,600,000 | 2,600,000 | 2,600,000 | |||||||||
|
|
|
|
|
|
|
|||||||
Fair Value of Financial Instruments
The carrying value of all current assets and current liabilities approximates fair value because of their short-term nature. The estimated fair value of all other amounts has been determined, depending on the nature and complexity of the assets or the liability, by using one or all of the following approaches:
| • | Market approach – based on market prices and other information from market transactions involving identical or comparable assets or liabilities. |
| • | Cost approach – based on the cost to acquire or construct comparable assets less an allowance for functional and/or economic obsolescence. |
| • | Income approach – based on the present value of a future stream of net cash flows |
These fair value methodologies depend on the following types of inputs:
| • | Quoted prices for identical assets or liabilities in active markets (Level 1 inputs) |
| • | Quoted prices for similar assets or liabilities in active markets or quoted prices for identical or similar assets or liabilities in markets that are not active or are directly or indirectly observable (Level 2 inputs) |
| • | Unobservable inputs that reflect estimates and assumptions (Level 3 inputs) |
F-25
Table of Contents
Universal Biosensors, Inc.
Notes to Consolidated Financial Statements
(for the years ended December 31, 2014, 2015 and 2016)
Impairment of Long-Lived Assets
The Company reviews its capital assets, including patents and licenses, for impairment whenever events or changes in business circumstances indicate that the carrying amount of the assets may not be fully recoverable. In performing the review, the Company estimates undiscounted cash flows from products under development that are covered by these patents and licenses. An impairment loss would be recognized when estimated undiscounted future cash flows expected to result from the use of the asset and its eventual disposition is less than the carrying amount of the asset. If the evaluation indicates that the carrying value of an asset is not recoverable from its undiscounted cash flows, an impairment loss is measured by comparing the carrying value of the asset to its fair value, based on discounted cash flows.
Australian Goods and Services Tax (GST) and Canadian Harmonized Sales Tax (HST)
Revenues, expenses and assets are recognized net of the amount of associated GST and HST, unless the GST and HST incurred is not recoverable from the taxation authority. In this case it is recognized as part of the cost of acquisition of the asset or as part of the expense. Receivables and payables are stated inclusive of the amount of GST and HST receivable or payable. The net amount of GST and HST recoverable from, or payable to, the taxation authority is included with other receivables or payables in the consolidated balance sheets.
Revenue Recognition
We recognize revenue from all sources based on the provisions of the U.S. SEC’s Staff Accounting Bulletin No. 104 and ASC 605 Revenue Recognition.
The Company’s revenue represents revenue from sales of products, provision of services and collaborative research and development agreements.
We recognize revenue from sales of products at the time title of goods passes to the buyer and the buyer assumes the risks and rewards of ownership, assuming all other revenue recognition criteria have been met. Generally, this is at the time products are shipped to the customer.
Revenue from services is recognized when a persuasive evidence of an arrangement exists, services have been rendered, the price is fixed or determinable, and collectability is reasonably assured. Revenue recognition principles are assessed for each new contractual arrangement and the appropriate accounting is determined for each service.
Where our agreements contain multiple elements, or deliverables, such as the manufacture and sale of products, provision of services or research and development activities, they are assessed to determine whether separate delivery of the individual elements of such arrangements comprises more than one unit of accounting. Where an arrangement can be divided into separate units of accounting (each unit constituting a separate earnings process), the arrangement consideration is allocated amongst those varying units based on the relative selling price of the separate units of accounting and the applicable revenue recognition criteria applied to the separate units. Selling prices are determined using fair value as determined by either vendor specific objective evidence or third party evidence of the selling price, when available, or the Company’s best estimate of selling price when fair value is not available for a given unit of accounting.
Under ASC 605-25, the delivered item(s) are separate units of accounting, provided (i) the delivered item(s) have value to a customer on a stand-alone basis, and (ii) if the arrangement includes a general right of return relative to the delivered item, delivery or performance of the undelivered item(s) is considered probable and substantially in our control. Where the arrangement cannot be divided into separate units, the individual deliverables are combined as a single unit of accounting and the total arrangement consideration is recognized across other deliverables in the arrangement or over the estimated collaboration period. Payments under these arrangements typically include one or more of the following: non-refundable, upfront payments; funding of research and/or development efforts; and milestone payments.
We typically generate milestone payments from our customers pursuant to the various agreements we have with them. Non-refundable milestone payments which represent the achievement of a significant technical/regulatory hurdle in the research and development process pursuant to collaborative agreements, and are deemed to be substantive, are recognized as revenue upon the achievement of the specified milestone. If the non-refundable milestone payment is not substantive or stand-alone value, the non-refundable milestone payment is deferred and recognized as revenue either over the estimated performance period stipulated in the agreement or across other deliverables in the arrangement.
F-26
Table of Contents
Universal Biosensors, Inc.
Notes to Consolidated Financial Statements
(for the years ended December 31, 2014, 2015 and 2016)
Management has concluded that the core operations of the Company are expected to be the research and development activities, commercial manufacture of approved medical or testing devices and the provision of services. The Company’s ultimate goal is to utilize the underlying technology and skill base for the development of marketable products that the Company will manufacture. The Company considers revenue from the sales of products, revenue from services and the income received from milestone payments indicative of its core operating activities or revenue producing goals of the Company, and as such have accounted for this income as “revenues”.
Master Services and Supply Agreement
In October 2007, the Company and LifeScan entered into a Master Services and Supply Agreement, under which the Company would provide certain services to LifeScan in the field of blood glucose monitoring and act as a non-exclusive manufacturer of blood glucose test strips. The Master Services and Supply Agreement was subsequently amended and restated in May 2009. The Company has concluded the Master Services and Supply Agreement should be accounted for as three separate units of accounting: 1) research and development to assist LifeScan in receiving regulatory clearance to sell the blood glucose product (milestone payment), 2) contract manufacturing of the blood glucose test strips (contract manufacturing) which ceased in December 2013, and 3) ongoing services and efforts to enhance the product (product enhancement).
All consideration within the Master Services and Supply Agreement is contingent. The Company concluded the undelivered items were not priced at a significant incremental discount to the delivered items and revenue for each deliverable will be recognized as each contingency is met and the consideration becomes fixed and determinable. The milestone payment was considered to be a substantive payment and the entire amount has been recognized as revenue when the regulatory approval was received. Revenues for contract manufacturing and ongoing efforts to enhance the product are recognized as revenue from products or revenue from services, respectively, when the four basic criteria for revenue recognition are met.
Collaboration Agreement
On September 9, 2011 the Company entered into a Collaboration Agreement with Siemens to develop coagulation related products for hospital point-of-care and ambulatory care coagulation markets. In addition to an up-front, non-refundable payment of A$2,961,245 (equivalent to US$3 million), the Collaboration Agreement (as amended) contains a further seven payments from Siemens upon the achievement of certain defined milestones. These seven milestones to a large extent relate to feasibility, regulatory submissions and the launch of the products to be developed. The Company has concluded that the up-front payment is not a separate unit of accounting and recorded the amount as deferred revenue to be recognized as revenue across other deliverables in the arrangement with Siemens based upon the Company’s best estimate of selling price. The deliverables related to each milestone are considered substantive and are not priced at a significant incremental discount to the other deliverables. As the achievement of the milestones is contingent upon a future event, the revenue for each deliverable will be recognized as the contingencies are met and the consideration becomes fixed and determinable.
Of the seven milestones, the Company has delivered on four as of December 31, 2016. Two milestones were delivered in 2012 and the milestones achieved subsequent to January 1, 2014 are as follows:
| • | In December 2014, the Company delivered on its third milestone when it completed the development of the Xprecia Stride™ Coagulation Analyzer and the product was launched by Siemens. Of the total amount of A$1,750,486 (equivalent to US$1,428,571) recognized as revenue from services in December 2014, A$1,225,340 (equivalent to US$1,000,000) relates to the achievement of the milestone whilst the balance relates to a portion of the deferred US$3 million up-front payment allocated to these milestones. |
| • | In July 2015, the Company delivered on its fourth milestone when Siemens made a premarket 510(k) submission to the FDA for regulatory clearance to sell the Xprecia Stride™ Coagulation Analyzer in the US. Of the total amount of A$1,955,340 (equivalent to US$1,428,571) recognized as revenue from services in July 2015, A$1,368,738 (equivalent to US$1,000,000) relates to the achievement of the milestone whilst the balance relates to a portion of the deferred US$3 million up-front payment allocated to these milestones. |
F-27
Table of Contents
Universal Biosensors, Inc.
Notes to Consolidated Financial Statements
(for the years ended December 31, 2014, 2015 and 2016)
Interest income
Interest income is recognized as it accrues, taking into account the effective yield on the cash and cash equivalents.
Research and development tax incentive income
Research and development tax incentive income is recognized when there is reasonable assurance that the income will be received, the relevant expenditure has been incurred, and the consideration can be reliably measured. The research and development tax incentive is one of the key elements of the Australian Government’s support for Australia’s innovation system and is supported by legislative law primarily in the form of the Australian Income Tax Assessment Act 1997 as long as eligibility criteria are met. Generally speaking, entities which are an R&D entity involved in eligible R&D activities may claim research and development tax incentive income as follows:
| 1. | as a refundable tax offset if aggregate turnover (which generally means an entity’s total income that it derives in the ordinary course of carrying on a business, subject to certain exclusions) of the entity is less than A$20 million, or |
| 2. | as a non-refundable tax offset if aggregate turnover of the entity is more than A$20 million. |
In accordance with SEC Regulation S-X Article 5-03, the Company’s research and development incentive income has been recognized as non-operating income as it is not indicative of the core operating activities or revenue producing goals of the Company.
Management has assessed the Company’s research and development activities and expenditures to determine which activities and expenditures are likely to be eligible under the tax incentive regime described above. At each period end management estimates the refundable tax offset available to the Company based on available information at the time. This estimate is also reviewed by external tax advisors on an annual basis.
The Company has recorded research and development tax incentive income of A$7,562,172, A$9,224,349 and A$9,935,083, respectively under the caption “Other” in the consolidated statements of comprehensive income in each of the years ended December 31, 2016, 2015 and 2014, respectively.
Of the A$9,935,083 research and development tax incentive recorded in other income for the year ended December 31, 2014, A$1,735,083 relates to research and development tax incentive income the Company received from the Australian Government for the year ended December 31, 2013 following a change in the original estimate. Similarly, included in the 2015 and 2016 research and development tax incentive income are amounts of A$24,349 and A$162,172, respectively which relates to prior years change in estimate of the research and development tax incentive income.
Foreign Currency
Functional and reporting currency
Items included in the financial statements of each of the Group’s entities are measured using the currency of the primary economic environment in which the entity operates (“the functional currency”). The functional currency of UBI and UBS is AUD or A$ for all years presented. The functional currency of HRL is Canadian dollars (“CAD$”).
The consolidated financial statements are presented using a reporting currency of Australian dollars.
Transactions and balances
Foreign currency transactions are translated into the functional currency using the exchange rates prevailing at the dates of the transactions. Foreign exchange gains and losses resulting from the settlement of such transactions and from the translation at year-end exchange rates of monetary assets and liabilities denominated in foreign currencies are recognized in the consolidated statements of comprehensive income.
The Company has recorded foreign currency transaction gains/(losses) of A$112,075, (A$959,343) and (A$918,479) in each of the years ended December 31, 2016, 2015 and 2014, respectively.
F-28
Table of Contents
Universal Biosensors, Inc.
Notes to Consolidated Financial Statements
(for the years ended December 31, 2014, 2015 and 2016)
The results and financial position of all the Group entities that have a functional currency different from the reporting currency are translated into the reporting currency as follows:
| • | assets and liabilities for each balance sheet item reported are translated at the closing rate at the date of that balance sheet; |
| • | income and expenses for each income statement item reported are translated at average exchange rates (unless this is not a reasonable approximation of the effect of the rates prevailing on the transaction dates, in which case income and expenses are translated at the dates of the transactions); and |
| • | all resulting exchange differences are recognized as a separate component of equity. |
On consolidation, exchange differences arising from the translation of any net investment in foreign entities are taken to the Accumulated Other Comprehensive Income.
Commitments and Contingencies
Liabilities for loss contingencies, arising from claims, assessments, litigation, fines, and penalties and other sources are recorded when it is probable that a liability has been incurred and the amount of the assessment can be reasonably estimated. These were nil as at December 31, 2016.
Patent and License Costs
Legal and maintenance fees incurred for patent application costs have been charged to expense and reported in general and administrative expense.
Clinical Trial Expenses
Clinical trial costs are a component of research and development expenses. These expenses include fees paid to participating hospitals and other service providers, which conduct certain testing activities on behalf of the Company. Depending on the timing of payments to the service providers and the level of service provided, the Company records prepaid or accrued expenses relating to these costs.
These prepaid or accrued expenses are based on estimates of the work performed under service agreements.
Leased Assets
All of the Company’s leases for the years ended December 31, 2016, 2015 and 2014 are considered operating leases. The costs of operating leases are charged to the consolidated statements of comprehensive income on a straight-line basis over the lease term.
Stock-based Compensation
We measure stock-based compensation at grant date, based on the estimated fair value of the award, and recognize the cost as an expense on a straight-line basis over the vesting period of the award. We estimate the fair value of stock options using the Trinomial Lattice model. We also grant our employees Restricted Stock Units (“RSUs”) and ZEPOs. RSUs are stock awards granted to employees that entitle the holder to shares of common stock as the award vests. ZEPOs are stock options granted to employees that entitle the holder to shares of common stock as the award vests. The value of RSUs are determined and fixed on the grant date based on the Company’s stock price. The exercise price of ZEPOs is nil. See note 5 for further details.
We record deferred tax assets for awards that will result in deductions on our income tax returns, based on the amount of compensation cost recognized and our statutory tax rate in the jurisdiction in which we will receive a deduction. Differences between the deferred tax assets recognized for financial reporting purposes and the actual tax deduction reported in our income tax return are recorded in expense or in capital in excess of par value if the tax deduction exceeds the deferred tax assets or to the extent that previously recognized credits to paid-in-capital are still available if the tax deduction is less than the deferred tax asset.
F-29
Table of Contents
Universal Biosensors, Inc.
Notes to Consolidated Financial Statements
(for the years ended December 31, 2014, 2015 and 2016)
Employee Benefit Costs
UBS contributes to standard defined contribution superannuation funds on behalf of all its UBS employees. This contribution amount, formerly equal to 9.25% of each employee’s salary, was increased by law to 9.50% from July 1, 2014 of each such employee’s salary. Superannuation is a compulsory savings program whereby employers are required to pay a portion of an employee’s remuneration to an approved superannuation fund that the employee is typically not able to access until they have reached the statutory requirement age. Whilst the Company has a third party default superannuation fund, it permits UBS employees to choose an approved and registered superannuation fund into which the contributions are paid. Contributions are charged to the consolidated statements of comprehensive income as they become payable.
Registered Retirement Savings Plan and Deferred Sharing Profit Plan
The Company provides eligible HRL employees a retirement plan through Sun Life Assurance Company of Canada. The retirement plan includes a Registered Retirement Savings Plan (“RRSP”) and Deferred Profit Sharing Plan (“DPSP”). The RRSP is voluntary and the employee contributions are matched by the Company up to a maximum of 5% based on their continuous years of service and placed into the DPSP. The Company contributes 1% to 2% of the employee’s base earnings towards the DPSP. The DPSP contributions are vested immediately.
Benefit Plan
The Company provides eligible HRL employees through Sun Life Assurance Company of Canada a Benefit Plan to its employees. In general, the Benefit Plan includes extended health care, dental care, basic life insurance, basic accidental death and dismemberment, and disability insurance.
Net Income/(Loss per) Share and Anti-dilutive Securities
Basic and diluted net income/(loss) per share is presented in conformity with ASC 260 – Earnings per Share. Basic net income/(loss) per share has been computed using the weighted-average number of common shares outstanding during the period. Diluted net income/(loss) per share is calculated by adjusting the basic net income/(loss) per share by assuming all dilutive potential ordinary shares are converted.
Total Comprehensive Income
The Company follows ASC 220 – Comprehensive Income. Comprehensive income is defined as the total change in shareholders’ equity during the period other than from transactions with shareholders, and for the Company, includes net income.
The tax effect allocated to each component of other comprehensive income is as follows:
| Before-Tax Amount |
Tax (Expense)/ Benefit |
Net-of-Tax Amount |
||||||||||
| A$ | A$ | A$ | ||||||||||
| 2016 |
||||||||||||
| Foreign currency translation reserve |
109 | 0 | 109 | |||||||||
| Reclassification for gains realised in net income |
0 | 0 | 0 | |||||||||
|
|
|
|
|
|
|
|||||||
| Other comprehensive gain |
109 | 0 | 109 | |||||||||
|
|
|
|
|
|
|
|||||||
| 2015 |
||||||||||||
| Unrealized loss on derivative instruments |
0 | 0 | 0 | |||||||||
| Reclassification for gains realised in net income |
0 | 0 | 0 | |||||||||
|
|
|
|
|
|
|
|||||||
| Other comprehensive gain |
0 | 0 | 0 | |||||||||
|
|
|
|
|
|
|
|||||||
| 2014 |
||||||||||||
| Unrealized loss on derivative instruments |
0 | 0 | 0 | |||||||||
| Reclassification for gains realised in net income |
0 | 0 | 0 | |||||||||
|
|
|
|
|
|
|
|||||||
| Other comprehensive gain |
0 | 0 | 0 | |||||||||
|
|
|
|
|
|
|
|||||||
F-30
Table of Contents
Universal Biosensors, Inc.
Notes to Consolidated Financial Statements
(for the years ended December 31, 2014, 2015 and 2016)
Business combinations
Business combinations are accounted for using the acquisition method of accounting. Acquisition cost is measured as the aggregate of the fair value at the date of acquisition of the assets given, equity instruments issued or liabilities incurred or assumed. Acquisition related costs are expensed as incurred (except for those costs arising on the issue of equity instruments which are recognised directly in equity). Identifiable assets acquired and liabilities and contingent liabilities assumed in a business combination are measured at fair value on the acquisition date. Goodwill is measured as the excess of the acquisition cost, the amount of any non-controlling interest and the fair value of any previous UBI equity interest in the acquiree, over the fair value of the identifiable net assets acquired.
Recent Accounting Pronouncements
On May 28, 2014, the FASB issued ASU 2014-09 which outlines a single comprehensive model for entities to use in accounting for revenue arising from contracts with customers and supersedes most current revenue recognition guidance, including industry-specific guidance.
The core principle of the revenue model is that “an entity recognizes revenue to depict the transfer of promised goods or services to customers in an amount that reflects the consideration to which the entity expects to be entitled in exchange for those goods or services.” In applying the revenue model to contracts within its scope, an entity will:
| • | Identify the contract(s) with a customer (step 1). |
| • | Identify the performance obligations in the contract (step 2). |
| • | Determine the transaction price (step 3). |
| • | Allocate the transaction price to the performance obligations in the contract (step 4). |
| • | Recognize revenue when (or as) the entity satisfies a performance obligation (step 5). |
The ASU applies to all contracts with customers except those that are within the scope of other topics in the FASB Accounting Standards Codification. Certain of the ASU’s provisions also apply to transfers of nonfinancial assets, including in-substance nonfinancial assets that are not an output of an entity’s ordinary activities (e.g., sales of (1) property, plant, and equipment; (2) real estate; or (3) intangible assets). Existing accounting guidance applicable to these transfers (e.g., ASC 360-20) has been amended or superseded.
Compared with current U.S. GAAP, the ASU also requires significantly expanded disclosures about revenue recognition.
The ASU is effective for annual reporting periods (including interim reporting periods within those periods) beginning after December 15, 2016, for public entities. Early application is not permitted (however, early adoption is optional for entities reporting under IFRSs).
Entities have the option of using either a full retrospective or a modified approach to adopt the guidance in the ASU:
| • | Full retrospective application — Retrospective application would take into account the requirements in ASC 250 (with certain practical expedients). |
| • | Modified retrospective application — Under the modified approach, an entity recognizes “the cumulative effect of initially applying the ASU as an adjustment to the opening balance of retained earnings of the annual reporting period that includes the date of initial application” (revenue in periods presented in the financial statements before that date is reported under guidance in effect before the change). Using this approach, an entity applies the guidance in the ASU to existing contracts (those for which the entity has remaining performance obligations) as of, and new contracts after, the date of initial application. The ASU is not applied to contracts that were completed before the effective date (i.e., an entity has no remaining performance obligations to fulfil). Entities that elect the modified approach must disclose an explanation of the impact of adopting the ASU, including the financial statement line items and respective amounts directly affected by the standard’s application. |
On May 9, 2016, the FASB issued ASU 2016-12 which amends certain aspects on the Board’s new revenue standard, ASU 2014-09. The amendments include further clarifications on collectability, presentation of sales tax and other similar taxes collected from customers, non-cash consideration, contract modifications and completed contracts at transaction and transition technical correction.
F-31
Table of Contents
Universal Biosensors, Inc.
Notes to Consolidated Financial Statements
(for the years ended December 31, 2014, 2015 and 2016)
On May 3, 2016, the FASB issued ASU 2016-11 which rescinds certain SEC guidance from the FASB Accounting Standards Codification in response to announcements made by the SEC at the EITF’s March 3, 2016 meeting.
The Company is currently evaluating the method and impact the adoption of ASU 2014-09 will have on the Company’s consolidated financial statements.
On August 12, 2015 the FASB issued ASU 2015-14 which defers the effective date of ASU 2014-09 by one year. For public entities, the standard will be effective for annual reporting periods (including interim reporting periods within those periods) beginning after December 15, 2017. Early adoption will be permitted as of the original effective date in ASU 2014-09 (i.e., annual reporting periods beginning after December 15, 2016, including interim reporting periods within those annual periods).
On January 9, 2015, the FASB issued ASU 2015-01 to eliminate from U.S. GAAP the concept of an extraordinary item, which is an event or transaction that is both (1) unusual in nature and (2) infrequently occurring. Under the ASU, an entity will no longer (1) segregate an extraordinary item from the results of ordinary operations; (2) separately present an extraordinary item on its income statement, net of tax, after income from continuing operations; or (3) disclose income taxes and earnings-per-share data applicable to an extraordinary item. ASU 2015-01 is effective for annual periods beginning after December 15, 2015, and interim periods within those annual periods. Entities may apply the guidance prospectively or retrospectively to all prior periods presented in the financial statements. Early adoption is permitted if the guidance is applied as of the beginning of the annual period of adoption. This guidance was adopted in 2015. The adoption of this guidance has not had a material impact on the Company’s financial statements.
On April 7, 2015, the FASB issued ASU 2015-03 as part of its simplification initiative. The ASU changes the presentation of debt issuance costs in financial statements. Under the ASU, an entity presents such costs in the balance sheet as a direct deduction from the related debt liability rather than as an asset. Amortization of the costs is reported as interest expense. For public business entities, the guidance in the ASU is effective for fiscal years, and interim periods within those fiscal years, beginning after December 15, 2015. Early adoption is allowed for all entities for financial statements that have not been previously issued. Entities should apply the new guidance retrospectively to all prior periods (i.e., the balance sheet for each period should be adjusted). The adoption of this guidance has not had a material impact on the Company’s financial statements.
On July 22, 2015, the FASB issued ASU 2015-11, which requires entities to measure most inventory “at the lower of cost and net realizable value,” thereby simplifying the current guidance under which an entity must measure inventory at the lower of cost or market (market in this context is defined as one of three different measures, one of which is net realizable value). The ASU does not apply to inventories that are measured by using either the last-in, first-out method or the retail inventory method. For public business entities, the ASU is effective prospectively for annual periods beginning after December 15, 2016, and interim periods therein. Early adoption is permitted. The Company has adopted this guidance and it has not had a material impact on the Company’s financial statements.
On November 20, 2015, the FASB issued ASU 2015-17 as part of its simplification initiative (i.e., FASB’s effort to reduce the cost and complexity of certain aspects of U.S. GAAP). The ASU requires entities to present deferred tax assets (DTAs) and deferred tax liabilities (DTLs) as non-current in a classified balance sheet. It thus simplifies the current guidance, which requires entities to separately present DTAs and DTLs as current or non-current in a classified balance sheet. Netting of DTAs and DTLs by tax jurisdiction is still required under the new guidance. For public business entities, the ASU is effective for annual periods beginning after December 15, 2016, and interim periods within those annual periods. Early adoption is permitted. This guidance was adopted in 2015. The adoption of this guidance has not had a material impact on the Company’s financial statements.
On February 25, 2016, the FASB issued ASU 2016-02, its new standard on accounting for leases. ASU 2016-02 introduces a lessee model that brings most leases on the balance sheet. The new standard also aligns many of the underlying principles of the new lessor model with those in ASC 606, the FASB’s new revenue recognition standard (e.g., those related to evaluating when profit can be recognized). Furthermore, the ASU addresses other concerns related to the current leases model. For example, the ASU eliminates the requirement in current U.S. GAAP for an entity to use bright-line tests in determining lease classification. The standard also requires lessors to increase the transparency of their exposure to changes in value of their residual assets and how they manage that exposure.
F-32
Table of Contents
Universal Biosensors, Inc.
Notes to Consolidated Financial Statements
(for the years ended December 31, 2014, 2015 and 2016)
The new guidance will be effective for public business entities for annual periods beginning after December 15, 2018, and interim periods therein. Early adoption is permitted. The Company is currently evaluating the impact the adoption of ASU 2016-02 will have on the Company’s consolidated financial statements.
On March 17, 2016, the FASB issued ASU 2016-08, which amends the principal-versus agent implementation guidance and illustrations in the Board’s new revenue standard (ASU 2014-09). The FASB issued the ASU in response to concerns identified by stakeholders, including those related to (1) determining the appropriate unit of account under the revenue standard’s principal-versus-agent guidance and (2) applying the indicators of whether an entity is a principal or an agent in accordance with the revenue standard’s control principle.
Among other things, the ASU clarifies that an entity should evaluate whether it is the principal or the agent for each specified good or service promised in a contract with a customer. As defined in the ASU, a specified good or service is “a distinct good or service (or a distinct bundle of goods or services) to be provided to the customer.” Therefore, for contracts involving more than one specified good or service, the entity may be the principal for one or more specified goods or services and the agent for others.
The ASU has the same effective date as the new revenue standard (as amended by the one-year deferral and the early adoption provisions in ASU 2015-14). In addition, entities are required to adopt the ASU by using the same transition method they used to adopt the new revenue standard. The Company is currently evaluating the impact the adoption of ASU 2016-08 will have on the Company’s consolidated financial statements.
On March 30, 2016, the FASB issued ASU 2016-09, which simplifies several aspects of the accounting for employee share-based payment transactions for both public and non-public entities, including the accounting for income taxes, forfeitures, and statutory tax withholding requirements, as well as classification in the statement of cash flows. For Public Business Entities, the ASU is effective for annual reporting periods beginning after December 15, 2016, including interim periods within those annual reporting periods. For all other entities, the ASU is effective for annual reporting periods beginning after December 15, 2017, and interim periods within annual reporting periods beginning after December 15, 2018. The adoption of this guidance has not had a material impact on the Company’s financial statements.
On August 26, 2016, the FASB issued ASU 2016-15, which amends the guidance in ASC 230 on the classification of certain cash receipts and payments in the statement of cash flows. The primary purpose of the ASU is to reduce the diversity in practice that has resulted from the lack of consistent principles on this topic. The ASU’s amendments add or clarify guidance on eight cash flow issues:
| • | Debt prepayment or debt extinguishment costs. |
| • | Settlement of zero-coupon debt instruments or other debt instruments with coupon interest rates that are insignificant in relation to the effective interest rate of the borrowing. |
| • | Contingent consideration payments made after a business combination. |
| • | Proceeds from the settlement of insurance claims. |
| • | Proceeds from the settlement of corporate-owned life insurance policies, including bank-owned life insurance policies. |
| • | Distributions received from equity method investees. |
| • | Beneficial interests in securitization transactions. |
| • | Separately identifiable cash flows and application of the predominance principle. |
For public business entities, the guidance in the ASU is effective for fiscal years beginning after December 15, 2017, including interim periods within those fiscal years. For all other entities, it is effective for fiscal years beginning after December 15, 2018, and interim periods within fiscal years beginning after December 15, 2019. Early adoption is permitted for all entities. The Company has adopted this guidance and it has not had a material impact on the Company’s financial statements.
On November 17, 2016, the FASB issued ASU 2016-18, which amends ASC 230 to add or clarify guidance on the classification and presentation of restricted cash in the statement of cash flows. For public business entities, the guidance is effective for fiscal years beginning after December 15, 2017, including interim periods therein. For all other entities, it is effective for fiscal years beginning after December 15, 2018, and interim periods thereafter. Early adoption is permitted for all entities. The Company is currently evaluating the impact the adoption of ASU 2016-18 will have on the Company’s consolidated financial statements.
F-33
Table of Contents
Universal Biosensors, Inc.
Notes to Consolidated Financial Statements
(for the years ended December 31, 2014, 2015 and 2016)
On October 24, 2016, the FASB issued ASU 2016-16, which removes the prohibition in ASC 740 against the immediate recognition of the current and deferred income tax effects of intra-entity transfers of assets other than inventory. For public business entities, the ASU is effective for annual periods beginning after December 15, 2017, and interim periods within those annual periods. For all other entities, the ASU is effective for annual periods beginning after December 15, 2018, and interim periods within annual periods beginning after December 15, 2019. Early adoption is permitted for all entities as of the beginning of a fiscal year for which neither the annual or interim (if applicable) financial statements have been issued. If an entity chooses to early adopt the amendments in the ASU, it must do so in the first interim period of its annual financial statements (if the entity issues interim financial statements). That is, an entity cannot adopt the amendments in the ASU in a later interim period and apply them as if they were in effect as of the beginning of the year. Entities should apply the ASU’s amendments on a modified retrospective basis, recognizing the effects in retained earnings as of the beginning of the year of adoption. The Company is currently evaluating the impact the adoption of ASU 2016-16 will have on the Company’s consolidated financial statements.
On January 5, 2017, the FASB issued ASU 2017-01 to clarify the definition of a business in ASC 805, which was among the primary issues raised in connection with the FAF’s post-implementation review report on FASB Statement 141(R) (codified in ASC 805). The amendments in the ASU are intended to make application of the guidance more consistent and cost-efficient. The ASU is effective for public business entities for annual periods beginning after December 15, 2017, including interim periods therein. For all other entities, the ASU is effective for annual periods beginning after December 15, 2018, and interim periods within annual periods beginning after December 15, 2019. The ASU must be applied prospectively on or after the effective date, and no disclosures for a change in accounting principle are required at transition. Early adoption is permitted for transactions (i.e., acquisitions or dispositions) that occurred before the issuance date or effective date of the standard if the transactions were not reported in financial statements that have been issued or made available for issuance. The Company is currently evaluating the impact the adoption of ASU 2017-01 will have on the Company’s consolidated financial statements.
On January 26, 2017, the FASB issued ASU 2017-04, which removes the requirement to compare the implied fair value of goodwill with its carrying amount as part of step 2 of the goodwill impairment test. As a result, under the ASU, “an entity should perform its annual, or interim, goodwill impairment test by comparing the fair value of a reporting unit with its carrying amount [and] should recognize an impairment charge for the amount by which the carrying amount exceeds the reporting unit’s fair value; however, the loss recognized should not exceed the total amount of goodwill allocated to that reporting unit.” The ASU is effective prospectively for fiscal years beginning after December 15, 2019 for public business entities that are SEC filers. Early adoption is permitted for interim or annual goodwill impairment tests performed on testing dates after January 1, 2017. The Company is currently evaluating the impact the adoption of ASU 2017-04 will have on the Company’s consolidated financial statements.
Revision
Beginning in 2016, the Company has classified patent application costs (including legal and maintenance fees) within the general and administrative expense line in the Consolidated Statement of Comprehensive Income/(Loss). As a result, patent application costs of A$643,000 in 2015 and A$520,000 in 2014 have been reclassified from Research and development expenses to General and administrative expenses to conform to current year classification. The Company has concluded that this reclassification was not material to the Consolidated Statements of Comprehensive Income/(Loss) and the reclassification had no impact on the pre-tax income, net income or earnings per share for the years ended December 31, 2015 and 2014.
F-34
Table of Contents
Universal Biosensors, Inc.
Notes to Consolidated Financial Statements
(for the years ended December 31, 2014, 2015 and 2016)
| (3) | Commitments and Contingent Liabilities |
For details on our contingent liabilities, see Notes to Consolidated Financial Statements – Note 2, Summary of Significant Accounting Policies.
Operating Leases
The lease for 1 Corporate Avenue, Rowville Victoria expires on March 31, 2019, with two options to renew the lease each for successive five-year periods. The Company’s primary bank has issued a bank guarantee of A$250,000 in relation to a rental bond to secure the payments under the lease. This bank guarantee is secured by a security deposit held at the bank and has been recorded as “Other non-current assets” in consolidated balance sheets.
In accordance with the terms of the lease, the lessee has to restore part of the building upon vacating the premises.
HRL leases approximately 482 square meters of office and laboratory facilities at 15(H) Wing, Second Floor, 711 Concession Street, Hamilton, Ontario. The lease for 711 Concession Street expires on January 31, 2020 with 2 further options to renew each for 5 years.
The Company has also entered into a lease with respect to certain office equipment. The lease is for a period of 60 months which commenced in November 2012.
Future minimum lease payments under non-cancelable operating leases (with initial or remaining lease terms in excess of one year) as of December 31, 2016 are:
| A$ | ||||
| Less than 1 year |
673,069 | |||
| 1 – 3 years |
941,608 | |||
| 3 – 5 years |
0 | |||
| More than 5 years |
0 | |||
|
|
|
|||
| Total minimum lease payments |
1,614,677 | |||
|
|
|
|||
Rent expense was A$626,437, A$647,104 and A$551,119 for the fiscal years ended December 31, 2016, 2015 and 2014, respectively.
Guarantees
There are cross guarantees given by Universal Biosensors, Inc. and Universal Biosensors Pty Ltd as described in note 15. No deficiencies of assets exist in any of these companies. No liability was recognized by the parent entity or the consolidated entity in relation to this guarantee, as the fair value of the guarantees is immaterial.
Government grants
UBS was awarded a grant from the Commonwealth of Australia under the Next Generation Manufacturing Investment Programme up to a maximum grant amount of A$575,000 payable over a three year period commencing from January 1, 2017. The grants are paid upon achievement of pre-agreed milestones. The milestones generally relate to UBS placing purchase orders, commissioning upgrades and validating the equipment. Amongst other reasons, the Commonwealth of Australia may terminate the grant agreement for breach of the agreement by UBS or for failure to undertake the required programme. Under these circumstances, the Commonwealth of Australia may require UBS to repay some or the entire grant. The Company continues to undertake the project funded by the Commonwealth of Australia.
No amounts have been received under this grant to date. In the event UBS had achieved milestones and received grant payments, it believes that the likelihood of being required to repay grant funding is remote because the Company continues to act in good faith with respect to the grant.
F-35
Table of Contents
Universal Biosensors, Inc.
Notes to Consolidated Financial Statements
(for the years ended December 31, 2014, 2015 and 2016)
| (4) | Income Taxes |
The Company is subject to income tax in Australia and is required to pay taxes on its Australian profits. As provided under the Australian income tax laws, UBI and its wholly owned resident subsidiary UBS have formed a tax-consolidated group. UBI is required to lodge U.S. federal income tax returns and HRL is required to lodge tax returns in Canada. UBI and HRL are currently in a tax loss situation.
A reconciliation of the (benefit)/provision for income taxes with the amount computed by applying the Australian statutory company tax rate of 30% to the net income/(loss) before income taxes is as follows:
| Years ended December 31, | ||||||||||||||||||||||||
| 2016 | 2015 | 2014 | ||||||||||||||||||||||
| A$ | % | A$ | % | A$ | % | |||||||||||||||||||
| Net income/(loss) before income taxes |
1,347,547 | (6,576,416 | ) | (9,316,127 | ) | |||||||||||||||||||
| Computed by applying income |
404,264 | 30 | (1,972,925 | ) | 30 | (2,794,838 | ) | 30 | ||||||||||||||||
| Research & development incentive |
2,664,682 | 197 | 3,560,728 | (54 | ) | 2,502,701 | (27 | ) | ||||||||||||||||
| Disallowed expenses/(income): |
||||||||||||||||||||||||
| Share based payment |
(395,343 | ) | (29 | ) | (19,480 | ) | 0 | (188,360 | ) | 2 | ||||||||||||||
| Other |
(12,460 | ) | (1 | ) | 120,837 | (2 | ) | 3,136 | 0 | |||||||||||||||
| Change in valuation allowance |
(2,661,143 | ) | (197 | ) | (1,689,160 | ) | 26 | 477,361 | (5 | ) | ||||||||||||||
|
|
|
|
|
|
|
|
|
|
|
|
|
|||||||||||||
| Income tax expense/(benefit) |
0 | 0 | 0 | 0 | 0 | 0 | ||||||||||||||||||
|
|
|
|
|
|
|
|
|
|
|
|
|
|||||||||||||
The components of our net income/(loss) before income taxes as either domestic or foreign is as follows:
| As of December 31, | ||||||||||||
| 2016 | 2015 | 2014 | ||||||||||
| A$ | A$ | A$ | ||||||||||
| Foreign |
0 | 0 | 0 | |||||||||
| Domestic (Australia) |
1,347,547 | (6,576,416 | ) | (9,316,127 | ) | |||||||
|
|
|
|
|
|
|
|||||||
| 1,347,547 | (6,576,416 | ) | (9,316,127 | ) | ||||||||
|
|
|
|
|
|
|
|||||||
Significant component of the Company’s deferred tax assets are shown below:
| As of December 31, | ||||||||
| 2016 A$ | 2015 A$ | |||||||
| Deferred tax assets: |
||||||||
| Operating loss carry forwards |
6,784,868 | 9,527,727 | ||||||
| Unamortized capital raising cost |
0 | 38,395 | ||||||
| Depreciation and amortization |
1,372,387 | 1,270,986 | ||||||
| Asset retirement obligations |
780,000 | 780,000 | ||||||
| Employee entitlements |
493,406 | 442,712 | ||||||
| Accruals |
1,513,551 | 1,667,495 | ||||||
| Decline in value of patents |
1,096,101 | 949,423 | ||||||
| Unrealized exchange loss |
75,887 | 645,095 | ||||||
| Other |
(9,791 | ) | (178,958 | ) | ||||
|
|
|
|
|
|||||
| Total deferred tax assets |
12,106,409 | 15,142,875 | ||||||
| Valuation allowance for deferred tax assets |
(12,106,409 | ) | (15,142,875 | ) | ||||
|
|
|
|
|
|||||
| Net deferred tax asset |
0 | 0 | ||||||
|
|
|
|
|
|||||
Significant components of deferred income taxes reflect the net tax effect of temporary differences between the carrying amounts of assets and liabilities for financial reporting and tax purposes. A valuation allowance has been established, as realization of such assets is not more likely than not.
F-36
Table of Contents
Universal Biosensors, Inc.
Notes to Consolidated Financial Statements
(for the years ended December 31, 2014, 2015 and 2016)
At December 31, 2016 the Company has A$22,616,230 (A$32,032,988 at December 31, 2015) of accumulated tax losses available for carry forward against future earnings, which under Australian tax laws do not expire but may not be available under certain circumstances. The Company also has A$5,800,672 of non-refundable R&D tax offset as at December 31, 2016 and 2015. The R&D Tax offset is a non-refundable tax offset, which assists to reduce a company’s tax liability. Once the liability has been reduced to zero, any excess offset may be carried forward into future income years. UBI has US tax losses available for carry forward against future earnings of US$1,011,321 as of December 31, 2016 and 2015.
| (5) | Employee Incentive Schemes |
| (a) | Stock Option Plan |
In 2004, the Company adopted an employee option plan (“Plan”). Options may be granted pursuant to the Plan to any person considered by the board to be employed by the Group on a permanent basis (whether full time, part time or on a long term casual basis). Each option gives the holder the right to subscribe for one share of common stock. The total number of options that may be issued under the Plan is such maximum amount permitted by law and the Listing Rules of the Australian Securities Exchange (“ASX”). The exercise price and any exercise conditions are determined by the board at the time of grant of the options. Any exercise conditions must be satisfied before the options vest and become capable of exercise. The options lapse on such date determined by the board at the time of grant or earlier in accordance with the Plan. Options granted to date have had a term up to 10 years and generally vest in equal tranches over three years.
An option holder is not permitted to participate in a bonus issue or new issue of securities in respect of an option held prior to the issue of shares to the option holder pursuant to the exercise of an option. If the Company changes the number of issued shares through or as a result of any consolidation, subdivision, or similar reconstruction of the issued capital of the Company, the total number of options and the exercise price of the options (as applicable) will likewise be adjusted. Options granted in 2014, 2015 and 2016 were 152,000, 1,015,000, and 9,291,000, respectively.
In accordance with ASC 718, the fair value of the option grants was estimated on the date of each grant using the Trinomial Lattice model. The assumptions for these grants were:
| Dec-16 | Apr-16 | Dec-15 | Jan-15 | Jan-15 | Aug-14 | |||||||||||||||||||
| Exercise Price (A$) |
0.33 | 0.50 | 0.45 | 0.00 | 0.23 | 0.17 | ||||||||||||||||||
| Share Price at Grant Date (A$) |
0.33 | 0.29 | 0.45 | 0.23 | 0.23 | 0.17 | ||||||||||||||||||
| Volatility |
69 | % | 70 | % | 70 | % | 72 | % | 72 | % | 71 | % | ||||||||||||
| Expected Life (years) |
7 | 7 | 7 | 7 | 7 | 7 | ||||||||||||||||||
| Risk Free Interest Rate |
2.60 | % | 2.23 | % | 2.56 | % | 2.27 | % | 2.27 | % | 3.13 | % | ||||||||||||
| Fair Value of Option (A$) |
0.19 | 0.08 | 0.26 | 0.23 | 0.14 | 0.10 | ||||||||||||||||||
Each of the inputs to the Trinomial Lattice model is discussed below.
Share Price and Exercise Price at Valuation Date
With the exception of ZEPOs, the value of all other options granted has been determined using the closing price of our common stock trading in the form of CDIs on ASX at the time of grant of the options. ZEPOs exercise price are nil. The ASX is the only exchange upon which our securities are quoted.
Volatility
We applied volatility having regard to the historical price change of our shares in the form of CDIs available from the ASX.
Time to Expiry
All options granted under our share option plan have a maximum 10 year term and are non-transferable.
Risk free rate
The risk free rate which we applied is equivalent to the yield on an Australian government bond with a time to expiry approximately equal to the expected time to expiry on the options being valued.
F-37
Table of Contents
Universal Biosensors, Inc.
Notes to Consolidated Financial Statements
(for the years ended December 31, 2014, 2015 and 2016)
Stock option activity during the current period is as follows:
| Number of shares | Weighted average issue price A$ |
|||||||
| Balance at December 31, 2015 |
9,709,661 | 0.99 | ||||||
| Granted |
9,291,000 | 0.50 | ||||||
| Exercised |
(77,500 | ) | 0.00 | |||||
| Lapsed |
(2,658,992 | ) | 1.25 | |||||
|
|
|
|
|
|||||
| Balance at December 31, 2016 |
16,264,169 | 0.67 | ||||||
|
|
|
|
|
|||||
At December 31, 2016, the number of options exercisable was 11,941,626 (2015: 8,662,448 and 2014: 8,611,392). At December 31, 2016, total stock compensation income recognized in the consolidated condensed statements of comprehensive income was A$1,317,809 (2015: A$64,932 and 2014: A$627,868).
The following table represents information relating to stock options outstanding under the plans as of December 31, 2016:
| Options Outstanding |
Options Exercisable Shares | |||||||
| Exercise Price A$ |
Shares |
Weighted average remaining life in years |
||||||
| $ 1.18 | 529,000 | 0 | 529,000 | |||||
| $ 1.20 | 525,000 | 1 | 525,000 | |||||
| $ 0.89 | 645,000 | 1 | 645,000 | |||||
| $ 0.70 | 102,000 | 2 | 102,000 | |||||
| $ 0.50 | 8,000 | 2 | 8,000 | |||||
| $ 0.00 | 50,001 | 2 | 50,001 | |||||
| $ 0.00 | 388,334 | 2 | 388,334 | |||||
| $ 0.94 | 698,667 | 2 | 698,667 | |||||
| $ 1.72 | 1,095,000 | 3 | 1,095,000 | |||||
| $ 1.60 | 50,000 | 0 | 50,000 | |||||
| $ 1.58 | 216,000 | 1 | 216,000 | |||||
| $ 0.00 | 91,667 | 1 | 91,667 | |||||
| $ 1.37 | 213,000 | 1 | 213,000 | |||||
| $ 1.00 | 66,000 | 2 | 66,000 | |||||
| $ 0.89 | 222,500 | 2 | 222,500 | |||||
| $ 0.00 | 100,000 | 2 | 100,000 | |||||
| $ 0.75 | 50,000 | 2 | 50,000 | |||||
| $ 0.73 | 74,000 | 3 | 74,000 | |||||
| $ 1.09 | 270,000 | 3 | 270,000 | |||||
| $ 0.00 | 100,000 | 3 | 100,000 | |||||
| $ 0.79 | 24,000 | 3 | 24,000 | |||||
| $ 0.71 | 30,000 | 4 | 30,000 | |||||
| $ 0.49 | 290,000 | 4 | 290,000 | |||||
| $ 0.00 | 160,000 | 4 | 160,000 | |||||
| $ 0.17 | 80,000 | 5 | 53,333 | |||||
| $ 0.23 | 352,500 | 5 | 234,970 | |||||
| $ 0.00 | 160,000 | 5 | 106,664 | |||||
| $ 0.45 | 382,500 | 6 | 127,490 | |||||
| $ 0.50 | 9,035,000 | 6 | 5,421,000 | |||||
| $ 0.33 | 256,000 | 7 | 0 | |||||
|
|
| |||||||
| 16,264,169 | 11,941,626 | |||||||
|
|
| |||||||
F-38
Table of Contents
Universal Biosensors, Inc.
Notes to Consolidated Financial Statements
(for the years ended December 31, 2014, 2015 and 2016)
The table below sets forth the number of employee stock options exercised and the number of shares issued in the period from December 31, 2014. We issued these shares in reliance upon exemptions from registration under Regulation S under the Securities Act of 1933, as amended.
| Period Ending |
Number of Options Exercised and Corresponding Number of Shares Issued |
Weighted Average Exercise Price |
Proceeds Received (A$) |
|||||||||
| 2014 |
8,333 | A$ | 0.00 | 0 | ||||||||
| 2015 |
72,496 | US$ | 0.26 | 26,127 | ||||||||
| 2016 |
77,500 | 0.00 | 0 | |||||||||
As of December 31, 2016, there was A$244,924 of unrecognized compensation expense related to unvested share-based compensation arrangements under the Employee Option Plan. This expense is expected to be recognized as follows:
| Fiscal Year |
A$ | |||
| 2017 |
166,139 | |||
| 2018 |
73,396 | |||
| 2019 |
5,389 | |||
|
|
|
|||
| 244,924 | ||||
|
|
|
|||
The aggregate intrinsic value for all options outstanding as at December 31, 2016 was zero.
| (b) | Restricted Share Plan |
Our Employee Share Plan was adopted by the Board of Directors in 2009. The Employee Share Plan permits our Board to grant shares of our common stock to our employees and directors (although our Board has determined not to issue equity to non-executive directors). The number of shares able to be granted is limited to the amount permitted to be granted at law, the ASX Listing Rules and by the limits on our authorized share capital in our certificate of incorporation. All our employees are eligible for shares under the Employee Share Plan. The Company currently proposes to continue to issue A$1,000 worth of restricted shares of common stock to employees of the Company on a recurring basis, but no more frequently than annually. The restricted shares have the same terms of issue as our existing shares of common stock but are not able to be traded until the earlier of three years from the date on which the shares are issued or the date the relevant employee ceases to be an employee of the Company or any of its associated group of companies.
The table below sets forth the restricted shares issued by the Company since January 1, 2014:
| Number of Restricted Shares Issued |
Market Value of Restricted Shares Issued (A$) |
|||||||
| June, 2014 |
2,040 | 1,000 | ||||||
| January, 2015 |
282,555 | 64,988 | ||||||
| July, 2015 |
4,347 | 1,000 | ||||||
| December, 2015 |
142,208 | 63,994 | ||||||
| February, 2016 |
15,000 | 6,000 | ||||||
| December, 2016 |
181,800 | 59,994 | ||||||
Restricted stock awards activity during the current period is as follows:
| Number of shares | Weighted average issue price (A$) |
|||||||
| Balance at December 31, 2015 |
542,816 | 0.35 | ||||||
| Granted |
196,800 | 0.34 | ||||||
| Release of restricted shares |
(164,036 | ) | 0.44 | |||||
|
|
|
|
|
|||||
| Balance at December 31, 2016 |
575,580 | 0.31 | ||||||
|
|
|
|
|
|||||
F-39
Table of Contents
Universal Biosensors, Inc.
Notes to Consolidated Financial Statements
(for the years ended December 31, 2014, 2015 and 2016)
| (6) | Related Party Transactions |
Details of related party transactions material to the operations of the Group other than compensation arrangements, expense allowances, and other similar items in the ordinary course of business, are set out below:
In September 2011, we entered into a non-exclusive license agreement with SpeeDx Pty Ltd (“SpeeDx”) pursuant to which SpeeDx granted us a license to use its proprietary MNAzyme technology in the field of molecular diagnostics. Under the agreement we make milestone payments totaling A$500,000 to SpeeDx if certain specified targets are achieved, and royalty payments ranging from 5% to 15% of that portion of our sales and licensing revenues arising from SpeeDx technology or products incorporating SpeeDx technology.
The license agreement and the obligation to pay royalties continues until SpeeDx’s patent rights have expired, lapsed, are found to be invalid or are rejected. The agreement will terminate by mutual agreement or by one party for breach or insolvency of the other. SpeeDx may also terminate the license agreement if the research and development on a first licensed product is not completed by UBS within 7 years (subject to certain exceptions), and UBS may terminate if it determines that it does not wish to proceed with further commercialization of SpeeDx’s technology.
In August 2013, we entered into a consulting agreement with SpeeDx pursuant to which we provided certain services relating to the establishment and maintenance of a quality management system at SpeeDx. Consulting fees received under this agreement in 2014 were A$77,758. In addition, a success fee of A$50,000 was paid by SpeeDx in 2014 as the criteria for successful completion of the engagement was met.
Mr. Denver is a director of the Company and SpeeDx. Talu Ventures Pty Ltd, of which Mr. Jane is a director, is a fund manager of a fund which holds approximately 33% of the issued shares in SpeeDx. Mr. Jane resigned as a director of the Company in March 2015. Until September 27, 2013, PFM Cornerstone Limited held approximately 6% of our shares (PFM Cornerstone Limited no longer holds any of our shares), and until June 28, 2016, PFM Cornerstone Limited also held approximately 33% of the issued shares in SpeeDx. Messrs Denver and Hanley are directors of the Company and until June 28, 2016 were directors of PFM Cornerstone Limited. Mr. Hanley is now a director of Biotech Investment Holdings 1 Pty Ltd and Biotech Investment Holdings 2 Pty Ltd which each respectively own approximately 14% of the issued share capital of SpeeDx.
Mr. Coleman is a director of the Company and Executive Chairman of Viburnum Funds Pty Ltd. Viburnum Funds Pty Ltd, as an investment manager for its associated funds holds a beneficial interest and voting power over approximately 15.51% of our shares.
| (7) | Financial Instruments |
Financial Assets
| Years Ended December 31, | ||||||||
| 2016 | 2015 | |||||||
| A$ | A$ | |||||||
| Financial assets: |
||||||||
| Cash and cash equivalents |
20,402,322 | 14,350,307 | ||||||
| Accounts receivables |
4,848,009 | 3,153,584 | ||||||
| Financial instruments |
0 | 0 | ||||||
|
|
|
|
|
|||||
| Total financial assets |
25,250,331 | 17,503,891 | ||||||
|
|
|
|
|
|||||
| Debt: |
||||||||
| Short term borrowings |
369,630 | 324,459 | ||||||
| Long term secured loan |
20,286,827 | 19,868,560 | ||||||
|
|
|
|
|
|||||
| Total debt |
20,656,457 | 20,193,019 | ||||||
|
|
|
|
|
|||||
| Net financial assets/(liabilities) |
4,593,874 | (2,689,128 | ) | |||||
|
|
|
|
|
|||||
The carrying value of the cash and cash equivalents and the accounts receivable approximates fair value because of their short-term nature.
We regularly review all our financial assets for impairment. There were no impairments recognized in 2016, 2015 and 2014.
F-40
Table of Contents
Universal Biosensors, Inc.
Notes to Consolidated Financial Statements
(for the years ended December 31, 2014, 2015 and 2016)
Derivative Instruments and Hedging Activities
We had no outstanding contracts as at December 31, 2016, 2015 and 2014, respectively. During the years ended December 31, 2016, 2015 and 2014, we recognized gains of nil. No amount of ineffectiveness was recorded in earnings for these designated cash flow hedges for the years ended December 31, 2016, 2015 and 2014. For further details, see Notes to Consolidated Financial Statements – Note 2, Summary of Significant Accounting Policies.
| (8) | Property, Plant and Equipment, net |
| As of December, 31 | ||||||||
| 2016 | 2015 | |||||||
| A$ | A$ | |||||||
| Plant and equipment |
25,913,814 | 24,676,687 | ||||||
| Leasehold improvements |
8,952,420 | 8,943,645 | ||||||
| Capital work in process |
1,943,032 | 1,943,032 | ||||||
|
|
|
|
|
|||||
| 36,809,266 | 35,563,364 | |||||||
| Accumulated depreciation |
(25,282,248 | ) | (22,655,162 | ) | ||||
|
|
|
|
|
|||||
| Property, plant & equipment, net |
11,527,018 | 12,908,202 | ||||||
|
|
|
|
|
|||||
Capital work in process relates to assets under construction and comprises primarily specialized manufacturing equipment. Legal right to the assets under construction rests with the Company. The amounts capitalized for capital work in process represent the percentage of expenditure that has been completed, and once the assets are placed into service, the Company begins depreciating the respective assets. The accumulated amortisation of capitalised leasehold improvements for the fiscal years ended December 31, 2016, 2015 and 2014 was A$7,958,666, A$7,517,590, and A$7,096,926, respectively.
From 2017 to 2019, the Company is entitled to receive Commonwealth of Australia grant monies under grant agreements to support its development activities, including in connection with the purchase of plant and equipment. Plant and equipment is presented net of the government grant of A$Nil for the year ended December 31, 2016. The grants are recognized against the acquisition costs of the related plant and equipment as and when the related assets are purchased. Grants received in advance of the relevant expenditure are treated as deferred income and included in Current Liabilities on the balance sheet as the Company does not control the monies until the relevant expenditure has been incurred. Grants due to the Company under research agreements are recorded as Currents Assets on the balance sheet.
Depreciation expense was A$2,646,185, A$2,697,151, and A$2,512,946, for the fiscal years ended December 31, 2016, 2015 and 2014, respectively.
| (9) | Accrued Expenses |
Accrued expenses consist of the following:
| As of December, 31 | ||||||||
| 2016 | 2015 | |||||||
| A$ | A$ | |||||||
| Legal, tax and accounting fees |
715,251 | 559,017 | ||||||
| Salary and related costs |
56,234 | 670,154 | ||||||
| Research and development materials |
896,227 | 654,701 | ||||||
| Other |
117,422 | 21,852 | ||||||
|
|
|
|
|
|||||
| 1,785,134 | 1,905,724 | |||||||
|
|
|
|
|
|||||
| (10) | Stockholders’ Equity - Common Stock |
Holders of common stock are generally entitled to one vote per share held on all matters submitted to a vote of the holders of common stock. At any meeting of the shareholders, the presence, in person or by proxy, of the majority of the outstanding stock entitled
F-41
Table of Contents
Universal Biosensors, Inc.
Notes to Consolidated Financial Statements
(for the years ended December 31, 2014, 2015 and 2016)
to vote shall constitute a quorum. Except where a greater percentage is required by the Company’s amended and restated certificate of incorporation or by-laws, the affirmative vote of the holders of a majority of the shares of common stock then represented at the meeting and entitled to vote at the meeting shall be sufficient to pass a resolution. Holders of common stock are not entitled to cumulative voting rights with respect to the election of directors, and the common stock does not have pre-emptive rights.
Trading in our shares of common stock on ASX is undertaken using CHESS Depositary Interests (“CDIs”). Each CDI represents beneficial ownership in one underlying share. Legal title to the shares underlying CDIs is held by CHESS Depositary Nominees Pty Ltd (“CDN”), a wholly owned subsidiary of ASX.
Holders of CDIs have the same economic benefits of holding the shares, such as dividends (if any), bonus issues or rights issues as though they were holders of the legal title. Holders of CDIs are not permitted to vote but are entitled to direct CDN how to vote. Subject to Delaware General Corporation Law, dividends may be declared by the Board and holders of common stock may be entitled to participate in such dividends from time to time.
| (11) | Net Income/(Loss) per Share |
Basic net income/(loss) per ordinary share was computed by dividing the net income/(loss) applicable to common stock by the weighted-average number of common stock outstanding during the period. Warrants issued to the Lenders and options granted to employees under the Universal Biosensors Employee Option Plan are considered to be potential ordinary shares for the purpose of calculating diluted net income/(loss) per share.
| Years Ended December 31, | ||||||||||||
| 2016 | 2015 | 2014 | ||||||||||
| Weighted average shares used as denominator in calculating: |
||||||||||||
| Basic net income/(loss) per share |
176,189,052 | 175,881,165 | 175,608,634 | |||||||||
|
|
|
|
|
|
|
|||||||
| Diluted net income/(loss) per share |
177,373,769 | 175,881,165 | 175,608,634 | |||||||||
|
|
|
|
|
|
|
|||||||
The number of shares not included in the calculation of basic net income/(loss) per ordinary share because the impact would be anti-dilutive were 1,184,717, Nil and Nil for the years ended December 31, 2016, 2015 and 2014, respectively.
| (12) | Guarantees and Indemnifications |
The certificate of incorporation and amended and restated by-laws of the Company provide that the Company will indemnify officers and directors and former officers and directors in certain circumstances, including for expenses, judgments, fines and settlement amounts incurred by them in connection with their services as an officer or director of the Company or its subsidiaries, provided that such person acted in good faith and in a manner such person reasonably believed to be in the best interests of the Company, and, with respect to any criminal action or proceeding, the Company had reasonable cause to believe that such person’s conduct was not unlawful.
In addition to the indemnities provided in the certificate of incorporation and amended and restated by-laws, the Company has entered into indemnification agreements with certain of its officers and each of its directors. Subject to the relevant limitations imposed by applicable law, the indemnification agreements, among other things:
| • | indemnify the relevant officers and directors for certain expenses, judgments, fines and settlement amounts incurred by them in connection with their services as an officer or director of the Company or its subsidiaries; and |
| • | require the Company to make a good faith determination whether or not it is practicable to maintain liability insurance for officers and directors or to ensure the Company’s performance of its indemnification obligations under the agreements. |
The Company maintains directors’ and officers’ liability insurance providing for the indemnification of our directors and certain of our officers against certain liabilities incurred as a director or officer, including costs and expenses associated in defending legal proceedings. In accordance with the terms of the insurance policy and commercial practice, the amount of the premium is not disclosed.
No liability has arisen under these indemnities as of December 31, 2016.
F-42
Table of Contents
Universal Biosensors, Inc.
Notes to Consolidated Financial Statements
(for the years ended December 31, 2014, 2015 and 2016)
| (13) | Segments |
The Company operates in one segment. The principal activities of the Company are research and development, commercial manufacture of approved medical or testing devices and the provision of services including contract research work.
The Company operates predominantly in one geographical area, being Australia and continues to derive significant revenues from LifeScan.
The Company’s material long-lived assets are all based in Australia.
| (14) | Deed of Cross Guarantee |
Universal Biosensors, Inc. and its wholly owned subsidiary, Universal Biosensors Pty Ltd, are parties to a deed of cross guarantee under which each company guarantees the debts of the other. By entering into the deed, the wholly-owned entity has been relieved from the requirements to prepare a financial report and directors’ report under Class Order 98/1418 (as amended) issued by the Australian Securities and Investments Commission.
The above companies represent a “Closed Group” for the purposes of the Class Order, and as there are no other parties to the Deed of Cross Guarantee that are controlled by Universal Biosensors, Inc., they also represent the “Extended Closed Group”.
The consolidated financial statements presented within this report comprise that of Universal Biosensors, Inc. and its wholly owned subsidiary, Universal Biosensors Pty Ltd. These two entities also represent the “Closed Group” and the “Extended Closed Group”.
| (15) | Borrowings |
Future maturities, interest and other payments under the Company’s long term secured loan pursuant to the credit agreement (described below) as of December 31, 2016 is as follows:
| December 31, 2016 | December 31, 2015 | |||||||||||||||
| US$ | A$ | US$ | A$ | |||||||||||||
| 2016 |
0 | 1,761,375 | ||||||||||||||
| 2017 |
1,756,563 | 1,756,563 | ||||||||||||||
| 2018 |
16,694,000 | 16,694,000 | ||||||||||||||
| Thereafter |
0 | 0 | ||||||||||||||
|
|
|
|
|
|||||||||||||
| Total minimum payments |
18,450,563 | 20,211,938 | ||||||||||||||
| Less amount representing interest and other fees |
(3,450,563 | ) | (5,211,938 | ) | ||||||||||||
|
|
|
|
|
|||||||||||||
| Gross balance of long term debt |
15,000,000 | 15,000,000 | ||||||||||||||
| Less fair value of warrants recorded within loan (a) |
(815,655 | ) | (815,655 | ) | ||||||||||||
| Plus interest accretion |
495,203 | 331,625 | ||||||||||||||
|
|
|
|
|
|||||||||||||
| Total carrying value |
14,679,548 | 20,286,827 | 14,515,970 | 19,868,560 | ||||||||||||
|
|
|
|
|
|
|
|
|
|||||||||
| Less current portion |
0 | 0 | 0 | 0 | ||||||||||||
|
|
|
|
|
|
|
|
|
|||||||||
| Total carrying value, non-current portion |
14,679,548 | 20,286,827 | 14,515,970 | 19,868,560 | ||||||||||||
|
|
|
|
|
|
|
|
|
|||||||||
The carrying value of the borrowings approximates its fair value. The fair value is estimated by discounting future cash flows at the currently offered rates for borrowings of similar remaining maturities.
| (a) | The warrants issued in December 2013 had a fair value of US$815,655 as of December 31, 2016, and are included in equity. |
Athyrium Credit Agreement
On December 19, 2013 (“Closing Date”), UBI and its wholly owned subsidiary, UBS (together UBI and UBS, the “Transaction Parties”) entered into a credit agreement with Athyrium Opportunities Fund (A) LP (“Athyrium A”), as administrative agent (the
F-43
Table of Contents
Universal Biosensors, Inc.
Notes to Consolidated Financial Statements
(for the years ended December 31, 2014, 2015 and 2016)
“Administrative Agent”) and as a lender, and Athyrium Opportunities Fund (B) LP (“Athyrium B”) as a lender (Athyrium A and Athyrium B together with any other lenders party thereto from time to time, the “Lenders”) for a secured term loan of up to US$25 million, which was amended on January 30, 2015 (“Credit Agreement”). Of this amount, US$15 million had been drawn at December 31, 2013, with a further US$10 million available to be drawn down on or before July 31, 2015 if UBS satisfied certain conditions precedent relating to product revenues.
Whilst UBS met the commercial conditions required under the Credit Agreement to draw down an additional US$10 million, it decided not to take up the additional debt funding.
The term loan has a maturity date of December 19, 2018 (“Maturity Date”) and bears interest at 10.5% per annum payable in cash quarterly in arrears over the five year term, and as otherwise described in the Credit Agreement. A default interest rate of 13% per annum shall apply during the existence of a default under the Credit Agreement. Other than as summarized below, UBS is not required to make payments of principal for amounts outstanding under the term loan until maturity, December 19, 2018. The term loan under the Credit Agreement is secured by substantially all of UBI and UBS’ assets. UBI (together with any future subsidiaries) guarantees all of UBS’s obligations under the term loan.
Voluntary prepayments of the term loans are not permitted prior to the second anniversary of the Closing Date, except in the event of a change of control of a Transaction Party. After the second anniversary, UBS can make voluntary repayments in minimum principal amounts of US$2,500,000 together with interest, plus the premium described below. UBS must make mandatory prepayments in certain prescribed circumstances, including in the event of raising additional debt financing, a sale or transfer of assets other than in certain circumstances and in the event of other specified extraordinary receipts. Extraordinary receipts include cash received or paid other than in the ordinary course of business, such as tax refunds (other than GST and R&D tax rebates), LifeScan lump sum fee payments and Siemens termination fees. In such events, UBS must prepay to the Lenders 100% of the net cash proceeds received up to the outstanding principal amount of the loans drawn down, together with all accrued and unpaid interest thereon and all other obligations. In the event of any prepayment on or prior to the second anniversary of the Closing Date with respect to any obligations under the Credit Agreement, UBS must also pay a prepayment premium of 20% of the principal of such prepayment due and payable on the applicable date. In the event of any prepayment after the second anniversary of the Closing Date with respect to any obligations under the Credit Agreement, UBS must pay a prepayment premium commencing at 15% of the principal of such prepayment due and payable on the applicable date and reducing pro-rata on a monthly basis until the Maturity Date.
Unless the facility is otherwise terminated earlier pursuant to the terms of the Credit Agreement, UBS (as the borrower) is required to repay the outstanding principal amount of the loans drawn down, together with all accrued and unpaid interest thereon and all other obligations on Maturity Date.
UBS paid a non-refundable fee of US$625,000 to the Lenders on the Closing Date (being 2.5% of the aggregate credit facility) and a non-refundable fee of US$200,000 to the Lenders in connection with the January 2015 amendment to the Credit Agreement. A 2% commitment fee based on any available unused borrowing commitment was paid by UBS under the Credit Agreement until July 31, 2015. The Lenders are also entitled to receive 30% of the net proceeds of milestone payments paid under the Collaboration Agreement by and among UBS, UBI and Siemens, up to a maximum of US$600,000 in the aggregate of which US$300,000 was paid in February 2015 and the balance of US$300,000 was paid in August 2015 (upon receipt of two further milestone payments). UBS has also agreed to pay certain taxes arising in connection with the Credit Agreement and other Loan Documents, including withholding taxes. UBS has also agreed to pay certain reasonable out-of-pocket expenses incurred by the Lenders in connection with the loan documents including the January 2015 amendment, or as may be incurred in connection with the enforcement or protection of their rights.
The Credit Agreement also contains certain covenants, including among other things, covenants: (i) relating to the delivery of financial and other information and certificates, notices of defaults, litigation and other material events; payment of taxes and other obligations; maintenance of insurance; (ii) which limit or restrict the incurrence of liens; the making of investments; the incurrence of certain indebtedness; mergers, dispositions, liquidations, or consolidations and significant asset sales; restricted payments; transactions with affiliates other than on normal and arms-length terms; burdensome agreements; prepayment of other indebtedness; ownership of subsidiaries; and (iii) which require UBS to maintain unrestricted cash of not less than US$2,000,000 in a specified bank account at any time.
As further described below, pursuant to the Credit Agreement, UBI issued to the Lenders warrants entitling the holder to purchase up to an aggregate total of 4.5 million shares of UBI’s common stock in the form of CDIs at a price of A$1.00 per share (the
F-44
Table of Contents
Universal Biosensors, Inc.
Notes to Consolidated Financial Statements
(for the years ended December 31, 2014, 2015 and 2016)
“Exercise Price”), which represents a 117% premium over the closing price of UBI’s common stock on December 19, 2013. The warrants are immediately exercisable and have a term of seven years.
Other
In December 2015, UBS entered into an arrangement with Elantis Premium Funding Ltd to fund the Group’s 2016 insurance premium. The total amount financed was A$360,510 at inception and the short-term borrowing was fully repaid in September 2016. Interest was charged at a fixed rate of 2.60% per annum. In December 2016, UBS entered into an arrangement with Elantis Premium Funding Ltd to fund the Group’s 2017 insurance premium. The total amount financed was A$369,630 at inception and the short-term borrowing will be fully repaid in September 2017. Interest is charged at a fixed rate of 2.60% per annum. The short-term borrowing is secured by the insurance premium refund.
| (16) | Warrants |
Pursuant to the Credit Agreement, UBI issued to the Lenders warrants entitling the holder to purchase up to an aggregate total of 4.5 million shares of UBI’s common stock in the form of CDIs at a price of A$1.00 per share (the “Exercise Price”), which represents a 117% premium over the closing price of UBI’s common stock on December 19, 2013. The warrants are immediately exercisable and have a term of seven years.
The warrants may be exercised at any time until December 19, 2020, in whole or in part in minimum multiples of 500,000 shares of common stock. The holder of the warrants can pay the Exercise Price in cash or it has the right to pay all or a portion of the Exercise Price by making a cashless exercise, therefore reducing the number of shares of common stock the holder would otherwise be issued.
The warrant is subject to adjustments in the event of certain issuances by UBI, such as bonus issues, pro rata (rights) issues and reorganizations (e.g. consolidation, subdivision).
The Company assessed that the warrants are not liabilities within scope of ASC 480-10-25. The warrants are legally detachable from the loan and separately exercisable and as such meet the definition of a freestanding derivative instrument pursuant to ASC 815.
However, the scope exception in accordance with ASC 815-10-15-74 applies to warrants and it meets the requirements of ASC 815 that would be classified in stockholders’ equity. Therefore, the warrants were initially accounted for within stockholders’ equity, and subsequent changes in fair value will not be recorded. The fair value of the warrant was estimated using the Trinomial Lattice model.
The debt issuance costs were recorded as deferred issuance costs and are amortized as interest expense, using the effective interest method, over the term of the loan pursuant to ASC 835-30-35-2.
| (17) | Restricted Cash |
Restricted cash maintained by the Company in the form of term deposits is as follows:
| Years Ended December 31, | ||||||||||||
| 2016 | 2015 | 2014 | ||||||||||
| A$ | A$ | A$ | ||||||||||
| Financial covenant pursuant to the credit agreement |
2,900,000 | 2,900,000 | 2,600,000 | |||||||||
| Collateral for facilities |
320,000 | 320,000 | 320,000 | |||||||||
|
|
|
|
|
|
|
|||||||
| 3,220,000 | 3,220,000 | 2,920,000 | ||||||||||
|
|
|
|
|
|
|
|||||||
Financial covenant pursuant to the credit agreement and collateral for facilities is recorded under the caption “Other non-current assets” in the consolidated balance sheets.
F-45
Table of Contents
Universal Biosensors, Inc.
Schedule ii – Valuation and Qualifying Accounts
(for the years ended December 31, 2014, 2015 and 2016)
| Additions | ||||||||||||||||||||
| Balance at Beginning of Period |
Charged to Costs and Expenses |
Charged to Other Accounts |
Deductions | Balance at end of Period |
||||||||||||||||
| A$ | A$ | A$ | A$ | A$ | ||||||||||||||||
| Year ended December 31, 2014 |
||||||||||||||||||||
| Deferred income tax valuation allowance |
23,413,313 | 477,361 | (6,854,223 | ) | 0 | 17,036,451 | ||||||||||||||
| Year ended December 31, 2015 |
||||||||||||||||||||
| Deferred income tax valuation allowance |
17,036,451 | (1,689,161 | ) | (204,415 | ) | 0 | 15,142,874 | |||||||||||||
| Year ended December 31, 2016 |
||||||||||||||||||||
| Deferred income tax valuation allowance |
15,142,874 | (2,661,144 | ) | (375,321 | ) | 0 | 12,106,409 | |||||||||||||
F-46