Attached files
| file | filename |
|---|---|
| EX-99.1 - EXHIBIT 99.1 - SECURITY FEDERAL CORP | exhibit991-123116.htm |
| 10-K - 10-K - SECURITY FEDERAL CORP | sfdl-2016x1231x10k.htm |
| EX-99.2 - EXHIBIT 99.2 - SECURITY FEDERAL CORP | exhibit992-123116.htm |
| EX-32 - EXHIBIT 32 - SECURITY FEDERAL CORP | sfdl-ex32x123116.htm |
| EX-31.2 - EXHIBIT 31.2 - SECURITY FEDERAL CORP | sfdl-ex312x123116.htm |
| EX-31.1 - EXHIBIT 31.1 - SECURITY FEDERAL CORP | sfdl-ex311x123116.htm |
| EX-23 - EXHIBIT 23 - SECURITY FEDERAL CORP | exhibit23-123116.htm |
| EX-21 - EXHIBIT 21 - SECURITY FEDERAL CORP | exhibit21-123116.htm |
Exhibit 13
Annual Report to Stockholders
SECURITY FEDERAL CORPORATION AND SUBSIDIARIES
Management's Discussion and Analysis of Financial Condition and Results of Operations

SECURITY FEDERAL CORPORATION AND SUBSIDIARIES
Management's Discussion and Analysis of Financial Condition and Results of Operations

SECURITY FEDERAL CORPORATION AND SUBSIDIARIES
Selected Consolidated Financial and Other Data
The following table provides selected consolidated financial and operating data of Security Federal Corporation at the dates and for the periods indicated. In conjunction with the data provided in the following tables and in order to more fully understand our historical consolidated financial and operating data, you should also read our “Management’s Discussion and Analysis of Financial Condition and Results of Operations” and our Consolidated Financial Statements and the accompanying notes included in this report.
Years Ended December 31, | Nine Months Ended December 31, | |||||||||||||||||||
2016 | 2015 | 2014 | 2013 | 2012 | ||||||||||||||||
Balance Sheet Data at End of Period | (Dollars in Thousands, Except Per Share Data) | |||||||||||||||||||
Total Assets | $ | 812,682 | $ | 799,728 | $ | 825,364 | $ | 849,248 | $ | 890,355 | ||||||||||
Cash and Cash Equivalents | 9,375 | 8,382 | 10,193 | 7,630 | 7,904 | |||||||||||||||
Certificates of Deposit With Other Banks | 2,445 | 3,445 | 2,095 | 2,100 | 1,729 | |||||||||||||||
Investment and Mortgage-Backed Securities | 387,643 | 405,387 | 429,701 | 431,003 | 430,988 | |||||||||||||||
Total Loans Receivable, Net (1) | 359,723 | 330,573 | 339,874 | 358,917 | 397,706 | |||||||||||||||
Deposits | 654,103 | 652,097 | 660,115 | 658,697 | 676,339 | |||||||||||||||
Advances From Federal Home Loan Bank | 48,395 | 34,640 | 52,900 | 87,740 | 105,257 | |||||||||||||||
Total Shareholders' Equity | 71,112 | 90,967 | 87,435 | 77,990 | 82,592 | |||||||||||||||
Income Data | ||||||||||||||||||||
Total Interest Income | $ | 28,388 | $ | 27,906 | $ | 29,482 | $ | 30,447 | $ | 24,791 | ||||||||||
Total Interest Expense | 3,516 | 4,199 | 5,813 | 7,533 | 7,460 | |||||||||||||||
Net Interest Income | 24,872 | 23,707 | 23,669 | 22,914 | 17,331 | |||||||||||||||
Provision For Loan Losses | 500 | — | 450 | 2,645 | 1,975 | |||||||||||||||
Net Interest Income After Provision For Loan Losses | 24,372 | 23,707 | 23,219 | 20,269 | 15,356 | |||||||||||||||
Non-Interest Income | 6,401 | 7,007 | 6,163 | 6,896 | 4,365 | |||||||||||||||
Non-Interest Expense | 22,928 | 22,531 | 21,268 | 22,033 | 17,062 | |||||||||||||||
Income Taxes | 1,920 | 2,067 | 2,303 | 1,341 | 704 | |||||||||||||||
Net Income | 5,925 | 6,116 | 5,811 | 3,791 | 1,955 | |||||||||||||||
Preferred Stock Dividends | (423 | ) | (440 | ) | (440 | ) | (440 | ) | (330 | ) | ||||||||||
Gain on Redemption of Preferred Stock | 660 | — | — | — | — | |||||||||||||||
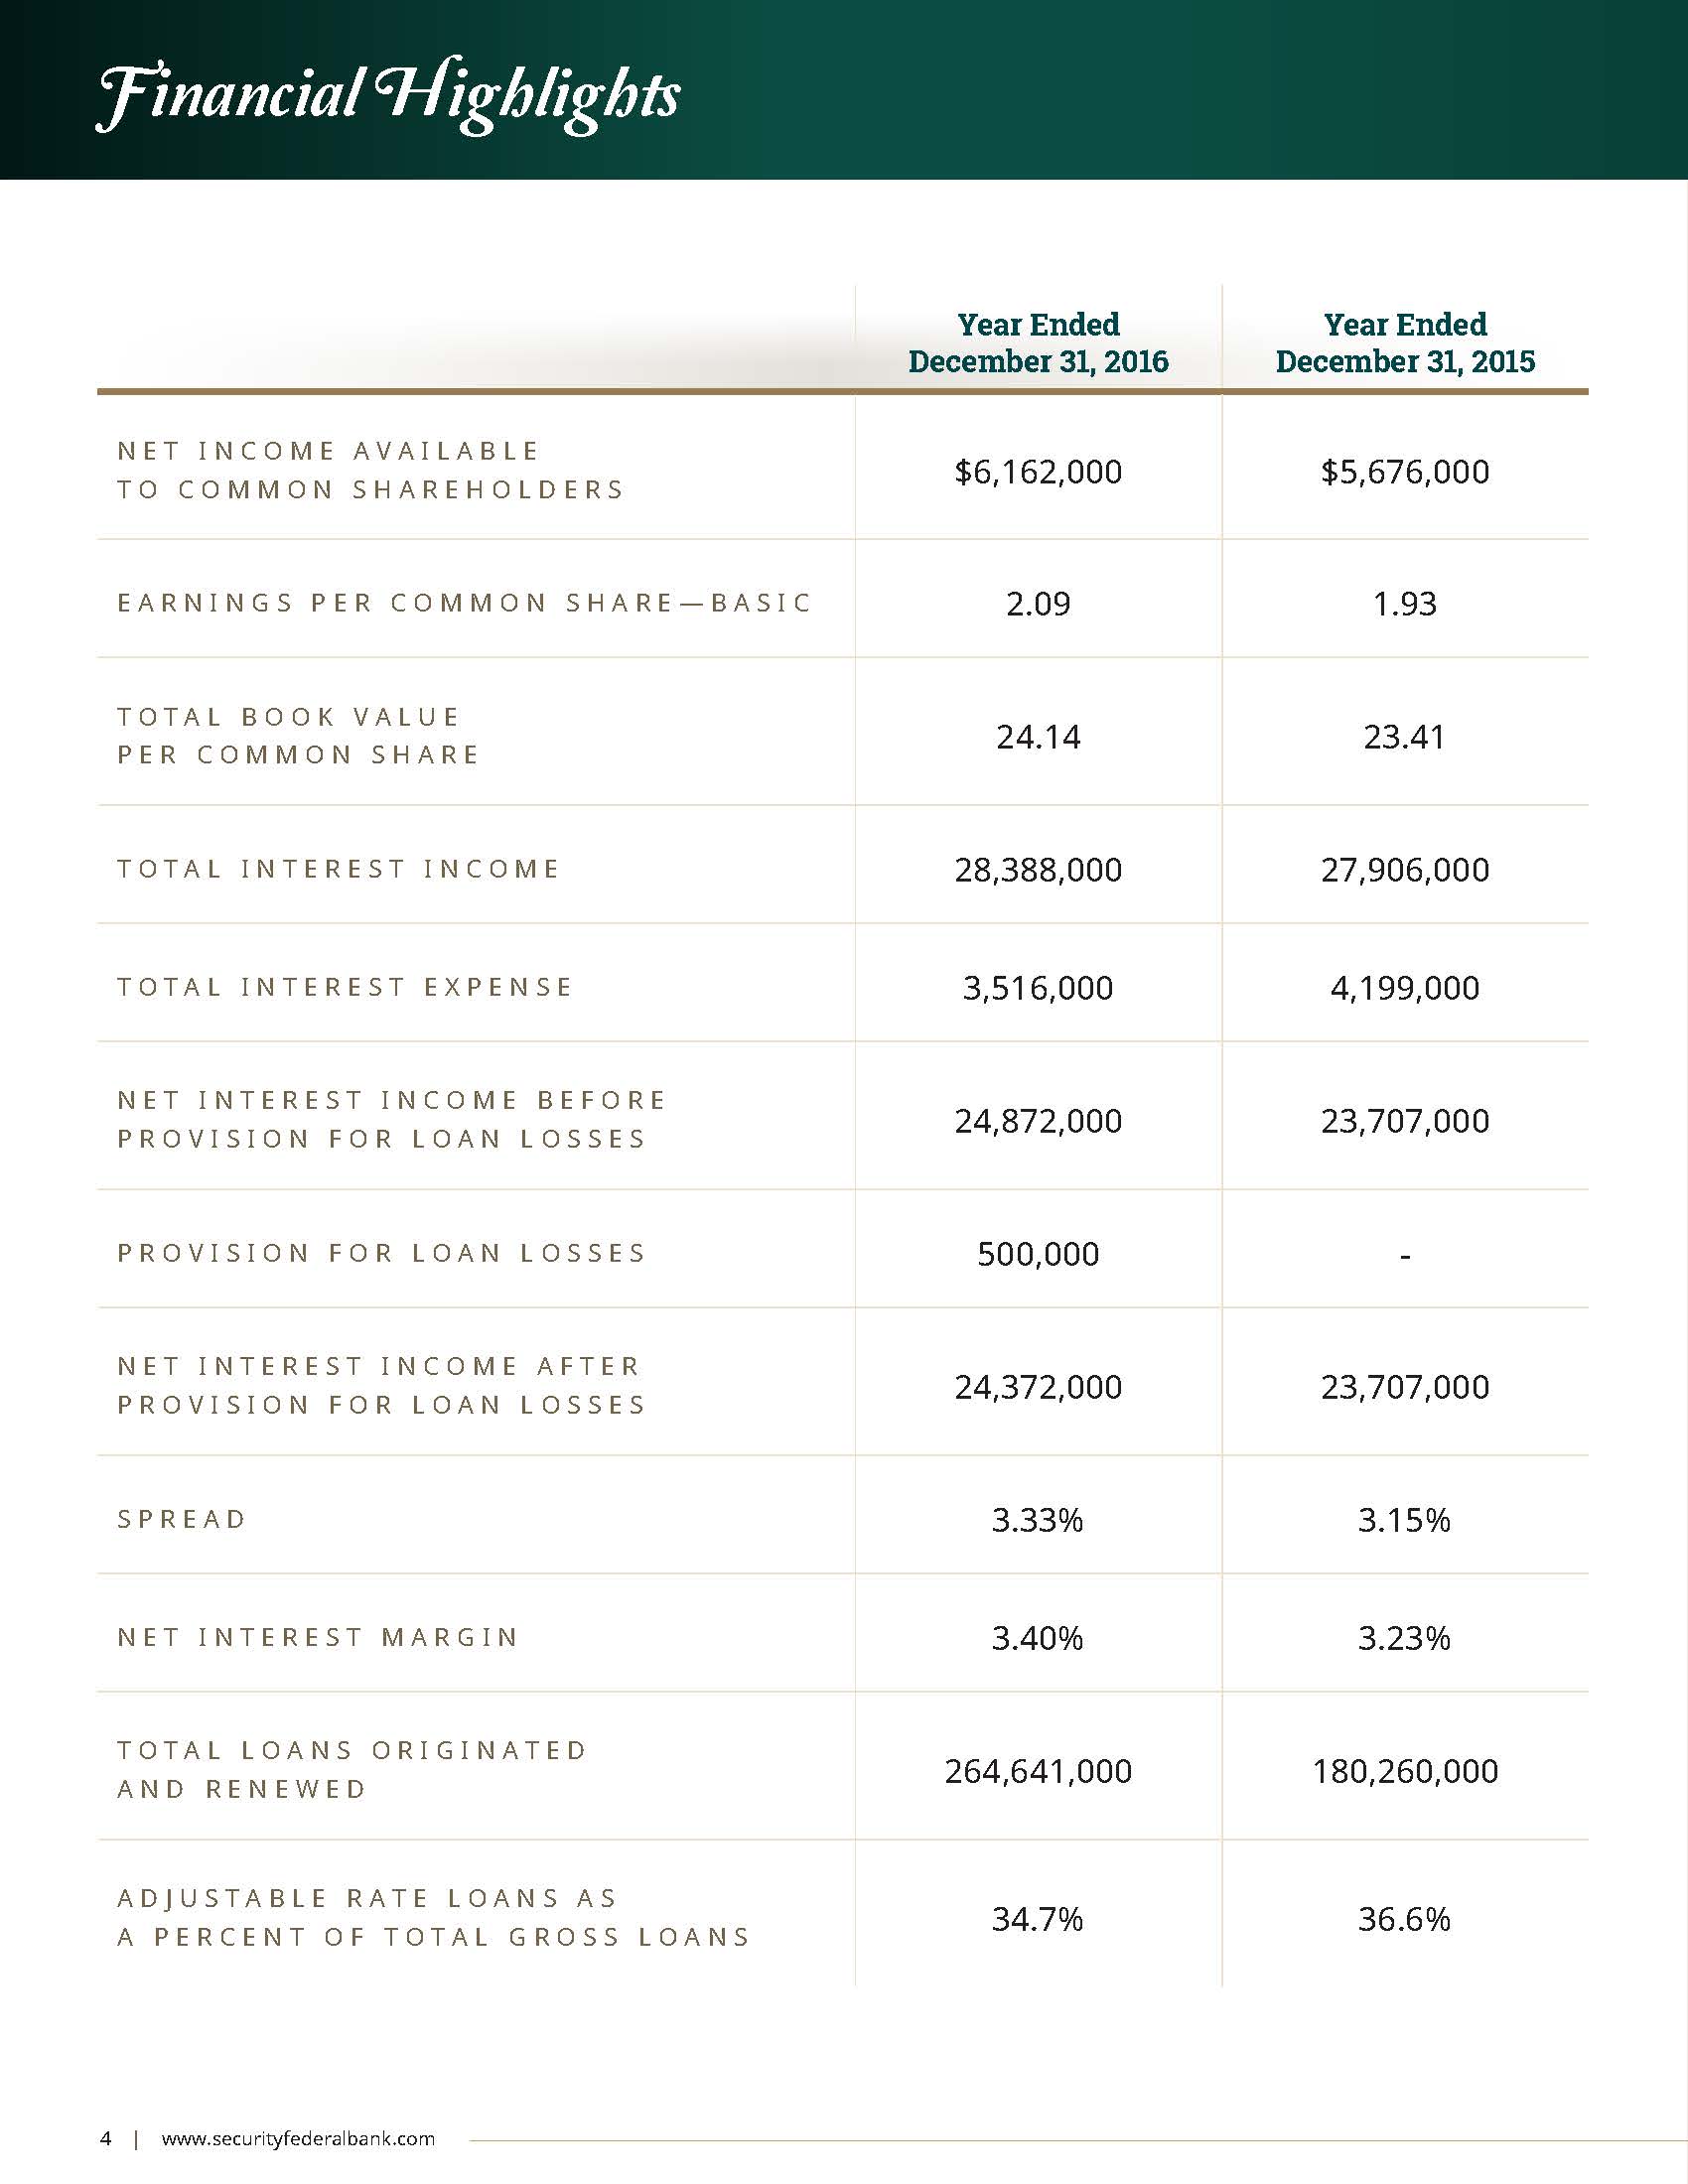
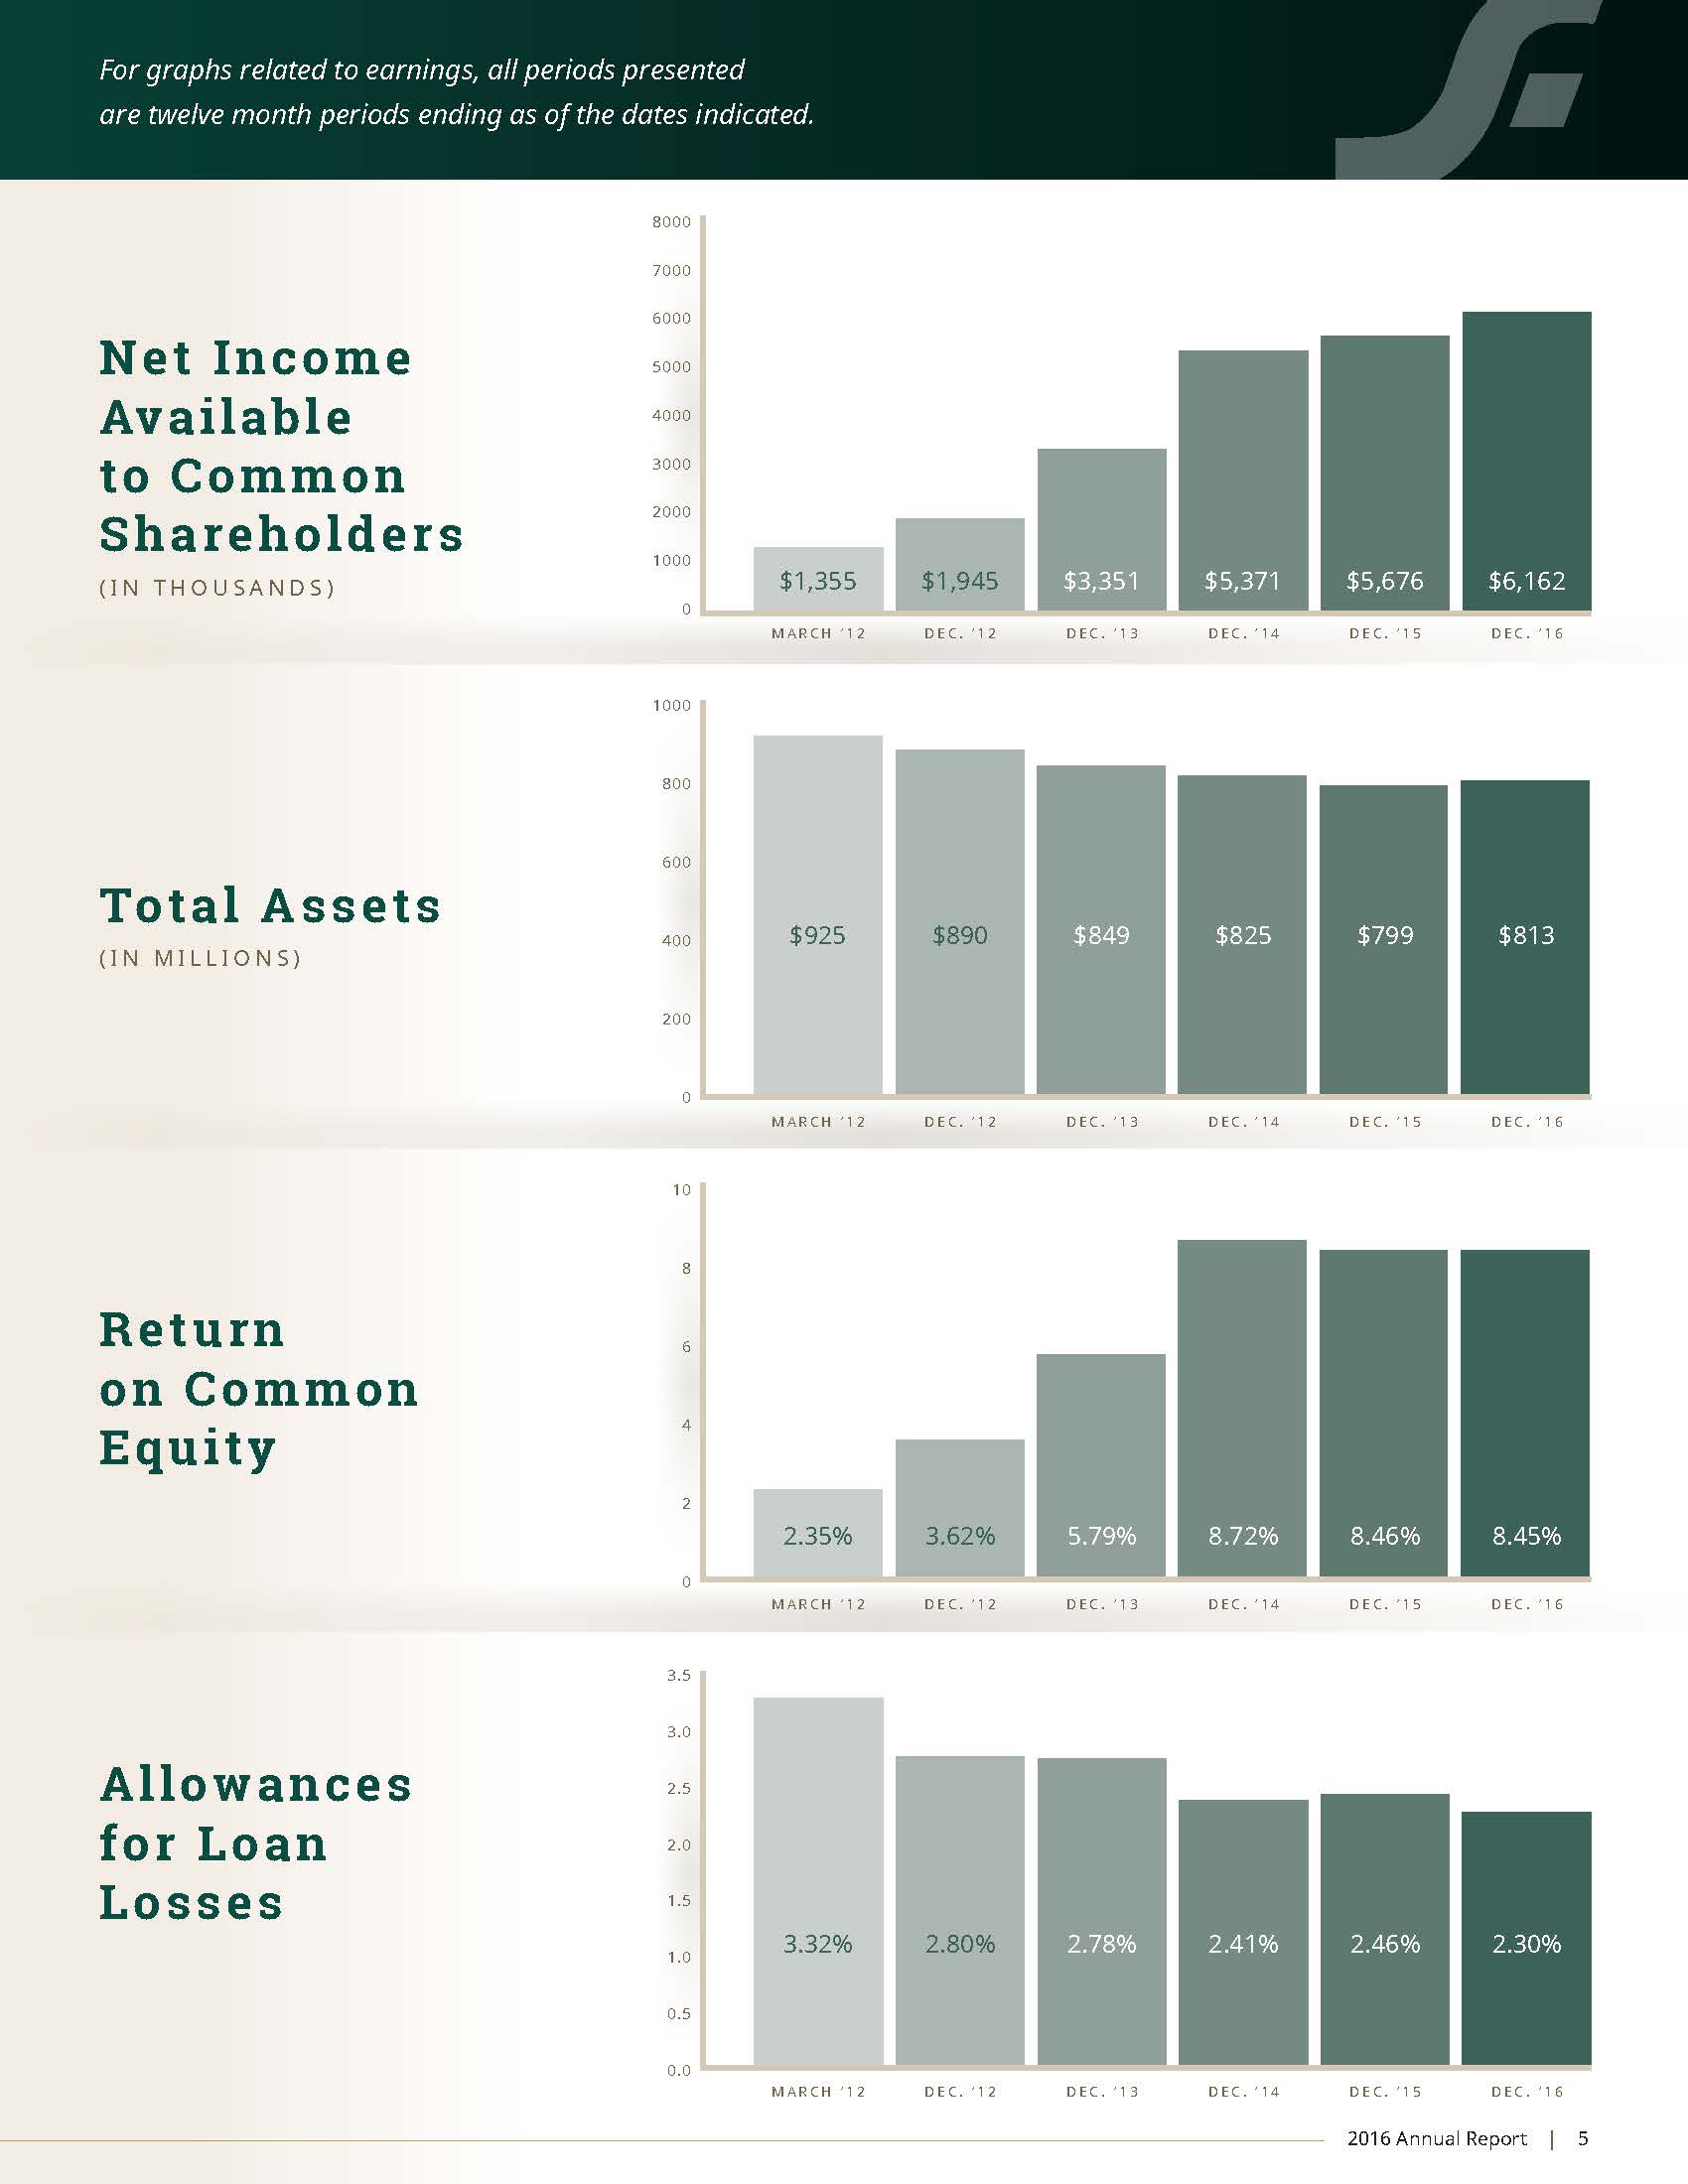
Net Income Available To Common Shareholders | $ | 6,162 | $ | 5,676 | $ | 5,371 | $ | 4,231 | $ | 2,285 | ||||||||||
Per Common Share Data | ||||||||||||||||||||
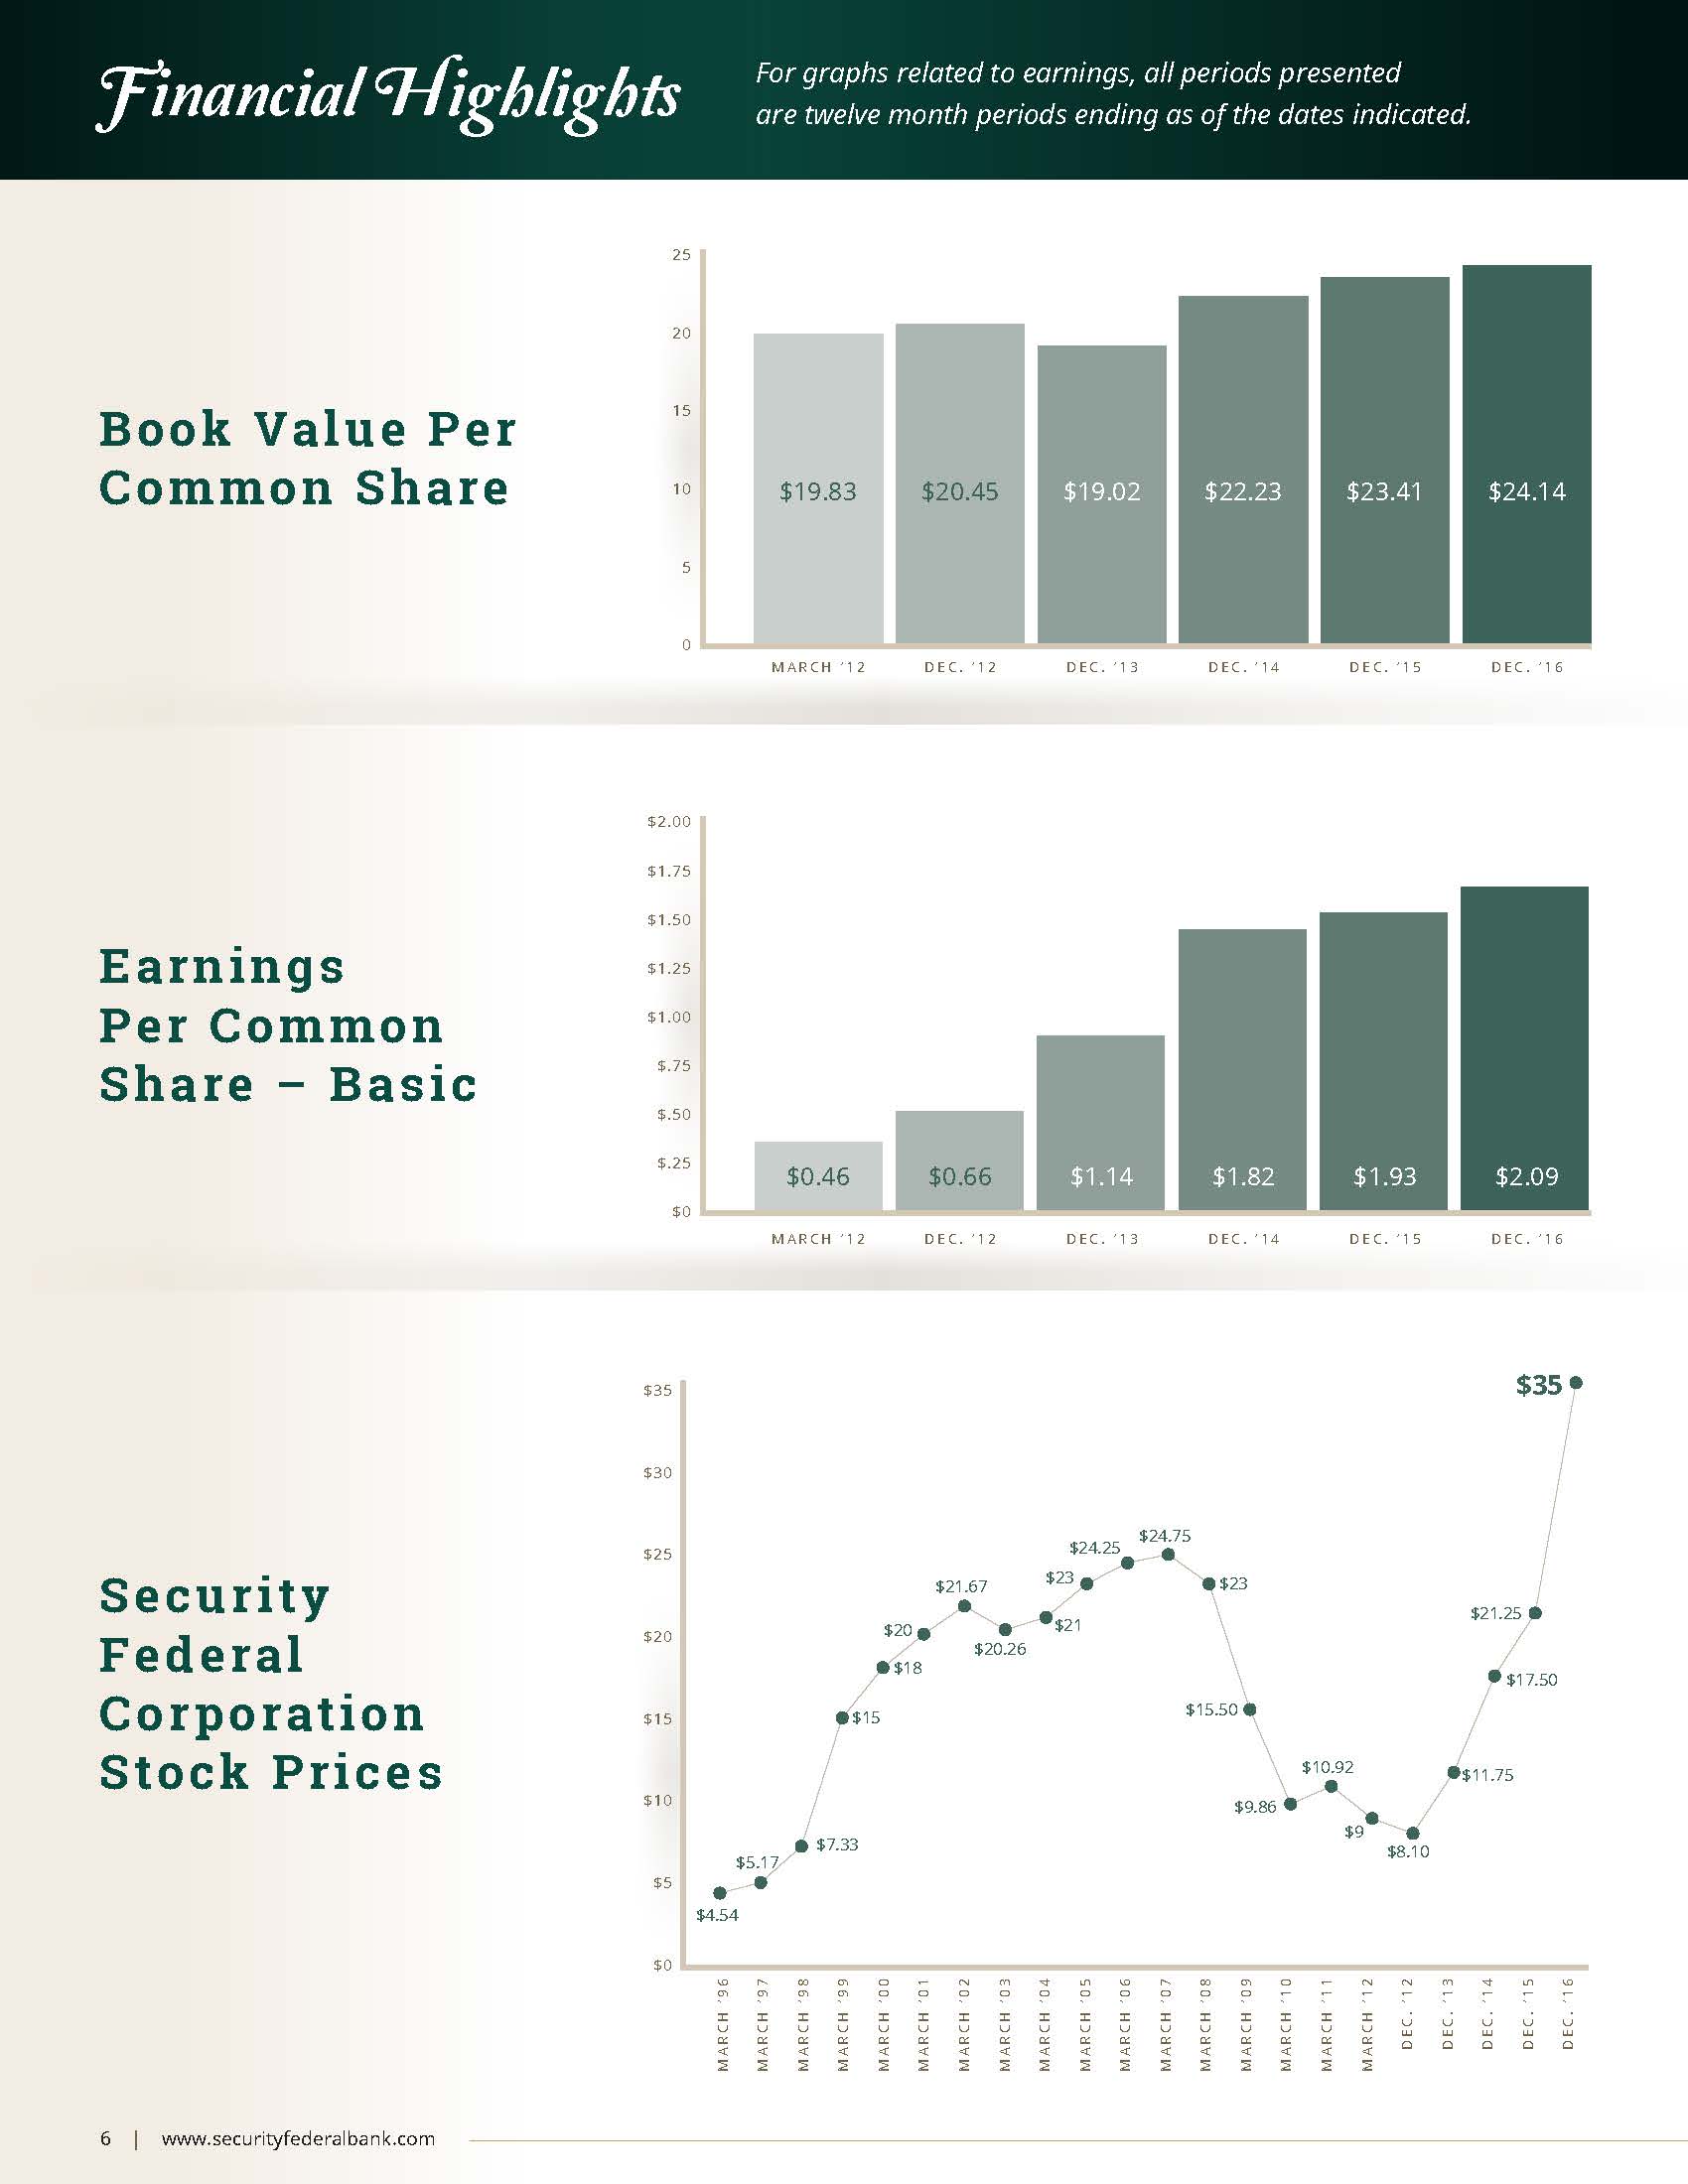
Net Income Per Common Share (Basic) | $ | 2.09 | $ | 1.93 | $ | 1.82 | $ | 1.14 | $ | 0.55 | ||||||||||
Cash Dividends | $ | 0.32 | $ | 0.32 | $ | 0.32 | $ | 0.32 | $ | 0.24 | ||||||||||
(1) INCLUDES LOANS HELD FOR SALE
7
SECURITY FEDERAL CORPORATION AND SUBSIDIARIES
Selected Consolidated Financial and Other Data
Years Ended December 31, | Nine Months Ended December 31, | ||||||||||||||
2016 | 2015 | 2014 | 2013 | 2012 | |||||||||||
Other Data | |||||||||||||||
Interest Rate Spread Information: | |||||||||||||||
Average During Period (4) | 3.33 | % | 3.15 | % | 2.98 | % | 2.81 | % | 2.70 | % | |||||
End of Period | 3.18 | % | 3.15 | % | 3.06 | % | 3.19 | % | 3.16 | % | |||||
Net Interest Margin (Net Interest Income/Average Earning Assets) (4) | 3.40 | % | 3.23 | % | 3.08 | % | 2.91 | % | 2.80 | % | |||||
Average Interest-Earning Assets to Average Interest-Bearing Liabilities | 115.08 | % | 114.60 | % | 113.01 | % | 110.71 | % | 108.08 | % | |||||
Common Equity to Total Assets | 8.75 | % | 8.62 | % | 7.93 | % | 6.59 | % | 6.81 | % | |||||
Non-Performing Assets to Total Assets (2) | 1.01 | % | 1.42 | % | 2.06 | % | 1.64 | % | 2.83 | % | |||||
Return on Assets (Net Income to Average Total Assets) (4) | 0.74 | % | 0.69 | % | 0.64 | % | 0.38 | % | 0.24 | % | |||||
Return on Common Equity (Net Income to Average Common Equity) (4) | 8.45 | % | 8.46 | % | 8.72 | % | 5.79 | % | 3.62 | % | |||||
Average Common Equity to Average Assets Ratio | 8.82 | % | 8.17 | % | 7.28 | % | 6.64 | % | 6.69 | % | |||||
Dividend Payout Ratio on Common Shares(3) | 15.16 | % | 16.61 | % | 17.54 | % | 28.11 | % | 43.48 | % | |||||
Number of Full-Service Offices | 14 | 14 | 13 | 13 | 13 | ||||||||||
(2) NON-PERFORMING ASSETS CONSIST OF NON-ACCRUAL LOANS AND OTHER REAL ESTATE OWNED ("OREO")
(3) RATIO OF DIVIDENDS PAID ON COMMON SHARES TO NET INCOME AVAILABLE TO COMMON SHAREHOLDERS
(4) ANNUALIZED FOR THE NINE MONTH TRANSITION PERIOD ENDED DECEMBER 31, 2012
8
SECURITY FEDERAL CORPORATION AND SUBSIDIARIES
Management's Discussion and Analysis of Financial Condition and Results of Operations
General
The following discussion and analysis is presented to provide the reader with an understanding of the financial condition and the results of operations of Security Federal Corporation and its subsidiaries. The investment and other activities of the parent company, Security Federal Corporation (the “Company”), have had no significant impact on the results of operations for the periods presented in the Consolidated Financial Statements included herein. The information presented in the following discussion of financial results is indicative of the activities of Security Federal Bank (the “Bank”), a wholly owned subsidiary of the Company. The Bank was founded in 1922 as a mutual building and loan association. In 1987, the Bank converted to a federally chartered stock savings bank. On December 28, 2011, the Bank completed a charter conversion from a federally chartered stock savings bank to a South Carolina chartered commercial bank. In connection with this transaction, the Company reorganized from a savings and loan holding company into a bank holding company.
As a result of the Company's reorganization, in order to better align the financial reporting periods for the Company and the Bank with regulatory reporting periods, the Company elected to change its fiscal year end from March 31 to December 31. This change was effective for the reporting period ended December 31, 2012, and as a result, the Company filed a transition period annual report on Form 10-KT with the Securities and Exchange Commission for the nine month period ended December 31, 2012.
The Bank also has two wholly owned subsidiaries: Security Federal Insurance Inc. (“SFINS”) and Security Financial Services Corporation (“SFSC”). SFINS was formed in the fiscal year ended March 31, 2002 and began operating during the December 2001 quarter. SFINS is an insurance agency offering auto, business, health, and home insurance. SFINS has a wholly owned subsidiary, Collier Jennings Financial Corporation (“Collier Jennings”), which has three wholly owned subsidiaries: Security Federal Auto Insurance, The Auto Insurance Store Inc., and Security Federal Premium Pay Plans Inc. Security Federal Premium Pay Plans Inc. has one wholly owned premium finance subsidiary and also has an ownership interest in four other premium finance subsidiaries. SFSC was formed in 1975 and is currently inactive.
In addition to the Bank, the Company has another wholly owned subsidiary, Security Federal Statutory Trust (the “Trust”), which issued and sold fixed and floating rate capital securities of the Trust. Under current accounting guidance, however, the Trust is not consolidated in the Company’s financial statements. Unless the context indicates otherwise, references to the Company shall include the Bank and its subsidiaries.
The principal business of the Bank is accepting deposits from the general public and originating consumer and commercial business loans as well as mortgage loans that enable borrowers to purchase or refinance one-to-four family residential real estate. The Bank also originates construction loans on single-family residences, multi-family dwellings, and commercial real estate, as well as loans for the acquisition, development and construction of residential subdivisions, and commercial projects. The Bank also provides trust services and it offers property, casualty and life insurance products through its subsidiary, Security Federal Insurance Inc.
The Bank's net income depends primarily on its interest rate spread which is the difference between the average yield earned on its loan and investment portfolios and the average rate paid on its deposits and borrowings. When the rate earned on interest-earning assets equals or exceeds the rate paid on interest-bearing liabilities, this positive interest rate spread will generate net interest income. The Bank’s interest spread is influenced by interest rates, deposit flows, and loan demands. Levels of non-interest income and operating expense are also significant factors in earnings.
9
SECURITY FEDERAL CORPORATION AND SUBSIDIARIES
Management's Discussion and Analysis of Financial Condition and Results of Operations
Forward-Looking Statements
This document, including information included or incorporated by reference, contents, and future filings by the Company on Form 10-K, Form 10-Q, and Form 8-K, and future oral and written statements by the Company and its management may contain forward-looking statements within the meaning of the Private Securities Litigation Reform Act of 1995. These statements relate to our financial condition, results of operations, plans, objectives, future performance or business. Forward-looking statements are not statements of historical fact, are based on certain assumptions and are generally identified by use of the words "believes," "expects," "anticipates," "estimates," "forecasts," "intends," "plans," "targets," "potentially," "probably," "projects," "outlook" or similar expressions or future or conditional verbs such as "may," "will," "should," "would" and "could." Forward-looking statements include statements with respect to our beliefs, plans, objectives, goals, expectations, assumptions and statements about, among other things, expectations of the business environment in which we operate, projections of future performance or financial items, perceived opportunities in the market, potential future credit experience, and statements regarding our mission and vision. These forward-looking statements are based upon current management expectations and may, therefore, involve risk and uncertainties. Our actual results, performance, or achievements may differ materially from those suggested, expressed, or implied by forward-looking statements as a result of a wide variety or range of factors, including, but not limited to:
• | the credit risks of lending activities, including changes in the level and trend of loan delinquencies and write-offs and changes in our allowance for loan losses and provision for loan losses that may be affected by deterioration in the housing and commercial real estate markets which may lead to increased losses and non-performing assets in our loan portfolio, and may result in our allowance for loan losses not being adequate to cover actual losses, and require us to materially increase our allowance for loan losses; |
• | changes in general economic conditions, either nationally or in our market areas; |
• | changes in the levels of general interest rates, and the relative differences between short and long term interest rates, deposit interest rates, our net interest margin and funding sources; |
• | fluctuations in the demand for loans, the number of unsold homes, land and other properties and fluctuations in real estate values in our market areas; |
• | secondary market conditions for loans and our ability to sell loans in the secondary market; |
• | results of examinations of the Company by the Board of Governors of the Federal Reserve System ("Federal Reserve") and our bank subsidiary by the Federal Deposit Insurance Corporation ("FDIC") and the South Carolina State Board of Financial Institutions, or other regulatory authorities, including the possibility that any such regulatory authority may, among other things, require us to increase our reserve for loan losses, write-down assets, change our regulatory capital position or affect our ability to borrow funds or maintain or increase deposits, or impose additional requirements or restrictions on us, any of which could adversely affect our liquidity and earnings; |
• | legislative or regulatory changes that adversely affect our business, including the effect of the Dodd-Frank Wall Street Reform and Consumer Protection Act; changes in regulatory policies and principles, or the interpretation of regulatory capital requirements or other rules, including as a result of Basel III; |
• | our ability to attract and retain deposits; |
• | increases in premiums for deposit insurance; |
• | our ability to control operating costs and expenses; |
• | our ability to implement our business strategies; |
• | the use of estimates in determining the fair value of certain of our assets, which estimates may prove to be incorrect and result in significant declines in valuation; |
• | difficulties in reducing risks associated with the loans on our balance sheet; |
• | staffing fluctuations in response to product demand or the implementation of corporate strategies that affect our workforce and potential associated charges; |
• | computer systems on which we depend could fail or experience a security breach; |
• | our ability to retain key members of our senior management team; |
• | costs and effects of litigation, including settlements and judgments; |
• | our ability to manage loan delinquency rates; |
• | increased competitive pressures among financial services companies; |
10
SECURITY FEDERAL CORPORATION AND SUBSIDIARIES
Management's Discussion and Analysis of Financial Condition and Results of Operations
• | changes in consumer spending, borrowing and savings habits; |
• | the availability of resources to address changes in laws, rules, or regulations or to respond to regulatory actions; |
• | our ability to pay dividends on our common stock; |
• | adverse changes in the securities markets; |
• | inability of key third-party providers to perform their obligations to us; |
• | changes in accounting policies and practices, as may be adopted by the financial institution regulatory agencies or the Financial Accounting Standards Board ("FASB"), including additional guidance and interpretation on accounting issues and details of the implementation of new accounting methods; and |
• | other economic, competitive, governmental, regulatory, and technological factors affecting our operations, pricing, products and services and the other risks described elsewhere in this document. |
Some of these and other factors are discussed in our Annual Report on Form 10-K for the year ended December 31, 2016 under Item 1A, “Risk Factors.” Such developments could have an adverse impact on our financial position and our results of operations.
Any of the forward-looking statements that we make may turn out to be inaccurate as a result of our beliefs and assumptions we make in connection with the factors set forth above or because of other unidentified and unpredictable factors. Because of these and other uncertainties, our actual future results may be materially different from the results indicated by these forward-looking statements and you should not rely on such statements. The Company undertakes no obligation to publish revised forward-looking statements to reflect the occurrence of unanticipated events or circumstances after the date hereof. These risks could cause our actual results for 2017 and beyond to differ materially from those expressed in any forward-looking statements by or on behalf of us, and could negatively affect the Company’s consolidated financial condition and consolidated results of operations, liquidity and stock price performance.
Critical Accounting Policies
The Company has adopted various accounting policies which govern the application of accounting principles generally accepted in the United States in the preparation of the Company’s Consolidated Financial Statements. The significant accounting policies of the Company are described in Note 1 of the Notes to the Consolidated Financial Statements included herein.
Certain accounting policies involve significant judgments and assumptions by management, which have a material impact on the carrying value of certain assets and liabilities; management considers these accounting policies to be critical accounting policies. The judgments, estimates and assumptions used by management are based on historical experience and other factors, which are believed to be reasonable under the circumstances. Because of the nature of the judgments, estimates and assumptions made by management, actual results could differ from these judgments, estimates and assumptions, which could have a material impact on the carrying values of assets and liabilities and the results of operations of the Company.
The Company believes the allowance for loan losses is a critical accounting policy that requires the most significant judgments, estimates and assumptions used in preparation of the Consolidated Financial Statements. The impact of an unexpected large loss could deplete the allowance and potentially require increased provisions to replenish the allowance, which would negatively affect earnings. The Company provides for loan losses using the allowance method. Accordingly, all loan losses are charged to the related allowance and all recoveries are credited to the allowance for loan losses. Additions to the allowance for loan losses are provided by charges to operations based on various factors, which, in management’s judgment, deserve current recognition in estimating possible losses. Such factors considered by management include the fair value of the underlying collateral, stated guarantees by the borrower (if applicable), the borrower’s ability to repay from other economic resources, growth and composition of the loan portfolio, the relationship of the allowance for loan losses to the outstanding loans, loss experience, delinquency trends, and general economic conditions. Management evaluates the carrying value of the loan portfolio monthly and adjusts the allowance accordingly.
While management uses the best information available to make evaluations, future adjustments may be necessary if economic conditions differ substantially from the assumptions used in making these evaluations. The allowance for loan losses is subject to periodic evaluations by bank regulatory agencies that may require adjustments to the allowance based upon the information that is available at the time of their examination. For a further discussion of the Company’s estimation process and methodology related to the allowance for loan losses, see the discussion under the section entitled “Financial Condition” and “Comparison of the Years Ended December 31, 2016 and 2015-Provision for Loan Losses” included herein.
11
SECURITY FEDERAL CORPORATION AND SUBSIDIARIES
Management's Discussion and Analysis of Financial Condition and Results of Operations
The Company values an impaired loan at the loan’s fair value if it is probable that the Company will be unable to collect all amounts due according to the contractual terms of the original loan agreement at the present value of expected cash flows, the market price of the loan, if available, or the value of the underlying collateral. Expected cash flows are required to be discounted at the loan’s effective interest rate. When the ultimate collectibility of an impaired loan’s principal is in doubt, wholly or partially, all payments received are applied to principal. Once the recorded principal balance has been reduced to zero, any additional payments received are applied to interest income to the extent that any interest has been foregone. Any additional payments received are recorded as recoveries of any amounts previously charged off. When the repayment of the loan is not in doubt, payments are applied under the contractual terms of the loan agreement first to interest and then to principal.
The Company uses assumptions and estimates in determining income taxes payable or refundable for the current year, deferred income tax liabilities and assets for events recognized differently in its financial statements and income tax returns, and income tax expense. Determining these amounts requires analysis of certain transactions and interpretation of tax laws and regulations. The Company exercises considerable judgment in evaluating the amount and timing of recognition of the resulting tax liabilities and assets. These judgments and estimates are reevaluated on a continual basis as regulatory and business factors change.
No assurance can be given that either the tax returns submitted by the Company or the income tax reported on the Consolidated Financial Statements will not be adjusted by either adverse rulings by the United States Tax Court, changes in the tax code, or assessments made by the Internal Revenue Service.
Asset and Liability Management
The objective of the Bank’s program of asset and liability management is to limit the Bank’s vulnerability to material and prolonged increases or decreases in interest rates, or "interest rate risk." The principal determinant of the exposure of the Bank's earnings to interest rate risk is the timing difference (“gap”) between the repricing or maturity of the Bank's interest-earning assets and the repricing or maturity of its interest-bearing liabilities. If the maturities of the Bank's assets and liabilities were perfectly matched and the interest rates borne by its assets and liabilities were equally flexible and moved concurrently (neither of which is the case), the impact on net interest income of any material and prolonged changes in interest rates would be minimal.
A positive gap position generally has an adverse effect on net interest income during periods of falling interest rates. A positive one-year gap position occurs when the dollar amount of rate sensitive assets maturing or repricing within one year exceeds the dollar amount of rate sensitive liabilities maturing or repricing during that same one-year period. As a result, in a period of falling interest rates, the interest received on interest-earning assets will decrease faster than the interest paid on interest-bearing liabilities, causing a decrease in net interest income. During periods of rising interest rates, the interest received on interest-earning assets will increase faster than interest paid on interest-bearing liabilities, thus increasing net interest income.
A negative gap position generally has an adverse effect on net interest income during periods of rising interest rates. A negative one-year gap position occurs when the dollar amount of rate sensitive liabilities maturing or repricing within one year exceeds the dollar amount of rate sensitive assets maturing or repricing during that same period. As a result, during periods of rising interest rates, the interest paid on interest-bearing liabilities will increase faster than interest received from interest-earning assets, thus reducing net interest income. The reverse is true in periods of declining interest rates, as discussed above, which generally results in an increase in net interest income.
At December 31, 2016 and 2015, the Bank's one-year gap position was a positive mismatch between asset and liability maturities and interest rates. At December 31, 2016, assets repricing exceeded liabilities repricing within one year by $47.2 million or 6.2% of total interest earning assets. At December 31, 2015, assets repricing exceeded liabilities repricing within one year by $36.6 million or 4.9% of total interest earning assets. For more information on the Bank’s repricing position at December 31, 2016, see the tables on pages 14 and 15.
During the year ended December 31, 2016, Bank originated $19.9 million in adjustable rate residential real estate loans (“ARMs”) for investment purposes. The Bank’s loan portfolio included $129.1 million of adjustable rate consumer loans, commercial loans, and mortgage loans or 34.7% of total loans at December 31, 2016.
12
SECURITY FEDERAL CORPORATION AND SUBSIDIARIES
Management's Discussion and Analysis of Financial Condition and Results of Operations
During the year ended December 31, 2016, the Bank originated $209.4 million in new and renewed consumer and commercial loans, which are usually short term in nature. The Bank's portfolio of consumer and commercial loans was $289.5 million at December 31, 2016, $263.0 million at December 31, 2015, and $270.5 million at December 31, 2014. Consumer and commercial loans combined were 77.9%, 76.9% and 77.4% of total loans at December 31, 2016, 2015 and 2014, respectively.
At December 31, 2016, the Bank held approximately $13.1 million in longer term fixed rate residential mortgage loans. Typically, long term, newly originated fixed rate mortgage loans are not retained in the portfolio but are sold immediately in contrast to ARMs, which are typically retained in the portfolio.
Fixed rate residential loans sold to institutional investors, on a service-released basis totaled $35.4 million during the year ended December 31, 2016, $24.2 million during the year ended December 31, 2015 and $23.6 million during the year ended December 31, 2014. The Bank sells all its fixed rate mortgage loans on a service-released basis.
Certificates of deposit of $100,000 or more, referred to as “Jumbo Certificates,” are normally considered to be interest rate sensitive because of their relatively short maturities. At December 31, 2016, the Bank had $119.2 million outstanding in Jumbo Certificates compared to $132.0 million at December 31, 2015. Brokered deposits totaled $40.3 million at December 31, 2016 compared to $42.5 million at December 31, 2015. The majority of the Bank’s deposits are originated within the Bank’s immediate market area.
The following table sets forth the maturity schedule of certificates of deposit with balances of $100,000 or greater at December 31, 2016:
(In Thousands) | |||
Within 3 Months | $ | 18,075 | |
After 3 Months, Within 6 Months | 17,720 | ||
After 6 Months, Within 12 Months | 29,897 | ||
After 12 Months | 53,539 | ||
$ | 119,231 | ||
13
SECURITY FEDERAL CORPORATION AND SUBSIDIARIES
Management's Discussion and Analysis of Financial Condition and Results of Operations
The following table sets forth the Bank’s interest-bearing liabilities and interest-earning assets repricing or maturing within one year. The table on the following page presents the Bank's entire interest-bearing liabilities and interest-earning assets into repricing or maturity time periods. Both tables present adjustable rate loans in the periods they are scheduled to reprice and fixed rate loans are shown in the time frame of corresponding principal amortization schedules. Adjustable and fixed rate loans are also adjusted for the Company’s estimates of pre-payments. Mortgage-backed securities are shown at repricing dates, but also include prepayment estimates. Both tables also assume that investments reprice at the earlier of maturity; the likely call date, if any, based on current interest rates; or the next scheduled interest rate change, if any. NOW accounts are assumed to have a decay rate of 20% the first year, money market accounts are assumed to have a decay rate of 65% the first year, and statement savings accounts are assumed to have a decay rate of 20% the first year. The balance, for all three products, is deemed to reprice in the one to three year category. Callable fixed rate Federal Home Loan Bank (“FHLB”) advances are included in borrowings, and are deemed to mature at the expected call date or maturity, based on the stated interest rate of the advance and current market rates. Junior subordinated debentures are shown at their repricing date or call date.
At December 31, | |||||||
(Dollars in thousands) | 2016 | 2015 | |||||
Interest Rate Sensitive Assets Repricing Within 1 Year | |||||||
Loans (1) | $ | 192,003 | $ | 188,160 | |||
Mortgage-Backed Securities: | |||||||
Available For Sale, at Fair Value | 111,659 | 94,426 | |||||
Held To Maturity, at Cost | 5,312 | 2,936 | |||||
Investment Securities: | |||||||
Available For Sale, at Fair Value | 86,246 | 90,154 | |||||
Other Interest-Earning Assets and FHLB Stock | 4,050 | 4,800 | |||||
Total Interest Rate Sensitive Assets Repricing Within 1 Year | $ | 399,270 | $ | 380,476 | |||
Interest Rate Sensitive Liabilities Repricing Within 1 Year | |||||||
Deposits | 309,203 | 315,571 | |||||
FHLB Advances and Other Borrowed Money | 42,888 | 28,307 | |||||
Total Interest Rate Sensitive Liabilities Repricing Within 1 Year | $ | 352,091 | $ | 343,878 | |||
Gap | $ | 47,179 | $ | 36,598 | |||
Interest Rate Sensitive Assets/Interest Rate Sensitive Liabilities | 113.4 | % | 110.6 | % | |||
Gap as a Percent of Total Interest-Earning Assets | 6.2 | % | 4.9 | % | |||
(1) | LOANS ARE NET OF UNDISBURSED FUNDS AND LOANS IN PROCESS. |
14
SECURITY FEDERAL CORPORATION AND SUBSIDIARIES
Management's Discussion and Analysis of Financial Condition and Results of Operations
The following table sets forth the interest rate sensitivity of the Bank's assets and liabilities at December 31, 2016, on the basis of the factors and assumptions set forth in the table on the previous page.
(Dollars in thousands) | 3 Months or Less | Over 3 – 12 Months | Over 1 – 3 Years | Over 3 – 5 Years | Over 5 – 10 Years | Over 10 Years | Total | ||||||||||||||||||||
Interest-Earnings Assets | |||||||||||||||||||||||||||
Loans (1) | $ | 98,600 | $ | 93,403 | $ | 98,463 | $ | 51,724 | $ | 21,038 | $ | 5,017 | $ | 368,245 | |||||||||||||
Mortgage-Backed Securities: | |||||||||||||||||||||||||||
Held To Maturity, at Cost | 1,302 | 4,010 | 7,959 | 3,835 | 5,843 | 2,634 | 25,583 | ||||||||||||||||||||
Available For Sale, at Fair Value | 92,517 | 19,141 | 13,253 | 14,439 | 15,551 | 30,360 | 185,261 | ||||||||||||||||||||
Investment Securities: | |||||||||||||||||||||||||||
Available For Sale, at Fair Value | 84,286 | 1,961 | 4,196 | 4,697 | 69,229 | 12,430 | 176,799 | ||||||||||||||||||||
FHLB Stock, at Cost | — | 2,776 | — | — | — | — | 2,776 | ||||||||||||||||||||
Other Interest-Earning Assets | 179 | 1,095 | 1,350 | — | — | — | 2,624 | ||||||||||||||||||||
Total Interest-Earning Assets | $ | 276,884 | $ | 122,386 | $ | 125,221 | $ | 74,695 | $ | 111,661 | $ | 50,441 | $ | 761,288 | |||||||||||||
Interest-Bearing Liabilities | |||||||||||||||||||||||||||
Deposit Accounts: | |||||||||||||||||||||||||||
Certificates | $ | 39,248 | $ | 92,237 | $ | 55,844 | $ | 28,216 | $ | — | $ | — | $ | 215,545 | |||||||||||||
NOW | 5,082 | 15,246 | 81,310 | — | — | — | 101,638 | ||||||||||||||||||||
Money Markets | 36,944 | 113,142 | 80,816 | — | — | — | 230,902 | ||||||||||||||||||||
Statement Savings | 1,826 | 5,478 | 29,218 | — | — | — | 36,522 | ||||||||||||||||||||
Borrowings (2) | 32,888 | 10,000 | 30,000 | 3,000 | — | 6,084 | 81,972 | ||||||||||||||||||||
Total Interest-Bearing Liabilities | $ | 115,988 | $ | 236,103 | $ | 277,188 | $ | 31,216 | $ | — | $ | 6,084 | $ | 666,579 | |||||||||||||
Current Period Gap | $ | 160,896 | $ | (113,717 | ) | $ | (151,967 | ) | $ | 43,479 | $ | 111,661 | $ | 44,357 | $ | 94,709 | |||||||||||
Cumulative Gap | $ | 160,896 | $ | 47,179 | $ | (104,788 | ) | $ | (61,309 | ) | $ | 50,352 | $ | 94,709 | $ | 94,709 | |||||||||||
Cumulative Gap as a Percent of Total Interest-Earning Assets | 21.1 | % | 6.2 | % | (13.8 | )% | (8.1 | )% | 6.6 | % | 12.4 | % | 12.4 | % | |||||||||||||
(1) | LOANS INCLUDE LOANS HELD FOR SALE AND ARE NET OF UNDISBURSED FUNDS AND LOANS IN PROCESS. |
(2) | CALLABLE SECURITIES AND FHLB ADVANCES ARE SHOWN AT THEIR LIKELY CALL DATES BASED ON MANAGEMENT’S ESTIMATES AT DECEMBER 31, 2016. |
In evaluating the Bank's exposure to interest rate risk, certain shortcomings inherent in the method of analysis presented in the tables above are considered. For example, although certain assets and liabilities may have similar maturities or periods of repricing, they may react in different degrees to changes in market interest rates. Additionally, the interest rates of certain types of assets and liabilities may fluctuate in advance of changes in market interest rates. Loan repayment rates and withdrawals of deposits will likely differ substantially from the assumed rates previously set forth in the event of significant changes in interest rates due to the option of borrowers to prepay their loans and the ability of depositors to withdraw funds prior to maturity. Further, certain assets, such as ARMs, have features that restrict changes in interest rates on a short-term basis as well as over the life of the asset.
15
SECURITY FEDERAL CORPORATION AND SUBSIDIARIES
Management's Discussion and Analysis of Financial Condition and Results of Operations
Financial Condition - Assets
Total assets increased $13.0 million or 1.6% to $812.7 million at December 31, 2016 from $799.7 million at December 31, 2015. This increase was primarily due to an increase in net loans receivable, which was partially offset by a decrease in investment and mortgage-backed securities.
Cash and cash equivalents increased $1.0 million or 11.8% to $9.4 million at December 31, 2016 compared to $8.4 million at December 31, 2015. Total investments and mortgage-backed securities decreased $17.7 million or 4.4% to $387.6 million at December 31, 2016 from $405.4 million at December 31, 2015. This decrease was due to the sale of 42 available for sale investment securities during the year ended December 31, 2016.
Total net loans receivable increased $29.2 million or 8.8% to $359.7 million at December 31, 2016 from $330.6 million at December 31, 2015 as a result of increases in all loan categories. Residential real estate loans held for investment increased $1.6 million or 2.1% to $78.0 million at December 31, 2016 from $76.4 million at December 31, 2015. Typically, long term, newly originated fixed rate mortgage loans are not retained in the portfolio but are sold immediately in contrast to ARMs, which are typically retained in the portfolio. At December 31, 2016, the Bank held 78.9% of its residential mortgage loans in ARMs and 21.1% in fixed rate residential mortgage loans. Consumer loans increased $288,000 or 0.6% to $50.7 million at December 31, 2016 from $50.4 million at December 31, 2015. Commercial business loans increased $3.8 million or 30.1% to $16.3 million at December 31, 2016 from $12.5 million at December 31, 2015 while commercial real estate loans increased $22.5 million or 11.3% to $222.6 million at December 31, 2016 from $200.1 million at December 31, 2015. Loans held for sale, which were $4.2 million at December 31, 2016, increased $1.8 million or 72.3% from $2.5 million at December 31, 2015.
Premises and equipment increased $1.1 million or 5.4% to $21.2 million at December 31, 2016 compared to $20.1 million at December 31, 2015. The increase is primarily due to additions to construction in progress related to the construction of the Bank's newest full-service branch in Evans, Georgia, which is scheduled to open in 2017.
In July 2006, the Company acquired Collier Jennings Financial Corporation, an insurance agency specializing in consumer automobile insurance and premium financing. The resulting goodwill from the acquisition was $1.2 million at December 31, 2016 and 2015 with no other intangibles recorded at those dates. Collier Jennings now operates as a subsidiary of Security Federal Insurance Inc., a subsidiary of the Bank.
The cash value of Bank Owned Life Insurance (“BOLI”) increased $528,000 or 3.2% to $17.1 million at December 31, 2016 from $16.6 million at December 31, 2015. The increase was entirely related to accrued interest credited to the cash surrender value underlying the Company's existing BOLI policies. There were no new policies purchased and no redemptions of BOLI during the year ended December 31, 2016. BOLI, which earns tax-free yields, is utilized to partially offset the cost of the Company’s employee benefits programs and to provide key person insurance on certain officers of the Company.
FHLB stock increased $562,000 or 25.4% to $2.8 million at December 31, 2016 compared to $2.2 million at December 31, 2015. The Bank, as a member of the FHLB of Atlanta, is required to acquire and hold shares of capital stock in the FHLB of Atlanta in an amount equal to a membership component, which is 0.09% of total assets plus a transaction component which equals 4.25% of outstanding advances (borrowings) from the FHLB of Atlanta. As our total assets and total advances have increased, so has the Bank’s required investment in FHLB stock.
Other assets increased $998,000 or 22.4% to $5.4 million at December 31, 2016 compared to $4.4 million at December 31, 2015 primarily due to a $1.4 million increase in net deferred tax assets, which was partially offset by a decrease of $420,000 in principal payments receivable from investment securities. The net unrealized gain on investment securities available for sale decreased $4.8 million during the year ended December 31, 2016 as a result of an increase in market rates. The majority of the increase in net deferred tax assets represents the tax impact of this change.
16
SECURITY FEDERAL CORPORATION AND SUBSIDIARIES
Management's Discussion and Analysis of Financial Condition and Results of Operations
Financial Condition - Non-Performing Assets
The Company’s non-performing assets decreased $3.2 million or 27.7% to $8.2 million at December 31, 2016 from $11.4 million at December 31, 2015. The following table summarizes our non-performing assets for the periods indicated:
At December 31, 2016 | At December 31, 2015 | $ | % | ||||||||||||||||
Amount | Percent (1) | Amount | Percent (1) | Decrease | Decrease | ||||||||||||||
Loans 90 Days or More Past Due or Non-Accrual Loans: | |||||||||||||||||||
Residential Real Estate | $ | 2,488,158 | 0.7% | $ | 3,306,675 | 1.0% | $ | (818,517 | ) | (24.8 | )% | ||||||||
Commercial Business | 145,401 | — | 178,076 | 0.1 | (32,675 | ) | (18.3 | ) | |||||||||||
Commercial Real Estate | 2,639,837 | 0.7 | 2,973,135 | 0.8 | (333,298 | ) | (11.2 | ) | |||||||||||
Consumer | 241,571 | 0.1 | 575,866 | 0.2 | (334,295 | ) | (58.1 | ) | |||||||||||
Total Non-Performing Loans | 5,514,967 | 1.5% | 7,033,752 | 2.1% | (1,518,785 | ) | (21.6 | )% | |||||||||||
Other Non-Performing Assets: | |||||||||||||||||||
OREO | 2,721,214 | 0.8% | 4,361,411 | 1.3 | (1,640,197 | ) | (37.6 | ) | |||||||||||
Total Other Non-Performing Assets | 2,721,214 | 0.8% | 4,361,411 | 1.3% | (1,640,197 | ) | (37.6 | )% | |||||||||||
Total Non-Performing Assets | $ | 8,236,181 | 2.3% | $ | 11,395,163 | 3.4% | $ | (3,158,982 | ) | (27.7 | )% | ||||||||
Total Non-Performing Assets as a Percentage of Total Assets | 1.0 | % | 1.4 | % | |||||||||||||||
(1) PERCENT OF GROSS LOANS RECEIVABLE HELD FOR INVESTMENT, NET OF DEFERRED FEES AND LOANS IN PROCESS
The largest decrease in non-performing loans was in the residential real estate loan category, which decreased $819,000 or 24.8% to $2.5 million at December 31, 2016 from $3.3 million at December 31, 2015. Non-performing residential real estate loans at December 31, 2016 consisted of 17 loans to 17 borrowers with an average loan balance of $146,000, the largest of which was $352,000. At December 31, 2015, non-performing residential real estate loans consisted of 24 loans to 24 borrowers with an average loan balance of $138,000, the largest of which was $386,000.
Non-performing commercial real estate loans decreased $333,000 or 11.2% to $2.6 million at December 31, 2016 from $3.0 million at December 31, 2015. The balance in non-performing commercial real estate loans at December 31, 2016 consisted of 20 loans to 17 borrowers with an average loan balance of $132,000 compared to 17 loans to 14 borrowers with an average balance of $175,000 at December 31, 2015. Of the non-performing commercial real estate loans at December 31, 2016, $1.7 million consisted of 11 loans secured by commercial buildings or first mortgages on principal residences throughout the Bank's market area to 9 different borrowers. These loans, even though secured by principal residences, are considered commercial real estate because they were business purpose loans. The remaining non-performing commercial real estate loans at December 31, 2016 consisted of $335,000 for two loans secured by builder lots to two borrowers; $233,000 for six loans secured by raw land to six separate borrowers; and $406,000 for one loan secured by a church building . At December 31, 2016, our largest non-performing commercial real estate loan had a balance of $557,000 and was secured by a commercial building.
OREO decreased $1.6 million or 37.6% to $2.7 million at December 31, 2016 from $4.4 million at December 31, 2015. At December 31, 2016, the balance of OREO consisted of the following real estate properties: nine single-family residences and 22 lots within residential subdivisions located throughout our market area in South Carolina and Georgia; eight lots within a subdivision and the adjacent 22.96 acres of land in Aiken, South Carolina; four parcels of commercial land and two commercial buildings in Aiken, South Carolina.
The Bank reviews its loan portfolio and allowance for loan losses on a monthly basis. Future additions to the Bank's allowance for loan losses are dependent on, among other things, the performance of the Bank's loan portfolio, the economy, changes in real estate values, and interest rates. There can be no assurance that additions to the allowance will not be required in future periods. The determination of the appropriate level of the allowance for loan losses inherently involves a high degree of subjectivity and requires us to make significant estimates of current credit risks and future trends, all of which may undergo material changes.
17
SECURITY FEDERAL CORPORATION AND SUBSIDIARIES
Management's Discussion and Analysis of Financial Condition and Results of Operations
Continuing deterioration in economic conditions affecting borrowers, new information regarding existing loans, identification of additional problem loans and other factors, both within and outside of our control, may require an increase in the allowance for loan losses. In addition, bank regulatory agencies periodically review our allowance for loan losses and may require an increase in the provision for possible loan losses or the recognition of further loan charge-offs, based on judgments different than those of management. In addition, if charge-offs in future periods exceed the allowance for loan losses, we will need additional provisions to increase the allowance for loan losses. Any increases in the allowance for loan losses will result in a decrease in net income and, possibly, capital, and may have a material adverse effect on our financial condition and results of operations. Management continually monitors its loan portfolio for the impact of local economic changes. The ratio of the allowance for loan losses to total loans was 2.30% and 2.46% at December 31, 2016 and 2015, respectively. The Bank closely monitors its past due loans.
The cumulative interest not accrued during the years ended December 31, 2016 and 2015 relating to all non-performing loans totaled $687,000 and $679,000, respectively. Our strategy is to work with our borrowers to reach acceptable payment plans while protecting our interests in the underlying collateral. In the event an acceptable arrangement cannot be reached, we may have to acquire these properties through foreclosure or other means and subsequently sell, develop, or liquidate them.
The balance of loans in troubled debt restructurings (“TDRs”) decreased $2.1 million or 31.6% during the year ended December 31, 2016. The Bank had 12 TDRs totaling $4.6 million at December 31, 2016 compared to 16 TDRs totaling $6.7 million at December 31, 2015. The 12 TDRs consisted of one consumer loan secured by a first mortgage on a residential dwelling and two automobiles totaling $60,000; one unsecured consumer loan with a balance of $21,000; and 10 commercial real estate loans to 9 separate borrowers, the largest of which had a balance of $2.5 million at December 31, 2016. The commercial real estate loans were secured primarily by first mortgages on one single family residence, two lots, one commercial building, one hotel, three churches and three parcels of land. At December 31, 2016, six of the TDRs totaling $1.3 million were non-accruing. All TDRs are reviewed for impairment loss. At December 31, 2016, the Bank had $8.3 million of impaired loans, including $4.6 million in TDRs, compared to $12.6 million of impaired loans, including $6.7 million in TDRs, at December 31, 2015.
Financial Condition - Liabilities
Deposits at the Bank increased $2.0 million or 0.3% to $654.1 million at December 31, 2016 from $652.1 million at December 31, 2015. The Bank had brokered time deposits of $40.3 million and $42.5 million at December 31, 2016 and 2015, respectively. The Bank uses brokered time deposits to manage interest rate risk because they are accessible in bulk at rates typically only slightly higher than those in our market areas. In addition, a portion of these brokered time deposits give the Bank a call option that allows the Bank the choice to redeem them early should rates change. Total deposits at December 31, 2016, excluding brokered time deposits, increased $4.2 million or 0.7% to $613.8 million from $609.6 million at December 31, 2015. Brokered time deposits were 6.2% of total deposits at December 31, 2016 and 6.5% of total deposits at December 31, 2015.
Advances from the FHLB increased $13.8 million or 39.7% to $48.4 million at December 31, 2016 from $34.6 million at December 31, 2015 due to an increase in loan demand from customers and the construction of our newest branch in Evans, Georgia. During the years ended December 31, 2016 and 2015, as part of the Company's strategy to lower its cost of funds, management elected to prepay $17.9 million and $15.0 million, respectively, in higher rate FHLB advances.
Other borrowed money increased $2.9 million or 45.6% to $9.3 million at December 31, 2016 from $6.4 million at December 31, 2015. These borrowings consist of short-term repurchase agreements with certain commercial demand deposit customers for sweep accounts. The repurchase agreements typically mature within one to three days and the interest rate paid on these borrowings floats monthly with money market type rates. At both December 31, 2016 and 2015, the interest rate paid on the repurchase agreements was 0.15%.
In September 2006, Security Federal Statutory Trust issued and sold capital securities of the Trust (the “Capital Securities”). The Trust used the net proceeds from the sale of the Capital Securities to purchase a like amount of junior subordinated debentures (the “Debentures”) of the Company which are reported on the Consolidated Balance Sheet as junior subordinated debentures. The Capital Securities accrue and pay distributions at a floating rate of three month LIBOR plus 170 basis points annually which was equal to 2.66% at December 31, 2016. The distribution rate payable on the Capital Securities is cumulative and payable quarterly in arrears. The Capital Securities mature or are mandatorily redeemable upon maturity on December 15, 2036, or upon earlier optional redemption as provided in the indenture. The Company has the right to redeem the Capital Securities in whole or in part.
18
SECURITY FEDERAL CORPORATION AND SUBSIDIARIES
Management's Discussion and Analysis of Financial Condition and Results of Operations
In December 2009, the Company issued $6.1 million in convertible senior debentures. The debentures mature on December 1, 2029 and accrue interest at the rate of 8.0% per annum until maturity or earlier redemption or repayment. The debentures are convertible into the Company’s common stock at a conversion price of $20 per share at the option of the holder at any time prior to maturity. The debentures are redeemable, in whole or in part, at the option of the Company at any time on or after December 1, 2019, at a price equal to 100% of the principal amount of the debentures to be purchased plus any accrued and unpaid interest to, but excluding, the date of redemption.
In October 2016, the Company obtained a $14.0 million term loan from another financial institution. The Company used the net proceeds from the loan for the sole purpose of financing a portion of the Company's redemption of its Series B Fixed Rate Cumulative Perpetual Preferred Stock ("Series B Preferred Stock"). The loan accrues and pays interest quarterly at a floating rate of the Wall Street Journal Prime index minus 30 basis points, which was equal to 3.45% at December 31, 2016. The note matures on October 1, 2019 and had a remaining principal balance of $13.0 million at December 31, 2016.
Total shareholders' equity was $71.1 million at December 31, 2016, a decrease of $19.9 million or 21.8% from $91.0 million at December 31, 2015. The majority of the decrease relates to the Company's redemption of its 22,000 shares of Series B Preferred Stock for a repurchase amount of $21.3 million plus accrued but unpaid interest of $93,000 for a total payment amount of $21.4 million. In connection with this transaction, the Company received a one time preferred stock redemption discount of $660,000 which was added to net income for the year ended December 31, 2016. The Company paid preferred stock dividends of $423,000, which partially offset the redemption discount, resulting in net income available to common shareholders of $6.2 million for the year ended December 31, 2016. Other changes in shareholders’ equity during the period included a net decrease in other comprehensive income of $3.1 million, representing the unrecognized gain in value of investment and mortgage-backed securities, and $943,000 in dividends paid to common shareholders.
19
SECURITY FEDERAL CORPORATION AND SUBSIDIARIES
Management's Discussion and Analysis of Financial Condition and Results of Operations
Results of Operations
The following table presents the dollar amount of changes in interest income and interest expense for major components of interest-earning assets and interest-bearing liabilities. The table also distinguishes between the changes related to higher or lower outstanding balances and the changes related to the volatility of interest rates. For each category of interest-earning assets and interest-bearing liabilities, information is provided on changes attributable to: (1) changes in rate (multiplied by prior year volume); (2) changes in volume (multiplied by prior year rate); and (3) net change (the sum of the prior columns). For purposes of this table, changes attributable to both rate and volume, which cannot be segregated, have been allocated proportionately to the change attributable to volume and the change attributable to rate. Changes in income are calculated on a tax equivalent basis using a 34% federal income tax rate.
Year Ended December 31, 2016 Compared to Year Ended December 31, 2015 | Year Ended December 31, 2015 Compared to Year Ended December 31, 2014 | |||||||||||||||||||||||
Volume | Rate | Net | Volume | Rate | Net | |||||||||||||||||||
(In Thousands) | ||||||||||||||||||||||||
Interest-Earning Assets: | ||||||||||||||||||||||||
Loans: (1) | ||||||||||||||||||||||||
Mortgage Loans | $ | 59 | $ | 37 | $ | 96 | $ | (133 | ) | $ | 70 | $ | (63 | ) | ||||||||||
Other Loans | 927 | (228 | ) | 699 | (1,247 | ) | 321 | (926 | ) | |||||||||||||||
Total Loans | 986 | (191 | ) | 795 | (1,380 | ) | 391 | (989 | ) | |||||||||||||||
Mortgage-Backed Securities (2) | (163 | ) | (219 | ) | (382 | ) | (567 | ) | (197 | ) | (764 | ) | ||||||||||||
Investments (2)(3) | (256 | ) | 348 | 92 | 362 | (19 | ) | 343 | ||||||||||||||||
Other Interest-Earning Assets | — | 14 | 14 | 3 | (6 | ) | (3 | ) | ||||||||||||||||
Total Interest-Earning Assets | $ | 567 | $ | (48 | ) | $ | 519 | $ | (1,582 | ) | $ | 169 | $ | (1,413 | ) | |||||||||
Interest-Bearing Liabilities: | ||||||||||||||||||||||||
Deposits: | ||||||||||||||||||||||||
Certificate Accounts | $ | (134 | ) | $ | (24 | ) | $ | (158 | ) | $ | (76 | ) | $ | (102 | ) | $ | (178 | ) | ||||||
NOW Accounts | (4 | ) | — | (4 | ) | 4 | (31 | ) | (27 | ) | ||||||||||||||
Money Market Accounts | (2 | ) | — | (2 | ) | (4 | ) | (107 | ) | (111 | ) | |||||||||||||
Savings Accounts | 4 | — | 4 | 3 | — | 3 | ||||||||||||||||||
Total Deposits | (136 | ) | (24 | ) | (160 | ) | (73 | ) | (240 | ) | (313 | ) | ||||||||||||
Borrowings | 201 | (725 | ) | (524 | ) | (1,159 | ) | (141 | ) | (1,300 | ) | |||||||||||||
Total Interest-Bearing Liabilities | 65 | (749 | ) | (684 | ) | (1,232 | ) | (381 | ) | (1,613 | ) | |||||||||||||
Effect on Net Interest Income | $ | 502 | $ | 701 | $ | 1,203 | $ | (350 | ) | $ | 550 | $ | 200 | |||||||||||
(1) INTEREST ON NON-ACCRUAL LOANS IS NOT INCLUDED IN INCOME, ALTHOUGH THEIR LOAN BALANCES ARE INCLUDED IN AVERAGE LOANS OUTSTANDING.
(2) | SECURITIES AVAILABLE FOR SALE ARE COMPUTED USING THEIR HISTORICAL COST. |
(3) | TAX EQUIVALENT BASIS RECOGNIZES THE INCOME TAX SAVINGS WHEN COMPARING TAXABLE AND TAX-EXEMPT ASSETS AND WAS CALCULATED USING AN EFFECTIVE TAX RATE OF 34%. THE TAX-EQUIVALENT ADJUSTMENT RELATES TO THE TAX EXEMPT MUNICIPAL BONDS AND WAS $700,573 AND $663,419 FOR THE YEARS ENDED DECEMBER 31, 2016 AND 2015, RESPECTIVELY. |
20
SECURITY FEDERAL CORPORATION AND SUBSIDIARIES
Management's Discussion and Analysis of Financial Condition and Results of Operations
The following tables present the total dollar amount of interest income on a tax equivalent basis from average interest-earning assets for the periods indicated and the resultant yields, as well as the interest expense on average interest-bearing liabilities expressed both in dollars and rates.
For The Year Ended December 31, | |||||||||||||||||||||||
Yield/ Rate at | 2016 | 2015 | |||||||||||||||||||||
December 31, 2016 | Average Balance | Interest | Annualized Yield/Rate | Average Balance | Interest | Annualized Yield/Rate | |||||||||||||||||
(Dollars In Thousands) | |||||||||||||||||||||||
Interest-Earning Assets: | |||||||||||||||||||||||
Mortgage Loans | 4.49% | $ | 76,231 | $ | 3,393 | 4.45 | % | $ | 74,903 | $ | 3,297 | 4.40 | % | ||||||||||
Other Loans | 5.44% | 268,134 | 15,830 | 5.90 | % | 252,624 | 15,131 | 5.99 | % | ||||||||||||||
Total Loans (1) | 5.24% | 344,365 | 19,223 | 5.58 | % | 327,527 | 18,428 | 5.63 | % | ||||||||||||||
Mortgage-Backed Securities(2) | 2.26% | 218,242 | 4,891 | 2.24 | % | 225,440 | 5,273 | 2.34 | % | ||||||||||||||
Investments (2) (3) | 2.58% | 186,114 | 4,952 | 2.66 | % | 196,268 | 4,860 | 2.48 | % | ||||||||||||||
Other Interest-Earning Assets | 0.80% | 4,071 | 22 | 0.54 | % | 4,103 | 8 | 0.19 | % | ||||||||||||||
Total Interest-Earning Assets | 3.74% | $ | 752,792 | $ | 29,088 | 3.86 | % | $ | 753,338 | $ | 28,569 | 3.79 | % | ||||||||||
Interest-Bearing Liabilities: | |||||||||||||||||||||||
Certificate Accounts | 0.76% | $ | 227,415 | $ | 1,654 | 0.73 | % | $ | 246,422 | $ | 1,812 | 0.74 | % | ||||||||||
NOW Accounts | 0.05% | 95,792 | 34 | 0.04 | % | 91,575 | 38 | 0.04 | % | ||||||||||||||
Money Market Accounts | 0.18% | 232,727 | 390 | 0.17 | % | 231,720 | 392 | 0.17 | % | ||||||||||||||
Savings Accounts | 0.10% | 34,437 | 34 | 0.10 | % | 30,362 | 30 | 0.10 | % | ||||||||||||||
Total Interest-Bearing Deposits | 0.36% | 590,371 | 2,112 | 0.36 | % | 600,079 | 2,272 | 0.38 | % | ||||||||||||||
Other Borrowings | 0.15% | 9,318 | 17 | 0.18 | % | 8,560 | 16 | 0.19 | % | ||||||||||||||
Note Payable | 3.45% | 2,369 | 77 | 3.25 | % | — | — | — | % | ||||||||||||||
Junior Subordinated Debt | 2.66% | 5,155 | 125 | 2.42 | % | 5,155 | 104 | 2.02 | % | ||||||||||||||
Senior Convertible Debt | 8.00% | 6,084 | 487 | 8.00 | % | 6,084 | 487 | 8.00 | % | ||||||||||||||
FHLB Advances | 1.05% | 40,848 | 698 | 1.71 | % | 37,484 | 1,321 | 3.52 | % | ||||||||||||||
Total Interest-Bearing Liabilities | 0.56% | $ | 654,145 | $ | 3,516 | 0.54 | % | $ | 657,362 | $ | 4,200 | 0.64 | % | ||||||||||
Net Interest Income | $ | 25,572 | $ | 24,369 | |||||||||||||||||||
Interest Rate Spread | 3.18% | 3.33 | % | 3.15 | % | ||||||||||||||||||
Net Yield on Earning Assets (Net Interest Margin) | 3.40 | % | 3.23 | % | |||||||||||||||||||
(1) INTEREST ON NON-ACCRUAL LOANS IS NOT INCLUDED IN INCOME, ALTHOUGH THEIR LOAN BALANCES ARE INCLUDED IN AVERAGE LOANS OUTSTANDING.
(2) | SECURITIES AVAILABLE FOR SALE ARE COMPUTED USING THEIR HISTORICAL COST. |
(3) | TAX EQUIVALENT BASIS RECOGNIZES THE INCOME TAX SAVINGS WHEN COMPARING TAXABLE AND TAX-EXEMPT ASSETS AND WAS CALCULATED USING AN EFFECTIVE TAX RATE OF 34%. THE TAX-EQUIVALENT ADJUSTMENT RELATES TO THE TAX EXEMPT MUNICIPAL BONDS AND WAS $700,573 AND $663,419 FOR THE YEARS ENDED DECEMBER 31, 2016 AND 2015. |
21
SECURITY FEDERAL CORPORATION AND SUBSIDIARIES
Management's Discussion and Analysis of Financial Condition and Results of Operations
For The Year Ended December 31, | |||||||||||||||||||||||
Yield/ Rate at | 2015 | 2014 | |||||||||||||||||||||
December 31, 2015 | Average Balance | Interest | Annualized Yield/Rate | Average Balance | Interest | Annualized Yield/Rate | |||||||||||||||||
(Dollars In Thousands) | |||||||||||||||||||||||
Interest-Earning Assets: | |||||||||||||||||||||||
Mortgage Loans | 4.44% | $ | 74,903 | $ | 3,297 | 4.40 | % | $ | 78,022 | $ | 3,360 | 4.31 | % | ||||||||||
Other Loans | 5.71% | 252,624 | 15,131 | 5.99 | % | 273,383 | 16,057 | 5.87 | % | ||||||||||||||
Total Loans (1) | 5.42% | 327,527 | 18,428 | 5.63 | % | 351,405 | 19,417 | 5.53 | % | ||||||||||||||
Mortgage-Backed Securities(2) | 2.34% | 225,440 | 5,273 | 2.34 | % | 249,066 | 6,037 | 2.42 | % | ||||||||||||||
Investments (2) (3) | 2.42% | 196,268 | 4,860 | 2.48 | % | 181,419 | 4,517 | 2.49 | % | ||||||||||||||
Other Interest-Earning Assets | 0.28% | 4,103 | 8 | 0.19 | % | 3,120 | 11 | 0.35 | % | ||||||||||||||
Total Interest-Earning Assets | 3.73% | $ | 753,338 | $ | 28,569 | 3.79 | % | $ | 785,010 | $ | 29,982 | 3.82 | % | ||||||||||
Interest-Bearing Liabilities: | |||||||||||||||||||||||
Certificate Accounts | 0.69% | $ | 246,422 | $ | 1,812 | 0.74 | % | $ | 256,315 | $ | 1,990 | 0.78 | % | ||||||||||
NOW Accounts | 0.05% | 91,575 | 38 | 0.04 | % | 86,553 | 65 | 0.08 | % | ||||||||||||||
Money Market Accounts | 0.16% | 231,720 | 392 | 0.17 | % | 233,676 | 503 | 0.22 | % | ||||||||||||||
Savings Accounts | 0.10% | 30,362 | 30 | 0.10 | % | 26,640 | 27 | 0.10 | % | ||||||||||||||
Total Interest-Bearing Deposits | 0.36% | 600,079 | 2,272 | 0.38 | % | 603,184 | 2,585 | 0.43 | % | ||||||||||||||
Other Borrowings | 0.15% | 8,560 | 16 | 0.19 | % | 9,450 | 17 | 0.18 | % | ||||||||||||||
Junior Subordinated Debt | 2.21% | 5,155 | 104 | 2.02 | % | 5,155 | 101 | 1.96 | % | ||||||||||||||
Senior Convertible Debt | 8.00% | 6,084 | 487 | 8.00 | % | 6,084 | 487 | 8.00 | % | ||||||||||||||
FHLB Advances | 2.85% | 37,484 | 1,321 | 3.52 | % | 70,739 | 2,623 | 3.71 | % | ||||||||||||||
Total Interest-Bearing Liabilities | 0.58% | $ | 657,362 | $ | 4,200 | 0.64 | % | $ | 694,612 | $ | 5,813 | 0.84 | % | ||||||||||
Net Interest Income | $ | 24,369 | $ | 24,169 | |||||||||||||||||||
Interest Rate Spread | 3.15% | 3.15 | % | 2.98 | % | ||||||||||||||||||
Net Yield on Earning Assets (Net Interest Margin) | 3.23 | % | 3.08 | % | |||||||||||||||||||
(1) INTEREST ON NON-ACCRUAL LOANS IS NOT INCLUDED IN INCOME, ALTHOUGH THEIR LOAN BALANCES ARE INCLUDED IN AVERAGE LOANS OUTSTANDING.
(2) | SECURITIES AVAILABLE FOR SALE ARE COMPUTED USING THEIR HISTORICAL COST. |
(3) | TAX EQUIVALENT BASIS RECOGNIZES THE INCOME TAX SAVINGS WHEN COMPARING TAXABLE AND TAX-EXEMPT ASSETS AND WAS CALCULATED USING AN EFFECTIVE TAX RATE OF 34%. THE TAX-EQUIVALENT ADJUSTMENT RELATES TO THE TAX EXEMPT MUNICIPAL BONDS AND WAS $663,419 AND $499,594 FOR THE YEARS ENDED DECEMBER 31, 2015 AND 2014. |
.
22
SECURITY FEDERAL CORPORATION AND SUBSIDIARIES
Management's Discussion and Analysis of Financial Condition and Results of Operations
Comparison of the Years Ended December 31, 2016 and 2015
General
The Company’s earnings available to common shareholders were $6.2 million or $1.99 per diluted common share for the year ended December 31, 2016, compared to $5.7 million or $1.84 per diluted common share for the year ended December 31, 2015. The $486,000 or 8.6% increase in earnings was primarily the result of an increase in net interest income offset partially by an increase in the provision for loan losses. Also contributing to the increase in earnings was a one-time gain on the redemption of preferred stock of $660,000 received in the fourth quarter of 2016.
Net Interest Income
Net interest margin on a tax equivalent basis increased 17 basis points to 3.40% for the year ended December 31, 2016 from 3.23% for the year ended December 31, 2015. The improvement in net interest spread was primarily achieved through an increase in interest income from loans combined with lower cost of funds. Interest income from loans increased $795,000 or 4.3% to $19.2 million for the year ended December 31, 2016 compared to $18.4 million for the year ended December 31, 2015. The increase was attributable to a $16.8 million increase in average total loans outstanding offset by a five basis point decrease in the average yield earned on the Bank’s loans during the year ended December 31, 2016. Total interest expense decreased $683,000 or 16.3% to $3.5 million for the year ended December 31, 2016, compared to $4.2 million for the year ended December 31, 2015. Consistent with the increase in net interest spread, tax equivalent net interest income increased $1.2 million or 4.9% to $25.6 million for the year ended December 31, 2016, compared to $24.7 million for the year ended December 31, 2015.
Tax equivalent interest income on investment securities, mortgage-backed securities, and other investments decreased $276,000 as a result of a $17.4 million decrease in the aggregate average balance of these interest earning assets offset by an increase of four basis points in the yield earned.
Interest expense on deposits decreased $160,000 or 7.0% to $2.1 million during the year ended December 31, 2016 from $2.3 million during the year ended December 31, 2015. Average interest bearing deposits decreased $9.7 million or 1.6% to $590.4 million during the year ended December 31, 2016 compared to $600.1 million during 2015, while the average cost of those deposits decreased two basis points to 0.36% during the year ended December 31, 2016 from 0.38% in 2015.
Interest expense on FHLB advances decreased $623,000 or 47.1% to $698,000 during the year ended December 31, 2016 from $1.3 million in 2015. The decrease was the result of a decrease of 181 basis points in the average cost of advances to 1.71% during 2016 compared to 3.52% during 2015. This decrease was offset by a $3.4 million increase in the average balance of FHLB advances outstanding during the year ended December 31, 2016.
Total average interest-earning assets decreased $546,000 or 0.1% to $752.8 million for the year ended December 31, 2016 from $753.3 million for the year ended December 31, 2015 while average interest-bearing liabilities decreased $3.2 million or 0.5% to $654.1 million for the year ended December 31, 2016 from $657.4 million for the year ended December 31, 2015. The interest rate spread was 3.33% for the year ended December 31, 2016 compared to 3.15% for the year ended December 31, 2015.
Provision for Loan Losses
The provision for loan losses was $500,000 for the year ended December 31, 2016 compared to a net provision of $0 for the year ended December 31, 2015. The increase was the result of an increase in net charge-offs combined with growth in total loans outstanding. The Company had net charge-offs of $419,000 for the year ended December 31, 2016 compared to $82,000 for the year ended December 31, 2015. Net charge-offs were 0.12% of gross loans during the year ended December 31, 2016 compared to 0.02% for the same period in 2015.
The amount of the provision is determined by management’s on-going monthly analysis of the loan portfolio and the adequacy of the allowance for loan losses. The Company has established policies and procedures for evaluating and monitoring the credit quality of the loan portfolio and for the timely identification of potential problem loans including internal and external loan reviews. The adequacy of the allowance for loan losses is reviewed monthly by the Asset Classification Committee and quarterly by the Board of Directors. Management’s monthly review of the adequacy of the allowance includes three main components.
23
SECURITY FEDERAL CORPORATION AND SUBSIDIARIES
Management's Discussion and Analysis of Financial Condition and Results of Operations
The first component is an analysis of loss potential in various homogeneous segments of the portfolio based on historical trends and the risk inherent in each category. The historical loss periods used to calculate these ratios can range from one to five years depending on which period is deemed a more relevant indicator of future losses.
The second component of management’s monthly analysis is the specific review and evaluation of significant problem credits identified through the Company’s internal monitoring system, including but not limited to classified loans, non-accrual loans and TDRs. These loans are evaluated for impairment and recorded in accordance with accounting guidance. All TDRs and substantially all non-accrual loans are individually for impairment. In accordance with our policy, non-accrual commercial loans with a balance less than $200,000 and non-accrual consumer loans with a balance less than $100,000 are deemed immaterial and therefore excluded from the individual impairment review. For each loan deemed impaired, management calculates a specific reserve for the amount in which the recorded investment in the loan exceeds the fair value. This estimate is based on a thorough analysis of the most probable source of repayment, which is typically liquidation of the collateral.
The third component is an analysis of changes in qualitative factors that may affect the portfolio, including but not limited to: relevant economic trends that could impact borrowers’ ability to repay, industry trends, changes in the volume and composition of the portfolio, credit concentrations, or lending policies and the experience and ability of the staff and Board of Directors. Management also reviews and incorporates certain ratios such as percentage of classified loans, average historical loan losses by loan category, delinquency percentages, and the assignment of percentage targets of reserves in each loan category when evaluating the allowance. Once the analysis is completed, the three components are combined and compared to the allowance amount. Based on this, charges are made to the provision as needed.
Management believes the allowance for loan losses is adequate based on its best estimates of the losses inherent in the loan portfolio, although there can be no guarantee as to these estimates. In addition, bank regulatory agencies may require additional provisions to the allowance for loan losses based on their judgments and estimates as part of their examination process. Because the allowance for loan losses is an estimate, there can be no guarantee that actual loan losses will not exceed the allowance for loan losses, or that additional increases in the allowance for loan losses will not be required in the future.
Non-Interest Income
Non-interest income decreased $606,000 or 8.7% to $6.4 million for the year ended December 31, 2016 from $7.0 million for the year ended December 31, 2015. The decrease is primarily the result of a decrease in the gain on sale of investment securities partially offset by an increase in the gain on sale of loans in 2016.
Gain on sale of investment securities decreased $1.2 million or 62.7% to $704,000 during the year ended December 31, 2016 from $1.9 million for the same period in 2015. The decrease was due to a decrease in the number of investment securities sold. The Company sold 42 available for sale investment securities during 2016 compared to 56 in 2015. Gain on sale of loans increased $266,000 or 38.6% to $956,000 for the year ended December 31, 2016 compared to $690,000 in 2015. The Company sold 201 loans to investors with an average balance of $176,000 in 2016 compared to 154 loans sold to investors with an average balance of $157,000 during 2015.
Service fees on deposit accounts decreased $36,000 or 3.3% to $1.0 million during the year ended December 31, 2016 from $1.1 million during the year ended December 31, 2015. Income from insurance agency commissions was $556,000 during the year ended December 31, 2016, an increase of $84,000 or 17.7% compared to $472,000 during the year ended December 31, 2015. Trust income increased $79,000 or 13.0% to $688,000 during the year ended December 31, 2016 from $609,000 during 2015. Check card fee income increased $25,000 or 2.6% to $995,000 for the year ended December 31, 2016 compared to $970,000 for the same period in the prior year. Income from BOLI increased $105,000 or 24.8% to $528,000 during the year ended December 31, 2016 from $423,000 during the year ended December 31, 2015. All BOLI income recognized in 2016 and 2015 was related to accrued interest credited to the cash surrender value underlying the BOLI policies. There was no additional income received for death benefits during those periods. Other non-interest income including annuity and investment brokerage commissions, bank credit life insurance on loans, and other miscellaneous income increased slightly from $652,000 for the year ended December 31, 2015 to $669,000 in 2016.
The Bank received $265,000 in grant income during the year ended December 31, 2016, which was awarded by the Bank Enterprise Award (BEA) Program in recognition of the Bank’s investments in distressed communities and its continued commitment to community development. The amount of the award increases as the Bank’s investment in these areas increases, but is also subject to changes in program funding levels from the federal government.
24
SECURITY FEDERAL CORPORATION AND SUBSIDIARIES
Management's Discussion and Analysis of Financial Condition and Results of Operations
In 2012, the United States Department of the Treasury's ("U.S. Treasury") Community Development Financial Institutions ("CDFI") Fund awarded the Bank a grant totaling $1.5 million in connection with a CDFI program that recognizes organizations who serve low income and distressed communities. As part of the award, the Bank committed to establish a small business micro lending program that lends specifically in low to moderate income areas. The Bank was required to lend $1.2 million over a five year period to qualifying customers, with the related grant income to be recognized during the period in which the loans were funded. During the year ended December 31, 2015, the Bank recognized $230,000 in grant income related to this award and as of that date there was no income remaining to be recognized related to unfunded microloans.
Non-Interest Expense
Non-interest expense increased $397,000 or 1.8% to $22.9 million during the year ended December 31, 2016 compared to $22.5 million during the same period one year earlier. The increase in non-interest expense was primarily due to increases in compensation and employee benefits expense and depreciation and maintenance expense, both of which increased as a result of our recent expansion. Since December 2015, we opened a fourth branch in our Midlands market and broke ground on our second branch in Evans, Georgia.
Compensation and employee benefits increased $854,000 or 7.0% to $13.0 million during the year ended December 31, 2016 from $12.2 million for the year ended December 31, 2015. The increase was a result of general cost of living increases combined with an increase in the number of full time equivalent employees within the branches. The Company recognized $250,000 and $150,000 in accrued bonuses related to its incentive compensation plan offered to employees during the years ended December 31, 2016 and 2015, respectively. The incentive compensation plan, first implemented in 2014, was designed to maximize achievement of the Bank’s overall goals by setting performance objectives for employees that are directly linked to the financial and strategic performance of the Bank. It encourages employees to focus on the success and profitability of the Bank and provides a means for the Bank to offer competitive pay to attract and retain the highest quality and highest performing employees.
Depreciation and maintenance of equipment increased $255,000 or 15.0% to $2.0 million for the year ended December 31, 2016 compared to $1.7 million in 2015 as a result of the new branches mentioned above. Occupancy expense increased $56,000 or 2.9% to $2.0 million for the year ended December 31, 2016 compared to $1.9 million for the year ended December 31, 2015. Advertising expense increased $116,000 or 14.0% to $533,000 for the year ended December 31, 2016 from $416,000 for the year ended December 31, 2015. Other non-interest expenses increased $416,000 or 9.5% to $4.8 million for the year ended December 31, 2016 compared to $4.4 million during 2015. Other expenses include legal, professional, and consulting expenses, office supplies and other miscellaneous expenses.
As part of the Company's strategy to lower its cost of funds, management elected to prepay some higher rate FHLB advances during 2016 and 2015, which resulted in prepayment penalties of $789,000 and $788,000 during the years ended December 31, 2016 and 2015, respectively.
The increase in non-interest expense was offset by a $609,000 net gain on the operation of OREO during the year ended December 31, 2016, a decrease of $1.1 million compared to net expense of $524,000 during the same period in 2015. The majority of the net gain was related to the sale of one OREO property in February 2016, which resulted in a $739,000 gain that was recorded as an offset to the cost of operating OREO properties during the period. A lower OREO balance and a decrease in OREO writedowns also contributed to the decrease in related expense. OREO was $2.7 million at December 31, 2016 compared to $4.4 million at December 31, 2015. OREO is recorded at the lower of cost or estimated fair value less costs to sell. As local real estate values declined significantly in the prior years, the Bank was required to write down these properties to their fair values. As a result of the improvement in real estate values within our market areas, write downs on OREO decreased to $40,000 for the year ended December 31, 2016 compared to write downs of $312,000 during 2015.
Income Taxes
The provision for income taxes decreased $147,000 or 7.1% to $1.9 million during the year ended December 31, 2016 compared to $2.1 million for the year ended December 31, 2015. The Company's combined federal and state effective tax rate was 24.5% for 2016 compared to 25.3% for 2015.
25
SECURITY FEDERAL CORPORATION AND SUBSIDIARIES
Management's Discussion and Analysis of Financial Condition and Results of Operations
Comparison of the Years Ended December 31, 2015 and 2014
General
The Company’s earnings available to common shareholders were $5.7 million or $1.84 per diluted common share for the year ended December 31, 2015, compared to $5.4 million or $1.75 per diluted common share for the year ended December 31, 2014. The $305,000 or 5.7% increase in earnings was attributable primarily to an increase in non-interest income combined with a decrease in the provision for loan losses.
Net Interest Income
Net interest margin on a tax equivalent basis increased 15 basis points to 3.23% for the year ended December 31, 2015 from 3.08% for the year ended December 31, 2014. The improvement in net interest spread was achieved through lower cost of funds as total interest expense decreased $1.6 million or 27.8% to $4.2 million for the year ended December 31, 2015, compared to $5.8 million for the year ended December 31, 2014. The decrease in interest expense was partially offset by a decrease in interest income. Net interest income after the provision for loan losses increased $487,000 or 2.1% to $23.7 million for the year ended December 31, 2015 compared to $23.2 million for the year ended December 31, 2014. Average interest-earning assets decreased $31.6 million or 4.0% to $753.3 million for the year ended December 31, 2015 from $785.0 million for the year ended December 31, 2014 while average interest-bearing liabilities decreased $37.3 million or 5.4% to $657.4 million for the year ended December 31, 2015 from $694.6 million for the year ended December 31, 2014. The interest rate spread was 3.15% for the year ended December 31, 2015 compared to 2.98% for the year ended December 31, 2014.
Interest income on loans decreased $1.0 million to $18.4 million during the year ended December 31, 2015 from $19.4 million during the year ended December 31, 2014. The 5.1% decrease was attributable to a decrease of $23.8 million in average total loans outstanding offset by a 10 basis point increase in the average yield earned on the Bank’s loans during the year ended December 31, 2015. Tax equivalent interest income on investment securities, mortgage-backed securities, and other investments decreased $424,000 as a result of an decrease in the yield earned combined with a $7.8 million decrease in the aggregate average balance of these interest-earning assets.
Interest expense on deposits decreased $313,000 or 12.1% to $2.3 million during the year ended December 31, 2015. Average interest bearing deposits decreased $3.1 million to $600.1 million during the year ended December 31, 2015 compared to $603.2 million during the year ended December 31, 2014, while the average cost of those deposits decreased five basis points to 0.38% during the year ended December 31, 2015. Interest expense on FHLB advances and other borrowings decreased $1.3 million or 49.4% to $1.3 million during the year ended December 31, 2015 from $2.6 million during the year ended December 31, 2014. The decrease was a result of a $34.1 million decrease in average FHLB advances and other borrowings outstanding during the year ended December 31, 2015 and a decrease in the average costs of those borrowings of 39 basis points to 2.90% compared to 3.29% during the year ended December 31, 2014.
Interest expense on junior subordinated debentures was $104,000 for the year ended December 31, 2015 compared to $101,000 for the year ended December 31, 2014. The average outstanding balance on these debentures remained constant at $5.2 million during both periods while the average cost increased six basis points to 2.02% during the year ended December 31, 2015 compared to 1.96% for the year ended December 31, 2014. Interest expense on senior convertible debentures was $487,000 for each of the years ended December 31, 2015 and 2014. The senior convertible debentures were issued during December 2009 and have a fixed rate of 8%.
Provision for Loan Losses
The net provision for loan losses was $0 for the year ended December 31, 2015 compared to provision expense of $450,000 for the year ended December 31, 2014. The decrease in the provision was attributable to a decrease in net charge offs. Net charge offs were $82,000 during the year ended December 31, 2015 compared to $2.3 million during the year ended December 31, 2014. The allowance for loan losses represented 7,535.3% of net charge offs during the year ended December 31, 2015 compared to 358.0% during the year ended December 31, 2014. Non-performing assets, which consist of non-accrual loans and repossessed assets, decreased $5.6 million or 32.9% to $11.4 million at December 31, 2015 from $17.0 million at December 31, 2014. As non-performing assets decline, the additional provision required to cover these loans has also declined. The majority of these loans are secured by real estate, and have been measured for impairment under the fair value of collateral method. As real estate values have continued to stabilize, the need to reserve for these assets has declined.
26
SECURITY FEDERAL CORPORATION AND SUBSIDIARIES
Management's Discussion and Analysis of Financial Condition and Results of Operations
Non-Interest Income
Non-interest income increased $844,000 or 13.7% to $7.0 million for the year ended December 31, 2015 from $6.2 million for the year ended December 31, 2014. The increase is primarily the result of an increase in the gain on sale of investment securities and loans partially offset by a decrease in grant income.
The gain on sale of investment securities increased $1.4 million or 331.7% to $1.9 million during the year ended December 31, 2015 from $437,000 during the year ended December 31, 2014. Gain on sale of loans increased $69,000 or 11.1% to $690,000 during the year ended December 31, 2015 compared to $621,000 during the year ended December 31, 2014. Service fees on deposit accounts decreased $101,000 or 8.6% to $1.1 million during the year ended December 31, 2015 from $1.2 million during the year ended December 31, 2014.
Income from insurance agency commissions was $472,000 during the year ended December 31, 2015, an increase of $47,000 or 11.0% compared to $425,000 during the year ended December 31, 2014. Trust income increased $67,000 or 12.3% to $609,000 during the year ended December 31, 2015 from $542,000 during the year ended December 31, 2014. Income from BOLI decreased $131,000 or 23.7% to $423,000 during the year ended December 31, 2015 from $554,000 during the year ended December 31, 2014. All BOLI income recognized in 2015 was related to accrued interest credited to the cash surrender value underlying the BOLI policies. During 2014, the Bank recognized $254,000 in death benefits in addition to $300,000 in income related to an increase in the cash surrender value of the BOLI policies.
Check card fee income increased $68,000 or 7.5% to $970,000 for the year ended December 31, 2015 compared to $902,000 for the same period in the prior year. Other non-interest income including annuity and investment brokerage commissions, bank credit life insurance on loans, and other miscellaneous income remained relatively unchanged at $652,000 during the years ended December 31, 2015 and 2014.
In 2012, the U.S. Treasury's CDFI Fund awarded the Bank a grant totaling $1.5 million in recognition of its commitment to community development. The award is part of a CDFI program that recognizes organizations who serve low income and distressed communities. As part of the award, the Bank committed to establish a small business micro lending program that lends specifically in low to moderate income areas. The Bank was required to lend $1.2 million over a five year period to qualifying customers. The Bank recognized $230,000 in grant income related to this award during the year ended December 31, 2015 compared to $295,000 during the year ended December 31, 2014. The grant income is recognized during the period in which the loans are funded. At December 31, 2015, there was no income remaining to be recognized related to unfunded microloans. During the year ended December 31, 2014, the Bank also recognized $557,000 in grant income, which was awarded by the Bank Enterprise Award (BEA) Program in recognition of the Bank’s investments in distressed communities and its continued commitment to community development. The amount of the award increases as the Bank’s investment in these areas increases. The Bank did not receive a similar award under this program during the year ended December 31, 2015. Due to a change in the timing of the award, the Bank received an award for its 2015 performance in early fiscal 2016.
Non-Interest Expense
Non-interest expense increased $1.3 million or 5.9% to $22.5 million during the year ended December 31, 2015 compared to $21.3 million during the same period one year earlier. The increase in non-interest expense was primarily the result of an increase in compensation and employee benefits expense and prepayment penalties on FHLB advances.
Compensation and employee benefits increased $872,000 or 7.7% to $12.2 million during the year ended December 31, 2015 from $11.3 million for the year ended December 31, 2014. The Company recognized $150,000 in accrued bonuses related to its incentive compensation plan offered to employees during the year ended December 31, 2015. The incentive compensation plan, first implemented in 2014, was designed to maximize achievement of the Bank’s overall goals by setting performance objectives for employees that are directly linked to the financial and strategic performance of the Bank. It encourages employees to focus on the success and profitability of the Bank and provides a means for the Bank to offer competitive pay to attract and retain the highest quality and highest performing employees.
Occupancy expense decreased $92,000 or 4.6% to $1.9 million for the year ended December 31, 2015 compared to $2.0 million for the year ended December 31, 2014. Depreciation and maintenance of equipment remained relatively unchanged at $1.7 million for the years ended December 31, 2015 and 2014. Advertising expense decreased $68,000 or 14.0% to $416,000 for the year ended December 31, 2015 from $484,000 for the year ended December 31, 2014.
27
SECURITY FEDERAL CORPORATION AND SUBSIDIARIES
Management's Discussion and Analysis of Financial Condition and Results of Operations
Net cost of operation of OREO decreased $17,000 or 3.2% to $524,000 for the year ended December 31, 2015 from $542,000 for the same period in 2014. OREO was $4.4 million at December 31, 2015 compared to $3.2 million at December 31, 2014. The decrease in the cost of OREO was the result of a decrease in OREO write downs during the year. OREO is recorded at the lower of cost or estimated fair value less costs to sell. As local real estate values declined significantly in the prior years, the Bank was required to write down these properties to their fair values. Write downs on OREO decreased to $312,000 for the year ended December 31, 2015 compared to $505,000 for the year ended December 31, 2014 as a result of the improvement of in real estate values in our market areas.
As part of the Company's strategy to lower its cost of funds, management elected to prepay some higher rate advances during 2015 and 2014. The Company incurred prepayment penalties of $788,000 and $178,000 for paying down FHLB advances during the years ended December 31, 2015 and 2014, respectively.
Other expenses remained unchanged at $4.4 million for the year ended December 31, 2015 and 2014. Other expenses include legal, professional, and consulting expenses, office supplies and other miscellaneous expenses.
Income Taxes
The provision for income taxes decreased $236,000 or 10.2% to $2.1 million during the year ended December 31, 2015 compared to $2.3 million for the year ended December 31, 2014. The effective tax rate was 25.3% for 2015 and 28.3% for 2014.
Regulatory Capital
The following table reconciles the Bank's shareholders' equity to its various regulatory capital positions.
December 31, | |||||||
2016 | 2015 | ||||||
(In Thousands) | |||||||
Bank’s Shareholders’ Equity (1) | $ | 89,339 | $ | 88,928 | |||
Reduction for Goodwill | 1,200 | 1,200 | |||||
Tangible Capital | 88,139 | 87,728 | |||||
Core Capital | 88,139 | 87,728 | |||||
Supplemental Capital | 5,596 | 4,925 | |||||
Total Risk-Based Capital | $ | 93,735 | $ | 92,653 | |||
(1) | THE YEARS ENDED DECEMBER 31, 2016 AND 2015 EXCLUDE UNREALIZED GAINS OF $1.1 MILLION and $4.2 MILLION, RESPECTIVELY, ON INVESTMENT SECURITIES. |
The Bank is subject to minimum capital requirements imposed by the FDIC. Based on capital levels at December 31, 2016, the Bank was considered to be well capitalized. At December 31, 2016, the Bank exceeded all regulatory capital requirements with Tier 1 leverage-based capital, Tier 1 risk-based capital, total risk-based capital, and common equity Tier 1 (CET1) capital ratios of 10.8%, 19.8%, 21.1%, and 19.8%, respectively.
For a bank holding company with less than $1.0 billion in assets, such as the Company, the capital guidelines apply on a bank only basis and the Federal Reserve requires the holding company's subsidiary banks to be well-capitalized under the prompt corrective action regulations. If Security Federal Corporation was subject to regulatory guidelines for bank holding companies with $1.0 billion or more in assets, at December 31, 2016, it would have exceeded all regulatory capital requirements. At December 31, 2016, the Company exceeded all regulatory capital requirements with Tier 1 leverage-based capital, Tier 1 risk-based capital, total risk-based capital, and common equity Tier 1 (CET1) capital ratios of 9.1%, 16.6%, 17.8%, and 15.4%, respectively.
For additional information regarding the Bank's and Company's regulatory capital compliance, see the discussion included in Note 15 of the Notes to Consolidated Financial Statements included herein.
28
SECURITY FEDERAL CORPORATION AND SUBSIDIARIES
Management's Discussion and Analysis of Financial Condition and Results of Operations
Liquidity and Capital Resources
Liquidity refers to the ability to generate sufficient cash flows to fund current loan demand, repay maturing borrowings, fund maturing deposit withdrawals, and meet operating expenses. The Bank's primary sources of funds include loan repayments, loan sales, increased deposits, advances from the FHLB, and cash flow generated from operations. The need for funds varies among periods depending on funding needs as well as the rate of amortization and prepayment on loans. The use of FHLB and other advances and borrowings varies depending on loan demand, deposit inflows, and the use of investment leverage strategies to increase net interest income.
The principal use of the Bank's funds is the origination of mortgages and other loans and the purchase of investments and mortgage-backed securities. Originations of new loans and renewals of previously funded loans on loans held for investment were $231.0 million during the year ended December 31, 2016 compared to $156.7 million during the year ended December 31, 2015 and $139.2 million during the year ended December 31, 2014. The increase in originations and renewals during the year ended December 31, 2016 resulted in a $60.7 million increase in commercial loan originations. Purchases of investments and mortgage-backed securities were $98.7 million during the year ended December 31, 2016 compared to $114.5 million during the year ended December 31, 2015 and $119.3 million during the year ended December 31, 2014. Other uses of the Bank's funds during the year ended December 31, 2016 included paying down FHLB advances, dividend payments to shareholders and the redemption of the Company's preferred stock.
Unused lines of credit on home equity loans, credit cards, and commercial loans amounted to $80.8 million at December 31, 2016. Home equity loans are made on a floating rate basis with final maturities of 10 to 15 years. Credit cards are made on a fixed rate basis, currently at 9.99% and are renewed every three years. In addition to the above commitments, the Bank has undisbursed loans-in-process of $3.5 million at December 31, 2016, which will be disbursed over an average of 90 days. These commitments to originate loans and future advances of lines of credit are expected to be funded from loan amortizations and prepayments, deposit inflows, maturing investments, and short-term borrowing capacity.
The following table summarizes the length of time until maturity for unused commitments to extend credit and standby letters of credit at December 31, 2016:
(In Thousands) | One Month Or Less | After One Through Three Months | After Three Through Twelve Months | Within One Year | One Year Or Greater | Total | |||||||||||||||||
Unused Lines Of Credit | $ | 303 | $ | 1,108 | $ | 23,526 | $ | 24,937 | $ | 55,317 | $ | 80,254 | |||||||||||
Standby Letters Of Credit | 25 | 160 | 384 | 569 | — | 569 | |||||||||||||||||
Total | $ | 328 | $ | 1,268 | $ | 23,910 | $ | 25,506 | $ | 55,317 | $ | 80,823 | |||||||||||
Management believes that future liquidity can be met through the Bank's deposit base, which had a balance of $654.1 million at December 31, 2016, and from investment sales and maturities. In addition, at December 31, 2016 the Bank had another $198.7 million in unused borrowing capacity at the FHLB.
Historically the Bank’s cash flow from operating activities has been relatively stable. The cash flows from investing activities vary with sales of investments and with the need to invest excess funds or utilize leverage strategies with the purchase of mortgage-backed and investment securities. The cash flows from financing activities vary depending on the need for FHLB advances and other borrowings.
Security Federal Corporation is a separate legal entity from Security Federal Bank and must provide for its own liquidity and pay its own operating expenses. Sources of capital and liquidity for Security Federal Corporation include distributions from Security Federal Bank and the issuance of debt or equity securities, although there are regulatory restrictions on the ability of the Security Federal Bank to pay dividends. At December 31, 2016, Security Federal Corporation (on an unconsolidated basis) had liquid assets of $4.8 million.
29
SECURITY FEDERAL CORPORATION AND SUBSIDIARIES
Management's Discussion and Analysis of Financial Condition and Results of Operations
Contractual Obligations
In the normal course of business, the Company enters into contractual obligations that meet various business needs. These contractual obligations include time deposits to customers, borrowings from the FHLB of Atlanta, other borrowings, notes payable, junior subordinated debentures, senior convertible debentures and lease obligations for facilities. See Notes 5, 9, 10, 11, 12 and 13 of the Notes to the Consolidated Financial Statements included herein for additional information. The following table summarizes the Company’s long-term contractual obligations at December 31, 2016. Contractual repayments may differ from actual repayments because some of the obligations may be subject to calls.
One Year or Less | Over One to Three Years | Over Three to Five Years | Thereafter | Total | |||||||||||||||
(In Thousands) | |||||||||||||||||||
Time Deposits | $ | 131,485 | $ | 55,844 | $ | 28,216 | $ | — | $ | 215,545 | |||||||||
FHLB Advances | 15,395 | 30,000 | 3,000 | — | 48,395 | ||||||||||||||
Other Borrowings | 9,338 | — | — | — | 9,338 | ||||||||||||||
Note Payable | — | 13,000 | — | — | 13,000 | ||||||||||||||
Jr. Subordinated Debentures | — | — | — | 5,155 | 5,155 | ||||||||||||||
Sr. Convertible Debentures | — | — | — | 6,084 | 6,084 | ||||||||||||||
Operating Lease Obligations | 407 | 599 | 591 | 2,962 | 4,559 | ||||||||||||||
Total | $ | 156,625 | $ | 99,443 | $ | 31,807 | $ | 14,201 | $ | 302,076 | |||||||||
Off-Balance Sheet Arrangements
In the normal course of business, the Company makes off-balance sheet arrangements, including credit commitments to its customers to meet their financial needs. These arrangements involve, to varying degrees, elements of credit and interest rate risk not recognized in the consolidated statement of financial condition. The Bank makes personal, commercial, and real estate lines of credit available to customers and does issue standby letters of credit.
Commitments to extend credit to customers are subject to the Bank’s normal credit policies and are essentially the same as those involved in extending loans to customers. See Note 18 of the Notes to the Consolidated Financial Statements included herein for additional information.
Impact of Inflation and Changing Prices
The Consolidated Financial Statements, related notes, and other financial information presented herein have been prepared in accordance with Generally Accepted Accounting Principles (“GAAP”) that require the measurement of financial position and operating results in terms of historical dollars without considering changes in relative purchasing power over time due to inflation. Unlike most industrial companies, substantially all of the assets and liabilities of a financial institution are monetary in nature. As a result, interest rates generally have a more significant impact on a financial institution's performance than does the effect of inflation.
30
REPORT OF INDEPENDENT REGISTERED PUBLIC ACCOUNTING FIRM
To the Board of Directors
Security Federal Corporation and Subsidiaries
Aiken, South Carolina
We have audited the accompanying consolidated balance sheets of Security Federal Corporation and Subsidiaries as of December 31, 2016 and 2015, and the related consolidated statements of income, comprehensive income, shareholders' equity, and cash flows for each of the three years in the period ended December 31, 2016. These consolidated financial statements are the responsibility of the Company's management. Our responsibility is to express an opinion on these consolidated financial statements based on our audits.
We conducted our audits in accordance with the standards of the Public Company Accounting Oversight Board (United States). Those standards require that we plan and perform the audit to obtain reasonable assurance about whether the financial statements are free of material misstatement. The Company is not required to have, nor were we engaged to perform, an audit of its internal control over financial reporting. Our audits included consideration of internal control over financial reporting as a basis for designing audit procedures that are appropriate in the circumstances, but not for the purpose of expressing an opinion on the effectiveness of the Company’s internal control over financial reporting. Accordingly, we express no such opinion. An audit also includes examining, on a test basis, evidence supporting the amounts and disclosures in the financial statements, assessing the accounting principles used and significant estimates made by management, as well as evaluating the overall financial statement presentation. We believe that our audits provide a reasonable basis for our opinion.
In our opinion, the consolidated financial statements referred to above present fairly, in all material respects, the financial position of Security Federal Corporation and Subsidiaries as of December 31, 2016 and 2015, and the results of their operations and their cash flows for each of the three years in the period ended December 31, 2016, in conformity with U.S. generally accepted accounting principles.
/s/ Elliott Davis Decosimo, LLC
Columbia, South Carolina
March 20, 2017
31
SECURITY FEDERAL CORPORATION AND SUBSIDIARIES
Consolidated Balance Sheets | December 31, | ||||||
2016 | 2015 | ||||||
ASSETS: | |||||||
Cash and Cash Equivalents | $ | 9,374,549 | $ | 8,381,951 | |||
Certificates of Deposit with Other Banks | 2,445,005 | 3,445,005 | |||||
Investment and Mortgage-Backed Securities: | |||||||
Available For Sale | 362,059,429 | 375,513,870 | |||||
Held To Maturity (Fair Value of $25,371,052 and $29,681,280 at December 31, 2016 and 2015, Respectively) | 25,583,956 | 29,873,098 | |||||
Total Investments and Mortgage-Backed Securities | 387,643,385 | 405,386,968 | |||||
Loans Receivable, Net: | |||||||
Held For Sale | 4,243,907 | 2,462,559 | |||||
Held For Investment: (Net of Allowance of $8,356,231 and $8,275,133 at December 31, 2016 and December 31, 2015, Respectively) | 355,478,939 | 328,110,170 | |||||
Total Loans Receivable, Net | 359,722,846 | 330,572,729 | |||||
Accrued Interest Receivable: | |||||||
Loans | 1,038,444 | 886,968 | |||||
Mortgage-Backed Securities | 605,474 | 614,925 | |||||
Investment Securities | 1,407,923 | 1,523,200 | |||||
Total Accrued Interest Receivable | 3,051,841 | 3,025,093 | |||||
Premises and Equipment, Net | 21,197,684 | 20,116,918 | |||||
Federal Home Loan Bank ("FHLB") Stock, at Cost | 2,776,500 | 2,214,800 | |||||
Other Real Estate Owned ("OREO") | 2,721,214 | 4,361,411 | |||||
Bank Owned Life Insurance ("BOLI") | 17,101,045 | 16,573,045 | |||||
Goodwill | 1,199,754 | 1,199,754 | |||||
Other Assets | 5,447,746 | 4,449,956 | |||||
Total Assets | $ | 812,681,569 | $ | 799,727,630 | |||
LIABILITIES AND SHAREHOLDERS’ EQUITY: | |||||||
Liabilities: | |||||||
Deposit Accounts | $ | 654,103,278 | $ | 652,096,545 | |||
Advance Payments By Borrowers For Taxes and Insurance | 260,580 | 256,730 | |||||
Advances From FHLB | 48,395,000 | 34,640,000 | |||||
Other Borrowings | 9,338,148 | 6,411,977 | |||||
Note Payable | 13,000,000 | — | |||||
Junior Subordinated Debentures | 5,155,000 | 5,155,000 | |||||
Senior Convertible Debentures | 6,084,000 | 6,084,000 | |||||
Other Liabilities | 5,233,289 | 4,115,956 | |||||
Total Liabilities | 741,569,295 | 708,760,208 | |||||
Commitments (Notes 5 and 18) | |||||||
Shareholders' Equity: | |||||||
Serial Preferred Stock, $.01 Par Value; Authorized 200,000 Shares; Issued and Outstanding, 22,000 at December 31, 2015 | — | 22,000,000 | |||||
Common Stock, $.01 Par Value; Authorized 5,000,000 Shares; Issued and Outstanding Shares, 3,146,407 and 2,945,474, Respectively | 31,464 | 31,464 | |||||
Additional Paid-In Capital | 12,036,744 | 12,028,832 | |||||
Treasury Stock, at Cost (200,933 Shares) | (4,330,712 | ) | (4,330,712 | ) | |||
Unvested Restricted Stock | (25,358 | ) | (25,358 | ) | |||
Accumulated Other Comprehensive Income | 1,180,086 | 4,262,361 | |||||
Retained Earnings | 62,220,050 | 57,000,835 | |||||
Total Shareholders' Equity | 71,112,274 | 90,967,422 | |||||
Total Liabilities and Shareholders' Equity | $ | 812,681,569 | $ | 799,727,630 | |||
SEE ACCOMPANYING NOTES TO CONSOLIDATED FINANCIAL STATEMENTS.
32
SECURITY FEDERAL CORPORATION AND SUBSIDIARIES
Consolidated Statements of Income | Years Ended December 31, | ||||||||||
2016 | 2015 | 2014 | |||||||||
Interest Income: | |||||||||||
Loans | $ | 19,223,161 | $ | 18,428,185 | $ | 19,416,904 | |||||
Mortgage-Backed Securities | 4,891,346 | 5,273,457 | 6,036,955 | ||||||||
Investment Securities | 4,250,855 | 4,196,609 | 4,017,705 | ||||||||
Other | 22,261 | 7,501 | 10,600 | ||||||||
Total Interest Income | 28,387,623 | 27,905,752 | 29,482,164 | ||||||||
Interest Expense: | |||||||||||
NOW and Money Market Accounts | 423,175 | 429,539 | 568,397 | ||||||||
Statement Savings Accounts | 34,488 | 30,315 | 26,600 | ||||||||
Certificate Accounts | 1,654,190 | 1,811,651 | 1,990,003 | ||||||||
FHLB Advances and Other Borrowings | 715,188 | 1,336,620 | 2,640,197 | ||||||||
Note Payable | 77,156 | — | — | ||||||||
Senior Convertible Debentures | 486,720 | 486,720 | 486,720 | ||||||||
Junior Subordinated Debentures | 124,875 | 104,334 | 101,139 | ||||||||
Total Interest Expense | 3,515,792 | 4,199,179 | 5,813,056 | ||||||||
Net Interest Income | 24,871,831 | 23,706,573 | 23,669,108 | ||||||||
Provision for Loan Losses | 500,000 | — | 450,000 | ||||||||
Net Interest Income After Provision For Loan Losses | 24,371,831 | 23,706,573 | 23,219,108 | ||||||||
Non-Interest Income: | |||||||||||
Gain on Sale of Investment Securities | 703,748 | 1,886,081 | 436,871 | ||||||||
Gain on Sale of Loans | 956,333 | 689,843 | 620,994 | ||||||||
Service Fees on Deposit Accounts | 1,040,263 | 1,076,102 | 1,176,849 | ||||||||
Commissions From Insurance Agency | 555,608 | 472,145 | 424,969 | ||||||||
Trust Income | 688,000 | 608,800 | 542,000 | ||||||||
BOLI Income | 528,000 | 423,000 | 554,364 | ||||||||
Check Card Fee Income | 994,806 | 969,710 | 901,998 | ||||||||
Grant Income | 265,496 | 229,848 | 851,999 | ||||||||
Other | 668,669 | 651,720 | 652,739 | ||||||||
Total Non-Interest Income | 6,400,923 | 7,007,249 | 6,162,783 | ||||||||
Non-Interest Expense: | |||||||||||
Compensation and Employee Benefits | 13,034,013 | 12,180,420 | 11,308,610 | ||||||||
Occupancy | 1,959,375 | 1,903,288 | 1,995,283 | ||||||||
Advertising | 532,660 | 416,322 | 484,056 | ||||||||
Depreciation and Maintenance of Equipment | 1,961,696 | 1,706,397 | 1,665,454 | ||||||||
FDIC Insurance Premiums | 442,050 | 611,157 | 691,937 | ||||||||
Amortization of Intangibles | — | — | 11,970 | ||||||||
Net Cost (Recovery) of Operation of OREO | (608,702 | ) | 524,345 | 541,840 | |||||||
Prepayment Penalties on FHLB Advances | 789,306 | 787,851 | 178,067 | ||||||||
Other | 4,817,220 | 4,401,016 | 4,390,766 | ||||||||
Total Non-Interest Expense | 22,927,618 | 22,530,796 | 21,267,983 | ||||||||
Income Before Income Taxes | 7,845,136 | 8,183,026 | 8,113,908 | ||||||||
Provision For Income Taxes | 1,920,480 | 2,067,099 | 2,303,168 | ||||||||
Net Income | 5,924,656 | 6,115,927 | 5,810,740 | ||||||||
Preferred Stock Dividends | (422,889 | ) | (440,000 | ) | (440,000 | ) | |||||
Gain on Redemption of Preferred Stock | 660,000 | — | — | ||||||||
Net Income Available To Common Shareholders | $ | 6,161,767 | $ | 5,675,927 | $ | 5,370,740 | |||||
Net Income Per Common Share (Basic) | $ | 2.09 | $ | 1.93 | $ | 1.82 | |||||
Net Income Per Common Share (Diluted) | $ | 1.99 | $ | 1.84 | $ | 1.75 | |||||
Cash Dividend Per Share On Common Stock | $ | 0.32 | $ | 0.32 | $ | 0.32 | |||||
Weighted Average Shares Outstanding (Basic) | 2,944,001 | 2,944,001 | 2,944,001 | ||||||||
Weighted Average Shares Outstanding (Diluted) | 3,248,572 | 3,248,312 | 3,248,201 | ||||||||
SEE ACCOMPANYING NOTES TO CONSOLIDATED FINANCIAL STATEMENTS.
33
SECURITY FEDERAL CORPORATION AND SUBSIDIARIES
Consolidated Statements of Comprehensive Income
Years Ended December 31, | ||||||||||||
2016 | 2015 | 2014 | ||||||||||
Net Income | $ | 5,924,656 | $ | 6,115,927 | $ | 5,810,740 | ||||||
Other Comprehensive Income (Loss) | ||||||||||||
Unrealized Gains (Losses) on Securities: | ||||||||||||
Unrealized Holding Gains (Losses) on Securities Available For Sale, Net of Taxes of $(1,546,140); $15,023 and $3,224,059 at December 31, 2016, 2015 and 2014, Respectively | (2,521,619 | ) | 22,905 | 5,274,829 | ||||||||
Reclassification Adjustment for Gains Included in Net Income, Net of Taxes of $267,425; $716,710 and $166,011 at December 31, 2016, 2015 and 2014, Respectively | (436,323 | ) | (1,169,371 | ) | (270,860 | ) | ||||||
Amortization of Unrealized Gains on Available For Sale Securities Transferred to Held To Maturity, Net of Taxes of $(76,075) and $(41,330) at December 31, 2016 and 2015, Respectively | (124,333 | ) | (67,548 | ) | — | |||||||
Other Comprehensive Income (Loss) | (3,082,275 | ) | (1,214,014 | ) | 5,003,969 | |||||||
Comprehensive Income | $ | 2,842,381 | $ | 4,901,913 | $ | 10,814,709 | ||||||
SEE ACCOMPANYING NOTES TO CONSOLIDATED FINANCIAL STATEMENTS.
Consolidated Statements of Changes in Shareholders' Equity
For the Years Ended December 31, 2016, 2015 and 2014
Preferred Stock | Common Stock | Unvested Restricted Stock | Additional Paid – In Capital | Treasury Stock | Accumulated Other Comprehensive Income | Retained Earnings | Total | ||||||||||||||||||||||||
Balance at December 31, 2015 | $ | 22,000,000 | $ | 31,464 | $ | (25,358 | ) | $ | 12,028,832 | $ | (4,330,712 | ) | $ | 4,262,361 | $ | 57,000,835 | $ | 90,967,422 | |||||||||||||
Net Income | — | — | — | — | — | — | 5,924,656 | 5,924,656 | |||||||||||||||||||||||
Other Comprehensive Loss, Net of Tax | — | — | — | — | — | (3,082,275 | ) | — | (3,082,275 | ) | |||||||||||||||||||||
Preferred Stock Redemption | (22,000,000 | ) | — | — | — | — | — | 660,000 | (21,340,000 | ) | |||||||||||||||||||||
Stock Option Compensation Expense | — | — | — | 7,912 | — | — | — | 7,912 | |||||||||||||||||||||||
Cash Dividends on Preferred Stock | — | — | — | — | — | — | (422,889 | ) | (422,889 | ) | |||||||||||||||||||||
Cash Dividends on Common Stock | — | — | — | — | — | — | (942,552 | ) | (942,552 | ) | |||||||||||||||||||||
Balance at December 31, 2016 | $ | — | $ | 31,464 | $ | (25,358 | ) | $ | 12,036,744 | $ | (4,330,712 | ) | $ | 1,180,086 | $ | 62,220,050 | $ | 71,112,274 | |||||||||||||
Preferred Stock | Common Stock | Unvested Restricted Stock | Additional Paid – In Capital | Treasury Stock | Accumulated Other Comprehensive Income | Retained Earnings | Total | ||||||||||||||||||||||||
Balance at December 31, 2014 | $ | 22,000,000 | $ | 31,449 | $ | — | $ | 11,990,813 | $ | (4,330,712 | ) | $ | 5,476,375 | $ | 52,267,460 | $ | 87,435,385 | ||||||||||||||
Net Income | — | — | — | — | — | — | 6,115,927 | 6,115,927 | |||||||||||||||||||||||
Other Comprehensive Loss, Net of Tax: | — | — | — | — | — | (1,214,014 | ) | — | (1,214,014 | ) | |||||||||||||||||||||
Common Stock Issuance | — | 15 | (25,358 | ) | 25,343 | — | — | — | — | ||||||||||||||||||||||
Stock Option Compensation Expense | — | — | — | 12,676 | — | — | — | 12,676 | |||||||||||||||||||||||
Cash Dividends on Preferred Stock | — | — | — | — | — | — | (440,000 | ) | (440,000 | ) | |||||||||||||||||||||
Cash Dividends on Common Stock | — | — | — | — | — | — | (942,552 | ) | (942,552 | ) | |||||||||||||||||||||
Balance at December 31, 2015 | $ | 22,000,000 | $ | 31,464 | $ | (25,358 | ) | $ | 12,028,832 | $ | (4,330,712 | ) | $ | 4,262,361 | $ | 57,000,835 | $ | 90,967,422 | |||||||||||||
34
SECURITY FEDERAL CORPORATION AND SUBSIDIARIES
Consolidated Statements of Changes in Shareholders' Equity
For the Years Ended December 31, 2016, 2015 and 2014, Continued
Preferred Stock | Common Stock | Additional Paid – In Capital | Treasury Stock | Accumulated Other Comprehensive Income | Retained Earnings | Total | ||||||||||||||||||||||
Balance at December 31, 2013 | $ | 22,000,000 | $ | 31,449 | $ | 11,978,137 | $ | (4,330,712 | ) | $ | 472,406 | $ | 47,838,800 | $ | 77,990,080 | |||||||||||||
Net Income | — | — | — | — | — | 5,810,740 | 5,810,740 | |||||||||||||||||||||
Other Comprehensive Income, Net of Tax: | — | — | — | — | 5,003,969 | — | 5,003,969 | |||||||||||||||||||||
Stock Option Compensation Expense | — | — | 12,676 | — | — | — | 12,676 | |||||||||||||||||||||
Cash Dividends on Preferred Stock | — | — | — | — | — | (440,000 | ) | (440,000 | ) | |||||||||||||||||||
Cash Dividends on Common Stock | — | — | — | — | — | (942,080 | ) | (942,080 | ) | |||||||||||||||||||
Balance at December 31, 2014 | $ | 22,000,000 | $ | 31,449 | $ | 11,990,813 | $ | (4,330,712 | ) | $ | 5,476,375 | $ | 52,267,460 | $ | 87,435,385 | |||||||||||||
SEE ACCOMPANYING NOTES TO CONSOLIDATED FINANCIAL STATEMENTS.
35
SECURITY FEDERAL CORPORATION AND SUBSIDIARIES
Consolidated Statements of Cash Flows
For the Years Ended December 31, | |||||||||||
2016 | 2015 | 2014 | |||||||||
CASH FLOWS FROM OPERATING ACTIVITIES: | |||||||||||
Net Income | $ | 5,924,656 | $ | 6,115,927 | $ | 5,810,740 | |||||
Adjustments To Reconcile Net Income To Net Cash Provided By Operating Activities: | |||||||||||
Depreciation Expense | 1,383,393 | 1,242,378 | 1,214,912 | ||||||||
Amortization of Intangible Assets | — | — | 11,970 | ||||||||
Stock Option Compensation Expense | 7,912 | 12,676 | 12,676 | ||||||||
Discount Accretion and Premium Amortization | 5,460,999 | 4,852,140 | 5,180,338 | ||||||||
Provisions for Loan Losses | 500,000 | — | 450,000 | ||||||||
Income From BOLI | (528,000 | ) | (423,000 | ) | (300,000 | ) | |||||
Gain on Sales of Loans | (956,333 | ) | (689,843 | ) | (620,994 | ) | |||||
Gain on Sales of Mortgage-Backed Securities ("MBS") | (29,080 | ) | (510,702 | ) | (503,288 | ) | |||||
(Gain) Loss on Sales of Investment Securities | (674,668 | ) | (1,375,379 | ) | 66,417 | ||||||
Gain on Sale of OREO | (841,221 | ) | (227,053 | ) | (303,440 | ) | |||||
Write Down on OREO | 40,000 | 312,347 | 505,000 | ||||||||
Gain on Disposal of Premises and Equipment | — | (5,647 | ) | — | |||||||
Amortization of Deferred Costs on Loans | 113,056 | 64,257 | 6,154 | ||||||||
Proceeds From Sale of Loans Held For Sale | 34,609,725 | 24,272,860 | 23,607,017 | ||||||||
Origination of Loans Held For Sale | (35,434,740 | ) | (24,180,577 | ) | (23,616,864 | ) | |||||
(Increase) Decrease in Accrued Interest Receivable: | |||||||||||
Loans | (151,476 | ) | 84,601 | 60,178 | |||||||
MBS | 9,451 | 67,660 | 49,515 | ||||||||
Investment Securities | 115,277 | (114,276 | ) | (15,768 | ) | ||||||
Increase (Decrease) in Advance Payments By Borrowers | 3,850 | (9,622 | ) | 10,988 | |||||||
Other, Net | 1,808,774 | (502,072 | ) | 575,230 | |||||||
Net Cash Provided By Operating Activities | 11,361,575 | 8,986,675 | 12,200,781 | ||||||||
CASH FLOWS FROM INVESTING ACTIVITIES: | |||||||||||
Purchase of MBS Available For Sale ("AFS") | (44,877,661 | ) | (35,881,719 | ) | (54,673,351 | ) | |||||
Proceeds from Payments and Maturities of MBS AFS | 34,544,961 | 28,187,696 | 32,752,039 | ||||||||
Proceeds from Sale of MBS AFS | 4,479,563 | 27,329,862 | 31,762,151 | ||||||||
Purchase of MBS Held To Maturity ("HTM") | (1,507,125 | ) | — | — | |||||||
Proceeds from Payments and Maturities of MBS HTM | 5,212,545 | 2,663,303 | — | ||||||||
Purchase of Investment Securities AFS | (52,310,805 | ) | (78,573,124 | ) | (64,593,473 | ) | |||||
Proceeds from Payments and Maturities of Investment Securities AFS | 23,277,500 | 30,858,855 | 21,531,825 | ||||||||
Proceeds from Sale of Investment Securities AFS | 39,395,848 | 44,312,795 | 37,842,271 | ||||||||
Investment in Certificates of Deposits with Other Banks | 1,000,000 | (1,350,005 | ) | — | |||||||
Purchase of FHLB Stock | (6,469,000 | ) | (5,044,000 | ) | (5,905,180 | ) | |||||
Redemption of FHLB Stock | 5,907,300 | 5,973,800 | 7,777,180 | ||||||||
(Purchase of) Proceeds from BOLI | — | (5,000,000 | ) | 624,260 | |||||||
(Increase) Decrease in Loans Receivable | (29,008,003 | ) | 5,472,435 | 17,578,222 | |||||||
Proceeds from Sale of OREO | 3,467,596 | 3,145,640 | 2,154,091 | ||||||||
Purchase and Improvement of Premises and Equipment | (2,464,159 | ) | (3,164,108 | ) | (2,204,748 | ) | |||||
Proceeds from Sale and Disposal of Premises and Equipment | — | 43,686 | — | ||||||||
Net Cash Provided (Used) By Investing Activities | (19,351,440 | ) | 18,975,116 | 24,645,287 | |||||||
36
SECURITY FEDERAL CORPORATION AND SUBSIDIARIES
For the Years Ended December 31, | |||||||||||
2016 | 2015 | 2014 | |||||||||
CASH FLOWS FROM FINANCING ACTIVITIES: | |||||||||||
Increase (Decrease) in Deposit Accounts | 2,006,733 | (8,018,619 | ) | 1,418,392 | |||||||
Proceeds from FHLB Advances | 331,501,000 | 284,804,000 | 253,630,000 | ||||||||
Repayment of FHLB Advances | (317,746,000 | ) | (303,064,000 | ) | (288,470,058 | ) | |||||
Proceeds From Note Payable, Net | 13,000,000 | — | — | ||||||||
Proceeds From (Repayments of) Other Borrowings, Net | 2,926,171 | (2,111,371 | ) | 520,609 | |||||||
Redemption of Preferred Stock | (21,340,000 | ) | — | — | |||||||
Dividends to Preferred Stock Shareholders | (422,889 | ) | (440,000 | ) | (440,000 | ) | |||||
Dividends to Common Stock Shareholders | (942,552 | ) | (942,552 | ) | (942,080 | ) | |||||
Net Cash Provided (Used) By Financing Activities | 8,982,463 | (29,772,542 | ) | (34,283,137 | ) | ||||||
Net Increase (Decrease) in Cash and Cash Equivalents | 992,598 | (1,810,751 | ) | 2,562,931 | |||||||
Cash and Cash Equivalents at Beginning of Year | 8,381,951 | 10,192,702 | 7,629,771 | ||||||||
Cash and Cash Equivalents at End of Year | $ | 9,374,549 | $ | 8,381,951 | $ | 10,192,702 | |||||
SUPPLEMENTAL DISCLOSURE OF CASH FLOW INFORMATION: | |||||||||||
Cash Paid During the Period For: | |||||||||||
Interest | $ | 3,600,927 | $ | 4,384,109 | $ | 5,969,581 | |||||
Income Taxes | $ | 899,242 | $ | 2,258,388 | $ | 1,464,350 | |||||
Supplemental Schedule of Non Cash Transactions: | |||||||||||
Transfers from Loans Receivable to OREO | $ | 1,026,178 | $ | 4,362,635 | $ | 1,638,135 | |||||
Transfers from MBS AFS to HTM | $ | — | $ | 32,811,452 | $ | — | |||||
Increase (Decrease) in Unrealized Gains on Securities AFS, Net of Taxes | $ | (3,082,275 | ) | $ | (1,214,014 | ) | $ | 5,003,969 | |||
SEE ACCOMPANYING NOTES TO CONSOLIDATED FINANCIAL STATEMENTS.
37
SECURITY FEDERAL CORPORATION AND SUBSIDIARIES
Notes to Consolidated Financial Statements
(1) | Significant Accounting Policies |
The following is a description of the more significant accounting and reporting policies used in the preparation and presentation of the accompanying consolidated financial statements. All significant intercompany transactions have been eliminated in consolidation.
(a) | Basis of Consolidation and Nature of Operations |
The accompanying consolidated financial statements include the accounts of Security Federal Corporation (the “Company”) and its wholly owned subsidiary, Security Federal Bank (the “Bank”) and the Bank’s wholly owned subsidiaries, Security Federal Insurance, Inc. (“SFINS”) and Security Financial Services Corporation (“SFSC”). Security Federal Corporation has a wholly owned subsidiary, Security Federal Statutory Trust (the “Trust”), which issued and sold fixed and floating rate capital securities of the Trust. However, under current accounting guidance, the Trust is not consolidated in the financial statements. The Bank is primarily engaged in the business of accepting savings and demand deposits and originating mortgage loans and other loans to individuals and small businesses for various personal and commercial purposes. SFINS was formed during fiscal 2002 and began operating during the December 2001 quarter. SFINS is an insurance agency offering auto, business, and home insurance. SFINS has a wholly owned subsidiary, Collier Jennings Financial Corporation which has as subsidiaries Security Federal Auto Insurance, The Auto Insurance Store Inc., and Security Federal Premium Pay Plans Inc. Security Federal Premium Pay Plans Inc. has one wholly owned premium finance subsidiary and also has an ownership interest in four other premium finance subsidiaries. SFSC was formed in 1975 and is currently inactive.
(b) | Cash and Cash Equivalents |
For purposes of reporting cash flows, cash and cash equivalents include cash and due from banks, interest-bearing balances in other banks, and federal funds sold. Cash equivalents have original maturities of three months or less.
(c) | Investment and Mortgage-Backed Securities |
Investment securities, including mortgage-backed securities, are classified in one of three categories: held to maturity, available for sale, or trading. Management determines the appropriate classification of debt securities at the time of purchase. Investment securities are classified as held to maturity when the Company has the positive intent and ability to hold the securities to maturity. These securities are recorded at cost and adjusted for amortization of premiums and accretion of discounts over the estimated life of the security using a method that approximates a level yield. Prepayment assumptions on mortgage-backed securities are anticipated.
Management classifies investment securities that are not considered to be held to maturity as available for sale. This type of investment is stated at fair value with unrealized gains and losses, net of tax, reported in a separate component of shareholders' equity (“accumulated other comprehensive income”). Gains and losses from sales of investment and mortgage-backed securities available for sale are determined using the specific identification method. The Company had no investment in trading securities.
(d) | Loans Receivable Held for Investment |
Loans receivable that management has the intent and ability to hold for the foreseeable future or until maturity or pay-off are reported at their outstanding principal balance adjusted for any charge-offs, the allowance for loan losses, and any deferred fees or costs on originated loans. Interest is recognized over the term of the loan based on the outstanding loan balance. Fees charged for originating loans, if any, are deferred and offset by the deferral of certain direct expenses associated with loans originated. The net deferred fees are recognized as yield adjustments by applying the interest method.
38
SECURITY FEDERAL CORPORATION AND SUBSIDIARIES
Notes to Consolidated Financial Statements
(1) | Significant Accounting Policies, Continued |
(e) | Allowance for Loan Losses |
The Company provides for loan losses using the allowance method. Accordingly, all loan losses are charged to the related allowance and all recoveries are credited to the allowance for loan losses.
Additions to the allowance for loan losses are provided by charges to operations based on various factors, which, in management’s judgment, deserve current recognition in estimating possible losses. Such factors considered by management include the fair value of the underlying collateral, stated guarantees by the borrower (if applicable), the borrower’s ability to repay from other economic resources, growth and composition of the loan portfolio, the relationship of the allowance for loan losses to the outstanding loans, loss experience, delinquency trends, and general economic conditions. Management evaluates the carrying value of the loans periodically and the allowance is adjusted accordingly. While management uses the best information available to make evaluations, future adjustments may be necessary if economic conditions differ substantially from the assumptions used in making these evaluations. The allowance for loan losses is subject to periodic evaluations by bank regulatory agencies that may require adjustments to be made to the allowance based upon the information that is available at the time of their examination.
The Company values impaired loans at the loan’s fair value if it is probable that the Company will be unable to collect all amounts due according to the terms of the loan agreement at the present value of expected cash flows, the market price of the loan, if available, or the value of the underlying collateral less estimated selling costs. In accordance with our policy, non-accrual commercial loans with a balance less than $200,000 and non-accrual consumer loans with a balance less than $100,000 are deemed immaterial and therefore excluded from the individual impairment review. Expected cash flows are required to be discounted at the loan’s effective interest rate. When the ultimate collectibility of an impaired loan’s principal is in doubt, wholly or partially, all cash receipts are applied to principal. When this doubt does not exist, cash receipts are applied under the contractual terms of the loan agreement first to interest and then to principal. Once the recorded principal balance has been reduced to zero, future cash receipts are applied to interest income to the extent that any interest has been foregone. Further cash receipts are recorded as recoveries of any amounts previously charged off.
(f) | Loans Receivable Held for Sale |
Loans originated and intended for sale in the secondary market are carried at the lower of cost or estimated fair value in the aggregate. Net unrealized losses are provided for in a valuation allowance by charges to operations.
(g) | Other Real Estate Owned |
Other real estate owned represents real estate and other assets acquired through foreclosure or repossession and are initially recorded at the estimated fair value less costs to sell. Subsequent improvements are capitalized. Costs of holding real estate, such as property taxes, insurance, general maintenance and interest expense, are expensed as a period cost. Fair values are reviewed regularly and allowances for possible losses are established when the carrying value of the asset owned exceeds the fair value less estimated costs to sell. Fair values are generally determined by reference to an outside appraisal.
(h) | Premises and Equipment |
Premises and equipment are carried at cost, net of accumulated depreciation. Depreciation of premises and equipment is amortized on a straight-line method over the estimated useful life of the related asset. Estimated lives are 7 to 40 years for buildings and improvements and generally 3 to 10 years for furniture, fixtures and equipment. Maintenance and repairs are charged to current expense. The cost of major renewals and improvements are capitalized.
(i) | Intangible Assets and Goodwill |
The Company's goodwill is a result of the excess of the cost over the fair value of net assets resulting from the Company's acquisition of Collier Jennings Financial Corporation in July 2006. Goodwill is reviewed for impairment annually or whenever events or changes in circumstances indicate the carrying amount of an asset may not be recoverable. Intangible assets are amortized over their estimated economic lives using methods that reflect the pattern in which the economic benefits are utilized. The intangible assets, which consisted of the customer list and employment contracts resulting from the Company’s acquisition of Collier Jennings Financial Corporation, were fully amortized at December 31, 2016.
39
SECURITY FEDERAL CORPORATION AND SUBSIDIARIES
Notes to Consolidated Financial Statements
(1) | Significant Accounting Policies, Continued |
(j) | Income Taxes |
Income tax expense or benefit is recognized for the net change during the year in the deferred tax liability or asset. That amount together with income taxes currently payable is the total amount of income tax expense or benefit for the year. Deferred taxes are provided for by the differences in financial reporting bases for assets and liabilities compared with their tax bases. Generally, a current tax liability or asset is established for taxes presently payable or refundable and a deferred tax liability or asset is established for future tax items. A valuation allowance, if applicable, is established for deferred tax assets that may not be realized. Tax bad debt reserves in excess of the base year amount (established as taxable years ending March 31, 1988 or later) would create a deferred tax liability. Deferred income taxes are provided for in differences between the provision for loan losses for financial statement purposes and those allowed for income tax purposes.
The Company adopted accounting guidance which prescribes a threshold and measurement attribute for the financial statement recognition and measurement of a tax position taken or expected to be taken in a tax return and also provides guidance on derecognition, classification, interest and penalties, accounting in interim periods and disclosures.
There have been no gross amounts of unrecognized tax benefits or interest or penalties related to uncertain tax positions since adoption. There are no unrecognized tax benefits that would, if recognized, affect the effective tax rate. There are no positions for which it is reasonably possible that the total amounts of unrecognized tax benefits will significantly increase or decrease within the next 12 months. Years prior to December 31, 2013 are closed for federal, state and local income tax matters.
(k) | Loan Fees and Costs Associated with Originating Loans |
Loan fees received, net of direct incremental costs of originating loans, are deferred and amortized over the contractual life of the related loan. The net fees are recognized as yield adjustments by applying the interest method. Prepayments are not anticipated.
(l) | Interest Income |
Interest on loans is accrued and credited to income monthly based on the principal balance outstanding and the contractual rate on the loan. The Company places loans on non-accrual status when they become greater than 90 days delinquent or when, in the opinion of management, full collection of principal or interest is unlikely. When interest accrual is discontinued, all unpaid accrued interest is reversed. Interest income is subsequently recognized only to the extent cash payments are received first to principal and then to interest income. The loans are returned to an accrual status when full collection of principal and interest appears likely.
(m) | Advertising Expense |
Advertising and public relations costs are generally expensed as incurred. External costs relating to direct mailing costs are expensed in the period in which the direct mailings are sent. Advertising and public relations costs of $533,000, $416,000, and $484,000 were included in the Company’s results of operations for the years ended December 31, 2016, 2015 and 2014, respectively.
(n) | Stock-Based Compensation |
The Company accounts for compensation costs under its stock option plans using the fair value method. This method requires the measurement of the cost of employee services received in exchange for an award of equity instruments based upon the fair value of the award on the grant date. The cost of the award is recognized in the income statement over the vesting period of the award.
(o) | Net Income Per Common Share |
Accounting guidance specifies computation and presentation requirements for both basic net income per common share ("EPS") and, for entities with complex capital structures, diluted EPS. Basic EPS is computed by dividing net income available to common shareholders by the weighted average number of common shares outstanding. Diluted EPS is similar to the computation of basic EPS except that the denominator is increased to include the number of additional common shares that would have been outstanding if the dilutive potential common shares had been issued. The dilutive effect of options and warrants outstanding is reflected in diluted earnings per share by application of the treasury stock method.
40
SECURITY FEDERAL CORPORATION AND SUBSIDIARIES
Notes to Consolidated Financial Statements
(1) | Significant Accounting Policies, Continued |
(o) | Net Income Per Common Share, Continued |
Net income available to common shareholders represents consolidated net income adjusted for preferred dividends declared, accretion of discounts and amortization of premiums on preferred stock issuances and cumulative dividends related to the current dividend period that have not been declared as of period end.
The following table provides a reconciliation of net income to net income available to common shareholders.
Years Ended December 31, | |||||||||||
2016 | 2015 | 2014 | |||||||||
Net Income | $ | 5,924,656 | $ | 6,115,927 | $ | 5,810,740 | |||||
Preferred Stock Dividends | (422,889 | ) | (440,000 | ) | (440,000 | ) | |||||
Gain on Redemption of Preferred Stock | 660,000 | — | — | ||||||||
Net Income Available to Common Shareholders | $ | 6,161,767 | $ | 5,675,927 | $ | 5,370,740 | |||||
The following tables show the effect of dilutive options on the Company’s net income per common share.
Year Ended December 31, 2016 | |||||||||
Income | Shares | Per Share | |||||||
Basic EPS | $ | 6,161,767 | 2,944,001 | $ | 2.09 | ||||
Effect of Dilutive Securities: | |||||||||
Senior Convertible Debentures | 301,766 | 304,200 | (0.10 | ) | |||||
Unvested Restricted Stock | — | 371 | — | ||||||
Diluted EPS | $ | 6,463,533 | 3,248,572 | $ | 1.99 | ||||
Year Ended December 31, 2015 | |||||||||
Income | Shares | Per Share | |||||||
Basic EPS | $ | 5,675,927 | 2,944,001 | $ | 1.93 | ||||
Effect of Dilutive Securities: | |||||||||
Senior Convertible Debentures | 301,766 | 304,200 | (0.09 | ) | |||||
Unvested Restricted Stock | — | 111 | — | ||||||
Diluted EPS | $ | 5,977,693 | 3,248,312 | $ | 1.84 | ||||
Year Ended December 31, 2014 | |||||||||
Income | Shares | Per Share | |||||||
Basic EPS | $ | 5,370,740 | 2,944,001 | $ | 1.82 | ||||
Effect of Dilutive Securities: | |||||||||
Senior Convertible Debentures | 301,766 | 304,200 | (0.07 | ) | |||||
Diluted EPS | $ | 5,672,506 | 3,248,201 | $ | 1.75 | ||||
The average market price used in calculating the assumed number of dilutive shares issued for the years ended December 31, 2016, 2015 and 2014 was $23.02, $18.61, and $14.56 respectively. As a result of the average stock price being less than the exercise price of all options in the years ended December 31, 2015 and 2014, the options were not dilutive in calculating diluted earnings per share for those periods. Although the average stock price for the year ended December 31, 2016 exceeded the exercise price of some options outstanding, after factoring in the unrecognized compensation cost of the stock options, they were no longer considered dilutive.
41
SECURITY FEDERAL CORPORATION AND SUBSIDIARIES
Notes to Consolidated Financial Statements
(1) | Significant Accounting Policies, Continued |
(p) | Use of Estimates |
The preparation of financial statements in conformity with U.S. generally accepted accounting principles (“GAAP”) requires management to make estimates and assumptions that affect the reported amounts of assets and liabilities and the disclosure of contingent assets and liabilities at the dates of the financial statements and the reported amounts of income and expenses during the reporting periods. Actual results could differ from those estimates.
(q) | Recently Issued Accounting Standards |
The following is a summary of recent authoritative pronouncements that could affect accounting, reporting, and disclosure of financial information by the Company:
In May 2014 and August 2015, the FASB issued guidance to change the recognition of revenue from contracts with customers. The core principle of the new guidance is that an entity should recognize revenue to reflect the transfer of goods and services to customers in an amount equal to the consideration the entity receives or expects to receive. The guidance will be effective for the Company for reporting periods beginning after December 15, 2017. The Company will apply the guidance using a modified retrospective approach. The Company does not expect these amendments to have a material effect on its consolidated financial statements.
In February 2015, the FASB issued guidance which amends the consolidation requirements and significantly changes the consolidation analysis required under U.S. GAAP. Although the amendments are expected to result in the deconsolidation of many entities, the Company will need to reevaluate all its previous consolidation conclusions. The amendments were effective for the Company on January 1, 2016. These amendments did not have a material effect on the Company's consolidated financial statements.
In January 2016, the FASB amended the Financial Instruments topic of the ASC to address certain aspects of recognition, measurement, presentation, and disclosure of financial instruments. The amendments will be effective for reporting periods beginning after December 15, 2017. The Company will apply the guidance by means of a cumulative-effect adjustment to the balance sheet as of the beginning of the fiscal year of adoption. The amendments related to equity securities without readily determinable fair values will be applied prospectively to equity investments that exist as of the date of adoption of the amendments. The Company does not expect these amendments to have a material effect on its consolidated financial statements.
In February 2016, the FASB amended the Leases topic of the ASC to revise certain aspects of recognition, measurement, presentation, and disclosure of leasing transactions. The amendments will be effective for reporting periods beginning after December 15, 2018. The Company is currently evaluating the effect that implementation of the new standard will have on its financial position, results of operations, and cash flows.
In March 2016, the FASB amended the Revenue from Contracts with Customers topic of the ASC to clarify the implementation guidance on principal versus agent considerations and address how an entity should assess whether it is the principal or the agent in contracts that include three or more parties. The amendments will be effective for the Company for reporting periods beginning after December 15, 2017. The Company does not expect these amendments to have a material effect on its consolidated financial statements.
In March 2016, the FASB issued guidance to simplify several aspects of the accounting for share-based payment award transactions including the income tax consequences, the classification of awards as either equity or liabilities, and the classification on the statement of cash flows. Additionally, the guidance simplifies two areas specific to entities other than public business entities allowing them apply a practical expedient to estimate the expected term for all awards with performance or service conditions that have certain characteristics and also allowing them to make a one-time election to switch from measuring all liability-classified awards at fair value to measuring them at intrinsic value. The amendments will be effective for the Company for annual periods beginning after December 15, 2016 and interim periods within those annual periods. The Company does not expect these amendments to have a material effect on its consolidated financial statements.
In April 2016, the FASB amended the Revenue from Contracts with Customers topic of the ASC to clarify guidance related to identifying performance obligations and accounting for licenses of intellectual property. The amendments will be effective for the Company for reporting periods beginning after December 15, 2017. The Company does not expect these amendments to have a material effect on its consolidated financial statements.
42
SECURITY FEDERAL CORPORATION AND SUBSIDIARIES
Notes to Consolidated Financial Statements
(1) | Significant Accounting Policies, Continued |
In May 2016, the FASB amended the Revenue from Contracts with Customers topic of the ASC to clarify guidance related to collectability, noncash consideration, presentation of sales tax, and transition. The amendments will be effective for the Company for reporting periods beginning after December 15, 2017. The Company does not expect these amendments to have a material effect on its consolidated financial statements.
In June 2016, the FASB issued guidance to change the accounting for credit losses and modify the impairment model for certain debt securities. The amendments will be effective for the Company for reporting periods beginning after December 15, 2019. The Company is currently evaluating the effect that implementation of the new standard will have on its consolidated financial position, results of operations, and cash flows.
In August 2016, the FASB amended the Statement of Cash Flows topic of the ASC to clarify how certain cash receipts and cash payments are presented and classified in the statement of cash flows. The amendments will be effective for the Company for reporting periods beginning after December 15, 2017. The Company does not expect these amendments to have a material effect on its consolidated financial statements.
In November 2016, the FASB amended the Statement of Cash Flows topic of the ASC to clarify how restricted cash is presented and classified in the statement of cash flows. The amendments will be effective for the Company for reporting periods beginning after December 15, 2017. Early adoption is permitted. The Company does not expect these amendments to have a material effect on its consolidated financial statements.
In December 2016, the FASB issued technical corrections and improvements to the Revenue from Contracts with Customers Topic. These corrections make a limited number of revisions to several pieces of the revenue recognition standard issued in 2014. The effective date and transition requirements for the technical corrections will be effective for the Company for reporting periods beginning after December 15, 2017. The Company will apply the guidance using a modified retrospective approach. The Company does not expect these amendments to have a material effect on its consolidated financial statements.
Other accounting standards that have been issued or proposed by the FASB or other standards-setting authorities are not expected to have a material impact on the Company’s consolidated financial position, results of operations or cash flows.
(r) | Risks and Uncertainties |
In the normal course of its business, the Company encounters two significant types of risk: economic and regulatory. There are three main components of economic risk: interest rate risk, credit risk, and market risk. The Company is subject to interest rate risk to the degree that its interest-bearing liabilities mature or reprice at different speeds, or on different bases, than its interest-earning assets. Credit risk is the risk of default on the Company’s loan portfolio that results from borrowers’ inability or unwillingness to make contractually required payments. Market risk reflects changes in the value of collateral underlying loans receivable, the valuation of real estate held by the Company, and the valuation of loans held for sale and mortgage-backed securities available for sale. The Company is subject to the regulations of various government agencies. These regulations can and do change significantly from period to period. The Company also undergoes periodic examinations by the bank regulatory agencies, which may subject it to further changes with respect to asset valuations, amounts of required loss allowances, and operating restrictions, resulting from the regulators’ judgments based on information available to them at the time of their examination.
(s) | Reclassifications |
Certain amounts in prior years’ consolidated financial statements have been reclassified to conform to current period classifications.
43
SECURITY FEDERAL CORPORATION AND SUBSIDIARIES
Notes to Consolidated Financial Statements
(2) Investment and Mortgage-Backed Securities, Available For Sale
The amortized cost, gross unrealized gains, gross unrealized losses, and fair values of investment and mortgage-backed securities available for sale at the dates indicated are as follows:
December 31, 2016 | |||||||||||||||
Amortized Cost | Gross Unrealized Gains | Gross Unrealized Losses | Fair value | ||||||||||||
FHLB Securities | $ | 998,001 | $ | — | $ | 1 | $ | 998,000 | |||||||
Small Business Administration (“SBA”) Bonds | 101,280,921 | 909,361 | 284,223 | 101,906,059 | |||||||||||
Tax Exempt Municipal Bonds | 72,248,915 | 1,185,753 | 1,899,519 | 71,535,149 | |||||||||||
Taxable Municipal Bonds | 2,021,192 | — | 30,062 | 1,991,130 | |||||||||||
Mortgage-Backed Securities | 183,657,697 | 2,575,616 | 972,222 | 185,261,091 | |||||||||||
Equity Securities | 250,438 | 117,562 | — | 368,000 | |||||||||||
$ | 360,457,164 | $ | 4,788,292 | $ | 3,186,027 | $ | 362,059,429 | ||||||||
December 31, 2015 | |||||||||||||||
Amortized Cost | Gross Unrealized Gains | Gross Unrealized Losses | Fair value | ||||||||||||
FHLB Securities | $ | 2,000,000 | $ | — | $ | 67,912 | $ | 1,932,088 | |||||||
Federal Farm Credit Bank ("FFCB") Securities | 2,000,000 | — | 12,064 | 1,987,936 | |||||||||||
Federal National Mortgage Association ("FNMA") Bonds | 997,564 | 6,767 | — | 1,004,331 | |||||||||||
SBA Bonds | 110,195,113 | 1,415,464 | 193,795 | 111,416,782 | |||||||||||
Tax Exempt Municipal Bonds | 73,499,636 | 2,770,115 | 204,132 | 76,065,619 | |||||||||||
Mortgage-Backed Securities | 180,197,347 | 3,281,116 | 681,251 | 182,797,212 | |||||||||||
Equity Securities | 250,438 | 59,464 | — | 309,902 | |||||||||||
$ | 369,140,098 | $ | 7,532,926 | $ | 1,159,154 | $ | 375,513,870 | ||||||||
The FHLB, FFCB, FNMA and the Federal Home Loan Mortgage Corporation (“FHLMC”) are government sponsored enterprises ("GSEs") and the securities and bonds issued by GSEs are not backed by the full faith and credit of the United States government. SBA bonds are backed by the full faith and credit of the United States government. Included in the tables above and below in mortgage-backed securities are Government National Mortgage Association ("GNMA") mortgage-backed securities, which are also backed by the full faith and credit of the United States government. At December 31, 2016, the Bank held an amortized cost and fair value of $107.9 million and $109.2 million, respectively, in GNMA mortgage-backed securities compared to an amortized cost and fair value of $116.8 million and $118.5 million, respectively, at December 31, 2015. Also included in mortgage-backed securities in the tables above and below are private label collateralized mortgage obligation ("CMO") securities, which are issued by non-governmental real estate mortgage investment conduits and are not backed by the full faith and credit of the United States government. At December 31, 2016 the Bank held an amortized cost and fair value of $20.0 million and $19.7 million, respectively, in private label CMO mortgage-backed securities, compared to both an amortized cost and fair value of $3.8 million at December 31, 2015.
44
SECURITY FEDERAL CORPORATION AND SUBSIDIARIES
Notes to Consolidated Financial Statements
(2) Investment and Mortgage-Backed Securities, Available For Sale, Continued
The amortized cost and fair value of investment and mortgage-backed securities available for sale at December 31, 2016 are shown below by contractual maturity. Expected maturities will differ from contractual maturities because borrowers have the right to prepay obligations with or without call or prepayment penalties. Since mortgage-backed securities are not due at a single maturity date, they are disclosed separately, rather than allocated over the the maturity groupings below.
Amortized Cost | Fair Value | ||||||
Due in less than one year | $ | 693,253 | $ | 697,840 | |||
Due in one year to five years | 16,133,816 | 16,320,055 | |||||
Due in five to ten years | 42,077,103 | 42,417,193 | |||||
Due in ten years or more | 117,895,295 | 117,363,250 | |||||
Mortgage-Backed Securities | 183,657,697 | 185,261,091 | |||||
$ | 360,457,164 | $ | 362,059,429 | ||||
The amortized cost and fair value of investment and mortgage-backed securities available for sale pledged as collateral for certain deposit accounts, FHLB advances and other borrowings were $75.3 million and $76.9 million, respectively, at December 31, 2016 and $81.0 million and $83.2 million, respectively, at December 31, 2015.
The Bank received $43.9 million, $71.6 million and $69.6 million in gross proceeds from sales of available for sale securities during the years ended December 31, 2016, 2015 and 2014, respectively. As a result, the Bank recognized gross gains of $1.0 million, $2.0 million and $1.1 million, respectively, and gross losses of $300,000, $72,000 and $623,000, respectively, during the years ended December 31, 2016, 2015 and 2014.
The tables below summarize gross unrealized losses and the related fair value, aggregated by investment category and length of time that individual available for sale securities have been in a continuous unrealized loss position for the periods indicated.
December 31, 2016 | |||||||||||||||||||||||
Less than 12 Months | 12 Months or More | Total | |||||||||||||||||||||
Fair Value | Unrealized Losses | Fair Value | Unrealized Losses | Fair Value | Unrealized Losses | ||||||||||||||||||
FHLB Securities | $ | 998,000 | $ | 1 | $ | — | $ | — | $ | 998,000 | $ | 1 | |||||||||||
SBA Bonds | 28,490,243 | 228,432 | 8,212,824 | 55,791 | 36,703,067 | 284,223 | |||||||||||||||||
Tax Exempt Municipal Bonds | 47,405,066 | 1,899,519 | — | — | 47,405,066 | 1,899,519 | |||||||||||||||||
Taxable Municipal Bonds | 1,991,130 | 30,062 | — | 1,991,130 | 30,062 | ||||||||||||||||||
Mortgage-Backed Securities | 62,738,366 | 916,699 | 5,600,262 | 55,523 | 68,338,628 | 972,222 | |||||||||||||||||
$ | 141,622,805 | $ | 3,074,713 | $ | 13,813,086 | $ | 111,314 | $ | 155,435,891 | $ | 3,186,027 | ||||||||||||
December 31, 2015 | |||||||||||||||||||||||
Less than 12 Months | 12 Months or More | Total | |||||||||||||||||||||
Fair Value | Unrealized Losses | Fair Value | Unrealized Losses | Fair Value | Unrealized Losses | ||||||||||||||||||
FHLB Securities | $ | — | $ | — | $ | 1,932,088 | $ | 67,912 | $ | 1,932,088 | $ | 67,912 | |||||||||||
FFCB Securities | 1,987,936 | 12,064 | — | — | 1,987,936 | 12,064 | |||||||||||||||||
SBA Bonds | 25,090,453 | 119,533 | 7,982,777 | 74,262 | 33,073,230 | 193,795 | |||||||||||||||||
Tax Exempt Municipal Bonds | 13,668,473 | 175,020 | 709,800 | 29,112 | 14,378,273 | 204,132 | |||||||||||||||||
Mortgage-Backed Securities | 63,273,417 | 648,862 | 1,706,086 | 32,389 | 64,979,503 | 681,251 | |||||||||||||||||
$ | 104,020,279 | $ | 955,479 | $ | 12,330,751 | $ | 203,675 | $ | 116,351,030 | $ | 1,159,154 | ||||||||||||
45
SECURITY FEDERAL CORPORATION AND SUBSIDIARIES
Notes to Consolidated Financial Statements
(2) Investment and Mortgage-Backed Securities, Available For Sale, Continued
Securities classified as available-for-sale are recorded at fair market value. At December 31, 2016 and 2015, 3.5% and 17.6% of the unrealized losses, representing fifteen and nine individual securities, respectively, consisted of securities in a continuous loss position for 12 months or more. The Company has the ability and intent to hold these securities until such time as the value recovers or the securities mature. The Company believes, based on industry analyst reports and credit ratings, that the deterioration in value is attributable to changes in market interest rates and is not in the credit quality of the issuer and therefore, these losses are not considered other-than-temporary. The Company reviews its investment securities portfolio at least quarterly and more frequently when economic conditions warrant, assessing whether there is any indication of other-than-temporary impairment (“OTTI”).
Factors considered in the Company's review of its investment securities portfolio include estimated future cash flows, length of time and extent to which market value has been less than cost, the financial condition and near term prospects of the issuer, and our intent and ability to retain the security to allow for an anticipated recovery in market value. If the review determines that there is OTTI, then an impairment loss is recognized in earnings equal to the entire difference between the investment’s cost and its fair value at the balance sheet date of the reporting period for which the assessment is made, or the Company may recognize a portion of the impairment in other comprehensive income. The fair value of investments on which OTTI is recognized then becomes the new cost basis of the investment.
There was no OTTI recognized during the years ended December 31, 2016, 2015 and 2014.
(3) Investment and Mortgage-Backed Securities, Held to Maturity
During the year ended December 31, 2015 the Company transferred 22 mortgage-backed securities classified as available for sale to its held to maturity portfolio. At the date of the transfer these securities had a fair value $32.8 million, which resulted in an unrealized gain of $602,000 that is reported in accumulated other comprehensive income and will be amortized over the remaining life of the securities. The amortized cost, gross unrealized gains, gross unrealized losses, and fair values of held to maturity securities at December 31, 2016 and 2015 were as follows:
December 31, 2016 | |||||||||||||||
Amortized Cost | Gross Unrealized Gains | Gross Unrealized Losses | Fair Value | ||||||||||||
Mortgage-Backed Securities (1) | $ | 25,583,956 | $ | 63,342 | $ | 276,246 | $ | 25,371,052 | |||||||
Total Held To Maturity | $ | 25,583,956 | $ | 63,342 | $ | 276,246 | $ | 25,371,052 | |||||||
December 31, 2015 | |||||||||||||||
Amortized Cost | Gross Unrealized Gains | Gross Unrealized Losses | Fair Value | ||||||||||||
Mortgage-Backed Securities (1) | $ | 29,873,098 | $ | 22,600 | $ | 214,418 | $ | 29,681,280 | |||||||
Total Held To Maturity | $ | 29,873,098 | $ | 22,600 | $ | 214,418 | $ | 29,681,280 | |||||||
(1) COMPRISED OF GSES OR GNMA MORTGAGE-BACKED SECURITIES
Other than the mortgage-backed securities included in the tables above, which include GNMA mortgage-backed securities, there were no other investment securities classified as held to maturity at December 31, 2016 and 2015. At December 31, 2016, the Bank held an amortized cost and fair value of $16.3 million and $16.2 million, respectively, in GNMA mortgage-backed securities compared to an amortized cost and fair value of $20.5 million and $20.4 million, respectively, at December 31, 2015. The Company has not invested in any private label mortgage-backed securities classified as held to maturity.
46
SECURITY FEDERAL CORPORATION AND SUBSIDIARIES
Notes to Consolidated Financial Statements
(3) Investment and Mortgage-Backed Securities, Held to Maturity, Continued
At December 31, 2016, the amortized cost and fair value of mortgage-backed securities held to maturity that were pledged as collateral for certain deposit accounts, FHLB advances and other borrowings were $23.2 million and $23.0 million, respectively, compared to an amortized cost and fair value of $26.0 million and $25.8 million, respectively, at December 31, 2015.
The following tables show gross unrealized losses, fair value and length of time that individual held to maturity securities were in a continuous unrealized loss position at December 31, 2016 and 2015.
December 31, 2016 | |||||||||||||||||||||||
Less than 12 Months | 12 Months or More | Total | |||||||||||||||||||||
Fair Value | Unrealized Losses | Fair Value | Unrealized Losses | Fair Value | Unrealized Losses | ||||||||||||||||||
Mortgage-Backed Securities (1) | $ | 15,447,596 | $ | 276,246 | $ | — | $ | — | $ | 15,447,596 | $ | 276,246 | |||||||||||
$ | 15,447,596 | $ | 276,246 | $ | — | $ | — | $ | 15,447,596 | $ | 276,246 | ||||||||||||
December 31, 2015 | |||||||||||||||||||||||
Less than 12 Months | 12 Months or More | Total | |||||||||||||||||||||
Fair Value | Unrealized Losses | Fair Value | Unrealized Losses | Fair Value | Unrealized Losses | ||||||||||||||||||
Mortgage-Backed Securities (1) | $ | 25,484,972 | $ | 214,418 | $ | — | $ | — | $ | 25,484,972 | $ | 214,418 | |||||||||||
$ | 25,484,972 | $ | 214,418 | $ | — | $ | — | $ | 25,484,972 | $ | 214,418 | ||||||||||||
(1) COMPRISED OF GSES OR GNMA MORTGAGE-BACKED SECURITIES
The Company’s held to maturity portfolio is recorded at amortized cost. The Company has the ability and intent to hold these securities to maturity.
47
SECURITY FEDERAL CORPORATION AND SUBSIDIARIES
Notes to Consolidated Financial Statements
(4) Loans Receivable, Net
Loans receivable, net, at December 31, 2016 and 2015 are summarized below.
December 31, | |||||||||||||
2016 | 2015 | ||||||||||||
Balance | % of Total Gross Loans | Balance | % of Total Gross Loans | ||||||||||
Residential Real Estate Loans | $ | 77,979,909 | 21.2 | % | $ | 76,373,071 | 22.5 | % | |||||
Consumer Loans | 50,667,894 | 13.8 | % | 50,380,289 | 14.8 | % | |||||||
Commercial Business Loans | 16,279,177 | 4.4 | % | 12,514,133 | 3.7 | % | |||||||
Commercial Real Estate Loans | 222,599,294 | 60.6 | % | 200,083,125 | 59.0 | % | |||||||
Total Loans Held For Investment | 367,526,274 | 100.0 | % | 339,350,618 | 100.0 | % | |||||||
Loans Held For Sale | 4,243,907 | 2,462,559 | |||||||||||
Total Loans Receivable, Gross | 371,770,181 | 341,813,177 | |||||||||||
Less: | |||||||||||||
Allowance For Loan Losses | 8,356,231 | 8,275,133 | |||||||||||
Loans in Process | 3,526,064 | 2,902,849 | |||||||||||
Deferred Loan Fees | 165,040 | 62,466 | |||||||||||
12,047,335 | 11,240,448 | ||||||||||||
Total Loans Receivable, Net | $ | 359,722,846 | $ | 330,572,729 | |||||||||
The Company uses a risk based approach based on the following credit quality measures when analyzing the loan portfolio: pass, caution, special mention, and substandard. These indicators are used to rate the credit quality of loans for the purposes of determining the Company’s allowance for loan losses. Pass loans are loans that are performing and are deemed adequately protected by the net worth of the borrower or the underlying collateral value. These loans are considered to have the least amount of risk in terms of determining the allowance for loan losses. Loans that are graded as substandard are considered to have the most risk. These loans typically have an identified weakness or weaknesses and are inadequately protected by the net worth of the borrower or collateral value. All loans 90 days or more past due are automatically classified in this category. The caution and special mention categories fall in between the pass and substandard grades and consist of loans that do not currently expose the Company to sufficient risk to warrant adverse classification but possess weaknesses.
The following tables summarize the loan grades used by the Company to measure the credit quality of gross loans receivable, excluding those held for sale, by loan segment at December 31, 2016 and 2015.
December 31, 2016 | Pass | Caution | Special Mention | Substandard | Total Loans | |||||||||||||||
Residential Real Estate | $ | 70,503,057 | $ | 665,235 | $ | 1,082,928 | $ | 5,728,689 | $ | 77,979,909 | ||||||||||
Consumer | 46,818,650 | 2,591,860 | 6,357 | 1,251,027 | 50,667,894 | |||||||||||||||
Commercial Business | 14,731,698 | 1,002,170 | 50,081 | 495,228 | 16,279,177 | |||||||||||||||
Commercial Real Estate | 127,068,983 | 71,927,031 | 18,153,718 | 5,449,562 | 222,599,294 | |||||||||||||||
Total | $ | 259,122,388 | $ | 76,186,296 | $ | 19,293,084 | $ | 12,924,506 | $ | 367,526,274 | ||||||||||
December 31, 2015 | Pass | Caution | Special Mention | Substandard | Total Loans | |||||||||||||||
Residential Real Estate | $ | 67,605,311 | $ | 1,264,415 | $ | 607,336 | $ | 6,896,009 | $ | 76,373,071 | ||||||||||
Consumer | 46,344,056 | 2,510,519 | 81,617 | 1,444,097 | 50,380,289 | |||||||||||||||
Commercial Business | 10,519,123 | 1,465,136 | 102,046 | 427,828 | 12,514,133 | |||||||||||||||
Commercial Real Estate | 129,242,390 | 43,863,659 | 17,304,431 | 9,672,645 | 200,083,125 | |||||||||||||||
Total | $ | 253,710,880 | $ | 49,103,729 | $ | 18,095,430 | $ | 18,440,579 | $ | 339,350,618 | ||||||||||
48
SECURITY FEDERAL CORPORATION AND SUBSIDIARIES
Notes to Consolidated Financial Statements
(4) Loans Receivable, Net, Continued
The following tables present an age analysis of past due balances by category at December 31, 2016 and 2015.
December 31, 2016 | ||||||||||||||||||||||||
30-59 Days Past Due | 60-89 Days Past Due | 90 Days or More Past Due | Total Past Due | Current | Total Loans Receivable | |||||||||||||||||||
Residential Real Estate | $ | 653,858 | $ | — | $ | 2,488,158 | $ | 3,142,016 | $ | 74,837,893 | $ | 77,979,909 | ||||||||||||
Consumer | 625,178 | 119,640 | 241,571 | 986,389 | 49,681,505 | 50,667,894 | ||||||||||||||||||
Commercial Business | 536,492 | 69,256 | 145,401 | 751,149 | 15,528,028 | 16,279,177 | ||||||||||||||||||
Commercial Real Estate | 1,719,758 | 256,285 | 2,639,837 | 4,615,880 | 217,983,414 | 222,599,294 | ||||||||||||||||||
Total | $ | 3,535,286 | $ | 445,181 | $ | 5,514,967 | $ | 9,495,434 | $ | 358,030,840 | $ | 367,526,274 | ||||||||||||
December 31, 2015 | ||||||||||||||||||||||||
30-59 Days Past Due | 60-89 Days Past Due | 90 Days or More Past Due | Total Past Due | Current | Total Loans Receivable | |||||||||||||||||||
Residential Real Estate | $ | — | $ | 1,144,381 | $ | 3,306,675 | $ | 4,451,056 | $ | 71,922,015 | $ | 76,373,071 | ||||||||||||
Consumer | 710,881 | 282,314 | 575,866 | 1,569,061 | 48,811,228 | 50,380,289 | ||||||||||||||||||
Commercial Business | 101,201 | — | 178,076 | 279,277 | 12,234,856 | 12,514,133 | ||||||||||||||||||
Commercial Real Estate | 3,309,287 | 929,819 | 2,973,135 | 7,212,241 | 192,870,884 | 200,083,125 | ||||||||||||||||||
Total | $ | 4,121,369 | $ | 2,356,514 | $ | 7,033,752 | $ | 13,511,635 | $ | 325,838,983 | $ | 339,350,618 | ||||||||||||
At December 31, 2016 and 2015, the Company did not have any loans that were 90 days or more past due and still accruing interest. Our strategy is to work with our borrowers to reach acceptable payment plans while protecting our interests in the existing collateral. In the event an acceptable arrangement cannot be reached, we may have to acquire these properties through foreclosure or other means and subsequently sell, develop, or liquidate them. The following table shows non-accrual loans by category at December 31, 2016 compared to 2015.
December 31, 2016 | December 31, 2015 | |||||||||||||||||||
Amount | Percent (1) | Amount | Percent (1) | $ Decrease | % Decrease | |||||||||||||||
Non-accrual Loans: | ||||||||||||||||||||
Residential Real Estate | $ | 2,488,158 | 0.7 | % | $ | 3,306,675 | 1.0 | % | $ | (818,517 | ) | (24.8 | )% | |||||||
Consumer | 241,571 | 0.1 | 575,866 | 0.2 | (334,295 | ) | (58.1 | ) | ||||||||||||
Commercial Business | 145,401 | — | 178,076 | 0.1 | (32,675 | ) | (18.3 | ) | ||||||||||||
Commercial Real Estate | 2,639,837 | 0.7 | 2,973,135 | 0.8 | (333,298 | ) | (11.2 | ) | ||||||||||||
Total Non-accrual Loans | $ | 5,514,967 | 1.5 | % | $ | 7,033,752 | 2.1 | % | $ | (1,518,785 | ) | (21.6 | )% | |||||||
(1) PERCENT OF GROSS LOANS RECEIVABLE HELD FOR INVESTMENT, NET OF DEFERRED FEES AND LOANS IN PROCESS.
49
SECURITY FEDERAL CORPORATION AND SUBSIDIARIES
Notes to Consolidated Financial Statements
(4) Loans Receivable, Net, Continued
The following tables show the activity in the allowance for loan losses by category for the years ended December 31, 2016, 2015 and 2014.
For the Year Ended December 31, 2016 | ||||||||||||||||||||
Residential Real Estate | Consumer | Commercial Business | Commercial Real Estate | Total | ||||||||||||||||
Beginning Balance | $ | 1,323,183 | $ | 1,063,153 | $ | 773,948 | $ | 5,114,849 | $ | 8,275,133 | ||||||||||
Provision | 223,232 | 88,466 | 247,320 | (59,018 | ) | 500,000 | ||||||||||||||
Charge-Offs | (197,381 | ) | (241,738 | ) | (150,000 | ) | (374,144 | ) | (963,263 | ) | ||||||||||
Recoveries | 11,312 | 86,739 | 11,731 | 434,579 | 544,361 | |||||||||||||||
Ending Balance | $ | 1,360,346 | $ | 996,620 | $ | 882,999 | $ | 5,116,266 | $ | 8,356,231 | ||||||||||
For the Year Ended December 31, 2015 | ||||||||||||||||||||
Residential Real Estate | Consumer | Commercial Business | Commercial Real Estate | Total | ||||||||||||||||
Beginning Balance | $ | 1,392,065 | $ | 886,716 | $ | 159,353 | $ | 5,919,362 | $ | 8,357,496 | ||||||||||
Provision | 53,694 | 549,462 | 617,658 | (1,220,814 | ) | — | ||||||||||||||
Charge-Offs | (216,525 | ) | (527,055 | ) | (10,947 | ) | (761,941 | ) | (1,516,468 | ) | ||||||||||
Recoveries | 93,949 | 154,030 | 7,884 | 1,178,242 | 1,434,105 | |||||||||||||||
Ending Balance | $ | 1,323,183 | $ | 1,063,153 | $ | 773,948 | $ | 5,114,849 | $ | 8,275,133 | ||||||||||
For the Year Ended December 31, 2014 | ||||||||||||||||||||
Residential Real Estate | Consumer | Commercial Business | Commercial Real Estate | Total | ||||||||||||||||
Beginning Balance | $ | 1,706,643 | $ | 847,777 | $ | 426,658 | $ | 7,260,892 | $ | 10,241,970 | ||||||||||
Provision | (91,991 | ) | 352,305 | (53,435 | ) | 243,121 | 450,000 | |||||||||||||
Charge-Offs | (359,021 | ) | (372,460 | ) | (328,094 | ) | (2,055,258 | ) | (3,114,833 | ) | ||||||||||
Recoveries | 136,434 | 59,094 | 114,224 | 470,607 | 780,359 | |||||||||||||||
Ending Balance | $ | 1,392,065 | $ | 886,716 | $ | 159,353 | $ | 5,919,362 | $ | 8,357,496 | ||||||||||
The following tables present information related to impaired loans evaluated individually and collectively for impairment in the allowance for loan losses at December 31, 2016 and 2015.
Allowance For Loan Losses | ||||||||||||
December 31, 2016 | Individually Evaluated For Impairment | Collectively Evaluated For Impairment | Total | |||||||||
Residential Real Estate | $ | — | $ | 1,360,346 | $ | 1,360,346 | ||||||
Consumer | 1,699 | 994,921 | 996,620 | |||||||||
Commercial Business | — | 882,999 | 882,999 | |||||||||
Commercial Real Estate | 12,590 | 5,103,676 | 5,116,266 | |||||||||
Total | $ | 14,289 | $ | 8,341,942 | $ | 8,356,231 | ||||||
50
SECURITY FEDERAL CORPORATION AND SUBSIDIARIES
Notes to Consolidated Financial Statements
(4) Loans Receivable, Net, Continued
Allowance For Loan Losses | ||||||||||||
December 31, 2015 | Individually Evaluated For Impairment | Collectively Evaluated For Impairment | Total | |||||||||
Residential Real Estate | $ | — | $ | 1,323,183 | $ | 1,323,183 | ||||||
Consumer | 32,300 | 1,030,853 | 1,063,153 | |||||||||
Commercial Business | — | 773,948 | 773,948 | |||||||||
Commercial Real Estate | 49,300 | 5,065,549 | 5,114,849 | |||||||||
Total | $ | 81,600 | $ | 8,193,533 | $ | 8,275,133 | ||||||
The following tables present information related to impaired loans evaluated individually and collectively for impairment in loans receivable at December 31, 2016 and 2015.
Loans Receivable | ||||||||||||
December 31, 2016 | Individually Evaluated For Impairment | Collectively Evaluated For Impairment | Total | |||||||||
Residential Real Estate | $ | 2,181,740 | $ | 75,798,169 | $ | 77,979,909 | ||||||
Consumer | 170,552 | 50,497,342 | 50,667,894 | |||||||||
Commercial Business | 145,401 | 16,133,776 | 16,279,177 | |||||||||
Commercial Real Estate | 5,830,341 | 216,768,953 | 222,599,294 | |||||||||
Total | $ | 8,328,034 | $ | 359,198,240 | $ | 367,526,274 | ||||||
Loans Receivable | ||||||||||||
December 31, 2015 | Individually Evaluated For Impairment | Collectively Evaluated For Impairment | Total | |||||||||
Residential Real Estate | $ | 2,922,105 | $ | 73,450,966 | $ | 76,373,071 | ||||||
Consumer | 372,382 | 50,007,907 | 50,380,289 | |||||||||
Commercial Business | 162,201 | 12,351,932 | 12,514,133 | |||||||||
Commercial Real Estate | 9,190,640 | 190,892,485 | 200,083,125 | |||||||||
Total | $ | 12,647,328 | $ | 326,703,290 | $ | 339,350,618 | ||||||
Loans for which it is probable that payment of interest and principal will not be made in accordance with the contractual terms of the loan agreement are considered impaired. Once a loan is identified as individually impaired, management measures impairment and records the loan at fair value. Fair value is estimated using one of the following methods: fair value of the collateral less estimated costs to sale, discounted cash flows, or market value of the loan based on similar debt. The fair value of the collateral less estimated costs to sell is the most frequently used method. Typically, the Company reviews the most recent appraisal and, if it is over 24 months old, will request a new third party appraisal. Depending on the particular circumstances surrounding the loan, including the location of the collateral, the date of the most recent appraisal and the value of the collateral relative to the recorded investment in the loan, management may order an independent appraisal immediately or, in some instances, may elect to perform an internal analysis. The average balance of total impaired loans was $13.2 million for year ended December 31, 2016 compared to $13.1 million for the year ended December 31, 2015.
51
SECURITY FEDERAL CORPORATION AND SUBSIDIARIES
Notes to Consolidated Financial Statements
(4) Loans Receivable, Net, Continued
The following tables present information related to impaired loans by loan category as of and for the years ended December 31, 2016, 2015 and 2014.
December 31, 2016 | ||||||||||||||||||||
Impaired Loans | Recorded Investment | Unpaid Principal Balance | Related Allowance | Average Recorded Investment | Interest Income Recognized | |||||||||||||||
With No Related Allowance Recorded: | ||||||||||||||||||||
Residential Real Estate | $ | 2,181,740 | $ | 2,263,240 | $ | — | $ | 3,443,140 | $ | 6,371 | ||||||||||
Consumer | 110,114 | 118,414 | — | 293,287 | — | |||||||||||||||
Commercial Business | 145,401 | 995,401 | — | 300,386 | — | |||||||||||||||
Commercial Real Estate | 5,424,701 | 7,207,688 | — | 8,688,506 | 227,441 | |||||||||||||||
With an Allowance Recorded: | ||||||||||||||||||||
Consumer | 60,438 | 60,438 | 1,699 | 61,947 | 4,591 | |||||||||||||||
Commercial Real Estate | 405,640 | 418,654 | 12,590 | 426,569 | 22,798 | |||||||||||||||
Total | ||||||||||||||||||||
Residential Real Estate | 2,181,740 | 2,263,240 | — | 3,443,140 | 6,371 | |||||||||||||||
Consumer | 170,552 | 178,852 | 1,699 | 355,234 | 4,591 | |||||||||||||||
Commercial Business | 145,401 | 995,401 | — | 300,386 | — | |||||||||||||||
Commercial Real Estate | 5,830,341 | 7,626,342 | 12,590 | 9,115,075 | 250,239 | |||||||||||||||
Total | $ | 8,328,034 | $ | 11,063,835 | $ | 14,289 | $ | 13,213,835 | $ | 261,201 | ||||||||||
December 31, 2015 | ||||||||||||||||||||
Impaired Loans | Recorded Investment | Unpaid Principal Balance | Related Allowance | Average Recorded Investment | Interest Income Recognized | |||||||||||||||
With No Related Allowance Recorded: | ||||||||||||||||||||
Residential Real Estate | $ | 2,922,105 | $ | 3,033,735 | $ | — | $ | 3,014,807 | $ | 13,909 | ||||||||||
Consumer | 120,889 | 129,188 | — | 130,202 | — | |||||||||||||||
Commercial Business | 162,201 | 362,201 | — | 190,562 | — | |||||||||||||||
Commercial Real Estate | 8,620,301 | 10,969,642 | — | 8,952,868 | 245,197 | |||||||||||||||
With an Allowance Recorded: | ||||||||||||||||||||
Consumer | 251,493 | 256,923 | 32,300 | 254,611 | 4,789 | |||||||||||||||
Commercial Real Estate | 570,339 | 577,139 | 49,300 | 579,418 | 31,684 | |||||||||||||||
Total | ||||||||||||||||||||
Residential Real Estate | 2,922,105 | 3,033,735 | — | 3,014,807 | 13,909 | |||||||||||||||
Consumer | 372,382 | 386,111 | 32,300 | 384,813 | 4,789 | |||||||||||||||
Commercial Business | 162,201 | 362,201 | — | 190,562 | — | |||||||||||||||
Commercial Real Estate | 9,190,640 | 11,546,781 | 49,300 | 9,532,286 | 276,881 | |||||||||||||||
Total | $ | 12,647,328 | $ | 15,328,828 | $ | 81,600 | $ | 13,122,468 | $ | 295,579 | ||||||||||
52
SECURITY FEDERAL CORPORATION AND SUBSIDIARIES
Notes to Consolidated Financial Statements
(4) Loans Receivable, Net, Continued
December 31, 2014 | ||||||||||||||||||||
Impaired Loans | Recorded Investment | Unpaid Principal Balance | Related Allowance | Average Recorded Investment | Interest Income Recognized | |||||||||||||||
With No Related Allowance Recorded: | ||||||||||||||||||||
Residential Real Estate | $ | 2,519,814 | $ | 2,618,003 | $ | — | $ | 2,642,156 | $ | — | ||||||||||
Consumer | 152,029 | 159,529 | — | 155,602 | 1,510 | |||||||||||||||
Commercial Business | 236,030 | 436,030 | — | 413,653 | — | |||||||||||||||
Commercial Real Estate | 13,721,964 | 18,088,149 | — | 14,980,690 | 297,839 | |||||||||||||||
With An Allowance Recorded: | ||||||||||||||||||||
Consumer | 66,203 | 66,203 | 2,600 | 67,522 | 4,867 | |||||||||||||||
Commercial Real Estate | 3,551,915 | 3,582,465 | 472,400 | 3,952,066 | 60,207 | |||||||||||||||
Total | ||||||||||||||||||||
Residential Real Estate | 2,519,814 | 2,618,003 | — | 2,642,156 | — | |||||||||||||||
Consumer | 218,232 | 225,732 | 2,600 | 223,124 | 6,377 | |||||||||||||||
Commercial Business | 236,030 | 436,030 | — | 413,653 | — | |||||||||||||||
Commercial Real Estate | 17,273,879 | 21,670,614 | 472,400 | 18,932,756 | 358,046 | |||||||||||||||
Total | $ | 20,247,955 | $ | 24,950,379 | $ | 475,000 | $ | 22,211,689 | $ | 364,423 | ||||||||||
In the course of resolving delinquent loans, the Bank may choose to restructure the contractual terms of certain loans. A troubled debt restructuring ("TDR") is a restructuring in which the Bank, for economic or legal reasons related to a borrower’s financial difficulties, grants a concession to a borrower that it would not otherwise consider (FASB ASC Topic 310-40). The concessions granted on TDRs generally include terms to reduce the interest rate, extend the term of the debt obligation, or modify the payment structure on the debt obligation. The Bank grants such concessions to reassess the borrower’s financial status and develop a plan for repayment. TDRs included in impaired loans at December 31, 2016 and 2015 were $4.6 million and $6.7 million, respectively.
At the date of modification, TDRs are initially classified as nonaccrual TDRs. They are returned to accruing status when there is economic substance to the restructuring, there is documented credit evaluation of the borrower's financial condition, the remaining balance is reasonably assured of repayment in accordance with its modified terms, and the borrower has demonstrated sustained repayment performance in accordance with the modified terms for a reasonable period of time (generally a minimum of six months).
The Bank did not modify any loans that were considered to be TDRs during the year ended December 31, 2016.
The following table summarizes the loans restructured as TDRs during the periods indicated:
Year Ended December 31, | ||||||||||||||||||||||
2015 | 2014 | |||||||||||||||||||||
Troubled Debt Restructurings | Number of Contracts | Pre- Modification Outstanding Recorded Investment | Post- Modification Outstanding Recorded Investment | Number of Contracts | Pre- Modification Outstanding Recorded Investment | Post- Modification Outstanding Recorded Investment | ||||||||||||||||
Consumer | 1 | $ | 36,460 | $ | 36,460 | — | $ | — | $ | — | ||||||||||||
Commercial Real Estate | 6 | 922,000 | 922,000 | 2 | 186,188 | 186,188 | ||||||||||||||||
Total | 7 | 958,460 | 958,460 | 2 | 186,188 | 186,188 | ||||||||||||||||
53
SECURITY FEDERAL CORPORATION AND SUBSIDIARIES
Notes to Consolidated Financial Statements
(4) Loans Receivable, Net, Continued
During the year ended December 31, 2015, the Bank modified seven loans that were considered TDRs. The Bank lowered the interest rate on three of the loans to allow the borrowers to begin making monthly principal and interest payments and changed the monthly payment to interest only for an agreed upon period for the other four loans. During the year ended December 31, 2014, the Bank modified two loans that were considered to be TDRs by lowering the interest rate on both loans.
The following table is a summary of TDRs restructured during the periods indicated that subsequently defaulted during the same period:
Year Ended December 31, | ||||||||||||||||||||
2016 | 2015 | 2014 | ||||||||||||||||||
Number of Contracts | Recorded Investment | Number of Contracts | Recorded Investment | Number of Contracts | Recorded Investment | |||||||||||||||
Commercial Real Estate | — | — | 2 | 30,713 | 1 | 66,138 | ||||||||||||||
Total | — | $ | — | 2 | $ | 30,713 | 1 | $ | 66,138 | |||||||||||
At December 31, 2016, two loans totaling $599,000 that had previously been restructured as TDRs were in default. Neither loan had been restructured within the last 12 months. At December 31, 2015, six loans that had been previously restructured were in default, including two which had been restructured within the last 12 months. At December 31, 2014, seven previously restructured loans were in default, including one which had been restructured during the same period. The Bank considers any loan 30 days or more past due to be in default.
Our policy with respect to accrual of interest on loans restructured as a TDR follows relevant supervisory guidance. That is, if a borrower has demonstrated performance under the previous loan terms and shows capacity to perform under the restructured loan terms, continued accrual of interest at the restructured interest rate is probable. If a borrower was materially delinquent on payments prior to the restructuring but shows capacity to meet the restructured loan terms, the loan will likely continue as nonaccrual going forward. Lastly, if the borrower does not perform under the restructured terms, the loan is placed on nonaccrual status.
We will continue to closely monitor these loans and will cease accruing interest on them if management believes that the borrowers may not continue performing based on the restructured note terms. If, after previously being classified as a TDR, a loan is restructured a second time, then that loan is automatically placed on nonaccrual status. Our policy with respect to nonperforming loans requires the borrower to become current and then make a minimum of six consecutive payments in accordance with the loan terms before that loan can be placed back on accrual status. Further, the borrower must show capacity to continue performing into the future prior to restoration of accrual status.
54
SECURITY FEDERAL CORPORATION AND SUBSIDIARIES
Notes to Consolidated Financial Statements
(5) Premises and Equipment, Net
Premises and equipment, net, are summarized as follows:
December 31, | |||||||
2016 | 2015 | ||||||
Land | $ | 6,693,927 | $ | 6,693,927 | |||
Buildings and Improvements | 20,299,729 | 20,040,102 | |||||
Furniture and Equipment | 11,620,148 | 11,142,428 | |||||
Construction in Progress | 1,702,791 | 236,019 | |||||
Total Premises and Equipment | 40,316,595 | 38,112,476 | |||||
Less: Accumulated Depreciation | (19,118,911 | ) | (17,995,558 | ) | |||
Total Premises and Equipment, Net | $ | 21,197,684 | $ | 20,116,918 | |||
The Company broke ground on its fifteenth full-service branch location during the year ended December 31, 2016 which resulted in the increase in construction in progress noted above. At December 31, 2016, the Company had additional commitments related to the construction of this branch expected to be paid totaling $1.4 million.
Depreciation expense on premises and equipment was $1.4 million for the year ended December 31, 2016 and $1.2 million for each of the years ended December 31, 2015 and 2014. The Bank has entered into non-cancelable operating leases related to buildings and land. At December 31, 2016, future minimum payments under non-cancelable operating leases with initial or remaining terms of one year or more are as follows (by fiscal year):
2017 | $ | 406,845 | |
2018 | 303,874 | ||
2019 | 295,303 | ||
2020 | 295,303 | ||
2021 | 295,303 | ||
Thereafter | 1,365,438 | ||
Total Future Minimum Payments | $ | 2,962,066 | |
Total rental expense was $399,000, $417,000, and $424,000 for the years ended December 31, 2016, 2015 and 2014, respectively. Five lease agreements with monthly expenses of $6,800, $800, $7,900, $8,600, and $10,000 have multiple renewal options totaling 30, 10, 15, 45, and 20 years, respectively.
55
SECURITY FEDERAL CORPORATION AND SUBSIDIARIES
Notes to Consolidated Financial Statements
(6) Goodwill
Goodwill was recorded in connection with the Company's acquisition of Collier Jennings Financial Corporation in July 2006. The goodwill balance of $1.2 million remained unchanged at December 31, 2016 and 2015.
In accordance with accounting guidance, the Company evaluates its goodwill on an annual basis. The evaluations were performed as of September 30, 2016 and September 30, 2015 for the years ended December 31, 2016 and 2015, respectively. At the time of the evaluations the Company determined that no impairment existed. Therefore, there was no write-down of goodwill for the years ended December 31, 2016 and 2015.
(7) FHLB Stock
The Bank, as a member of the FHLB of Atlanta, is required to acquire and hold shares of capital stock in the FHLB of Atlanta in an amount equal to a membership component, which was 0.09% of total assets at both December 31, 2016 and 2015, plus a transaction component equal to 4.25% of outstanding advances (borrowings) from the FHLB of Atlanta at December 31, 2016 and 2015. The Bank is in compliance with this requirement with an investment in FHLB of Atlanta stock of $2.8 million and $2.2 million at December 31, 2016 and 2015, respectively. No readily available market exists for this stock and it has no quoted fair value. However, because redemption of this stock has historically been at par, it is carried at cost.
(8) Other Real Estate Owned
The Bank owned $2.7 million and $4.4 million in OREO at December 31, 2016 and 2015, respectively. Transactions in OREO for the years ended December 31, 2016, 2015 and 2014 are summarized below.
2016 | 2015 | 2014 | |||||||||
Balance, beginning of year | $ | 4,361,411 | $ | 3,229,710 | $ | 3,947,226 | |||||
Additions | 1,026,178 | 4,362,635 | 1,638,135 | ||||||||
Sales | (2,626,375 | ) | (2,918,587 | ) | (1,850,651 | ) | |||||
Write-downs | (40,000 | ) | (312,347 | ) | (505,000 | ) | |||||
Balance, end of year | $ | 2,721,214 | $ | 4,361,411 | $ | 3,229,710 | |||||
56
SECURITY FEDERAL CORPORATION AND SUBSIDIARIES
Notes to Consolidated Financial Statements
(9) Deposits
Deposits outstanding at December 31, 2016 and 2015 are summarized below by account type.
December 31, 2016 | December 31, 2015 | ||||||||||||||
Balance | Weighted Rate | Interest Rate Range | Balance | Weighted Rate | Interest Rate Range | ||||||||||
Checking Accounts | $ | 171,133,555 | 0.02% | 0.00-0.20% | $ | 155,765,968 | 0.03% | 0.00-0.20% | |||||||
Money Market Accounts | 230,902,038 | 0.20% | 0.00-0.50% | 229,016,993 | 0.16% | 0.10-0.17% | |||||||||
Statement Savings Accounts | 36,522,989 | 0.10% | 0.00-0.10% | 31,191,828 | 0.10% | 0.00-0.10% | |||||||||
Total | $ | 438,558,582 | 0.12% | 0.00-0.50% | $ | 415,974,789 | 0.11% | 0.00-0.20% | |||||||
Certificate Accounts: | |||||||||||||||
0.00 – 0.99% | $ | 148,370,515 | $ | 175,755,511 | |||||||||||
1.00 – 1.99% | 66,532,221 | 51,479,431 | |||||||||||||
2.00 – 2.99% | 641,960 | 8,886,814 | |||||||||||||
Total | $ | 215,544,696 | 0.78% | 0.05-2.00% | $ | 236,121,756 | 0.69% | 0.04-2.52% | |||||||
Total Deposits | $ | 654,103,278 | 0.34% | 0.00-2.00% | $ | 652,096,545 | 0.32% | 0.00-2.52% | |||||||
Included in the certificates above were $40.3 million and $42.5 million in brokered deposits at December 31, 2016 and 2015, respectively, with a weighted average interest rate of 1.14% and 0.94%, respectively. Of the $40.3 million in brokered deposits at December 31, 2016, $15.9 million mature within one year.
The aggregate amount of certificates of deposit with a minimum denomination of $100,000 was $119.2 million and $132.0 million at December 31, 2016 and 2015, respectively.
Certificate of deposits that met or exceeded the FDIC insurance limit of $250,000 were $57.4 million and $71.3 million at December 31, 2016 and 2015, respectively.
The amounts and scheduled maturities of all certificates of deposit were as follows at December 31, 2016 and 2015:
December 31, | |||||||
2016 | 2015 | ||||||
Within 1 Year | $ | 131,484,617 | $ | 141,385,500 | |||
After 1 Year, Within 2 Years | 40,384,177 | 56,022,488 | |||||
After 2 Years, Within 3 Years | 15,459,977 | 23,139,815 | |||||
After 3 Years, Within 4 Years | 8,452,948 | 9,179,894 | |||||
After 4 Years, Within 5 Years | 19,762,977 | 6,394,059 | |||||
$ | 215,544,696 | $ | 236,121,756 | ||||
At December 31, 2016 and 2015, the Bank had $81,000 and $46,000, respectively, in overdrafts that were reclassified to loans.
57
SECURITY FEDERAL CORPORATION AND SUBSIDIARIES
Notes to Consolidated Financial Statements
(10) Advances From Federal Home Loan Bank and Other Borrowings
Advances from the FHLB are summarized by year of maturity and weighted average interest rate at December 31, 2016 below.
Amount | Weighted Rate | ||||
2017 | $ | 15,395,000 | 0.76% | ||
2018 | 18,000,000 | 1.06% | |||
2019 | 12,000,000 | 1.31% | |||
2020 | 3,000,000 | 1.38% | |||
Total | $ | 48,395,000 | 1.05% | ||
These advances are secured by a blanket collateral agreement with the FHLB by pledging the Bank’s portfolio of residential first mortgage loans and investment securities with an amortized cost and fair value of $73.3 million and $71.1 million, respectively, at December 31, 2016 and $77.8 million and $74.7 million, respectively, at December 31, 2015.
FHLB advances are subject to prepayment penalties. During the year ended December 31, 2016, the Bank prepaid three FHLB advances totaling $17.9 million and incurred $789,000 in prepayment penalties. During the year ended December 31, 2015, the Bank prepaid three FHLB advances totaling $15.0 million and incurred $788,000 in prepayment penalties. During the year ended December 31, 2014, the Bank prepaid one FHLB advance with a balance of $5.0 million and incurred $178,000 in prepayment penalties.
Callable advances are callable at the option of the FHLB. If an advance is called, the Bank has the option to pay off the advance without penalty, re-borrow funds on different terms, or convert the advance to a three-month floating rate advance tied to LIBOR. The Bank did not have any callable FHLB advances at December 31, 2016.
At December 31, 2016 and 2015, the Bank had $198.7 million and $240.2 million in additional borrowing capacity, respectively, at the FHLB.
The Bank had $9.3 million and $6.4 million in other borrowings at December 31, 2016 and 2015, respectively. These borrowings consist of short-term repurchase agreements with certain commercial demand deposit customers for sweep accounts. The repurchase agreements typically mature within one to three days and the interest rate paid on these borrowings floats monthly with money market type rates. At both December 31, 2016 and 2015, the interest rate paid on the repurchase agreements was 0.15%. The maximum amount outstanding at any one month end during the year ended December 31, 2016 was $12.6 million compared to $10.3 million during the year ended December 31, 2015. The Bank had pledged as collateral for these repurchase agreements investment and mortgage-backed securities with amortized costs and fair values of $17.6 million and $17.9 million, respectively, at December 31, 2016 and $14.3 million and $14.6 million, respectively, at December 31, 2015.
(11) Note Payable
On October 31, 2016, the Company repurchased all 22,000 shares of its Series B Preferred Stock from the United States Department of the Treasury ("Treasury") for a repurchase amount of $21.3 million plus accrued but unpaid interest of $93,000 for a total payment amount of $21.4 million. See Note 20 for more information on this transaction. In connection with this repurchase, the Company obtained a $14.0 million unsecured term loan from another financial institution. The loan accrues and pays interest quarterly at a floating rate of the Wall Street Journal Prime index minus 30 basis points, which was equal to 3.45% at December 31, 2016. The unpaid principal balance is payable in 11 consecutive quarterly payments of $437,500 each, with a balloon payment equal to the entire remaining principal balance due on October 1, 2019. At December 31, 2016, the remaining principal balance on the loan was $13.0 million.
The note has the following covenants with which the Bank must maintain compliance: the Bank must maintain a "Well Capitalized" rating in accordance with regulatory standards, a Risk-Based Capital Ratio of not less than 12.00%, a “Modified” Texas Ratio of not more than 30.00%, and an annual return on assets of at least 0.60%. The Bank is also required to maintain a loan loss reserve in amounts deemed adequate by all federal and state regulatory authorities. Management of the Bank reviews these covenants quarterly for compliance. At December 31, 2016, the Bank was in compliance with all covenants.
58
SECURITY FEDERAL CORPORATION AND SUBSIDIARIES
Notes to Consolidated Financial Statements
(12) Junior Subordinated Debentures
On September 21, 2006, Security Federal Statutory Trust (the “Trust”), a wholly-owned subsidiary of the Company, issued and sold fixed and floating rate capital securities of the Trust (the “Capital Securities”), which are reported on the consolidated balance sheet as junior subordinated debentures, generating proceeds of $5.2 million. The Trust loaned these proceeds to the Company to use for general corporate purposes, primarily to provide capital to the Bank.
The Capital Securities accrue and pay distributions quarterly at a floating rate of three month LIBOR plus 170 basis points which was a rate per annum equal to 2.66% and 2.21% at December 31, 2016 and 2015, respectively. The distribution rate payable on the Capital Securities is cumulative and payable quarterly in arrears.
The Company has the right, subject to events of default, to defer payments of interest on the Capital Securities for a period not to exceed 20 consecutive quarterly periods, provided that no extension period may extend beyond the maturity date of December 15, 2036. The Company has no current intention to exercise its right to defer payments of interest on the Capital Securities.
The Capital Securities mature or are mandatorily redeemable upon maturity on December 15, 2036, or upon earlier optional redemption as provided in the indenture. The Company has had the right to redeem the Capital Securities in whole or in part since September 15, 2011.
(13) Senior Convertible Debentures
Effective December 1, 2009, the Company issued $6.1 million in convertible senior debentures. These debentures will mature on December 1, 2029 and accrue interest at the rate of 8.0% per annum until maturity or earlier redemption, repayment, or conversion into common stock. Interest on the debentures is payable on June 1 and December 1 of each year, and commenced June 1, 2010. These debentures are convertible into the Company’s common stock at a conversion price of $20 per share at the option of the holder at any time prior to maturity.
The convertible senior debentures are redeemable, in whole or in part, at the option of the Company at any time on or after December 1, 2019, at a price equal to 100% of the principal amount of the debentures to be purchased plus any accrued and unpaid interest to, but excluding, the date of redemption. These debentures are unsecured general obligations of the Company ranking equal in right of payment to all of our present and future unsecured indebtedness that is not expressly subordinated.
(14) Income Taxes
Income tax expense was comprised of the following for the dates indicated below:
Years Ended December 31, | |||||||||||
2016 | 2015 | 2014 | |||||||||
Current: | |||||||||||
Federal | $ | 1,022,082 | $ | 1,056,002 | $ | 1,833,069 | |||||
State | 191,999 | 285,699 | 267,904 | ||||||||
Total Current Tax Expense | 1,214,081 | 1,341,701 | 2,100,973 | ||||||||
Deferred: | |||||||||||
Federal | 696,638 | 722,699 | 192,051 | ||||||||
State | 9,761 | 2,699 | 10,144 | ||||||||
Total Deferred Tax Expense | 706,399 | 725,398 | 202,195 | ||||||||
Total Income Tax Expense | $ | 1,920,480 | $ | 2,067,099 | $ | 2,303,168 | |||||
59
SECURITY FEDERAL CORPORATION AND SUBSIDIARIES
Notes to Consolidated Financial Statements
(14) Income Taxes, Continued
The Company's income taxes differ from those computed at the statutory federal income tax rate, as follows:
Years Ended December 31, | |||||||||||
2016 | 2015 | 2014 | |||||||||
Tax at Statutory Income Tax Rate | $ | 2,667,347 | $ | 2,782,229 | $ | 2,758,729 | |||||
State Tax and Other | (26,284 | ) | (41,986 | ) | 66,738 | ||||||
Tax Exempt Interest | (732,087 | ) | (684,708 | ) | (534,325 | ) | |||||
Valuation Allowance | 11,504 | 11,564 | 12,026 | ||||||||
Total Income Tax Expense | $ | 1,920,480 | $ | 2,067,099 | $ | 2,303,168 | |||||
The tax effects of temporary differences that give rise to significant portions of the deferred tax assets and deferred tax liabilities as of December 31, 2016 and 2015 are presented below.
December 31, | |||||||
2016 | 2015 | ||||||
Deferred Tax Assets: | |||||||
Deferred Compensation | $ | 620,256 | $ | 558,870 | |||
Provision for Loan Losses | 2,873,574 | 2,846,867 | |||||
Other Real Estate Owned | 106,107 | 1,004,332 | |||||
Net Fees Deferred for Financial Reporting | 97,273 | 112,782 | |||||
Net Operating Losses | 243,279 | 231,775 | |||||
Other | 292,402 | 205,009 | |||||
Total Gross Deferred Tax Assets | 4,232,891 | 4,959,635 | |||||
Less: Valuation Allowance | (243,279 | ) | (231,775 | ) | |||
Net Deferred Tax Assets | 3,989,612 | 4,727,860 | |||||
Deferred Tax Liabilities: | |||||||
FHLB Stock Basis Over Tax Basis | 114,577 | 114,630 | |||||
Depreciation | 386,940 | 420,568 | |||||
Prepaid Expenses | 44,103 | 42,271 | |||||
Unrealized Gain on Securities Available for Sale | 714,584 | 2,604,222 | |||||
Total Gross Deferred Tax Liability | 1,260,204 | 3,181,691 | |||||
Net Deferred Tax Asset | $ | 2,729,408 | $ | 1,546,169 | |||
Deferred tax assets represent the future tax benefit of deductible differences and, if it is more likely than not that a tax asset will not be realized, a valuation allowance is required to reduce the recorded deferred tax assets to net realizable value. As of December 31, 2016, management has determined that it is more likely than not that the total deferred tax asset will be realized except for the deferred tax asset associated with state net operating loss carryforwards, and, accordingly, has established a valuation allowance only for this item. The change in the valuation allowance was $11,500. Net deferred tax assets are included in other assets at December 31, 2016 and 2015. The Company had state net operating losses attributable to the non-bank entities of $7.4 million and $7.0 million for the years ended December 31, 2016 and 2015, respectively.
Retained earnings at December 31, 2016 included tax bad debt reserves of $2.1 million, for which no provision for federal income tax has been made. If, in the future, these amounts are used for any purpose other than to absorb bad debt losses, including dividends, stock redemptions, or distributions in liquidation, or the Company ceases to be qualified as a bank holding company, they may be subject to federal income tax at the prevailing corporate tax rate.
At December 31, 2016, the Company had no material unrecognized tax benefits or accrued interest and penalties. It is the Company's policy to account for interest and penalties accrued relative to unrecognized tax benefits as a component of income tax expense. Tax returns for 2013 and subsequent years are subject to examination by taxing authorities.
60
SECURITY FEDERAL CORPORATION AND SUBSIDIARIES
Notes to Consolidated Financial Statements
(15) Regulatory Matters
As a state-chartered, federally insured commercial bank, the Bank is subject to the regulatory capital requirements established by the FDIC. Under the FDIC’s capital adequacy guidelines and the regulatory framework for prompt corrective action, the Bank must meet specific capital guidelines that involve quantitative measures of the Bank’s assets, liabilities and certain off-balance-sheet items as calculated under regulatory accounting practices. The Bank’s capital amounts and classification are also subject to qualitative judgments by the regulators about components, risk weightings and other factors.
Quantitative measures established by regulation to ensure capital adequacy require the Bank to maintain minimum amounts and ratios (set forth in the table below) of Tier 1 capital (as defined in the regulations) to total average assets (as defined), and minimum ratios of Tier 1 total capital (as defined) and common equity Tier 1 (“CET1”) capital to risk-weighted assets (as defined). Failure to meet minimum capital requirements can initiate certain mandatory and possibly additional discretionary actions by bank regulators that, if undertaken, could have a direct material effect on the Company's consolidated financial statements.
Effective January 1, 2015 (with some changes transitioned into full effectiveness over two to four years), the Bank became subject to new regulatory capital requirements. The new minimum requirements are a ratio of CET1 capital to total risk-weighted assets (the "CET1 risk-based ratio") of 4.5%, a Tier 1 capital ratio of 6.0%, a total capital ratio of 8.0%, and a leverage ratio of 4.0%. In addition to the minimum CET1, Tier 1 and total capital ratios, the Bank is required to maintain a capital conservation buffer consisting of additional CET1 capital above the required minimum levels in order to avoid limitations on paying dividends, engaging in share repurchases, and paying discretionary bonuses based on percentages of eligible retained income that could be utilized for such actions. This new capital conservation buffer requirement began to be phased in starting in January 2016 at 0.625% of risk-weighted assets and will increase each year until fully implemented in January 2019.
In addition to the capital requirements, there are a number of changes in what constitutes regulatory capital, subject to transition periods. These changes include the phasing-out of certain instruments as qualifying capital. The Bank does not have any of these instruments. Mortgage servicing rights and deferred tax assets over designated percentages of CET1 will be deducted from capital, subject to a transition period ending December 31, 2017. CET1 consists of Tier 1 capital less all capital components that are not considered common equity. In addition, Tier 1 capital includes accumulated other comprehensive income (loss), which includes all unrealized gains and losses on available for sale debt and equity securities, subject to a transition period ending December 31, 2017. Because of the Bank's asset size, it was not considered an advanced approaches banking organization and has elected to permanently opt-out of the inclusion of unrealized gains and losses on available for sale debt and equity securities in its capital calculations.
The new requirements also include changes in the risk-weighting of assets to better reflect credit risk and other risk exposure. These include a 150% risk weight (up from 100%) for certain high volatility commercial real estate acquisition, development and construction loans and for non-residential mortgage loans that are 90 days or more past due or otherwise on non-accrual status; a 20% (up from 0%) credit conversion factor for the unused portion of a commitment with an original maturity of one year or less that is not unconditionally cancellable; and a 250% risk weight (up from 100%) for mortgage servicing rights and deferred tax assets that are not deducted from capital.
Under the new standards, in order to be considered well-capitalized, the Bank must have a CET1 risk-based capital ratio of 6.5% (new), a Tier 1 risk-based capital ratio of 8.0% (increased from 6.0%), a total risk-based capital ratio of 10.0% (unchanged) and a Tier 1 leverage capital ratio of 5.0% (unchanged). As of December 31, 2016, the Bank was categorized as well-capitalized under the regulatory framework for prompt corrective action.
The Company is a bank holding company registered with the Federal Reserve. Bank holding companies are subject to capital adequacy requirements of the Federal Reserve under the Bank Holding Company Act of 1956, as amended, and the regulations of the Federal Reserve. For a bank holding company with less than $1.0 billion in assets, the capital guidelines apply on a bank only basis and the Federal Reserve expects the holding company's subsidiary banks to be well-capitalized under the prompt corrective action regulations. If Security Federal Corporation was subject to regulatory guidelines for bank holding companies with $1.0 billion or more in assets, at December 31, 2016, it would have exceeded all regulatory capital requirements.
61
SECURITY FEDERAL CORPORATION AND SUBSIDIARIES
Notes to Consolidated Financial Statements
(15) Regulatory Matters, Continued
The Company and the Bank’s regulatory capital amounts and ratios were as follows as of the dates indicated:
Actual | For Capital Adequacy | To Be Well Capitalized Under Prompt Corrective Action Provisions | ||||||||||||||||||
Amount | Ratio | Amount | Ratio | Amount | Ratio | |||||||||||||||
(Dollars in Thousands) | ||||||||||||||||||||
December 31, 2016 | ||||||||||||||||||||
SECURITY FEDERAL CORP. | ||||||||||||||||||||
Tier 1 Risk-Based Core Capital (To Risk Weighted Assets) | $ | 73,787 | 16.6 | % | $ | 26,714 | 6.0 | % | N/A | N/A | ||||||||||
Total Risk-Based Capital (To Risk Weighted Assets) | 79,383 | 17.8 | % | 35,618 | 8.0 | % | N/A | N/A | ||||||||||||
Common Equity Tier 1 Capital (To Risk Weighted Assets) | 68,787 | 15.4 | % | 20,035 | 4.5 | % | N/A | N/A | ||||||||||||
Tier 1 Leverage (Core) Capital (To Adjusted Tangible Assets) | 73,787 | 9.1 | % | 32,548 | 4.0 | % | N/A | N/A | ||||||||||||
SECURITY FEDERAL BANK | ||||||||||||||||||||
Tier 1 Risk-Based Core Capital (To Risk Weighted Assets) | $ | 88,139 | 19.8 | % | $ | 26,694 | 6.0 | % | $ | 35,592 | 8.0 | % | ||||||||
Total Risk-Based Capital (To Risk Weighted Assets) | 93,735 | 21.1 | % | 35,592 | 8.0 | % | 44,490 | 10.0 | % | |||||||||||
Common Equity Tier 1 Capital (To Risk Weighted Assets) | 88,139 | 19.8 | % | 20,021 | 4.5 | % | 28,919 | 6.5 | % | |||||||||||
Tier 1 Leverage (Core) Capital (To Adjusted Tangible Assets) | 88,139 | 10.8 | % | 32,587 | 4.0 | % | 40,734 | 5.0 | % | |||||||||||
December 31, 2015 | ||||||||||||||||||||
SECURITY FEDERAL CORP. | ||||||||||||||||||||
Tier 1 Risk-Based Core Capital (To Risk Weighted Assets) | $ | 84,672 | 21.7 | % | $ | 23,429 | 6.0 | % | N/A | N/A | ||||||||||
Total Risk-Based Capital (To Risk Weighted Assets) | 95,429 | 24.4 | % | 31,239 | 8.0 | % | N/A | N/A | ||||||||||||
Common Equity Tier 1 Capital (To Risk Weighted Assets) | 63,504 | 16.3 | % | 17,572 | 4.5 | % | N/A | N/A | ||||||||||||
Tier 1 Leverage (Core) Capital (To Adjusted Tangible Assets) | 84,672 | 10.6 | % | 31,811 | 4.0 | % | N/A | N/A | ||||||||||||
SECURITY FEDERAL BANK | ||||||||||||||||||||
Tier 1 Risk-Based Core Capital (To Risk Weighted Assets) | $ | 87,728 | 22.5 | % | $ | 23,440 | 6.0 | % | $ | 31,254 | 8.0 | % | ||||||||
Total Risk-Based Capital (To Risk Weighted Assets) | 92,653 | 23.7 | % | 31,254 | 8.0 | % | 39,067 | 10.0 | % | |||||||||||
Common Equity Tier 1 Capital (To Risk Weighted Assets) | 87,728 | 22.5 | % | 17,580 | 4.5 | % | 25,394 | 6.5 | % | |||||||||||
Tier 1 Leverage (Core) Capital (To Adjusted Tangible Assets) | 87,728 | 11.0 | % | 31,801 | 4.0 | % | 39,751 | 5.0 | % | |||||||||||
The FDIC also has authority to establish individual minimum capital requirements in appropriate cases upon a determination that an institution's capital level is or may become inadequate in light of particular risks or circumstances. Management of the Company and the Bank believe that, under the current regulations, the Company and the Bank will continue to meet their minimum capital requirements in the foreseeable future.
62
SECURITY FEDERAL CORPORATION AND SUBSIDIARIES
Notes to Consolidated Financial Statements
(16) Employee Benefit Plans
The Company is participating in a multiple employer defined contribution employee benefit plan covering substantially all employees with six months or more of service. The Company matches a portion of the employees’ contributions and the plan has a discretionary profit sharing provision. Total employer contributions were $224,000, $210,000 and $186,000 for the years ended December 31, 2016, 2015 and 2014, respectively.
The Company has an Employee Stock Purchase Plan (“ESPP”). The ESPP allows employees of the Company to purchase stock quarterly through a payroll deduction at a discount calculated as 15% of the market value with a floor equal to the Company’s book value. The ESPP, which was approved by stockholders in July 2005, became effective in January 2007. Participation in the ESPP is voluntary. Employees are limited to investing $25,000 or 5% of their annual salary, whichever is lower, during the year. During the year ended December 31, 2016, there were no employee stock purchases within the plan.
The Company implemented an Incentive Compensation Plan (the "Plan") during the year ended December 31, 2014. Incentive awards are based on the financial and operating performance of the Company as well as other participant specific objectives. The Plan allows employees of the Company to earn up to 7.5 days of their annual salary for successfully completing specific goals established by the participants and their respective supervisors plus an additional 2.5 days of their annual salary if the Company meets an annual predetermined net operating income amount determined by the Board of Directors. The Company also implemented an Incentive Compensation Plan for executive level officers (the "Executive Plan"). Under this plan incentive awards are based on contributions to performance as measured by critical operating and financial ratios, and other participant specific objectives. The Company has to meet the annual predetermined net operating income amount determined by the Board of Directors for any incentive awards to be paid under the Executive Plan. If the Company does not meet the required net income amount, no incentives are paid regardless of the executive's performance on individual objectives or entity wide objectives. Participation in both plans is voluntary. At December 31, 2016 and 2015, the Company accrued $250,000 and $150,000, respectively, for incentive payments, which were paid during the subsequent year.
Certain officers of the Company participate in a supplemental retirement plan. These benefits are not qualified under the Internal Revenue Code and they are not funded. During the years ended December 31, 2016, 2015 and 2014, the Company incurred expenses of $276,000, $205,000, and $103,000, respectively, for this plan.
Certain officers and directors of the Company participate in incentive and non-qualified stock option plans. Prior to fiscal 2010, the Company had three stock option plans that together authorized the Company to grant 150,000 options. In 2008, the 2008 Equity Incentive Plan was approved by stockholders and implemented by the Company with the intention of replacing the previous three option plans. No additional options are to be granted under the old plans and forfeitures under the old plans are not added to the new plan as available options, however, all existing options outstanding under these plans remain in effect. The 2008 Equity Incentive Plan provides for the grant of non-qualified and incentive stock options, stock appreciation rights (“SARS”), and restricted stock awards. Under the 2008 Equity Incentive Plan, 50,000 shares of common stock are reserved for the issuance of stock options and SARS in addition to 50,000 shares subject to restricted stock awards. The plan is administered by a committee appointed by the Board of Directors. The committee determines the specific employees, amount and type of any awards granted. At December 31, 2016 and 2015, there were 50,000 shares available for issuance under this plan for stock options and SARS. Options under all plans are granted at exercise prices not less than the fair value of the Company’s common stock on the date of the grant.
63
SECURITY FEDERAL CORPORATION AND SUBSIDIARIES
Notes to Consolidated Financial Statements
(16) Employee Benefit Plans, Continued
The following is a summary of the activity under the Company’s incentive and non-qualified stock option plans for the years ended December 31, 2016, 2015 and 2014:
Years Ended December 31, | ||||||||||||||||||||
2016 | 2015 | 2014 | ||||||||||||||||||
Shares | Weighted Avg. Exercise Price | Shares | Weighted Avg. Exercise Price | Shares | Weighted Avg. Exercise Price | |||||||||||||||
Balance, Beginning of Period | 29,500 | $ | 23.55 | 47,500 | $ | 22.41 | 61,500 | $ | 22.49 | |||||||||||
Options Granted | — | — | — | — | — | — | ||||||||||||||
Options Exercised | — | — | — | — | — | — | ||||||||||||||
Options Forfeited | 8,000 | 23.47 | 18,000 | 20.55 | 14,000 | 22.74 | ||||||||||||||
Balance, End of Period | 21,500 | $ | 23.57 | 29,500 | $ | 23.55 | 47,500 | $ | 22.41 | |||||||||||
Options Exercisable | 18,200 | $ | 23.62 | 21,500 | $ | 23.57 | 34,300 | $ | 22.00 | |||||||||||
Weighted-Average Remaining Life of Exercisable Options | 1.0 year | 1.4 years | 1.1 years | |||||||||||||||||
Options Available for Grant | 50,000 | 50,000 | 50,000 | |||||||||||||||||
During the year ended December 31, 2016, 4,500 options with a weighted average exercise price of $23.57 vested. During the year ended December 31, 2015, 5,200 stock options with a weighted average exercise price of $23.50 vested. During the year ended December 31, 2014, 5,400 options with a weighted average exercise price of $23.50 vested. The aggregate intrinsic value of the stock options outstanding and exercisable was $0 at December 31, 2016, 2015 and 2014. Total compensation expense related to stock options was $8,000, $12,700, and $12,700 for the years ended December 31, 2016, 2015 and 2014, respectively. As of December 31, 2016, there was $5,155 of total unrecognized compensation cost related to non-vested stock options. The cost is expected to be recognized over a weighted average period of three years.
There were no stock options granted by the Company during the years ended December 31, 2016, 2015 and 2014. At December 31, 2016, the Company had the following options outstanding:
Grant Date | Outstanding Options | Option Price | Expiration Date | |||
05/24/07 | 2,000 | $24.34 | 05/24/17 | |||
07/09/07 | 1,000 | $24.61 | 07/09/17 | |||
10/01/07 | 2,000 | $24.28 | 10/01/17 | |||
01/01/08 | 12,000 | $23.49 | 01/01/18 | |||
05/19/08 | 2,500 | $22.91 | 05/19/18 | |||
07/01/08 | 2,000 | $22.91 | 07/01/18 | |||
Options granted after March 31, 2006 generally vest 20% per year every year beginning in the sixth year after the grant date. These options may be exercised as they vest in years six through ten, or until the end of year ten after the grant date.
64
SECURITY FEDERAL CORPORATION AND SUBSIDIARIES
Notes to Consolidated Financial Statements
(17) Bank Owned Life Insurance
BOLI provides key person life insurance on certain officers of the Company. The cash value of the life insurance policies are recorded as a separate line item in the accompanying balance sheets at $17.1 million and $16.6 million at December 31, 2016 and 2015, respectively. The earnings portion of the insurance policies grows tax deferred and helps offset the cost of the Company’s benefits programs. The Company recorded earnings of $528,000, $423,000 and $300,000 for the growth in the cash value of life insurance during the years ended December 31, 2016, 2015 and 2014, respectively. There were no death benefits received during the year ended December 31, 2016.
(18) Commitments and Contingencies
In the ordinary course of business, the Company has various outstanding commitments and contingent liabilities that are not reflected in the accompanying consolidated financial statements. In addition, the Company is a defendant in certain claims and legal actions arising in the ordinary course of business. In the opinion of management, after consultation with legal counsel, the ultimate disposition of these matters is not expected to have a material adverse effect on the consolidated financial condition of the Company.
In conjunction with its lending activities, the Bank enters into various commitments to extend credit and issue letters of credit. Loan commitments (unfunded loans and unused lines of credit) and letters of credit are issued to accommodate the financing needs of the Bank's customers. Loan commitments are agreements by the Bank to lend at a future date, so long as there are no violations of any conditions established in the agreement. Letters of credit commit the Bank to make payments on behalf of customers when certain specified events occur.
Financial instruments where the contract amount represents the Bank's credit risk include commitments under pre-approved but unused lines of credit of $80.3 million and $51.2 million, undisbursed loans in process of $3.5 million and $2.9 million, and letters of credit of $570,000 and $882,000 at December 31, 2016 and 2015, respectively.
These loan and letter of credit commitments are subject to the same credit policies and reviews as loans on the balance sheet. Collateral, both the amount and nature, is obtained based upon management's assessment of the credit risk. Since many of the extensions of credit are expected to expire without being drawn, the total commitment amounts do not necessarily represent future cash requirements. Included in the loan commitments noted above were unused credit card loan commitments of $4.9 million and $4.6 million at December 31, 2016 and 2015, respectively. The Bank had $165,000 in outstanding commitments on mortgage loans not yet closed at December 31, 2016 compared to none at December 31, 2015. These commitments, which are funded subject to certain limitations, extend over varying periods of time with the majority being funded within 45 days. At December 31, 2016 and 2015, the Bank had outstanding commitments to sell approximately $4.2 million and $2.5 million of loans, respectively, which encompassed the Bank’s held for sale loans. The Bank also has commitments to sell mortgage loans not yet closed, on a best efforts basis. Best efforts means the Bank suffers no penalty if they are unable to deliver the loans to the potential buyers. The fair value of the Bank’s commitment to originate mortgage loans at committed interest rates and to sell such loans to permanent investors is insignificant.
65
SECURITY FEDERAL CORPORATION AND SUBSIDIARIES
Notes to Consolidated Financial Statements
(19) Related Party Transactions
Certain directors, executive officers and companies with which they are affiliated are customers of, and have banking transactions with, the Bank in the ordinary course of business. These loans were made on substantially the same terms, including interest rates and collateral, as those prevailing at the time for comparable arms-length transactions. A summary of loan transactions with directors, including their affiliates, and executive officers follows:
Years Ended December 31, | |||||||||||
2016 | 2015 | 2014 | |||||||||
Balance, Beginning of Period | $ | 181,738 | $ | 202,197 | $ | 230,722 | |||||
New Loans | 66,269 | 692 | 1,116 | ||||||||
Less Loan Payments | (106,035 | ) | (21,151 | ) | (29,641 | ) | |||||
Balance, End of Period | $ | 141,972 | $ | 181,738 | $ | 202,197 | |||||
Loans to all employees, officers, and directors of the Company, in the aggregate constituted approximately 4.9% and 3.3% of the Company’s total shareholders' equity at December 31, 2016 and 2015, respectively. Deposits from executive officers and directors of the Company and the Bank and their related interests were approximately $13.7 million at $15.1 million at December 31, 2016 and 2015 and have substantially the same terms, including interest rates, as those prevailing at the time with other non- related depositors.
The Company leased office space from a related party during the years ended December 31, 2016, 2015 and 2014. The lease is with a company in which the related party, who is both a director and an officer of the Company, has an ownership interest. The Company incurred rent expense of $81,000 for each of the years ended December 31, 2016, 2015 and 2014 related to this lease. Management is of the opinion that the transactions with respect to office rent were made on terms that are comparable to those which would be made with unaffiliated persons.
(20) Stock Issuance and Exchange
The Company was approved to participate in the Treasury’s Community Development Capital Initiative (“CDCI”) program. The CDCI was established by the Treasury under the Troubled Asset Relief Program to invest lower cost capital in Community Development Financial Institutions (“CDFI”), supporting their efforts to provide credit to small businesses and other qualified customers in connection with the downturn in the economy.
In connection with its participation in the CDCI, on September 29, 2010, the Company (i) exchanged all $18.0 million (aggregate liquidation preference amount) of its Fixed Rate Cumulative Perpetual Preferred Stock, Series A (“Series A Preferred Stock”), previously sold to the Treasury pursuant to the Capital Purchase Program ("CPP"), for $18.0 million (aggregate liquidation preference amount) of the Company’s newly designated Fixed Rate Cumulative Perpetual Preferred Stock, Series B (the “Series B Preferred Stock”), (ii) sold 400,000 shares of its common stock at $10.00 per share in a private offering to board members of the Company for aggregate gross proceeds of $4.0 million; and (iii) received an additional $4.0 million investment from the Treasury through the sale of an additional $4.0 million (aggregate liquidation preference amount) of its Series B Preferred Stock to the Treasury. The additional $4.0 million investment from the Treasury was contingent upon the Company’s completion of the $4.0 million separate stock offering for the same amount, as required by the Company’s primary regulator at the time, the Office of Thrift Supervision.
In conjunction with its participation in the CPP in 2008, the Company sold a warrant to the Treasury to purchase 137,966 shares of the Company’s common stock. The warrant had a 10-year term and was immediately exercisable upon issuance. The warrant remained outstanding after the exchange until its repurchase by the Company in 2013 at a fair market value of $50,000. As a result of the transaction, the warrant was canceled, which reduced warrants outstanding by $400,000 and increased additional paid in capital by $350,000.
66
SECURITY FEDERAL CORPORATION AND SUBSIDIARIES
Notes to Consolidated Financial Statements
(20) Stock Issuance and Exchange, Continued
Participation in the CDCI provided the Company with $8.0 million in additional capital and lowered the cost of the capital received from the Treasury. The annual dividend rate on the Series A Preferred Stock was 5% and was scheduled to increase to 9% on February 15, 2014. The annual dividend rate on the Series B Preferred Stock was 2% for the first eight years from the date of issuance, or until September 19, 2018, and 9% thereafter if still then outstanding. The annual dividend rate on the Series B Preferred Stock also could be increased if the Company and the Bank did not maintain eligibility as a CDFI under Treasury regulations.
On October 31, 2016, the Company repurchased all 22,000 shares of its Series B Preferred Stock from the Treasury for a repurchase amount of $21.3 million plus accrued interest of $93,000 for a total payment amount of $21.4 million. The repurchase was partially funded through cash on hand and a $14.0 million term loan from another financial institution. As a result of this transaction, the Company recognized $660,000 in net income available to common shareholders during the year ended December 31, 2016.
(21) Unvested Restricted Stock Issuance
On February 12 2015, the Company issued 1,473 shares of restricted stock at $17.22 per share to the Company’s Chief Executive Officer (“CEO”). The issuance was in lieu of annual incentive pay for the 2014 Incentive Plan year. Based on restrictions set forth in our agreement with Treasury as part of the Company’s participation in the CDCI program, the CEO is not permitted to receive cash incentive pay. The shares cliff vest at the end of two years. All dividends until that date are held in an escrow account. There were no shares of restricted stock issued by the Company during the year ended December 31, 2016 .
67
SECURITY FEDERAL CORPORATION AND SUBSIDIARIES
Notes to Consolidated Financial Statements
(22) Security Federal Corporation Condensed Financial Statements (Parent Company Only)
The following is condensed financial information of Security Federal Corporation (Parent Company only). The primary asset is its investment in the Bank subsidiary and the principal source of income for the Company is equity in undistributed earnings from the Bank.
Condensed Balance Sheet Data
December 31, | |||||||
2016 | 2015 | ||||||
Assets: | |||||||
Cash | $ | 4,631,554 | $ | 8,785,338 | |||
Investment Securities, Available For Sale | 213,000 | 154,902 | |||||
Investment in Security Federal Statutory Trust | 155,000 | 155,000 | |||||
Investment in Security Federal Bank | 90,441,110 | 93,150,771 | |||||
Accounts Receivable and Other Assets | 31,275 | 25,242 | |||||
Total Assets | $ | 95,471,939 | $ | 102,271,253 | |||
Liabilities and Shareholders’ Equity: | |||||||
Accounts Payable and Other Liabilities | $ | 121,965 | $ | 66,130 | |||
Note Payable | 13,000,000 | — | |||||
Junior Subordinated Debentures | 5,155,000 | 5,155,000 | |||||
Senior Convertible Debentures | 6,084,000 | 6,084,000 | |||||
Shareholders’ Equity | 71,110,974 | 90,966,123 | |||||
Total Liabilities and Shareholders’ Equity | $ | 95,471,939 | $ | 102,271,253 | |||
Condensed Statements of Income Data
Years Ended December 31, | |||||||||||
2016 | 2015 | 2014 | |||||||||
Income: | |||||||||||
Equity in Earnings of Security Federal Bank | $ | 410,959 | $ | 506,074 | $ | 3,779,212 | |||||
Dividend Income from Security Federal Bank | 6,000,000 | 6,000,000 | 2,400,000 | ||||||||
Miscellaneous Income | 21,530 | 15,828 | 12,937 | ||||||||
Total Income | 6,432,489 | 6,521,902 | 6,192,149 | ||||||||
Expenses: | |||||||||||
Interest Expense | 688,750 | 591,054 | 587,859 | ||||||||
Other Expenses | 69,603 | 18,822 | 19,382 | ||||||||
Total Expenses | 758,353 | 609,876 | 607,241 | ||||||||
Income Before Income Taxes | 5,674,136 | 5,912,026 | 5,584,908 | ||||||||
Income Tax Benefit | (250,520 | ) | (203,901 | ) | (225,832 | ) | |||||
Net Income | 5,924,656 | 6,115,927 | 5,810,740 | ||||||||
Preferred Stock Dividends | (422,889 | ) | (440,000 | ) | (440,000 | ) | |||||
Gain on Redemption of Preferred Stock | 660,000 | — | — | ||||||||
Net Income Available to Common Shareholders | $ | 6,161,767 | $ | 5,675,927 | $ | 5,370,740 | |||||
68
SECURITY FEDERAL CORPORATION AND SUBSIDIARIES
Notes to Consolidated Financial Statements
(22) Security Federal Corporation Condensed Financial Statements (Parent Company Only), Continued
Condensed Statements of Cash Flow Data
Years Ended December 31, | |||||||||||
2016 | 2015 | 2014 | |||||||||
Operating Activities: | |||||||||||
Net Income | $ | 5,924,656 | $ | 6,115,927 | $ | 5,810,740 | |||||
Adjustments to Reconcile Net Income to Net Cash Provided By Operating Activities: | |||||||||||
Equity in Earnings of Security Federal Bank | (410,959 | ) | (506,074 | ) | (3,779,212 | ) | |||||
Stock Compensation Expense | 7,912 | 12,676 | 12,676 | ||||||||
(Increase) Decrease in Accounts Receivable | 14,207 | 825 | (49 | ) | |||||||
Increase in Accounts Payable | 15,841 | 1,758 | 270 | ||||||||
Net Cash Provided By Operating Activities | 5,551,657 | 5,625,112 | 2,044,425 | ||||||||
Financing Activities: | |||||||||||
Redemption of Preferred Stock | (21,340,000 | ) | — | — | |||||||
Proceeds from Note Payable | 14,000,000 | — | — | ||||||||
Repayment of Note Payable | (1,000,000 | ) | — | — | |||||||
Dividends Paid to Shareholders-Preferred Stock | (422,889 | ) | (440,000 | ) | (440,000 | ) | |||||
Dividends Paid to Shareholders-Common Stock | (942,552 | ) | (942,552 | ) | (942,080 | ) | |||||
Net Cash Used in Financing Activities | (9,705,441 | ) | (1,382,552 | ) | (1,382,080 | ) | |||||
Net Increase (Decrease) in Cash | (4,153,784 | ) | 4,242,560 | 662,345 | |||||||
Cash at Beginning of Period | 8,785,338 | 4,542,778 | 3,880,433 | ||||||||
Cash at End of Period | $ | 4,631,554 | $ | 8,785,338 | $ | 4,542,778 | |||||
(23) Carrying Amounts and Fair Value of Financial Instruments
The Company has adopted accounting guidance which defines fair value, establishes a framework for measuring fair value and expands disclosures about fair value under generally accepted accounting principles. This guidance applies to reported balances that are required or permitted to be measured at fair value under existing accounting pronouncements; accordingly, the standard does not require any new fair value measurements of reported balances.
Accounting guidance emphasizes that fair value is a market-based measurement, not an entity-specific measurement. Therefore, a fair value measurement should be determined based on the assumptions that market participants would use in pricing the asset or liability. As a basis for considering market participant assumptions in fair value measurements, the guidance establishes a fair value hierarchy that distinguishes between market participant assumptions based on market data obtained from sources independent of the reporting entity (observable inputs that are classified within Levels 1 and 2 of the hierarchy) and the reporting entity’s own assumptions about market participant assumptions (unobservable inputs classified within Level 3 of the hierarchy).
69
SECURITY FEDERAL CORPORATION AND SUBSIDIARIES
Notes to Consolidated Financial Statements
(23) Carrying Amounts and Fair Value of Financial Instruments, Continued
Level 1 | Valuation is based upon quoted prices (unadjusted) in active markets for identical assets or liabilities that the Company has the ability to access. Level 1 assets and liabilities include debt and equity securities and derivative contracts that are traded in an active exchange market, as well as U.S. Treasuries and money market funds. |
Level 2 | Valuation is based upon quoted prices for similar assets and liabilities in active markets, as well as inputs that are observable for the asset or liability (other than quoted prices), such as interest rates, foreign exchange rates, and yield curves that are observable at commonly quoted intervals. Level 2 assets and liabilities include debt securities with quoted prices that are traded less frequently than exchange-traded instruments, mortgage-backed securities, municipal bonds, corporate debt securities and derivative contracts whose value is determined using a pricing model with inputs that are observable in the market or can be derived principally from or corroborated by observable market data. This category generally includes certain derivative contracts. |
Level 3 | Valuation is generated from model-based techniques that use at least one significant assumption based on unobservable inputs for the asset or liability, which are typically based on an entity’s own assumptions, as there is little, if any, related market activity. In instances where the determination of the fair value measurement is based on inputs from different levels of the fair value hierarchy, the level in the fair value hierarchy within which the entire fair value measurement falls is based on the lowest level input that is significant to the fair value measurement in its entirety. The assessment of the significance of a particular input to the fair value measurement in its entirety requires judgment, and considers factors specific to the asset or liability. |
The following is a description of the valuation methodologies used for assets and liabilities recorded at fair value.
Investment Securities Available for Sale
Investment securities available for sale are recorded at fair value on a recurring basis. At December 31, 2016, the Company’s investment portfolio was comprised of government and agency bonds, mortgage-backed securities issued by government agencies or GSEs, private label CMO mortgage-backed securities, municipal securities, and two equity investments. Fair value measurement is based upon prices obtained from third party pricing services that use independent pricing models which rely on a variety of factors including reported trades, broker/dealer quotes, benchmark yields, economic and industry events and other relevant market information. As such, these securities are classified as Level 2.
Mortgage Loans Held for Sale
The Company originates fixed rate residential loans on a servicing released basis in the secondary market. Loans closed but not yet settled with institutional investors, are carried in the Company’s loans held for sale portfolio. These loans are fixed rate residential loans that have been originated in the Company’s name and have closed. Virtually all of these loans have commitments to be purchased by investors and the majority of these loans were locked in by price with the investors on the same day or shortly thereafter that the loan was locked in with the Company’s customers. Therefore, these loans present very little market risk for the Company.
The Company usually delivers to, and receives funding from, the investor within 30 days. Commitments to sell these loans to the investor are considered derivative contracts and are sold to investors on a “best efforts" basis. The Company is not obligated to deliver a loan or pay a penalty if a loan is not delivered to the investor. As a result of the short-term nature of these derivative contracts, the fair value of the mortgage loans held for sale in most cases is the same as the value of the loan amount at its origination. These loans are classified as Level 2.
Impaired Loans
The Company does not record loans held for investment at fair value on a recurring basis. However, from time to time, a loan is considered impaired and an allowance for loan losses is established as necessary. Loans for which it is probable that payment of interest and principal will not be made in accordance with the contractual terms of the loan agreement are considered impaired. Once a loan is identified as individually impaired, management measures impairment.
70
SECURITY FEDERAL CORPORATION AND SUBSIDIARIES
Notes to Consolidated Financial Statements
(23) Carrying Amounts and Fair Value of Financial Instruments, Continued
Fair value is estimated using one of the following methods: fair value of the collateral less estimated costs to sell, discounted cash flows, or market value of the loan based on similar debt. The fair value of the collateral less estimated costs to sell is the most frequently used method. Typically, the Company reviews the most recent appraisal and if it is over 24 months old will request a new third party appraisal. Depending on the particular circumstances surrounding the loan, including the location of the collateral, the date of the most recent appraisal and the value of the collateral relative to the recorded investment in the loan, management may order an independent appraisal immediately or, in some instances, may elect to perform an internal analysis. Specifically as an example, in situations where the collateral on a nonperforming commercial real estate loan is out of the Company’s primary market area, management would typically order an independent appraisal immediately, at the earlier of the date the loan becomes nonperforming or immediately following the determination that the loan is impaired. However, as a second example, on a nonperforming commercial real estate loan where management is familiar with the property and surrounding areas and where the original appraisal value far exceeds the recorded investment in the loan, management may perform an internal analysis whereby the previous appraisal value would be reviewed and adjusted for current conditions including recent sales of similar properties in the area and any other relevant economic trends. These valuations are reviewed at a minimum on a quarterly basis.
Those impaired loans not requiring an allowance represent loans for which the fair value of the expected repayments or collateral exceed the recorded investments in such loans. At December 31, 2016, most of the total impaired loans were evaluated based on the fair value of the collateral. Impaired loans where an allowance is established based on the fair value of collateral require classification in the fair value hierarchy. The Company records impaired loans as nonrecurring Level 3.
As of December 31, 2016 and 2015, the recorded investment in impaired loans was $8.3 million and $12.6 million, respectively. The average recorded investment in impaired loans was $13.2 million for year ended December 31, 2016 and $13.1 million for the year ended December 31, 2015.
Foreclosed Assets
Foreclosed assets are adjusted to fair value upon transfer of the loans to foreclosed assets. Subsequently, foreclosed assets are carried at the lower of carrying value or fair value. Fair value is based upon independent market prices, appraised values of the collateral or management’s estimation of the value of the collateral less estimated selling costs. When the fair value of the collateral is based on an observable market price or a current appraised value, the Company records the foreclosed asset as nonrecurring Level 3. When an appraised value is not available or management determines the fair value of the collateral is further impaired below the appraised value and there is no observable market price, the Company records the asset as nonrecurring Level 3.
Assets measured at fair value on a recurring basis as of December 31, 2016 are summarized below.
Assets: | Quoted Market Price in Active Markets (Level 1) | Significant Other Observable Inputs (Level 2) | Significant Unobservable Inputs (Level 3) | ||||||||
FHLB Securities | $ | — | $ | 998,000 | $ | — | |||||
SBA Bonds | — | 101,906,059 | — | ||||||||
Tax Exempt Municipal Bonds | — | 71,535,149 | — | ||||||||
Taxable Municipal Bonds | — | 1,991,130 | — | ||||||||
Mortgage-Backed Securities | — | 185,261,091 | — | ||||||||
Equity Securities | — | 368,000 | — | ||||||||
Total | $ | — | $ | 362,059,429 | $ | — | |||||
71
SECURITY FEDERAL CORPORATION AND SUBSIDIARIES
Notes to Consolidated Financial Statements
(23) Carrying Amounts and Fair Value of Financial Instruments, Continued
Assets measured at fair value on a recurring basis as of December 31, 2015 are summarized below.
Assets: | Quoted Market Price In Active Markets (Level 1) | Significant Other Observable Inputs (Level 2) | Significant Unobservable Inputs (Level 3) | ||||||||
FHLB Securities | $ | — | $ | 1,932,088 | $ | — | |||||
FFCB Securities | — | 1,987,936 | — | ||||||||
FNMA Bonds | — | 1,004,331 | — | ||||||||
SBA Bonds | — | 111,416,782 | — | ||||||||
Tax Exempt Municipal Bonds | — | 76,065,619 | — | ||||||||
Mortgage-Backed Securities | — | 182,797,212 | — | ||||||||
Equity Securities | — | 309,902 | — | ||||||||
Total | $ | — | $ | 375,513,870 | $ | — | |||||
There were no liabilities measured at fair value on a recurring basis as of December 31, 2016 and 2015.
The Company may be required, from time to time, to measure certain assets at fair value on a nonrecurring basis. These include assets that are measured at the lower of cost or market that were recognized at fair value below cost at the end of the period. The table below presents assets and liabilities measured at fair value on a nonrecurring basis as of December 31, 2016 and 2015, aggregated by the level in the fair value hierarchy within which those measurements fall.
Assets: | Level 1 | Level 2 | Level 3 | December 31, 2016 | |||||||||||
Mortgage Loans Held For Sale | $ | — | $ | 4,243,907 | $ | — | $ | 4,243,907 | |||||||
Collateral Dependent Impaired Loans (1) | — | — | 8,313,745 | 8,313,745 | |||||||||||
Foreclosed Assets | — | — | 2,721,214 | 2,721,214 | |||||||||||
Total | $ | — | $ | 4,243,907 | $ | 11,034,959 | $ | 15,278,866 | |||||||
(1) IMPAIRED LOANS ARE REPORTED NET OF SPECIFIC RESERVES OF $14,289
Assets: | Level 1 | Level 2 | Level 3 | December 31, 2015 | |||||||||||
Mortgage Loans Held For Sale | $ | — | $ | 2,462,559 | $ | — | $ | 2,462,559 | |||||||
Collateral Dependent Impaired Loans (1) | — | — | 12,565,728 | 12,565,728 | |||||||||||
Foreclosed Assets | — | — | 4,361,411 | 4,361,411 | |||||||||||
Total | $ | — | $ | 2,462,559 | $ | 16,927,139 | $ | 19,389,698 | |||||||
(1) IMPAIRED LOANS ARE REPORTED NET OF SPECIFIC RESERVES OF $81,600
There were no liabilities measured at fair value on a nonrecurring basis as of December 31, 2016 and 2015.
72
SECURITY FEDERAL CORPORATION AND SUBSIDIARIES
Notes to Consolidated Financial Statements
(23) Carrying Amounts and Fair Value of Financial Instruments, Continued
For Level 3 assets and liabilities measured at fair value on a recurring or non-recurring basis, the significant unobservable inputs used in the fair value measurements were as follows as of December 31, 2016:
Valuation | Significant | ||||||||
Fair Value | Technique | Unobservable Inputs | Range | ||||||
Collateral Dependent Impaired Loans | $ | 8,313,745 | Appraised Value | Discount Rates/ Discounts to Appraised Values | 0% - 24% | ||||
Foreclosed Assets | $ | 2,721,214 | Appraised Value/Comparable Sales | Discount Rates/ Discounts to Appraised Values | 16% - 100% | ||||
For assets and liabilities not presented on the balance sheet at fair value, the following methods are used to determine fair value:
Cash and cash equivalents—The carrying amount of these financial instruments approximates fair value. All mature within 90 days and do not present unanticipated credit concerns.
Certificates of deposits with other banks—Fair value is based on market prices for similar assets.
Investment securities held to maturity—Securities held to maturity are valued at quoted market prices or dealer quotes.
Loans Receivable, Net—The fair value of loans are estimated by discounting the future cash flows using the current rates at which similar loans would be made to borrowers with similar credit ratings and for the same remaining maturities. As discount rates are based on current loan rates as well as management estimates, the fair values presented may not be indicative of the value negotiated in an actual sale.
FHLB Stock—The fair value approximates the carrying value.
Deposits—The fair value of demand deposits, savings accounts, and money market accounts is the amount payable on demand at the reporting date. The fair value of fixed-maturity certificates of deposits is estimated by discounting the future cash flows using rates currently offered for deposits of similar remaining maturities.
FHLB Advances—Fair value is estimated using discounted cash flows with current market rates for borrowings with similar terms.
Other Borrowed Money—The carrying value of these short term borrowings approximates fair value.
Note Payable—The carrying value of the note payable approximates fair value.
Senior Convertible Debentures— The fair value is estimated by discounting the future cash flows using the current rates at which similar debenture offerings with similar terms and maturities would be issued by similar institutions. As discount rates are based on current debenture rates as well as management estimates, the fair values presented may not be indicative of the value negotiated in an actual sale.
Junior Subordinated Debentures—The carrying value of junior subordinated debentures approximates fair value.
73
SECURITY FEDERAL CORPORATION AND SUBSIDIARIES
Notes to Consolidated Financial Statements
(23) Carrying Amounts and Fair Value of Financial Instruments, Continued
The following tables summarize the carrying value and estimated fair value of the Company’s financial instruments as of December 31, 2016 and 2015 presented in accordance with the applicable accounting guidance.
December 31, 2016 | |||||||||||||||||||
Carrying | Fair Value | ||||||||||||||||||
(In Thousands) | Amount | Total | Level 1 | Level 2 | Level 3 | ||||||||||||||
Financial Assets: | |||||||||||||||||||
Cash and Cash Equivalents | $ | 9,375 | $ | 9,375 | $ | 9,375 | $ | — | $ | — | |||||||||
Certificates of Deposits with Other Banks | 2,445 | 2,445 | — | 2,445 | — | ||||||||||||||
Investment and Mortgage-Backed Securities | 387,643 | 387,430 | — | 387,430 | — | ||||||||||||||
Loans Receivable, Net | 359,723 | 357,457 | — | — | 357,457 | ||||||||||||||
FHLB Stock | 2,777 | 2,777 | 2,777 | — | — | ||||||||||||||
Financial Liabilities: | |||||||||||||||||||
Deposits: | |||||||||||||||||||
Checking, Savings and Money Market Accounts | $ | 438,559 | $ | 438,559 | $ | 438,559 | $ | — | $ | — | |||||||||
Certificate Accounts | 215,545 | 214,149 | — | 214,149 | — | ||||||||||||||
Advances From FHLB | 48,395 | 48,153 | — | 48,153 | — | ||||||||||||||
Other Borrowed Money | 9,338 | 9,338 | 9,338 | — | — | ||||||||||||||
Note Payable | 13,000 | 13,000 | — | 13,000 | — | ||||||||||||||
Junior Subordinated Debentures | 5,155 | 5,155 | — | 5,155 | — | ||||||||||||||
Senior Convertible Debentures | 6,084 | 6,084 | — | 6,084 | — | ||||||||||||||
December 31, 2015 | |||||||||||||||||||
Carrying | Fair Value | ||||||||||||||||||
(In Thousands) | Amount | Total | Level 1 | Level 2 | Level 3 | ||||||||||||||
Financial Assets: | |||||||||||||||||||
Cash and Cash Equivalents | $ | 8,382 | $ | 8,382 | $ | 8,382 | $ | — | $ | — | |||||||||
Certificates of Deposits with Other Banks | 3,445 | 3,445 | — | 3,445 | — | ||||||||||||||
Investment and Mortgage-Backed Securities | 405,387 | 405,196 | — | 405,196 | — | ||||||||||||||
Loans Receivable, Net | 330,573 | 327,460 | — | — | 327,460 | ||||||||||||||
FHLB Stock | 2,215 | 2,215 | 2,215 | — | — | ||||||||||||||
Financial Liabilities: | |||||||||||||||||||
Deposits: | |||||||||||||||||||
Checking, Savings and Money Market Accounts | $ | 415,975 | $ | 415,975 | $ | 415,975 | $ | — | $ | — | |||||||||
Certificate Accounts | 236,122 | 235,476 | — | 235,476 | — | ||||||||||||||
Advances From FHLB | 34,640 | 35,676 | — | 35,676 | — | ||||||||||||||
Other Borrowed Money | 6,412 | 6,412 | 6,412 | — | — | ||||||||||||||
Junior Subordinated Debentures | 5,155 | 5,155 | — | 5,155 | — | ||||||||||||||
Senior Convertible Debentures | 6,084 | 6,084 | — | 6,084 | — | ||||||||||||||
At December 31, 2016, the Bank had $80.3 million of off-balance sheet financial commitments. These commitments are to originate loans and unused consumer lines of credit and credit card lines. Because these obligations are based on current market rates, if funded, the original principal is considered to be a reasonable estimate of fair value.
Fair value estimates are made on a specific date, based on relevant market data and information about the financial instrument. These estimates do not reflect any premium or discount that could result from offering for sale the Bank’s entire holdings of a particular financial instrument.
74
SECURITY FEDERAL CORPORATION AND SUBSIDIARIES
Notes to Consolidated Financial Statements
(23) Carrying Amounts and Fair Value of Financial Instruments, Continued
Because no active market exists for a significant portion of the Bank’s financial instruments, fair value estimates are based on judgments regarding future expected loss experience, current economic conditions, current interest rates and prepayment trends, risk characteristics of various financial instruments, and other factors. These estimates are subjective in nature and involve uncertainties and matters of significant judgment and therefore cannot be determined with precision. Changes in any of these assumptions used in calculating fair value would also significantly affect the estimates. Fair value estimates are based on existing on- and off-balance sheet financial instruments without attempting to estimate the value of anticipated future business and the value of assets and liabilities that are not considered financial instruments. For example, the Bank has significant assets and liabilities that are not considered financial assets or liabilities including deposit franchise values, loan servicing portfolios, deferred tax liabilities, and premises and equipment.
In addition, the tax ramifications related to the realization of the unrealized gains and losses can have a significant effect on fair value estimates and have not been considered in any of these estimates. The Company has used management’s best estimate of fair value on the above assumptions. Thus, the fair values presented may not be the amounts, which could be realized, in an immediate sale or settlement of the instrument. In addition, any income taxes or other expenses that would be incurred in an actual sale or settlement are not taken into consideration in the fair value presented.
(24) Quarterly Financial Data (Unaudited)
Unaudited condensed financial data by quarter for the years ended December 31, 2016 and 2015 is as follows (dollars, except per share data, in thousands):
Quarter ended | |||||||||||||||
3/31/2016 | 6/30/2016 | 9/30/2016 | 12/31/2016 | ||||||||||||
Interest Income | $ | 6,985 | $ | 7,173 | $ | 7,153 | $ | 7,077 | |||||||
Interest Expense | 919 | 868 | 805 | 924 | |||||||||||
Net Interest Income | 6,066 | 6,305 | 6,348 | 6,153 | |||||||||||
Provision for Loan Losses | — | — | — | 500 | |||||||||||
Net Interest Income After Provision for Loan Losses | 6,066 | 6,305 | 6,348 | 5,653 | |||||||||||
Non-interest Income | 1,828 | 1,464 | 1,781 | 1,328 | |||||||||||
Non-interest Expense | 5,536 | 5,693 | 5,694 | 6,004 | |||||||||||
Income Before Income Tax | 2,358 | 2,076 | 2,435 | 977 | |||||||||||
Provision for Income Taxes | 641 | 510 | 655 | 115 | |||||||||||
Net Income | 1,717 | 1,566 | 1,780 | 862 | |||||||||||
Preferred Stock Dividends | (110 | ) | (110 | ) | (110 | ) | (93 | ) | |||||||
Gain on Redemption of Preferred Stock | — | — | — | 660 | |||||||||||
Net Income Available to Common Shareholders | $ | 1,607 | $ | 1,456 | $ | 1,670 | $ | 1,429 | |||||||
Basic Net Income Per Common Share | $ | 0.55 | $ | 0.49 | $ | 0.57 | $ | 0.49 | |||||||
Diluted Net Income Per Common Share | $ | 0.52 | $ | 0.47 | $ | 0.54 | $ | 0.46 | |||||||
Basic Weighted Average Shares Outstanding | 2,944,001 | 2,944,001 | 2,944,001 | 2,944,001 | |||||||||||
Diluted Weighted Average Shares Outstanding | 3,248,442 | 3,248,444 | 3,248,526 | 3,248,790 | |||||||||||
75
SECURITY FEDERAL CORPORATION AND SUBSIDIARIES
Notes to Consolidated Financial Statements
(24) Quarterly Financial Data (Unaudited), Continued
Quarter ended | |||||||||||||||
3/31/2015 | 6/30/2015 | 9/30/2015 | 12/31/2015 | ||||||||||||
Interest Income | $ | 6,949 | $ | 7,066 | $ | 6,908 | $ | 6,983 | |||||||
Interest Expense | 1,173 | 1,068 | 1,001 | 957 | |||||||||||
Net Interest Income | 5,776 | 5,998 | 5,907 | 6,026 | |||||||||||
Provision For Loan Losses | 100 | — | (200 | ) | 100 | ||||||||||
Net Interest Income After Provision for Loan Losses | 5,676 | 5,998 | 6,107 | 5,926 | |||||||||||
Non-interest Income | 2,651 | 1,387 | 1,369 | 1,600 | |||||||||||
Non-interest Expense | 6,255 | 5,335 | 5,130 | 5,811 | |||||||||||
Income Before Income Tax | 2,072 | 2,050 | 2,346 | 1,715 | |||||||||||
Provision For Income taxes | 567 | 527 | 601 | 371 | |||||||||||
Net Income | 1,505 | 1,523 | 1,745 | 1,344 | |||||||||||
Preferred Stock Dividends | 110 | 110 | 110 | 110 | |||||||||||
Net Income Available to Common Shareholders | $ | 1,395 | $ | 1,413 | $ | 1,635 | $ | 1,234 | |||||||
Basic Net Income Per Common Share | $ | 0.47 | $ | 0.48 | $ | 0.56 | $ | 0.42 | |||||||
Diluted Net Income Per Common Share | $ | 0.45 | $ | 0.46 | $ | 0.53 | $ | 0.40 | |||||||
Basic Weighted Average Shares Outstanding | 2,944,001 | 2,944,001 | 2,944,001 | 2,944,001 | |||||||||||
Diluted Weighted Average Shares Outstanding | 3,248,230 | 3,248,249 | 3,248,361 | 3,248,415 | |||||||||||
(25) Subsequent Events
Subsequent events are events or transactions that occur after the balance sheet date but before financial statements are issued. Recognized subsequent events are events or transactions that provide additional evidence about conditions that existed at the date of the balance sheet, including estimates inherent in the process of preparing financial statements. Nonrecognized subsequent events are events that provide evidence about conditions that did not exist at the date of the balance sheet but arose after that date. Management has reviewed all events occurring through the date the financial statements were available to be issued and determined that there were no subsequent events that required disclosure.
76
SHAREHOLDERS INFORMATION
ANNUAL MEETING
The annual meeting of shareholders will be held at 11:00 a.m. on Thursday, April 20, 2017 at Newberry Hall, 117 Newberry Street SW, Aiken, South Carolina.
STOCK LISTING
The Company’s stock is traded on the Over-The-Counter-Bulletin Board under the symbol “SFDL.OB.” The stock began trading on the Bulletin Board in October 2003.
PRICE RANGE OF COMMON STOCK
The table below shows the range of high and low bid prices. These prices represent actual transactions and do not include retail markups, markdowns or commissions.
High | Low | |||
Year Ended December 31, 2015 | ||||
03/31/2015 | $17.85 | $17.40 | ||
06/30/2015 | $18.20 | $17.42 | ||
09/30/2015 | $20.00 | $18.90 | ||
12/31/2015 | $22.00 | $19.00 | ||
Year Ended December 31, 2016 | ||||
03/31/2016 | $21.25 | $20.00 | ||
06/30/2016 | $21.24 | $20.00 | ||
09/30/2016 | $23.25 | $20.41 | ||
12/31/2016 | $35.00 | $23.20 | ||
As of December 31, 2016, the Company had approximately 270 shareholders of record, not including shares held in street name, and 2,945,474 outstanding shares of common stock.
DIVIDENDS
The first quarterly dividend on the stock was paid to shareholders on March 15, 1991. Dividends will be paid upon the determination of the Board of Directors that such payment is consistent with the long-term interest of the Company. The factors affecting this determination include the Company’s current and projected earnings, operating results, financial condition, regulatory restrictions, future growth plans, and other relevant factors. The Company has paid $0.08 per share cash dividends each quarter since the first quarter of fiscal 2009.
The ability of the Company to pay dividends depends primarily on the ability of the Bank to pay dividends to the Company. The Bank may not declare or pay a cash dividend on its stock or repurchase shares of its stock if the offset thereof would be to cause its regulatory capital to be reduced below the amount required to meet applicable regulatory capital requirements. South Carolina banking regulations restrict the amount of dividends that the Bank can pay to the Company, and may require prior approval before declaration and payment of any excess dividend. Unlike the Bank, there is no regulatory restriction on the payment of dividends by the Company; however, it is subject to the requirements of South Carolina law. South Carolina law generally prohibits the Company from paying dividends if, after giving effect to a proposed dividend: (1) the Company would be unable to pay its debts as they become due in the normal course of business, or (2) the Company’s total assets would be less than its total liabilities plus the sum that would be needed to satisfy the preferential rights upon dissolution of shareholders whose preferential rights are superior to those receiving the dividend. The Federal Reserve also has the authority to prohibit the Company from paying a dividend on its common and/or preferred stock. See Note 20 of the Notes to the Consolidated Financial Statements included herein for additional information.
CODE OF ETHICS
A copy of the Company’s Code of Ethics may be obtained at the Company’s Internet website at www.securityfederalbank.com.
77