Attached files
| file | filename |
|---|---|
| EX-99.1 - EXHIBIT 99.1 - TerraVia Holdings, Inc. | tvia201610kex991.htm |
| EX-32.1 - EXHIBIT 32.1 - TerraVia Holdings, Inc. | tvia201610kex321.htm |
| EX-31.2 - EXHIBIT 31.2 - TerraVia Holdings, Inc. | tvia201610kex312.htm |
| EX-31.1 - EXHIBIT 31.1 - TerraVia Holdings, Inc. | tvia201610kex311.htm |
| EX-23.1 - EXHIBIT 23.1 - TerraVia Holdings, Inc. | tvia201610kex231.htm |
| EX-21.1 - EXHIBIT 21.1 - TerraVia Holdings, Inc. | tvia201610kex211.htm |
| EX-12.1 - EXHIBIT 12.1 - TerraVia Holdings, Inc. | tvia201610kex121.htm |
UNITED STATES
SECURITIES AND EXCHANGE COMMISSION
Washington, D.C. 20549
FORM 10-K
(Mark One)
x | ANNUAL REPORT PURSUANT TO SECTION 13 OR 15(d) OF THE SECURITIES EXCHANGE ACT OF 1934 |
For the fiscal year ended December 31, 2016
OR
¨ | TRANSITION REPORT PURSUANT TO SECTION 13 OR 15(d) OF THE SECURITIES EXCHANGE ACT OF 1934 |
For the Transition Period from to
Commission File Number: 001-35189
TerraVia Holdings, Inc.
(Exact name of Registrant as specified in its charter)
Delaware | 33-1077078 | |
(State or Other Jurisdiction of Incorporation or Organization) | (I.R.S. Employer Identification Number) | |
TerraVia Holdings, Inc.
225 Gateway Boulevard
South San Francisco, CA 94080
(650) 780-4777
(Address and telephone number principal executive offices)
Securities Registered Pursuant to Section 12(b) of the Exchange Act:
Title of Each Class: | Name of Each Exchange on which Registered: | |
Common Stock, par value $0.001 per share | The NASDAQ Global Select Market | |
Securities Registered Pursuant to Section 12(g) of the Exchange Act: None.
Indicate by check mark if the registrant is a well-known seasoned issuer, as defined in Rule 405 of the Securities Act. Yes ¨ No x
Indicate by check mark if the registrant is not required to file reports pursuant to Section 13 or Section 15(d) of the Exchange Act. Yes ¨ No x
Indicate by check mark whether the registrant (1) has filed all reports required to be filed by Section 13 or 15(d) of the Exchange Act during the preceding 12 months (or for such shorter period that the registrant was required to file such reports), and (2) has been subject to such filing requirements for the past 90 days. Yes x No ¨
Indicate by check mark whether the registrant has submitted electronically and posted on its corporate Web site, if any, every Interactive Data File required to be submitted and posted pursuant to Rule 405 of Regulation S-T (§232.405 of this chapter) during the preceding 12 months (or for such shorter period that the registrant was required to submit and post such files). Yes x No ¨
Indicate by check mark if disclosure of delinquent filers pursuant to Item 405 of Regulation S-K is not contained herein, and will not be contained, to the best of registrant’s knowledge, in definitive proxy or information statements incorporated by reference in Part III of this Form 10-K or any amendment to this Form 10-K. x
Indicate by check mark whether the registrant is a large accelerated filer, an accelerated filer, a non-accelerated filer or a smaller reporting company. See definitions of “large accelerated filer,” “accelerated filer” and “smaller reporting company” in Rule 12b-2 of the Exchange Act. (Check one.
Large accelerated filer | ¨ | Accelerated filer | x | |||
Non-accelerated filer | ¨ (Do not check if a smaller reporting company) | Smaller reporting company | ¨ | |||
Indicate by check mark whether the registrant is a shell company (as defined in Rule 12b-2 of the Exchange Act.): Yes ¨ No x
The aggregate market value of the registrant’s common stock, $0.001 par value, held by non-affiliates of the registrant as of June 30, 2016, the last business day of our second fiscal quarter, was approximately $204.1 million based on the closing sale price as reported on the Nasdaq Global Select Market.
As of March 1, 2017, there were 99,295,892 shares of the registrant’s common stock, par value $0.001 per share, outstanding.
Documents Incorporated by Reference
Portions of the registrant’s definitive proxy statement for its 2017 Annual Meeting of Stockholders are incorporated by reference into Part III hereof.
TerraVia Holdings, Inc.
Annual Report on Form 10-K
For The Year Ended December 31, 2016
INDEX
PART I | ||||
Item 1 | — | |||
Item 1A | — | |||
Item 1B | — | |||
Item 2 | — | |||
Item 3 | — | |||
Item 4 | — | |||
PART II | ||||
Item 5 | — | |||
Item 6 | — | |||
Item 7 | — | |||
Item 7A | — | |||
Item 8 | — | |||
Item 9 | — | |||
Item 9A | — | |||
Item 9B | — | |||
PART III | ||||
Item 10 | — | |||
Item 11 | — | |||
Item 12 | — | |||
Item 13 | — | |||
Item 14 | — | |||
PART IV | ||||
Item 15 | — | |||
Our registered trademarks include Solazyme®, Thrive®, Encapso®, AlgaVia® and AlgaWise®. This Annual Report on Form 10-K also contains trademarks, service marks and trade names owned by us as well as others.
2
The following discussion and analysis should be read together with our audited consolidated financial statements and the related notes and other financial information appearing elsewhere in this Annual Report on Form 10-K. This Annual Report on Form 10-K contains forward-looking statements reflecting our current expectations and involves risks and uncertainties. In some cases, you can identify forward-looking statements by terminology such as “may,” “will,” “should,” “expect,” “plan,” “anticipate,” “believe,” “estimate,” “predict,” “intend,” “potential” or “continue” or the negative of these terms or other comparable terminology. For example, statements regarding our expectations as to future financial performance, expense levels, future manufacturing capacity, addressable market size, target average selling prices and liquidity sources are forward-looking statements. Our actual results and the timing of events may differ materially from those discussed in our forward-looking statements as a result of various factors, including those discussed below and those discussed in the section entitled “Risk Factors” included in this Annual Report on Form 10-K and in our other filings with the Securities and Exchange Commission (SEC).
PART I
Item 1. Business
Our Company
TerraVia is a food, nutrition and specialty ingredients company that harnesses the power of algae, the origin of all plants. We produce high-value oils, specialty fats and powdered ingredients utilizing our leading microalgae-based innovation platform, which we believe offers the unique opportunity to transform our food system by bringing together better nutrition and great taste, along with economic and environmental sustainability. We believe our solutions can enable our customers to improve product performance and nutrition, reduce processing costs and/or improve their products’ sustainability profile.
We have spent over a decade unlocking the power of algae to find and develop valuable oils and powdered ingredients that offer sustainable and healthy solutions to improve the lives of people and the planet. The customized compositions of our oils, powdered ingredients and other algae-derived products help to address specific market and customer needs, offering superior performance characteristics and value. We have developed and are commercializing a number of products for food, nutrition and specialty ingredients. For example:
• | Our AlgaPrime™ DHA ingredient, introduced in early 2016, is a sustainable, omega-3 rich algae ingredient that helps to address the growing global demand for omega-3s. Our initial focus for AlgaPrime™ DHA is in the markets of aquaculture, pet and animal nutrition. We intend to ultimately market this across the food and nutrition markets with our partner Bunge. |
• | Our AlgaVia® whole food ingredients help to address the growing market demand for healthy plant based foods. Our Lipid Rich Whole Algae delivers a nutritious oil in powdered form and can replace dairy fats and eggs in food products providing food and beverage customers with the opportunity for an improved nutritional profile, a reduction in food allergens, with improved or maintained taste and texture. Our Protein Rich Whole Algae offers a vegan source of quality protein with the added benefits of insoluble fiber, good fats and micronutrients such as lutein and zeaxanthin. |
• | Our AlgaWise® ingredients can replace or improve upon conventional vegetable oils or specialty fats in major markets by providing customers with the opportunity for better nutrition and improved sustainability profiles. Our first commercially available AlgaWise® oil is high in monounsaturated fats and low saturated and polyunsaturated fat content, which offers strong nutritional benefits and the improved culinary benefits of higher stability and smoke point. Today, we primarily sell this oil as Thrive® Culinary Algae Oil. |
• | Our AlgaPur™ specialty oil ingredients are important to strategic customers in meeting their product requirements, specifically by improving their product performance and supply chains, and helping to meet their global sustainability goals. |
Market Need
Increasing global demand for healthy and sustainable oils and fats as well as plant-based protein sources, amplified by the need for improved nutritional and ecological alternatives in existing supply chains, is driving the market need for new alternatives to incumbent food and specialty ingredients throughout the world.
3
We believe urbanization, improved living standards, and changing diets are consumer forces that will drive demand for our food, nutrition and specialty ingredient products. As the global population continues to grow, we expect an increase in demand for healthier oils and fats that are sustainably and economically produced. In addition, the problems of heart health, obesity, diabetes and protein deficiencies are increasingly impacting many global sub-populations. Faced with increasing pressure from consumers to improve the nutritional profile of food and beverage products, governments and manufacturers are increasingly looking for innovation and new food ingredient solutions that better enable reductions in saturated fat, calories, and cholesterol without compromising performance, taste or cost.
The improvement of living standards globally is also driving increased consumption of proteins. Many Western consumers consider protein consumption to be an effective strategy for weight and energy management. The environmental impact of addressing the increased demand for protein is important. Animal-derived proteins have a significant impact on land use, deforestation and greenhouse gas emissions. To address this demand for protein, food and beverage manufacturers are looking for new, efficiently-produced plant-based sources of protein.
Global growth in the consumption of omega-3 fatty acids for nutrition has increased dramatically, and we believe this increase is driven in large part by the important role these nutrients play in human health. Consumer demand for foods rich in omega-3s and through dietary supplements is also changing the landscape in how manufacturers, suppliers and marketers are bringing omega-3s to market. Increasing demand is placing pressure on the ocean’s supply of fish for fish oil - the most abundant source of omega-3s today. Algae is an original source of omega-3s for fish oil, and global market participants are rapidly recognizing the value in algae as part of an innovative, scalable and sustainable solution to meet the increasing consumer demand for foods rich in omega-3s.
Initiatives focused on fulfillment of corporate sustainability objectives and government mandates also support an increased use of renewable oils and sustainable ingredients. The ongoing demand to improve the sustainability footprint of supply chains across the globe are being driven by not only social and political drivers, but also the need to improve the overall environmental impacts that originate from increased raw material needs. The ability to convert sustainable carbohydrate-rich plant materials into unique high-value oils and materials offers a solution to global demand for a range of products.
Our Strategy
We intend to be a global market leader delivering much needed innovation and sustainability to food, nutrition and specialty ingredients through the use of microalgae. The principal elements of our strategy are:
• | Prioritize Food, Nutrition and Specialty Ingredients. We intend to focus on high-value food, nutrition and specialty products that generate attractive margins in our target markets while we continue to scale operations at our manufacturing facilities. We have spent over a decade building a leading innovation platform for food and specialty ingredients, obtaining critical regulatory clearance for our core products, producing at commercial scale and validating our products with customers and consumers. All of these efforts align with our goal to capitalize on market demand for more nutritious oils and healthier ingredients during a time when the key trends of plant-based eating and enhanced nutrition are accelerating. |
• | Execute on our customer-driven approach to technology and product development. We will continue to work closely with our partners and customers to understand their requirements and design products to specifically address their needs. It is our intent to provide both branded and unbranded products within food applications that include an AlgaPrime™ DHA omega-3 rich ingredient, AlgaVia® protein and lipid-rich powders, AlgaWise® food oils and AlgaPur™ specialty oils for personal care. |
• | Enter into additional partnership agreements to advance commercialization efforts. We are currently engaged in development activities with multiple partners in food, nutrition and specialty ingredients. In addition to funding development work and performing application testing, we expect that our partners will enter into long-term commercial supply or distribution agreements with us. It is our intent to leverage established supply chains to globally distribute our products rather than invest in and develop a stand-alone platform. |
• | Maximize return on manufacturing assets. We have brought large-scale manufacturing of our products online and have invested to establish our manufacturing footprint. This includes a wholly owned research and development facility for food ingredients and other new products in Peoria, Illinois (Peoria facility). It also includes the large commercial manufacturing facility in Brazil that was built with our joint venture partner, Bunge. |
4
Our Technology
Our process begins by selecting one of our microalgae strains to produce a specific oil or powder (whole algae products). Through fermentation, the microalgae convert plant sugars into the desired end product. Fermentation helps accelerate microalgae’s natural biological process, allowing us to produce large amounts of a desired product in a matter of days. After fermentation, the microalgae go through a few final steps depending on the product, such as drying or standard mechanical oil extraction (pressing), before being shipped to customers in a variety of end markets. Our technology platform enables us to produce a broad array of products and oil profiles with the same infrastructure.
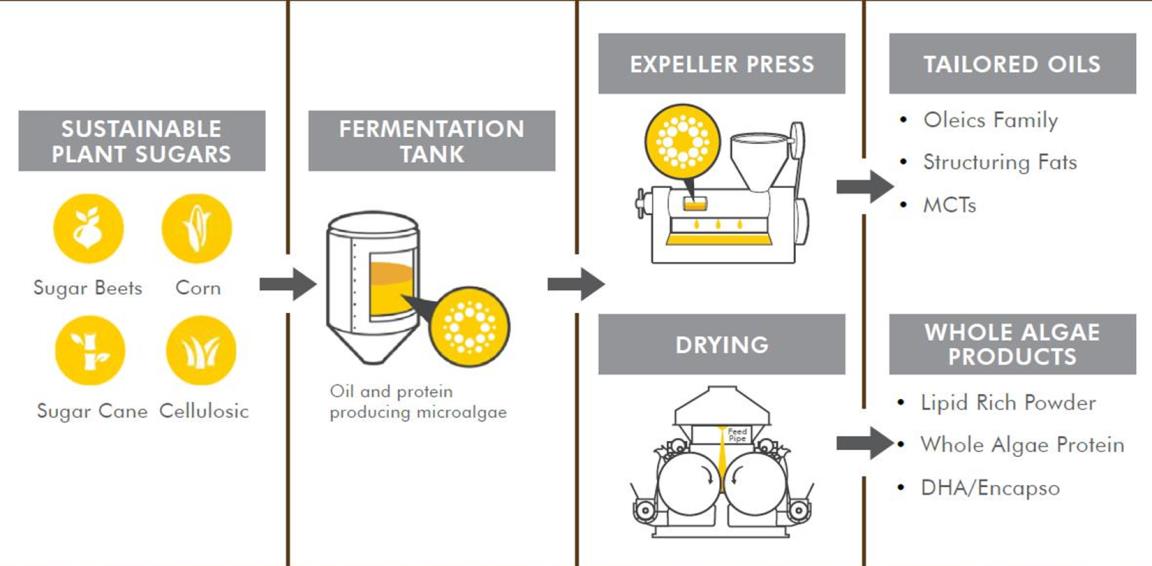
Our platform is feedstock flexible and can utilize a variety of renewable plant-based sugars. We currently use sugarcane-based sucrose and corn-based dextrose as our two primary feedstock sources. Our technology can also support sugar from other sustainable biomass sources including cellulosics, which may represent an important alternative feedstock in the future.
The controlled environment of our standard fermentation tanks helps enable product purity and allows us to tightly regulate acidity, temperature and other key parameters. Our core competencies include (1) identifying, isolating and further optimizing strains of microalgae to achieve high cell densities, high yields converting sugar to product and high time-based productivity rates compared to other alternatives, and (2) tailoring oil outputs to meet specific market needs.
Some of our oils and all of our whole algae products are made from native microalgae strains. These strains are selected through a rigorous screening process in which we look at thousands of microalgae strains, seeking properties that translate into product benefits for our customers.
When we seek to develop unique oils with significant health and performance benefits - for example, oil with a higher flash point to improve the performance of cooking oil or more nutritious oil with low levels of saturated fat, we apply the tools of biotechnology, including standard genetic engineering techniques, to the algae to develop these oils. These are tools that have been used for decades to generate important drugs, vitamins, foods, hygiene and household products that are broadly used and beneficial for people. We may introduce one or sometimes a few genes from a plant with desired properties, or we might make only modest changes to the microalgae’s existing genes, for example, by shutting off production of an undesired oil component.
5
We believe that the following advantages of our platform help us to offer new sources of high-value oil and powdered products aimed at addressing the major markets served by conventional oils:
• | Large and diverse market opportunities. Because we make oils, we can access vast markets currently served by petroleum, plant oils and animal fats. In addition, we make proteins, fibers, polysaccharides and micronutrients that are also broadly used in food, nutrition and specialty ingredients. |
• | Cost-competitive at commercial scale. We harness the innate characteristics of microalgae through a proven fermentation process in a controlled environment that we believe is able to produce large volumes of oil, proteins and other macro and micronutrients in a cost-effective, scalable and predictable manner. |
• | Rapid time to market. Our custom-designed oils can improve upon triglyceride oils currently used and can be integrated more quickly into our customers’ platforms because they are chemically similar to existing oils. Additionally, if a customer desires a novel oil profile, our development timelines for new profiles can be on a scale of several months to several years as opposed to timelines demonstrated with conventional oils from plants, which are typically on the scale of 10-15 years. |
Our Products
Our primary products are oils and fats, powdered ingredients, including proteins, lipids, fibers and micronutrients that are brought to market based on our proprietary technology platform. We have two distinct methods in which we recognize revenues associated with the commercial sales of our products; either directly through the Company or indirectly through Solazyme Bunge Renewable Oils Cooperatief U.A., (SB Oils JV).
We believe that for the intermediate term, the bulk of products sold based on technology will be produced at the SB Oils JV plant with the associated revenues recognized in the unconsolidated entity. Additionally, we have the right to manufacture certain products via a tolling arrangement with the SB Oils JV, to service fields outside those being pursued by the SB Oils JV.
Our products are sold into two main categories as: Food and Nutrition Products and Specialty Ingredients.
Food and Nutrition Products
• | AlgaPrime™ DHA is a source of omega-3s that helps to address the growing need for sustainable, omega-3s across a number of applications and markets. We started by addressing this need and are currently selling AlgaPrime™ DHA into the aquaculture industry, which uses over $3 billion worth of fish oil as the primary source of omega 3s. Usage of omega-3s in the aquaculture industry has been growing at a rate of approximately 10% per year over the last five years. Representing a step change to current industry solutions, our algae is grown in closed fermentation tanks in just days and offers consistent supply and quality to customers. The ability to provide supply chain resilience without the constraints of geography, seasonality and at a scale that is relevant to meet industry needs, is a solution that we believe can help to offset the depletion of small marine fish currently used to supply omega-3s. We believe the total addressable market for our AlgaPrime™ DHA ingredient is in excess of $3.0 billion annually. |
• | AlgaVia® Lipid Whole Algae (commonly known as whole algae flour) is a lipid-rich ingredient that can replace or reduce dairy fat, egg yolks and oil in recipes to reduce fat, cholesterol and calories with the added benefits of texture enhancement, water binding and flavor delivery. This is a new fat source that can enable the creation of healthier products with taste and texture similar to or better than foods made with conventional animal or vegetable oils. We believe the total addressable market for our lipid powders is greater than $2.5 billion annually. |
• | AlgaVia® Protein Rich Whole Algae (commonly known as whole algae protein) is a vegan protein source that is free from known allergens, gluten-free and a sustainable source of high quality protein. This ingredient delivers protein along with a rich collection of fiber, lipids and micronutrients. The protein present in AlgaVia® protein is protected by the natural cell wall and enables protein fortification in challenging applications such as low pH beverages, dressings and crackers. We believe the total addressable market for our protein powders is greater than $8.0 billion annually. |
6
• | AlgaWise® Ultra Omega-9 Algae Oil is extremely stable, exhibits a high level of omega-9 fatty acid and contains one of the lowest levels of saturated fat and one of the highest levels of monounsaturated fat of any commercially available oil while having a neutral flavor and high smoke point. This oil provides exceptional stability in a wide range of applications such as for use in frying, baking, spreads, coatings, sauces, and dressings. Higher stability leads to lower systems costs overall and greater simplicity. It can also enable longer shelf life with fresher tasting products, longer fry life, and less polymerization in frying and baking. |
• | Thrive® Culinary Algae Oil, launched in 2015, has 75% less saturated fat than olive oil, contains the highest level of monounsaturated fat and low levels of saturated fats. This oil is commercially available at select retailers across the western U.S. and available online through amazon.com |
• | New Products: In addition to our products that are commercially available today, we have a pipeline of additional products we expect to launch in the food, nutrition and specialty ingredients markets in 2017 and 2018. Our next available commercial product is expected to be a new structuring fat, already identified as AlgaWise® Algae Butter, which is a palm-free, non-hydrogenated solution for bakery, spread and confectionery applications. |
Specialty Ingredients
• | AlgaPur™ line of algae oils is a range of specialty personal care oils including Capric, Lauric and Oleic-based oils that have improved characteristics, such as stability, sensory and hydration for skin and hair benefits. For example, Unilever is currently using our AlgaPur™ high lauric oil in certain of its soap brands. |
SB Oils Joint Venture
Since 2011, we have worked with Bunge to jointly develop oils, powders and biomass products from sugarcane feedstock. In April 2012, we and Bunge formed the SB Oils JV to build, own and operate the SB Oils JV plant. The SB Oils JV is 50.1% owned by us and 49.9% owned by Bunge (see Note 4 to our consolidated financial statements in item 8). We present the SB Oils JV financial operations in our results via equity method accounting and results are not consolidated with our operations.
The SB Oils JV has produced multiple unique products for commercial applications and market development. In late 2016, we and Bunge made an operating decision to narrow production focus on AlgaPrime™ DHA and AlgaPur™ oils for Unilever with the intent to establish consistent operations, lower costs, and demonstrate operational excellence. It is anticipated that the ongoing focus around these two product categories will help us to continue to: 1) demonstrate the production capabilities of the SB Oils JV plant and 2) drive improved financial performance.
Our Competitive Strengths
We harness the power of microalgae to develop and commercialize breakthrough products. Our key competitive advantages are:
• | Proprietary and innovative technology. We have made significant investments to protect the intellectual property and know-how related to our technology platform, including screening, classical strain development, targeted recombinant strain optimization, product and applications development and manufacturing capabilities. |
• | Premium pricing for custom-designed and unique products. We believe the enhanced value of our oils, powders, and other products as compared to conventional ingredients should garner premium pricing. Examples in food and nutrition applications include oils with low levels of polyunsaturates for improved shelf and frying life, structuring fats, like algae-based butter, providing specific melting profiles, and naturally encapsulated protein powders that can enable increased protein incorporation into foods. |
• | Technology proven at scale. We have operated our large-scale fermentations at multiple partner facilities since 2008 and now run our processes routinely in our 128,000 liter fermenters in the Peoria facility and 625,000 liter fermenters at the SB Oils JV plant. |
• | Established manufacturing capacity. In structuring our capacity and feedstock partnerships, we have deployed a capital efficient strategy to source low-cost financing and predictable feedstock with our partners. We have scaled up |
7
our technology platform and have successfully operated at lab (5-15 liter), pilot (600-1,000 liter) and commercial (up to 625,000 liter) fermenter scale.
• | Commercial products. We commenced commercial scale production of our renewable, custom-designed products in January 2014 in the United States and at the SB Oils JV plant in Brazil in May 2014. As of the end of 2016, we have focused commercial production at our SB Oils JV plant on a select portfolio of products, with supplemental powdered food product capabilities for AlgaVia® products and developmental oils centered at our Peoria facility. In addition to products commercially available today, we have a pipeline of additional high value products we expect to launch in the food, nutrition and specialty ingredients markets in 2017 and 2018. In 2016, we sold a majority interest our Algenist® business. |
• | Feedstock and target market flexibility. Our technology platform provides us with the flexibility to choose from among multiple feedstocks on the input side and multiple specific products (and markets) on the output side, while using the same standard fermentation equipment. A manufacturing facility utilizing a single given plant-based sugar feedstock can produce many different products. Our facilities can also produce those same products by processing a variety of plant-based sugar feedstock. This flexibility enables us to choose the optimal feedstock for any particular geography, while also enabling us to produce a variety of products at the same manufacturing facility. |
Significant Partners
Bunge. Since 2011, we have entered multiple Joint Development Agreements (JDAs) with Bunge to jointly develop microbe-derived oils, biomass, and explore the production of such oils and biomass from Brazilian sugarcane feedstock.
In April 2012, we and Bunge formed the SB Oils JV to build, own and operate the SB Oils JV plant, a commercial-scale renewable algae oils production facility adjacent to Bunge's Moema sugar mill in Brazil. Construction of the SB Oils JV plant commenced in the second quarter of 2012 and the SB Oils JV plant produced its first products on full-scale production lines in May 2014.
In October 2015, we and Bunge entered into an amended and restated joint venture agreement to expand the SB Oils JV to add worldwide focus on human food and animal nutrition. Also in October 2015, we and Bunge entered into an amended and restated development agreement under which we granted to the SB Oils JV a worldwide royalty-bearing, field-limited license to all of our technology that is necessary or useful for the manufacture of certain algae oil products. Concurrently with the entry into such agreement, we and SB Oils JV entered into two funded research programs targeted at completing the development of additional products for the SB Oils JV. Refer to Note 4 in the accompanying notes to the consolidated financial statements for further discussion on the SB Oils JV. On February 28, 2017, Bunge Limited filed its 2016 Annual Report on Form 10-K in which it reported equity investment impairment charges of $44 million in the fourth quarter of 2016 that included an impairment charge of Bunge’s equity investment in the SB Oils JV. See Note 4 to our consolidated financial statements to this 2016 Annual Report on Form 10-K for our analysis of our $42.4 million equity investment in the SB Oils JV.
Unilever. In March 2016, we entered into a multi-year global supply agreement with Unilever, which includes a broad portfolio of our algae oils for Unilever to purchase for use in personal care products. Production of these oils will take place at the SB Oils JV plant in Brazil and pricing terms are based upon variable production cost plus a defined contribution margin. The agreement contains certain minimum and maximum sales volumes and is subject to other terms and conditions.
In October 2011, we entered into a joint development agreement with Unilever, which expanded our current research and development efforts. In September 2015, we and Unilever extended this joint development agreement through September 30, 2017. In September 2013, we and Unilever entered into a commercial supply agreement for up to 10,000 MT of our algae oil. In May 2014, Unilever announced the initial introduction of our sustainable algal oil into one of its biggest soap brands, Lux.
Mitsui. We have an agreement with Mitsui & Co., Ltd. (Mitsui) relating to triglyceride oils for use primarily in the oleochemical industry. End use applications may include renewable, high-performance lubricants and other industrial products.
AkzoNobel. In May 2013, we entered into a joint development agreement with AkzoNobel targeting the development and commercial sales of triglyceride oils for use by AkzoNobel. Product development efforts began in the second half of 2013, and in July 2014 we entered into a research and development plan with AkzoNobel which extends through June 2017.
8
Tengram Capital Partners. In August 2016, we sold a majority interest in our Algenist® business to Tengram Capital Partners. TerraVia retained an ownership interest in Algenist of approximately 20% and expect to continue to supply ingredients formulated in the Algenist product line.
Manufacturing Operations
Our process is compatible with commercial-scale, widely-available fermentation and oil recovery equipment. We operate our lab and pilot fermentation and recovery equipment as scaled-down versions of our large commercial engineering designs, such as those used to perform development work under certain agreements with strategic partners and to fulfill commercial supply agreements with certain partners. This allows us to more easily scale up to larger fermentation vessels. Our existing manufacturing operations are as follows:
• | Our pilot plant in South San Francisco, California, with recovery operations capable of handling material from both 600 and 1,000 liter fermenters, enables us to produce samples of our algae oils for testing and optimization by our partners, as well as to test new process conditions at an intermediate scale. |
• | In 2012, we commissioned our Peoria Facility to perform research and product development activities as well as produce algae oil. The Peoria Facility has 128,000 liter production fermentation tanks and provides an important platform for continued work on feedstock flexibility and scaling of new algae oils into the marketplace. We have also modified our Peoria Facility to produce food ingredients in conjunction with market development activity. |
• | In May 2014, the SB Oils JV plant initiated its first commercial production utilizing full-scale production lines, including 625,000 liter production fermentation tanks. The SB Oils JV plant leverages our technology and Bunge’s sugarcane milling and natural oil processing capabilities to produce microalgae-based products. In addition, the SB Oils JV plant has been designed to be expanded for further production in line with market demand. The facility was constructed as part of our joint venture with Bunge, and was financed with essentially equal equity contributions from both Bunge and us and project financing from BNDES. The capital expenditure related to investments for the SB Oils JV plant was approved for financing through an 8-year loan from the Brazilian Development Bank (BNDES) at an average interest rate of approximately 4% per annum. |
• | We utilize contract manufacturing to assist in the production of certain products and we closely monitor and advise these contract manufacturers to maintain stringent quality standards for our products. |
Intellectual Property
Our success depends in part upon our ability to obtain and maintain intellectual property protection for our products and technologies, and to operate without infringing the proprietary rights of others. With respect to the former, our policy is to protect our proprietary position through filing for patent applications on inventions, filing for trademark protection on our product names and related materials and methods, and through trade secret protection when and where appropriate. We seek to avoid infringing the proprietary rights of others by: (1) monitoring patents and publications in our product areas; (2) monitoring the technological developments of others; and (3) evaluating and taking appropriate courses of action whenever we identify such developments.
As of December 31, 2016, we own over 60 issued U.S. patents, over 70 issued foreign patents and over 275 pending patent applications filed in the United States and in various foreign jurisdictions. The expiration dates of the issued patents are between 2024 and 2035. Patents that issue, if any, from our currently pending patent applications would be expected to expire twenty years from the date of filing. Our patents and patent applications are directed to compositions such as food products, custom oils, fuel products, DHA, chemicals, cosmetics, strains of microbes, and recombinant technologies; methods of manufacturing finished goods and raw materials; and methods of using our raw materials and products. We also protect our proprietary information by requiring our employees, consultants, contractors and other advisors to execute nondisclosure and assignment of invention agreements upon commencement of their respective employments or engagements. Agreements with our employees also prohibit them from bringing the proprietary rights of third parties to us. In addition, we protect our proprietary information through creating written obligations of confidentiality with outside parties who are exposed to confidential information. Where appropriate we also employ material transfer agreements governing the use, intellectual property rights, and transfer of materials such as custom oils when sending them to third parties for purposes such as integration into food applications or conversion into personal care products.
9
We believe that the creation, when possible and appropriate, of multiple, overlapping mechanisms and forms of protection will offer the possibility of broadest and longest proprietary positions for our products and technologies. It is possible that our current and future patents may be successfully challenged and/or invalidated in whole or in part. It is also possible that we may not obtain issued patents from our filed applications, and may not be able to obtain patents covering other inventions we seek to protect. Due to uncertainties inherent in prosecuting patent applications, some patent applications may be rejected and we may subsequently abandon them. We may also abandon applications when we determine that a product or method is no longer of interest. It is also possible that we may develop products or technologies that will not be patentable or that the patents of others will limit or preclude our ability to do business. In addition, any patent issued to us may provide us with little or no competitive advantage, in which case we may abandon such patent or license it to another entity.
Government Regulation
Our development and production processes involve the use, generation, handling, storage, transportation and disposal of hazardous chemicals and radioactive and biological materials. We are subject to a variety of environmental, health and safety, federal, state, local and international laws, regulations and permit requirements governing, among other matters, the use, generation, manufacture, transportation, storage, handling and disposal of these materials, in the U.S., Brazil and other countries where we intend to operate or may operate or sell our products in the future. These laws, regulations and permits can cause delays, require expensive fees, pollution control equipment, capital expenditures or operational changes to limit actual or potential impact of our operations on the environment.
We are also subject to regulation by the Occupational Safety and Health Administration (OSHA), the California and federal Environmental Protection Agency (EPA), and to regulation under the Toxic Substance Control Act (TSCA). OSHA, the California or federal EPA or other government agencies may adopt regulations that affect our research and development programs. In particular, our renewable chemical products may be subject to regulation by government agencies in our target markets. The EPA administers the requirements of the TSCA, which regulates the commercial use of chemicals. Before an entity can manufacture a chemical, it needs to determine whether that chemical is listed in the TSCA inventory. If the substance is listed, then manufacture can commence immediately. If not, then a pre-manufacture notice (PMN) must be filed with the EPA, which has 90 days to review it. Some of the products we produce or plan to produce are on the TSCA inventory, after successful PMN submissions and filed Notice of Commencements (NOC). Others are not yet listed. A similar program exists under the European Chemicals Agency (ECHA) called REACH. Under REACH, we are required to register some of our products with the ECHA, and this process could cause delays or involve significant costs.
The use of recombinant microbes like many of our microbial strains is subject to laws and regulations in many countries. In the U.S., the EPA regulates the commercial use of recombinant microbes as well as potential products from recombinant microbes. When used in an industrial process, our microalgae strains designed using recombinant technology may be considered new chemicals under TSCA, administered by the EPA. Our microalgae strains designed using recombinant technology will be required to comply with the EPA’s Microbial Commercial Activity Notice (MCAN) process and we have filed MCANs for strains of recombinant microalgae that we use for our chemicals business, which have been dropped from review. We have subsequently filed NOCs for dropped MCANs allowing commercial use of the microalgae in the U.S. In Brazil, engineered microbes are regulated by CTNBio. We have filed applications, and in the future may file additional applications, for approval from CTNBio to import and use engineered microbes in our Brazilian facilities for research and development purposes. In addition, we received several commercial approvals from CTNBio for one of our current microbial strains since October 2013. We expect to encounter regulations concerning engineered microbes in most if not all of the countries in which we may seek to make our chemical products, however, the scope and nature of these regulations will likely be different from country to country. In February 2014, CTNBio granted a CQB (Certificate of Quality in Biosafety) to the Solazyme Bunge JV Plant for activities including industrial production, import and export, disposal and storage of our key production organisms, allowing the Solazyme Bunge JV Plant to run strains without prior commercial approval, under controlled conditions.
The manufacture, sale and use of our foods products are regulated as food ingredients in the United States by the U.S Food and Drug Administration (FDA) under the federal Food, Drug, and Cosmetic Act. Food ingredients are broadly defined as any substance that may become a component, or otherwise affect the characteristics, of food. Food ingredients are regulated as food additives and must be approved through a formal Food Additive Petition (FAP) process or affirmed as substances generally recognized as safe, or GRAS. A substance can be listed or affirmed as GRAS by the FDA or self-affirmed by its manufacturer upon determination by independent qualified experts who generally agree that the substance is GRAS for a particular use. Although the FDA does not officially affirm the GRAS status of ingredients, it does review, at the notifier’s request, the notifier’s determination of ingredients’ GRAS status. FDA endeavors to respond to GRAS notices by issuing a letter that either does not question the basis of the notifier’s determination of GRAS status or concludes that the notice does not
10
provide a sufficient basis for a GRAS determination. Self-affirmation of GRAS status without FDA notification allows the marketing and sale of the ingredient, but reliance on self-affirmation alone may limit its marketability, as many food manufacturers require that the FDA issue a letter confirming that it does not question the notifier’s determination of GRAS status before such manufacturers will purchase food ingredients from third parties. We submitted a GRAS Notice to the FDA for our first algae oil in June 2011, and received a “No Questions” letter from the FDA in June 2012. A panel of qualified experts in the field of food toxicology has determined that an additional oleic algae oil, our second algae oil, is GRAS. We submitted a GRAS Notice for the oleic algae oil in July 2014, and received a “No Questions” letter from the FDA in February 2015. We submitted a GRAS Notice for whole algae flour in the third quarter of 2012 and received a “No Questions” letter from the FDA in June 2013. We also submitted a GRAS Notice for whole algae protein in June 2014 and received a “No Questions” letter from the FDA in December 2014.
Food ingredients that are not suitable for the GRAS affirmation process are regulated as food additives and require the submission of a food additive petition (FAP) to the FDA and the FDA’s approval prior to commercialization. The FAP process is generally expensive and time consuming, with approval, if secured, taking years. The petition must establish with reasonable certainty that the food additive is safe for its intended use at the level specified in the petition. If a food additive petition is submitted, the FDA may choose to reject the petition or deny any desired labeling claims. Furthermore, the FDA may require the establishment of regulations that necessitate costly and time-consuming compliance procedures. All products may also fall under the jurisdiction of the U.S. Department of Agriculture if the intended applications are for meat, dairy, organic or other specialty food areas.
The sale of ingredients for use in animal feed is regulated by agencies including the FDA Center for Veterinary Medicine, or CVM. CVM requirements for suitability must be met by providing data from studies.
Countries other than the U.S. also regulate the manufacture and sale of food, feed and chemical ingredients. Regulations vary substantially from country to country, and we will be required to comply with applicable regulations in each country in which we choose to market our ingredients. In February 2014, the Sao Paulo State Environmental Department granted a license to operate the Solazyme Bunge JV Plant, which was necessary to begin commercial production. We submitted a dossier for oleic algae oil to the Brazilian food safety agency ANVISA in the first quarter of 2014, and anticipate approval for use in foods in 2017. We received food approval from ANVISA with no restrictions for our whole algae flour in July 2015. We also received a Letter of No Objection from Health Canada for whole algae flour in February 2016 and whole algae protein in December 2016.
Employees
As of December 31, 2016, we had 124 full-time employees, excluding the employees of SB Oils. Our employees’ roles include research, process development, manufacturing, regulatory affairs, program management, finance, human resources, administration, sales and marketing and business development. None of our employees are covered by collective bargaining agreements and we consider relations with our employees to be good.
Investor Information
Our Annual Report on Form 10-K, Quarterly Reports on Form 10-Q, current reports on Form 8-K and any amendments to those reports are available free of charge on the Investor Relations section of our website at http://investors.terravia.com/sec.cfm as soon as reasonably practicable after they are electronically filed with or furnished to the Securities and Exchange Commission (SEC). The public may read and copy any materials filed us with the SEC at the SEC’s Public Reference Room at 100 F Street, NE, Room 1580, Washington, DC 20549. The public may obtain information on the operation of the Public Reference Room by calling the SEC at 1-800-SEC-0330. The SEC maintains an Internet site that contains reports, proxy and information statements and other information regarding issuers that file electronically with the SEC at http://www.sec.gov. Except as expressly set forth in this Annual Report on Form 10-K, the contents of these websites are not incorporated into, or otherwise to be regarded as part of this report.
11
Item 1A. | Risk Factors. |
You should carefully consider the risks and uncertainties described below before investing in our securities. Additional risks and uncertainties not presently known to us or that our management currently deems immaterial also may impair our business operations. If any of the risks described below were to occur, our business, financial condition, operating results, and cash flows could be materially adversely affected. In such an event, the trading price of our common stock could decline and you could lose all or part of your investment. In assessing these risks and uncertainties, you should also refer to the other information contained in this Report, including our consolidated financial statements and related notes. The risks and
uncertainties discussed below also include forward-looking statements, and our actual results may differ substantially from those discussed in these forward-looking statements. See Management’s Discussion and Analysis of Financial Condition and Results of Operations-Forward-Looking Statements.
Risks Related to Our Business and Industry
We have a limited operating history and have incurred significant losses to date, anticipate continuing to incur losses and may never achieve or sustain profitability.
We are an emerging growth company with a limited operating history. We only recently began commercializing our products. To date, a substantial portion of our revenues has consisted of funding from third party collaborative research agreements and government grants. We have generated only limited revenues from commercial sales, the majority of which have been derived from sales of our skin and personal care products through our Algenist business, which we sold to a third party in August 2016. We expect a significant portion of our future revenues to come from commercial sales in food, including aquaculture, nutrition, and specialty personal care ingredients.
We have incurred substantial net losses since our inception, including a net loss of $101.6 million during the year ended December 31, 2016. We expect these losses may continue as we ramp up our manufacturing capacity and build out our product pipeline. As of December 31, 2016, we had an accumulated deficit of $711.5 million. We expect to incur additional costs and expenses related to the continued development and expansion of our business, including research and development, the operation of our Peoria production facility, the ramp up and operation of the Solazyme Bunge Produtos Renováveis Ltda. (SB Oils) production facility (described below) and, potentially, other commercial facilities. As a result, our annual and quarterly operating losses may continue.
In April 2012, we entered into a Joint Venture Agreement with Bunge Global Innovation and certain of its affiliates (Bunge), forming Solazyme Bunge Renewable Oils Coöperatief U.A. (SB Oils JV) which wholly owns Solazyme Bunge Produtos Renováveis Ltda., which is doing business as SB Oils. We, along with our development and commercialization partners, will need to develop products successfully, cost effectively produce them in large quantities, and market and sell them profitably. If we fail to become profitable, or if we are unable to fund our continuing losses, we may be unable to continue our business operations. There can be no assurance that we will ever achieve or sustain profitability.
Our independent registered public accounting firm, Deloitte & Touche LLP, has included a going concern uncertainty explanatory paragraph in its Report of Independent Registered Public Accounting Firm issued to us in connection with this 2016 Annual Report on Form 10-K. Our business has not been generating sufficient cash flow from operations, and funds may not be available in an amount sufficient to enable us to pay our indebtedness, or to fund our other liquidity needs, and we could utilize our available financial resources sooner than we currently expect. We may not be able to raise sufficient additional funds on terms that are favorable to us, if at all. If we fail to raise adequate funds and continue to incur losses, we will not be able to fund our operations or continue our business as a going concern. For additional information, see Note 3 - Going Concern Uncertainty - of the notes to the consolidated financial statements.
We expect to require additional financing in the future and may not be able to obtain such financing on favorable terms, if at all, which could force us to delay, reduce or eliminate our research and development or commercialization activities.
To date, we have financed our operations primarily through our initial public offering, completed in June 2011, public and private placements of our equity and convertible debt securities, credit facilities, government grants and funding from strategic partners. In January 2013 we issued $125.0 million aggregate principal amount of convertible senior subordinated notes due 2018 (the 2018 Notes). The 2018 Notes bear interest at a rate of 6.00% per year, payable in cash semi-annually. In April 2014 we issued 5,750,000 shares of our common stock and $149.5 million aggregate principal amount of convertible senior subordinated notes due 2019 (the 2019 Notes). The 2019 Notes bear interest at a rate of 5.00% per year, payable in cash semi-annually. As of December 31, 2016, approximately $32.5 million aggregate principal amount of the 2018 Notes was outstanding and approximately $148.1 million aggregate principal amount of the 2019 Notes was outstanding. In March 2016, we issued $27,850,000 aggregate principal amount of our Series A Convertible Preferred Stock. The terms of our Series A Convertible Preferred Stock are described in Note 13 in the accompanying notes to our consolidated financial statements. In June 2016, we also entered into a loan and security agreement with SVB that provides for a $12.9 million letter of credit facility and supports the standby letter of credit issued by Silicon Valley Bank in April 2016 (SVB SLOC) in favor of Itaú Unibanco S.A (Itaú) in connection with the loan agreement entered into by SB Oils and the Brazilian Development Bank in February 2013 (JV BNDES Loan.)
We have sought to raise funds and to refinance our convertible notes but have been unsuccessful in such efforts to date. If we fail to do so, we may not be able to continue our operations as a going concern.
12
Some of our previous funding has come from government grants; however, our future ability to obtain government grants is uncertain due to the competitive bid process and other factors. In addition, we expect to raise additional funds through public or private debt or equity financings to meet our capital requirements, including our portion of joint venture funding requirements. For example, if SB Oils needs and is unable to secure additional financing, we will be required to fund our portion of SB Oils' capital requirements from existing sources or seek additional financing. In addition, our working capital requirements and the working capital requirements of SB Oils may increase as we and SB Oils each increase production due to an increase in inventory and the manufacture of out-of-specification product during the ramp-up of commercial production. Furthermore, Bunge has been providing working capital to SB Oils through a revolving loan facility that matures on April 2, 2017. If Bunge does not extend the maturity date of the revolving loan facility, then SB Oils would need to find alternative sources of financing. SB Oils may not be able to obtain such financing on favorable terms, or at all, which may lead to increased equity investments in the SB Oils JV by TerraVia and Bunge.
Our independent registered public accounting firm, Deloitte & Touche LLP, has included a going concern uncertainty explanatory paragraph in its Report of Independent Registered Public Accounting Firm issued to us in connection with this 2016 Annual Report on Form 10-K. Our business has not been generating sufficient cash flow from operations, and funds may not be available in an amount sufficient to enable us to pay our indebtedness, or to fund our other liquidity needs, and we could utilize our available financial resources sooner than we currently expect. We may not be able to raise sufficient additional funds on terms that are favorable to us, if at all. If we fail to raise adequate funds and continue to incur losses, we will not be able to fund our operations or continue our business as a going concern. For additional information, see Note 3 - Going Concern Uncertainty - of the notes to the consolidated financial statements.
Servicing our debt requires a significant amount of cash, and we may not have sufficient cash flow from our business to pay amounts due under our indebtedness.
As of December 31, 2016, our total consolidated indebtedness was $180.6 million. Of our $180.6 million of indebtedness, none is currently secured. We ended 2016 with a cash and marketable securities balance of $64.0 million. The 2019 Notes mature on October 1, 2019 and the 2018 Notes mature on February 1, 2018. We also may be required to provide a corporate guarantee with respect to the portion of the JV BNDES loan that, when added to our bank guarantee, does not exceed our percentage ownership in the SB Oils JV.
Our ability to make scheduled payments of the principal of, to pay interest on or to refinance our indebtedness, including the 2018 Notes and the 2019 Notes, depends on our future performance, which is subject to economic, financial, competitive and other factors beyond our control. Our business may not continue to generate cash flow from operations in the future sufficient to service our debt and make necessary capital expenditures. If we are unable to generate such cash flow, we may be required to adopt one or more alternatives, such as selling assets, restructuring debt or obtaining additional equity capital on terms that may be onerous or highly dilutive. Our ability to refinance our indebtedness will depend on the capital markets and our financial condition at such time. We may not be able to engage in any of these activities or engage in these activities on desirable terms, which could result in a default on our debt obligations.
We have generated limited revenues from the sale of our products, and our business may fail if we are not able to successfully commercialize these products.
We have had only limited product revenues to date, with historic positive gross margins principally derived from the commercial sale of skin and personal care products through our Algenist business, which we sold to a third party in August 2016, and negative gross margins on certain other commercial product sales. Sales of our ingredients and other products have not historically generated positive gross margins. If we are not successful in replacing sales of Algenist products with sales of our other products at acceptable prices, further advancing our existing commercial arrangements with strategic partners, developing new arrangements, ramping up or otherwise increasing our manufacturing capacity and securing reliable access to sufficient volumes of low-cost feedstock, we will be unable to generate meaningful revenues from our products. We are subject to the substantial risk of failure facing businesses seeking to develop products based on a new technology.
Certain factors that could, alone or in combination, prevent us from successfully commercializing our products include:
• | our ability to secure reliable access to sufficient volumes of low-cost feedstock; |
• | our ability to achieve commercial-scale production of our products on a cost-effective basis and in a timely manner; |
• | our ability to generate sufficient cash flows to fund our operations and continue as a going concern; |
• | our ability to secure consistent and reliable supplies of power and steam for production facilities; |
13
• | technical or operational challenges with our manufacturing processes or with development, scaling up or ramping production of new products that we are not able to overcome; |
• | our ability to consistently manufacture our products within specifications; |
• | our ability to establish and maintain successful relationships with development, feedstock, manufacturing and commercialization partners; |
• | our ability to gain market acceptance of our products with customers and maintain customer relationships; |
• | our ability to sell our products at an acceptable price; |
• | our ability to manage our growth; |
• | our ability to meet applicable regulatory requirements for the production, distribution and sale of our products and to comply with applicable laws and regulations; |
• | actions of direct and indirect competitors that may seek to enter the markets in which we expect to compete or that may seek to impose barriers to one or more markets that we intend to target; and |
• | public concerns about the ethical, legal, environmental and social ramifications of the use of targeted recombinant technology, land use and the potential diversion of resources from food production. |
The production of our microalgae-based products requires fermentable feedstock. The inability to obtain feedstock in sufficient quantities or in a timely and cost-effective manner may limit our ability to produce our products.
A critical component of the production of our microalgae-based products is access to feedstock in sufficient quantities and at an acceptable price to enable commercial production and sale. Other than as described below, we currently purchase feedstock, such as sugarcane-based sucrose and corn-based dextrose, for the production of our products at prevailing market prices.
We do not have any long-term supply agreements or other guaranteed access to feedstock other than for the supply of feedstock to SB Oils by our partner, Bunge, pursuant to our joint venture arrangement that includes a feedstock supply agreement. As we scale our production, we anticipate that the production of our microalgae-based products will require large volumes of feedstock, and we may not be able to contract with feedstock producers to secure sufficient quantities of feedstock at reasonable costs or at all. For example, sugarcane-based sucrose for the SB Oils production facility in Moema, Brazil is being provided by Bunge. Sugar and corn are traded as commodities and are subject to price volatility. While we may seek to manage our exposure to fluctuations in the price of sugar and corn-based dextrose by entering into hedging transactions directly or through our joint venture arrangement, we may not be successful in doing so. If we cannot access feedstock in the quantities we need at acceptable prices, we may not be able to successfully commercialize our food ingredients, including aquaculture, specialty personal care products and other products, and our business will suffer. If we do not succeed in entering into long-term supply contracts when necessary or successfully hedge against our exposure to fluctuations in the price of feedstock, our costs and profit margins may fluctuate from period to period as we will remain subject to prevailing market prices.
Although our plan is to enter into partnerships, such as the SB Oils JV, with feedstock providers to supply the feedstock necessary to produce our products, we cannot predict the future availability or price of such feedstock or be sure that our feedstock partners will be able to supply such feedstock in sufficient quantities or in a timely manner. The prices of feedstock depend on numerous factors outside of our or our partners’ control, including weather conditions, government programs and regulations, changes in global demand, rising or falling commodities and equities markets, and availability of credit to producers. Crop yields and sugar content depend on weather conditions such as rainfall and temperature. Variable weather conditions have historically caused volatility in feedstock crop prices due to crop failures or reduced harvests. For example, excessive rainfall can adversely affect the supply of feedstock available for the production of our products by reducing the sucrose content of feedstock and limiting growers’ ability to harvest. Crop disease and pestilence can also occur from time to time and can adversely affect feedstock crop growth, potentially rendering useless or unusable all or a substantial portion of affected harvests. The limited amount of time during which feedstock crops keep their sugar content after harvest poses a risk of spoilage. Also, the fact that many feedstock crops are not themselves traded commodities limits our ability to substitute supply in the event of such an occurrence. If our ability to obtain feedstock crops is adversely affected by these or other conditions, our ability to produce our products will be impaired, and our business will be adversely affected. In the near term we believe Brazilian sugarcane-based sucrose will be an important feedstock for us. Along with the risks described above, Brazilian sugarcane prices may also increase due to, among other things, changes in the criteria set by the Conselho dos
14
Produtores de Cana, Açúcar e Álcool (Council of Sugarcane, Sugar and Ethanol Producers), known as Consecana. Consecana is an industry association of producers of sugarcane, sugar and ethanol that sets market terms and prices for general supply, lease and partnership agreements and may change such prices and terms from time to time. Moreover, Brazil has a developed industry for producing ethanol from sugarcane, and if we have manufacturing operations in Brazil that do not have a partner providing the sugarcane feedstock, such as Bunge as part of the SB Oils JV, we will need to compete for sugarcane feedstock with ethanol producers. Such changes and competition could result in higher sugarcane prices and/or a significant decrease in the volume of sugarcane available for the production of our products, which could adversely affect our business and results of operations.
We have entered into joint venture arrangements with Bunge to produce microalgae-based products in Brazil using Bunge's sugarcane feedstock, and if we are not able to successfully execute our strategy under these arrangements in a timely manner, or at all, our business will be adversely affected.
SB Oils produces microalgae-based products in Brazil using our proprietary technology and sugarcane feedstock provided by Bunge. SB Oils' production facility is located adjacent to a sugarcane processing mill in Brazil that is owned by Bunge. SB Oils purchased the facility site from Bunge. The purchase of any additional land by SB Oils would be complex, subject to multiple approvals from governmental authorities and take time to complete. The construction of SB Oils' production facility began in June 2012, and the first commercial product from the SB Oils production facility was produced in the second quarter of 2014. Manufacturing operations and processes continue to be optimized as the facility is ramped up. In addition, we have entered into a series of research and development agreements with Bunge and with SB Oils to, among other things, develop additional products for SB Oils. The current funded projects extend through December 2018.
Due to the termination of certain contracts relating to third party manufacturing facilities in the United States, some customers that previously had received our products from such facilities may need to qualify products that are now to be produced at the SB Oils production facility. A failure by the products manufactured at the SB Oils production facility to qualify or otherwise meet the requirements of our customers would adversely affect our business.
Our pursuit of new product opportunities may not be technologically feasible or cost effective, which would limit our ability to expand our product line and sources of revenues.
We have committed, and intend to continue to commit, substantial resources, alone or with collaboration partners, to the development and analysis of new oils and other microalgae-based products by applying classical and recombinant technology to our microalgae strains. There is no guarantee that we will be successful in creating new oil profiles, or other microalgae-based products, that we, our customers, our partners or their customers desire. There are significant technological hurdles in successfully applying recombinant and other technology to microalgae, and if we are unsuccessful at developing microalgae strains that produce desirable oils and other microalgae-based products, the number and size of the markets we will be able to address will be limited, our expected profit margins could be reduced and the potential profitability of our business could be compromised.
The successful development of our business depends on our ability to efficiently and cost-effectively produce microalgae-based products at large commercial scale.
Two of the significant drivers of our production costs are the level of productivity and conversion yield of our microalgae strains. For example, with respect to oil, productivity is principally a function of the amount of oil that can be obtained from a given volume over a particular time period. Conversion yield refers to the amount of the desired oil that can be produced from a fixed amount of feedstock. We may not be able to meet our currently expected production cost profile as we ramp up large commercial manufacturing facilities. If we cannot do so, our business could be materially and adversely affected.
Production of both current and future oils and other microalgae-based products will require that our technology and processes be scalable from laboratory, pilot and demonstration projects to large commercial-scale production. We have limited experience constructing, ramping up or managing large, commercial-scale manufacturing facilities. We may not have identified all of the factors that could affect our manufacturing processes. Our technology may not perform as expected when applied at large commercial scale, or we may encounter operational challenges for which we are unable to identify a workable solution. For example, contamination in the production process, equipment failure or accidents, problems with consistent and reliable plant utilities, human error, issues arising from process modifications to reduce costs and adjust product specifications, and other similar challenges could decrease process efficiency, create delays and increase our costs. To date we have employed our technology using fermenters with a capacity of up to approximately 625,000 liters. However, we still need to demonstrate that we can reach our target cost structure, including the achievement of target yields and productivities at approximately 625,000 liter scale in Brazil. We may not be able to scale up our production in a timely manner, on commercially reasonable terms, or at
15
all. If we are unable to manufacture products at a large commercial scale, our ability to commercialize our technology will be adversely affected, and, with respect to any products that we do bring to market, we may not be able to achieve and maintain an acceptable production cost profile, which would adversely affect our ability to reach, maintain and increase the profitability of our business.
We rely in part on third parties for the production and processing of our products. If these parties do not produce and process our products at a satisfactory quality, in a timely manner, in sufficient quantities and at an acceptable cost, our development and commercialization efforts could be delayed or otherwise negatively impacted.
Other than our Peoria production facility, we do not wholly own facilities that can produce and process our products other than at small scale. As such, we rely, and we expect to continue to rely, at least partially, on third parties (including partners and contract manufacturers) for the production and processing of our products. We currently have only one manufacturing arrangement for large-scale commercial fermentation: an agreement for the manufacture of certain products by SB Oils pursuant to a joint venture arrangement. We also have the ability to do smaller-scale commercial fermentation at our Peoria production facility.
In addition, we have manufacturing agreements relating to other aspects of our production process. Our current and anticipated future dependence upon our partners and contract manufacturers for the production and processing of our products may adversely affect our ability to develop products on a timely and competitive basis. The failure of any of our counterparties, including SB Oils, to provide acceptable products at required volumes could delay the development and commercialization of our products or disrupt our operations or the operations of SB Oils. We or our partners will need to enter into additional agreements for the commercial development, manufacturing and sale of our products. There can be no assurance that we or our partners can do so on favorable terms, if at all. Even if we reach agreements with manufacturing partners to produce and process our products, initially the partners will be unfamiliar with our technology and production processes. We cannot be sure that the partners will have or develop the operational expertise needed to run the equipment and processes required to manufacture our products. Further, we may have limited control over the amount or timing of resources that any partner is able or willing to devote to production and processing of our products.
To date, our products have been produced and processed in quantities sufficient for our development work and initial commercial sales. Even if there is demand for our products at commercial scale, we or our partners may not be able to successfully increase the production capacity for any of our products in a timely or economic manner or at all. In addition, to the extent we are relying on contract manufacturers to produce and process our products, we cannot be sure that such contract manufacturers will have capacity available when we need their services, that they will be willing to dedicate a portion of their production and/or processing capacity to our products or that we will be able to reach acceptable price and other terms with them for the provision of their production and/or processing services. If we, our partners or our contract manufacturers are unable to increase the production capacity for a product when and as needed, the commercial launch of that product may be delayed, or there may be a shortage of supply, which could limit sales, cause us to lose customers and sales opportunities and impair the growth of our business.
In addition, if a production facility or the equipment in a production facility that produces and/or processes our products is significantly damaged, destroyed or otherwise becomes unavailable, we or our partners may be unable to replace the manufacturing capacity quickly or cost effectively. The inability to enter into manufacturing agreements, the damage or destruction of a production facility upon which we or our partners rely for manufacturing or any other delays in obtaining supply would delay or prevent us and/or our partners from further developing and commercializing our products.
We may experience significant delays and/or cost overruns in financing, designing, constructing and ramping up large commercial manufacturing facilities, which could result in harm to our business and prospects.
In order to meet our financial requirements for manufacturing facilities, we may have to raise additional funds and may be unable to do so in a timely manner, in sufficient amounts and on terms that are favorable to us, if at all. If we fail to raise sufficient funds, our ability to ramp up the SB Oils production facility or construct additional manufacturing facilities could be significantly limited. If this happens, we may be forced to delay the commercialization of our products and we will not be able to successfully execute our business plan, which would harm our business.
16
Manufacturing operations have begun at the SB Oils production facility adjacent to Bunge’s Moema sugarcane mill in Brazil. The first products from the SB Oils production facility were produced in the second quarter of 2014, and manufacturing operations at this facility are in the process of being optimized and ramped up. We do not expect this facility to reach target nameplate capacity in the near term as SB Oils continues to optimize manufacturing operations and focuses production on high margin products, and additional capital expenditures may be required to reach nameplate capacity depending on the product mix produced at the SB Oils production facility. Under the joint venture agreements, Bunge has agreed to provide feedstock as well as utility services to the SB Oils production facility. The production facility has experienced, and may continue to experience, intermittent interruptions of supply of power and steam from Bunge. Bunge and SB Oils have completed a number of power and steam improvement projects, including the construction of an electrical grid tie-in and the tie-in and activation of a second steam boiler. SB Oils continues to evaluate the performance of these projects and may take additional actions in the future to further improve power and steam reliability, if necessary. Without consistent and reliable supplies of power and steam to the production facility, production yields will be lower, the ramp up and optimization of the SB Oils production facility will be delayed, our costs will increase and our business and results of operations will be adversely affected.
In February 2013, SB Oils entered into the JV BNDES Loan for project financing. Funds borrowed under the loan agreement have supported the production facility in Brazil, including a portion of the construction costs of the facility. In April 2016, the SVB SLOC was issued in favor of Itaú to support a bank guarantee issued to BNDES by Itaú on our behalf in connection with the JV BNDES Loan. The SVB SLOC is supported by a $12.9 million letter of credit facility we entered into with Silicon Valley Bank in June 2016 (SVB Facility).
In addition to the bank guarantee, we may be required to provide a corporate guarantee of a portion of the JV BNDES Loan (in an amount that, when added to the amount supported by our bank guarantee, does not exceed our ownership percentage in the SB Oils JV). Negotiating the terms of the corporate guarantee documentation may take longer than anticipated and may contain terms that are not favorable to us. SB Oils may in the future seek additional financing and may not be able to raise sufficient additional funds on favorable terms, if at all. If SB Oils is unable to secure additional financing, we will be required to fund our portion of SB Oils' capital requirements either from existing sources or seek additional financing. SB Oils also purchased the facility site from Bunge. The purchase of any additional land by SB Oils would be complex, subject to multiple approvals of governmental authorities and take time to complete.
We may need to construct, or otherwise secure access to, and fund, additional capacity greater than what we currently have as we continue to commercialize our products. Some of our customers may ultimately require that we acquire access to additional production facilities in order to diversify our manufacturing base. In addition, we have limited experience in the management of manufacturing operations at large scale. We may not be successful in producing the amount and quality of oil or other microalgae-based products we anticipate in the production facilities and our results of operations may suffer as a result. We have limited experience producing our products at commercial scale, and we will not succeed if we cannot maintain or decrease our production costs and effectively scale our technology and manufacturing processes.
We face financial risk associated with ramping up production to reduce our per-unit production costs. To reduce per-unit production costs, we must increase production to achieve economies of scale. However, if we do not sell production output in a timely manner or in sufficient volumes at sufficient prices, our investment in production will harm our cash position and generate losses. Due to decreases in the prices of petroleum and certain plant oils, on which products competitive with our own depend, we have determined not to manufacture certain of our products because the production and sale of such products at a loss would adversely affect our business. Therefore, we expect the time required to ramp up the SB Oils production facility and to achieve positive cash flows at such facility will be more than we previously anticipated. Further delays would materially adversely affect our business.
Our transition to a food, including aquaculture, nutrition and specialty ingredients company may not go as planned.
In 2016, changed our name from Solazyme, Inc. to TerraVia Holdings, Inc. and sold Algenist, our skin care business, to a third party. We are focusing on the commercialization of food ingredients, consumer food brands, animal nutrition and specialty personal care ingredients. In connection with this transition, we plan to reallocate capital and management attention away from activities in industrial products, including fuels, chemicals and oil field services, and we are currently seeking strategic alternatives with respect to these businesses. We may not succeed in finding a strategic alternative that we believe appropriately values these businesses. We and our management may spend more resources than anticipated in evaluating strategic alternatives or continuing these businesses, which could negatively impact our overall business. Moreover, the minority interest we have in the Algenist business, which may not be successful, may lose some or all of its value.
17
If we fail to maintain and successfully manage our existing, or enter into new, strategic collaborations, we may not be able to develop and commercialize many of our products and achieve or sustain profitability.
Our ability to enter into, maintain and manage collaborations in our target markets is important to the success of our business. We currently have joint venture, research and development, supply and/or distribution agreements with various strategic partners. We currently rely on our partners, in part, for manufacturing, sales and marketing services and intend to continue to do so for the foreseeable future, and we intend to enter into other strategic collaborations to produce, market and sell other products we develop. However, we may not be successful in entering into collaborative arrangements with third parties for the production, sale and marketing of other products. Any failure to enter into collaborative arrangements on favorable terms could delay or hinder our ability to develop and commercialize our products and could increase our costs of development and commercialization.
In the food, animal nutrition and chemicals markets, we have entered into a joint venture arrangement with Bunge that is focused on the manufacture of products in Brazil and development agreements with various other partners. In addition, we have entered into a commercial supply agreement with Unilever for specialty personal care ingredients and with BioMar for use of AlgaPrime™ DHA in aquaculture. There can be no guarantee that we can successfully manage these strategic collaborations. Moreover, the exclusivity provisions of certain strategic arrangements limit our ability to commercialize our products outside of these arrangements.
Pursuant to the agreements described above and similar arrangements that we may enter into in the future, we may have limited or no control over the amount or timing of resources that any partner is able or willing to devote to our products or collaborative efforts. Any of our partners may fail to perform their obligations as expected. These partners may breach or terminate their agreements with us or otherwise fail to conduct their collaborative activities successfully and in a timely manner. Further, our partners may not develop products arising out of our arrangements or devote sufficient resources to the development, manufacture, marketing, or sale of our products. Dependence on collaborative arrangements will also subject us to other risks, including:
• | we may be required to relinquish important rights, including intellectual property, marketing and distribution rights; |
• | we may disagree with our partners as to rights to intellectual property we develop, or their research programs or commercialization activities; |
• | we may have lower revenues than if we were to market and distribute such products ourselves; |
• | a partner could separately develop and market a competing product either independently or in collaboration with others, including our competitors; |
• | a partner could divest assets that are critical to our or our joint venture’s operations to a third party that is less willing to cooperate with us or is less incentivized or able to manage such assets in a way that helps us achieve our operational and financial goals; |
• | our partners could become unable or less willing to expend their resources on research and development, commercialization efforts or the maintenance or supply of production services due to general market conditions, their financial condition or other circumstances beyond our control; |
• | we may be unable to manage multiple simultaneous partnerships or collaborations; and |
• | our partners may operate in countries where their operations could be adversely affected by changes in the local regulatory environment or by political unrest. |
Moreover, disagreements with a partner or former partner could develop, and any conflict with a partner or former partner could reduce our ability to enter into future collaboration agreements and negatively impact our relationships with one or more existing partners. If any of these events occurs, or if we fail to maintain our agreements with our partners, we may not be able to commercialize our existing and potential products, grow our business or generate sufficient revenues to support our operations. In addition, disagreements with a partner or former partner could result in disputes or litigation. Formal dispute resolution and litigation can require substantial time and resources, and the resolution of disputes and litigation may result in settlements or judgments that have a materially adverse impact on our results of operations or our financial condition. We are currently engaged in legal proceedings with our former partner Roquette Frères, S.A. (Roquette). For additional information regarding the Roquette proceedings, see Note 11 - Commitments and Contingencies of the notes to the consolidated financial statements.
18
Additionally, our business could be negatively impacted if any of our partners undergoes a change of control or were to otherwise assign the rights or obligations under any of our agreements to a competitor of ours or to a third party who is not willing to work with us on the same terms or commit the same resources as the current partner.
Our relationship with our strategic partner Bunge may not prove successful.
We have entered into a joint venture with Bunge that is focused on the production of certain microalgae-based products in Brazil. In connection with the establishment of SB Oils, we entered into a development agreement and other agreements with Bunge and SB Oils. Since originally establishing the SB Oils JV, we have expanded the products and fields in which the joint venture is operating.
Our ability to generate value from the SB Oils JV depends on, among other things, our ability to work cooperatively with Bunge and SB Oils for the commercialization of the products manufactured at the SB Oils production facility. We may not be able to do so. For example, under the joint venture agreements, Bunge has agreed to provide feedstock as well as utility services to the SB Oils production facility.
In addition, Bunge has announced that it is actively pursuing strategic alternatives for its Brazilian sugarcane business, which could involve the divestment, in whole or in part, of the assets of such business. While a new controlling entity would remain subject to the terms of the feedstock and utility supply agreements, that entity may be less willing to cooperate with us or SB Oils, which may adversely affect the development and commercialization of the products manufactured at the SB Oils production facility.
Moreover, in March 2017, the SB Oils JV's independent registered public accounting firm, Deloitte Touche Tohmatsu Auditores Independentes has included a going concern uncertainty explanatory paragraph in its Independent Auditors' Report issued to the SB Oils JV. The SB Oils JV's business has not been generating sufficient cash flow from operations, and funds may not be available in an amount sufficient to enable it to pay its indebtedness, or to fund other liquidity needs, and it could utilize its available financial resources sooner than it currently expects. The SB Oils JV may not be able to raise sufficient additional funds on terms that are favorable to it, if at all. If the SB Oils JV fails to raise adequate funds and continues to incur losses, it will not be able to fund its operations or continue its business as a going concern.
We and Bunge each provide various administrative services to SB Oils, and Bunge also provides working capital to SB Oils through a revolving loan facility that matures on April 2, 2017. If Bunge does not extend the maturity date of the revolving loan facility, then SB Oils would need to find alternative sources of financing. SB Oils may not be able to obtain such financing on favorable terms, or at all, which may lead to increased equity investments in the SB Oils JV by us and Bunge, which we may not be able to fund. If we are unable to fund our financial obligations under the SB Oils JV arrangements, then SB Oils may not be able to continue as a going concern and this would have a material adverse effect on each of our and SB Oils' financial condition and results of operations. Furthermore, Bunge does not have previous experience working with our technology, and we cannot be sure that SB Oils will be successful in commercializing its products. In addition, there may be delays or cost overruns in connection with the ramp up and optimization of the SB Oils production facility. There may also be delays in our negotiation of the corporate guarantee in connection with the JV BNDES Loan. In addition, we will be required to maintain the required license, granted by the São Paulo State Environmental Department, to operate the SB Oils production facility. Any negative event with respect to these issues would delay the development and commercialization of the products manufactured at the SB Oils production facility. Furthermore, the agreements governing our partnership are complex and cover a range of future activities, and disputes may arise between us and Bunge that could delay the ramp up of the SB Oils production facility, the expansion of SB Oils' production capacity and/or the development and commercialization of the products manufactured at the SB Oils production facility or cause the dissolution of the SB Oils JV. In addition, on February 28, 2017, Bunge Limited filed its 2016 Annual Report on Form 10-K in which it reported equity investment impairment charges of $44 million in the fourth quarter of 2016 that included an impairment charge of Bunge's equity investment in the SB Oils JV. See Note 4 to our consolidated financial statements to this 2016 Annual Report on Form 10-K for our analysis of our $42.4 million equity investment in the SB Oils JV.
Our joint venture with Roquette has been dissolved. We are currently in litigation with Roquette and we may have other disputes with Roquette related to the joint venture's business.
In 2010, we entered into a 50/50 joint venture with Roquette Frères, S.A. (Roquette). As part of this relationship, we and Roquette formed Solazyme Roquette Nutritionals, LLC (SRN) through which both we and Roquette agreed to pursue certain opportunities in microalgae-based products for the food, nutraceuticals and animal feed markets. In June 2013, we and Roquette agreed to dissolve SRN and in July 2013, SRN was dissolved. As a result of the dissolution, the joint venture and operating
19
agreement between us and Roquette, and the license agreement, whereby we licensed to SRN certain of our intellectual property, automatically terminated.
We and Roquette engaged in an arbitration proceeding concerning the proper assignment of the intellectual property of SRN. In February 2015 the arbitration panel awarded all such intellectual property to us, and this award was confirmed by the U.S. District Court for the District of Delaware in December 2015 and this confirmation was upheld by the U.S. Court of Appeals for the Third Circuit in December 2016. In addition, Roquette commenced two separate actions in the U.S. District Court for the District of Delaware for declarations that, among other things, the arbitrators exceeded their authority by failing to render a timely arbitration award and as a result any orders or awards issued by the arbitrators are void. Summary judgment in these matters requested by Roquette was denied by the U.S. District Court for the District of Delaware in December 2015. We have counterclaimed for damages for misappropriation of trade secrets and breach of contract. In turn Roquette has counterclaimed that we have misused certain Roquette trade secrets. The proceedings are ongoing. See Note 11 - Commitments and Contingencies of the notes to the consolidated financial statements for more information regarding our proceedings with Roquette. We cannot be sure that other disputes will not arise between us and Roquette related to the joint venture's business. Such disagreements and disputes are costly, time-consuming to resolve and distracting to our management.
Disputes regarding our intellectual property rights, and the rights of others (including Roquette) to manufacture and sell the products included in the SRN joint venture could delay or negatively impact our commercialization of products in the markets SRN was targeting. Any such disputes could be costly, time-consuming to resolve and distracting to our management. In addition, if our commercialization in these markets is delayed or unsuccessful, our financial results could be negatively impacted.
We cannot be sure that our products will meet necessary standards or be approved or accepted by customers in our target markets.
If we are unable to convince our potential customers or end users of our products that we are a reliable supplier, that our products are comparable or superior to the products that they currently use, or that the use of our products is otherwise beneficial to them, we will not be successful in entering our target markets and our business will be adversely affected.
In the food and nutrition market and in the animal nutrition market, our food ingredients and products will compete with oils and other food ingredients currently in use. Potential customers may not perceive a benefit to microalgae-based ingredients as compared to existing ingredients or may be otherwise unwilling to adopt their use. In addition, our branded food product is marketed directly to potential consumers, but we cannot be sure that consumers will continue to be attracted to our brand, be attracted to our new brands or products, or purchase our products on an ongoing basis. As a result, our branded products may not be successful, distribution partners may decide to discontinue marketing our products and our business will be adversely affected. If consumer packaged goods companies do not accept our food ingredients as ingredients for their finished products, or if end customers are unwilling to purchase finished products made using our products, we will not be successful in competing in the nutrition market and our business will be adversely affected. Customers in the nutrition market also may require lengthy and complex qualification procedures with respect to our products, our manufacturing capabilities, regulatory issues and other matters. Likewise, in the animal nutrition market, if customers are not willing to integrate our products into their animal nutrition products, our business will be adversely affected.
In the specialty personal care ingredients market, the potential customers for our or SB Oils' products are generally companies that have well-developed manufacturing processes and arrangements with suppliers for the components of their products and may resist changing these processes and components. These potential customers frequently impose lengthy and complex product qualification procedures on their suppliers, influenced by consumer preference, manufacturing considerations, supplier operating history, regulatory issues, product liability and other factors, many of which are unknown to, or not well understood by, us. Satisfying these processes may take many months or years.
We have entered into a limited number of binding, definitive commercial supply agreements. We also periodically enter into non-binding letters of intent with third parties regarding purchase of our products, but these agreements do not unconditionally obligate the other party to purchase any quantities of any products at this time. There can be no assurance that non-binding letters of intent will lead to unconditional definitive agreements to purchase our products.
We have limited experience in structuring arrangements with customers for the purchase of our microalgae-based products, and we may not be successful in this essential aspect of our business.
We expect that our customers will include large companies that sell food products, including aquaculture, nutrition products and specialty personal care products. Because we have only recently begun to commercialize ingredients for specialty
20
personal care products and our own food and food ingredient products, including aquaculture, and are still in the process of developing products and ingredients for the food, aquaculture, nutrition and specialty personal care markets, we have limited experience operating in our customers’ industries and interacting with the customers that we intend to target. Developing the necessary expertise may take longer than we expect and will require that we expand and improve our sales and marketing capability, which could be costly. These activities could delay our ability to capitalize on the opportunities that we believe our technology and products present, and may prevent us from successfully commercializing our products. Further, we ultimately aim to sell large amounts of our products, and this will require that we effectively negotiate and manage contracts for these purchase and sale relationships. The companies with which we aim to have arrangements are generally much larger than we are and have substantially longer operating histories and more experience in their industries than we have. As a result, we may not succeed in establishing relationships with these companies and, if we do, we may not be effective in negotiating or managing the terms of such relationships, which could adversely affect our future results of operations.
We may be subject to product liability claims and other claims of our customers, partners and third parties.
The design, development, production and sale of our products involve an inherent risk of product liability claims and the associated adverse publicity. Because some of our ultimate products in each of our target markets are used by consumers, and because use of those ultimate products may cause injury to those consumers and damage to property, we are subject to a risk of claims for such injuries and damages, claims from consumer packaged goods companies for the costs of removing finished products containing one or more of our ingredients from the market and costs to remove our branded food products from the market. In addition, we may be named directly in product liability suits relating to our products or third-party products integrating our products, even for defects resulting from errors of our partners, contract manufacturers or other third parties working with our products. These claims could be brought by various parties, including customers who are purchasing products directly from us or other users who purchase products from our customers or partners. We could also be named as co-parties in product liability suits that are brought against manufacturing partners that produce our products.
In addition, our customers, partners and third parties may bring suits against us alleging damages for the failure of our products to meet stated claims, specifications, warranties or other requirements. Any such suits, even if not successful, could be costly, disrupt the attention of our management and damage our negotiations with other partners and/or customers. Although we often seek to limit our product liability in our contracts, such limits may not be enforceable or may be subject to exceptions. Our current product liability and umbrella insurance for our business may be inadequate to cover all potential liability claims. Insurance coverage is expensive and may be difficult to obtain. Also, insurance coverage may not be available in the future on acceptable terms and may not be sufficient to cover potential claims. We cannot be sure that our contract manufacturers or manufacturing partners who produce our ultimate products will have adequate insurance coverage to cover against potential claims. If we experience a large insured loss, it may exceed our coverage limits, or our insurance carrier may decline to further cover us or may raise our insurance rates to unacceptable levels, any of which could impair our financial position and potentially cause us to go out of business.
We will face risks associated with our international business in developing countries and elsewhere.
For the foreseeable future, our business plan will likely subject us to risks associated with essential manufacturing, sales and operations in developing countries. We have limited experience to date manufacturing and selling internationally and such expansion will require us to make significant expenditures, including the hiring of local employees and establishing facilities, in advance of generating any revenue. The economies of many of the countries in which we or our joint venture, partners or customers operate or will operate have been characterized by frequent and occasionally extensive government intervention and unstable economic cycles.
In addition, in Brazil, where SB Oils is located, there are restrictions on the foreign ownership of land, which may affect SB Oils' ownership rights in the production facility site or in any additional land purchased.
International business operations are subject to local legal, political, regulatory and social requirements and economic conditions and our business, financial performance and prospects may be adversely affected by, among others, the following factors:
• | political, economic, diplomatic or social instability; |
• | land reform movements; |
• | tariffs, export or import restrictions, restrictions on remittances abroad or repatriation of profits, duties or taxes that limit our ability to move our products out of these countries or interfere with the import of essential materials into these countries; |
21
• | inflation, changing interest rates and exchange controls; |
• | tax burden and policies; |
• | delays or failures in securing licenses, permits or other governmental approvals necessary to build and operate facilities and use our microalgae strains to produce products; |
• | the imposition of limitations on products or processes and the production or sale of those products or processes; |
• | uncertainties relating to foreign laws, including labor laws, regulations and restrictions, and legal proceedings; |
• | foreign ownership rules and changes in regard thereto; |
• | an inability, or reduced ability, to protect our intellectual property, including any effect of compulsory licensing imposed by government action; |
• | successful compliance with U.S. and foreign laws that regulate the conduct of business abroad, including the Foreign Corrupt Practices Act; |
• | insufficient investment in developing countries in public infrastructure, including transportation infrastructure, and disruption of transportation and logistics services; and |
• | difficulties and costs of staffing and managing foreign operations. |
These and other factors could have a material adverse impact on our results of operations and financial condition.
Our international operations may expose us to the risk of fluctuation in currency exchange rates and rates of foreign inflation, which could adversely affect our results of operations.
We currently incur some costs and expenses in Brazilian Reals and expect in the future to incur additional expenses in these and other foreign currencies, and also derive a portion of our revenues in the local currencies of customers throughout the world. As a result, our revenues and results of operations are subject to foreign exchange fluctuations, which we may not be able to manage successfully. During the past few decades, the Brazilian currency in particular has faced frequent and substantial exchange rate fluctuations in relation to the U.S. dollar and other foreign currencies. For example, the value of the Brazilian Real has fluctuated significantly against the U.S. dollar over the past few years. There can be no assurance that the Real will not significantly appreciate or depreciate against the U.S. dollar in the future. We bear the risk that the rate of inflation in the foreign countries where we incur costs and expenses or the decline in value of the U.S. dollar compared to those foreign currencies will increase our costs as expressed in U.S. dollars. Future measures by foreign governments to control inflation, including interest rate adjustments, intervention in the foreign exchange market and changes to the fixed value of their currencies, may trigger increases in inflation. We may not be able to adjust the prices of our products to offset the effects of inflation on our cost structure, which could increase our costs and reduce our net operating margins. If we do not successfully manage these risks through hedging or other mechanisms, our revenues and results of operations could be adversely affected.
We may encounter difficulties managing our business as it evolves, and we will need to properly prioritize our efforts in our target markets as our business grows. If we are unable to do so, our business, financial condition and results of operations may be adversely affected.
Our business has encountered periods of rapid growth and evolution. Rapid growth or evolution places a strain on our human and capital resources. If we grow or evolve too rapidly or if our headcount or other aspects of our operating structure become misaligned with our strategy, we may need to reduce headcount or other operating costs. For example, in December 2014, as part of an adjustment to our operating and expense strategy related to the ramping up of SB Oils' production facility, we announced the intention to decrease operating expenses through a reduction in workforce and other cost-cutting measures. See the risk factor titled “We may experience significant delays and/or cost overruns in financing, designing, constructing and ramping up large commercial manufacturing facilities, which could result in harm to our business and prospects” above for more information. In addition, in January 2016, as part of our continuing strategy to focus operations on targeted, higher-value product categories, we streamlined operations by reducing our workforce. Such reductions in workforce can have an adverse effect on our business.
Furthermore, we intend to conduct our business internationally and anticipate business operations in the United States, Europe, Latin America and elsewhere. These diversified, global operations place increased demands on our limited resources and may require us to expand the capabilities of our administrative and operational resources and will require us to attract, train,
22
manage and retain qualified management, technicians, scientists and other personnel. As our operations shift or expand domestically and internationally, we will need to continue to manage multiple locations and additional relationships with various customers, partners, suppliers and other third parties across several product categories and markets.
In the past, our business has taken place across several target markets: food and nutrition, skin and personal care, fuels and chemicals, and oil field services. We will be required to prioritize our limited financial and managerial resources as we pursue particular development and commercialization efforts in our target markets of food, including aquaculture, nutrition and specialty personal care ingredients. Any resources we expend on one or more of these efforts could be at the expense of other potentially profitable opportunities. If we focus our efforts and resources on one or more of our target markets and they do not lead to commercially viable products, our revenues, financial condition and results of operations could be adversely affected. Furthermore, as our operations grow or evolve, the simultaneous management of development, production and commercialization across our target markets could become increasingly complex and may result in less than optimal allocation of management and other administrative resources, increase our operating expenses and harm our operating results.
Our ability to effectively manage our operations, growth and various projects across our target markets will require us to make additional investments in our infrastructure to continue to improve our operational, financial and management controls and our reporting systems and procedures and to attract and retain sufficient numbers of talented employees, which we may be unable to do effectively. We may be unable to successfully manage our expenses in the future, which may negatively impact our gross margins or operating margins in any particular quarter.
In addition, we may not be able to improve our management information and control systems, including our internal control over financial reporting, to a level necessary to manage our growth or evolution and we may discover deficiencies in existing systems and controls that we may not be able to remediate in an efficient or timely manner.
We are involved, and may become involved in the future, in legal proceedings that, if adversely adjudicated or settled, could adversely affect our financial results.
We, and certain of our officers and directors, are involved, and may be involved in the future, in legal proceedings and claims arising in the course of our business. Such matters are subject to many uncertainties and there can be no assurance that such legal proceedings will not have a material adverse effect on our business, results of operations, financial position or cash flows. See Note 11 - Commitments and Contingencies of the notes to the consolidated financial statements of this report for a description of the material legal proceedings in which we are currently engaged.
We cannot predict the outcome of any legal proceeding in which we are engaged. Moreover, any conclusion of legal proceedings in a manner adverse to us could have an adverse effect on our financial condition and business. Even if we are successful in litigation, we could incur substantial costs, suffer a significant adverse impact on our reputation and divert management’s attention and resources from other priorities, including the execution of business plans and strategies that are important to our ability to grow our business, any of which could have an adverse effect on our business. Legal proceedings may result in significant legal expenses, settlement costs or damage awards that are not covered by, or exceed the limits of, our liability insurance, which could adversely impact our financial condition, results of operations or cash flow.
Our success depends in part on recruiting and retaining key personnel and, if we fail to do so, it may be more difficult for us to execute our business strategy.
Our success depends on our continued ability to attract, retain and motivate highly qualified management, business development, manufacturing and scientific personnel and directors, and on our ability to develop and maintain important relationships with leading academic institutions and scientists. We are dependent upon a number of key members of our senior management, including executive, manufacturing, business development and scientific personnel, and on our directors. If any of such persons left, our business could be harmed. All of our employees and directors are at-will and may resign at any time. The loss of the services of one or more of our key employees or directors could delay or have an impact on the successful commercialization of our products. We do not maintain any key man insurance. Competition for qualified personnel in the biotechnology field is intense, particularly in the San Francisco Bay Area. We may not be able to attract and retain qualified personnel on acceptable terms given the competition for such personnel. In addition, the restructurings that we implemented in December 2014 and January 2016 could have an adverse impact on our ability to retain and recruit qualified personnel. If we are unsuccessful in our recruitment efforts, we may be unable to execute our strategy.
23
We may not be able to meet applicable regulatory requirements for the sale of our microalgae-based products and the operation of production facilities, and, even if requirements are met, complying on an ongoing basis with the numerous regulatory requirements applicable to our various product categories and facilities will be time-consuming and costly.
Our food and nutrition products are subject to regulation by various government agencies, including the U.S. Food and Drug Administration (FDA), state and local agencies and similar agencies outside the United States. In the U.S., food ingredients are regulated either as food additives or as substances generally recognized as safe, or GRAS. A GRAS self-determination can be made with respect to a substance by its manufacturer upon the receipt of an opinion from a panel of qualified experts who determine that the substance is GRAS for its intended conditions of use. A GRAS Notice for one algae oil was submitted to the FDA in June 2011, and a “no questions” letter was received from the FDA in June 2012. A GRAS Notice for each of whole algae flour and whole algae protein was submitted to the FDA, and a “no questions” letter was received from the FDA in 2013 for whole algae flour, in 2014 for whole algae protein and in 2015 for our second algae oil, an oleic algae oil. If the FDA were to disagree with the conclusions in future GRAS Notices, they could ask that the products be voluntarily withdrawn from the market or could initiate legal action to halt their sale. Such actions by the FDA could have an adverse effect on our business, financial condition, and results of our operations. Food ingredients that are not GRAS are regulated as food additives and require FDA approval prior to commercialization. The food additive petition process is generally expensive and time consuming with approval, if secured, taking years. In Brazil, we submitted applications to the Brazilian Health Surveillance Agency (ANVISA) for approval of various food products. We received food approval with no restrictions for our whole algae flour in July 2015 and for whole algae protein in December 2016. In Canada, we received a Letter of No Objection for whole algae flour in February 2016. Other products may or may not be approved in the future. Any significant delay or disapproval of our food products by ANVISA, Health Canada or other government agencies in these or other countries would adversely affect our food and nutrition business in these and other countries.
The sale of ingredients for use in animal feed is regulated by agencies including the FDA's Center for Veterinary Medicine. Regulatory requirements for suitability must be met by providing data from studies, which may cause delays and the incursion of additional costs. Any significant delay or disapproval by government agencies of our animal nutrition products would have an adverse effect on our business.
Our chemical products may be subject to government regulation in our target markets. In the United States, the EPA administers the Toxic Substances Control Act (TSCA), which regulates the commercial registration, distribution, and use of chemicals. TSCA requires us to comply with the Microbial Commercial Activity Notice (MCAN) process to manufacture and distribute products made from our recombinant microalgae strains. An MCAN is not required for non-recombinant strains. To date, we have filed MCANs for certain of our recombinant microalgae strains, all of which have been dropped from review. Our subsequent filing of Notices of Commencement (NOC) relating to previously filed MCANs allows us to commercially use these strains. We expect to file additional MCANs in the future.
Before we can manufacture or distribute significant volumes of a chemical, we need to determine whether that chemical is listed in the TSCA inventory. If the substance is listed, then manufacture or distribution can commence immediately. If not, then a pre-manufacture notice (PMN) must be filed with the EPA for a review period of up to 90 days excluding extensions. We have filed PMNs for certain of our products and expect to file additional PMNs in the future. Some of the products we produce or plan to produce are already on the TSCA inventory due to our successful PMN submissions and filed NOCs. Others are not yet listed. We may not be able to expediently receive approval from the EPA to list the chemicals we would like to make on the TSCA inventory, resulting in delays or significant increases in testing requirements. A similar program exists in the European Union, called REACH (Registration, Evaluation, Authorization, and Restriction of Chemical Substances). We are required to register some of our products with the European Commission, and this process could cause delays or significant costs. We have determined that some of our algae oils are exempt from REACH registration requirements. To the extent that other geographies, such as Brazil, may rely on the TSCA or REACH for chemical registration in their geographies, delays with the U.S. or European authorities may subsequently delay entry into these markets as well. Furthermore, other geographies may have their own chemical inventory requirements, which may delay entry into these markets, irrespective of U.S. or European approval.
Changes in regulatory requirements, laws and policies, or evolving interpretations of existing regulatory requirements, laws and policies, may result in increased compliance costs, delays, capital expenditures and other financial obligations that could adversely affect our business or financial results.
We expect to encounter regulations in most if not all of the countries in which we may seek to sell our products, and we cannot be sure that we will be able to obtain necessary approvals in a timely manner or at all. If our products do not meet applicable regulatory requirements in a particular country or at all, then we may not be able to commercialize them and our business will be adversely affected. The various regulatory schemes applicable to our products will continue to apply following initial approval for sale. Monitoring regulatory changes and ensuring our ongoing compliance with applicable requirements is
24
time-consuming and may affect our results of operations. If we fail to comply with such requirements on an ongoing basis, we may be subject to fines or other penalties, or may be prevented from selling our products, and our business may be harmed.
The construction and operation of our, our partners’ or our joint venture's production facilities are likely to require government approvals. If we are not able to obtain or maintain the necessary approvals in a timely manner or at all, our business will be adversely affected. In February 2014, the São Paulo State Environmental Department granted a license to operate the SB Oils production facility, which was necessary to begin commercial production.
We may incur significant costs complying with environmental, health and safety laws and regulations, and failure to comply with these laws and regulations could expose us to significant liabilities.
We use hazardous chemicals and radioactive and biological materials in our business and are subject to a variety of federal, state, local and international laws and regulations governing, among other matters, the use, generation, manufacture, transportation, storage, handling, disposal of, and human exposure to, these materials both in the U.S. and outside the U.S., including regulation by governmental regulatory agencies, such as the Occupational Safety and Health Administration and the EPA. We have incurred, and will continue to incur, capital and operating expenditures and other costs in the ordinary course of our business in complying with these laws and regulations.
Although we have implemented safety procedures for handling and disposing of these materials and waste products in an effort to comply with these laws and regulations, we cannot be sure that our safety measures will be compliant or capable of eliminating the risk of injury or contamination from the generation, manufacturing, use, storage, transportation, handling, disposal of, and human exposure to, hazardous materials. Failure to comply with environmental, health and safety laws could subject us to liability and resulting damages. There can be no assurance that violations of environmental, health and safety laws will not occur as a result of human error, accident, equipment failure or other causes. Compliance with applicable environmental laws and regulations may be expensive, and the failure to comply with past, present, or future laws could result in the imposition of fines, regulatory oversight costs, third party property damage, product liability and personal injury claims, investigation and remediation costs, the suspension of production, or a cessation of operations, and our liability may exceed our total assets. Liability under environmental laws, such as the Comprehensive Environmental Response Compensation and Liability Act in the United States, can impose liability for the full amount of damages, without regard to comparative fault for the investigation and cleanup of contamination and impacts to human health and for damages to natural resources. Contamination at properties we own and operate, and at properties to which we send hazardous materials, may result in liability for us under environmental laws and regulations.
Our business and operations will be affected by other new environmental, health and safety laws and regulations, which may affect our research and development and manufacturing programs, and environmental laws could become more stringent over time, requiring us to change our operations, or resulting in greater compliance costs and increasing risks and penalties associated with violations, which could impair our research, development or production efforts and harm our business. The costs of complying with environmental, health and safety laws and regulations, and any claims concerning noncompliance or liability with respect to contamination in the future, could have a material adverse effect on our financial condition or operating results.
We may face risks relating to the use of our targeted recombinant microalgae strains, and if we are not able to meet applicable regulatory requirements for the use of these strains or if we face material ethical, legal and social concerns about our use of targeted recombinant technology, our business could be adversely affected.
The use of microorganisms designed using targeted recombinant technology, such as some of our microalgae strains, is subject to laws and regulations in many states and countries, some of which are new and still evolving and interpreted by fact specific application. In the U.S. the EPA regulates the commercial use of microorganisms designed using targeted recombinant technology as well as potential products derived from them.
We expect to encounter regulations of microorganisms designed using targeted recombinant technology in most if not all of the countries in which we may seek to establish manufacturing operations, and the scope and nature of these regulations will likely be different from country to country. For example, in the U.S., when used in an industrial process, our microalgae strains designed using targeted recombinant technology may be considered new chemicals under the TSCA, administered by the EPA. We will be required to comply with the EPA’s process. In Brazil, microorganisms designed using targeted recombinant technology are regulated by the National Biosafety Technical Commission, or CTNBio. In March 2013, we submitted an application for approval from CTNBio to use a specific microalgae strain designed using targeted recombinant technology in a contained environment in order to use these microalgae for research and development and commercial production purposes in any facilities we establish in Brazil. We obtained approval for this application from CTNBio in October 2013, and we have
25
since received several approvals related to additional applications we had submitted. In February 2014, CTNBio granted a CQB (Certificate of Quality in Biosafety) to the SB Oils production facility for activities including industrial production, import and export, disposal and storage of our key production organisms. If we cannot meet the applicable requirements in countries in which we intend to produce microalgae-based products, or if it takes longer than anticipated to obtain such approvals, our business could be adversely affected.
The subject of organisms designed using targeted recombinant technology has received negative publicity, which has aroused public debate. Public attitudes about the safety and environmental hazards of, and ethical concerns over, genetic research and microorganisms designed using targeted recombinant technology could influence public acceptance of our technology and products. In addition, shifting public attitudes regarding, and potential changes to laws governing, ownership of genetic material could harm our intellectual property rights with respect to our genetic material and discourage collaborators from supporting, developing, or commercializing our products, processes and technologies. Governmental reaction to negative publicity concerning organisms designed using targeted recombinant technology could result in greater government regulation of or trade restrictions on imports of genetic research and derivative products. If we and/or our collaborators are not able to overcome the ethical, legal, and social concerns relating to the use of targeted recombinant technology, our products and processes may not be accepted or we could face increased expenses, delays or other impediments to their commercialization.
We expect to face competition for our food and nutrition, animal nutrition and specialty personal care ingredients and products from other companies in these fields, many of whom have greater resources and experience than we do. If we cannot compete effectively against these companies or their products, we may not be successful in selling our ingredients or products or further growing our business.
We expect that our food, nutrition, animal nutrition and specialty personal care ingredients and products will compete with providers in the specialty, mass food ingredient and animal nutrition markets. Many of these companies, such as Cargill, Incorporated, Monsanto Company, Syngenta AG and Roquette Frères, S.A., are substantially larger than we are, have well-developed distribution systems and networks for their products, and valuable historical relationships with the potential customers and distributors we hope to serve and have substantially greater resources than we do. We may also compete with companies seeking to produce food, nutrition and animal nutrition products based on renewable oils, including DSM Food Specialties and DuPont Nutrition & Health. Our success in the development of food, nutrition and animal nutrition products will depend on our ability to effectively compete with established companies and successfully commercialize our products. We believe the primary competitive factors in the food, nutrition, animal nutrition and specialty personal care ingredient and product markets are product performance, cost-in-use, sustainability, and availability of supply.
We expect to face competition for our products in the specialty personal care market from providers of products based on petroleum, plant oils and animal fats and from other companies seeking to provide alternatives to these products, many of whom have greater resources and experience than we do. If we cannot compete effectively against these companies or products, our business could be harmed and certain of our strategic alternatives could be adversely impacted.
In the specialty personal care market, we will compete with the established providers of oils currently used in specialty personal care products. Producers of these incumbent products include global oil companies, including those selling agricultural products such as palm oil, palm kernel oil, shea butter, cacao butter, argan oil, almond oil and sunflower oil, large international personal care companies and other companies specializing in specific products or essential oils. We may also compete in one or more of these markets with manufacturers of other products such as highly refined mineral oils and other petroleum-based fluids, as well as new market entrants.
We believe the primary competitive factors in the specialty personal care market are product price, product performance, sustainability, availability of supply and compatibility of products with existing formulations.
Companies with whom we compete and expect to compete are much larger than we are, have, in most cases, well-developed distribution systems and networks for their products, have valuable historical relationships with the potential customers we are seeking to serve and have much more extensive sales and marketing programs in place to promote their products. Some of our competitors may use their influence to impede the development and acceptance of our products. Our limited resources relative to many of our competitors may cause us to fail to anticipate or respond adequately to new developments and other competitive pressures. In the nascent markets for renewable oils, it is difficult to predict which, if any, market entrants will be successful, and we may lose market share to competitors producing new or existing renewable products. If we are unsuccessful in competing in the specialty personal care market, our business could be harmed and certain of our strategic alternatives could be adversely impacted.
26
A decline in the price of petroleum and petroleum-based products, plant oils or other commodities may reduce demand for our products and may otherwise adversely affect our business.
We anticipate that many of our oils will be marketed as alternatives to corresponding products based on petroleum and plant oils. When the price of any of these oils falls, as they have recently, we may be unable to produce algae oils or other products that are cost-effective alternatives to their petroleum or plant oil-based counterparts. Declining oil prices, or the perception of a future decline in oil prices, may adversely affect the prices we can obtain from our potential customers or prevent potential customers from entering into agreements with us to buy our products. During sustained periods of lower oil prices we may be unable to sell our products, which could materially and adversely affect our operating results. For example, in part as a result of the recent drop in the prices of petroleum and certain plant oils, the ramp up of the SB Oils production facility in Brazil will be slower than, and the mix of products manufactured in that facility will be different from, what we previously anticipated as production will be focused primarily on higher margin products.
Prices of plant oils have experienced significant volatility, and this volatility is expected to persist. If prices for plant oils remain at low levels, there may be less demand for oil alternatives, which could reduce demand for our products and harm our business. The prices of commodities that serve as food ingredients have also been volatile. To the extent that the prices of these commodities decline and remain at lower levels for extended periods of time, the demand for our food, including aquaculture, nutrition and specialty personal care ingredients and products may be reduced, and our ability to successfully compete in this market may be harmed.
Our information technology systems, processes and sites may suffer a significant breach or disruption that may adversely affect our ability to conduct our business.
Our information technology systems, some of which are dependent on services provided by third parties, provide critical data and services for internal and external users, including procurement and inventory management, transaction processing, financial, commercial and operational data, human resources management, legal and tax compliance information and other information and processes necessary to operate and manage our business. Our information technology and infrastructure may experience attacks by hackers, breaches or other failures or disruptions that could compromise our systems and the information stored there. While we have implemented security measures and disaster recovery plans designed to protect the security and continuity of our networks and critical systems, these measures may not adequately prevent adverse events such as breaches or failures from occurring or mitigate their severity if they do occur. If our information technology systems are breached, damaged or fail to function properly due to any number of causes, such as security breaches or cyber-based attacks, systems implementation difficulties, catastrophic events or power outages, and our security, contingency or disaster recovery plans do not effectively mitigate these occurrences on a timely basis, we may experience a material disruption in our ability to manage our business operations. We may also be subject to legal claims or proceedings, liability under laws that protect the privacy of personal information, potential regulatory penalties and damage to our reputation. The occurrence of any of these events may adversely impact our business, results of operations and financial condition, as well as our competitive position.
Our facilities in California are located near an earthquake fault, and an earthquake or other natural disaster or resource shortage could disrupt our operations.
Important documents and records, such as hard copies of our laboratory books and records for our products and some of our manufacturing operations, are located in our corporate headquarters in South San Francisco, California, near active earthquake zones. In the event of a natural disaster, such as an earthquake, drought or flood, or localized extended outages of critical utilities or transportation systems, we do not have a formal business continuity or disaster recovery plan, and could therefore experience a significant business interruption. In addition, California from time to time has experienced shortages of water, electric power and natural gas. Future shortages and conservation measures could disrupt our operations and could result in additional expense. Although we maintain business interruption insurance coverage, we do not maintain earthquake or flood coverage.
Risks Related to Our Intellectual Property
Our competitive position depends on our ability to effectively obtain and enforce patents related to our products, manufacturing components and manufacturing processes. If we or our licensors fail to adequately protect this intellectual property, our ability and/or our partners’ ability to commercialize products could suffer.
Our success depends in part on our ability to obtain and maintain patent protection sufficient to prevent others from utilizing our manufacturing components, manufacturing processes or marketing our products, as well as to successfully defend
27
and enforce our patents against infringement by others. In order to protect our products, manufacturing components and manufacturing processes from unauthorized use by third parties, we must hold patent rights that cover our products, manufacturing components and manufacturing processes.
The patent position of biotechnology and bio-industrial companies can be highly uncertain because obtaining and determining the scope of patent rights involves complex legal and factual questions. The standards applied by the U.S. Patent and Trademark Office and foreign patent offices in granting patents are different and not always applied uniformly or predictably. There is no uniform worldwide policy regarding patentable subject matter, the scope of claims allowable in biotechnology and bio-industrial patents, or the formal requirements to obtain such patents. Consequently, patents may not issue from our pending patent applications. Furthermore, in the process of seeking patent protection or even after a patent is granted, we could become subject to expensive and protracted proceedings, including patent interference, opposition, post-grant review, invalidation proceedings and re-examination proceedings, which could invalidate or narrow the scope of our patent rights. As such, we do not know nor can we predict the scope and/or breadth of patent protection that we might obtain on our products and technology.
Changes either in patent laws or in interpretations of patent laws in the United States and other countries may diminish the value of our intellectual property rights. In the U.S., depending on the decisions and actions taken by the U.S. Congress, the federal courts, and the U.S. Patent and Trademark Office, the laws and regulations governing patents could change in unpredictable ways that could weaken our ability to obtain new patents or to enforce our existing patents and patents that we might obtain in the future. In foreign jurisdictions, depending on the decisions and actions taken by the foreign government, the judicial system of the jurisdiction, and its patent office, the laws and regulations governing patents could change in unpredictable ways that could weaken our ability to obtain new patents or to enforce our existing patents or patents that we might obtain in the future.
The America Invents Act (AIA), which was signed into law on September 16, 2011, brought a number of changes to the U.S. patent system and affects the way patents are prosecuted, challenged and litigated. Among the changes that went into effect on September 16, 2012, one of the most significant involves the implementation of a reformed post-grant review system. Other changes, which went into effect on March 16, 2013, include the transition from a “first-to-invent” to “first-to-file” system that attempts to harmonize the laws of the U.S. with the laws of most of the world. Lack of precedential interpretation of the new provisions of the AIA through specific cases or through guidelines promulgated by the U.S. Patent and Trademark Office and the lack of binding precedent from the courts increase the uncertainty of the impact of the AIA. Together, these changes may increase the costs of prosecution and enforcement of U.S. patents. While it is currently unclear what impact these changes will have on the operation of our business, they may favor companies able to dedicate more resources to patent filings and challenges.
Risks associated with enforcing our intellectual property rights in the United States and elsewhere.
If we were to initiate legal proceedings against a third party to enforce a patent claiming one of our technologies, the defendant could counterclaim that our patent is invalid and/or unenforceable or assert that the patent does not cover its manufacturing processes, manufacturing components or products. Proving patent infringement may be difficult, especially where it is possible to manufacture a product by multiple processes or when a patented process is performed by multiple parties. Patent litigation is also costly, time-consuming and distracting to our management. Furthermore, in patent litigation in the United States or elsewhere, defendant counterclaims alleging both invalidity and unenforceability are commonplace. Although we believe that we have conducted our patent prosecution in accordance with the duty of candor and in good faith, the outcome following legal assertions of invalidity and unenforceability during patent litigation is unpredictable. With respect to the validity of our patent rights, we cannot be certain, for example, that there is no invalidating prior art, of which we and the patent examiner were unaware during prosecution. If a defendant were to prevail on a legal assertion of invalidity and/or unenforceability, we would not be able to exclude others from practicing the inventions claimed therein. Such a loss of patent protection could have a material adverse effect on our business. Defendant counterclaims of antitrust or other anti-competitive conduct are also commonplace.
Even if our patent rights are found to be valid and enforceable, patent claims that survive litigation may not cover commercially viable products or prevent competitors from importing or marketing products similar to our own, or using manufacturing processes or manufacturing components similar to our own.
Although we believe we have obtained valid assignments of patent rights from all inventors, if an inventor did not adequately assign their patent rights to us, a third party could obtain a license to the patent from such inventor. This could preclude us from enforcing the patent against such third party.
28
We may not be able to enforce our intellectual property rights throughout the world.
The laws of some foreign countries where we intend to produce and use our proprietary strains in collaboration with sugar mills or other feedstock suppliers do not protect intellectual property rights to the same extent as the laws of the United States. Many companies have encountered significant problems in protecting and defending intellectual property rights in certain foreign jurisdictions. The legal systems of certain countries, including Brazil, do not favor the enforcement of patents and other intellectual property protection, particularly those relating to biotechnology and/or bio-industrial technologies. This could make it difficult for us to stop the infringement of our patents or misappropriation of our intellectual property rights in these countries. Proceedings to enforce our patent rights in certain foreign jurisdictions are unpredictable and could result in substantial costs and divert our efforts and attention from other aspects of our business. Accordingly, our efforts to protect our intellectual property rights in such countries may be inadequate.
Third parties may misappropriate our proprietary strains, information, or trade secrets despite a contractual obligation not to do so.
Third parties (including joint venture, collaboration, development and feedstock partners and former partners, contract manufacturers, and other contractors and shipping agents) often have custody or control of our proprietary microbe strains. If our proprietary microbe strains were stolen, misappropriated or reverse engineered, they could be used by other parties who may be able to use our strains or reverse-engineered strains for their own commercial gain. It is difficult to prevent misappropriation or subsequent reverse engineering. In the event that our proprietary microbe strains are misappropriated, it could be difficult for us to challenge the misappropriation or prevent reverse engineering, especially in countries with limited legal and intellectual property protection.
Confidentiality agreements with employees and third parties may not prevent unauthorized disclosure of proprietary information and trade secrets.
In addition to patents, we rely on confidentiality agreements to protect our technical know-how and other proprietary information. Confidentiality agreements are used, for example, when we talk to potential strategic partners. In addition, each of our employees signed a confidentiality agreement upon joining our company. Nevertheless, there can be no guarantee that an employee or an outside party will not make an unauthorized disclosure or use of our proprietary confidential information. This might happen intentionally or inadvertently. It is possible that a competitor will make use of such information, and that our competitive position will be compromised, in spite of any legal action we might take against persons making such unauthorized disclosures.
We also keep as trade secrets certain technical and proprietary information where we do not believe patent protection is appropriate, desirable or obtainable. However, trade secrets are difficult to protect. Although we use reasonable efforts to protect our trade secrets, our employees, consultants, contractors, outside scientific collaborators, partners, former partners and other advisors may unintentionally or willfully disclose our trade secrets to competitors or otherwise use misappropriated trade secrets to compete with us. It can be expensive and time consuming to enforce a claim that a third party illegally obtained and is using our trade secrets. Furthermore, the outcome of such claims is unpredictable. In addition, courts outside the United States may be less willing to or may not protect trade secrets. Moreover, our competitors may independently design around our intellectual property or develop equivalent knowledge, methods and know-how without misappropriating or otherwise violating our trade secret rights. Where a third party independently designs around our intellectual property or develops equivalent knowledge, methods and know-how without misappropriating or otherwise violating our trade secret rights, they may be able to seek patent protection for such equivalent knowledge, methods and know-how. This could prohibit us from practicing our trade secrets.
Claims by patent holders that our products or manufacturing processes infringe their patent rights could result in costly litigation or could require substantial time and money to resolve, whether or not we are successful, and an unfavorable outcome in these proceedings could have a material adverse effect on our business.
Our ability to commercialize our technology depends on our ability to develop, manufacture, market and sell our products without infringing the proprietary rights of patent holders or their authorized agents. An issued patent does not guarantee us the right to practice or utilize the patented inventions or commercialize the patented product. Third parties may have blocking patents that may prevent us from commercializing our patented products and utilizing our patented manufacturing components and manufacturing processes. In the event that we are made aware of blocking third party patents, we cannot be sure that licenses to the blocking third-party patents would be available or obtainable on terms favorable to us or at all.
29
Numerous U.S. and foreign issued patents and pending patent applications, which are owned by third parties, relate to (1) the production of bio-industrial products, including edible ingredients, oils, chemicals and drilling fluids, and (2) the use of microalgae strains, such as microalgae strains containing genes to alter their oil composition. As such, there could be existing valid patents that our manufacturing processes, manufacturing components, or products may inadvertently infringe. There could also be existing invalid or unenforceable patents that could nevertheless be asserted against us and would require expenditure of resources to defend against. In addition, there are pending patent applications that are currently unpublished and therefore unknown to us that may later result in issued patents that are infringed by our products, manufacturing processes or other aspects of our business.
We may be exposed to future litigation based on claims that our products, manufacturing processes or manufacturing components infringe the intellectual property rights of others. There is inevitable uncertainty in any litigation, including patent litigation. Defending against claims of patent infringement is costly and time consuming, regardless of the outcome. Thus, even if we were to ultimately prevail, or to settle at an early stage of litigation, such litigation could burden us with substantial unanticipated costs. Some of our competitors are larger than we are and have substantially greater resources. These competitors are, therefore, likely to be able to sustain the costs of complex patent litigation longer than we could. In addition, the costs and uncertainty associated with patent litigation could have a material adverse effect on our ability to continue our internal research and development programs, in-license needed technology, or enter into strategic partnerships that would help us commercialize our technologies. In addition, litigation or threatened litigation could result in significant demands on the time and attention of our management team, distracting them from the pursuit of other company business.
If a party successfully asserts a patent or other intellectual property rights against us, we might be barred from using certain of our manufacturing processes or manufacturing components, or from developing and commercializing related products. Injunctions against using specified processes or components, or prohibitions against commercializing specified products, could be imposed by a court or by a settlement agreement between us and a third party. In addition, we may be required to pay substantial damage awards to the third party, including treble or enhanced damages if we are found to have willfully infringed the third party’s intellectual property rights. We may also be required to obtain a license from the third party in order to continue manufacturing and/or marketing the products that were found to infringe. It is possible that the necessary license will not be available to us on commercially acceptable terms, or at all. This could limit our ability to competitively commercialize some or all of our products.
During the course of any patent litigation, there could be public announcements of the results of hearings, rulings on motions, and other interim proceedings in the litigation. If securities analysts or investors regard these announcements as negative, the perceived value of our products, technology or intellectual property could be diminished. Accordingly, the market price of our common stock may decline.
We have received government funding in connection with the development of certain of our proprietary technologies, which could negatively affect our intellectual property rights in such technologies.
Some of our proprietary technology was developed with U.S. federal government funding. When new technologies are developed with U.S. government funding, the government obtains certain rights in any resulting patents, including a nonexclusive license authorizing the government to use the invention for non-commercial purposes. These rights may permit the government to disclose our confidential information to third parties and to exercise “march-in” rights to use or allow third parties to use our patented technology. The government can exercise its march-in rights if it determines that action is necessary because we fail to achieve practical application of the U.S. government-funded technology, and/or because action is necessary to alleviate health or safety needs, to meet requirements of federal regulations, or to give preference to U.S. industry. In addition, U.S. government-funded inventions must be reported to the government and U.S. government funding must be disclosed in any resulting patent applications. In addition, our rights in such inventions are subject to government license rights and foreign manufacturing restrictions. Any exercise by the government of such rights could harm our competitive position or impact our operating results.
In addition, some of our technology was funded by a grant from the State of California. Inventions funded by this grant may be subject to forfeiture if we do not seek to patent or practically apply them. Any such forfeiture could have a materially adverse effect on our business. For proprietary technology developed with funding from the State of California, certain confidential information may be disclosed to third parties by the State of California. Our rights in such inventions are subject to the State of California's license and march-in rights. Any exercise by the State of California of such rights could harm our competitive position or impact our operating results.
30
Risks Related to Our Finances and Capital Requirements
Our financial results could vary significantly from quarter to quarter and are difficult to predict.
Our revenues and results of operations could vary significantly from quarter to quarter because of a variety of factors, many of which are outside of our control. As a result, comparing our results of operations on a period-to-period basis may not be meaningful. Factors that could cause our quarterly results of operations to fluctuate include:
• | achievement, or failure to achieve, technology or product development milestones needed to allow us to enter target markets on a cost effective basis; |
• | delays or greater than anticipated expenses or time associated with the completion of new manufacturing facilities and the ramp up to nameplate capacity and optimization of production following completion of a new manufacturing facility; |
• | delays or greater than anticipated expenses associated with the provision of key support and/or operational services to manufacturing facilities; |
• | our capital requirements or capital requirements of our joint venture or other collaborations; |
• | our ability to effectively manage larger working capital positions as we increase commercial production and distribution of our products; |
• | disruptions in the production process at any facility where we produce our products, including due to equipment failure or accidents; |
• | the timing, size and mix of sales to customers for our products; |
• | increases in price or decreases in availability of feedstocks such as sucrose from sugarcane and/or dextrose from corn; |
• | fluctuations in the price of, and demand for, products based on petroleum or other oils for which our products are alternatives; |
• | the unavailability of contract manufacturing capacity altogether or at anticipated cost; |
• | fluctuations in foreign currency exchange rates; |
• | seasonal production and sale of our products; |
• | the effects of competitive pricing pressures, including decreases in average selling prices of our products; |
• | unanticipated expenses associated with changes in governmental regulations and environmental, health and safety requirements; |
• | reductions or changes to existing regulations and policies that impact the food, including aquaculture, nutrition, or specialty personal care markets; |
• | departure of key employees; |
• | business interruptions, such as earthquakes and other natural disasters; |
• | our ability to integrate businesses that we may acquire; |
• | our ability to transition out of businesses that we may divest; |
• | our ability to generate sufficient cash flows to fund our operations and continue as a going concern; |
• | risks associated with the international aspects of our business; and |
• | changes in general economic, industry and market conditions, both domestically and in foreign markets in which we operate. |
31
Due to these factors and others, the results of any quarterly or annual period may not meet our expectations or the expectations of our investors and may not be meaningful indications of our future performance.
Despite our current debt levels, we may still incur substantially more debt or take other actions that would intensify the risks discussed above.
Despite our current consolidated debt levels, we and our subsidiaries may be able to incur substantial additional debt in the future, subject to the restrictions contained in our debt instruments, some of which may be secured debt. We are not restricted under the terms of the indentures governing the 2018 Notes and 2019 Notes from incurring additional debt, securing existing or future debt, recapitalizing our debt or taking a number of other actions that are not limited by the terms of the indentures governing the 2018 Notes and the 2019 Notes that could have the effect of diminishing our ability to make payments on the notes when due. The SVB Facility restricts our ability to incur additional indebtedness, including secured indebtedness, but if the facility matures or is repaid, we may not be subject to such restrictions under the terms of any subsequent indebtedness.
We have received government grant funding and entered contracts with government agencies, and may pursue government grant funding or contracts in the future. Our receipt of government funds through grants and contracts subjects us to additional regulatory oversight.
We have received government grants and have entered contracts with government agencies in the past. Activities funded by a government grant or pursuant to government contracts are subject to audits by government agencies. As part of an audit, these agencies may review our performance, cost structures and compliance with applicable laws, regulations and standards. Grant funds must be applied by us toward the research and development programs specified by the granting agency, rather than for all of our programs generally. If any of our grant-funded costs are found to be allocated improperly, the costs may not be reimbursed and any costs already reimbursed may have to be refunded. Accordingly, an audit could result in an adjustment to our revenues and results of operations. We are also subject to additional regulations based on our receipt of government grant funding and entry into government contracts. If we fail to comply with the requirements under our grants or contracts, we may face penalties or other negative consequences, and in such event we may not be awarded government funding or contracts in the future.
The sale of our Algenist business involves risks, and we may not be able to realize the anticipated benefits from the transaction, which could have a material adverse effect on our results of operations or financial condition.
On August 16, 2016, we closed the sale of our Algenist business to TCP Algenist LLC, a Delaware limited liability company (Buyer) and Algenist Holdings, Inc., a Delaware corporation (Algenist Holdings) in exchange for $20.2 million in cash, 601,969 shares of common stock of Algenist Holdings (amounting to 19.9% of its outstanding capital stock at closing) and the assumption of substantially all of the liabilities related to the Algenist business by Algenist Holdings (collectively, the “Transaction”). As part of the Transaction, we agreed to provide Algenist Holdings with certain transition services following the closing of the Transaction, which could result in diversion of internal resources from our core businesses.
We also expect to continue to supply active ingredients formulated in the Algenist product line to Algenist Holdings. We may not, however, be able to realize the anticipated benefits from our minority holdings or this supply arrangement, as we do not control the Algenist business, including with respect to the operation of the business and the amount or timing of resources that Buyer devotes to the Algenist business or this supply arrangement. Our minority interest in the Algenist business and supply arrangement with Algenist Holdings may not provide us with a return on investment and our investment may lose some or all of its value.
In addition, under the terms of the sale agreement, subject to certain limitations, we agreed to indemnify Buyer and certain other parties against breaches of our representations, warranties or covenants in the sale agreement and other specified damages, and certain liabilities related to the Algenist business not expressly assumed by Algenist Holdings. If Buyer makes a claim for indemnification against us, we may incur expenses to contest or resolve the claim (including indemnifiable damages for third party claims, if adversely decided) that could adversely affect our financial results.
If we engage in any acquisitions, we will incur a variety of costs and may potentially face numerous risks that could adversely affect our business and operations.
If appropriate opportunities become available, we may seek to acquire additional businesses, assets, technologies or products to enhance our business. In connection with any acquisitions, we could issue additional equity or equity-linked securities such as the 2018 Notes or 2019 Notes, which would dilute our stockholders, incur substantial debt to fund the acquisitions, or assume significant liabilities.
32
Acquisitions involve numerous risks, including problems integrating the purchased operations, technologies or products, unanticipated costs and other liabilities, diversion of management’s attention from our core businesses, adverse effects on existing business relationships with current and/or prospective collaborators, customers and/or suppliers, risks associated with entering markets in which we have no or limited prior experience and potential loss of key employees. Acquisitions may also require us to record goodwill and non-amortizable intangible assets that will be subject to impairment testing on a regular basis and potential periodic impairment charges, incur amortization expenses related to certain intangible assets, and incur write offs and restructuring and other related expenses, any of which could harm our operating results and financial condition. If we fail in our integration efforts with respect to any of our acquisitions and are unable to efficiently operate as a combined organization, our business and financial condition may be adversely affected.
Raising additional funds may cause dilution to our stockholders or require us to relinquish valuable rights.
If we elect to raise additional funds through equity offerings or offerings of equity-linked securities, our stockholders would likely experience dilution. Debt financing, if available, may subject us to restrictive covenants that could limit our flexibility in conducting future business activities. For example, the SVB Facility contains financial covenants that, if breached, would require us to secure our obligations thereunder. To the extent that we raise additional funds through collaboration and licensing arrangements, it may be necessary for us to share a portion of the margin from the sale of our products. We may also be required to relinquish or license on unfavorable terms our rights to technologies or products that we otherwise would seek to develop or commercialize ourselves.
If we fail to maintain an effective system of internal controls, we might not be able to report our financial results accurately or prevent fraud; in that case, our stockholders could lose confidence in our financial reporting, which would harm our business and could negatively impact the price of our stock.
Effective internal controls are necessary for us to provide reliable financial reports and prevent fraud. In addition, Section 404 of the Sarbanes-Oxley Act of 2002 requires us and our independent registered public accounting firm to evaluate and report on our internal control over financial reporting, and have our chief executive officer and chief financial officer certify as to the accuracy and completeness of our financial reports. The process of implementing our internal controls and complying with Section 404 is expensive and time consuming, and requires significant attention from management. We cannot be certain that these measures will ensure that we implement and maintain adequate controls over our financial processes and reporting in the future.
Our management has concluded that there were no material weaknesses in our internal controls over financial reporting as of December 31, 2016. However, there can be no assurance that our controls over financial processes and reporting will be effective in the future or that material weaknesses or significant deficiencies in our internal controls will not be discovered in the future. Because of its inherent limitations, internal control over financial reporting may not prevent or detect fraud or misstatements. Failure to implement required new or improved controls, or difficulties encountered in their implementation, could harm our results of operations or cause us to fail to meet our reporting obligations. If we or our independent registered public accounting firm discover a material weakness, the disclosure of that fact, even if quickly remedied, could reduce the market’s confidence in our financial statements and harm our stock price.
Risks Relating to Securities Markets and Investment in Our Stock
The price of our common stock may be volatile.
The market price of our common stock has been subject to volatility, ranging from a low of $0.90 to a high of $3.15 in the 52-week period ending December 31, 2016. Our stock price has been affected by, among other things, the market's perception of our ability to finance our operations on an on-going basis, changes in the valuation of companies perceived by the market to be comparable to us, and changes in general economic, industry and market conditions. Stock markets have experienced extreme volatility that has often been unrelated to the operating performance of particular companies. These broad market fluctuations may adversely affect the trading price of our common stock. In addition, the average daily trading volume of the securities of small companies, particularly small technology companies, can be very low. Limited trading volume of our stock may contribute to its volatility. Price declines in our common stock could result from general market and economic conditions and a variety of other factors, including any of the risk factors described in this report.
These broad market and industry factors may seriously harm the market price of our common stock, regardless of our operating performance. The market price of our common stock could also be affected by possible sales of our common stock by
33
investors who view our convertible notes as a more attractive means of equity participation in us and by hedging or arbitrage trading activity that we expect involving our common stock.
The sale or issuance by us of substantial amounts of our common stock could adversely impact the trading price of our common stock.
A substantial number of shares of our common stock may be issued in connection with the exercise of options outstanding under our equity incentive plans, the vesting of restricted stock awards and restricted stock units, the exercise of outstanding warrants, the conversion of or exchange for outstanding 2018 Notes and 2019 Notes, and the conversion of our Series A preferred stock. See Note 2 in the accompanying notes to our consolidated financial statements for additional information regarding the number of outstanding shares of potentially dilutive securities. Also see Note 10 in the accompanying notes to our consolidated financial statements for information regarding the possible conversion of the 2018 Notes and 2019 Notes into shares of our common stock. In addition, we expect to issue additional shares under our equity incentive plans and employee stock purchase plan in the future. In the future, we may issue additional shares of common stock or other equity-linked securities to raise additional capital.
Any future sale or issuance of common stock could adversely impact the trading price of our common stock.
If the market price of our common stock were to cease to be quoted on a national exchange, the market price of our common stock and our reputation would be negatively impacted.
Our consolidated closing bid price has recently fallen below $1.00 per share and if it does not increase to $1.00 per share or more and we are unable to meet the stock price listing requirements of NASDAQ, including the requirement that our consolidated closing bid price not be below $1.00 per share for 30 consecutive business days, NASDAQ may issue a deficiency notice providing a 180 day compliance period prior to our common stock being subject to delisting from the NASDAQ Global Select Market. If our common stock were delisted from the NASDAQ Global Select Market, among other things, this could result in a number of negative implications, including reduced price and liquidity in our common stock as a result of the loss of market efficiencies associated with NASDAQ and the loss of federal preemption of state securities laws, as well as the potential loss of confidence by suppliers, customers and employees, the loss of institutional investor interest, the loss of the ability to raise future capital, less coverage by analysts, fewer business development opportunities and greater difficulty in obtaining financing. The threat of delisting may also lead to a “reverse split” to increase the per share price of our common stock.
Our certificate of incorporation, our bylaws and Delaware law contain provisions that could discourage another company from acquiring us and may prevent attempts by our stockholders to replace or remove our current management.
Provisions of Delaware law (where we are incorporated), our certificate of incorporation and bylaws may discourage, delay or prevent a merger or acquisition that stockholders may consider favorable, including transactions in which you might otherwise receive a premium for your shares. In addition, these provisions may frustrate or prevent any attempts by our stockholders to replace or remove our current management by making it more difficult for stockholders to replace or remove our board of directors. These provisions include:
• | authorizing the issuance of “blank check” preferred stock without any need for action by stockholders; |
• | requiring supermajority stockholder voting to effect certain amendments to our certificate of incorporation and bylaws; |
• | eliminating the ability of stockholders to call special meetings of stockholders; |
• | prohibiting stockholder action by written consent; |
• | establishing advance notice requirements for nominations for election to the board of directors or for proposing matters that can be acted on by stockholders at stockholder meetings; and |
• | dividing our board of directors into three classes so that only one third of our directors will be up for election in any given year. |
In addition, we are subject to Section 203 of the Delaware General Corporation Law, which, under certain circumstances, may make it more difficult for a person who would be an “interested stockholder,” as defined in Section 203, to effect various business combinations with us for a three-year period. Our certificate of incorporation and bylaws do not exclude us from the restrictions imposed under Section 203. These provisions could impede a merger, takeover or other business combination
34
involving us or discourage a potential acquirer from making a tender offer for our common stock, which, under certain circumstances, could reduce the market price of our common stock.
We incur significant expenses as a result of being a public company.
As a public company, we incur significant additional legal, accounting and other expenses. For example, as a public company, we have adopted internal and disclosure controls and procedures and bear all of the internal and external costs of preparing and distributing periodic public reports in compliance with our obligations under applicable securities laws.
In addition, changing laws, regulations and standards relating to corporate governance and public disclosure, including the Sarbanes-Oxley Act of 2002 and related regulations implemented by the SEC and the NASDAQ-GS, create uncertainty for public companies, increasing legal and financial compliance costs and making some activities more time consuming. We evaluate and monitor developments with respect to new and proposed rules and cannot predict or estimate the amount of additional costs we may incur or the timing of such costs. These laws, regulations and standards are subject to varying interpretations, in many cases due to their lack of specificity, and, as a result, their application in practice may evolve over time as new guidance is provided by regulatory and governing bodies. This could result in continuing uncertainty regarding compliance matters and higher costs necessitated by ongoing revisions to disclosure and governance practices. We intend to invest resources to comply with evolving laws, regulations and standards, and this investment may result in increased general and administrative expenses and a diversion of management’s time and attention from revenue-generating activities to compliance activities. If our efforts to comply with new laws, regulations and standards differ from the activities intended by regulatory or governing bodies due to ambiguities related to practice, regulatory authorities may initiate legal proceedings against us and our business may be harmed. These factors could also make it more difficult for us to attract and retain qualified members of our board of directors, particularly to serve on our audit committee and compensation committee, and attract and retain qualified executive officers. If these requirements divert our management’s attention from other business concerns, they could have a material adverse effect on our business, financial condition and results of operations.
If securities or industry analysts do not continue to publish research or publish inaccurate or unfavorable research about our business, our stock price and trading volume could decline.
The trading market for our common stock depends in part on the research and reports that securities or industry analysts publish about us or our business. If securities or industry analysts do not continue coverage of our company, the trading price for our common stock would be negatively impacted. If one or more of the analysts who cover us downgrade our common stock or publish inaccurate or unfavorable research about our business, the price of our common stock would likely decline. If one or more of these analysts cease coverage of our company or fail to publish reports on us regularly, demand for our common stock could decrease, which might cause the price of our common stock and its trading volume to decline.
We do not anticipate paying cash dividends, and accordingly, stockholders must rely on stock appreciation for any return on their investment.
We do not anticipate paying cash dividends in the foreseeable future. As a result, only appreciation of the price of our common stock, which may never occur, would provide a return to stockholders. Our SVB Facility restricts our ability to pay cash dividends, and we may be subject to additional dividend restrictions under the terms of future indebtedness. Investors seeking cash dividends should not invest in our common stock.
Item 1B.Unresolved Staff Comments.
None.
Item 2. Properties.
We currently lease an aggregate of approximately 106,000 square feet of office and laboratory facilities, including a pilot plant, in South San Francisco, California. The South San Francisco location is comprised of two buildings and is covered by a lease agreement that expires in January 2018.
In August 2016, we assigned the lease agreement for approximately 5,000 square feet of office space in Glendale, California to Algenist LLC in connection with the sale of our Algenist business.
We believe that our current facilities are suitable and adequate to meet our current needs. As our needs change and as our business grows, we intend to build, lease or acquire additional manufacturing capacity on our own and with partners. We believe that additional space and facilities will be available.
35
Item 3. Legal Proceedings.
Norfolk Securities Class Action Litigation
In June 2015, a securities class action complaint entitled Norfolk County Retirement System v. Solazyme, Inc. et al., was filed against the Company, its then CEO, Jonathan Wolfson, its CFO/COO, Tyler Painter, certain of its current and former directors, and the underwriters of its March 2014 equity and debt offerings, Goldman, Sachs & Co., Inc. and Morgan Stanley & Co. LLC, in the U.S. District Court for the Northern District of California (the “Norfolk Securities Class Action”). The complaint asserted claims for alleged violations of Sections 11, 12(a)(2), and 15 of the Securities Act of 1933, as well as Sections 10(b) and 20(a) of the Securities Exchange Act of 1934. The complaint sought unspecified damages on behalf of a purported class that would comprise all individuals who acquired the Company’s securities (i) between February 27, 2014 and November 5, 2014 and (ii) pursuant and/or traceable to the Company's public equity and debt offerings in March 2014. The complaint alleged that investors were misled by statements made during that period about the construction progress, development, and production capacity associated with the production facility located in Brazil owned by the Company’s joint venture, Solazyme Bunge Produtos Renovaveis Ltda. A consolidated complaint was filed in December 2015. In December 2016, the court dismissed the complaint with leave to amend.
In February 2017, the plaintiffs in the Norfolk Securities Class Action filed an amended complaint against the Company, its former CEO, Jonathan Wolfson and its current CFO/COO, Tyler Painter. The complaint asserts claims for alleged violations of Sections 10(b) and 20(a) of the Securities Exchange Act of 1934. The amended complaint seeks unspecified damages on behalf of a purported class that would comprise all individuals who acquired the Company’s securities between February 27, 2014 and November 5, 2014. The amended complaint alleges that investors were misled by statements made during that period about the construction progress, development, and production capacity associated with the production facility located in Brazil owned by the Company’s joint venture, Solazyme Bunge Produtos Renovaveis Ltda. The Company believes the complaint lacks merit, and intends to defend itself vigorously.
Derivative Litigation Related to Norfolk Class Action Litigation
In July 2015, a complaint entitled Jim Bertonis, derivatively on behalf of Solazyme, Inc. v. Jonathan Wolfson et al. was filed in the Superior Court of California, County of San Mateo. In May 2016, a second, related derivative complaint, captioned Ben Wang, derivatively on behalf of Solazyme, Inc. v. Jonathan Wolfson et al, was filed in the same court. Both actions have been consolidated going forward as In re TerraVia Holdings, Inc. f/k/a Solazyme, Inc. Shareholder Litigation (the “Bertonis State Derivative Action”). The complaints seek unspecified damages, purportedly on behalf of the Company, from certain of its current and former directors and officers. The complaints assert claims against these defendants for breach of fiduciary duty, unjust enrichment, and aiding and abetting. The complaints allege that these defendants are liable for making allegedly false and misleading statements and omitting certain material facts in the Company's securities filings and other public disclosures. The Bertonis State Derivative Action is based on substantially the same facts as the Norfolk Securities Class Action described above. The Bertonis State Derivative Action is presently stayed by court order through July 1, 2017. Based on a review of the plaintiffs’ allegations, the Company believes that the plaintiffs have not demonstrated standing to sue on its behalf.
In August 2015, a complaint entitled Gregory M. Miller, derivatively on behalf of Solazyme, Inc. v. Jonathan S. Wolfson et al. was filed in the U.S. District Court for the Northern District of California (the “Miller Federal Derivative Action”). The complaint seeks unspecified damages, purportedly on behalf of the Company from certain of its current and former directors and officers. The complaint asserts claims against these defendants for breach of fiduciary duty and aiding and abetting. The complaint alleges that these defendants are liable for making allegedly false and misleading statements and omitting certain material facts in the Company's securities filings and other public disclosures. The Miller Federal Derivative Action is based on substantially the same facts as the Norfolk Securities Class Action and the Bertonis State Derivative Action described above. The Miller Federal Derivative Action is presently stayed pending resolution of the anticipated motion to dismiss in the Norfolk Securities Class Action. Based on a review of the plaintiffs’ allegations, the Company believes that the plaintiff has not demonstrated standing to sue on its behalf.
Perales Securities Class Action Litigation
In November 2016, a securities class action complaint entitled Ruben Perales v. TerraVia Holdings, Inc. et al. was filed against the Company, its former CEO, Jonathan Wolfson, its current CEO, Apu Mody and its CFO/COO, Tyler Painter, in the U.S. District Court for the Northern District of California. In December 2016, a second, related securities class action complaint, captioned Dimitrios Daniil v. TerraVia Holdings, Inc. et al, was filed in the same court (the “Perales Securities Class Action”). The plaintiffs assert claims for alleged violations of Sections 10(b) and 20(a) of the Securities Exchange Act of 1934. The plaintiffs seek unspecified damages on behalf of a purported class that would comprise all individuals who acquired the
36
Company's securities between March 13, 2013 and November 7, 2016. The plaintiffs allege that investors were misled by statements made during that period about the Company’s AlgaVia® algae products and as a result the Company’s statements about its business, operations and prospects were false and misleading and/or lacked a reasonable basis. The Company believes the complaint lacks merit, and intends to defend itself vigorously.
Derivative Litigation Related to Perales Class Action Litigation
In February 2017, a complaint entitled Avery Daniel Robinson, derivatively on behalf of TerraVia Holdings, Inc. v. Jonathan S. Wolfson et al. was filed in the Superior Court of California, County of San Francisco (the “Robinson State Derivative Action”). The complaint seeks unspecified damages, purportedly on behalf of the Company from its current directors and its CFO/COO, Tyler Painter. The complaint asserts claims against these defendants for breach of fiduciary duty, unjust enrichment, waste, and aiding and abetting. The complaint alleges that these defendants are liable for making allegedly false and misleading statements and omitting certain material facts in the Company’s securities filings and other public disclosures. The Robinson State Derivative Action is based on substantially the same facts as the Perales Securities Class Action described above. Based on a review of the plaintiffs’ allegations, the Company believes that the plaintiff has not demonstrated standing to sue on its behalf.
Roquette Frères, S.A.
In September 2013, an arbitration (the “Roquette Arbitration”) was initiated with Roquette Frères, S.A. (“Roquette”) in connection with the dissolution of a joint venture between the Company and Roquette known as Solazyme Roquette Nutritionals L.L.C. (“SRN”). The Company sought a declaration that, in accordance with the terms of the joint venture agreement between the parties, the Company should be assigned all improvements made by or on behalf of SRN to the Company’s intellectual property. In February 2015 the arbitration panel released its decision, ordering, inter alia, the assignment to the Company of (i) all SRN patent applications, (ii) all SRN know-how related to high lipid algae flour and high protein algae powder and (iii) all Roquette patent applications filed since November 2010 relating to algae food and food ingredients, as well as methods for making and using them. In addition, the arbitration panel ordered Roquette to pay to the Company $2.3 million in legal costs and fees. The arbitration award was confirmed by order of the U.S. District Court for the District of Delaware in December 2015. Roquette appealed the confirmation of the arbitration award to the U.S. Court of Appeals for the Third Circuit. In December 2016 the U.S. Court of Appeals for the Third Circuit upheld the confirmation of the panel’s award. Roquette has paid a portion of the award and the parties are discussing the remainder of the award, including the assignment by Roquette to the Company of all Roquette patent applications filed since November 2010 relating to algae food and food ingredients, as well as methods for making and using them. The stay entered in January 2016 by the U.S. District Court for the District of Delaware, which enjoined Roquette from pursuing any further commercialization of any technology arguably within the ambit of the arbitral decision, including the sale of products, remains in place.
In November 2014, Roquette filed an action against the Company in U.S. District Court for the District of Delaware for declaratory judgment related to the Roquette Arbitration. Roquette sought a declaration that (i) the arbitrators in the Roquette Arbitration exceeded their authority by failing to render a timely arbitration award, (ii) any award issued by the arbitrators is void and (iii) all intangible assets of SRN should be assigned jointly to Roquette and the Company. Other than seeking its attorney fees and costs in the action, Roquette did not make any monetary claims against the Company. The Company filed an Answer to the Complaint in January 2015, denying substantially all of Roquette’s claims and all of its prayers for relief.
In February 2015 Roquette filed a second action against the Company in U.S. District Court for the District of Delaware for declaratory judgment related to the Roquette Arbitration. Roquette sought a declaration that (A) the order of the arbitrators in the Roquette Arbitration for more discovery and new hearings was unenforceable and (B) in the alternative, the proposed new discovery and hearings concerned an issue that was outside the scope of the arbitration. Other than seeking its attorney fees and costs in the action, Roquette did not make any monetary claims against the Company. The two Delaware actions were consolidated in February 2015. The Company filed its Answer to the second Complaint in February 2015, denying all claims made in the Complaint and all related prayers for relief. In addition, the Company counterclaimed for damages for misappropriation of the Company’s trade secrets and breach of contract. In April 2015 Roquette added counterclaims against the Company for misappropriation of certain Roquette trade secrets and for breach of contract. Also in April 2015, Roquette filed motions for summary judgment in each of the two declaratory judgment actions commenced by Roquette, as well as on the Company’s counterclaim against Roquette for trade secret misappropriation. The summary judgment motions made by Roquette on the declaratory judgment claims were denied by the court in December 2015 and judgment on those claims was entered in favor of the Company. The court postponed deciding Roquette’s summary judgment motions directed to the Company’s trade secret misappropriation claim against Roquette until a resolution on the arbitration award is reached. All further proceedings in the district court actions are currently stayed.
37
The Company may be involved, from time to time, in additional legal proceedings and claims arising in the ordinary course of its business. Such matters are subject to many uncertainties and outcomes are not predictable with assurance. The Company accrues amounts, to the extent they can be reasonably estimated, that it believes are adequate to address any liabilities related to legal proceedings and other loss contingencies that the Company believes will result in a probable loss. While there can be no assurances as to the ultimate outcome of any legal proceeding or other loss contingencies involving the Company, management does not believe any pending matters individually and in the aggregate will be resolved in a manner that would have a material effect on the Company’s consolidated financial position, results of operations or cash flows.
Item 4. Mine Safety Disclosures.
Not applicable.
38
PART II
Item 5. Market for Registrant’s Common Equity, Related Stockholder Matters and Issuer Purchases of Equity Securities
Market Information
Our common stock is traded on The NASDAQ Global Select Market, or NASDAQ, under the symbol TVIA. The following table sets forth the high and low sales prices per share of the common stock as reported on NASDAQ. Such prices represent inter dealer prices without retail markup, markdown or commission and may not necessarily represent actual transactions.
Fiscal 2015 | High | Low | |||||
First Quarter | $ | 3.49 | $ | 2.00 | |||
Second Quarter | 4.74 | 2.82 | |||||
Third Quarter | 3.34 | 1.89 | |||||
Fourth Quarter | 3.52 | 2.32 | |||||
Fiscal 2016 | High | Low | |||||
First Quarter | $ | 3.15 | $ | 1.18 | |||
Second Quarter | 2.81 | 1.86 | |||||
Third Quarter | 2.98 | 2.12 | |||||
Fourth Quarter | 2.86 | 0.90 | |||||
Holders
As of March 1, 2017 there were 148 stockholders of record of our common stock. A substantially greater number of stockholders may be beneficial holders, whose shares are held of record by banks, brokers and other financial institutions in “street name.”
Dividend Policy
We have never declared or paid any dividends on our common stock or any other securities. We currently intend to retain our future earnings, if any, for use in the expansion and operation of our business and therefore do not anticipate paying cash dividends on our common stock in the foreseeable future. Any future determination relating to our dividend policy will be made at the discretion of our board of directors, based upon our financial condition, results of operations, contractual restrictions, capital requirements, business prospects and other factors our board of directors may deem relevant. In addition, the terms of our loan facility require that we obtain consent from the lender prior to any payment of dividends.
Stock Performance Graph
The following graph compares our total common stock return with the total return for (i) the S&P SmallCap 600 Index (ii) the NASDAQ Clean Edge Green Energy Index, and (iii) the S&P Food and Beverage Select Industry Index for the period from December 31, 2011 through December 31, 2016. As we have streamlined our strategy to focus on food, nutrition and specialty ingredient products, we have included the S&P Food and Beverage Select Industry Index, as we feel that this index more closely matches our current focus. The figures represented below assume an investment of $100 in our common stock at the closing price of $11.90 on December 31, 2011 and in the S&P SmallCap Index, the NASDAQ Clean Edge Green Energy Index and the S&P Food and Beverage Select Industry Index on December 31, 2011 and the reinvestment of dividends into shares of common stock. The comparisons in the table are required by the SEC and are not intended to forecast or be indicative of possible future performance of our common stock. This graph shall not be deemed “soliciting material” or to be “filed” for purposes of Section 18 of the Exchange Act or otherwise subject to the liabilities under that Section, and shall not be deemed to be incorporated by reference into any of our filings under the Securities Act or the Exchange Act.
39
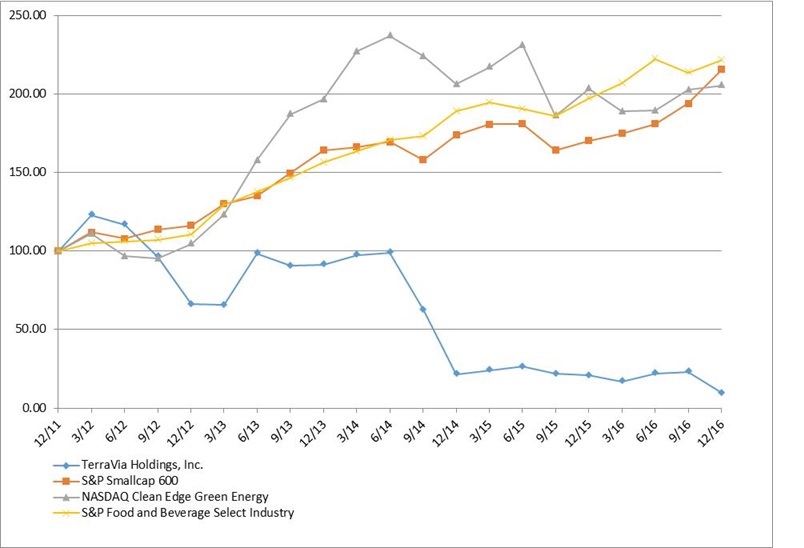
Recent Sales of Unregistered Securities
1.On April 1, 2014, we issued $149.5 million aggregate principal amount of convertible notes (2019 Notes) that will mature on October 1, 2019. See Note 10 of our consolidated financial statements for additional detail. We had $148.1 million aggregate principal amount of 2019 Notes outstanding as of December 31, 2016.
2. On December 28, 2015, we entered into a warrant exchange agreement (Exchange Agreement) with ADM pursuant to which ADM agreed to exchange (x) a warrant covering 500,000 shares of Company common stock, (y) a warrant in the face amount of $5.1 million and (z) two warrants in the face amount of $6.5 million each (the Warrants) for (i) 1,121,914 shares of our common stock, which is equal to $3.0 million divided by the average daily closing share price of our common stock over the five consecutive trading days ending on the trading day prior to December 28, 2015 and (ii) a number of shares of common stock equal to $2.5 million divided by the average daily closing share price of our common stock over the five consecutive trading days ending on the trading day prior to February 17, 2016. The settlement of the first tranche of shares covered by the Exchange occurred on December 29, 2015.
3. On February 17, 2016 we and ADM amended the Exchange Agreement (Amended Exchange Agreement) to provide that the Company’s exchange consideration for the February issuance portion would instead be (x) $1.25 million paid to ADM in cash no later than February 19, 2016, and such payment occurred on February 19, 2016 and (y) the issuance of a number of shares of Common Stock to ADM equal to $1.25 million divided by the average daily closing share price of our common Stock over the five consecutive trading days ending on the trading day prior to April 1, 2016, and such issuance occurred on April 1, 2016.
4. On January 29, 2016, pursuant to a Consulting Agreement with Mark Schuett, we issued 111,386 shares of our common stock to Mr. Schuett. Pursuant to the Consulting Agreement, Mr. Schuett is providing consulting services related to manufacturing processes.
5. On March 8, 2016, we granted an option to purchase 200,000 shares of common stock to a consultant in connection with the provision of consulting services related to financing and business strategy. The exercise price of such option is $1.66, the fair market value of a share of Company common stock on the grant date.
40
6. On August 22, 2016, we granted an option to purchase 83,333 shares of common stock and granted 2,083 restricted stock units to a service provider in connection with a retained executive recruitment search. The exercise price of the option is $2.62, the fair market value of a share of Company common stock on the grant date.
7. On August 22, 2016, we granted 30,992 restricted stock units to a service provider in connection with the provision of financial services.
The issuances of securities described in paragraph 1 above was made pursuant to Rule 144A under the Securities Act in private offerings to qualified institutional buyers. The issuance of securities described in paragraphs 2 and 3 above were made in reliance on the exemption from registration contained in Section 3(a)(9) of the Securities Act of 1933, as amended. The issuances of securities described in paragraphs 2, 3 6 and 7 above were deemed to be exempt from registration under the Securities Act in reliance on Section 4(2) of the Securities Act and Regulation D promulgated thereunder as transactions by an issuer not involving a public offering. The recipients of securities in each such transaction represented their intention to acquire the securities for investment only and not with a view to or for sale in connection with any distribution thereof and appropriate legends were affixed to the electronic records representing such securities in such transactions. All recipients received adequate information about us.
41
Item 6. Selected Financial Data
On August 16, 2016 we sold our Algenist skincare business to TCP Algenist LLC, an affiliate of Tengram Capital Partners and Algenist Holdings, Inc. We have presented the historical results of Algenist as discontinued operations for all periods presented in this filing.
Year Ended December 31, | |||||||||||||||||||
2016 | 2015 | 2014 | 2013 | 2012 | |||||||||||||||
(In thousands, except share per share data) | |||||||||||||||||||
Statement of Operations Data: | |||||||||||||||||||
Total revenues | $ | 18,482 | $ | 22,853 | $ | 35,962 | $ | 19,894 | $ | 27,649 | |||||||||
Cost of product revenues | 5,256 | 10,563 | 12,866 | 47 | — | ||||||||||||||
Research and development | 31,116 | 48,094 | 81,680 | 66,572 | 66,384 | ||||||||||||||
Sales, general and administrative | 43,741 | 62,041 | 72,621 | 50,146 | 43,499 | ||||||||||||||
Restructuring charges | 1,412 | 4,953 | 3,514 | — | — | ||||||||||||||
Total costs and operating expenses | 81,525 | 125,651 | 170,681 | 116,765 | 109,883 | ||||||||||||||
Loss from continuing operations before other income (expense): | (63,043 | ) | (102,798 | ) | (134,719 | ) | (96,871 | ) | (82,234 | ) | |||||||||
Total other income (expense), net | (43,876 | ) | (35,584 | ) | (26,442 | ) | (20,241 | ) | 1,954 | ||||||||||
Loss from continuing operations before income taxes | (106,919 | ) | (138,382 | ) | (161,161 | ) | (117,112 | ) | (80,280 | ) | |||||||||
Benefit from income taxes | (2,062 | ) | — | — | — | — | |||||||||||||
Loss from continuing operations | (104,857 | ) | (138,382 | ) | (161,161 | ) | (117,112 | ) | (80,280 | ) | |||||||||
Income (loss) from discontinued operations, net of tax | 3,301 | (3,065 | ) | (980 | ) | 723 | (2,852 | ) | |||||||||||
Net loss | $ | (101,556 | ) | $ | (141,447 | ) | $ | (162,141 | ) | $ | (116,389 | ) | $ | (83,132 | ) | ||||
Net income (loss) per share, basic and diluted: | |||||||||||||||||||
Continuing operations | $ | (1.22 | ) | $ | (1.73 | ) | $ | (2.13 | ) | $ | (1.82 | ) | $ | (1.32 | ) | ||||
Discontinued operations | 0.04 | (0.03 | ) | (0.01 | ) | 0.01 | (0.05 | ) | |||||||||||
Net loss per share, basic and diluted | $ | (1.18 | ) | $ | (1.76 | ) | $ | (2.14 | ) | $ | (1.81 | ) | $ | (1.37 | ) | ||||
Shares used in computation of basic and diluted net loss per share | 85,952 | 80,165 | 75,879 | 64,212 | 60,509 | ||||||||||||||
As of December 31, | |||||||||||||||||||
2016 | 2015 | 2014 | 2013 | 2012 | |||||||||||||||
(In thousands) | |||||||||||||||||||
Balance Sheet Data: | |||||||||||||||||||
Cash and cash equivalents | $ | 63,509 | $ | 46,966 | $ | 42,689 | $ | 54,977 | $ | 30,818 | |||||||||
Marketable securities | 522 | 51,009 | 164,619 | 112,544 | 118,187 | ||||||||||||||
Net current assets | 51,712 | 93,614 | 210,473 | 166,523 | 140,341 | ||||||||||||||
Total assets (1) | 135,709 | 181,972 | 311,959 | 258,308 | 216,987 | ||||||||||||||
Total debt, net (1) | 174,620 | 202,015 | 199,467 | 93,125 | 14,931 | ||||||||||||||
Convertible preferred stock | 25,653 | — | — | — | — | ||||||||||||||
Accumulated deficit | (711,461 | ) | (609,905 | ) | (468,458 | ) | (306,317 | ) | (189,928 | ) | |||||||||
Total stockholders’ (deficit) equity | (82,246 | ) | (46,475 | ) | 86,376 | 138,948 | 183,311 | ||||||||||||
(1) Reflects adoption of ASU 2015-03 related to classification of debt issuance costs. Unamortized debt issuance costs of $0.4 million, $0.6 million, $0.4 million, and $37,000 at December 31, 2015, 2014, 2013, and 2012, respectively, were reclassified from Other long-term assets to a reduction in Long-term debt.
42
Item 7. Management’s Discussion and Analysis of Financial Condition and Results of Operations.
Forward-Looking Statements
The following discussion and analysis should be read together with our audited consolidated financial statements and the other financial information appearing elsewhere in this Annual Report on Form 10-K. This discussion contains forward-looking statements reflecting our current expectations and involves risks and uncertainties. In some cases, you can identify forward-looking statements by terminology such as “may,” “will,” “should,” “expect,” “plan,” “anticipate,” “believe,” “estimate,” “predict,” “intend,” “potential” or “continue” or the negative of these terms or other comparable terminology. For example, statements regarding our expectations as to future financial and operating performance, future selling prices and margins for our products, attributes and performance of our products, manufacturing capacity, expense levels and liquidity sources are forward-looking statements. Our actual results and the timing of events may differ materially from those discussed in our forward-looking statements as a result of various factors, including those discussed below and those discussed in the section entitled “Risk Factors” included in this Annual Report on Form 10-K and in our other filings with the Securities and Exchange Commission (SEC).
Overview
We are a food, nutrition and specialty ingredients company that harnesses the power of algae, the origin of all plants. Our innovative platform uses microalgae to produce high-value triglyceride oils, proteins, fibers, micronutrients and other ingredients. The inherent flexibility of our technology platform and the broad usage of these materials across multiple industries allow us to approach a wide range of customers across myriad end markets. We have streamlined our strategy to focus on food, nutrition and specialty ingredient products and began to more broadly commercialize these products in 2015, and in May 2016, we changed our name from “Solazyme, Inc.” to “TerraVia Holdings, Inc.”, and changed our Nasdaq ticker listing symbol from SZYM to TVIA. With the transition to the TerraVia brand and our refined focus on food, nutrition and specialty ingredients, we appointed Apu Mody as our Chief Executive Officer, effective upon the commencement of his employment with TerraVia, which occurred on August 22, 2016. Additionally, in August 2016, we sold our Algenist® skincare business, a transaction in line with our strategy to focus efforts on core growth engines in food, nutrition and specialty ingredients.
The unique composition of our oils, powders and other algae-derived products addresses specific customer requirements. We are commercializing high-value oils and powder products with companies that primarily use them as ingredients. We have developed and are commercializing products for specialty food ingredients, animal nutrition ingredients, consumer food products and specialty personal care ingredients. Over our history, we have also invested in and developed products, technology and market opportunities in the industrials area, which includes fuels, industrial oils, and the oilfield/Encapso® business. In line with our strategy to focus our commercial efforts on food and specialty personal care ingredients, we will be opportunistic in our pursuit of strategic alternatives for the industrials business and identify and partner with organizations who have the operational capabilities needed to realize the potential of those businesses.
Our food oils are formulated to offer a variety of functional benefits such as enhanced structuring capabilities and stability while providing robust formulation and process flexibility. These food oils have the potential to improve upon conventionally utilized specialty fats and oils and our high oleic algae oil has received a FDA generally recognized as safe (GRAS) "No Questions" letter. Currently, these oils are commercially available in our AlgaWise® branded food oil platform and in our consumer culinary oil Thrive® brand. In addition, we have developed novel methods of preparing powdered forms of triglyceride oils and vegan proteins, and our powdered ingredients are composed of unmodified whole algae cells. AlgaVia® Lipid Powder (commonly known as whole algae flour) and AlgaVia® Protein (commonly known as whole algae protein) are whole algae ingredients that can improve the nutritional profile of foods and beverages. AlgaVia® Lipid Powder is a new fat source that allows for the reduction or replacement of dairy fats, oils, and eggs. AlgaVia® Protein is a new vegan source of protein that is free of known allergens and gluten. Both AlgaVia® Lipid Powder and Protein can be used across a range of applications such as beverages (ready-to-drink and powdered), bakery, snacks, bars, dressings, sauces and frozen desserts and each ingredient received a FDA GRAS “No Questions” letter. In May 2016, we and Bunge announced that we launched a native, whole algae DHA, docosahexaenoic acid, a long chain omega-3 fatty acid as a sustainable specialty feed ingredient, prioritizing the aquaculture market.
Our manufacturing process is compatible with commercial-scale, widely-available fermentation and oil recovery equipment. We operate our lab and pilot fermentation and recovery equipment as scaled-down versions of our large commercial engineering designs, such as those used to perform development work under certain agreements with strategic partners and to fulfill commercial supply agreements. We have scaled up our technology platform and have successfully operated at lab (5-15 liter), pilot (600-1,000 liter), demonstration/small commercial (120,000 liter) and large commercial (approximately 500,000 liter and above) fermenter scale.
43
Since 2011, we have entered into multiple Joint Development Agreements (JDAs) with Bunge to jointly develop microbe-derived oils, powders and biomass products, and explore the production of such products from Brazilian sugarcane feedstock. In April 2012, we formed with Bunge Solazyme Bunge Renewable Oils Cooperatief U.A., (SB Oils JV) which wholly owns Solazyme Bunge Produtos Renováveis Ltda. (SB Oils). SB Oils operates a commercial-scale renewable algae oils production facility adjacent to Bunge's Moema sugar mill in Brazil. In addition, the SB Oils plant has been designed to be expanded for further production in line with market demand. Additional capital expenditures may be required to reach nameplate capacity depending on the product mix produced at the plant. We own 50.1% of the SB Oils JV and Bunge Global Innovation, LLC owns the remaining 49.9%. We account for the SB Oils JV under the equity method of accounting and the SB Oils JV results are not consolidated with our operations. See Significant Partner Agreements and Note 4 to our consolidated financial statements in item 8 for further discussion on the SB Oils JV. References to the SB Oils JV include activities of SB Oils unless otherwise noted. On February 28, 2017, Bunge Limited filed its 2016 Annual Report on Form 10-K in which it reported equity investment impairment charges of $44 million in the fourth quarter of 2016 that included an impairment charge of Bunge’s equity investment in the SB Oils JV. See Note 4 to our consolidated financial statements to this 2016 Annual Report on Form 10-K for our analysis of our $42.4 million equity investment in the SB Oils JV.
In August 2016 we sold our Algenist skincare business to TCP Algenist LLC, an affiliate of Tengram Capital Partners and Algenist Holdings, Inc. Upon closing, we received approximately $18.8 million in cash, net of closing costs, and a 19.9% ownership interest in Algenist Holdings Inc., which is accounted for under the equity method. We expect to supply active ingredients formulated in the Algenist product line to Algenist. We have presented the historical results of Algenist as discontinued operations for all periods presented in this filing.
Our business has not been generating sufficient cash flow from operations, and funds may not be available in an amount sufficient to enable us to pay our indebtedness, or to fund our other liquidity needs, and we could utilize our available financial resources sooner than we currently expect. We may not be able to raise sufficient additional funds on terms that are favorable to us, if at all. If we fail to raise adequate funds and continue to incur losses, we will not be able to fund our operations or continue our business as a going concern. For additional information, see Note 3 - Going Concern Uncertainty - of the notes to the consolidated financial statements.
Financial Operations Overview
Revenues
Our total revenues are generated from (1) sales of our products and (2) funding from our R&D agreements with strategic partners, including the SB Oils JV. Our total revenues were $18.5 million, $22.9 million and $36.0 million in 2016, 2015, and 2014, respectively. We intend to focus on growing product revenues primarily in the unconsolidated SB Oils JV in 2017. As a result, we expect our reported consolidated revenues to decrease in 2017 compared to 2016, primarily due to lower research and development programs revenues as certain funded programs shift toward commercial product revenue in the unconsolidated SB Oils JV.
Product revenues consist of sales of our food, nutrition and specialty ingredients; and also includes sales of our Industrial oils, Encapso® product, and fuel blend sales related to our fuels marketing and commercial development programs. We began to sell ingredient products more broadly into the Industrial Products markets in the first quarter of 2014, as we began to commercially produce and distribute products from the Clinton/Galva Facilities, and from the SB Oils JV plant in May 2014. As of December 31, 2016, we focused commercial production at the SB Oils plant on a select portfolio of oils, with supplemental powdered food product capabilities for AlgaVia® products and developmental oils being produced at our Peoria facility. We believe that for the intermediate term, the bulk of products sold based on the technology developed at TerraVia will be produced at the SB Oils plant and will be sold by SB Oils. Additionally, we have rights under the SB Oils JV agreement that allow us to produce certain products at the SB Oils plant, however we believe those products will take time to develop and commercialize. Product revenues represented 19%, 44%, and 36% of our total revenues for 2016, 2015, and 2014, respectively.
We are currently engaged in development activities with multiple strategic partners and the SB Oils JV, and we expect research and development program revenues to comprise a significant portion of overall revenue for 2017. Our revenues from development agreements with the SB Oils JV and strategic partners fluctuate due to timing and terms of the development work performed and achievement of contract milestones defined in these agreements. R&D program revenues represented 81%, 56%, and 64% of our total revenues for 2016, 2015, and 2014, respectively.
Cost of Product Revenues
44
Cost of product revenues consist primarily of certain costs of our Peoria facility, third-party contractor costs associated with the production, distribution and packaging of our products, as well as shipping, supplies, internal labor and other overhead costs. Prior to our products' meeting any applicable regulatory requirements, all manufacturing and related production costs are recorded as research and development expenses.
Research and Development Expenses
Our research and development efforts are directed at (1) identifying, isolating and further optimizing strains of microalgae to achieve high cell densities, high yield converting sugar to product and high productivity rates compared to other alternatives; (2) tailoring the oil outputs to meet specific market needs; (3) product and process development projects aimed at reducing the cost of oil production; and (4) scale-up of commercial scale production as well as product and process development activities at our production facilities.
We expense our research and development costs as they are incurred. Our research and development programs are undertaken to advance our overall technology platform that enables us to produce high-value algae oils and other products. Although our partners fund certain development activities, they benefit from advances in our technology platform as a whole, including costs funded by other development programs. Therefore, costs for such activities have not been separated as these costs have all been determined to be part of our total research and development related activity.
Research and development expenses consist primarily of personnel and related costs including non-cash stock-based compensation, third party contract manufacturers, reimbursable equipment and other costs associated with our work on R&D programs associated with our collaboration agreements with strategic partners. In addition, research and development expenses include certain costs associated with the Peoria facility and contract manufacturers' facilities, feedstock and supplies, depreciation and amortization of property and equipment used in the development of our algae oil products as we scale up our manufacturing facilities and processes to commercial scale production.
Sales, General and Administrative Expenses
Sales, general and administrative expenses consist primarily of personnel and related costs including non-cash stock-based compensation related to our executive management, corporate administration, sales, marketing and business development functions, professional services, marketing programs and samples, facility and administrative overhead expenses and unabsorbed production costs associated with excess capacity. Professional services consist primarily of consulting, external accounting, legal and investor relations fees associated with operating as a publicly-traded company.
Critical Accounting Policies and Estimates
Our discussion and analysis of our financial condition and results of operations is based upon our consolidated financial statements, which have been prepared in accordance with accounting principles generally accepted in the United States. The preparation of our consolidated financial statements requires us to make estimates, assumptions and judgments that affect the reported amounts of assets, liabilities, revenues, expenses and related disclosures. The results of our analysis form the basis for making assumptions about the carrying values of assets and liabilities that are not readily apparent from other sources. Our actual results may differ from these estimates under different assumptions or conditions. We evaluate our estimates, assumptions and judgments on an ongoing basis.
We believe the following critical accounting policies involve significant areas of management’s judgments and estimates in the preparation of our consolidated financial statements.
Revenue Recognition
Revenues are recognized when the following criteria are met: (1) persuasive evidence of an arrangement exists; (2) transfer of title has been completed or services have been rendered; (3) the fee is fixed or determinable; and (4) collectability is reasonably assured. We recognize revenues from research and development programs that consist of collaborative research and development agreements with commercial and strategic partners and related parties, and commercial sales of our products.
Collaborative research and development programs with commercial and strategic partners typically provide us with multiple revenue streams, which may include up-front non-refundable fees for licensing and reimbursement for research and development activities; cost reimbursement fees may include reimbursement for full-time employee equivalents, contingent milestone payments upon achievement of contractual criteria, licensing fees and commercialization royalty fees. These revenues are recognized as the services are performed over a performance period, as specified in the respective agreements. When up-front payments are combined with funded research services in a single unit of accounting, we recognize the payments
45
using the straight-line method of revenue recognition, as that best approximates actual performance under our Collaborative agreements, but not greater than the amount of the research and development program fee as specified under these agreements. We evaluate the appropriate period based on research progress attained and reevaluate the period when significant changes occur. Where arrangements include milestones that are determined to be substantive and at risk at the inception of the arrangement, revenues are recognized upon achievement of the milestone and are limited to those amounts for which collectability is reasonably assured. If these conditions are not met, the milestone payments are deferred and recognized as revenue over the estimated period of performance under the contract as we complete our performance obligations.
If collaborative research and development or sales agreements contain multiple elements, we evaluate whether the components of each arrangement represent separate units of accounting. We have determined that all of our revenue arrangements should be accounted for as a single unit of accounting. Application of revenue recognition standards requires subjective determination and requires management to make judgments about the fair values of each individual element and whether it is separable from other aspects of the contractual relationship.
Impairment Assessment of Equity Method Investments
We periodically review if a series of operating losses or other factors might indicate that a decrease in value of our equity method investments has occurred that is other than temporary.
We assessed the recoverability of our $42.4 million equity investment in the SB Oils JV as of December 31, 2016 using a discounted cash flow analysis. We also compared the discounted cash flow analysis to a market approach based upon relevant market multiples. Our analysis was performed using the guidance from ASC 323, Investments - Equity Method and Joint Ventures, Subsequent Measurement, which states that a loss in value of an investment that is an other than a temporary decline shall be recognized. A current fair value of an investment that is less than its carrying amount may indicate a loss in value of the investment. However, a decline in the quoted market price below the carrying amount or the existence of operating losses is not necessarily indicative of a loss in value that is other than temporary. With consideration to the above guidance, we evaluated our ongoing business activities at the SB Oils JV and concluded there was no impairment of our investment in the SB Oils JV as of December 31, 2016. The process of evaluating the potential impairment is subjective and requires significant estimates and assumptions. Our estimated future cash flows are based on assumptions that are consistent with our annual planning process and include estimates for revenue and operating margins and future economic and market conditions. Actual future results may differ significantly from those estimates. Changes in assumptions or circumstances could result in an impairment in the period the change occurs and in future years. Management’s conclusion that our equity investment in the SB Oils JV was not impaired as of December 31, 2016 was based upon the following critical estimates and assumptions:
Revenues
• | material increases in product revenues from $10 million in 2016 to over $200 million in 2021 and future years, primarily from AlgaPrime™ DHA sales; |
• | maintain current average selling prices based on current contracted prices; |
Costs
• | maintain access to cane sugar feedstock; |
• | increase production volumes by optimizing plant throughput and increasing yields, drying rates and final recovery rates; |
• | reduction of production costs through increased fermentation and recovery efficiencies combined with increasing volumes; |
• | increase in contribution margins; |
Capital Expenditures
• | capital expenditure of $3 million in 2017 on dryer refurbishment; |
46
• | additional capital investment of $20 million to $30 million over the next five years to improve throughput rates and increase capacity; |
Other
• | discount rate of approximately 14%; and |
• | no significant adverse change in the regulatory or economic environment in Brazil or other countries, as applicable |
We also performed independent breakeven sensitivity analyses, and determined there would be no impairment as of December 31, 2016, as follows:
• | If sales volume were 37% less than forecast in the years 2017 through 2030; |
• | If the contribution margin was 47% less than forecast in the years 2017 through 2030; or |
• | If the discount rate was increased to approximately 20%. |
The estimates used for cash flow forecasts required significant exercise of judgment and are subject to change in future reporting periods as facts and circumstances change. Additionally, we may make changes to our and the SB Oils JV business plan that could result in changes to the expected cash flows. As a result, it is possible that impairments may be required in 2017 or future reporting periods.
Stock-Based Compensation
We recognize stock-based compensation for awards to employees based on the grant date estimated fair value. We use the Black-Scholes option-pricing model to estimate the fair value of awards granted to employees, and the requisite fair value is recognized as expense on a straight-line basis over the service period of the award, which is generally the vesting period.
We account for restricted stock units issued to employees based on the quoted market price of our common stock on the date of grant, which is then expensed on a straight-line basis over the service period.
The Black-Scholes option pricing model requires the following inputs: expected life, expected volatility, risk-free interest rate, expected dividend yield rate, exercise price and closing price of our common stock on the date of grant. Due to our limited history of grant activity, we calculate our expected term utilizing the “simplified method” permitted by the Securities and Exchange Commission (SEC), which is the average of the total contractual term of the option and its vesting period.
We use the Black-Scholes option-pricing model to estimate the fair value of awards granted to nonemployees. We account for restricted stock units issued to nonemployees based on the estimated fair value of our common stock on the date of grant. The measurement of stock-based compensation for nonemployees is subject to periodic adjustments as the underlying equity instruments vest, and the resulting change in value, if any, is recognized in our consolidated statements of operations during the period the related services are rendered.
Results of Operations
Comparison of Years Ended December 31, 2016 and 2015
Revenues
Year ended December 31, | |||||||||||
2016 | 2015 | $ Change | |||||||||
(In thousands) | |||||||||||
Revenues: | |||||||||||
Product revenues | $ | 3,483 | $ | 10,022 | $ | (6,539 | ) | ||||
Research and development programs | 14,999 | 12,831 | 2,168 | ||||||||
Total revenues | $ | 18,482 | $ | 22,853 | $ | (4,371 | ) | ||||
47
Product Revenues and Cost of Product Revenues
Product revenues and cost of product revenues for 2016 and 2015 were as follows:
Year Ended December 31, | |||||||||||
2016 | 2015 | $ Change | |||||||||
Product revenues | $ | 3,483 | $ | 10,022 | $ | (6,539 | ) | ||||
Cost of product revenues | 5,256 | 10,563 | (5,307 | ) | |||||||
Gross margin (loss) | $ | (1,773 | ) | $ | (541 | ) | $ | (1,232 | ) | ||
Gross margin % | (51 | )% | (5 | )% | (46 | )% | |||||
Product revenues decreased $6.5 million in 2016 compared to 2015 primarily due to decreased revenues from our fuels marketing and commercial development program and Encapso® and industrial oil products, in line with our strategy to focus on food, nutrition and specialty ingredients.
During scale-up of the manufacturing process at the Archer Daniels Midland Company Clinton (ADM Clinton) and American Natural Processors Galva (ANP Galva) facilities (collectively, Clinton/Galva Facilities) in 2015, and in our Peoria facility in 2016, certain production costs were charged to research and development and selling, general and administrative expenses in line with applicable accounting standards. Gross margins would have been lower in 2015 and 2016 if such production costs had been charged to cost of product revenues.
Our gross margin was a negative 51% in 2016 compared to a negative 5% gross margin in 2015. This was primarily due to an inventory write off of Encapso® product in the fourth quarter of 2016 of $1.3 million, as we reduce focus on non-core activities outside of food, nutrition and specialty ingredients, as well as changes in product mix.
We plan to focus on our production at the SB Oils plant and at our Peoria facility in the immediate future on a narrow set of food and nutritional and specialty products, and believe this strategic decision will better align our immediate production assets with our operating strategy while minimizing production costs.
Research and Development Programs Revenue
We are currently engaged in development activities with multiple strategic partners and the SB Oils JV, and we expect research and development program revenues to comprise a significant portion of overall revenue for 2017. Research and development programs revenues (net of intercompany eliminations) increased $2.2 million in 2016 compared to 2015 primarily due to a new development agreement with the SB Oils JV partially offset by a decrease in revenues from collaboration agreements with other partners.
Operating Expenses
2016 | 2015 | $ Change | |||||||||
(In thousands) | |||||||||||
Operating expenses: | |||||||||||
Research and development | $ | 31,116 | $ | 48,094 | $ | (16,978 | ) | ||||
Sales, general and administrative | 43,741 | 62,041 | (18,300 | ) | |||||||
Restructuring charges | 1,412 | 4,953 | (3,541 | ) | |||||||
Total operating expenses | $ | 76,269 | $ | 115,088 | $ | (38,819 | ) | ||||
Research and Development Expenses
Research and development expenses decreased $17.0 million in 2016 compared to 2015, primarily due to decreases in personnel-related costs of $7.4 million, scale-up production costs related to operations at the Clinton/Galva Facilities of $2.9 million, product development, process development, and other costs of $3.2 million, and consumable supply costs of $1.1 million. Personnel-related costs include non-cash stock-based compensation expense of $2.6 million in 2016 compared to $4.6
48
million in 2015. Research and development expenses included expenses at our Peoria facility of $6.6 million in 2016 and $9.6 million in 2015.
We expect overall research and development expenses to decrease in 2017 compared to 2016, primarily due to lower employee costs and other cost reductions.
Sales, General and Administrative Expenses
Sales, general and administrative expenses decreased $18.3 million in 2016 compared to 2015, primarily due to decreases in fixed third-party facilities costs associated with the Clinton/Galva facilities of $11.2 million, personnel-related costs of $4.9 million, and sales and marketing costs of $2.8 million. Personnel-related costs include non-cash stock-based compensation expense of $8.8 million in 2016 compared to $10.1 million in 2015.
We expect overall sales, general and administrative expenses to decrease in 2017 compared to 2016, primarily due to lower employee costs and other cost reductions.
Restructuring Charges
Restructuring charges decreased $3.5 million in 2016 compared to 2015, primarily due to 2015 incurring more significant charges related to a strategic decision to terminate our current manufacturing agreements at the ADM Clinton and ANP Galva Facilities to better align our immediate production assets with our operating strategy while minimizing production costs.
Other Income (Expense), Net
Year ended December 31, | |||||||||||
2016 | 2015 | $ Change | |||||||||
(In thousands) | |||||||||||
Other income (expense): | |||||||||||
Interest and other income, net | $ | 1,748 | $ | 964 | $ | 784 | |||||
Interest expense | (13,545 | ) | (14,160 | ) | 615 | ||||||
Debt conversion expense | (9,770 | ) | — | (9,770 | ) | ||||||
Loss from equity method investments | (22,391 | ) | (22,389 | ) | (2 | ) | |||||
Gain from change in fair value of derivative liability | 82 | 1 | 81 | ||||||||
Total other income (expense), net | $ | (43,876 | ) | $ | (35,584 | ) | $ | (8,292 | ) | ||
Interest and Other Income, Net
Interest and other income, net increased $0.8 million in 2016 compared to 2015, primarily due to sublease rental income. Our interest income will vary for each reporting period depending on our average investment balances during the period and market interest rates.
Interest Expense
Interest expense decreased $0.6 million in 2016 compared to 2015, primarily due to lower amounts outstanding on our Convertible Notes following conversion of convertible debt to equity in 2016. We expect interest expense to decrease slightly in 2017 compared to 2016, based on an existing and active agreement to reduce a certain amount of convertible debt.
Debt Conversion Expense
Debt conversion expense increased $9.8 million in 2016 compared to 2015, after we exchanged 2018 and 2019 Notes totaling approximately $30.6 million by issuing 9,022,954 new shares (including 4,550,208 inducement shares) of our common stock.
Loss from Equity Method Investments
Loss from equity method investments remained relatively constant in 2016 compared to 2015. We expect the loss from our equity method investments to decrease in 2017 compared to 2016 due to optimization of the SB Oils JV plant that is expected to reduce production costs and increase commercial sales.
49
We assessed the recoverability of our equity investment in the SB Oils JV as of December 31, 2016 and concluded that we expect to recover the carrying amount of our equity investment and our equity investment was not impaired. See discussion of Impairment Assessment of Equity Method Investments in Critical Accounting Policies and Estimates above for impairment considerations.
Benefit from Income Taxes
We have incurred net operating losses for 2016, 2015 and 2014, and therefore have no overall provision for income taxes for these years. Income tax benefit from continuing operations was $2.1 million in 2016 represents the intraperiod allocation to continuing operations, as a result of recording the income tax expense of $2.1 million related to the sale of the Algenist business in discontinued operations.
Discontinued Operations As further described in Note 18 to our consolidated financial statements, in August 2016 we sold our Algenist skincare business to TCP Algenist LLC, an affiliate of Tengram Capital Partners and Algenist Holdings, Inc. in exchange for $20.2 million in cash (before $1.4 million closing costs), 19.9% of the fully diluted equity of Algenist Holdings, Inc. and the assumption of substantially all of the liabilities related to the Algenist skincare business by Algenist Holdings, Inc. The gain on sale of Algenist before income taxes was approximately $9.0 million. The Algenist skincare business was previously presented as an operating segment. The results of operations and financial position of Algenist have been presented as discontinued operations for all periods.
Results of Operations
Comparison of Years Ended December 31, 2015 and 2014
Revenues
Year ended December 31, | |||||||||||
2015 | 2014 | $ Change | |||||||||
(In thousands) | |||||||||||
Revenues: | |||||||||||
Product revenues | $ | 10,022 | $ | 12,917 | $ | (2,895 | ) | ||||
Research and development programs | 12,831 | 23,045 | (10,214 | ) | |||||||
Total revenues | $ | 22,853 | $ | 35,962 | $ | (13,109 | ) | ||||
Product Revenues and Cost of Product Revenues
Product revenues and cost of product revenues for 2015 and 2014 were as follows:
2015 | 2014 | $ Change | |||||||||
Product revenues | $ | 10,022 | $ | 12,917 | $ | (2,895 | ) | ||||
Cost of product revenues | 10,563 | 12,866 | (2,303 | ) | |||||||
Gross margin (loss) | $ | (541 | ) | $ | 51 | $ | (592 | ) | |||
Gross margin % | (5 | )% | — | % | (5 | )% | |||||
Product revenues decreased $2.9 million in 2015 compared to 2014 due to decreased product sales related to our fuels marketing and commercial development program, consistent with our strategy to focus on high value product sales.
During scale-up of the manufacturing process at the ADM Clinton and ANP Galva Facilities in 2014 and 2015, certain production costs were charged to research and development and selling, general and administrative expenses. Product gross margins would have been lower in 2015 if such production costs had not been charged to operating expenses.
Our gross margin was a negative gross margin of 5% in 2015 compared to a 0% gross margin in 2014, primarily due to product mix, and consistent with our strategy to focus on high value product sales. Gross margin was lower in 2015 primarily due to lower industrial sales which have higher average selling prices, compared to the same period in 2014.
Research and Development Programs Revenue
50
Research and development programs revenue decreased by $10.2 million in 2015 compared to 2014, primarily due to decreased revenues from the development agreements with SB Oils and development agreements with strategic partners. Our revenues from development agreements with SB Oils and strategic partners fluctuate due to timing and terms of the development work performed and achievement of contract milestones defined in these agreements. Revenues from the SB Oils JV decreased in 2015 compared to 2014, primarily due to a reduction of revenue associated with technical and commercial services related to the operations of the SB Oils Plant and support for its commercial activities as the plant ramps up, partially offset by revenue associated with new development agreements entered into with the SB Oils JV in the fourth quarter of 2015.
Operating Expenses
Year ended December 31, | |||||||||||
2015 | 2014 | $ Change | |||||||||
(In thousands) | |||||||||||
Operating expenses: | |||||||||||
Research and development | $ | 48,094 | $ | 81,680 | $ | (33,586 | ) | ||||
Sales, general and administrative | 62,041 | 72,621 | (10,580 | ) | |||||||
Restructuring charges | 4,953 | 3,514 | 1,439 | ||||||||
Total operating expenses | $ | 115,088 | $ | 157,815 | $ | (42,727 | ) | ||||
Research and Development Expenses
Research and development expenses decreased $33.6 million in 2015 compared to 2014, primarily due to decreases in scale-up production costs related to operations at the Clinton/Galva Facilities of $17.2 million, personnel-related and costs of $9.7 million, product development costs of $3.3 million, consumables and supplies cost of $1.2 million, travel of $1.0 million and third party contract manufacturing and facilities costs of $1.1 million. The reduction in personnel related costs are related primarily to our restructuring activities implemented starting in late December 2014. Personnel-related costs include non-cash stock-based compensation expense of $4.6 million in 2015 compared to $7.4 million in 2014. Scale up costs decreased as we had limited operations at the Clinton/Galva Facilities in 2015 compared to 2014. Research and development expenses included expenses at our Peoria facility of $9.6 million in 2015 and $14.1 million in 2014.
Sales, General and Administrative Expenses
Sales, general and administrative expenses decreased $10.6 million in 2015 compared to 2014, primarily due to decreases in personnel-related costs of $12.8 million, costs from the 2014 litigation settlement and other external legal costs of $6.1 million, travel costs of $0.7 million, and professional and outside services of $0.8 million. These decreases were partially offset by a $10.2 million increase in unallocated fixed costs for the Clinton/Galva Facilities associated with the facilities not operating at full capacity, increased marketing and promotional costs of $0.6 million and $0.5 million of increased facility costs. Personnel-related costs decreased due to decreased non-cash stock-based compensation expense and decreased personnel costs as a result of restructuring activities implemented in December 2014. Personnel-related costs include non-cash stock-based compensation of $10.1 million in 2015 compared to $16.9 million in 2014. Stock-based compensation decreased in 2015 compared to 2014 primarily due to the restructuring activities implemented in December 2014 and stock option modification expense recorded in 2014.
During 2015, our facilities were not operating at full capacity as we managed limited production campaigns at the Clinton/Galva Facilities to focus on establishing operations at the SB Oils plant pursuant to our 2014 Restructuring Plan.
Restructuring Charges
Restructuring charges increased $1.4 million in 2015 compared to 2014, primarily due to 2015 incurring more significant charges related to a strategic decision to terminate our current manufacturing agreements at the ADM Clinton and ANP Galva facilities to better align our immediate production assets with our operating strategy while minimizing production costs.
In October 2015, we made a strategic decision to terminate our current manufacturing agreements at the ADM Clinton and ANP Galva facilities to better align our immediate production assets with our operating strategy while minimizing production costs (2015 Exit Plan). On October 29, 2015, we provided to ADM a notice of termination of the Operating Agreement entered into with ADM in 2012 related to the production of products at the ADM Clinton facility, and as a result, the Strategic
51
Collaboration Agreement with ADM automatically terminated on February 26, 2016. In December 2015, we entered into a termination agreements with ADM Clinton and ANP Galva (collectively, the ADM and ANP Termination Agreements).
In December 2014 we took steps to decrease operating expenses through a reduction in workforce and other cost-cutting measures (2014 Restructuring Plan). These targeted reductions were designed to enable us to achieve sustainable cash flow in the future.
Other Income (Expense), Net
Year ended December 31, | |||||||||||
2015 | 2014 | $ Change | |||||||||
(In thousands) | |||||||||||
Other income (expense): | |||||||||||
Interest and other income, net | $ | 964 | $ | 1,328 | $ | (364 | ) | ||||
Interest expense | (14,160 | ) | (11,711 | ) | (2,449 | ) | |||||
Debt conversion expense | — | (1,766 | ) | 1,766 | |||||||
Loss from equity method investments | (22,389 | ) | (23,037 | ) | 648 | ||||||
Gain from change in fair value of derivative liabilities | 1 | 8,744 | (8,743 | ) | |||||||
Total other income (expense), net | $ | (35,584 | ) | $ | (26,442 | ) | $ | (9,142 | ) | ||
Interest and other income, net
Interest and other income, net decreased $0.4 million in 2015 compared to 2014, primarily due to interest income earned on lower investment balances.
Interest expense
Interest expense increased $2.4 million in 2015 compared to 2014, primarily due to increased interest expense as a result of the 2019 Notes issued in April 2014.
Debt conversion expense
Debt conversion expense decreased $1.8 million in 2015 compared to 2014, primarily due a charge associated with the conversion of convertible debt to equity in 2014, with no similar transactions occurring in 2015.
Gain from Change in Fair Value of Derivative Liabilities
Gain from change in fair value of derivative liabilities decreased $8.7 million in 2015 compared to 2014, primarily due to the change in the fair value of the embedded derivatives related to the 2018 Notes and 2019 Notes (Notes) being $1,000 in 2015, compared to a $8.1 million gain in 2014 primarily due to the decline in our stock price.
Liquidity and Capital Resources
Total cash and cash equivalents and marketable securities available-for-sale were:
December 31, 2016 | December 31, 2015 | ||||||
(In thousands) | |||||||
Cash and cash equivalents | $ | 63,509 | $ | 46,966 | |||
Marketable securities available-for-sale | 522 | 51,009 | |||||
Total cash and cash equivalents and marketable securities | $ | 64,031 | $ | 97,975 | |||
Cash, cash equivalents and marketable securities decreased by $33.9 million in 2016, primarily due to cash used in operating activities of $64.5 million and $19.3 million of capital contributed to the SB Oils JV, partially offset by net proceeds from the issuance of convertible preferred stock of approximately $27.0 million, the sale of Algenist of $18.8 million, and the issuance of common stock of $5.8 million.
52
The following table shows a summary of our cash flows from continuing operations:
Year ended December 31, | |||||||||||
2016 | 2015 | 2014 | |||||||||
(In thousands) | |||||||||||
Net cash used in operating activities | $ | (60,427 | ) | $ | (81,764 | ) | $ | (116,361 | ) | ||
Net cash provided by investing activities | $ | 29,220 | $ | 89,455 | $ | (95,091 | ) | ||||
Net cash provided by financing activities | $ | 32,822 | $ | 708 | $ | 201,082 | |||||
Liquidity
We are an emerging growth company with a limited operating history. We only recently began commercializing our products. To date, a substantial portion of revenues has consisted of funding from third party collaborative research agreements and government grants. We have generated limited revenues from commercial sales. We intend to focus on growing product revenues primarily in the unconsolidated SB Oils JV in 2017. As a result, we expect our reported consolidated revenues to decrease in 2017 compared to 2016, primarily due to lower research and development programs revenues as certain funded programs shift toward commercial product revenue in the unconsolidated SB Oils JV.
Net losses may continue as we ramp up manufacturing capacity and build out our product pipeline. We expect to incur additional costs and expenses related to the continued development and expansion of our business, including research and development, the operation of our facility in Peoria, the ramp up and operation of the SB Oils JV plant and other facilities.
We, along with our development and commercialization partners, need to develop products successfully, cost effectively produce them in large quantities and market and sell such products profitably. Our failure to generate sufficient revenues, achieve planned gross margins, control operating costs or raise sufficient additional funds may require us to modify, delay or abandon our planned operations, which could have a material adverse effect on the business, operating results, financial condition and ability to achieve intended business objectives. We may be required to seek additional funds through collaborations, public or private debt or equity financings or government programs, and may also seek to reduce expenses related to our operations. There can be no assurance that any financing will be available or on acceptable terms.
As of December 31, 2016, there was $32.5 million outstanding of convertible notes (2018 Notes), due on February 1, 2018, and $148.1 million outstanding of convertible notes (2019 Notes), due on October 1, 2019. Accordingly, we had $32.5 million due in 13 months from December 31, 2016 or 10.5 months from March 16, 2017 (the date of the filing of this Form 10-K), and $148.1 million due in 2.7 years from December 31, 2016 or 2.5 years from March 16, 2017. Cash and cash equivalents and forecasted cash flows from operations are not sufficient to sustain our operations and meet such obligations through March 31, 2018.
On February 24, 2017, we announced that we had retained Rothschild Inc. (Rothschild) as our financial advisor and that we were in discussions with a number of potential investors to raise additional capital and/or recapitalize our outstanding convertible senior subordinated notes. However, no agreements have been made and such discussions may not lead to a transaction.
We have directed Rothschild to assist us in the following objectives:
• | restructure or refinance a substantial portion of our 2018 and 2019 Notes; |
• | raise additional capital via a combination of the following potential activities |
•Issuance of new equity
•Issuance of new debt;
•Entering partnerships for our AlgaVia® food powders and/or our Thrive® Consumer businesses;
• | and/or the outright sale of certain other assets |
In addition to the above activities directed by our financial advisor, we also have the ability to execute a combination of the following initiatives:
53
• | sell additional equity through an existing effective registration statement (we sold common stock for cash proceeds of approximately $4.8 million in the last five months of 2016); |
• | convert individual holders of the convertible 2018 and 2019 Notes into our common stock through induced conversions (in 2016, we exchanged 2018 and 2019 Notes totaling approximately $30.6 million by issuing 9.0 million shares (including 4.6 million inducement shares); and/or |
• | further streamline operations which may result in further reduction in headcount and other expenses (in 2016, we reduced our workforce by approximately 20%). |
The accompanying consolidated financial statements have been prepared assuming that we will continue as a going concern. There is significant uncertainty regarding our ability to meet our obligations and sustain our operations through March 31, 2018. These conditions raise substantial doubt as to our ability to continue as a going concern. Management’s plans concerning these matters are discussed above. Our independent registered public accounting firm, Deloitte & Touche LLP, has included a going concern uncertainty explanatory paragraph in its Report of Independent Registered Public Accounting Firm issued to us in connection with this 2016 Annual Report on Form 10-K. The accompanying consolidated financial statements do not include any adjustments that might result from the outcome of this going concern uncertainty.
Cash Flows from Operating Activities from Continuing Operations
Cash used in operating activities was $60.4 million in 2016 compared to $81.8 million in 2015, and $116.4 million in 2014. These decreases were primarily due to lower loss from continuing operations primarily as a result of reduced operating expenses. The following table outlines the remaining components of cash used in continuing operations (in thousands):
Year ended December 31, | |||||||||||
2016 | 2015 | 2014 | |||||||||
Loss from continuing operations | $ | (104,857 | ) | $ | (138,382 | ) | $ | (161,161 | ) | ||
Non cash charges: | |||||||||||
Loss from equity method investments | 22,391 | 21,994 | 23,432 | ||||||||
Stock-based compensation expense | 11,450 | 14,614 | 24,345 | ||||||||
Debt conversion expense | 9,770 | — | 1,766 | ||||||||
Depreciation and amortization | 4,753 | 5,832 | 6,274 | ||||||||
Other Non-cash charges | 1,159 | 6,276 | (1,501 | ) | |||||||
Total Non-cash charges | 49,523 | 48,716 | 54,316 | ||||||||
Net change in operating assets and liabilities | (5,093 | ) | 7,902 | (9,516 | ) | ||||||
Net cash used in operating activities — continuing operations | $ | (60,427 | ) | $ | (81,764 | ) | $ | (116,361 | ) | ||
The net change in our operating assets and liabilities from continuing operations for 2016 was as follows (in thousands):
Factor | Amount | Description | ||
Decreased accounts payable and accrued liabilities | $ | (3,242 | ) | Restructuring liability payoff in 2016 of amounts owed as of December 31, 2015 |
Accounts receivable | (2,159 | ) | Accounts receivable of $4.2 million contributed to investment in SBO Oils JV in 2016 partially offset by decrease in accounts receivable | |
Other | 308 | |||
Net change in operating assets and liabilities | $ | (5,093 | ) | |
Cash Flows from Investing Activities from Continuing Operations
Cash provided by investing activities from continuing operations was $29.2 million in 2016 primarily as a result of $50.4 million of net proceeds from marketable securities maturities and sales, partially offset by $19.3 million of capital contributed to the SB Oils JV and $1.9 million of equipment purchases.
54
Cash provided by investing activities from continuing operations was $89.5 million in 2015 primarily as a result of $112.6 million of net proceeds from marketable securities maturities and sales, partially offset by $22.3 million of capital contributed to the SB Oils JV and $1.2 million of equipment purchases.
In 2014, cash used in investing activities from continuing operations was $95.1 million, primarily as a result of $54.0 million of net marketable securities purchases, $32.6 million of capital contributed to the SB Oils JV, $7.2 million of capital expenditures related primarily to equipment installed at the Peoria and Clinton/Galva facilities, a $0.7 million letter of credit obtained for a lease agreement and $0.6 million of interest capitalized related to the SB Oils JV.
Cash Flows from Financing Activities
In 2016, cash provided by financing activities was $32.8 million, primarily due to net proceeds received of $27.0 million from the convertible preferred stock issuance in March 2016 and the issuance of common stock of $5.8 million.
In 2015, cash provided by financing activities was $0.7 million, primarily due to proceeds received from common stock issuances pursuant to our equity plans.
In 2014, cash provided by financing activities was $201.1 million, primarily due to $202.6 million of proceeds received from the issuance of the 2019 Notes and Common Stock Offering, net of underwriting discounts and offering issue costs and $8.9 million of proceeds received from common stock issuances pursuant to our equity plans, partially offset by $10.4 million of principal debt payments.
BNDES Loan
In February 2013, SB Oils entered a loan agreement with the Brazilian Development Bank (BNDES) under which it could borrow up to R$245.7 million (approximately USD $75.4 million based on the exchange rate as of December 31, 2016). As of December 31, 2016, approximately $52.6 million was outstanding under the BNDES loan based on the exchange rate as of December 31, 2016. We have provided a bank guarantee equal to 14.39% of the total amount available under the BNDES Loan and may be required to provide a corporate guarantee equal to 35.71% of the total amount available under the BNDES Loan (with the total amount covered by the guarantees not to exceed our ownership percentage in the SB Oils JV). We expect to evaluate the optimal amount of SB Oils JV-related capital expenditures that we agree to fund on a case-by-case basis. These events may require us to access additional capital through equity or debt offerings. If we are unable to access additional capital, our growth may be limited due to the inability to build out additional manufacturing capacity.
SVB Letter of Credit and Loan and Security Agreement
In the second quarter of 2016, we entered into an agreement with Silicon Valley Bank that provides for a $12.9 million letter of credit facility for letters of credit denominated in U.S. dollars or a foreign currency. On April 29, 2016, Silicon Valley Bank issued a standby letter of credit (SVB SLOC) to support the bank guarantee issued on our behalf to BNDES in connection with the loan agreement entered into in 2013 between BNDES and SB Oils. The SVB SLOC is being supported by a bank confirmation issued by the Bank of Nova Scotia on behalf of Silicon Valley Bank.
Convertible Debt
2018 Notes—In January 2013, we issued $125.0 million aggregate principal amount of 2018 Notes that will mature on February 1, 2018. We had $32.5 million aggregate principal amount of 2018 Notes outstanding as of December 31, 2016.
2019 Notes—On April 1, 2014, we issued $149.5 million aggregate principal amount of 2019 Notes that will mature on October 1, 2019. We had $148.1 million aggregate principal amount of 2019 Notes outstanding as of December 31, 2016.
Contractual Obligations and Commitments
The following is a summary of our contractual obligations and commitments as of December 31, 2016 (in thousands)
Total | 2017 | 2018 | 2019 | 2020 and beyond | |||||||||||||||
Principal payments on long-term debt | $ | 180,558 | $ | — | $ | 32,485 | $ | 148,073 | $ | — | |||||||||
Interest payments on long-term debt, fixed rate | 25,135 | 9,353 | 8,378 | 7,404 | — | ||||||||||||||
Non-cancelable operating leases | 4,742 | 4,376 | 366 | — | — | ||||||||||||||
Total | $ | 210,435 | $ | 13,729 | $ | 41,229 | $ | 155,477 | $ | — | |||||||||
55
Off-Balance Sheet Arrangements
For information on variable interest entities and guarantees, refer to Notes 4, 10 and 11 in the accompanying notes to our consolidated financial statements.
Recent Accounting Pronouncements
Refer to Note 2 in the accompanying notes to our consolidated financial statements for a discussion of recent accounting pronouncements.
56
Item 7A. Quantitative and Qualitative Disclosures about Market Risk.
We are exposed to financial market risks, primarily changes in interest rates, currency exchange rates and commodity prices. All of the potential changes noted below are based on sensitivity analyses performed on our financial positions as of December 31, 2016. Actual results may differ materially.We are exposed to financial market risks, primarily changes in interest rates, currency exchange rates and commodity prices. All of the potential changes noted below are based on sensitivity analyses performed on our financial positions as of December 31, 2016. Actual results may differ materially.
Interest Rate Risk
Our exposure to market risk for changes in interest rates relates primarily to our investment portfolio and our outstanding debt obligations. As of December 31, 2016, our investment portfolio was not significant, and hence we believe we do not have material exposure to changes in fair value as a result of changes in interest rates. Our outstanding debt as of December 31, 2016 consists of fixed-rate debt, and therefore, is not subject to fluctuations in market interest rates.
Foreign Currency Risk
Our operations include manufacturing and sales activities primarily in the United States, as well as research activities primarily in the United States. We own 50.1% of Solazyme Bunge Renewable Oils Cooperatief U.A., a holding company which owns SB Oils. As we expand internationally, our results of operations and cash flows will become increasingly subject to fluctuations due to changes in foreign currency exchange rates. For example, our operations in Brazil and/or potential expansion elsewhere in Latin America or increasing Euro denominated product sales to European distributors, will result in our use of currencies other than the U.S. dollar. In addition, the local currency is the functional currency of our Brazil subsidiary and SB Oils (an unconsolidated joint venture). The assets and liabilities of the Brazil subsidiary are translated from its functional currency to U.S. dollars at the exchange rate in effect at the balance sheet date, with resulting foreign currency translation adjustments recorded in accumulated other comprehensive income (loss) in our consolidated statements of comprehensive loss. The assets and liabilities of SB Oils are also translated to U.S. dollars similar to our Brazil subsidiary, and we adjust our investment in SB Oils and cumulative translation adjustment in equity for our ownership portion of the cumulative translation gain or loss recognized on SB Oils' financial statements. As a result, our comprehensive income (loss), cash flows and expenses are subject to fluctuations due to changes in foreign currency exchange rates. In periods when the U.S. dollar declines in value as compared to the foreign currencies in which we incur expenses, our foreign-currency based expenses increase when translated into U.S. dollars. A hypothetical 10% adverse change in foreign currency exchange rate would have had a $1.2 million impact on our net loss for the year ended December 31, 2016. We have not hedged our foreign currency since the exposure has not been material to our historical operating results. Although substantially all of our sales are currently denominated in U.S. dollars, future fluctuations in the value of the U.S. dollar may affect the price competitiveness of our products outside the United States. We may consider hedging our foreign currency risk as we continue to expand internationally.
Commodity Price Risk
Our exposure to market risk for changes in commodity prices currently relates primarily to our purchases of plant sugar feedstock. A hypothetical 10% change in the cost of plant sugar feedstock would have had approximately a $0.5 million impact on our share of loss from equity method investment in the SB Oils JV for the year ended December 31, 2016. We have not historically hedged the price volatility of plant sugar feedstock. Also, fluctuations in the prices of petroleum or certain plant oils may also impact our business to the extent our products compete with petroleum or plant-oil-derived products. In the future, we may manage our exposure to these risks by hedging the price volatility of such products, principally through futures contracts, and entering into joint venture agreements that would enable us to obtain secure access to feedstock. See also “Risk Factors-Risks Related to Our Business and Industry," A decline in the price of petroleum and petroleum-based products, plant oils or other commodities may reduce demand for our products and may otherwise adversely affect our business.
57
Item 8. Financial Statements and Supplementary Data.
CONSOLIDATED FINANCIAL STATEMENTS
TerraVia Holdings, Inc.
Index
CONSOLIDATED FINANCIAL STATEMENTS AS OF DECEMBER 31, 2016 AND 2015 AND FOR THE YEARS ENDED DECEMBER 31, 2016, 2015 AND 2014: | |
58
REPORT OF INDEPENDENT REGISTERED PUBLIC ACCOUNTING FIRM
To the Board of Directors and Stockholders of TerraVia Holdings, Inc:
We have audited the accompanying consolidated balance sheets of TerraVia Holdings, Inc. and subsidiaries (the “Company”) as of December 31, 2016 and 2015, and the related consolidated statements of operations, comprehensive loss, stockholders’ (deficit) equity, and cash flows for each of the three years in the period ended December 31, 2016. These consolidated financial statements are the responsibility of the Company's management. Our responsibility is to express an opinion on these financial statements based on our audits.
We conducted our audits in accordance with the standards of the Public Company Accounting Oversight Board (United States). Those standards require that we plan and perform the audit to obtain reasonable assurance about whether the financial statements are free of material misstatement. An audit includes examining, on a test basis, evidence supporting the amounts and disclosures in the financial statements. An audit also includes assessing the accounting principles used and significant estimates made by management, as well as evaluating the overall financial statement presentation. We believe that our audits provide a reasonable basis for our opinion.
In our opinion, the consolidated financial statements referred to above present fairly, in all material respects, the financial position of TerraVia Holdings, Inc. and subsidiaries as of December 31, 2016 and 2015, and the results of their operations and their cash flows for each of the three years in the period ended December 31, 2016, in conformity with accounting principles generally accepted in the United States of America.
The accompanying consolidated financial statements have been prepared assuming that the Company will continue as a going concern. As discussed in Note 3 to the consolidated financial statements, the Company has incurred recurring net losses and negative cash flows from operations and expects significant uncertainty in generating sufficient cash flow to meet its obligations and sustain its operations, which raises substantial doubt about its ability to continue as a going concern. Management's plans in regard to these matters are also discussed in Note 3 to the consolidated financial statements. The consolidated financial statements do not include any adjustments that might result from the outcome of this uncertainty.
We have also audited, in accordance with the standards of the Public Company Accounting Oversight Board (United States), the Company's internal control over financial reporting as of December 31, 2016, based on the criteria established in Internal Control - Integrated Framework (2013) issued by the Committee of Sponsoring Organizations of the Treadway Commission and our report dated March 16, 2017 expressed an unqualified opinion on the Company's internal control over financial reporting.
/s/ DELOITTE & TOUCHE LLP
San Francisco, California
March 16, 2017
59
REPORT OF INDEPENDENT REGISTERED PUBLIC ACCOUNTING FIRM
To the Board of Directors and Stockholders of TerraVia Holdings, Inc:
We have audited the internal control over financial reporting of TerraVia Holdings, Inc. and subsidiaries (the "Company") as of December 31, 2016, based on criteria established in Internal Control - Integrated Framework (2013) issued by the Committee of Sponsoring Organizations of the Treadway Commission. The Company's management is responsible for maintaining effective internal control over financial reporting and for its assessment of the effectiveness of internal control over financial reporting, included in the accompanying Management's Report on Internal Control Over Financial Reporting. Our responsibility is to express an opinion on the Company's internal control over financial reporting based on our audit.
We conducted our audit in accordance with the standards of the Public Company Accounting Oversight Board (United States). Those standards require that we plan and perform the audit to obtain reasonable assurance about whether effective internal control over financial reporting was maintained in all material respects. Our audit included obtaining an understanding of internal control over financial reporting, assessing the risk that a material weakness exists, testing and evaluating the design and operating effectiveness of internal control based on the assessed risk, and performing such other procedures as we considered necessary in the circumstances. We believe that our audit provides a reasonable basis for our opinion.
A company's internal control over financial reporting is a process designed by, or under the supervision of, the company's principal executive and principal financial officers, or persons performing similar functions, and effected by the company's board of directors, management, and other personnel to provide reasonable assurance regarding the reliability of financial reporting and the preparation of financial statements for external purposes in accordance with generally accepted accounting principles. A company's internal control over financial reporting includes those policies and procedures that (1) pertain to the maintenance of records that, in reasonable detail, accurately and fairly reflect the transactions and dispositions of the assets of the company; (2) provide reasonable assurance that transactions are recorded as necessary to permit preparation of financial statements in accordance with generally accepted accounting principles, and that receipts and expenditures of the company are being made only in accordance with authorizations of management and directors of the company; and (3) provide reasonable assurance regarding prevention or timely detection of unauthorized acquisition, use, or disposition of the company's assets that could have a material effect on the financial statements.
Because of the inherent limitations of internal control over financial reporting, including the possibility of collusion or improper management override of controls, material misstatements due to error or fraud may not be prevented or detected on a timely basis. Also, projections of any evaluation of the effectiveness of the internal control over financial reporting to future periods are subject to the risk that the controls may become inadequate because of changes in conditions, or that the degree of compliance with the policies or procedures may deteriorate.
In our opinion, the Company maintained, in all material respects, effective internal control over financial reporting as of December 31, 2016, based on the criteria established in Internal Control - Integrated Framework (2013) issued by the Committee of Sponsoring Organizations of the Treadway Commission.
We have also audited, in accordance with the standards of the Public Company Accounting Oversight Board (United States), the consolidated financial statements as of and for the year ended December 31, 2016 of the Company and our report dated March 16, 2017 expressed an unqualified opinion on those consolidated financial statements and included an explanatory paragraph regarding the Company’s ability to continue as a going concern.
/s/ DELOITTE & TOUCHE LLP
San Francisco, California
March 16, 2017
60
TERRAVIA HOLDINGS, INC.
CONSOLIDATED BALANCE SHEETS
In thousands except per share amounts
December 31, 2016 | December 31, 2015 | ||||||
ASSETS | |||||||
Current assets: | |||||||
Cash and cash equivalents | $ | 63,509 | $ | 46,966 | |||
Marketable securities available-for-sale | 522 | 51,009 | |||||
Accounts receivable, net | 284 | 2,647 | |||||
Inventories | 2,345 | 3,212 | |||||
Current assets of discontinued operations | — | 13,389 | |||||
Prepaid expenses and other current assets | 1,339 | 1,721 | |||||
Total current assets | 67,999 | 118,944 | |||||
Property, plant and equipment, net | 22,674 | 25,996 | |||||
Equity method investments | 43,856 | 35,910 | |||||
Noncurrent assets of discontinued operations | — | 348 | |||||
Other assets | 1,180 | 774 | |||||
Total assets | $ | 135,709 | $ | 181,972 | |||
LIABILITIES, CONVERTIBLE PREFERRED STOCK AND STOCKHOLDERS’ DEFICIT | |||||||
Current liabilities: | |||||||
Accounts payable | $ | 4,159 | $ | 4,951 | |||
Accrued liabilities | 8,856 | 13,306 | |||||
Deferred revenue | 3,272 | 4,159 | |||||
Current liabilities of discontinued operations | — | 2,914 | |||||
Total current liabilities | 16,287 | 25,330 | |||||
Deferred revenue | — | 500 | |||||
Convertible debt | 174,620 | 202,015 | |||||
Noncurrent liabilities of discontinued operations | — | 26 | |||||
Other liabilities | 1,395 | 576 | |||||
Total liabilities | 192,302 | 228,447 | |||||
Commitments and contingencies (Note 11) | |||||||
Convertible preferred stock, par value $0.001—5,000 shares authorized; 27 and zero shares issued and outstanding at December 31, 2016 and 2015, respectively | 25,653 | — | |||||
Stockholders’ deficit: | |||||||
Common stock, par value $0.001—225,000 shares authorized; 96,436 and 81,734 shares issued and outstanding at December 31, 2016 and 2015, respectively | 96 | 82 | |||||
Additional paid-in capital | 645,927 | 585,679 | |||||
Accumulated other comprehensive loss | (16,808 | ) | (22,331 | ) | |||
Accumulated deficit | (711,461 | ) | (609,905 | ) | |||
Total stockholders’ deficit | (82,246 | ) | (46,475 | ) | |||
Total liabilities, convertible preferred stock and stockholders’ deficit | $ | 135,709 | $ | 181,972 | |||
See accompanying notes to the consolidated financial statements.
61
TERRAVIA HOLDINGS, INC.
CONSOLIDATED STATEMENTS OF OPERATIONS
In thousands, except per share amounts
Year Ended December 31, | |||||||||||
2016 | 2015 | 2014 | |||||||||
Revenues: | |||||||||||
Product revenues | $ | 3,483 | $ | 10,022 | $ | 12,917 | |||||
Research and development programs | 14,999 | 12,831 | 23,045 | ||||||||
Total revenues | 18,482 | 22,853 | 35,962 | ||||||||
Costs and operating expenses: | |||||||||||
Cost of product revenues | 5,256 | 10,563 | 12,866 | ||||||||
Research and development | 31,116 | 48,094 | 81,680 | ||||||||
Sales, general and administrative | 43,741 | 62,041 | 72,621 | ||||||||
Restructuring charges | 1,412 | 4,953 | 3,514 | ||||||||
Total costs and operating expenses | 81,525 | 125,651 | 170,681 | ||||||||
Loss from continuing operations before other income (expense): | (63,043 | ) | (102,798 | ) | (134,719 | ) | |||||
Other income (expense): | |||||||||||
Interest and other income, net | 1,748 | 964 | 1,328 | ||||||||
Interest expense | (13,545 | ) | (14,160 | ) | (11,711 | ) | |||||
Debt conversion expense | (9,770 | ) | — | (1,766 | ) | ||||||
Loss from equity method investments | (22,391 | ) | (22,389 | ) | (23,037 | ) | |||||
Gain from change in fair value of derivative liabilities | 82 | 1 | 8,744 | ||||||||
Total other expense, net | (43,876 | ) | (35,584 | ) | (26,442 | ) | |||||
Loss from continuing operations before income taxes | (106,919 | ) | (138,382 | ) | (161,161 | ) | |||||
Benefit from income taxes | (2,062 | ) | — | — | |||||||
Loss from continuing operations | (104,857 | ) | (138,382 | ) | (161,161 | ) | |||||
Income (loss) from discontinued operations, net of tax | 3,301 | (3,065 | ) | (980 | ) | ||||||
Net loss | $ | (101,556 | ) | $ | (141,447 | ) | $ | (162,141 | ) | ||
Net income (loss) per share, basic and diluted: | |||||||||||
Continuing operations | $ | (1.22 | ) | $ | (1.73 | ) | $ | (2.13 | ) | ||
Discontinued operations | 0.04 | (0.03 | ) | (0.01 | ) | ||||||
Net loss per share, basic and diluted | $ | (1.18 | ) | $ | (1.76 | ) | $ | (2.14 | ) | ||
Weighted average number of common shares used in loss per share computation, basic and diluted | 85,952 | 80,165 | 75,879 | ||||||||
See accompanying notes to the consolidated financial statements.
62
TERRAVIA HOLDINGS, INC.
CONSOLIDATED STATEMENTS OF COMPREHENSIVE LOSS
In thousands
Year Ended December 31, | |||||||||||
2016 | 2015 | 2014 | |||||||||
Net loss | $ | (101,556 | ) | $ | (141,447 | ) | $ | (162,141 | ) | ||
Other comprehensive income (loss), net: | |||||||||||
Change in unrealized gain/loss on available-for-sale securities | (2 | ) | 228 | (312 | ) | ||||||
Foreign currency translation adjustment | 5,525 | (11,545 | ) | (6,908 | ) | ||||||
Other comprehensive income (loss) | 5,523 | (11,317 | ) | (7,220 | ) | ||||||
Total comprehensive loss | $ | (96,033 | ) | $ | (152,764 | ) | $ | (169,361 | ) | ||
See accompanying notes to the consolidated financial statements.
63
TERRAVIA HOLDINGS, INC.
CONSOLIDATED STATEMENTS OF STOCKHOLDERS’ (DEFICIT) EQUITY
In thousands, except per share amounts
Common Stock | Additional Paid-In Capital | Accumulated Other Comprehensive Loss | Accumulated Deficit | Total Stockholders’ (Deficit) Equity | ||||||||||||||||||
Shares | Amount | |||||||||||||||||||||
December 31, 2013 | 68,745 | $ | 69 | $ | 448,990 | $ | (3,794 | ) | $ | (306,317 | ) | $ | 138,948 | |||||||||
Issuance of common stock under stock plans, net of shares used for tax withholdings | 1,367 | 1 | 8,879 | 8,880 | ||||||||||||||||||
Issuance of common stock | 5,750 | 6 | 59,203 | 59,209 | ||||||||||||||||||
Common stock issued pursuant to vesting of restricted stock and restricted stock units | 783 | 1 | 8,517 | 8,518 | ||||||||||||||||||
Stock-based compensation expense | 17,032 | 17,032 | ||||||||||||||||||||
Common stock issued upon early conversion of Senior Convertible Notes | 2,743 | 2 | 22,592 | 22,594 | ||||||||||||||||||
Vesting of warrant shares | 556 | 556 | ||||||||||||||||||||
Change in unrealized loss on available-for-sale securities | (312 | ) | (312 | ) | ||||||||||||||||||
Foreign currency translation adjustments | (6,908 | ) | (6,908 | ) | ||||||||||||||||||
Net loss | (162,141 | ) | (162,141 | ) | ||||||||||||||||||
December 31, 2014 | 79,388 | 79 | 565,769 | (11,014 | ) | (468,458 | ) | 86,376 | ||||||||||||||
Issuance of common stock under stock plans, net of shares used for tax withholdings | 416 | 1 | 836 | 837 | ||||||||||||||||||
Common stock issued pursuant to vesting of restricted stock and restricted stock units | 808 | 1 | 5,632 | 5,633 | ||||||||||||||||||
Stock-based compensation expense | 10,052 | 10,052 | ||||||||||||||||||||
Vesting of warrant shares | 97 | 97 | ||||||||||||||||||||
Cancellation of ADM warrants | 242 | 242 | ||||||||||||||||||||
Common stock issued pursuant to ADM termination agreement | 1,122 | 1 | 3,051 | 3,052 | ||||||||||||||||||
Change in unrealized loss on available-for-sale securities | 228 | 228 | ||||||||||||||||||||
Foreign currency translation adjustment | (11,545 | ) | (11,545 | ) | ||||||||||||||||||
Net loss | (141,447 | ) | (141,447 | ) | ||||||||||||||||||
December 31, 2015 | 81,734 | 82 | 585,679 | (22,331 | ) | (609,905 | ) | (46,475 | ) | |||||||||||||
Issuance of common stock under stock plans, net of shares used for tax withholdings | 537 | 1 | 894 | 895 | ||||||||||||||||||
Common stock issued pursuant to vesting of restricted stock and restricted stock units | 682 | 1 | (1 | ) | — | |||||||||||||||||
Stock-based compensation expense | 11,912 | 11,912 | ||||||||||||||||||||
Issuance of common stock options for offering costs | 335 | 335 | ||||||||||||||||||||
Conversion of preferred stock to common stock | 550 | 1 | 1,055 | 1,056 | ||||||||||||||||||
Common stock issued pursuant to at the market offering | 3,171 | 1 | 4,774 | 4,775 | ||||||||||||||||||
Shares issued pursuant to consulting agreement | 111 | — | 183 | 183 | ||||||||||||||||||
Common stock issued upon early conversion of Senior Convertible Notes | 9,023 | 9 | 39,891 | 39,900 | ||||||||||||||||||
Common stock issued pursuant to ADM termination agreement | 628 | 1 | 1,205 | 1,206 | ||||||||||||||||||
Change in unrealized loss on available-for-sale securities | (2 | ) | (2 | ) | ||||||||||||||||||
Foreign currency translation adjustments | 5,525 | 5,525 | ||||||||||||||||||||
Net loss | (101,556 | ) | (101,556 | ) | ||||||||||||||||||
December 31, 2016 | 96,436 | $ | 96 | $ | 645,927 | $ | (16,808 | ) | $ | (711,461 | ) | $ | (82,246 | ) | ||||||||
See accompanying notes to the consolidated financial statements.
64
TERRAVIA HOLDINGS, INC.
CONSOLIDATED STATEMENTS OF CASH FLOWS
In thousands
Year Ended December 31, | |||||||||||
2016 | 2015 | 2014 | |||||||||
Operating activities: | |||||||||||
Net loss | $ | (101,556 | ) | $ | (141,447 | ) | $ | (162,141 | ) | ||
Income (loss) from discontinued operations | 3,301 | (3,065 | ) | (980 | ) | ||||||
Loss from continuing operations | (104,857 | ) | (138,382 | ) | (161,161 | ) | |||||
Adjustments to reconcile net loss from continuing operations to net cash used in operating activities: | |||||||||||
Depreciation and amortization | 4,753 | 5,832 | 6,274 | ||||||||
Non-cash benefit from income taxes | (2,062 | ) | — | — | |||||||
Gain on sale of available for sale securities | 57 | (49 | ) | (7 | ) | ||||||
Net amortization of premiums on marketable securities | 135 | 1,053 | 1,588 | ||||||||
Amortization of debt discount and loan fees | 2,560 | 2,554 | 2,206 | ||||||||
Warrant expense related to vesting of ADM Warrant | — | 97 | 556 | ||||||||
Debt conversion expense | 9,770 | — | 1,766 | ||||||||
Provision for doubtful accounts | 321 | — | — | ||||||||
Restructuring charges | — | 2,622 | 2,900 | ||||||||
Stock-based compensation expense | 11,450 | 14,614 | 24,345 | ||||||||
Loss from equity method investments | 22,391 | 21,994 | 23,432 | ||||||||
Gain from change in fair value of derivative liabilities | (82 | ) | (1 | ) | (8,744 | ) | |||||
Loss on retirement of fixed assets | 230 | — | — | ||||||||
Changes in operating assets and liabilities: | |||||||||||
Accounts receivable | (2,159 | ) | (2,598 | ) | (11,153 | ) | |||||
Inventories | 867 | 2,682 | (2,696 | ) | |||||||
Prepaid expenses and other current assets | 423 | 433 | (141 | ) | |||||||
Other assets | (413 | ) | (42 | ) | 3,582 | ||||||
Accounts payable | (690 | ) | 1,818 | 1,610 | |||||||
Accrued liabilities | (2,552 | ) | (3,214 | ) | (1,815 | ) | |||||
Deferred revenue | (1,387 | ) | 3,460 | (1,075 | ) | ||||||
Other current and long-term liabilities | 818 | 5,363 | 2,172 | ||||||||
Net cash used in operating activities — continuing operations | (60,427 | ) | (81,764 | ) | (116,361 | ) | |||||
Net cash used in operating activities — discontinued operations | (4,107 | ) | (3,351 | ) | (1,752 | ) | |||||
Net cash used in operating activities | (64,534 | ) | (85,115 | ) | (118,113 | ) | |||||
Investing activities: | |||||||||||
Purchases of property, plant and equipment | (1,923 | ) | (1,241 | ) | (7,208 | ) | |||||
Proceeds received from the sale of equipment | 51 | 114 | — | ||||||||
Purchases of marketable securities | (3,013 | ) | (24,146 | ) | (195,987 | ) | |||||
Proceeds from maturities of marketable securities | 29,466 | 105,589 | 135,464 | ||||||||
Proceeds from sales of marketable securities | 23,981 | 31,196 | 6,541 | ||||||||
Capital contributions in unconsolidated joint ventures | (19,342 | ) | (22,344 | ) | (32,550 | ) | |||||
Capitalized interest related to unconsolidated joint venture | — | — | (620 | ) | |||||||
Restricted certificates of deposit | — | 287 | (731 | ) | |||||||
Net cash provided by (used in) investing activities — continuing operations | 29,220 | 89,455 | (95,091 | ) | |||||||
Net cash provided by (used in) investing activities — discontinued operations | 18,837 | (338 | ) | — | |||||||
Net cash provided by (used in) investing activities | 48,057 | 89,117 | (95,091 | ) | |||||||
Financing activities: | |||||||||||
Repayments under loan agreements | — | (6 | ) | (10,433 | ) | ||||||
Proceeds from the issuance of senior subordinated convertible notes, net of discount | — | — | 143,894 | ||||||||
Proceeds from the issuance of common stock | 5,778 | 746 | 8,945 | ||||||||
Proceeds from issuance of preferred stock, net of offering costs | 27,044 | — | — | ||||||||
Payment for loan costs and fees | — | — | (465 | ) | |||||||
Proceeds from issuance of common stock in a public offering, net of underwriting discounts and commission | — | — | 59,209 | ||||||||
Cash settlement of vested restricted stock units | — | (32 | ) | (68 | ) | ||||||
Net cash provided by financing activities | 32,822 | 708 | 201,082 | ||||||||
Effect of exchange rate changes on cash and cash equivalents | 198 | (433 | ) | (166 | ) | ||||||
Net increase (decrease) of cash and cash equivalents | 16,543 | 4,277 | (12,288 | ) | |||||||
Cash and cash equivalents—beginning of period | 46,966 | 42,689 | 54,977 | ||||||||
Cash and cash equivalents—end of period | $ | 63,509 | $ | 46,966 | $ | 42,689 | |||||
Supplemental disclosures of cash flow information: | |||||||||||
Interest paid in cash, net of capitalized interest | $ | 11,013 | $ | 11,175 | $ | 7,558 | |||||
Noncash investing and financing activities: | |||||||||||
Purchase of property, plant and equipment in accounts payable and accrued liabilities | $ | 20 | $ | 232 | $ | 154 | |||||
Capital contribution to unconsolidated joint venture settled with reduction of receivable | $ | 4,204 | $ | 5,480 | $ | 15,300 | |||||
Common stock issued to Archer-Daniels-Midlands Company pursuant to termination agreement | $ | 1,206 | $ | 3,052 | $ | — | |||||
Non-cash issuance of common stock options for offering costs | $ | 335 | $ | — | $ | — | |||||
Conversion of preferred stock to common stock | $ | 1,056 | $ | — | $ | — | |||||
Exchange of convertible debt for common stock: | |||||||||||
Convertible debt exchanged | $ | 30,575 | $ | — | $ | 20,147 | |||||
Issuance of common stock | $ | 39,900 | $ | — | $ | 22,594 | |||||
See accompanying notes to the consolidated financial statements.
65
NOTES TO THE CONSOLIDATED FINANCIAL STATEMENTS
1. THE COMPANY
Nature of Business—TerraVia Holdings, Inc. (We or the Company) was incorporated in the State of Delaware on March 31, 2003. We produce food, nutrition and specialty ingredients from algae. In May 2016, we changed our name from Solazyme, Inc. to TerraVia Holdings, Inc., and changed our Nasdaq ticker listing symbol from SZYM to TVIA.
Our proprietary technology uses microalgae to produce high-value triglyceride oils, proteins, fibers, micronutrients and other ingredients. We have developed and are commercializing products for food and nutrition ingredients, animal nutrition ingredients and specialty personal care applications and our products can replace or enhance products derived from the world’s three existing oil sources: petroleum, plants and animal fats. Our technology platform harnesses the oil and protein-producing characteristics of microalgae and we are able to tailor the composition of our oils, powders and other bioproducts to address specific customer requirements. We use standard fermentation equipment to convert sugars into the desired end product. By feeding plant-based sugars to our proprietary microalgae in enclosed fermentation tanks, we are in effect utilizing “indirect photosynthesis.”
We are involved in a highly competitive industry that is characterized by the risks of changing technologies, market conditions and regulatory requirements. Penetration into markets requires investment of considerable resources and continuous development efforts. Our future success depends upon several factors, including the technological quality, price, and performance of our products and services relative to those of our competitors, scaling up of production for commercial sale, ability to secure adequate project financing at appropriate terms, and the nature of regulation in our target markets.
We own 50.1% of Solazyme Bunge Renewable Oils Cooperatief U.A., (SB Oils JV), which wholly owns Solazyme Bunge Produtos Renováveis Ltda. (SB Oils), which operates a commercial production facility in Brazil. Bunge Global Innovation, LLC owns the remaining 49.9% of the SB Oils JV. References to the SB Oils JV include activities of SB Oils unless otherwise noted.
Discontinued Operations—As further described in Note 18, on August 16, 2016 we sold our Algenist skincare business to TCP Algenist LLC, an affiliate of Tengram Capital Partners and Algenist Holdings, Inc. in exchange for $20.2 million in cash (before $1.4 million closing costs), 19.9% of the fully diluted equity of Algenist Holdings, Inc. and the assumption of substantially all of the liabilities related to the Algenist skincare business by Algenist Holdings, Inc. The Algenist skincare business was previously presented as an operating segment. The results of operations and financial position of Algenist have been presented as discontinued operations for all periods. Unless otherwise noted, the notes to the consolidated financial statements pertain to continuing operations.
2. SUMMARY OF SIGNIFICANT ACCOUNTING POLICIES AND RECENT ACCOUNTING PRONOUNCEMENTS
Basis of Presentation—The accompanying consolidated financial statements have been prepared in accordance with accounting principles generally accepted in the United States of America (GAAP) and include all adjustments necessary for the fair presentation of our consolidated financial position, results of operations and cash flows for the periods presented. The consolidated financial statements include our accounts and our wholly-owned subsidiaries. All intercompany accounts and transactions have been eliminated in consolidation.We own 50.1% of the SB Oils JV, a variable interest entity (VIE) and Bunge owns 49.9%. We determined that we were not required to consolidate the 50.1% ownership in this joint venture and, therefore, account for this joint venture under the equity method of accounting (see Note 4). We own 19.9% of Algenist Holdings, Inc. which is accounted for under the equity method of accounting (see Note 18).
As of December 31, 2016, our investment in equity method investments comprised as follows (in thousands):
SB Oils JV (Note 4) | $ | 42,373 | |
Algenist Holdings, Inc. (Note 18) | 1,483 | ||
Total equity method investments | $ | 43,856 | |
Use of Estimates—Financial statements prepared in conformity with GAAP require management to make estimates and assumptions that affect the reported amounts of assets and liabilities, the disclosure of contingent assets and liabilities as of the date of the financial statements and the reported amounts of revenues and expenses during the reporting period. Actual results could differ materially from those estimates.
66
Foreign Currency Translation—The assets and liabilities of our foreign subsidiary, Solazyme Brazil, and SB Oils, where the local currency is the functional currency, are translated from their respective functional currency into U.S. dollars at the exchange rate in effect at the balance sheet date, with resulting foreign currency translation adjustments recorded in accumulated other comprehensive income (loss) in the consolidated statements of comprehensive loss. We also adjust our investment in the SB Oils JV and cumulative translation adjustment in equity for our ownership portion of the cumulative translation gain or loss recognized on the SB Oils JV's financial statements. Revenues and expense amounts are translated at average rates during the period.
Cash Equivalents—All highly liquid investments with original or remaining maturities of three months or less at the time of purchase are classified as cash equivalents. Cash equivalents primarily consist of money market funds, commercial paper and U.S. treasury notes.
Marketable Securities—Investments with original maturities greater than three months at the time of purchase and maturing less than one year from the consolidated balance sheet date are classified as marketable securities. We classify marketable securities as short-term based upon whether such assets are reasonably expected to be used in current operations. As of December 31, 2016, all of our marketable securities are corporate bonds. We classify our marketable securities as available-for-sale, and record them at estimated fair value in the consolidated balance sheets, with unrealized gains and losses, if any, reported as a component of accumulated other comprehensive income (loss) in the consolidated statements of comprehensive loss. Marketable securities classified as available-for-sale are adjusted for amortization of premiums and accretion of discounts and such amortization and accretion are reported as components of interest and other income. Realized gains and losses and declines in value that are considered to be other-than-temporary are recognized in interest and other income. The cost of all securities sold is based on the specific identification method.
Restricted Certificates of Deposit—We maintained certificates of deposits classified in other long-term assets of $0.7 million as of both December 31, 2016 and 2015. These certificates of deposits were required to be pledged as collateral related to our facility lease in South San Francisco.
Deferred Financing Costs—Issuance fees or direct costs relating to our debt are deferred and amortized to interest expense over the contractual or expected term of the related debt using the effective interest method. We classify deferred financing costs in the consolidated balance sheets as a reduction to associated debt balances.
Debt Discounts—Debt discounts incurred with the issuance of our debt are recorded in the consolidated balance sheets as a reduction to associated debt balances. We amortize debt discount to interest expense over the contractual or expected term of the debt using the effective interest method.
Accounts Receivable—Accounts receivable represents amounts owed to us for product revenues, collaborative research and development agreements and agreements with related parties. We had no material amounts reserved for doubtful accounts as of December 31, 2016 and 2015, as we expected to collect our accounts receivable balances. We reserve for estimated product returns as reductions of accounts receivable and product revenues.
Fair Value of Financial Instruments—We measure certain financial assets and liabilities at fair value based on the exchange price that would be received for an asset or paid to transfer a liability (an exit price) in the principal or most advantageous market for the asset or liability in an orderly transaction between market participants. Where available, fair value is based on, or derived from, observable market prices or other observable inputs. Where observable prices or inputs are not available, valuation models are applied. These valuation techniques involve some level of management estimation and judgment, the degree of which is dependent on the price transparency for the instruments or market and the instruments’ complexity. While we believe that our valuation methods are appropriate and consistent with other market participants, we recognize that the use of different methodologies or assumptions to determine the fair value of certain financial instruments could result in a different estimate of fair value at the reporting date.The carrying amount of certain of our financial instruments, including cash and cash equivalents, restricted certificates of deposit, accounts receivable, prepaid expenses, accounts payable and accrued liabilities, approximates fair value due to their relatively short maturities.
Concentration of Credit and Customer Risk—Financial instruments that potentially subject us to a concentration of credit risk consist of cash and cash equivalents, marketable securities, accounts receivables and restricted certificates of deposit. We place our cash equivalents and investments with high credit quality financial institutions and, by policy, limit the amounts invested with any one financial institution or issuer. Deposits held with banks may exceed the amount of insurance provided on such deposits. We have not experienced any losses on our deposits of cash and cash equivalents. Revenues from two customers accounted for more than 10% of our total net revenues from continuing operations in each of 2016, 2015 and 2014, respectively.
67
Inventories—Inventories are stated at the lower of cost or market. Cost is determined using the first-in, first-out basis. Inventory cost consists of raw materials, third-party contractor costs associated with packaging, distribution and production of products, supplies, shipping costs and other overhead costs associated with manufacturing. If inventory costs exceed expected market value due to obsolescence or lack of demand, inventory write-downs may be recorded as deemed necessary by management for the difference between the cost and the market value in the period that impairment is first recognized. During scale up of the manufacturing process, a portion of the manufacturing and associated production costs are charged to research and development expenses.
Property, Plant and Equipment—Property, plant and equipment are recorded at cost, less accumulated depreciation. Depreciation is calculated on a straight-line basis over the following estimated ranges of useful lives:
Asset classification | Estimated useful life | |
Plant equipment | 5 – 20 years | |
Lab equipment | 3 – 7 years | |
Leasehold improvements | Shorter of useful life or life of lease | |
Building and improvements | 7 – 20 years | |
Computer equipment and software | 3 – 7 years | |
Furniture and fixtures and automobiles | 5 – 7 years | |
Long-Lived Assets—We periodically review long-lived assets, including property, plant and equipment, for impairment whenever events or changes in business circumstances indicate that the carrying amount of an asset may not be recoverable or the estimated useful lives are no longer appropriate. If indicators of impairment exist and the undiscounted projected cash flows associated with such assets are less than the carrying amount of the asset, an impairment loss is recorded to write the asset down to its estimated fair value. Fair value is estimated based on discounted future cash flows.
Segment Reporting—The chief operating decision maker is our Chief Executive Officer, and we have one operating segment, Ingredients and Other. Prior to the sale of our Algenist business, we had two operating segments for financial statement reporting purposes: Algenist and Ingredients and Other.Geographic Data—Geographic revenues are identified by the location in which the research and development program revenue and product sales were originated, and Long-lived assets, net of accumulated depreciation were as follows (in thousands).
Year ended December 31, | |||||||||||
2016 | 2015 | 2014 | |||||||||
United States | $ | 18,036 | $ | 22,454 | $ | 31,845 | |||||
Brazil | 446 | 399 | 4,117 | ||||||||
Total revenues | $ | 18,482 | $ | 22,853 | $ | 35,962 | |||||
As of December 31, | |||||||||||
2016 | 2015 | ||||||||||
United States | $ | 24,157 | $ | 25,973 | |||||||
Brazil | 42,373 | 35,933 | |||||||||
Total long-lived assets | $ | 66,530 | $ | 61,906 | |||||||
Revenue Recognition—Revenues are recognized when the following criteria are met: (1) persuasive evidence of an arrangement exists; (2) transfer of title has been completed or services have been rendered; (3) the fee is fixed or determinable; and (4) collectability is reasonably assured. We recognize revenues from research and development programs that consist of collaborative research and development agreements with commercial and strategic partners and related parties, and commercial sales of our products.
Collaborative research and development programs with commercial and strategic partners typically provide us with multiple revenue streams, which may include up-front non-refundable fees for licensing and reimbursement for research and development activities; cost reimbursement fees may include reimbursement for full-time employee equivalents, contingent milestone payments upon achievement of contractual criteria, licensing fees and commercialization royalty fees. These
68
revenues are recognized as the services are performed over a performance period, as specified in the respective agreements. When up-front payments are combined with funded research services in a single unit of accounting, we recognize the payments using the straight-line method of revenue recognition, as that best approximates actual performance under our Collaborative agreements, but not greater than the amount of the research and development program fee as specified under these agreements. We evaluate the appropriate period based on research progress attained and reevaluate the period when significant changes occur. Where arrangements include milestones that are determined to be substantive and at risk at the inception of the arrangement, revenues are recognized upon achievement of the milestone and are limited to those amounts for which collectability is reasonably assured. If these conditions are not met, the milestone payments are deferred and recognized as revenue over the estimated period of performance under the contract as we complete our performance obligations.
If collaborative research and development or sales agreements contain multiple elements, we evaluate whether the components of each arrangement represent separate units of accounting. We have determined that all of our revenue arrangements should be accounted for as a single unit of accounting. Application of revenue recognition standards requires subjective determination and requires management to make judgments about the fair values of each individual element and whether it is separable from other aspects of the contractual relationship.
Research and Development—Research and development costs associated with research performed pursuant to research and development programs with government entities and commercial and strategic partners and our internal projects are expensed as incurred, and include, but are not limited to, personnel and related expenses, facility costs and overhead (including costs incurred at our Peoria facility), depreciation and amortization of plant, property and equipment used in development, laboratory supplies, and scale-up research manufacturing and consulting costs.
Restructuring Charges—We account for restructuring activities in accordance with FASB ASC 420, Exit or Disposal Cost Obligations. Costs associated with such restructuring activity are recognized in the period in which we incur the liability.
Patent Costs—All costs related to filing and pursuing patent applications are expensed as incurred as recoverability of such expenditures is uncertain and the underlying technologies are under development. Patent-related legal costs incurred are recorded in selling, general and administrative expenses.
Income Taxes—We account for income taxes under the asset and liability method, which requires, among other things, that deferred income taxes be provided for temporary differences between the tax basis of our assets and liabilities and the financial statement reported amounts. A valuation allowance is provided against deferred tax assets when it is more likely than not that they will not be realized.We provide for reserves necessary for uncertain tax positions taken or expected to be taken on tax filings. First, we determine if the weight of available evidence indicates that a tax position is more likely than not to be sustained upon audit. Second, based on the largest amount of benefit that is more likely than not to be realized on ultimate settlement, we recognize any such differences as a liability.
Stock-Based Compensation—We recognize stock-based compensation for awards to employees based on the grant date estimated fair value. We use the Black-Scholes option-pricing model to estimate the fair value of awards granted to employees, and the requisite fair value is recognized as expense on a straight-line basis over the service period of the award, which is generally the vesting period.We account for restricted stock units issued to employees based on the quoted market price of our common stock on the date of grant, which is then expensed on a straight-line basis over the service period.
The Black-Scholes option pricing model requires the following inputs: expected life, expected volatility, risk-free interest rate, expected dividend yield rate, exercise price and closing price of our common stock on the date of grant. Due to our limited history of grant activity, we calculate our expected term utilizing the “simplified method” permitted by the Securities and Exchange Commission (SEC), which is the average of the total contractual term of the option and its vesting period. We believe historical volatility data of our share price provides the best estimate for the expected volatility of the underlying share price that marketplace participants would most likely use in determining an exchange price for an option. As such, beginning in the second quarter of 2014 we began weighting the historical volatility data of our share price in proportion to the number of years of information it has available to the total expected term of stock options. The remaining volatility weight is allocated evenly among selected comparable public companies within our industry. The risk-free interest rate is based on the U.S. Treasury yield curve in effect at the time of grant for zero coupon U.S. Treasury notes with maturities similar to the option’s expected term. The expected dividend yield was assumed to be zero, as we have not paid, nor do we anticipate paying, cash dividends on shares of our common stock. We estimate our forfeiture rate based on an analysis of our actual forfeitures and will continue to evaluate the appropriateness of the forfeiture rate based on actual forfeiture experience, analysis of employee turnover and other factors.We account for restricted stock units and restricted stock awards issued to employees based on the quoted market price of our common stock on the date of grant that are expensed on a straight-line basis over the service period.
69
We use the Black-Scholes option-pricing model to estimate the fair value of awards granted to nonemployees. We account for restricted stock units issued to nonemployees based on the estimated fair value of our common stock on the date of grant. The measurement of stock-based compensation for nonemployees is subject to periodic adjustments as the underlying equity instruments vest, and the resulting change in value, if any, is recognized in our consolidated statements of operations during the period the related services are rendered.
Accumulated Other Comprehensive Loss—The components of accumulated other comprehensive income (loss) consisted of the following (in thousands):
Foreign Currency Translation Adjustments | Change in unrealized gain/loss on available-for-sale securities | Total Accumulated Other Comprehensive Loss | |||||||||
Balance at December 31, 2013 | $ | (3,880 | ) | $ | 86 | $ | (3,794 | ) | |||
Current period other comprehensive loss | (6,908 | ) | (312 | ) | (7,220 | ) | |||||
Balance at December 31, 2014 | (10,788 | ) | (226 | ) | (11,014 | ) | |||||
Current period other comprehensive loss | (11,545 | ) | 228 | (11,317 | ) | ||||||
Balance at December 31, 2015 | (22,333 | ) | 2 | (22,331 | ) | ||||||
Current period other comprehensive loss | 5,525 | (2 | ) | 5,523 | |||||||
Balance at December 31, 2016 | $ | (16,808 | ) | $ | — | $ | (16,808 | ) | |||
Net Loss per Share—Basic net loss per share is computed by dividing our net loss by the weighted-average number of common shares outstanding during the period. Diluted net loss per share is computed by giving effect to all potentially dilutive securities, including conversion of our debt or preferred stock into common stock, stock options, common stock issuable pursuant to restricted stock units and common stock warrants. Basic and diluted net loss per share was the same for all periods presented as the inclusion of all potentially dilutive securities outstanding was anti-dilutive.The following outstanding shares of potentially dilutive securities were excluded from the calculation of diluted net loss per share for the periods presented as the effect was anti-dilutive (in thousands):
Year ended December 31, | ||||||||
2016 | 2015 | 2014 | ||||||
Shares of common stock to be issued upon conversion of the Notes | 15,152 | 18,791 | 18,791 | |||||
Shares of common stock to be issued upon conversion of Series A Preferred Stock | 13,375 | — | — | |||||
Options to purchase common stock | 12,707 | 11,901 | 13,740 | |||||
Restricted stock units | 1,274 | 1,884 | 1,812 | |||||
Warrants to purchase common stock | 750 | 750 | 1,250 | |||||
Total | 43,258 | 33,326 | 35,593 | |||||
The table above does not reflect early conversion payment features of the Notes (see Note 10) that may be settled, at our election, in cash or, subject to satisfaction of certain conditions, in shares of our common stock.
Recently Adopted Accounting Standards — In April 2015, the FASB issued ASU 2015-03, Simplifying the Presentation of Debt Issuance Costs. The standard amends existing guidance to require the presentation of debt issuance costs in the balance sheet as a deduction from the carrying amount of the related debt liability instead of as an asset. We adopted ASU 2015-03 retrospectively in our fiscal quarter ended March 31, 2016. As a result of the retrospective adoption, we reclassified unamortized debt issuance costs of $0.5 million from other long-term assets to a reduction in convertible debt on the consolidated balance sheet as of December 31, 2015.
Recent Accounting Pronouncements—In May 2014, the FASB issued Accounting Standards Update (ASU) 2014-09, Revenue from Contracts with Customers (Topic 606) (ASU 2014-09), which supersedes the revenue recognition requirements in FASB ASC 605, Revenue Recognition. ASU 2014-09 is based on the principle that revenue is recognized to depict the transfer of goods or services to customers in an amount that reflects the consideration to which the entity expects to be entitled in exchange for those goods or services. ASU 2014-09 also requires additional disclosure about the nature, amount, timing and uncertainty of revenue and cash flows arising from customer contracts, including significant judgments and changes in judgments and assets recognized from costs incurred to obtain or fulfill a contract. In addition, in March and April 2016, the FASB issued ASU No. 2016-08, Revenue from Contracts with Customers (Topic 606) and ASU No. 2016-10, Revenue from
70
Contracts with Customers (Topic 606), which clarify the guidance in ASU 2014-09 and have the same effective date as the original standard. This guidance requires the recognition of revenue to depict the transfer of promised goods or services to customers in an amount that reflects the consideration expected in exchange for those goods or services. In May 2016, the FASB issued ASU No. 2016-12, Narrow Scope Improvements and Practical Expedients, which provides for improvements to the guidance on collectability, noncash consideration and completed contracts, and provides a practical expedient for contract modifications upon adoption of the updated guidance under ASC 606. This new guidance is effective for interim and annual reporting periods beginning after December 15, 2017, with early adoption permitted, and is required to be adopted by taking either a full retrospective or a modified retrospective approach. We are currently assessing the potential impact of this new guidance on our consolidated financial statements. A portion of our revenues relate to the sale of finished product to various customers and we do not believe that the adoption of the new standard will have a material impact on these transactions. We are continuing to evaluate the impact on collaborative research and development arrangements with our strategic partners. We expect to adopt the standard in 2018 using the modified retrospective approach.
In February 2016, the FASB issued ASU 2016-02, Leases (Topic 842) which, for operating leases, requires a lessee to recognize a right-of-use asset and a lease liability, initially measured at the present value of the lease payments, in its balance sheet. The standard also requires a lessee to recognize a single lease cost, calculated so that the cost of the lease is allocated over the lease term, on a generally straight-line basis. The ASU is effective for public companies for fiscal years beginning after December 15, 2018, including interim periods within those fiscal years. Early adoption is permitted. We are in the process of evaluating the impact of the adoption of this new guidance on our consolidated financial statements.
In March 2016, the FASB issued ASU 2016-09, Compensation, Stock Compensation (Topic 718), a new standard simplifying certain aspects of accounting for share-based payments. The key provision of the new standard requires that excess tax benefits and shortfalls be recorded as income tax benefit or expense in the income statement, rather than in stockholders' equity. The ASU is effective for public companies in the three months ending March 31, 2017. We do not believe that the adoption of this new guidance will have a material impact on our consolidated financial statements.
3. GOING CONCERN UNCERTAINTY
We have incurred substantial net losses since our inception; we incurred net losses of $101.6 million, $141.4 million and $162.1 million in 2016, 2015 and 2014, respectively. Accumulated deficit was $711.5 million as of December 31, 2016. Net cash used in operating activities was $64.5 million, $85.1 million and $118.1 million in 2016, 2015 and 2014, respectively. Cash and cash equivalents and marketable securities available for sale were $64.0 million as of December 31, 2016.
We are an emerging growth company with a limited operating history. We only recently began commercializing our products. To date, a substantial portion of revenues has consisted of funding from third party collaborative research agreements and government grants. We intend to focus on growing product revenues primarily in the unconsolidated SB Oils JV in 2017. As a result, we expect our reported consolidated revenues to decrease in 2017 compared to 2016, primarily due to lower research and development programs revenues as certain funded programs shift toward commercial product revenue in the unconsolidated SB Oils JV.
Net losses may continue as we ramp up manufacturing capacity and build out our product pipeline. We expect to incur additional costs and expenses related to the continued development and expansion of our business, including research and development, the operation of our Peoria facility, the ramp up and operation of the SB Oils JV plant and other facilities.
As of December 31, 2016, there was $32.5 million outstanding of convertible notes (2018 Notes), due on February 1, 2018, and $148.1 million outstanding of convertible notes (2019 Notes), due on October 1, 2019. Accordingly, we had $32.5 million due in 13 months from December 31, 2016 or 10.5 months from March 16, 2017 (the date of the filing of this Form 10-K), and $148.1 million due in 2.7 years from December 31, 2016 or 2.5 years from March 16, 2017. Cash and cash equivalents and forecasted cash flows from operations are not sufficient to sustain our operations and meet such obligations through March 31, 2018.
On February 24, 2017, we announced that we had retained Rothschild Inc. (Rothschild) as our financial advisor and that we were in discussions with a number of potential investors to raise additional capital and/or recapitalize our outstanding convertible senior subordinated notes. However, no agreements have been made and such discussions may not lead to a transaction.
We have directed Rothschild to assist us in the following objectives:
• | restructure or refinance a substantial portion of our 2018 and 2019 Notes; |
71
• | raise additional capital via a combination of the following potential activities |
•Issuance of new equity
•Issuance of new debt;
•Entering partnerships for our AlgaVia® food powders and/or our Thrive® Consumer businesses;
• | and/or the outright sale of certain other assets |
In addition to the above activities directed by our financial advisor, we also have the ability to execute a combination of the following initiatives:
• | sell additional equity through an existing effective registration statement (we sold common stock for cash proceeds of approximately $4.8 million in the last five months of 2016); |
• | convert individual holders of the convertible 2018 and 2019 Notes into our common stock through induced conversions (in 2016, we exchanged 2018 and 2019 Notes totaling approximately $30.6 million by issuing 9.0 million shares (including 4.6 million inducement shares); and/or |
• | further streamline operations which may result in further reduction in headcount and other expenses (in 2016, we reduced our workforce by approximately 20%). |
The accompanying consolidated financial statements have been prepared assuming that we will continue as a going concern. There is significant uncertainty regarding our ability to meet our obligations and sustain our operations through March 31, 2018. These conditions raise substantial doubt as to our ability to continue as a going concern. Management’s plans concerning these matters are discussed above. The accompanying consolidated financial statements do not include any adjustments that might result from the outcome of this going concern uncertainty.
4. INVESTMENT IN SB OILS JV
Background and Operations
In April 2012, we formed with Bunge Solazyme Bunge Renewable Oils Cooperatief U.A., (SB Oils JV) to build, own and operate the SB Oils JV Plant, a commercial-scale renewable algae oils production facility adjacent to Bunge’s Moema sugarcane mill in Brazil, leveraging our technology. SB Oils JV is governed by a six member board, three from each investor.
The SB Oils JV's operational focus from inception to date has been primarily to support the construction, ramp up and optimization of the commercial-scale production facility. While the SB Oils JV has incurred significant losses to date, we believe that long-term profitability will drive positive cash flows sufficient for us to recover our investment.
In October 2015, we entered into an amended and restated joint venture agreement with Bunge to expand the SB Oils JV to add a worldwide focus on human food and animal nutrition. Also in October 2015, we entered into an amended and restated Development Agreement with Bunge under which we granted to the SB Oils JV a worldwide royalty-bearing, field-limited license to all of our technology that is necessary or useful for the manufacture of certain algae oil products. Concurrently with the entry into such agreements, we entered into two funded research programs with the SB Oils JV targeted at completing the development of additional products for the SB Oils JV. Pursuant to these agreements:
SB Oils JV will:
• | continue to use our proprietary technology to produce a range of algae-based oils and products from cane sugar through microbe-based catalysis; |
• | pay us a royalty for certain products sold by the joint venture; and |
• | pay us a technology maintenance fee in recognition of our ongoing research investment in technology. |
72
We will:
• | provide sales, marketing and application development for certain oils and technical expertise in regard to the implementation of our technology; |
• | provide access to our proprietary technology for the production of certain oils and structuring fats for the food and animal nutrition markets; and |
• | retain co-primary sales rights for certain products. |
Bunge will:
• | continue to provide cane sugar feedstock and utilities to the SB Oils JV Plant from Bunge's adjacent sugar cane processing mill; |
• | provide sales, marketing and application development for certain food oils and will also provide oil processing, global distribution and logistics; |
• | serve as the primary sales channel for some of the joint venture's products, with us as an additional sales channel, in each case in exchange for a distribution fee; and |
• | continue to provide working capital to SB Oils until April 2, 2017 through a revolving loan facility. |
Equity Accounting
We account for our interest in the SB Oils JV under the equity method of accounting. Our equity investment in the SB Oils JV was $42.4 million and $35.9 million as of December 31, 2016 and 2015, respectively. During 2016, 2015 and 2014, we recognized $22.3 million, $22.4 million and $23.0 million of losses, respectively, related to our equity method investment in the SB Oils JV.
We contributed $19.3 million, $22.3 million and $32.6 million during 2016, 2015 and 2014, respectively. We also contributed $4.2 million, $5.5 million and $15.3 million in 2016, 2015 and 2014, respectively, to the SB Oils JV through a reduction in our receivables due from the SB Oils JV.
We have determined that the SB Oils JV is a VIE based on the insufficiency of each party’s equity investment at risk to absorb their respective share of the expected losses of the SB Oils JV. The optimization and ramping up of the SB Oils JV Plant is the activity of the SB Oils JV that most significantly impacts its current economic performance. Although we have the obligation to absorb losses and the right to receive benefits of the SB Oils JV that could potentially be significant to the SB Oils JV, we have equal shared decision–making powers with Bunge over certain significant activities of the SB Oils JV, including those related to the construction, optimization and ramping up of the SB Oils JV. Therefore, through and as of December 31, 2016, we do not consider ourselves to be the SB Oils JV’s primary beneficiary, and as such have not consolidated the financial results of the SB Oils JV. Consolidation may be required in the future due to changes in events and circumstances impacting the power to direct the activities that most significantly affect the SB Oils JV’s economic performance. We will continue to reassess our designation as the primary beneficiary of the SB Oils JV.
The following table summarizes the carrying amounts of the assets and the fair value of the liabilities included in our consolidated balance sheets and the maximum loss exposure related to our interest in the SB Oils JV as of December 31, 2016 and 2015 (in thousands):
As of December 31, 2016 | |||||||||||||||||||
Assets | Liabilities | ||||||||||||||||||
VIE | Accounts Receivable | Unbilled Revenues | Investments in Unconsolidated Joint Ventures | Loan Guarantee | Maximum Exposure to Loss(1) | ||||||||||||||
SB Oils JV | $ | — | $ | — | $ | 42,373 | $ | — | $ | 54,162 | |||||||||
73
As of December 31, 2015 | |||||||||||||||||||
Assets | Liabilities | ||||||||||||||||||
VIE | Accounts Receivable | Unbilled Revenues | Investments in Unconsolidated Joint Ventures | Loan Guarantee | Maximum Exposure to Loss(2) | ||||||||||||||
SB Oils JV | $ | 12 | $ | 839 | $ | 35,910 | $ | — | $ | 45,692 | |||||||||
(1) | Includes maximum exposure to loss attributable to our bank guarantee required to be provided for the SB Oils JV of $10.8 million and non-cancelable purchase obligations of $0.9 million (based on the exchange rate at December 31, 2016). |
(2) | Includes maximum exposure to loss attributable to our bank guarantee required to be provided for the SB Oils JV of $8.9 million (based on the exchange rate at December 31, 2015). |
We may be required to contribute additional capital to the VIE which would increase our maximum exposure to loss. These future contribution amounts cannot be quantified at this time.
During 2013, the SB Oils JV entered into a loan agreement with the Brazilian Development Bank (BNDES or BNDES Loan) under which it could borrow up to $75.4 million (based on the exchange rate as of December 31, 2016). Outstanding borrowings were $52.6 million and $53.4 million as of December 31, 2016 and 2015, respectively. We have provided a bank guarantee equal to 14.39% of the total amount available under the BNDES Loan and may be required to provide a corporate guarantee equal to 35.71% of the total amount available under the BNDES Loan (with the total amount covered by the guarantees not to exceed our ownership percentage in the SB Oils JV). The BNDES funding has supported the construction of the SB Oils JV’s production facility. The term of the BNDES Loan is eight years and the loan has an average interest rate of approximately 4.0% per annum. As of December 31, 2016, our bank guarantee was in place and the corporate guarantee was not in place. The fees incurred on the cancelable bank guarantee were not material during 2016, 2015 and 2014.
Impairment Assessment
We assessed the recoverability of our $42.4 million equity investment in the SB Oils JV as of December 31, 2016 using a discounted cash flow analysis. We also compared the discounted cash flow analysis to a market approach based upon relevant market multiples. Our analysis was performed using the guidance from ASC 323, Investments - Equity Method and Joint Ventures, Subsequent Measurement, which states that a loss in value of an investment that is an other than a temporary decline shall be recognized. A current fair value of an investment that is less than its carrying amount may indicate a loss in value of the investment. However, a decline in the quoted market price below the carrying amount or the existence of operating losses is not necessarily indicative of a loss in value that is other than temporary. With consideration to the above guidance, we evaluated our ongoing business activities at the SB Oils JV and concluded there was no impairment of our investment in the SB Oils JV as of December 31, 2016. The process of evaluating the potential impairment is subjective and requires significant estimates and assumptions. Our estimated future cash flows are based on assumptions that are consistent with our annual planning process and include estimates for revenue and operating margins and future economic and market conditions. Actual future results may differ significantly from those estimates. Changes in assumptions or circumstances could result in an impairment in the period the change occurs and in future years. Management’s conclusion that our equity investment in SB Oils JV was not impaired as of December 31, 2016 was based upon the following critical estimates and assumptions:
Revenues
• | material increases in product revenues from $10 million in 2016 to over $200 million in 2021 and future years, primarily from AlgaPrime™ DHA sales; |
• | maintain current average selling prices based on current contracted prices; |
Costs
• | maintain access to cane sugar feedstock; |
• | increase production volumes by optimizing plant throughput and increasing yields, drying rates and final recovery rates; |
• | reduction of production costs through increased fermentation and recovery efficiencies combined with increasing volumes; |
74
• | increase in contribution margins; |
Capital Expenditures
• | capital expenditure of $3 million in 2017 on dryer refurbishment; |
• | additional capital investment of $20 million to $30 million over the next five years to improve throughput rates and increase capacity; |
Other
• | discount rate of approximately 14%; and |
• | no significant adverse change in the regulatory or economic environment in Brazil or other countries, as applicable |
We also performed independent breakeven sensitivity analyses, and determined there would be no impairment as of December 31, 2016, as follows:
• | If sales volume were 37% less than forecast in the years 2017 through 2030; |
• | If the contribution margin was 47% less than forecast in the years 2017 through 2030; or |
• | If the discount rate was increased to approximately 20%. |
The estimates used for cash flow forecasts required significant exercise of judgment and are subject to change in future reporting periods as facts and circumstances change. Additionally, we may make changes to our and the SB Oils JV business plans that could result in changes to the expected cash flows. As a result, it is possible that impairments may be required in 2017 or future reporting periods.
5. MARKETABLE SECURITIES
Marketable securities classified as available-for-sale consisted of the following (in thousands):
December 31, 2016 | |||||||||||||||
Amortized Cost | Gross Unrealized Gain | Gross Unrealized Loss | Fair Value | ||||||||||||
Corporate bonds | $ | 522 | $ | — | $ | — | $ | 522 | |||||||
Total | $ | 522 | $ | — | $ | — | $ | 522 | |||||||
December 31, 2015 | |||||||||||||||
Amortized Cost | Gross Unrealized Gain | Gross Unrealized Loss | Fair Value | ||||||||||||
Corporate bonds | $ | 25,608 | $ | 122 | $ | (73 | ) | $ | 25,657 | ||||||
Asset-backed securities | 12,424 | — | (31 | ) | 12,393 | ||||||||||
Mortgage-backed securities | 4,800 | 2 | (23 | ) | 4,779 | ||||||||||
Government and agency securities | 5,705 | 16 | (9 | ) | 5,712 | ||||||||||
Municipal bonds | 2,470 | — | (2 | ) | 2,468 | ||||||||||
Total | $ | 51,007 | $ | 140 | $ | (138 | ) | $ | 51,009 | ||||||
75
The following table summarizes the amortized cost and fair value of our marketable securities, classified by maturity as of December 31, 2016 and 2015 (in thousands):
December 31, 2016 | December 31, 2015 | ||||||||||||||
Amortized Cost | Fair Value | Amortized Cost | Fair Value | ||||||||||||
Marketable securities | |||||||||||||||
Due in 1 year or less | $ | 522 | $ | 522 | $ | 17,783 | $ | 17,870 | |||||||
Due in 1-4 years | — | — | 26,258 | 26,200 | |||||||||||
Due in 5-9 years | — | — | 2,844 | 2,843 | |||||||||||
Due in more than 9 years | — | — | 4,122 | 4,096 | |||||||||||
$ | 522 | $ | 522 | $ | 51,007 | $ | 51,009 | ||||||||
6. FAIR VALUE OF FINANCIAL INSTRUMENTS
Assets and liabilities recorded at fair value in the consolidated financial statements are categorized based upon the level of judgment associated with the inputs used to measure their fair value. Hierarchical levels that are directly related to the amount of subjectivity associated with the inputs to the valuation of these assets or liabilities are as follows:
• | Level 1—Observable inputs, such as quoted prices in active markets for identical assets or liabilities. |
• | Level 2—Observable inputs other than Level 1 prices, such as quoted prices for similar assets or liabilities, quoted prices in markets that are not active, or other inputs that are observable or can be corroborated by observable market data for substantially the full term of the assets or liabilities. |
• | Level 3—Unobservable inputs that are supported by little or no market activity and that are significant to the fair value of the assets or liabilities. Level 3 assets and liabilities include those whose fair value measurements are determined using pricing models, discounted cash flow methodologies or similar valuation techniques and significant management judgment or estimation. |
The following tables present our financial instruments that were measured at fair value on a recurring basis as of December 31, 2016 and 2015 by level within the fair value hierarchy (in thousands):
December 31, 2016 | |||||||||||||||
Level 1 | Level 2 | Level 3 | Total | ||||||||||||
Financial Assets | |||||||||||||||
Cash equivalents | $ | 21,834 | $ | — | $ | — | $ | 21,834 | |||||||
Marketable securities: | |||||||||||||||
Corporate bonds | — | 522 | — | 522 | |||||||||||
— | 522 | — | 522 | ||||||||||||
Total | $ | 21,834 | $ | 522 | $ | — | $ | 22,356 | |||||||
76
December 31, 2015 | |||||||||||||||
Level 1 | Level 2 | Level 3 | Total | ||||||||||||
Financial Assets | |||||||||||||||
Cash equivalents | $ | 3 | $ | 18,900 | $ | — | $ | 18,903 | |||||||
Marketable securities: | |||||||||||||||
Corporate bonds | — | 25,657 | — | 25,657 | |||||||||||
Asset-backed securities | — | 12,393 | — | 12,393 | |||||||||||
Mortgage-backed securities | — | 4,779 | — | 4,779 | |||||||||||
Government and agency securities | 3,722 | 1,990 | — | 5,712 | |||||||||||
Municipal bonds | — | 2,468 | — | 2,468 | |||||||||||
3,722 | 47,287 | — | 51,009 | ||||||||||||
Total | $ | 3,725 | $ | 66,187 | $ | — | $ | 69,912 | |||||||
Financial Liabilities | |||||||||||||||
Fair value of early conversion feature of convertible debt | $ | — | $ | — | $ | 82 | $ | 82 | |||||||
Other than long-lived assets impaired in 2015 and 2014 (see Note 17), we had no transactions measured at fair value on a nonrecurring basis as of December 31, 2016 and 2015.
Cash Equivalents and Marketable Securities - Cash equivalents and marketable securities classified within Level 2 of the fair value hierarchy are valued based on other observable inputs, including broker or dealer quotations or alternative pricing sources. When quoted prices in active markets for identical assets or liabilities are not available, we rely on non-binding quotes, which are based on proprietary valuation models of independent pricing services. These models generally use inputs such as observable market data, quoted market prices for similar instruments, historical pricing trends of a security as relative to its peers and internal assumptions of the independent pricing services. We corroborate the reasonableness of non-binding quotes received from the independent pricing services by comparing them to quotes of identical or similar instruments from other pricing sources.
Convertible Notes - We have estimated the fair value of our Convertible Notes to be $77.6 million at December 31, 2016, compared to a carrying value of $180.6 million, and $105.9 million at December 31, 2015, compared to a carrying value of $211.1 million. These estimates are based upon Level 2 inputs using the market price of the Notes derived from actual trades quoted from Bloomberg using a midmarket pricing convention (the midpoint price between bid and ask prices).
7. INVENTORIES
Inventories consisted of the following (in thousands):
December 31, 2016 | December 31, 2015 | ||||||
Raw materials | $ | 25 | $ | 180 | |||
Work in process | 773 | 1,301 | |||||
Finished goods | 1,547 | 1,731 | |||||
Total inventories | $ | 2,345 | $ | 3,212 | |||
Inventory write offs, including adjustments to carry inventory at lower of cost or market were $2.4 million, $1.0 million and $0.8 million in 2016, 2015 and 2014, respectively.
77
8. PROPERTY, PLANT AND EQUIPMENT—NET
Property, plant and equipment—net consisted of the following (in thousands):
December 31, 2016 | December 31, 2015 | ||||||
Plant equipment | $ | 25,269 | $ | 24,824 | |||
Building and improvements | 5,810 | 5,810 | |||||
Lab equipment | 7,088 | 7,495 | |||||
Leasehold improvements | 2,993 | 1,866 | |||||
Computer equipment and software | 3,968 | 3,988 | |||||
Other | 1,076 | 1,421 | |||||
Total | 46,204 | 45,404 | |||||
Less: accumulated depreciation and amortization | (23,530 | ) | (19,408 | ) | |||
Property, plant and equipment—net | $ | 22,674 | $ | 25,996 | |||
Depreciation and amortization expense was $4.8 million, $5.8 million and $6.3 million for 2016, 2015 and 2014, respectively.
9. ACCRUED LIABILITIES
Accrued liabilities consisted of the following (in thousands):
December 31, 2016 | December 31, 2015 | ||||||
Accrued compensation and related liabilities | $ | 4,379 | $ | 5,614 | |||
Accrued interest | 2,663 | 3,495 | |||||
Accrued restructuring costs | — | 3,400 | |||||
Other accrued liabilities | 1,814 | 797 | |||||
Total accrued liabilities | $ | 8,856 | $ | 13,306 | |||
10. CONVERTIBLE DEBT
A summary of our convertible debt as of December 31, 2016 and 2015 is as follows (in thousands):
December 31, 2016 | December 31, 2015 | ||||||
Convertible debt: | |||||||
2018 Notes, due February 1, 2018 | $ | 32,485 | $ | 61,632 | |||
2019 Notes, due October 1, 2019 | 148,073 | 149,500 | |||||
Total debt | 180,558 | 211,132 | |||||
Add: | |||||||
Fair value of embedded derivative | — | 82 | |||||
Less: | |||||||
Unamortized debt discount | (5,668 | ) | (8,749 | ) | |||
Debt issuance costs | (270 | ) | (450 | ) | |||
Long-term portion of debt | $ | 174,620 | $ | 202,015 | |||
Total interest costs incurred related to our total debt (including amortization of loan fees and debt discount) were $13.5 million, $14.2 million and $11.7 million for 2016, 2015 and 2014, respectively. Total interest costs capitalized during 2014 were $0.6 million, related to our investment in the SB Oils JV. We were in compliance with all debt covenants as of December 31, 2016 and 2015.
78
Convertible Senior Subordinated Notes -2018 Notes—On January 24, 2013 we issued $125.0 million aggregate principal amount of 6.00% Convertible Senior Subordinated Notes due 2018 (2018 Notes) in a private offering to qualified institutional buyers pursuant to Rule 144A under the Securities Act of 1933, as amended. As of December 31, 2016, we had $32.5 million aggregate principal amount of 2018 Notes outstanding. The 2018 Notes bear interest at a fixed rate of 6.00% per year, payable semiannually in arrears on August 1 and February 1 of each year. The 2018 Notes are convertible into our common stock and may be settled as described below. The 2018 Notes will mature on February 1, 2018, unless earlier repurchased or converted. We may not redeem the 2018 Notes prior to maturity.
The 2018 Notes are convertible at the option of the holders at any time prior to the close of business on the scheduled trading day immediately preceding February 1, 2018 into shares of our common stock at the then-applicable conversion rate. The conversion rate is 121.1240 shares of common stock per $1,000 principal amount of 2018 Notes (equivalent to an initial conversion price of approximately $8.26 per share of common stock). With respect to any conversion prior to November 1, 2016 (other than conversions in connection with certain fundamental changes where we may be required to increase the conversion rate as described below), in addition to the shares deliverable upon conversion, holders were entitled to receive an early conversion payment equal to $83.33 per $1,000 principal amount of 2018 Notes surrendered for conversion that may be settled, at our election, in cash or, subject to satisfaction of certain conditions, in shares of our common stock.
Convertible Senior Subordinated Notes - 2019 Notes—On April 1, 2014, we issued $149.5 million aggregate principal amount of 5.00% Convertible Senior Subordinated Notes due 2019 (2019 Notes) in a public offering. As of December 31, 2016, we had $148.1 million aggregate principal amount of 2019 Notes outstanding. The 2019 Notes bear interest at a fixed rate of 5.00% per year, payable semiannually in arrears on April 1 and October 1 of each year. The 2019 Notes are convertible into our common stock and may be settled early as described below. The 2019 Notes will mature on October 1, 2019, unless earlier repurchased or converted. We may not redeem the 2019 Notes prior to maturity.
The 2019 Notes are convertible at the option of the holders on any day prior to and including the scheduled trading day prior to October 1, 2019. The 2019 Notes are convertible at a conversion rate of 75.7576 shares of Common Stock per $1,000 principal amount of 2019 Notes (equivalent to an initial conversion price of $13.20 per share of Common Stock), subject to adjustment upon the occurrence of certain events. With respect to any conversion prior to January 1, 2018 (other than conversions in connection with certain fundamental changes where we may be required to increase the conversion rate as described below), in addition to the shares deliverable upon conversion, holders are entitled to receive an early conversion payment equal to $83.33 per $1,000 principal amount of 2019 Notes surrendered for conversion that may be settled, at the Company’s election, in cash or shares of our common stock.
We issued the Notes pursuant to our indenture agreements with Wells Fargo Bank, National Association, as trustee. The indentures provide for customary events of default, including cross acceleration to certain other indebtedness of the Company and its significant subsidiaries.
If we undergo a fundamental change (as defined), holders may require us to repurchase for cash all or part of their Notes at a purchase price equal to 100% of the principal amount of the Notes to be repurchased, plus accrued and unpaid interest to, but excluding, the fundamental change repurchase date. In addition, if certain fundamental changes occur, we may be required in certain circumstances to increase the conversion rate for any Notes converted in connection with such fundamental changes by a specified number of shares of our common stock.
The Notes are our general unsecured obligations and will be subordinated in right of payment to any senior debt outstanding. The Notes will be equal or senior in right of payment to any of our indebtedness other than senior debt. The Notes will effectively rank junior in right of payment to any of our secured indebtedness to the extent of the value of the assets securing such indebtedness and be structurally junior to all indebtedness and other liabilities of our subsidiaries, including trade payables.
Debt Conversion —During 2016, we exchanged 2018 and 2019 Notes totaling approximately $30.6 million by issuing 9,022,954 new shares (including 4,550,208 inducement shares) of our common stock. We recorded a non-cash debt conversion expense of approximately $9.8 million related to the exchange in 2016, representing the fair value of the securities transferred in excess of the fair value of the securities issuable upon the original conversion terms of the 2018 and 2019 Notes.
As of December 31, 2016, we had agreed to exchange approximately $7.6 million of 2019 Notes, and final settlement was confirmed on March 15, 2017 with an associated debt conversion expense of approximately $2.5 million, which we will record in the three months ending March 31, 2017.
79
During 2014, we exchanged 2018 Notes totaling approximately $17.5 million by issuing 2,409,964 new shares (including 160,670 inducement shares) of our common stock. We recorded a non-cash debt conversion expense of approximately $1.8 million related to the exchange in 2014, representing the fair value of the securities transferred in excess of the fair value of the securities issuable upon the original conversion terms of the 2018 Notes. In addition, we exchanged Notes with no inducement for approximately $2.6 million by issuing 333,511 common shares.
A summary of debt maturity as of December 31, 2016 was as follows (in thousands):
2017 | $ | — | |
2018 | 32,485 | ||
2019 | 148,073 | ||
Total | $ | 180,558 | |
SVB Standby Letter of Credit and Loan and Security Agreement—In the second quarter of 2016, we entered into an agreement with Silicon Valley Bank (SVB Agreement) that provides for a $12.9 million letter of credit facility (the Facility) denominated in U.S. dollars or a foreign currency. On April 29, 2016, Silicon Valley Bank issued a standby letter of credit (SVB SLOC) to support a bank guarantee issued on our behalf to BNDES in connection with the loan agreement entered into in 2013 between BNDES and the SB Oils JV. The SVB SLOC is being supported by a bank confirmation issued by the Bank of Nova Scotia (the Scotia Bank Confirmation) on behalf of Silicon Valley Bank. We are required to pay fees of 1.5% and 0.7% of the collateral per annum related to the SVB SLOC and the Scotia Bank Confirmation, respectively. We are also required to pay a fee of 1.99% of the collateral per annum for the issuance of the bank guarantee to BNDES. We are subject to customary events of default under the SVB Agreement. We have not recorded any liability for this guarantee as of December 31, 2016, as performance is not considered probable. Under the SVB Agreement, we are subject to financial covenants and covenants related to our 2018 Notes and 2019 Notes, as well as customary negative covenants. The SVB Agreement also contains certain customary representations and warranties, affirmative covenants and provisions relating to events of default.
11. COMMITMENTS AND CONTINGENCIES
Operating Lease Agreements
We record rent expense under our lease agreements on a straight-line basis. Differences between actual lease payments and rent expense recognized under these leases results in a deferred rent asset or a deferred rent liability at each reporting period.
We currently lease 106,000 square feet of office and laboratory space located in two buildings on adjacent properties in South San Francisco (SSF), California. The term of the current lease will end in January 2018. This lease agreement includes scheduled rent increases over the lease term, and we were required to provide the landlord with letters of credit supported by time deposits amounting to $0.7 million, which were included in other assets in the consolidated balance sheets as of December 31, 2016 and 2015. In addition, the landlord agreed to reimburse us up to $1.6 million of improvements to the leased property, subject to certain requirements. This reimbursement is considered a lease incentive and is recognized as a deferred lease incentive liability and recognized as a reduction of our rent expense on a straight-line basis over the term of the lease.
Future minimum lease payments under non-cancellable operating leases are as follows as of December 31, 2016 (in thousands):
2017 | $ | 4,376 | |
2018 | 366 | ||
Total minimum lease payments | $ | 4,742 | |
Rent expense from continuing operations was $3.8 million, $10.6 million and $10.5 million for 2016, 2015 and 2014, respectively.
Contractual Obligations—We have various manufacturing, research, and other contracts with vendors in the conduct of the normal course of our business. All contracts are terminable with varying provisions regarding termination. If a contract with a specific vendor were to be terminated, we would only be obligated for the products or services that we had received at the time the termination became effective.
80
Guarantees and Indemnifications—We make certain indemnities, commitments, and guarantees under which we may be required to make payments in relation to certain transactions. As permitted under Delaware law and in accordance with our amended and restated certificate of incorporation and amended and restated bylaws, we indemnify our officers and directors for certain events or occurrences, subject to certain limits, while the officer or director is or was serving at our request in such capacity. The duration of these indemnifications, commitments, and guarantees varies and, in certain cases, is indefinite. The maximum amount of potential future indemnification is unlimited; however, we have a director and officer insurance policy that may enable us to recover all or a portion of any future amounts paid. We believe the fair value of these indemnification agreements is immaterial. We have not recorded any liability for these indemnities in the accompanying consolidated balance sheets. However, we accrue for losses for any known contingent liability, including those that may arise from indemnification provisions, when future payment is probable. No such losses have been recorded to date.
Legal Matters
Norfolk Securities Class Action Litigation
In June 2015, a securities class action complaint entitled Norfolk County Retirement System v. Solazyme, Inc. et al., was filed against the Company, its then CEO, Jonathan Wolfson, its CFO/COO, Tyler Painter, certain of its current and former directors, and the underwriters of its March 2014 equity and debt offerings, Goldman, Sachs & Co., Inc. and Morgan Stanley & Co. LLC, in the U.S. District Court for the Northern District of California (the “Norfolk Securities Class Action”). The complaint asserted claims for alleged violations of Sections 11, 12(a)(2), and 15 of the Securities Act of 1933, as well as Sections 10(b) and 20(a) of the Securities Exchange Act of 1934. The complaint sought unspecified damages on behalf of a purported class that would comprise all individuals who acquired our securities (i) between February 27, 2014 and November 5, 2014 and (ii) pursuant and/or traceable to our public equity and debt offerings in March 2014. The complaint alleged that investors were misled by statements made during that period about the construction progress, development, and production capacity associated with the production facility located in Brazil owned by SB Oils. A consolidated complaint was filed in December 2015. In December 2016, the court dismissed the complaint with leave to amend.
In February 2017, the plaintiffs in the Norfolk Securities Class Action filed an amended complaint against the Company, its former CEO, Jonathan Wolfson and its current CFO/COO, Tyler Painter. The complaint asserts claims for alleged violations of Sections 10(b) and 20(a) of the Securities Exchange Act of 1934. The amended complaint seeks unspecified damages on behalf of a purported class that would comprise all individuals who acquired our securities between February 27, 2014 and November 5, 2014. The amended complaint alleges that investors were misled by statements made during that period about the construction progress, development, and production capacity associated with the production facility located in Brazil owned by SB Oils. We believe the complaint lacks merit, and intends to defend ourselves vigorously.
Derivative Litigation Related to Norfolk Class Action Litigation
In July 2015, a complaint entitled Jim Bertonis, derivatively on behalf of Solazyme, Inc. v. Jonathan Wolfson et al. was filed in the Superior Court of California, County of San Mateo. In May 2016, a second, related derivative complaint, captioned Ben Wang, derivatively on behalf of Solazyme, Inc. v. Jonathan Wolfson et al, was filed in the same court. Both actions have been consolidated going forward as In re TerraVia Holdings, Inc. f/k/a Solazyme, Inc. Shareholder Litigation (the “Bertonis State Derivative Action”). The complaints seek unspecified damages, purportedly on our behalf, from certain of our current and former directors and officers. The complaints assert claims against these defendants for breach of fiduciary duty, unjust enrichment, and aiding and abetting. The complaints allege that these defendants are liable for making allegedly false and misleading statements and omitting certain material facts in our securities filings and other public disclosures. The Bertonis State Derivative Action is based on substantially the same facts as the Norfolk Securities Class Action described above. The Bertonis State Derivative Action is presently stayed by court order through July 1, 2017. Based on a review of the plaintiffs’ allegations, we believe that the plaintiffs have not demonstrated standing to sue on our behalf.
In August 2015, a complaint entitled Gregory M. Miller, derivatively on behalf of Solazyme, Inc. v. Jonathan S. Wolfson et al. was filed in the U.S. District Court for the Northern District of California (the “Miller Federal Derivative Action”). The complaint seeks unspecified damages, purportedly on our behalf from certain of our current and former directors and officers. The complaint asserts claims against these defendants for breach of fiduciary duty and aiding and abetting. The complaint alleges that these defendants are liable for making allegedly false and misleading statements and omitting certain material facts in our securities filings and other public disclosures. The Miller Federal Derivative Action is based on substantially the same facts as the Norfolk Securities Class Action and the Bertonis State Derivative Action described above. The Miller Federal Derivative Action is presently stayed pending resolution of the anticipated motion to dismiss in the Norfolk Securities Class
81
Action. Based on a review of the plaintiffs’ allegations, we believe that the plaintiff has not demonstrated standing to sue on our behalf.
Perales Securities Class Action Litigation
In November 2016, a securities class action complaint entitled Ruben Perales v. TerraVia Holdings, Inc. et al. was filed against the Company, its former CEO, Jonathan Wolfson, its current CEO, Apu Mody and its CFO/COO, Tyler Painter, in the U.S. District Court for the Northern District of California. In December 2016, a second, related securities class action complaint, captioned Dimitrios Daniil v. TerraVia Holdings, Inc. et al, was filed in the same court (the “Perales Securities Class Action”). The plaintiffs assert claims for alleged violations of Sections 10(b) and 20(a) of the Securities Exchange Act of 1934. The plaintiffs seek unspecified damages on behalf of a purported class that would comprise all individuals who acquired our securities between March 13, 2013 and November 7, 2016. The plaintiffs allege that investors were misled by statements made during that period about our AlgaVia algae products and as a result our statements about our business, operations and prospects were false and misleading and/or lacked a reasonable basis. We believe the complaint lacks merit, and intends to defend ourselves vigorously.
Derivative Litigation Related to Perales Class Action Litigation
In February 2017, a complaint entitled Avery Daniel Robinson, derivatively on behalf of TerraVia Holdings, Inc. v. Jonathan S. Wolfson et al. was filed in the Superior Court of California, County of San Francisco (the “Robinson State Derivative Action”). The complaint seeks unspecified damages, purportedly on our behalf from our current directors and its CFO/COO, Tyler Painter. The complaint asserts claims against these defendants for breach of fiduciary duty, unjust enrichment, waste, and aiding and abetting. The complaint alleges that these defendants are liable for making allegedly false and misleading statements and omitting certain material facts in our securities filings and other public disclosures. The Robinson State Derivative Action is based on substantially the same facts as the Perales Securities Class Action described above. Based on a review of the plaintiffs’ allegations, we believe that the plaintiff has not demonstrated standing to sue on our behalf.
Roquette Frères, S.A.
In September 2013, an arbitration (the “Roquette Arbitration”) was initiated with Roquette Frères, S.A. (“Roquette”) in connection with the dissolution of a joint venture between the Company and Roquette known as Solazyme Roquette Nutritionals L.L.C. (“SRN”). We sought a declaration that, in accordance with the terms of the joint venture agreement between the parties, we should be assigned all improvements made by or on behalf of SRN to our intellectual property. In February 2015 the arbitration panel released its decision, ordering, inter alia, the assignment to the Company of (i) all SRN patent applications, (ii) all SRN know-how related to high lipid algae flour and high protein algae powder and (iii) all Roquette patent applications filed since November 2010 relating to algae food and food ingredients, as well as methods for making and using them. In addition, the arbitration panel ordered Roquette to pay to us $2.3 million in legal costs and fees. The arbitration award was confirmed by order of the U.S. District Court for the District of Delaware in December 2015. Roquette appealed the confirmation of the arbitration award to the U.S. Court of Appeals for the Third Circuit. In December 2016 the U.S. Court of Appeals for the Third Circuit upheld the confirmation of the panel’s award. Roquette has paid a portion of the award and the parties are discussing the remainder of the award, including the assignment by Roquette to the Company of all Roquette patent applications filed since November 2010 relating to algae food and food ingredients, as well as methods for making and using them. The stay entered in January 2016 by the U.S. District Court for the District of Delaware, which enjoined Roquette from pursuing any further commercialization of any technology arguably within the ambit of the arbitral decision, including the sale of products, remains in place. In connection with the arbitration award, we received a payment of $2.4 million in February 2017 from Roquette. We expect that this payment will be recognized as income in our consolidated financial statements for the three months ending March 31, 2017.
In November 2014, Roquette filed an action against the Company in U.S. District Court for the District of Delaware for declaratory judgment related to the Roquette Arbitration. Roquette sought a declaration that (i) the arbitrators in the Roquette Arbitration exceeded their authority by failing to render a timely arbitration award, (ii) any award issued by the arbitrators is void and (iii) all intangible assets of SRN should be assigned jointly to Roquette and us. Other than seeking its attorney fees and costs in the action, Roquette did not make any monetary claims against us. We filed an Answer to the Complaint in January 2015, denying substantially all of Roquette’s claims and all of its prayers for relief.
In February 2015 Roquette filed a second action against us in U.S. District Court for the District of Delaware for declaratory judgment related to the Roquette Arbitration. Roquette sought a declaration that (A) the order of the arbitrators in
82
the Roquette Arbitration for more discovery and new hearings was unenforceable and (B) in the alternative, the proposed new discovery and hearings concerned an issue that was outside the scope of the arbitration. Other than seeking its attorney fees and costs in the action, Roquette did not make any monetary claims against us. The two Delaware actions were consolidated in February 2015. We filed our Answer to the second Complaint in February 2015, denying all claims made in the Complaint and all related prayers for relief. In addition, we counterclaimed for damages for misappropriation of our trade secrets and breach of contract. In April 2015 Roquette added counterclaims against us for misappropriation of certain Roquette trade secrets and for breach of contract. Also in April 2015, Roquette filed motions for summary judgment in each of the two declaratory judgment actions commenced by Roquette, as well as on our counterclaim against Roquette for trade secret misappropriation. The summary judgment motions made by Roquette on the declaratory judgment claims were denied by the court in December 2015 and judgment on those claims was entered in our favor. The court postponed deciding Roquette’s summary judgment motions directed to our trade secret misappropriation claim against Roquette until a resolution on the arbitration award is reached. All further proceedings in the district court actions are currently stayed.
We may be involved, from time to time, in additional legal proceedings and claims arising in the ordinary course of our business. Such matters are subject to many uncertainties and outcomes are not predictable with assurance. We accrue amounts, to the extent they can be reasonably estimated, that we believes are adequate to address any liabilities related to legal proceedings and other loss contingencies that we believe will result in a probable loss. While there can be no assurances as to the ultimate outcome of any legal proceeding or other loss contingencies involving us, management does not believe any pending matters individually and in the aggregate will be resolved in a manner that would have a material effect on our consolidated financial position, results of operations or cash flows.
12. COMMON STOCK
The authorized number of shares of common stock is 225 million. The holder of each share of common stock is entitled to one vote.
In 2014, we issued 5,750,000 shares of our common stock, par value $0.001 per share, at $11.00 per share. The resulting net proceeds were approximately $59.2 million, after we paid underwriter discounts and commissions and offering expenses. In 2016, we issued approximately 3,171.0 million shares for net sale proceeds of $4.8 million pursuant to our at the market offering.
During 2016, 2015 and 2014, we issued 9,022,954, zero and 2,743,475 new shares following the exchange of 2018 and 2019 Notes for common stock (see Note 10).
13. CONVERTIBLE PREFERRED STOCK
In March 2016, we issued 27,850 shares of Convertible Preferred Stock for cash proceeds of $27.0 million, net of issuance costs of $0.8 million. Shares of the Series A Preferred Stock are convertible at the option of the holders into shares of our common stock, at an initial conversion price of $2.00 per share, subject to customary adjustments in the event of stock splits and certain other changes to our capitalization. In 2016, two of the holders of preferred stock converted 1,100 shares of Convertible Preferred Stock into 550,000 shares of our common stock. This transaction resulted in an increase to common stock and additional paid in capital, and a decrease to convertible preferred stock of approximately $1.1 million. We have classified the convertible preferred stock as temporary equity in our consolidated balance sheet as of December 31, 2016 due to the existence of certain change in control provisions that are not solely within our control.
The convertible preferred stock contains the following terms and conditions:
• | Dividends. The holders are entitled to participate equally and ratably with holders of our common stock in all dividends and distributions on an as-converted basis, subject to certain customary exceptions. The Preferred Stock ranks senior to our common stock. |
• | Liquidation Preference. In the event of any voluntary or involuntary liquidation, dissolution or winding up of the Company or certain change of control transactions, each holder will be entitled to receive a liquidation preference before any distribution or payment is made to holders of our common stock or any other security that ranks junior to the Preferred Stock. |
• | Voting Rights. Holders are entitled to vote together as a single class with the holders of our common stock on all matters submitted for a vote by holders of our common stock, with each such holder of Preferred Stock being |
83
entitled to cast a number of votes equal to the number of whole shares of our common stock issuable upon conversion of such Preferred Stock.
• | Board Representation. For so long as the outstanding shares of Preferred Stock represent at least 5.0% of our outstanding voting power on an as-converted basis, the holders have the right to designate a nominee for election to our Board of Directors. As of December 31, 2016, our Board does not include any such nominee. |
• | Protective Provisions. For so long as at least 1,392 shares of Preferred Stock remain outstanding, we may not, without the approval of the holders of at least two-thirds of the then outstanding shares of Preferred Stock: (i) amend any provision of the Certificate of Designations or our Amended and Restated Certificate of Incorporation or bylaws so as to adversely affect the rights, preferences or privileges of the Preferred Stock; or (ii) declare or pay any divided on our common stock, subject to certain customary exceptions. In addition, for so long as at least 11,140 shares of Preferred Stock remain outstanding, we may not, without the approval of the holders of at least two-thirds of the then outstanding shares of Preferred Stock, create, authorize or issue any equity securities senior to the Preferred Stock. |
• | Mandatory Conversion. We can require the conversion of the outstanding shares of Preferred Stock if either the trading price per share of our common stock is greater than $6 before March 15, 2019 or $8 per share thereafter, subject to certain customary conditions. |
• | Transfer Restrictions. No holder of any shares of Preferred Stock may transfer such shares except to their affiliate or the Company. If the transfer is to an affiliate, such affiliate must become a party to the Registration Rights Agreements. In addition, if such affiliate would beneficially own 5% or more of our aggregate voting power after giving effect to the transfer, they must enter into a customary standstill agreement. |
14. STOCK-BASED COMPENSATION
Stock-based compensation expense (including amounts related to restricted stock units, modifications and exchanges discussed below) was as follows (in thousands):
2016 | 2015 | 2014 | |||||||||
Employees | $ | 10,862 | $ | 14,652 | $ | 23,881 | |||||
Nonemployees | 1,050 | 1,032 | 1,668 | ||||||||
Total stock based compensation expense | $ | 11,912 | $ | 15,684 | $ | 25,549 | |||||
Comprised as follows: | |||||||||||
Continuing operations: Research and development | $ | 2,623 | $ | 4,562 | $ | 7,407 | |||||
Continuing operations: Sales, general and administrative | 8,827 | 10,052 | 16,938 | ||||||||
Total continuing operations | 11,450 | 14,614 | 24,345 | ||||||||
Discontinued operations | 462 | 1,070 | 1,204 | ||||||||
Total stock based compensation expense | $ | 11,912 | $ | 15,684 | $ | 25,549 | |||||
Our equity incentive plans allow us to grant options, restricted stock and stock purchase rights to our employees, directors, or consultants. Options granted may be either incentive stock options or nonstatutory stock options. Incentive stock options may be granted to employees (including offices and directors, who are also employees). Nonstatutory stock options may be granted to employees, directors or consultants. As of December 31, 2016 there were 10,650,151 shares available for issuance under our equity plans.
Options under our plans may be granted for periods up to ten years. All options issued to date have had up to a ten year life. The exercise price of incentive and nonstatutory stock options shall not be less than 100% of the fair market value of the shares on the date of grant. The Board of Directors determines the vesting period of stock-based awards. Our stock options generally vest over four years. Restricted stock awards are subject to forfeiture if certain vesting requirements are not met. We issue new common stock from authorized shares upon the exercise of stock options.
Employee Stock Purchase Plan—We have an Employee Stock Purchase Plan (the ESPP). The purchase price of the common stock under the ESPP is 85% of the lower of the fair market value of a share of common stock on the first day of the offering period or the last day of the purchase period. The ESPP also provides for automatic annual increases in the number of
84
shares reserved for future issuance, and during 2016 an additional 817,340 shares were reserved under the ESPP as a result of this provision. As of December 31, 2016 there were 3,409,883 shares available for issuance under the ESPP.
We recognized stock-based compensation expense (benefit) related to our 2011 ESPP of ($0.2 million), $0.1 million and $0.7 million for 2016, 2015 and 2014, respectively.
Stock Options
A summary of our stock option activity under the Plans and related information is as follows:
Number of Options | Weighted Average Exercise Price | Weighted Average Remaining Contractual Term (in years) | Aggregate Intrinsic Value(1) | |||||||||
(in thousands) | ||||||||||||
Balance at December 31, 2015 | 11,900,671 | $ | 4.20 | 7.7 | $ | 999 | ||||||
Granted | 4,286,008 | $ | 2.15 | |||||||||
Exercised | (380,145 | ) | $ | 1.83 | ||||||||
Forfeited, canceled or expired | (3,099,497 | ) | $ | 4.26 | ||||||||
Balance at December 31, 2016 | 12,707,037 | $ | 3.56 | 7.4 | $ | 137 | ||||||
Options vested and exercisable at December 31, 2016 | 7,553,273 | $ | 4.34 | 6.3 | $ | 137 | ||||||
Options vested and expected to vest as of December 31, 2016 | 11,543,799 | $ | 3.68 | 7.2 | $ | 137 | ||||||
(1) | The aggregate intrinsic value represents the value by which our closing stock price on the last trading day of the year ended December 31, 2016 exceeds the exercise price of the stock multiplied by the number of options outstanding or exercisable, excluding any that have a negative intrinsic value. |
The weighted-average grant date fair value of options granted was $1.42, $1.68 and $3.98 for 2016, 2015 and 2014, respectively. The total intrinsic value of options exercised was $254,000, $251,000 and $5.8 million for 2016, 2015 and 2014, respectively.
The total grant date fair value of options vesting in 2016, 2015 and 2014 was $11.3 million, $3.8 million and $14.7 million, respectively.
The following table presents the composition of options outstanding and vested and exercisable as of December 31, 2016:
Options Outstanding | Options Vested and Exercisable | ||||||||||||||||
Range of Exercise Prices | Number of Options | Weighted Average Exercise Price | Weighted Average Remaining Contractual Term (in years) | Number of Vested and Exercisable Options | Weighted Average Exercise Price | Weighted Average Remaining Contractual Term (in years) | |||||||||||
$0.12-2.39 | 3,107,393 | $ | 1.72 | 7.4 | 1,536,600 | $ | 1.71 | 5.5 | |||||||||
$2.46-2.60 | 4,087,859 | $ | 2.52 | 6.8 | 2,823,284 | $ | 2.54 | 6.2 | |||||||||
$2.62-2.72 | 3,215,695 | $ | 2.66 | 9.1 | 1,115,374 | $ | 2.68 | 8.6 | |||||||||
$2.76-8.77 | 1,008,356 | $ | 5.50 | 6.4 | 823,328 | $ | 5.94 | 6.0 | |||||||||
$8.92-27.03 | 1,287,734 | $ | 12.07 | 5.6 | 1,254,687 | $ | 12.06 | 5.6 | |||||||||
Totals | 12,707,037 | $ | 3.56 | 7.4 | 7,553,273 | $ | 4.34 | 6.3 | |||||||||
No income tax benefits have been recognized related to stock-based compensation expense for 2016, 2015 and 2014.
Employee Stock-Based Compensation—There was unrecognized stock-based compensation cost of $6.6 million related to nonvested stock options granted to employees and directors as of December 31, 2016, and we expect to recognize this cost over a weighted-average period of 2.2 years. The grant date fair value of employee stock-based awards was estimated using the following weighted-average assumptions:
85
2016 | 2015 | 2014 | |||
Expected term (in years) | 5.1-6.1 | 5.3-6.0 | 5.3-6.0 | ||
Volatility | 75%-80% | 67%-73% | 51%-68% | ||
Risk-free interest rate | 1.05%-2.02% | 0.86%-1.85% | 1.58%-2.0% | ||
Dividend yield | —% | —% | —% | ||
Nonemployee Stock-Based Compensation—There was unrecognized stock-based compensation cost of approximately $0.2 million related to nonvested stock options granted to nonemployees as of December 31, 2016, and we expect to recognize this cost over a weighted-average period of 0.9 years. The fair value of non-employee stock-based awards was estimated using the following weighted-average assumptions:
2016 | 2015 | 2014 | |||
Expected term (in years) | 8.9-9.2 | 8.2-8.6 | 8.3-8.6 | ||
Volatility | 69%-70% | 65%-67% | 53%-64% | ||
Risk-free interest rate | 1.42%-2.32% | 1.83%-2.21% | 2.0%-2.5% | ||
Dividend yield | —% | —% | —% | ||
Restricted Stock Units—A summary of our restricted stock unit activity was as follows:
Number of Shares | Weighted Average Grant Date Fair Value | |||||
Unvested at December 31, 2015 | 1,883,552 | $ | 9.85 | |||
Granted | 681,325 | $ | 2.16 | |||
Vested | (682,064 | ) | $ | 6.87 | ||
Canceled | (608,854 | ) | $ | 6.13 | ||
Unvested at December 31, 2016 | 1,273,959 | $ | 4.22 | |||
Stock-based compensation expense related to RSUs was as follows (in thousands):
Year ended December 31, | |||||||||||
2016 | 2015 | 2014 | |||||||||
Continuing operations | $ | 3,796 | $ | 5,076 | $ | 8,077 | |||||
Discontinued operations | 70 | 556 | 509 | ||||||||
Total stock based compensation expense | $ | 3,866 | $ | 5,632 | $ | 8,586 | |||||
Stock Option Modification—In August 2016, we modified an employee’s stock options and recorded $116,000 of additional discontinued operations stock-based compensation expense in 2016. In October 2014, we modified an employee’s stock options and recorded $2.3 million of additional continuing operations stock-based compensation expense in 2014.
Employee Stock Option Exchange Program—In January 2015, we commenced an exchange offer to allow employees the opportunity to exchange, on a grant-by-grant basis, their outstanding eligible options that had an exercise price per share equal to or greater than $6.79 for new stock options on a two-for-one basis that we granted under our 2011 EIP. Generally, all employees with options were eligible to participate in the program, which expired on February 18, 2015. Non-employee members of our Board of Directors were not eligible to participate. Each new stock option has an exercise price of $2.58, the last reported sale price per share of our common stock on the NASDAQ Global Select Market on February 19, 2015, which was the new stock option grant date.Each new stock option has a maximum term that is equal to the remaining term of the corresponding eligible option. Each new stock option has the same final vesting date as the corresponding eligible option. Each new stock option has the same rate of vesting, from the same vesting commencement date, as the corresponding eligible option, provided that any vesting that would have occurred prior to January 1, 2016 cumulated and cliff vested on January 1, 2016. This is the case even if the eligible options were fully vested on the date of the exchange. On February 19, 2015, we granted new options to eligible options holders to purchase 2,745,279 shares of common stock in exchange for the cancellation of the
86
tendered options. We record a charge of approximately $0.5 million associated with the stock option modification over the vesting periods of the new options which range from ten months to four years. This modification charge was recorded as additional stock-based compensation expense beginning in the first quarter of 2015.
15. INCOME TAXES
Income tax benefit from continuing operations was $2.1 million, zero, and zero in 2016, 2015 and 2014, respectively. This amount was comprised of $1.8 million of U.S. federal taxes and $0.2 million of U.S. state taxes. Income from discontinued operations included equivalent amounts of income tax expense, leading to no overall income tax expense for all periods presented.
We have federal, state and foreign net operating loss carryforwards of approximately $594.9 million, $364.5 million and $14.5 million, respectively, as of December 31, 2016. Federal net operating loss carryforwards expire beginning in 2024 and state net operating loss carryforwards expire beginning in 2017, if not utilized. We have federal and state research and development tax credit carryforwards of $6.2 million and $4.1 million, respectively, as of December 31, 2016. The federal research and development tax credit carryforwards will expire starting in 2028 if not utilized. The state research and development tax credit carryforwards can be carried forward indefinitely.
Utilization of the net operating loss and research and development credit carryforwards may be subject to an annual limitation due to the ownership percentage change limitations provided by Section 382 of the Internal Revenue Code and similar state provisions. The annual limitation may result in the expiration of the net operating losses and research and development credit carryforwards before utilization.
The components of loss before income taxes from continuing operations were as follows for 2016, 2015 and 2014 (in thousands):
Years Ending December 31, | |||||||||||
2016 | 2015 | 2014 | |||||||||
United States | $ | (105,533 | ) | $ | (135,359 | ) | $ | (158,390 | ) | ||
Foreign | (1,386 | ) | (3,023 | ) | (2,771 | ) | |||||
Loss before income taxes from continuing operations | $ | (106,919 | ) | $ | (138,382 | ) | $ | (161,161 | ) | ||
Reconciling items from income tax computed at the statutory federal rate for the years ended December 31, 2016, 2015 and 2014, were as follows:
Years Ending December 31, | ||||||||
2016 | 2015 | 2014 | ||||||
Federal income tax statutory rate | 34.0 | % | 34.0 | % | 34.0 | % | ||
State income taxes, net of federal benefits | 4.5 | 2.2 | 1.6 | |||||
Revalued derivative liability | — | — | 0.6 | |||||
Incentive stock option compensation | (0.4 | ) | (0.4 | ) | (1.3 | ) | ||
Research tax credits | 1.4 | 0.4 | 0.8 | |||||
Other | (0.1 | ) | — | — | ||||
Valuation allowance | (37.5 | ) | (36.2 | ) | (35.7 | ) | ||
Effective income tax rate from continuing operations | 1.9 | % | — | % | — | % | ||
87
The tax effects of temporary differences and carry forwards that give rise to significant portions of the deferred tax assets are as follows (in thousands):
December 31, | |||||||
2016 | 2015 | ||||||
Net operating loss carry forwards | $ | 228,637 | $ | 187,169 | |||
Capitalized start-up costs | 7,093 | 7,475 | |||||
Research and development credits | 8,922 | 6,320 | |||||
Stock compensation | 10,256 | 12,683 | |||||
Other | 4,313 | 6,875 | |||||
Total deferred tax assets | 259,221 | 220,522 | |||||
Valuation allowance | (255,765 | ) | (216,220 | ) | |||
Deferred tax liability—fixed assets | (3,456 | ) | (3,056 | ) | |||
Deferred tax liability—derivative liability | — | (1,246 | ) | ||||
Net deferred tax assets, after valuation allowance | $ | — | $ | — | |||
We track the portion of our deferred tax assets attributable to excess stock option benefits in accordance with FASB ASC 718-740-45, Other Presentation Matters, and therefore, these amounts are not included in our deferred tax assets. The deferred tax assets attributable to excess stock option benefits total $6.8 million at December 31, 2016, and the benefit related thereto will only be recognized when it reduces cash taxes payable.
Our deferred tax assets represent an unrecognized future tax benefit. We have provided a full valuation allowance on our deferred tax assets as of December 31, 2016 and 2015, as management believes it is more likely than not that the related deferred tax asset will not be realized. The net valuation allowance increased by $39.5 million during 2016.
Uncertain Tax Positions
A reconciliation of the beginning and ending amount of unrecognized tax benefits is as follows (in thousands):
Balance as of December 31, 2013 | $ | 1,488 | |
Addition based on tax positions related to current year | 6,411 | ||
Additions based on tax positions related to prior year | 4,042 | ||
Balance as of December 31, 2014 | 11,941 | ||
Addition based on tax positions related to current year | 184 | ||
Reduction based on tax positions related to prior year | (9,799 | ) | |
Additions based on tax positions related to prior year | 86 | ||
Balance as of December 31, 2015 | 2,412 | ||
Addition based on tax positions related to current year | 595 | ||
Additions based on tax positions related to prior year | 431 | ||
Balance as of December 31, 2016 | $ | 3,438 | |
Our policy is to include interest and penalties related to unrecognized tax benefits within the provision for income taxes. Management has determined that no accrual for interest and penalties was required as of December 31, 2016. We do not anticipate the total amounts of unrecognized tax benefits will significantly increase or decrease in the next twelve months.
We are subject to taxation in the U.S., various states and a foreign jurisdiction. As of December 31, 2016, our tax years 2004 and thereafter remain subject to examination by the tax authorities.
88
16. EMPLOYEE BENEFIT PLAN
We sponsor a 401(k) plan for our employees whereby eligible employees may contribute up to 90% of their compensation, on a pretax basis, subject to the maximum amount permitted by the Internal Revenue Code. We have not contributed to, nor are we required to contribute to, the 401(k) plan since its inception.
17. RESTRUCTURING CHARGES
Restructuring charges were $1.4 million, $5.0 million and $3.5 million for 2016, 2015 and 2014, respectively.
2016 Restructuring Plan
As part of our continuing strategy to focus our operations on targeted, higher-value product categories, we streamlined operations by reducing workforce by approximately 20% in January 2016. As a result, we recorded a charge for employee termination costs of $1.2 million in 2016, substantially all of which was paid as of December 31, 2016.
2015 Exit Activities
In October 2015, we made a strategic decision to terminate our current manufacturing agreements at the ADM Clinton and American Natural Processors (ANP) Galva facilities to better align our immediate production assets with our operating strategy while minimizing production costs. On October 29, 2015, we provided to ADM a notice of termination of the Operating Agreement entered into with ADM in November 2012 related to the production of products at the Clinton Facility. On February 26, 2016, the Operated Agreement and the Strategic Collaboration Agreement with ADM terminated. In December 2015, we entered into a termination agreement with ADM (ADM Termination Agreement). A summary of the costs, which were recorded to restructuring charges in the consolidated statements of operations during 2016 and 2015 was as follows (in thousands):
2015 Expense | Deductions/Payments | Liability as of December 31, 2015 | 2016 Expense | Deductions/Payments | Liability as of December 31, 2016 | |||||||||||||||||||
Facility closure costs | $ | 495 | $ | (495 | ) | $ | — | $ | — | $ | — | $ | — | |||||||||||
Asset impairment | 4,931 | (4,931 | ) | — | — | — | — | |||||||||||||||||
Other exit costs | 6,429 | (3,029 | ) | 3,400 | 254 | (3,654 | ) | — | ||||||||||||||||
Reversal of deferred rent liabilities | (7,273 | ) | 7,273 | — | — | — | — | |||||||||||||||||
Total | $ | 4,582 | $ | (1,182 | ) | $ | 3,400 | $ | 254 | $ | (3,654 | ) | $ | — | ||||||||||
2014 Restructuring Plan
On December 18, 2014 we took steps to decrease operating expenses through a reduction in workforce and other cost-cutting measures. All costs were paid as of December 31, 2015. A summary of the costs associated recorded to Restructuring Charges in the consolidated statements of operations during 2015 and 2014 was as follows (in thousands):
2014 | 2015 | ||||||
Employee termination costs | $ | 1,962 | $ | (22 | ) | ||
Asset impairment | 1,552 | — | |||||
Other exit costs | — | 393 | |||||
Total | $ | 3,514 | $ | 371 | |||
18. SALE OF ALGENIST AND DISCONTINUED OPERATIONS
On August 16, 2016, we sold our Algenist skincare business to TCP Algenist LLC, an affiliate of Tengram Capital Partners and Algenist Holdings, Inc., in exchange for $18.8 million in cash, net of closing costs, 19.9% of the fully diluted equity of Algenist Holdings, Inc. and the assumption of substantially all of the liabilities related to the Algenist skincare
89
business by Algenist Holdings, Inc. The gain on the sale of the Algenist business was as follows (in thousands):
Cash received, net of closing costs | $ | 18,837 | |
19.9% interest in Algenist at fair value | 1,600 | ||
20,437 | |||
Net assets sold (primarily working capital) | (11,470 | ) | |
Gain on sale of Algenist before income taxes | $ | 8,967 | |
The summary comparative financial results of the Algenist discontinued operations were as follows (in thousands):
Year ended December 31, | |||||||||||
2016 | 2015 | 2014 | |||||||||
Total revenues | $ | 13,674 | $ | 23,278 | $ | 24,429 | |||||
Costs and operating expenses: | |||||||||||
Cost of product revenues | 4,724 | 7,616 | 7,746 | ||||||||
Sales, general and administrative | 12,525 | 18,692 | 17,645 | ||||||||
Total costs and operating expenses | 17,249 | 26,308 | 25,391 | ||||||||
Income (loss) before other expense | (3,575 | ) | (3,030 | ) | (962 | ) | |||||
Other expense | (29 | ) | (35 | ) | (18 | ) | |||||
Gain on sale of Algenist | 8,967 | — | — | ||||||||
Income (loss) from discontinued operations before income taxes | 5,363 | (3,065 | ) | (980 | ) | ||||||
Income tax provision | 2,062 | — | — | ||||||||
Income (loss) from discontinued operations | $ | 3,301 | $ | (3,065 | ) | $ | (980 | ) | |||
Assets and liabilities related to Algenist presented as discontinued operations as of December 31, 2015 were as follows (in thousands):
Accounts receivable | $ | 1,941 | |
Inventories | 8,806 | ||
Prepaid expenses and other current assets | 2,642 | ||
Current assets of discontinued operations | $ | 13,389 | |
Property, plant and equipment, net | $ | 348 | |
Accounts payable | $ | 2,065 | |
Accrued liabilities | 849 | ||
Current liabilities of discontinued operations | $ | 2,914 | |
Noncurrent liabilities of discontinued operations | $ | 26 | |
After the sale, we consider that we have sufficient influence over Algenist Holdings, Inc. to require equity accounting. Hence we recognize our proportionate share of the earnings (losses) of Algenist Holdings, Inc. under the equity method of accounting within results of continuing operations. Our investment in Algenist Holdings, Inc. included in equity method investment assets on our consolidated balance sheet was $1.5 million as of December 31, 2016, and our equity loss from our investment in Algenist Holdings, Inc. for the period from August 16, 2016 to December 31, 2016 was $0.1 million.
Summarized financial information
90
Summarized financial information for the Algenist Holdings, Inc. balance sheet as of December 31, 2016 and the income statement for the period from August 16, 2016 to December 31, 2016 was as follows (in thousands):
Current assets | $ | 14,883 | |
Property, plant and equipment, net | 666 | ||
Other assets | 15,044 | ||
Total assets | $ | 30,593 | |
Current liabilities | $ | 2,580 | |
Noncurrent liabilities | 1 | ||
Stockholders' equity | 28,012 | ||
Total liabilities and stockholders' equity | $ | 30,593 | |
Statements of Operations: | |||
Net sales | $ | 8,843 | |
Gross profit | $ | 5,861 | |
Net loss | $ | (768 | ) |
91
19. SELECTED QUARTERLY FINANCIAL DATA (Unaudited)
We have presented the historical results of Algenist (See Note 18) as discontinued operations for all periods presented in this filing. The following table provides the selected quarterly financial data for 2016 and 2015 (in thousands, except per share amounts):
Quarter Ended | |||||||||||||||||||||||||||||||
December 31, 2016 | September 30, 2016 | June 30, 2016 | March 31, 2016 | December 31, 2015 | September 30, 2015 | June 30, 2015 | March 31, 2015 | ||||||||||||||||||||||||
Revenues: | |||||||||||||||||||||||||||||||
Product revenues | $ | 617 | $ | 709 | $ | 856 | $ | 1,301 | $ | 2,045 | $ | 2,251 | $ | 3,116 | $ | 2,610 | |||||||||||||||
Research and development programs | 4,219 | 3,601 | 3,592 | 3,587 | 3,348 | 2,266 | 3,433 | 3,784 | |||||||||||||||||||||||
Total revenues | 4,836 | 4,310 | 4,448 | 4,888 | 5,393 | 4,517 | 6,549 | 6,394 | |||||||||||||||||||||||
Costs and operating expenses: | |||||||||||||||||||||||||||||||
Cost of product revenues | 2,218 | 884 | 850 | 1,304 | 2,788 | 2,411 | 3,014 | 2,350 | |||||||||||||||||||||||
Research and development | 6,901 | 7,708 | 8,276 | 8,231 | 9,586 | 13,207 | 12,747 | 12,554 | |||||||||||||||||||||||
Sales, general and administrative | 10,096 | 11,169 | 10,834 | 11,642 | 14,075 | 15,143 | 16,411 | 16,412 | |||||||||||||||||||||||
Restructuring charges | (43 | ) | 216 | 49 | 1,190 | 4,581 | (21 | ) | (31 | ) | 424 | ||||||||||||||||||||
Total costs and operating expenses | 19,172 | 19,977 | 20,009 | 22,367 | 31,030 | 30,740 | 32,141 | 31,740 | |||||||||||||||||||||||
Loss from continuing operations before other income (expense): | (14,336 | ) | (15,667 | ) | (15,561 | ) | (17,479 | ) | (25,637 | ) | (26,223 | ) | (25,592 | ) | (25,346 | ) | |||||||||||||||
Other income (expense): | |||||||||||||||||||||||||||||||
Interest and other (expense) income, net | (2,544 | ) | (2,898 | ) | (3,157 | ) | (3,116 | ) | (3,314 | ) | (3,047 | ) | (3,534 | ) | (3,300 | ) | |||||||||||||||
Loss from equity method investments | (5,783 | ) | (6,378 | ) | (5,358 | ) | (4,872 | ) | (4,098 | ) | (5,916 | ) | (7,309 | ) | (5,066 | ) | |||||||||||||||
Debt conversion expense | (4,743 | ) | (3,242 | ) | (1,785 | ) | — | — | — | — | — | ||||||||||||||||||||
Total other income (expense) | (13,070 | ) | (12,518 | ) | (10,300 | ) | (7,988 | ) | (7,412 | ) | (8,963 | ) | (10,843 | ) | (8,366 | ) | |||||||||||||||
Loss from continuing operations before income taxes | (27,406 | ) | (28,185 | ) | (25,861 | ) | (25,467 | ) | (33,049 | ) | (35,186 | ) | (36,435 | ) | (33,712 | ) | |||||||||||||||
Benefit from income taxes | (223 | ) | (1,839 | ) | — | — | — | — | — | — | |||||||||||||||||||||
Loss from continuing operations | (27,183 | ) | (26,346 | ) | (25,861 | ) | (25,467 | ) | (33,049 | ) | (35,186 | ) | (36,435 | ) | (33,712 | ) | |||||||||||||||
Income (loss) from discontinued operations, net of tax | 71 | 5,852 | (1,577 | ) | (1,045 | ) | (1,644 | ) | 268 | (736 | ) | (953 | ) | ||||||||||||||||||
Net loss | $ | (27,112 | ) | $ | (20,494 | ) | $ | (27,438 | ) | $ | (26,512 | ) | $ | (34,693 | ) | $ | (34,918 | ) | $ | (37,171 | ) | $ | (34,665 | ) | |||||||
Net income (loss) per share, basic and diluted: | |||||||||||||||||||||||||||||||
Continuing operations | $ | (0.30 | ) | $ | (0.31 | ) | $ | (0.31 | ) | $ | (0.31 | ) | $ | (0.41 | ) | $ | (0.44 | ) | $ | (0.45 | ) | $ | (0.43 | ) | |||||||
Discontinued operations | — | 0.07 | (0.02 | ) | (0.01 | ) | (0.02 | ) | 0.01 | (0.01 | ) | (0.01 | ) | ||||||||||||||||||
Net loss per share, basic and diluted | $ | (0.30 | ) | $ | (0.24 | ) | $ | (0.33 | ) | $ | (0.32 | ) | $ | (0.43 | ) | $ | (0.43 | ) | $ | (0.46 | ) | $ | (0.44 | ) | |||||||
Weighted average number of common shares used in loss per share computation, basic and diluted | 91,582 | 85,837 | 84,380 | 81,950 | 80,600 | 80,298 | 80,098 | 79,650 | |||||||||||||||||||||||
92
Item 9. Changes in and Disagreements with Accountants on Accounting and Financial Disclosures.
None.
Item 9A. Controls and Procedures.
Our management, including our Chief Executive Officer and Chief Financial Officer, evaluated the effectiveness of our disclosure controls and procedures as of December 31, 2016. The term “disclosure controls and procedures,” as defined in Rules 13a-15(e) and 15d-15(e) under the Exchange Act, means controls and other procedures of a company that are designed to ensure that information required to be disclosed by us in the reports that we file or submit under the Exchange Act is recorded, processed, summarized and reported within the time periods specified in the SEC’s rules and forms. Disclosure controls and procedures include, without limitation, controls and procedures designed to ensure that information required to be disclosed by us in the reports that we file or submit under the Exchange Act is accumulated and communicated to our management, including our Chief Executive Officer and Chief Financial Officer, as appropriate, to allow timely decisions regarding required disclosure. In designing and evaluating the disclosure controls and procedures, management recognizes that any controls and procedures, no matter how well designed and operated, can provide only reasonable, and not absolute, assurance of achieving the desired objectives. In reaching a reasonable level of assurance, management necessarily applies its judgment in evaluating the cost-benefit relationship of possible controls and procedures. Based on this evaluation, our Chief Executive Officer and Chief Financial Officer concluded that our disclosure controls and procedures were effective as of December 31, 2016 at the reasonable assurance level.
Management’s Report on Internal Control over Financial Reporting
Our management is responsible for establishing and maintaining adequate internal control over financial reporting, as such term is defined in Exchange Act Rules 13a-15(f) and 15d-15(f). Under the supervision and with the participation of our management, including our Chief Executive Officer and Chief Financial Officer, we conducted an evaluation of the effectiveness of our internal control over financial reporting as of December 31, 2016 based on the guidelines established in Internal Control—Integrated Framework (2013) issued by the Committee of Sponsoring Organizations of the Treadway Commission (COSO). Our internal control over financial reporting includes policies and procedures that provide reasonable assurance regarding the reliability of financial reporting and the preparation of financial statements for external reporting purposes in accordance with U.S. generally accepted accounting principles.
Based on the results of our evaluation, our management concluded that our internal control over financial reporting was effective as of December 31, 2016. We reviewed the results of management’s assessment with our Audit Committee. The effectiveness of our internal control over financial reporting as of December 31, 2016 has been audited by Deloitte & Touche LLP, an independent registered public accounting firm, as stated in their report which is included in this Annual Report on Form 10-K.
Changes in Internal Control Over Financial Reporting
There was no change in our internal control over financial reporting (as defined in Rules 13a-15(f) and 15d-15(f) under the Exchange Act) that occurred during the quarterly period ended December 31, 2016 that has materially affected, or is reasonably likely to materially affect, our internal control over financial reporting.
Inherent Limitations on Effectiveness of Controls
Our management, including our Chief Executive Officer and Chief Financial Officer, believes that our disclosure controls and procedures and internal control over financial reporting are designed to provide reasonable assurance of achieving their objectives and are effective at the reasonable assurance level. However, our management does not expect that our disclosure controls and procedures or our internal control over financial reporting will prevent all errors and all fraud. A control system, no matter how well conceived and operated, can provide only reasonable, not absolute, assurance that the objectives of the control system are met. Further, the design of a control system must reflect the fact that there are resource constraints, and the benefits of controls must be considered relative to their costs. Because of the inherent limitations in all control systems, no evaluation of controls can provide absolute assurance that all control issues and instances of fraud, if any, have been detected. These inherent limitations include the realities that judgments in decision making can be faulty, and that breakdowns can occur because of a simple error or mistake. Additionally, controls can be circumvented by the individual acts of some persons, by collusion of two or more people or by management override of the controls. The design of any system of controls also is based in part upon certain assumptions about the likelihood of future events, and there can be no assurance that any design will succeed in achieving its stated goals under all potential future conditions; over time, controls may become inadequate because of changes
93
in conditions, or the degree of compliance with policies or procedures may deteriorate. Because of the inherent limitations in a cost effective control system, misstatements due to error or fraud may occur and not be detected.
Item 9B. Other Information.
None.
94
PART III
Item 10. Directors, Executive Officers and Corporate Governance.
The information required by this item concerning our directors, executive officers, compliance with Section 16 of the Exchange Act, our Code of Business Conduct and Ethics and other governance matters is incorporated by reference from the information set forth in the sections under the headings “Directors, Executive Officers and Corporate Governance” and “Section 16(a) Beneficial Ownership Reporting Compliance” in our Definitive Proxy Statement to be filed with the Securities and Exchange Commission pursuant to Regulation 14A within 120 days after our fiscal year end of December 31, 2016 in connection with the Annual Meeting of Stockholders to be held in 2017 (the 2017 Proxy Statement).
Item 11. Executive Compensation.
The information required by this item is incorporated by reference from the information in the 2017 Proxy Statement under the headings “Executive Compensation,” “Directors, Executive Officers and Corporate Governance—Non-Employee Director Compensation” and “Directors, Executive Officers and Corporate Governance—Compensation Committee Interlocks and Insider Participation.”
Item 12. Security Ownership of Certain Beneficial Owners and Management and Related Stockholder Matters.
The information required by this item concerning securities authorized for issuance under equity compensation plans and security ownership of certain beneficial owners and management is incorporated by reference from the information in the 2017 Proxy Statement under the headings “Equity Compensation Plan Information” and “Security Ownership of Certain Beneficial Owners and Officers and Directors.”
Item 13. Certain Relationships and Related Transactions, and Director Independence.
The information required by this item concerning transactions with related persons and director independence is incorporated by reference from the information in the 2017 Proxy Statement under the headings “Certain Relationships and Related Party Transactions” and “Directors, Executive Officers and Corporate Governance.”
Item 14. Principal Accounting Fees and Services.
The information required by this item is incorporated by reference from the information in the 2017 Proxy Statement under the heading “Ratification of Appointment of Independent Registered Public Accounting Firm—Fees Paid to Auditors.”
95
PART IV
Item 15. Exhibits and Financial Statement Schedules.
1. Our consolidated financial statements are filed as part of this Annual Report on Form 10-K in Item 8. Financial Statements and Supplementary Data, and a list of the consolidated financial statements are found on page 58 of this report.
2. The consolidated financial statements of Solazyme Bunge Renewable Oils Cooperatief U.A. for 2016, 2015 (unaudited) and 2014 (unaudited) are included as Exhibit 99.1 to this Annual Report on Form 10-K in accordance with SEC Regulation S-X, Rule 3-09 - Separate financial statements of subsidiaries not consolidated and 50 percent or less owned persons.
3. Exhibits: The exhibits listed in the accompanying index to exhibits are filed or incorporated by reference as part of this Annual Report on Form 10-K.
96
SIGNATURES
Pursuant to the requirements of Section 13 or 15(d) of the Securities Exchange Act of 1934, the registrant has duly caused this report to be signed on its behalf by the undersigned, thereunto duly authorized.
TERRAVIA HOLDINGS, INC. | |
By:/S/ APURVA S. MODY | |
Name: Apurva S. Mody | |
Title: Chief Executive Officer | |
Date: March 16, 2017
POWER OF ATTORNEY
Each person whose individual signature appears below hereby authorizes and appoints Apurva S. Mody and Tyler W. Painter, and each of them, with full power of substitution and resubstitution and full power to act without the other, as his or her true and lawful attorney-in-fact and agent to act in his or her name, place and stead and to execute in the name and on behalf of each person, individually and in each capacity stated below, and to file any and all amendments to this annual report on Form 10-K and to file the same, with all exhibits thereto, and other documents in connection therewith, with the Securities and Exchange Commission, granting unto said attorneys-in-fact and agents, and each of them, full power and authority to do and perform each and every act and thing, ratifying and confirming all that said attorneys-in-fact and agents or any of them or their or his substitute or substitutes may lawfully do or cause to be done by virtue thereof.
Pursuant to the requirements of the Securities Exchange Act of 1934, this report has been signed by the following persons on behalf of the registrant in the capacities and on the dates indicated.
Signature | Title | Date | ||
/s/ Apurva S. Mody | Chief Executive Officer and Director (Principal Executive Officer) | March 16, 2017 | ||
Apurva S. Mody | ||||
/s/ Tyler W. Painter | Chief Financial Officer and Chief Operating Officer (Principal Financial and Accounting Officer) | March 16, 2017 | ||
Tyler W. Painter | ||||
/s/ Irene Chang Britt | Chairperson of the Board | March 16, 2017 | ||
Irene Chang Britt | ||||
/s/ Michael V. Arbige | Director | March 16, 2017 | ||
Michael V. Arbige | ||||
/s/ Ian T. Clark | Director | March 16, 2017 | ||
Ian T. Clark | ||||
/s/ James R. Craigie | Director | March 16, 2017 | ||
James R. Craigie | ||||
/s/ Jerry Fiddler | Director | March 16, 2017 | ||
Jerry Fiddler | ||||
/s/ Gary Pfeiffer | Director | March 16, 2017 | ||
Gary Pfeiffer | ||||
/s/ Jonathan S. Wolfson | Director | March 16, 2017 | ||
Jonathan S. Wolfson | ||||
97
Exhibit Number | Description | Incorporated by Reference | Filed Herewith with this 10-K | ||||||||||
Form | File No. | Filing Date | Exhibit | ||||||||||
2.1 | Contribution Agreement, dated as of August 2, 2016 between TCP Algenist LLC, Algenist Holdings, Inc. and TerraVia Holdings, Inc | 10-Q | 001-35189 | November 4, 2016 | 2.1 | ||||||||
3.1 | Amended and Restated Certificate of Incorporation | 10-K/A | 001-35189 | April 27, 2012 | 3.1 | ||||||||
3.2 | Certificate of Amendment of Amended and Restated Certificate of Incorporation | 8-K | 001-35189 | May 12, 2016 | 3.1 | ||||||||
3.3 | Certificate of Amendment of Amended and Restated Certificate of Incorporation | S-3 | 333-212448 | July 8, 2016 | 3.3 | ||||||||
3.4 | Amended and Restated Bylaws | 8-K | 001-35189 | May 12, 2016 | 3.2 | ||||||||
3.5 | Certificate of Designations of Preferences, Rights and Limitations of Series A Convertible Preferred Stock of Solazyme, Inc. | 8-K | 001-35189 | March 16, 2016 | 3.1 | ||||||||
4.1 | Indenture dated as of January 24, 2013 between Wells Fargo Bank, National Association, as Trustee, and Solazyme, Inc. | 8-K | 001-35189 | January 24, 2013 | 4.1 | ||||||||
4.2 | Indenture dated as of April 1, 2014 between Wells Fargo Bank, National Association, as Trustee, and Solazyme, Inc. | 8-K | 001-35189 | April 1, 2014 | 4.1 | ||||||||
10.1§ | Form of Director/Officer Indemnification Agreement entered into by and between Solazyme, Inc. and each of its directors and executive officers | S-1 | 333-172790 | May 4, 2011 | 10.1 | ||||||||
10.2§ | Second Amended and Restated 2004 Equity Incentive Plan and forms of notice of stock option grant, stock option agreement and restricted stock agreement | S-1 | 333-172790 | March 11, 2011 | 10.2 | ||||||||
10.3§ | 2011 Equity Incentive Plan | S-1 | 333-172790 | May 4, 2011 | 10.3 | ||||||||
10.4§ | 2011 Employee Stock Purchase Plan | S-1 | 333-172790 | May 4, 2011 | 10.4 | ||||||||
10.5§ | Executive Severance and Change of Control Plan | S-1 | 333-172790 | May 23, 2011 | 10.17 | ||||||||
10.6§ | Amended and Restated Employment Agreement dated May 19, 2011, by and between Solazyme, Inc. and Jonathan S. Wolfson | S-1 | 333-172790 | May 23, 2011 | 10.18 | ||||||||
10.7§ | Amended and Restated Employment Agreement dated May 19, 2011, by and between Solazyme, Inc. and Tyler W. Painter | S-1 | 333-172790 | May 23, 2011 | 10.20 | ||||||||
10.8§ | Amended and Restated Employment Agreement dated May 19, 2011, by and between Solazyme, Inc. and Peter J. Licari | S-1 | 333-172790 | May 23, 2011 | 10.21 | ||||||||
10.9§ | Amended and Restated Employment Agreement dated May 19, 2011, by and between Solazyme, Inc. and Paul T. Quinlan | S-1 | 333-172790 | May 23, 2011 | 10.22 | ||||||||
10.10 | Warrant for the Purchase of Shares of Common Stock of Solazyme, Inc. by Bunge Limited | S-1 | 333-172790 | May 4, 2011 | 10.24 | ||||||||
10.11 | Amendment No. 1 to Warrant for the Purchase of Shares of Common Stock of Solazyme, Inc. dated August 5, 2011 by and between Solazyme, Inc. and Bunge Limited | 10-Q | 001-35189 | November 8, 2011 | 10.20 | ||||||||
10.12§ | Form of 2011 Equity Incentive Plan Stock Option Agreement | 10-K | 001-35189 | March 15, 2012 | 10.30 | ||||||||
10.13§ | Form of 2011 Equity Incentive Plan Restricted Stock Agreement | 10-K | 001-35189 | March 15, 2012 | 10.31 | ||||||||
98
Exhibit Number | Description | Incorporated by Reference | Filed Herewith with this 10-K | ||||||||||
Form | File No. | Filing Date | Exhibit | ||||||||||
10.14§ | Form of 2011 Equity Incentive Plan Restricted Stock Unit Agreement | 10-K | 001-35189 | March 13, 2013 | 10.23 | ||||||||
10.15 | Credit Facility Agreement No. 12.2.1149.1, Executed Between Banco Nacional de Desenvolvimento Economico e Social—BNDES and Solazyme Bunge Produtos Renovaveis Ltda., dated February 14, 2013 | 10-Q | 001-35189 | August 7, 2013 | 10.10 | ||||||||
10.16 | 1st Amendment to Credit Facility Agreement No., 12.2.1149.1, Executed Between Banco Nacional de Desenvolvimento Economico e Social-BNDES and Solazyme Bunge Produtos Renovaveis Ltda., dated January 16, 2014 | 10-Q | 001-35189 | May 8, 2014 | 10.2 | ||||||||
10.17 | Lease, dated as of July 22, 2014, by and between Britannia Gateway II Limited Partnership and Solazyme, Inc. | 10-Q | 001-35189 | November 6, 2014 | 10.1 | ||||||||
10.18† | Amended and Restated Joint Venture Agreement entered into as of October 27, 2015 by and among Bunge Global Innovation, LLC, Solazyme, Inc. and certain other parties | 10-K | 001-35189 | March 15, 2016 | 10.23† | ||||||||
10.19† | Amended and Restated Solazyme Development Agreement entered into as of October 27, 2015 by and among Solazyme Bunge Renováveis Ltda., Solazyme, Inc. and certain other parties. | 10-K | 001-35189 | March 15, 2016 | 10.24† | ||||||||
10.20 | Series A Convertible Preferred Stock Purchase Agreement, effective as of March 10, 2016, by and among Solazyme, Inc. and certain purchasers | 10-Q | 001-35189 | May 6, 2016 | 10.1 | ||||||||
10.21 | Amendment No. 1 to Series A Convertible Preferred Stock Purchase Agreement, dated March 10, 2016, by and among Solazyme, Inc. and certain purchasers | 10-Q | 001-35189 | May 6, 2016 | 10.2 | ||||||||
10.22 | Registration Rights Agreement, dated March 15, 2016, among Solazyme, Inc. and certain purchasers | 10-Q | 001-35189 | May 6, 2016 | 10.3 | ||||||||
10.23 | Form of Standstill Agreement | 10-Q | 001-35189 | May 6, 2016 | 10.4 | ||||||||
10.24 | Loan and Security Agreement, dated June 28, 2016 between Silicon Valley Bank and TerraVia Holdings, Inc. | 10-Q | 001-35189 | August 8, 2016 | 10.1 | ||||||||
10.25 | Standby Letter of Credit Agreement dated as of April 12, 2016 between Silicon Valley Bank and Solazyme, Inc. | 10-Q | 001-35189 | August 8, 2016 | 10.2 | ||||||||
10.26 | Bank Services Pledge Agreement dated as of April 12, 2016 between Silicon Valley Bank and Solazyme, Inc. | 10-Q | 001-35189 | August 8, 2016 | 10.3 | ||||||||
10.27§ | Employment Agreement dated July 27, 2016, by and between TerraVia Holdings, Inc. and Apurva S. Mody | 10-Q | 001-35189 | November 4, 2016 | 10.1§ | ||||||||
10.28 | Sales Agreement dated August 8, 2016 by and between TerraVia Holdings, Inc. and Cowen and Company, LLC | 10-Q | 001-35189 | November 4, 2016 | 10.2 | ||||||||
12.1 | Computation of Ratio of Earnings to Fixed Charges | X | |||||||||||
21.1 | List of subsidiaries of the Registrant | X | |||||||||||
23.1 | Consent of Deloitte & Touche LLP, Independent Registered Public Accounting Firm | X | |||||||||||
24.1 | Power of Attorney (found on Signature Page) | X | |||||||||||
99
Exhibit Number | Description | Incorporated by Reference | Filed Herewith with this 10-K | ||||||||||
Form | File No. | Filing Date | Exhibit | ||||||||||
31.1 | Certification of Chief Executive Officer, as required by Section 302 of the Sarbanes-Oxley Act of 2002 | X | |||||||||||
31.2 | Certification of Chief Financial Officer, as required by Section 302 of the Sarbanes-Oxley Act of 2002 | X | |||||||||||
32.1 | Certification of the Chief Executive Officer and Chief Financial Officer, as required by Section 906 of the Sarbanes-Oxley Act of 2002 | X | |||||||||||
99.1 | Consolidated financial statements of Solazyme Bunge Renewable Oils Cooperatief U.A. as of December 31, 2016 and 2015 (unaudited); and for the years ended December 31, 2016, 2015 (unaudited) and 2014 (unaudited) | X | |||||||||||
101 | The following financial statements, formatted in XBRL: (i) Consolidated Balance Sheets at December 31, 2016 and December 31, 2015, (ii) Consolidated Statements of Operations for each of the three years in the period ended December 31, 2016, (iii) Consolidated Statements of Comprehensive Loss for each of the three years in the period ended December 31, 2016, (iv) Consolidated Statements of Stockholders’ Equity for each of the three years in the period ended December 31, 2016, (v) Consolidated Statements of Cash Flows for each of the three years in the period ended December 31, 2016; and (vi) Notes to the Consolidated Financial Statements | X | |||||||||||
† | Confidential treatment has been granted, or requested, with respect to portions of the exhibit. A complete copy of the agreement, including the redacted terms, has been separately filed with the SEC. |
§ | Management contract or compensatory plan or arrangement. |
100