Attached files
| file | filename |
|---|---|
| EX-32.2 - EXHIBIT 32.2 - SCANDIUM INTERNATIONAL MINING CORP. | exhibit32-2.htm |
| EX-32.1 - EXHIBIT 32.1 - SCANDIUM INTERNATIONAL MINING CORP. | exhibit32-1.htm |
| EX-31.2 - EXHIBIT 31.2 - SCANDIUM INTERNATIONAL MINING CORP. | exhibit31-2.htm |
| EX-31.1 - EXHIBIT 31.1 - SCANDIUM INTERNATIONAL MINING CORP. | exhibit31-1.htm |
| EX-23.4 - EXHIBIT 23.4 - SCANDIUM INTERNATIONAL MINING CORP. | exhibit23-4.htm |
| EX-23.3 - EXHIBIT 23.3 - SCANDIUM INTERNATIONAL MINING CORP. | exhibit23-3.htm |
| EX-23.2 - EXHIBIT 23.2 - SCANDIUM INTERNATIONAL MINING CORP. | exhibit23-2.htm |
| EX-23.1 - EXHIBIT 23.1 - SCANDIUM INTERNATIONAL MINING CORP. | exhibit23-1.htm |
| EX-21.1 - EXHIBIT 21.1 - SCANDIUM INTERNATIONAL MINING CORP. | exhibit21-1.htm |
UNITED STATES
SECURITIES AND EXCHANGE COMMISSION
Washington, D.C. 20549
FORM 10-K
[X] ANNUAL REPORT PURSUANT TO SECTION 13 OR 15(d) OF THE SECURITIES EXCHANGE ACT OF 1934
For the fiscal year ended December 31, 2016
[ ] TRANSITION REPORT PURSUANT TO SECTION 13 OR 15(d) OF THE SECURITIES EXCHANGE ACT OF 1934
For the transition period from _______________to _______________
000-54416
(Commission File Number)
Scandium International Mining Corp.
(Exact Name of Registrant as specified in its charter)
| British Columbia, Canada | 98-1009717 |
| (State or other Jurisdiction of Incorporation | (I.R.S. Employer |
| or organization) | Identification No.) |
| 1430 Greg Street, Suite 501 | |
| Sparks, Nevada | 89431 |
| (Address of Principal Executive Offices) | (Zip Code) |
Registrant’s Telephone Number, including area code: (775) 355-9500
Securities registered pursuant to Section 12(b) of the Act: None
| Securities to be registered pursuant to Section 12(g) of the Act: | Common Shares without par value |
| (Title of class) |
Indicate by check mark if the registrant is a well-known
seasoned issuer, as defined in Rule 405 of the Securities Act.
Yes [ ] No [X]
Indicate by check mark if the registrant is not required to
file reports pursuant to Section 13 or Section 15(d) of the Act.
Yes [ ] No [X]
Indicate by check mark whether the registrant (1) has filed all
reports required to be filed by Section 13 or 15(d) of the Securities Exchange
Act of 1934 during the preceding 12 months (or for such shorter period that the
registrant was required to file such reports), and (2) has been subject to such
filing requirements for the past 90 days.
Yes [X] No [ ]
Indicate by check mark whether the registrant has submitted
electronically and posted on its corporate Website, if any, every Interactive
Data File required to be submitted and posted pursuant to Rule 405 of Regulation
S-T during the preceding 12 months (or for such shorter period that the
registrant was required to submit and post such files).
Yes [X] No [ ]
Indicate by check mark if disclosure of delinquent filers in response to Item 405 of Regulation S-K is not contained herein, and will not be contained, to the best of registrant’s knowledge, in definitive proxy or information statements incorporated by reference in Part III of this Form 10-K or any amendment to this Form 10-K. [X]
Indicate by check mark whether the registrant is a large accelerated filer, an accelerated filer, a non-accelerated filer or a smaller reporting company. See the definitions of “large accelerated filer,” “accelerated filer” and “smaller reporting company” in Rule 12b-2 of the Exchange Act (Check one):
| Large Accelerated Filer [ ] | Accelerated Filer [ ] |
| Non-Accelerated Filer [ ] | Smaller Reporting Company[ x ] |
Indicate by check mark whether the registrant is a shell
company (as defined in Rule 12b-2 of the Exchange Act).
Yes [ ] No [X]
State the aggregate market value of the voting and non-voting common equity held by non-affiliates computed by reference to the price at which the common equity was sold, or the average bid and asked price of such common equity, as of the last business day of the registrant’s most recently completed second fiscal quarter: $20,607,985 as at June 30, 2016.
Indicate the number of shares outstanding of each of the registrant’s classes of common equity, as of the latest practicable date: 227,372,200 common shares as at March 13, 2015.
DOCUMENTS INCORPORATED BY REFERENCE
Portions of the registrant's Proxy Statement for the Annual Meeting of Stockholders are incorporated by reference into Part III of this Form 10-K, which Proxy Statement is to be filed within 120 days after the end of the registrant's fiscal year ended December 31, 2016.
2
TABLE OF CONTENTS
PART I
Note about Forward-Looking Statements
Certain statements contained in this annual report on Form 10-K and the documents incorporated by reference herein constitute "forward-looking statements". Forward-looking statements may include, but are not limited to, statements with respect to the future price of commodities, the estimation of mineral resources, the realization of mineral resource estimates, the timing and amount of estimated future production, costs of production, capital expenditures, costs and timing of the development of new deposits, success of exploration activities, our ability to fund property acquisition costs, our ability to reach targeted time frames for establishing feasibility, permitting time lines, currency fluctuations, requirements for additional capital, government regulation of mining operations, environmental risks, unanticipated reclamation expenses, title disputes or claims, our ability to raise funds necessary for ongoing and planned expenditures and operations, and regulatory approvals. In certain cases, forward-looking statements can be identified by the use of words such as "plans", "expects" or "does not expect", "is expected", "scheduled", "estimates", "intends", "anticipates" or "believes", or variations of such words and phrases or state that certain actions, events or results "may", "could", "would" or "will be taken", "occur" or "be achieved". Forward-looking statements involve known and unknown risks, uncertainties and other factors which may cause our actual results, performance or achievements to be materially different from any future results, performance or achievements expressed or implied by the forward looking statements. Such factors may include, among others, risks related to our joint venture operations; actual results of current exploration activities or production technologies that we are currently testing; actual results of reclamation activities; future metal prices; accidents, labour disputes and other risks of the mining industry; delays in obtaining governmental or regulatory approvals or financing or in the completion of development activities, as well as those factors discussed in the section entitled "Risk Factors" and elsewhere in this Form 10-K. Although we have attempted to identify important factors that could cause actual actions, events or results to differ materially from those described in forward looking statements, there may be other factors that cause actions, events or results not to be as anticipated, estimated or intended. There can be no assurance that forward-looking statements will prove to be accurate, as actual results and future events could differ materially from those anticipated in such statements. Accordingly, readers should not place undue reliance on forward-looking statements.
Glossary of Terms
“Company”, “SCY”, “we”, “us”, “our” and similar words of similar meaning refer to Scandium International Mining Corp.
| $, A$, C$ |
mean respectively, United States dollars, Australian dollars and Canadian dollars. |
|
| |
| Alteration |
Usually referring to chemical reactions in a rock mass resulting from the passage of hydrothermal fluids. |
|
| |
| Assay |
An analysis to determine the presence, absence or quantity of one or more components, elements or minerals. |
4
| Core |
The long cylindrical piece of a rock, up to several inches in diameter, brought to the surface by Diamond drilling. |
|
| |
| Diamond drilling |
A drilling method in which the cutting is done by abrasion using diamonds embedded in a matrix rather than by percussion. The drill cuts a core of rock, which is recovered in long cylindrical sections. |
| Fractures |
Breaks in a rock, usually due to intensive folding or faulting. |
| Grade |
The concentration of a valuable mineral within an Ore. |
| Hydrothermal |
Hot fluids, usually water, which may, or may not carry metals and other compounds in solution to the site of mineral deposition or wall rock alteration. |
| Igneous |
A rock formed by the cooling of molten silicate material. |
| Intrusion |
A general term for a body of igneous rock formed below the surface of the earth. |
|
| |
| Kg |
Kilogram which is equivalent to approximately 2.20 pounds. |
| Km |
Kilometer which is equivalent to approximately 0.62 miles. |
| Mineralization |
A term used to describe the presence of minerals of possible economic value. Also used to describe the process by which concentration of economic minerals occurs. |
| Net Smelter Returns Royalty |
A share of the net revenues generated from the sale of metal produced by a mine. |
|
| |
| NI 43-101 |
National Instrument 43-101 – Standards for Disclosure of Mineral Projects, being the regulation adopted by Canadian securities regulators that governs the public disclosure of technical and scientific information concerning a mineral property. |
| Ore |
A naturally occurring solid material from which a metal or valuable mineral can be profitably extracted. |
| Outcrop |
An exposure of rock at the earth’s surface. |
| ppm |
Parts per million. |
| Pyrite |
Iron sulphide mineral. The most common and abundant sulphide mineral and often found in association with copper and gold. |
| Qualified Person |
Means a Qualified Person as defined in National Instrument 43-101, including an engineer or geoscientist in good standing with their professional association, with at least five years of relevant experience. |
| Quartz |
The second most common rock forming mineral in the earth’s crust. SiO2. |
5
| Resource | Means any of a measured, indicated or inferred resource as used in NI 43-101, and having the following meanings: |
|
| |
|
“measured resource” is that part of a Mineral Resource for which quantity, grade or quality, densities, shape, and physical characteristics are so well established that they can be estimated with confidence sufficient to allow the appropriate application of technical and economic parameters, to support production planning and evaluation of the economic viability of the deposit. The estimate is based on detailed and reliable exploration, sampling and testing information gathered through appropriate techniques from locations such as outcrops, trenches, pits, workings and drill holes that are spaced closely enough to confirm both geological and grade continuity. | |
|
| |
|
“indicated resource” is that part of a Mineral Resource for which quantity, grade or quality, densities, shape and physical characteristics, can be estimated with a level of confidence sufficient to allow the appropriate application of technical and economic parameters, to support mine planning and evaluation of the economic viability of the deposit. The estimate is based on detailed and reliable exploration and testing information gathered through appropriate techniques from locations such as outcrops, trenches, pits, workings and drill holes that are spaced closely enough for geological and grade continuity to be reasonably assumed. | |
|
| |
|
“inferred resource” is that part of a Mineral Resource for which quantity and grade or quality can be estimated on the basis of geological evidence and limited sampling and reasonably assumed, but not verified, geological and grade continuity. The estimate is based on limited information and sampling gathered through appropriate techniques from locations such as outcrops, trenches, pits, workings and drill holes. | |
|
| |
|
For the purposes of the above a “mineral resource” means a concentration or occurrence of diamonds, natural solid inorganic material, or natural solid fossilized organic material including base and precious metals, coal, and industrial minerals in or on the Earth’s crust in such form and quantity and of such a grade or quality that it has reasonable prospects for economic extraction. The location, quantity, grade, geological characteristics and continuity of a Mineral Resource are known, estimated or interpreted from specific geological evidence and knowledge. | |
|
| |
|
(Please refer to “Item 2. Properties - Cautionary Note to U.S. Investors Regarding Resource Estimates” in regards to the use of the above terms in this Form 10-K.) | |
|
| |
| Sulphide |
A class of minerals characterized by the linkage of sulphur with a metal (such as Pyrite (FeS2)). |
|
| |
| Tpd/Tpa |
Tonnes per day/tonnes per annum. |
|
| |
| Tonnes |
A metric ton which is equivalent to approximately 2,204 pounds. |
|
| |
| Sediments |
The debris resulting from the weathering and breakup of other rocks that have been deposited by or carried by runoff, streams and rivers, or left over from glacial erosion or sometimes from wind action. |
6
|
Vein |
A geological feature comprised of minerals (usually dominated by quartz) that are found filling openings in rocks created by faults or replacing rocks on either side of faults or Fractures. |
7
ITEM 1. BUSINESS
General
We were incorporated on July 17, 2006 under the laws of British Columbia, Canada under the name Golden Predator Mines Inc. We were incorporated as a wholly owned subsidiary of Energy Metals Corp. for the purpose of holding precious metals and certain specialty metals assets. In order to focus on specialty metals, during February 2009 we transferred most of our precious mineral assets to our then wholly-owned subsidiary Golden Predator Corp. and on March 6, 2009 we completed a spin-out of Golden Predator Corp. to our shareholders. Effective March 12, 2009, we changed our name to EMC Metals Corp. In order to reflect a new emphasis on mining for scandium minerals, effective November 19, 2014, we changed our name to Scandium International Mining Corp.
We are a reporting issuer in the Canadian Provinces of British Columbia, Alberta and Ontario and our common shares are listed for trading on the Toronto Stock Exchange under the trading symbol “SCY”.
Our head office is located at 1430 Greg Street, Suite 501, Sparks, Nevada 89431. The address of our registered office is 1200 - 750 West Pender Street, Vancouver, British Columbia, Canada, V6C 2T8.
Our focus of operations is the development of the Nyngan Scandium project located in New South Wales, Australia (the “Nyngan Scandium Project”). We also hold a scandium minerals property located nearby Nyngan known as the “Honeybugle Scandium property”.
Our plan of operation for the remainder of 2017 is to obtain the required mining permits on our Nyngan Scandium Project and seek additional funding for project construction and corporate working capital. We will also continue to seek offtake sales agreements with counterparties for Nyngan Scandium Project product, and will continue to test and develop unique scandium recovery and finishing techniques, including the processing of intermediate scandium aluminum products.
Intercorporate Relationships
The chart below illustrates our corporate structure on December 31, 2016, including our subsidiaries, the jurisdictions of incorporation, and the percentage of voting securities held.

8
Recent History
Nyngan Feasibility Study
On April 18, 2016 the Company announced the results of an independently prepared feasibility study on the Nyngan Scandium Project. The technical report on the feasibility study entitled “Feasibility Study – Nyngan Scandium Project, Bogan Shire, NSW, Australia” is dated May 4, 2016 and was independently compiled pursuant to the requirements of NI 43-101. The report was filed on May 6, 2016 and is available on SEDAR (www.sedar.com) and on the Company’s website (www.scandiummining.com) and the SEC’s website (www.sec.gov). A summary of the report is provided herein under “Item 2. Properties – Description of Mineral Projects – Nyngan Scandium Project – Nyngan Feasibility Study”.
June 2014 Financing Transaction
On June 24, 2014 SCY entered into a $2.5 million loan facility with Scandium Investments LLC (“SIL”), a company owned by a US private investor group (the “2014 Loan”).
In accordance with the terms of the 2014 Loan, the outstanding principal and interest were converted in 2015 into a 20% ownership interest in EMC Metals Australia Pty Ltd (“EMC Australia”), with SCY holding an 80% ownership interest. EMC Australia holds our interests in the Nyngan Scandium Project and Honeybugle Scandium property. Under the terms of the 2014 Loan, upon conversion of the loan EMC Australia will be operated as a joint venture between SIL and SCY with SIL holding a carried interest in the Nyngan Scandium Project until the Company meets two development milestones: (1) filing a feasibility study on SEDAR, and (2) receiving a mining lease on either joint venture property. At such time as the two development milestones are met, SIL becomes fully participating on project costs thereafter.
Completion of the development milestones by the Company, as described above, activates a second onetime, limited period option for SIL to elect to convert the fair market value of its 20% joint venture interest in the Nyngan Scandium Project and Honeybugle Scandium property into an equivalent value of the Company’s common shares, at then prevailing market prices, rather than continue with ownership at the project level.
Business Operations
Company Summary
We are a mineral exploration and development company that is focused on the development of scandium, rare earth minerals, and other specialty metals, including nickel, cobalt, boron, manganese, tantalum, titanium and zirconium. We have not commenced development of any of our projects, and as a result we are an exploration stage company. We have not established mineral reserves on any of our projects.
Our principal project is the Nyngan Scandium Project located in New South Wales, Australia, which we own 80% of the rights to, including exploration licenses. In April of 2014 we also acquired an exploration license referred to as the Honeybugle Scandium property, a prospective scandium exploration property located 24 kilometers from the Nyngan Scandium Project.
Corporate Objective and Strategy
Our corporate focus is to produce and sell scandium (Sc) and scandium-based products. None of our current properties has advanced to the development or production stage and we are currently an exploration stage company. We have completed an independently prepared definitive feasibility study of the Nyngan Scandium Project. Subject to successfully financing of construction costs, we intend to develop the Nyngan Scandium Project for production, with a view to supplying anticipated future demand for scandium oxide and scandium-content materials. For further information on the Nyngan Scandium Project, please refer to “Item 2. Properties - Description of Mineral Projects – Nyngan Scandium Project” and “Item 1A. Risk Factors”.
9
Concurrently with our analysis of the Nyngan Scandium Project, we are developing and testing unique mineral recovery techniques as well as techniques to produce high quality intermediate scandium-content aluminum alloy products. If effective at a commercial level, these mineral recovery techniques, scandia finishing techniques and intermediate product developments are expected to provide increased economic margins and returns on capital on any future scandium production.
Presently our recovery and finishing technology is completed to a degree that supports engineering and flow sheet design for our +15%/-5% DFS, although further development work will continue in both areas. There is no guarantee that we will be able to benefit from the commercial application of such techniques or that we will have scandium production in the future.
Global Scandium Production and Market
Scandium is the 31st most abundant element in the earth’s crust (average 33 ppm), which makes it more common than lead, mercury and precious metals, but less common than copper. Scandium has characteristics that are similar to rare earth elements, and it is often classified as a member of that group, although it is technically a light transition metal. Scandium occurs in nature as an oxide, rarely occurs in concentrated quantities because it does not selectively combine with the common ore-forming anions, and is very difficult to reduce to a pure metal state. Scandium is typically produced and sold as scandium oxide (Sc2O3), and is properly known as scandia.
Global annual production estimates of scandium range from 10 tonnes to 15 tonnes, but accurate statistics are not available due to the lack of public information from countries in which scandium is currently being produced. There are four known, primary production sources globally today: stockpiles from the former Zhovti Voty uranium mine in Ukraine, the rare earth mine at Bayan Obo in China, apatite mines on the Kola Peninsula in Russia, and by-product production from titanium dioxide (TiO2) pigmentrefiners in China.
There is no reliable pricing data on global scandium oxide trading. The U.S. Geological Survey (“USGS”) in its latest report (February 2017) documents the 2016 price of scandium oxide (99.99% grade) at US$4,600/kg, a reduction of approximately 10% off the 2015 price estimate. Small quantities of scandium oxide are currently offered on the internet by traders for prices at this level, although product of slightly lower grade is commonly available at lower prices. Scandium oxide grades of 95% or greater are considered commercially suitable, with 99.9% grade used for electrical applications, and grades higher than 99.9% reserved for science and new technical applications. Scandium oxide grades of 95-99% are generally considered suitable for aluminum alloy applications.
Scandium oxide is typically traded in small quantities, between private parties, and pricing is not transparent to other buyers or sellers as there is no clearing facility as is more common with more commonly traded metals and commodities. Prices do vary, based on purity and quantity supplied. Small sale quantities tend to command premium prices, and large quantities (over one tonne) are simply not available to establish appropriate commercial pricing.
10
Scandium can also be effectively purchased in the form of aluminum-scandium (Al-Sc) master alloy, typically containing 2% scandium by weight. This product is tailored for use in aluminum alloy production containing scandium. The 2017 USGS report indicates the 2016 price for Al-Sc 2% master alloy at US$340/kg. This 2016 price estimate represents a higher estimate than the 2015 USGS average. USGS estimated prices for Al-Sc 2% master alloy over the last five years show significant year-by-year volatility, ranging from a low of US$ 220/kg (2012) to a high of US$386/kg (2014).
Principal uses for scandium are in high-strength aluminum alloys, high-intensity metal halide lamps, electronics, and laser research. Recently developed applications include welding wire and fuel cells which are expected to be in future demand. Approximately 15 different commercial aluminum-scandium alloys have been developed, and some of them are used for aerospace applications. In Europe and the U.S., scandium-containing alloys have been evaluated for use in structural parts in commercial airplanes, high stress parts in automobile engines and brake systems, and high tension electrical wires. Military and aerospace applications are known to be of interest, although with less specificity. The combination of high strength and light weight makes aluminum-scandium alloys generally suitable for a number of applications where existing aluminum alloys made with other metals are used today.
Competitive Conditions
We compete with numerous other companies and individuals in the search for and the acquisition or control of attractive rare earth and specialty metals mineral properties. Our ability to acquire further properties will depend not only on our ability to operate and develop our properties but also on our ability to select and acquire suitable properties or prospects for development or mineral exploration.
In regards to our plan to produce scandium, there are a limited number of scandium producers presently. If we are successful at becoming a producer of scandium, our ability to be competitive will require that we establish a reliable supply of scandium to the market, delivered at purity levels demanded by various applications, and that our operating costs generate margins at prices that will be set by customers and competitors in a market yet to mature.
Governmental Regulations and Environmental Laws
The development of any of our properties, and specifically the Nyngan Scandium Project, will require numerous local and national government approvals and environmental permits. For further information about governmental approvals and permitting requirements, please refer to “Item 1A. Risk Factors”.
Employees
As at January 1, 2017, we have 6 full and part time employees and 1 individual working on a consulting basis. Our operations are managed by our officers with input from our directors. We engage geological, metallurgical, and engineering consultants from time to time as required to assist in evaluating our property interests and recommending and conducting work programs.
ITEM 1A. RISK FACTORS
In addition to the factors discussed elsewhere in this Form 10-K, the following are certain material risks and uncertainties that are specific to our industry and properties that could materially adversely affect our business, financial condition and results of operations.
Risks Associated with the Nyngan Scandium Project
11
There are technical challenges to scandium production that may render the Nyngan Scandium Project not economic. The economics of scandium recovery are known to be challenging. There are very few facilities producing scandium and the existing scandium producers are secretive in their techniques for recovery. In addition, the recovery of scandium product from laterite resources, such as are found on the Nyngan property, has not been demonstrated at an operating facility. The Nyngan processing facility design, if constructed, will be the first of its kind for scandium production. These factors increase the possibility that we will encounter unknown or unanticipated production and processing risks. Should we encounter any of these risks, they could increase the cost of production thereby reducing margins on the Nyngan Scandium Project or rendering ituneconomic.
There is no guarantee that we will be able to finance the Nyngan Scandium Project for production.
Any decision to proceed with production on the Nyngan Scandium Project will require significant production financing. Scandium projects are uncommon, and economic and production uncertainty may limit our ability to attract the required amount of capital to put the project into production. If we are unable to source production financing on commercially viable terms, we may not be able to proceed with the project and may have to write off our investment in the project.
If we are successful at achieving production, we may have difficulty selling scandium. Scandium is characterized by unreliable supply, resulting in limited development of markets for scandium oxide. Markets may take longer to develop than anticipated, and Nyngan and other potential scandium producers may have to wait for products and applications to create adequate demand. Certain applications may require lengthy certification processes that could delay usage or acceptance. In addition, certain scandium applications require very high purity scandium product, which is much more difficult to produce than lower grade product. If we commence production, our inability to supply scandium in sufficient quantities, in a reliable and timely manner, and in the correct quality, could reduce the demand for any scandium produced from our projects and possibly render the project uneconomic.
General Risks Associated with our Mining Activities and Company
We may not receive permits necessary to proceed with the development of a mining project. The development of any of our properties, including the Nyngan Scandium Project, will require the acquisition and sustained possession of numerous local and national government approvals and permits. Our ability to secure all necessary permits required to develop any of our projects is unknown until such permits are received. If we cannot obtain all necessary permits, the Nyngan Scandium Project cannot be developed, and our investment in the project will likely be lost. While many of the critical permits for the Nyngan Scandium Project have been received, other critical permits remain outstanding at this time. Our future market value will likely be significantly reduced to the extent one or more of our projects cannot proceed to the development or production stage due to an inability to secure all required permits.
Mineral Resource Estimates on our properties are subject to uncertainty and may not reflect what may be economically extracted. Resource estimates included for scandium on our Nyngan property are estimates only and no assurances can be given that the estimated levels of scandium minerals will actually be produced or that we will receive the metal prices assumed in determining our resources. Such estimates are expressions of judgment based on knowledge, mining experience, analysis of drilling and exploration results and industry practices. Estimates made at any given time may significantly change when new information becomes available or when parameters that were used for such estimates change. By their nature resource estimates are imprecise and depend, to a certain extent, upon statistical inferences which may ultimately prove unreliable. Furthermore, market price fluctuations in scandium, as well as increased capital or production costs or reduced recovery rates, may limit our ability to establish reserves at some future point on Nyngan, or on any of our properties. The extent to which resources may ultimately be reclassified as proven or probable reserves is dependent upon the demonstration of their profitable recovery. The evaluation of reserves or resources is always influenced by economic and technological factors, which may change over time. Accordingly, current resource estimates on our material properties may never be converted into reserves, or be economically extracted, and we may have to write off such properties or incur a loss on sale of our interest on such properties, which will likely reduce the value of our shares.
12
Our potential for a competitive advantage in specialty and rare metals production depends on the availability of our technical processing abilities, as currently provided by our Chief Technology Officer. We are dependent upon the personal efforts and commitment of Willem Duyvesteyn, our CTO, a director and significant shareholder of the Company, for the continued development of new extractive technologies related to scandium and other rare and specialty metals production. The loss of the services of Mr. Duyvesteyn will likely limit our ability to use or continue the development of such technologies, which would remove the potential competitive and economic benefit of such technologies.
Our operations are subject to losses due to exchange rate fluctuation. We maintain accounts in Canadian, Australian and U.S. currency. Our equity financings have to date been priced in Canadian dollars. All of our material projects and non-cash assets are located outside of both Canada and the USA, however, and require regular currency conversions to local currencies where such projects and assets are located. Our operations are accordingly subject to foreign currency fluctuations and such fluctuations may materially affect our financial position and results. We do not engage in currency hedging activities.
We do not currently earn any revenue and without additional funding, we will not be able to carry out our business plan, and if we raise additional funding existing security holders may experience dilution.
As an exploration stage mining company, none of our principal properties are in operation and we do not currently earn any revenue. In order to continue our exploration activities and to meet our obligations on the Nyngan Scandium Project, we will need to raise additional funds. Recently, we have relied entirely on the sale of our securities to raise funds for operations. Our ability to continue to raise funds from the sale of our securities is subject to significant uncertainty due to volatility in the mineral exploration marketplace. If we are able to raise funds from the sale of our securities, existing security holders may experience significant dilution of their ownership interests and possibly to the value of their existing securities.
ITEM 2. PROPERTIES
Cautionary Note to U.S. Investors Regarding Resource Estimates
Certain terms used in this section are those used in accordance with the requirements of the securities laws in effect in Canada, which differ from the requirements of U.S. securities laws. Canadian requirements, including NI 43-101, differ significantly from the requirements of the U.S. Securities and Exchange Commission (the “SEC”), and resource information contained herein may not be comparable to similar information disclosed by U.S. companies.
In particular, and without limiting the generality of the foregoing, the term “resource” does not equate to the term “reserves”. The requirements of NI 43-101 for identification of “reserves” are not the same as those of the SEC, and reserves reported in compliance with NI 43-101 may not qualify as “reserves” under SEC standards. Under U.S. standards, mineralization may not be classified as a “reserve” unless the determination has been made that the mineralization could be economically and legally produced or extracted at the time the reserve determination is made. We have not established reserves on any of our properties.
13
The SEC’s disclosure standards normally do not recognize information concerning “measured mineral resources”, “indicated mineral resources” or “inferred mineral resources” or other descriptions of the amount of mineralization in mineral deposits that do not constitute “reserves” by U.S. standards, in documents filed with the SEC. In addition, resources that are classified as “inferred mineral resources” have a great amount of uncertainty as to their existence and great uncertainty as to their economic and legal feasibility. It cannot be assumed that all or any part of an “inferred mineral resource” will ever be upgraded to a higher category. Under Canadian rules, estimated “inferred mineral resources” may not generally form the basis of feasibility or pre-feasibility studies. Investors are cautioned not to assume that all or any part of an “inferred mineral resource” exists or is economically or legally mineable.
Disclosure of “contained ounces” in a resource is permitted disclosure under Canadian regulations, however, the SEC normally only permits issuers to report mineralization that does not constitute “reserves” by SEC standards as in-place tonnage and grade without reference to unit measures.
Accordingly, information concerning mineral deposits set forth herein may not be comparable with information presented by companies using only U.S. standards in their public disclosure.
Description of Mineral Projects
Nyngan Scandium Project
Property Description and Location
The Nyngan Scandium Project site is located approximately 450 kilometres northwest of Sydney, NSW, Australia and approximately 20 kilometres due west from the town of Nyngan, a rural town of approximately 2,900 people. The deposit is located 5 kilometres south of Miandetta, off the Barrier Highway that connects the town of Nyngan to the town of Cobar. The license area can be reached via the paved Barrier Highway, which allows year-round access, but final access to the site itself is reached by clay farm tracks. The general area can be characterized as flat countryside and is classified as agricultural land, used predominantly for wheat farming and livestock grazing. Infrastructure in the area is good, with available water and electric power in close proximity to the property boundaries.
The Nyngan property is classified as an Australia Property for purposes of financial statement segment information.
The scandium resource is hosted within the lateritic zone of the Gilgai Intrusion, one of several Alaskan-type mafic and ultramafic bodies which intrude Cambrian-Ordovician metasediments collectively called the Girilambone Group. The laterite zone, locally up to 40 meters thick, is layered with hematitic clay at the surface followed by limonitic clay, saprolitic clay, weathered bedrock and finally fresh bedrock. The scandium mineralization is concentrated within the hematitic, limonitic, and saprolitic zones with values up to 350 ppm scandium.
The general location of the Nyngan Scandium Project is provided in Figure 1 below. The specific location of the exploration licenses that we may earn an interest in are provided in Figure 2 below.
14
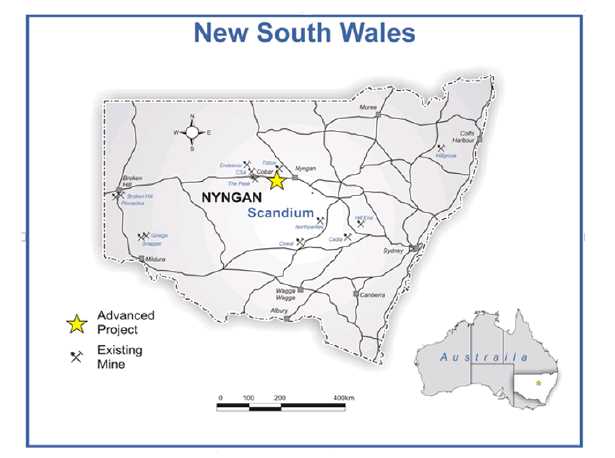
Figure 1: Location of Nyngan Scandium Project
15
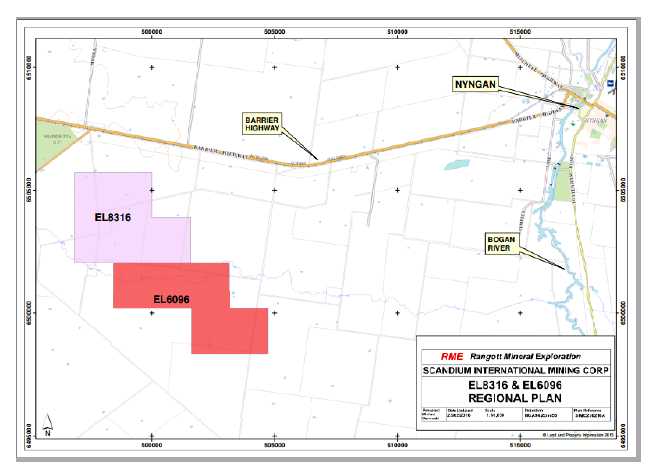
Figure 2: Location of the Exploration Licenses for the Nyngan Scandium Project
Mineral License Details
The scandium resource is held under Exploration License (EL) 8316 (Block Number 3132, units d, e, j, k and Block no. 3133, unit f) and EL 6096 (Block 3132, unit p, and Block 3133, units l, m, r and s); a total of ten (10) graticular units. The exploration licenses allow the license holder to conduct exploration on private land (with landowner consents and signed compensation agreements in place) and public lands not including wildlife reserves, heritage areas or National Parks. The scandium resource is fully enclosed on private agricultural land.
The Company’s Australian subsidiary holds legal title to both the surface and mineral exploration rights on the Nyngan Scandium Project.
The exploration licenses cover 29.25 square kilometers (2,925 hectares). The resource site is located at geographic coordinates MGA zone 55, GDA 94, Lat: - 31.5987, Long: 146.9827, Map Sheets 1:250k – Cobar (SH/55-14) and 1:100k Hermidale (8234).
The project surface rights (freehold) total 810 acres (370 hectares) on a portion of the exploration license area. The freehold property boundaries are defined by standard land survey techniques undertaken by the Lands Department and currently presented in the form of Cadastral Deposited Plans (DP) and Lots. The land associated with the project rights is DP 752879, Lots 6 and 7 (Appendix 2, Lots 6 and 7 - Nyngan).
16
The Company is required to lodge individual A$10,000 environmental bonds with the NSW Mines Department for each license, and must meet total minimum work requirements annually of approximately A$65,000, covering both licenses. Annual property costs to the local Shire Council are under A$1,000 per year.
Royalties attached to the properties include a 1.5% Net Profits Interest royalty to private parties involved with the early exploration on the property, a 1.7% Net Smelter Returns Royalty payable to Jervois for 12 years after production commences, subject to terms in the settlement agreement, and a 0.7% royalty on gross mineral sales to a private investor. Another revenue royalty is payable to private interests of 0.2%, subject to a US$370k cap. A NSW minerals royalty will also be levied on the project, subject to negotiation, currently 4% on revenue.
Metallurgy Development
The Company has invested in and developed methodology for extracting scandium from the Nyngan property resource since 2010. A portion of the work done over this period has been superseded by work that followed, but subsequent test programs universally benefitted from prior efforts. In summary, the programs have been as follows:
- 2010 – The Company inherited work done on Nyngan from Jervois, and applied that work to a quick flowsheet and capital estimate done for management by Roberts & Schaefer of Salt Lake City, Utah;
- 2011 - The Company employed Hazen Research, Inc., of Golden, Colorado, USA (“Hazen”) to test acid baking techniques and solvent extraction (“SX”) processes with Nyngan resource material. The Company also employed SGS-Lakefield (Ontario) to test pressure acid leach techniques on Nyngan resource, as a replacement for or an enhancement to acid bake techniques done earlier in the year by Hazen;
- 2012 – The Company engaged SNC-Lavalin to do an economic study for management, utilizing an acid bake flowsheet and SX work from the Hazen test program;
- 2014 - The Company published a preliminary economic assessment (“PEA”) entitled NI 43- 101F1 Technical Report on the Feasibility of the Nyngan Scandium Project, authored by Larpro Pty Ltd, utilizing both Hazen and SGS-Lakefield testwork results; and
- 2015 – The Company amended and refiled the 2014 PEA Report as the “Amended Technical Report and Preliminary Economic Analysis on the Nyngan Scandium Project, NSW, Australia”.
- 2016 – The Company published an independently prepared definitive feasibility study on the Nyngan Scandium Project. The technical report on the feasibility study entitled “Feasibility Study – Nyngan Scandium Project, Bogan Shire, NSW, Australia” was independently compiled pursuant to the requirements of NI 43-101 and incorporated the results of current and previous test work.
Development Program Review
The first work phase of the metallurgy development program consisted of detailed metallurgical bench scale testing, and was intended to refine and enhance the Company’s existing material process flow sheet to extract scandium from the resource material. This existing flow sheet, developed by Jervois and external consultants, formed the basis of a preliminary, conceptual engineering report for the processing elements of the project that was completed by Roberts & Schaefer specifically for use by SCY management.
17
The Roberts & Schaefer report included capital and operating cost estimates, based on process flow sheets and technical reports previously done for Jervois or SCY on various metallurgical aspects of the resource. These technical/process reports included work done by METCON, the CSIRO, and by others, proprietary to or sourced by Jervois or SCY. The bulk of the process applied by Roberts & Schaefer in their Report was defined by bench scale as well as small scale pilot plant work results compiled by others, and a preliminary flow sheet complied by the CSIRO.
This early stage Roberts & Schaefer Report was carried forward into the later metallurgical test work subsequently conducted by Hazen and the design work utilized in the SNC- Lavalin economic study presented to management in 2012.
In January 2011, SCY announced results of initial lab test work, independently prepared by Hazen. These results defined general results involving conventional contained acid leach systems and suggested recoveries from resource of up to 75%. No secondary recoveries were considered in these initial bench-scale tests.
The second phase of the Hazen test work program continued through July, and involved continuous pilot plant testing of the acid leach systems, solvent extraction systems and product finish systems identified by earlier CSIRO work. The overall objectives of the test work program were to define and optimize a process or series of processes that achieves an 80% scandium recovery, lowest possible capital and operating costs, and most benign environmental impact, using standard and accepted processes.
On January 19, 2012 we announced receipt an independent metallurgical test-work report, titled
“Purification of Scandium Extracted from Laterite Ore”, outlining the results of a number of pilot-scale tests on Nyngan resource material, and estimated recoveries and grades of scandium oxide product. The report was independently prepared by Hazen and is the final in a series of three phases of semi-continuous pilot plant scale test-work completed by Hazen during 2011. Work was finalized in late November.
Highlights of the 2011 Hazen semi-continuous pilot plant test-work are as follows:
- Results of conventional contained sulfuric acid bake and water leach systems, at atmospheric pressure, demonstrated scandium recoveries averaging 75%;
- Results of conventional SX on the pregnant leach solution, demonstrated scandium recoveries exceeding 99%;
- Results on final stage precipitation of scandium oxide (Sc2O3), focused on highest combined purity and recovery, demonstrated scandium recoveries of 97.5%, at purity levels of 97.5% Sc2O3. Higher purity levels were achieved at lower recoveries;
- Overall recovery results were 70% to 80%, based on ore type (limonite or saprolite); and
- All process assumptions were based on standard and accepted techniques for ore preparation, leaching, solvent extraction and final product preparation.
In late 2011, the Company commissioned test work on high pressure acid leach (“HPAL”) processes, with both Hazen and SGS-Lakefield of Ontario, Canada. The initial HPAL work was applied to residue from the acid bake process sourced from the earlier Hazen test work, specifically to determine if additional scandium could be effectively recovered in a second pass with a pressure system. Those results were encouraging, and led to later test work in 2012-13 which applied HPAL techniques directly on the laterite resource material. No HPAL research results were included in the report and findings compiled for management by SNC-Lavalin in early 2012. However, the work that subsequently continued on HPAL, after that SNC Report was completed, has been incorporated into current engineering studies and flow sheet strategies for the Nyngan project. Existing HPAL work results were done to bench scale, and not to pilot scale, and are currently being followed up with further test work.
18
The Company is continuing test work on metallurgy to increase recoveries and final product grades.
In February, 2011 we announced results of a series of laboratory-scale tests investigating the production of aluminum-scandium alloys directly from aluminum oxide and scandium oxide feed materials, prepared by the CSIRO. The overall objective of this research was to demonstrate and commercialize the production of aluminum-scandium master alloy using impure scandium oxide as the scandium source, potentially significantly improving the economics of aluminum-scandium master alloy production. In 2014, the Company announced it applied for a US Patent on master alloy production, which is still in the application phase. That patent application addressed scandium master alloys with both aluminum-base and magnesium-base metals.
On March 2, 2017 we announced the signing of a Memorandum of Understanding ("MOU") with Weston Aluminium Pty Ltd ("Weston") of Chatswood, NSW, Australia. The MOU defines a cooperative commercial alliance to jointly develop the capability to manufacture aluminum-scandium master alloy. The intended outcome of this alliance will be to develop the capability to offer Nyngan Scandium Project aluminum alloy customers scandium in form of Al-Sc master alloy, should customers prefer that product form.
The MOU outlines steps to jointly establish the manufacturing parameters, metallurgical processes, and capital requirements to convert Nyngan Scandium Project scandium product into Master Alloy, on Weston's existing production site in NSW. The MOU does not include a binding contract with commercial terms at this stage, although the intent is to pursue the necessary technical elements to arrive at a commercial contract for conversion of scandium oxide to master alloy, and to do so prior to first mine production from the Nyngan Scandium Project.
Nyngan Feasibility Study
On April 18, 2016 the Company announced the results of an independently prepared feasibility study on the Nyngan Scandium Project. The technical report on the feasibility study entitled “Feasibility Study – Nyngan Scandium Project, Bogan Shire, NSW, Australia” is dated May 4, 2016 (the “Feasibility Study”).
The Feasibility Study was prepared by Lycopodium Minerals Pty Ltd. of Brisbane, QLD, Australia (“Lycopodium”) and supported by Rangott Mineral Exploration Pty Ltd. (Orange, Australia), Altrius Engineering Services Pty Ltd (Brisbane, QLD) and Knight Piesold Pty Ltd (Brisbane, QLD). The Feasibility Study has been independently compiled pursuant to the requirements of NI 43-101. The report was filed on May 6, 2016 and is available on SEDAR (www.sedar.com) and on the Company’s website (www.scandiummining.com) and the SEC’s website (www.sec.gov).
The Feasibility Study concluded that the Nyngan Scandium Project has the potential to produce an average of 37,690 kilograms of scandium oxide (scandia) per year, at grades of 98.0% -99.9%, generating an after tax cumulative cash flow over a 20 year Project life of US$629 million, with an NPV10% of US$177 million. The average process plant feed grade over the 20 year Project life is 409ppm of scandium.
The financial results of the Feasibility Study are based on a conventional flow sheet, employing continuous high pressure acid leach (HPAL) and solvent extraction (SX) techniques. The flow sheet was modeled and validated from METSIM modeling and considerable bench scale/pilot scale metallurgical test work utilising Nyngan resource material. A number of the key elements of this flowsheet work have been protected by the Company under US Patent Applications.
19
The Feasibility Study has been developed and compiled to an accuracy level of +15%/-5%, by a globally recognized engineering firm that has considerable expertise in laterite deposits and process facilities, as well as in smaller mining and processing projects, and has excellent familiarity with the Nyngan Scandium Project location and environment.
Nyngan Scandium Project Financial Highlights and Key Assumptions
The Feasibility Study found that the Nyngan Scandium Project has the potential for attractive economics, based on a capital estimate supported by conventional process designs and direct vendor pricing. The Feasibility Study is expressed in US dollar (US$) currency, unless otherwise noted. A foreign exchange rate of US$0.70 (1A$=US$0.70) was applied in all conversions. No escalation for inflation was assumed in cash flows. All cash flows and discounted cash flows (NPVs and IRRs) are shown on an after-tax basis, based on a 30% Australian corporate tax rate.
Financial highlights are as follows:
Table 1. Nyngan Scandium Project - Feasibility Study Financial Highlights
| Summary Nyngan Scandium Project Key Project Parameters |
NI 43-101 DFS Result |
| Capital Cost Estimate (US$ M) | $87.1 |
| Average Plant Feed Grade (ppm Sc) | 409 |
| Resource Processed (tpy) | 71,820 |
| Mill Recovery (%) | 83.7% |
| Oxide Production (kg per year) | 37,690 |
| Scandium Oxide (Scandia) Product Grade | 98-99.9% |
| Annual Cash Operating Cost (US$ M) | $21.0 |
| Unit Cash Cost (US$/kg Oxide) | $557 |
| Oxide Price Assumption (US$/kg) | $2,000 |
| Annual Revenue (US$ millions) | $75.4 |
| Annual EBITDA (US$ millions) | $49.5 |
| NPV (10%i) (After Tax) | $177.5 |
| NPV (8%i) (After Tax) | $225.4 |
| IRR (%) (After Tax) | 33.1% |
| Payback (years) | 3.3 |
Mineral Resource Estimate
We advise U.S. investors that while the terms “measured resources,” and “indicated resources” are recognized and required by Canadian regulations, the U.S. Securities and Exchange Commission does not recognize these terms. U.S. investors are cautioned not to assume that any part or all of the material in these categories will be converted into reserves.
The Feasibility Study includes a revised and updated resource estimate for the Nyngan Scandium Project, originally established in 2010. The revised NI 43-101 Measured and Indicated scandium resource now totals 16.9 million tonnes at an average grade of 235ppm scandium, from all scandium-bearing sources including hematite, limonite, saprolite and some bedrock resource material. The updated resource retains the same economic cut-off value of 100ppm as was used in the earlier resource estimate. The new resource was established using Gemcom’s SURPAC Block Model software and applied Ordinary Kriging techniques for estimation.
20
The Feasibility Study production plan is based on a portion of the new limonite-only resource, and provides a 20 year mining program consisting of two production pits, sufficient to supply the processing plant at a (nameplate) rate of 75,000 tpy and an average grade of 409ppm scandium over the life of the Nyngan Scandium Project. Both the new resource estimate and the 20 year mining pit design are based on assay and lithology data from a property total of 141 drill holes, including assay and lithology data from recent (2014-2015) drilling work.
The updated and original Nyngan Scandium Project scandium mineral resources as calculated in the Feasibility Study by Lycopodium are as follows:
Table 2. Nyngan Scandium Resource
![]()
Note that the terms measured and indicated resources are not terms recognized in the United States under SEC rules and guidelines. See “Item 2. Properties – Note to U.S. Investors Regarding Resource Estimates”.
Mineral Reserve Estimate
The Feasibility Study includes the first established Reserve on a portion of the resource, associated specifically with that portion of the limonite resource on which economic viability has been established by the engineering and project development work in the Feasibility Study. The feasibility study utilizes 1.34 million tonnes of limonite resource over 20 years, almost all in the Measured Resource category, and that portion of the overall resource has generated the Reserve figure, as shown below:
21
Table 3. Nyngan Scandium Reserve
| Mineral Reserve | ||
| Nyngan Project | (effective date: April 15, 2016) | |
| Reserve Summary | Reserve | Grade |
| Tonnes | (ppm Sc) | |
| Proven Reserve | 794,514 | 394 |
| Probable Reserve | 641,915 | 429 |
| Total Reserve | 1,436,429 | 409 |
| NOTE: Reserve strip ratio is 3.42 (waste/reserve tonnes) | ||
Mining and Processing Summary
The mining element of the Nyngan Scandium Project represents a relatively minor part, although a critical part, of the overall Nyngan Scandium Project activity. The Feasibility Study mine plan is based on a plant feed of 240 tonnes/day (tpd) or 75,000 tonnes per year requirement. Mine production is based on conventional open pit methods with an average strip ratio of 2.1:1 (overburden/resource). The mine will be worked in campaigns, likely 3 one-month production periods per year, avoiding the wet months, in which a contract miner will be employed to extract and deliver material to a run-of-mine plant stockpile adjacent to the processing facility. The processing plant will run continuously, fed from plant stockpiles of previously mined resource, and covered against moisture and weather.
The processing plant operations will size the input material, and then initially apply an HPAL system, using a continuous autoclave pressure-fed with pre-heated ore, dosed with sulfuric acid. Subsequent circuits will then recover the liberated scandium using SX, oxalate precipitation and calcination, to generate a finished scandium oxide product. Once at nameplate capacity, the processing plant is forecast to produce between 36,600 and 42,000 kilograms of scandium oxide product per year, averaging 37,690 kilograms/year over the 20 year feasibility study production period. Oxide product will be produced on-site at grades between 98% and 99.9%, as Sc2O3, and will be offered at grades that meet various customer requirements, suitably packaged for direct sales to end users.
Plant tailings will be neutralized with lime to pH 8.5, dewatered, and stored in a Residue Storage Facility (tailings pond) meeting the environmental requirements of mining permits and NSW State regulators.
Capital Cost Detail
Total capital costs for the Nyngan Scandium Project are estimated at US$87.1 million, and include a 10.5% contingency, allocated on a line item basis varying from 5% to 15%, depending on estimation method, vendor quotation details, and a risk assessment for the capital cost area. The majority (87%) of the capital cost in the Feasibility Study was Australian-sourced, and consequently initially priced in Australian dollars (A$). The capital cost estimate is established at a +15%/-5% level of accuracy, consistent with industry standards for a definitive feasibility study.
The initial capital cost is spread over a number of areas, but the high pressure autoclave systems, leaching and neutralization circuits contained in the processing plant are the most significant capital items, totaling US$41M or 47% of total costs, including contingencies. Sustaining plant and operations capital is provided as an annual expensed cost, and totals US$3.6M over the life of the project. Sustaining tailings pond capital is similarly provided for and expensed annually to operating costs, and totals US$22.4M, over the life of the project. These costs are treated as cash unit production costs, where those figures are provided.
22
The cash flow model includes US$5.2M in costs for tailings pond closure, expensed one year after the final year of operation, which is 2038. The pond will likely have reached its optimal size at this time, and would need to be rehabilitated in any event. The model does not include any costs for demolition of facilities, or recovery of value for equipment or facilities in the form of salvage. The Feasibility Study authors did not undertake detailed investigations of alternate site uses for the project facility after 20 years, because the Measured and Indicated scandium resource is considerably larger than the current project would consume, allowing for either expansions of capacity, extensions of the 20-year initial time period of operation, or both.
23
Table 4. Feasibility Study Capital Cost Detail
| Nyngan Project
Capital Cost Summary (millions) |
Initial Project
Capital Cost (US$M) |
| Mining Capital | |
| Pre-Stripping Cost | $1.72 |
| Vehicles/Site Equipment | $1.26 |
| Mining Subtotal | $2.98 |
| Processing Plant Capital | |
| Process Plant Mechanicals | $40.96 |
| Site Infrastructure | $25.95 |
| Construction Costs | $3.91 |
| EPCM Costs | $10.41 |
| Owners Costs | $2.93 |
| Process Plant Subtotal | $84.16 |
| Total Project Capital Cost | $87.14 |
Operating Costs Detail
Operating costs were estimated based on metallurgical test work results and METSIM modelling quantities and requirements. The single most significant cost item in operating costs is reagent cost, with the single largest component in this category being sulfuric acid. The acid price used was A$270/tonne, as quoted by a sulfuric acid broker, delivered to site. The second most significant cost is staff/labor, where the feasibility study assumes a staffing level of 73 full time personnel. The level of accuracy on the operating component was estimated at +15%/- 15%.
Operating cost details in the Feasibility Study, as to total average annual cash costs, and also unit costs on an annual average ore tonnage throughput basis and a kilogram oxide basis, are as follows:
24
Table 5. Feasibility Study Operating Costs, and Unit Costs Per kg Oxide
| Nyngan Project OpEx Mine/Process Expense |
Average Annual Cost US$ M |
Unit Cost/
Processed Tonne US$/tonne |
Unit Cost/ Oxide kg US$/kg |
| Mining Costs | |||
| Stripping Cost | $0.5 | $7.49 | $14.27 |
| Mining Costs | $0.8 | $10.96 | $20.88 |
| Total Mining Costs | $1.3 | $18.45 | $35.15 |
| Processing Cost | |||
| Labor Cost | $5.9 | $82.19 | $156.60 |
| Utilities Costs | $2.2 | $29.99 | $57.15 |
| Reagents | $7.1 | $98.24 | $187.19 |
| Consumables | $0.6 | $8.02 | $15.29 |
| Maintenance | $1.6 | $22.80 | $43.44 |
| General | $0.16 | $2.23 | $4.24 |
| Total Processing Costs | $17.5 | $243.48 | $463.92 |
| General Costs | |||
| Tailings Pond Costs | $1.1 | $15.60 | $29.72 |
| Site G&A Costs | $0.6 | $7.82 | $14.90 |
| Consultants & Marketing | $0.5 | $6.76 | $12.88 |
| Total General Costs | $2.2 | $30.18 | $57.50 |
| Annual Cash Operating Cost | $21.0 | $292.10 | $556.57 |
The Nyngan Scandium Project plan has provided for a gradual ramp-up to full (nameplate) capacity in the first two years of operation. The ramp-up provides for 35% of nameplate throughput (26,250 tonnes) in production year 1 (2018) and 80% of nameplate throughput (60,000 tonnes) in production year 2 (2019). The respective scandium oxide product output estimate during those years is 13,300kg and 30,900kg, respectively. This 2 year ramp-up to nameplate capacity was determined based on the commissioning experience of other HPAL plants of similar general design, built and brought online in the last 15 years. All of these benchmarking examples were nickel plants processing lateritic ores, all but one were initial installations, and all were of much bigger size than the Nyngan processing plant.
25
Pricing Assumptions
The price assumption in the Feasibility Study is US$2,000 per kilogram (kg) of scandium oxide product, as an average price covering all product sold, over various product grades. Current market pricing, such as that can be established, is substantially above these levels based on small unit quantities and varying grades. In order to encourage a viable, over-subscribed and vigorous scandium market, across numerous applications, product suppliers, like us, will need to provide for adequate supply of quality product, available from trusted jurisdictions, at prices lower than products trade for today.
In addition to limited publicly available price quotes for scandium oxide, the Feasibility Study notes two other reference points on the US$2,000/kg price assumption. The Company has an offtake agreement in place, for 7,500 kg/year (3 years), with pricing being supportive of the pricing assumption in the Feasibility Study. The customer is a knowledgeable alloy group, with longstanding interest in aluminum-scandium alloys. The Feasibility Study price assumption is also supported by a recent, independent marketing report that examined the 10 year scandium supply/demand outlook, and includes scenario-based 10 year price forecasts. The details and contents of this market outlook report will remain confidential, but select information is included in the feasibility study. Both of these reference points support that the scandium value proposition for customers/consumers is valid at this price level.
Sensitivities
The Nyngan Scandium Project is most sensitive to changes in the value of the Australian dollar relative to the US dollar, along with changes in the product price. The Nyngan Scandium Project is somewhat less sensitive to either operating or capital cost changes. Sensitivities to various parameters are shown below.
Table 6. Sensitivity to Product Price
| Project Financial Sensitivity to Product Price |
Constant Dollar
(after Tax) Project NPV at Various Discount Rates and Various Oxide Product Prices (US$) | |||||
Product Price (US$/kg) |
$1,200 |
$1,500 |
$2,000 |
$2,500 |
$3,000 |
$3,500 |
| Constant Dollar | ||||||
| Net Present Value (US$ M) | ||||||
| 6% Discount | $82.4 | $159.7 | $287.6 | $414.9 | $542.2 | $669.4 |
| 8% Discount | $55.1 | $119.3 | $225.3 | $330.9 | $436.3 | $541.7 |
| 10% Discount | $34.3 | $88.3 | $177.5 | $266.1 | $354.7 | $443.1 |
| Internal Rate of Return (IRR) | 15.2% | 22.4% | 33.1% | 42.8% | 52.0% | 60.6% |
26
Table 7. Profitability Sensitivities to Changes in Key Financial Assumptions
| Sensitivity to
Financial Parameters |
NPV (10%i) US$ M |
IRR (%) |
DFS Result |
$177.5 |
33.1% |
| Operating Cost Sensitivity | ||
| Cost Increase (10%) | $166.3 | 31.6% |
| Cost Decrease (10%) | $188.7 | 34.5% |
| Price Sensitivity | ||
| Lower Realized Oxide Price (10%) | $142.0 | 29.0% |
| Higher Realized Oxide Price (10%) | $212.9 | 37.0% |
| Capital Cost Sensitivity | ||
| Higher Capital Cost (10%) | $169.6 | 30.4% |
| Lower Capital Cost (10%) | $185.4 | 36.2% |
| Fx Sensitivity ($0.70) | ||
| US$/A$ @ $0.80 | $150.3 | 27.6% |
| US$/A$ @ $0.75 | $163.9 | 30.2% |
| US$/A$ @ $0.65 | $191.3 | 36.4% |
General Assumptions
The Feasibility Study is presented on a 100% ownership basis. The Company effectively owns 80% of the Nyngan Scandium Project through EMC Australia. The remaining 20% of EMC Australia is owned by SIL, a Nevada corporation owned by private interests.
All cash flows and financial analyses have been presented on a 100% equity basis. No debt leverage has been assumed in providing capital for development. No inflation factors have been applied to future cash flows, making the discounted cash flow performance measures constant dollar figures.
The Nyngan Scandium Project schedule identifies 2017 as the initial year in the cash flow, with construction initiated and completed in that year. Some commissioning is scheduled for Q4 2017. Further wet commissioning and start-up is scheduled for Q1 2018. First production is planned for March 2018, which is year 1 of 20 (calendar) years of production, completing in 2037. Reclamation of the Residue Storage Facility is scheduled for 2038. The supply and delivery estimate on the specialist autoclave and flash vessels is setting the timeframe for first production in Q1 2018.
Feasibility Study Conclusions and Recommendations
The production assumptions in the Feasibility Study are backed by solid independent flow sheet test work on the planned process for scandium recovery. The Feasibility Study consolidates a significant amount of metallurgical test work and prior study on the Nyngan Scandium Project, including important test work results completed since the PEA was generated in 2014. The entire body of work demonstrates a viable, conventional process flow sheet utilizing a continuous-system HPAL leaching process, and good metallurgical recoveries of scandium from the resource. The metallurgical assumptions are supported by various bench and pilot scale independent test work programs that are consistent with known outcomes in other laterite resources. The continuous autoclave configuration, as opposed to batch systems explored in previous flow sheets, is also a more conventional and current design choice.
27
The level of accuracy established in the Feasibility Study substantially reduces the uncertainty levels inherent in earlier studies, specifically the PEA. The greater confidence intervals around the Feasibility Study were achieved by reliance on significant project engineering work, a capital and operating cost estimate supported by detailed requirements and vendor pricing, plus one offtake agreement and an independent marketing assessment, both supportive of the marketing assumptions on the business.
The Feasibility Study delivered a positive result on the Nyngan Scandium Project, and recommends the Nyngan Scandium Project owners seek finance and proceed to construction. Recommendations were made therein for additional immediate work, notably to win additional offtake agreements with customers, complete some optimizing flow sheet studies, and to initiate as early as possible detailed engineering required on certain long-lead capital items.
Confirmatory Metallurgical Test Results
On June 29, 2016 we announced the results of a confirmatory metallurgical test work report from Altrius Engineering Services (AES) of Brisbane, Australia. The test work results directly relate to the list of recommended programs included in the Feasibility Study. AES devised and supervised these test work programs at the SGS laboratory in Perth, Australia and at the Nagrom laboratory in Brisbane, Australia.
The project DFS recommended a number of process flowsheet test work programs be investigated prior to commencing detailed engineering and construction. Those study areas included pressure leach (“HPAL”), counter-current decant circuits (“CCD”), solvent extraction (“SX”), and oxalate precipitation, with specific work steps suggested in each area. This latest test work program addresses all of these recommended areas, and the results confirm recoveries and efficiencies that either meet or exceed the parameters used in the DFS. Highlights of the testing are:
- Pressure leach test work achieved 88% recoveries, from larger volume tests,
- Settling characteristics of leach discharge slurry show substantial improvement,
- Residue neutralization work meets or exceeds all environmental requirements as presented in the DFS and the environmental impact statement ,
- Solvent extraction circuit optimization tests generated improved performance, exceeding 99% recovery in single pass systems, and
- Product finish circuits produced 99.8% scandium oxide, completing the recovery process from Nyngan ore to finished scandia product.
Environmental Permitting/Development Consent/Mining Lease
On May 2, 2016 the Company announced the filing of an Environmental Impact Statement (“EIS”) with the New South Wales, Australia, Department of Planning and Environment, (the “Department”) in support of the planned development of the Nyngan Scandium Project. The EIS was prepared by R.W. Corkery & Co. Pty. Limited, on behalf of the Company’s 80% owned subsidiary, EMC Australia to support an application for Development Consent for the Nyngan Scandium Project. The EIS is a complete document, including a Specialist Consultants Study Compendium, and was submitted to the Department on Friday, April 29, 2016.
28
EIS Highlights:
- The EIS finds residual environmental impacts represent negligible risk.
- The proposed development design achieves sustainable environmental outcomes.
- The EIS finds net-positive social and economic outcomes for the community.
- Nine independent environmental consulting groups conducted analysis over five years, and contributed report findings to the EIS.
- The Nyngan Project development is estimated to contribute A$12.4M to the local and regional economies, and A$39M to the State and Federal economies, annually
- The EIS is fully aligned with the DFS and with a NSW Mining License Application for the Nyngan Project.
Conclusion statement in the EIS:
“In light of the conclusions included throughout this Environmental Impact Statement, it is assessed that the Proposal could be constructed and operated in a manner that would satisfy all relevant statutory goals and criteria, environmental objectives and reasonable community expectations.”
EIS Discussion:
The EIS is the foundation document submitted by a developer intending to build a mine facility in Australia. The Nyngan Scandium Project is considered a State Significant Project, in that capital cost exceeds A$30million, which means State agencies are designated to manage the investigation and approval process for granting a Development Consent, from the Minister of Planning and Environment. This Department will manage the review of the Proposal through a number of State and local governmental agencies.
The EIS is a self-contained set of documents used to seek a Development Consent. It is however, supported in many ways by the recently completed feasibility study.
On November 10, 2016 the Company announced that the Development Consent had been granted. This Development Consent represents an approval to develop the Nyngan Scandium Project and is based on the EIS. The Development Consent follows an in-depth review of the EIS, the project plan, community impact studies, public EIS exhibition and commentary, and economic viability, and involved more than 12 specialized governmental agencies and groups.
Upon granting of the Development Consent, there remain a number of operating licenses that are required from various regulatory agencies to construct and operate a mining operation in NSW.
The remaining key license approvals are:
- A Mining Lease,
- An Environment Protection Licence,
- Water Supply Works and Use Approval and Water Access Licence,
- A Section 138 Permit issued by the Bogan Shire Council, for construction of the intersection of the Site Access Road and Gilgai Road,
- An approval from the NSW Dams Safety Committee for the design and construction of the Residue Storage Facility, and
29
- A high voltage connection agreement with Essential Energy.
The Mining Lease provides a right to mine and extract minerals from the approved property and is required before mine construction may begin. Dependant primarily upon obtaining the Development Consent, the Company’s application for the Mining Lease is currently under review for approval. General estimates range from 4-6 months from the Development Consent, with some proposals taking longer, particularly larger proposals, or proposals with more community and environmental impacts to consider.
The Company intends to continue to follow and support the progress of governmental agency reviews.
Patent Application Filings
On February 17, 2015 the Company announced the filing of five patent applications with the US Patent Office that correspond to novel flowsheet designs for the recovery of scandium from laterite resource material. All five of these patents are directly applicable to our Nyngan Scandium Project, although one of the five patents pertains to downstream product design.
The five patent applications are titled as follows:
| 1. |
Systems and methodologies for recovering scandium values from mixed ion solutions; | |
| 2. |
Systems and methodologies for direct acid leaching of scandium bearing laterite ores; | |
| 3. |
Solvent extraction of scandium from leach solutions; | |
| 4. |
Systems and processes for recovering scandium values from laterite ores; and | |
| 5. |
Scandium-containing master alloys and method for making the same. |
Patent Applications Discussion:
- These patent applications cover novel, unique flowsheet designs, applicable to scandium extraction, from scandiferous laterite resources;
- The patented designs are largely supported by test work done with Nyngan Scandium Project resource material and known design parameters;
- The patents cover HPAL system material flows, SX, ion exchange systems (“IX”), atmospheric tank and heap leaching systems and techniques, and processes for directly making select master alloys containing scandium;
- The designs are incorporated as part of the DFS,; and
- The master alloy patent application uniquely integrates planned flowsheet design and downstream product development, either by SCY or with future customers.
These five patent applications have been filed with the US Patent Office, with dates of record from September 2014 to February 2015. They protect the Company’s position and rights to the intellectual property (IP) contained and identified in the applications as of the date filed, within the worldwide jurisdiction limits of the US patent system. Review by the US Patent Office takes further time, but the dates of record define the basis of IP ownership claims, as is generally afforded US patent-holders.
The Company intends to utilize the IP contained in these process patents in the development of process flowsheets for recovery of scandium from its Nyngan Scandium Project.
The Company believes that patent protection of these specific, novel process designs will be granted. Many of the basic design elements contemplated in the Nyngan Scandium Project flowsheet are commonly applied to other specialty metals, particularly nickel. However, the application of these basic design elements has not been commonly applied to scandium extraction from laterite resources, and there are enough intended and required operational differences in the application to permit the Company to patent-protect IP on those differences.
30
These patent claims are the result of several years of metallurgical test work with independent resource laboratories and specific design work by Willem Duyvesteyn, the Company’s Chief Technology Officer, using Nyngan property resource material. This work is ongoing. Patent protection on flowsheet intellectual property will serve to limit or prevent the unauthorized use of that IP by others, without the Company’s consent. We believe these filings are an important action to protect the ownership of a Company asset, on behalf of all SCY shareholders.
ALCERECO MOU and Offtake Agreements
On March 30, 2015, the Company announced that it had signed a memorandum of understanding (the “MOU”) with ALCERECO Inc. of Kingston, Ontario (“ALCERECO”), forming a strategic alliance to develop markets and applications for aluminum alloys containing scandium. To further that alliance, and to reinforce the capability of both companies to deliver product developed for Al-Sc alloy markets, SCY and ALCERECO also signed an offtake agreement (the “Offtake Agreement”) governing sales terms of scandium oxide product (scandia) produced from the Nyngan Scandium Project. The Offtake Agreement specifies deliveries of scandium oxide product commencing in early 2017.
Scandium as an alloying agent in aluminum allows for aluminum metal products that are much stronger, more easily weldable and exhibit improved performance at higher temperatures than current aluminum based materials. This means lighter structures, lower manufacturing costs and improved performance in areas that aluminum alloys do not currently compete.
- The MOU covers areas of joint cooperation and development of aluminum alloys that contain and are enhanced by the addition of scandium;
- The MOU recognizes the specialized capabilities ALCERECO holds for the design, manufacture, and testing of Al-Sc alloy materials;
- The Offtake Agreement outlines standard sale terms on 7,500 kg of scandia per annum, for a term of three years beginning in 2017, which can be extended; and
- The Offtake Agreement contains both fixed and variable pricing components, which are subject to confidentiality.
ALCERECO is an advanced materials development company that provides services and specialty processing capabilities to companies innovating in a diverse range of markets, including aerospace, automotive, electronics and consumer/sporting goods. ALCERECO staff work with a range of materials and processes and have the tools and knowledge to take on leading-edge projects such as development of aluminum-scandium alloys, specialty ceramics, composites and graphene enhanced materials. ALCERECO has a particular focus on lightweight materials capable of delivering greater strength, functionality and exceptional performance.
ALCERECO operates out of the Grafoid Global Technology Centre in Kingston, Ontario that was originally founded by Alcan Aluminum in the 1940s. ALCERECO is a Canadian private company, and a wholly-owned subsidiary of Ottawa-based Grafoid Inc., a graphene application development company.
Nyngan Scandium Project - Planned Activities for 2016-2017
The following steps are planned for Nyngan during the 2016 and 2017 Calendar years:
31
- Obtain a mining lease pertaining to the Nyngan Scandium Project with NSW Department of Trade and industry , anticipated in in Q1 2017, or early Q2 2017;
- Pursue additional offtake agreements in support of planned future scandium sales;
- Seek project financing to fund the construction of the Nyngan Scandium Project for drawdown after the granting of a mining license from NSW for the mine development;
- Commence site construction during in late 2017, with anticipated construction completion over 18 months, and
- Initiate project commissioning in Q4 2018, product production in Q1 2019, and with product available for sale by the end of Q1 2019.
Honeybugle Scandium Property
On April 2, 2014 the Company announced that it had secured a 100% interest in an exploration license (EL 7977) covering 34.7 square kilometers in New South Wales (NSW), Australia referred to as the Honeybugle Scandium property. The license area is located approximately 24 kilometers west-southwest from SCY’s Nyngan Scandium Project. The license area covers part of the Honeybugle geologic complex, and will carry that name in our future references to the property. The ground was released by the prior holder, and SCY intends to explore the property for scandium and other metals.
The Company currently does not consider the Honeybugle Scandium property to be a material property at this time. No resources or reserves are known to exist on the property. The property is classified as an Australian property for purposes of financial statement segment information.
The location of the Honeybugle Scandium property is provided below.
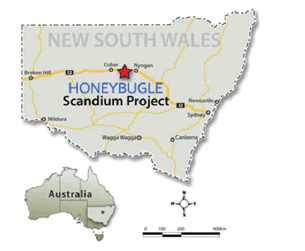
Figure 4. Location of Honeybugle Scandium property
Honeybugle Drill Results
On May 7, 2014 the Company announced completion of an initial program of 30 air core (AC) drill holes on the property, specifically at the Seaford anomaly, targeting scandium (Sc). Results on 13 of these holes are shown in detail, in the table below. These holes suggest the potential for scandium mineralization on the property similar to our Nyngan Scandium Project.
Highlights of initial drilling program results are as follows:
32
The highest 3-meter intercept graded 572 ppm scandium (hole EHAC 11);
EHAC 11 also generated two additional high grade scandium intercepts, grading 510 ppm and 415 ppm, each over 3 meters; The program identified a 13-hole cluster which was of particular interest; Intercepts on these 13 holes averaged 270 ppm scandium over a total 273 meters at an average continuous thickness of 21 meters per hole, representing a total of 57% (354 meters) of total initial program drilling; The 13 holes produced 29 individual (3-meter) intercepts over 300 ppm, representing 31% of the mineralized intercepts in the 273 meters of interest; and This initial 30-hole AC exploratory drill program generated a total of 620 meters of scandium drill/assay results, over approximately 1 square kilometer on the property.
The detail results of 13 holes in the initial drill program are as follows:
Table 7. Results of 13-Hole Initial Drill Program

Seaford is characterized by extensive outcrops of dry, iron-rich laterites, allowing for a particularly shallow drill program. Thirty (30) air core (AC) holes on nominal 100-meter spacing were planned, over an area of approximately 1 square kilometer. Four holes were halted in under 10 meters depth, based on thin laterite beds, low scandium grades, and shallow bedrock.
33
The 13 holes highlighted in the table are grouped together on either side of Coffills Lane, and represent all of the drill locations where meaningful intercept thickness generated scandium grades exceeding 175 ppm. Some of these 13 holes showed significant scandium values on the immediate surface, and alternately, other holes exhibited favorable scandium grades that began at shallow depth. The highest grade Sc sample was found in a 21-24 meter interval (572 ppm), although several holes produced better than 350 ppm Sc intercepts at depths of under 9 meters. The deepest hole (EHAC 7) was drilled to 57 meters, showing good scandium grades over a 12-meter horizon (245 ppm) near the bottom of the hole, from 39 to 51 meters depth. Higher scandium grades were associated with higher iron levels. Holes were drilled to a depth where they contacted the fresh ultramafic bedrock, which generally signaled the end of any scandium enrichment zones.
The drill plan divided Seaford into four sub-areas, 1-4, as highlighted Figure 5, below. Area 1 was relatively higher ground and therefore the least impacted by ground moisture. Consequently this dryer area received the greatest attention, although that had been the general intention in the plan. Area 1 received 17 holes, with 13 presented in detail in the table above. Areas 2-4 were each intended as step-out areas that need to be further examined in the next program. The three step-out areas did not generate results of particular note, although hole locations were not optimal due to ground conditions and access.
Area 2 received 3 holes, 60 meters total, and generated Sc grades from 45-75 ppm, Area 3 received 4 holes, 87 meters total, and generated Sc grades from 47-122 ppm, Area 4 received 5 holes, 72 meters total, and generated Sc grades from 60-101 ppm, and The average depth of all of these holes was 18 meters, with the deepest 30 meters.
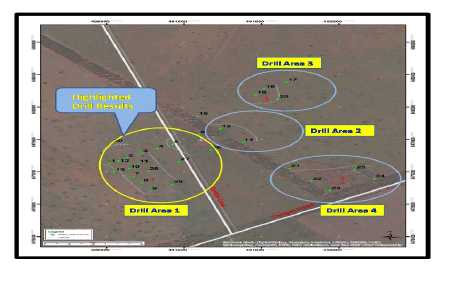
Figure 5. Initial Drill Program Map
This 13-hole cluster (Area 1) was noted to be in a relatively thick laterite zone which was constrained to the west by contact with meta-sediments, to the east by fresh ultramafic bedrock, and to some extent in the north by a poor intersection result in hole 30. Area 1 remains somewhat open to the south, with the two southern-most holes (EHAC 9 and EHAC 29) generating some of the best scandium grade intercepts in the area.
34
The surface and near surface mineralization at this property is an advantage, both in locating areas of interest for future exploration work, and also because of extremely low overburden ratios. This particular characteristic for the Honeybugle Scandium property is different to our Nyngan Scandium Project, where mineralization is typically covered by 10-20 meters of barren alluvium.
Further drilling at Seaford is warranted, based on the results of this introductory and modest program, specifically to the north and south of the existing area 1 drill pattern, along with investigation and select drilling at the other three remaining anomalies on the property.
Qualified Person and Quality Assurance/Quality Control
John Thompson, B.E. (Mining); Vice President - Development at SCY is a qualified person as defined in NI 43-101 and has reviewed the technical information on this property. The drilling, sampling, packaging and transport of the drill samples was carried out to industry standards for QA/QC. SCY employed an independent local geology consulting and drill supervisory team, Rangott Mineral Exploration Pty. Ltd., (RME) of Orange, NSW, Australia, to manage the drill work on-site. Bulk samples of drill returns were collected at one metre intervals from a cyclone mounted on the drilling rig, and a separate three-tier riffle splitter was used on site to obtain 2.0 -4.5kg composite samples collected over 3 metre intervals, for assay. Individual sample identifiers were cross-checked during the process. The assay samples were placed in sealed polyweave bags which remained in RME’s possession until the completion of the drilling program, at which time they were transported to RME’s office in Orange. There, the sequence of sample numbers was validated, and the assay samples were immediately submitted to Australian Laboratory Services’ (ALS’) laboratory in Orange. The remnant bulk samples, which were collected in sealed polythene bags, were transported by RME to a local storage unit at Miandetta, for long-term storage.
ALS/Orange dried and weighed the samples, and pulverized the entire sample to 85% passing 75 microns or better (technique PUL-21). These 50g sample bags of pulps were then sent to the ALS laboratory at Stafford in Brisbane, Queensland for analysis. ALS/Brisbane analyzed the pulps for scandium, nickel, cobalt, chromium, iron and magnesium, using Inductively Coupled Plasma Atomic Emission Spectroscopy (ICP-AES) after a four acid (total) digestion (technique ME-ICP61). The lower detection limit for scandium using this technique is 1ppm. For their internal quality control, ALS/Brisbane added 4 standard samples (for 20 repeat analyses), 10 blank samples and 16 duplicate samples to the batch. Please see news release see news release dated May 7, 2014 and available on www.sedar.com for further information on the Honeybugle drill results.
Tørdal Property
During 2011 we entered into option agreements with REE Mining AS of Norway, to obtain exploration rights to several properties located in central and southern Norway. Based on exploration results and holding costs, the Tørdal property holding was retained but all other Norway properties were subsequently dropped. The Tørdal agreement was renegotiated to secure a 100% ownership position for SCY.
The 90 sq km Tørdal exploration property is prospective for a grouping of specialty metals, and rare earth elements, including scandium, yttrium, tantalum, beryllium, niobium, zirconium, titanium, lithium, nickel and tin. Certain of these metals are subject to Norwegian government controlled mineral rights and others are subject to landowner mineral rights. The Company has decided the lack of clarity in mineral rights control at Tørdal raises unacceptable risk to continuing forward with additional exploration at this time.
35
Accordingly, the Tordal property mineral exploration rights were not renewed in January 2017, and the Company has no further plans for the property at this time.
The Company believes geologic and mineralogy findings made during exploration at Tørdal can be applied to other similar mineral properties and will continue to assess similar properties for potential exploration.
The Company does not, and has never considered the Tørdal property, located in Norway, to be a material property. No resources or reserves are known to exist on the property. The property has been classified as the Norway Property for purposes of financial statement segment information and all expenditures capitalized on this property haves been written off as at December 31, 2016.
ITEM 3. LEGAL PROCEEDINGS
We are not a party to any pending legal proceedings and, to the best of our knowledge, none of our properties or assets are the subject of any pending legal proceedings.
ITEM 4. MINE SAFETY DISCLOSURES
The Company has no active mining operations or dormant mining assets at this time, and has no outstanding mine safety violations or other regulatory safety matters to report.
PART II
ITEM 5. MARKET FOR REGISTRANTS’ COMMON EQUITY, RELATED STOCKHOLDER MATTERS AND ISSUER PURCHASES OF EQUITY SECURITIES
Price Range of Common Shares
The principal market on which our common shares are traded is the Toronto Stock Exchange. Our common shares commenced trading on the Toronto Stock Exchange on April 24, 2008 under the symbol “GP”. Effective March 11, 2009, the common shares were listed and posted for trading on the Toronto Stock Exchange under the symbol “EMC”. Effective November 28, 2014, the common shares were listed and posted for trading on the Toronto Stock Exchange under the symbol “SCY”. The following table shows the high and low trading prices of our common shares on the Toronto Stock Exchange for the periods indicated.
| Year |
High (C$) |
Low (C$) |
| Fiscal Year ended December 31, 2016 | ||
| First quarter | 0.190 | 0.100 |
| Second quarter | 0.205 | 0.150 |
| Third quarter | 0.180 | 0.135 |
| Fourth quarter | 0.295 | 0.135 |
| Fiscal Year ended December 31, 2015 | ||
| First quarter | 0.140 | 0.080 |
| Second quarter | 0.175 | 0.100 |
36
| Year |
High (C$) |
Low (C$) |
| Third quarter | 0.170 | 0.075 |
| Fourth quarter | 0.230 | 0.125 |
Exchange Rates
We maintain our books of account in United States dollars and references to dollar amounts herein are to the lawful currency of the United States except that we are traded on the Toronto Stock Exchange and, accordingly, stock price quotes and sales of stock are conducted in Canadian dollars (C$). The following table sets forth, for the periods indicated, certain exchange rates based on the noon rate provided by the Bank of Canada. Such rates are the number of Canadian dollars per one (1) U.S. dollar (US$). The high and low exchange rates for each month during the previous six months were as follows:
| High | Low | |
| January 2017 | 1.3458 | 1.3032 |
| December 2016 | 1.3598 | 1.3081 |
| November 2016 | 1.3588 | 1.3298 |
| October 2016 | 1.3434 | 1.3005 |
| September 2016 | 1.3281 | 1.2823 |
| August 2016 | 1.3178 | 1.2765 |
The following table sets out the exchange rate (price of one U.S. dollar in Canadian dollars) information as at each of the years ended December 31, 2015 and 2016.
| Year Ended December 31 | ||
| (Canadian $ per U.S. $) | ||
| 2016 | 2015 | |
| Rate at end of Period | 1.3427 | 1.3840 |
| Low | 1.2562 | 1.1728 |
| High | 1.4661 | 1.3990 |
As of January 31, 2017, there were 104 registered holders of record of the Company’s common shares and an undetermined number of beneficial holders.
Dividends
We have not paid any cash dividends on our common shares since our inception and do not anticipate paying any cash dividends in the foreseeable future. We plan to retain our earnings, if any, to provide funds for the expansion of our business.
Securities Authorized for Issuance under Compensation Plans
The following table sets forth information as at December 31, 2016 respecting the compensation plans under which shares of the Company’s common stock are authorized to be issued.
37
Plan Category |
Number of securities to be issued upon exercise of outstanding options, warrants and rights (a) |
Weighted-average exercise price of outstanding options, warrants and rights (b) |
Number of securities remaining available for future issuance under equity compensation plans (excluding securities reflected in column (a)) (c) |
| Equity compensation plans approved by security holders |
21,820,000 |
C$0.11 |
11,937,080 |
| Equity compensation plans not approved by security holders |
Nil |
Nil |
Nil |
| Total | 21,820,000 | C$0.11 | 11,937,080 |
Purchases of Equity Securities by the Company and Affiliated Purchasers
Neither the Company nor an affiliated purchaser of the Company purchased common shares of the Company in the year ended December 31, 2016.
ITEM 6. SELECTED FINANCIAL DATA
Not applicable.
ITEM 7. MANAGEMENT’S DISCUSSION AND ANALYSIS OF FINANCIAL CONDITIONS AND RESULTS OF OPERATIONS
Overview
The Company is a specialty metals and alloys company focusing on scandium and other specialty metals.
The Company was incorporated under the laws of the Province of British Columbia, Canada in 2006. The Company currently trades on the Toronto Stock Exchange under the symbol “SCY”.
The Company’s focus is on the exploration and evaluation of its specialty metals assets, specifically the Nyngan scandium deposit located in New South Wales, Australia and the Tørdal scandium/rare earth minerals deposit in Norway. In June 2014, the Company made the final installment payment to acquire the Nyngan property. The Company is an exploration stage company and anticipates incurring significant additional expenditures prior to production at any and all of its properties.
38
In fiscal 2015, the Company exchanged a $2,500,000 loan for a 20% interest in its Australian subsidiary which holds the Nyngan Scandium Project and Honeybugle Scandium property. Accordingly, the Company holds an 80% interest in its Australian subsidiary as at period end. The full $2,500,000 has been reflected in additional paid in capital.
These condensed consolidated financial statements have been prepared on a going concern basis that contemplates the realization of assets and discharge of liabilities at their carrying values in the normal course of business for the foreseeable future. These financial statements do not reflect any adjustments that may be necessary if the Company is unable to continue as a going concern.
The Company currently earns no operating revenues and will require additional capital to advance both the Nyngan Scandium Project and the Honeybugle property. The Company’s ability to continue as a going concern is uncertain and is dependent upon the generation of profits from mineral properties, obtaining additional financing and maintaining continued support from its shareholders and creditors. These are material uncertainties that raise substantial doubt about the Company’s ability to continue as a going concern. If additional financial support is not received or operating profits are not generated, the carrying values of the Company’s assets may be adversely affected.
RESULTS FOR THE YEAR ENDED DECEMBER 31, 2016
Liquidity and Capital Resources
At December 31, 2016, we had working capital of $625,108 including cash of $615,234 and current liabilities of $41,353 as compared to working capital of $2,149,874 including cash of $2,249,676 at December 31, 2015. The decrease in working capital is due to costs incurred in completing the Nyngan Scandium Project definitive feasibility study and ongoing operating costs.
At December 31, 2016, we had a total of 21,820,000 (2015 – 17,610,000) stock options exercisable between C$0.07 and C$0.20 (2015 – between C$0.07 and C$0.315) which has the potential upon exercise to generate a total of C$2,465,660 (2015 – C$2,033,050) in cash over the next four and a half years. There is no assurance that these securities will be exercised.
Our continued development is contingent upon our ability to raise sufficient financing both in the short and long term. There are no guarantees that additional sources of funding will be available to us; however, management is committed to pursuing all possible sources of financing to execute our business plan.
Our major capital requirement in the next 12 months relates to the start of construction on the Nyngan Scandium Project.
The Company will need additional funding to develop the Nyngan project into a mine in the first half of 2017, and will seek to raise additional equity financing at that time.
Results of Operations
Quarter ended December 31, 2016
The net loss for the quarter decreased by $965,539 to $198,183 from a loss of $1,163,722 in the prior year, mainly as a result of a research and development refund received for the Nyngan project. Details of the individual items contributing to the decreased loss are as follows:
39
| Q4 2016 vs. Q4 2015 - Variance Analysis (US$) | ||
| Item |
Variance
Favourable / (Unfavourable) |
Explanation |
| Exploration
|
$1,066,648
|
During the fourth
quarter the Company received A$629,000 (approximately US$474,000) Research & Development ("R&D") Tax Incentive refund, net of costs to prepare and file. Also in Q4 2015, the Company was in the midst of preparing a definitive feasibility study (“DFS”) for the Nyngan Scandium project. By Q4 2016 the DFS was complete and very little was being spent on exploration. These two factors led to the favorable variance. |
| Stock-based compensation |
$307,818 |
In Q4 2015, the
Company, with shareholder approval, extended the life of 4,300,000 options resulting in higher expenses during 2015 and favourable variance in Q4 2016. |
| Professional fees |
$81,740 |
The favourable
variance is due to increased legal fees and guidance required on the sale of a royalty in Q4 of 2015 when compared to Q4 of 2016. |
| General and administrative |
$37,335 |
In Q4 2014, the company was
preparing a DFS for the Nyngan Scandium project and resulted in higher G&A in that period. |
| Travel & entertainment |
$16,403 |
In Q4 2015 the
Company incurred travel costs associated with the sale of a royalty as well as visiting Australia to work on the Nyngan Scandium project DFS. No similar costs were incurred during Q4 2016. |
| Foreign exchange loss |
$4,907 |
Funds were held
in Australian dollars subsequent to the receipt of Research & Development ("R&D") Tax Incentive refund. These funds increased in value in Q4 2016 resulting in this favorable variance. |
| Insurance |
$793 |
Quarter to
quarter expenses were similar with a slightly favorable variance being recognized in Q4 2016. |
| Amortization |
$631 |
Certain fixed
assets were fully depreciated towards the end of 2015 resulting in lower costs in 2016. |
| Consulting |
($2,500) |
This unfavorable
variance is due to a one-ime charge being incurred in 2016. |
| Salaries and benefits |
($22,658) |
The Company,
hired a new employee in Q3 2016 which resulted in this Q4 un-favorable variance. |
40
| Q4 2016 vs. Q4 2015 - Variance Analysis (US$) | ||
| Item |
Variance
Favourable / (Unfavourable) |
Explanation |
| Write-off of mineral property interests |
($238,670) |
It was decided in
Q4 of 2016 to write-off the Tordal property in Norway. There were no write-offs in Q4 of 2015. |
| Cost allocable to non-controlling interest in a subsidiary |
($241,230) |
The lower costs
for exploration in 2016 due to the receipt of Research & Development ("R&D") Tax Incentive refund led to lower recovery in Q4 2016 when compared to Q4 2015. |
Results of Operations for the Year ended December 31, 2016
The net loss for the year decreased by $662,003 to $2,108,428 from $2,770,431 in the prior year, mainly as a result of decreased exploration costs as we finalized the Nyngan DFS early in 2016, receiving a research and development refund from the New South Wales government and no longer having debt on our balance sheet in 2016. Details of the individual items contributing to the decreased net loss are as follows:
| 2016 vs. 2015 - Variance Analysis (US$) | ||
| Item |
Variance
Favourable / (Unfavourable) |
Explanation |
| Exploration |
$487,823 |
In 2016, the
Company received a refund from the Australian government for research and development with respect to the Nyngan Scandium project. Also, costs in 2016 were lower due to the completion of the DFS early in the year whereas the majority of the DFS costs were incurred during 2015. |
| Stock-based compensation |
$203,790 |
The number of
options issued in 2015 and 2016 were about the same but in 2015 the Company, with shareholder approval, extended the life of 4,300,000 options resulting in higher expenses this year. No such extension has taken place in 2016. |
| Interest expense |
$226,141 |
The Company held
no debt in 2016, while in 2015 an interest-bearing note was in place until repaid in Q2 of that year. |
| Professional fees |
$71,779 |
The 2015 costs
are higher due to legal fees and guidance required on the sale of a royalty in Q4 of 2015. |
| Foreign exchange loss |
$10,443 |
More stable
foreign exchange in 2016 resulted in this favorable variance. |
41
| 2016 vs. 2015 - Variance Analysis (US$) | ||
| Item |
Variance Favourable / (Unfavourable) |
Explanation |
| General and administrative |
$9,727 |
Higher G&A costs in the year
ended December 31, 2015 are a result of higher patent fees, marketing costs and IT support when compared to 2016. |
| Travel and entertainment |
$6,060 |
In 2015 more travel was incurred
due to the activity around the preparation of the Nyngan Scandium project DFS. |
| Amortization |
$983 |
Certain fixed assets were fully
depreciated towards the end of 2015 resulting in lower costs in 2016. |
| Insurance |
($12,408) |
The Company in 2015 received a
refund due to a Worker’s Compensation audit which resulted in the lower costs in that year. Without this favorable outcome, costs would have been relatively the same. |
| Costs allocable to non-controlling interest in a subsidiary |
($49,338) |
The lower loss in 2016 means lower
costs allocable to the non-controlling interest in our Australian entities. |
| Salaries and benefits |
($54,327) |
In 2016 the Company hired an
additional staff position midway through the year. |
| Write-off of mineral property interests |
($238,670) |
It was decided in Q4 of 2016 to
write-off the Tordal property in Norway. There were no write-offs in 2015. |
Cash flow discussion for the year ended December 31, 2016 compared to December 31, 2015
The cash outflow from operating activities decreased by $382,310 to $1,631,285 (2015 – $2,013,595) due to lower costs incurred in preparing the definitive feasibility study.
Cash flows from investing activities decreased by $2,073,157 to ($3,157) (2015 – $2,070,000) due to the sale of a royalty on the Australian projects in 2015.
Cash inflows from financing activities decreased by $1,775,885 to Nil (2015 - $1,775,885) as a result of no share issues or option exercises in 2016.
Summary of quarterly results (US$)
| 2016 | 2015 | |||||||
| Q4 | Q3 | Q2 | Q1 | Q4 | Q3 | Q2 | Q1 | |
| Net Sales Net Income (Loss) |
- (198,183) |
- (333,031) |
- (496,118) |
- (1,081,096) |
- 1,163,542 |
- (503,537) |
- (632,698) |
- (470,654) |
42
| Basic and diluted Net Income (Loss) per share |
(0.00) |
(0.00) |
(0.00) |
(0.01) |
(0.00) |
(0.00) |
(0.00) |
(0.00) |
Financial Position
Cash
The decrease in cash of $1,634,442 to $615,234 (2015 - $2,249,676) results from the completion of the Nyngan Scandium project DFS and no financing activities in 2016.
Property, plant and equipment
Property plant and equipment consists of office furniture and computer equipment at the Sparks, Nevada office. The increase of $307 to $2,918 at December 31, 2016 (2015 - $2,611) is due to the purchase of new computer hardware items.
Mineral interests
Mineral interests decreased by $238,670 to $704,053 at December 31, 2016 (2015 - $942,723) due to the write-off of the Tordal property in Norway.
Notes Payable and Accrued Liabilities
Notes payable and accrued liabilities have decreased by $165,978 to $41,353 at December 31, 2016 (2015 – $207,331) as the Nyngan Scandium project DFS was in full activity over the last months of 2015 and early 2016.
Capital Stock
Capital stock remained the same at $91,142,335 for both year-ends.
Additional paid-in capital increased by $469,434 to $6,844,671 (2015 - $6,375,237) as a result of stock options expensing.
Treasury shares remained at $1,264,194 through the 2015 fiscal period.
Off-balance sheet arrangements
At December 31, 2016, we had no material off-balance sheet arrangements such as guarantee contracts, contingent interest in assets transferred to an entity, derivative instruments obligations or any obligations that trigger financing, liquidity, market or credit risk to us.
Additional Information and Accounting Pronouncements
Outstanding share data
43
At March 13, 2017 we had 227,372,200 issued and outstanding common shares, 24,595,000 outstanding stock options at a weighted average exercise price of C$0.17. No warrants are outstanding at March 13, 2017.
Critical Accounting Estimates
The preparation of financial statements in conformity with generally accepted accounting policies requires our management to make estimates and assumptions that affect the reported amounts of assets and liabilities at the date of the financial statements and the reported amounts of revenues and expenses during the reporting period. These estimates are based on past experience, industry trends and known commitments and events. By their nature, these estimates are subject to measurement uncertainty and the effects on the financial statements of changes in such estimates in future periods could be significant. Actual results will likely differ from those estimates.
Stock-based compensation
We use the Black-Scholes option pricing model to calculate the fair value of stock options and compensatory warrants granted. This model is subject to various assumptions. The assumptions we make will likely change from time to time. At the time the fair value is determined, the methodology that we use is based on historical information, as well as anticipated future events. The assumptions with the greatest impact on fair value are those for estimated stock volatility and for the expected life of the instrument.
Deferred income taxes
We account for tax consequences of the differences in the carrying amounts of assets and liabilities and our tax bases using tax rates expected to apply when these temporary differences are expected to be settled. When the deferred realization of income tax assets does not meet the test of being more likely than not to occur, a valuation allowance in the amount of the potential future benefit is taken and no future income tax asset is recognized. We have taken a valuation allowance against all such potential tax assets.
Mineral properties and exploration and development costs
We capitalise the costs of acquiring mineral rights at the date of acquisition. After acquisition, various factors can affect the recoverability of the capitalized costs. Our recoverability evaluation of our mineral properties and equipment is based on market conditions for minerals, underlying mineral resources associated with the assets and future costs that may be required for ultimate realization through mining operations or by sale. We are in an industry that is exposed to a number of risks and uncertainties, including exploration risk, development risk, commodity price risk, operating risk, ownership and political risk, funding and currency risk, as well as environmental risk. Bearing these risks in mind, we have assumed recent world commodity prices will be achievable. We have considered the mineral resource reports by independent engineers on the Nyngan project in considering the recoverability of the carrying costs of the mineral properties. All of these assumptions are potentially subject to change, out of our control, however such changes are not determinable. Accordingly, there is always the potential for a material adjustment to the value assigned to mineral properties and equipment.
Recent Accounting Pronouncements
Accounting Standards Update 2016-09 – Compensation—Stock Compensation (Topic 718) Improvements to Employee Share-Based Payment Accounting. This accounting pronouncement, which goes into effect for annual periods beginning after December 16, 2016, addresses the simplification of several aspects of the accounting for share-based payment transactions, including the income tax consequences, classification of awards as either equity or liabilities, and classification on the statement of cash flows. The Company is reviewing this update to determine the impact it will have on its financial statements.
44
Accounting Standards Update 2016-02-Leases (Topic 842). This accounting pronouncement allows lessees to make an accounting policy election to not recognize a lease asset and liability for leases with a term of 12 months or less and do not have a purchase option that is expected to be exercised. This standard is effective for interim and annual reporting periods beginning after December 15, 2018, with early adoption permitted. The Company is currently evaluating the impact this guidance will have on its financial statements.
Accounting Standards Update 2016 -01 – Financial Instruments – Overall (Subtopic 825-10): Recognition and Measurement of Financial Assets and Financial Liabilities. This accounting pronouncement, which goes into effect for annual periods beginning after December 12, 2017, is far reaching and covers several presentation areas dealing with measurement, impairment, assumptions used in estimating fair value and several other areas. The Company is reviewing this update to determine the impact it may have on its financial statements.
Accounting Standards Update 2015-17 – Income Taxes (Topic 740): Balance Sheet Classification of Deferred Taxes. This accounting pronouncement requires that deferred tax liabilities and assets be classified as noncurrent in a classified statement of financial position. Currently deferred tax liabilities and assets must be presented as current and noncurrent. The policy is effective for annual periods beginning after December 16, 2016. The Company has adopted this policy and it has had little impact on the presentation of its financial statements.
Accounting Standards Update 2015-02 - Consolidation (Topic 810) - Amendments to the Consolidation Analysis. This update provides guidance with respect to the analysis that a reporting entity must perform to determine whether it should consolidate certain types of legal entities. The amendments in this Update are effective for public business entities for fiscal years, and for interim periods within those fiscal years, beginning after December 15, 2015. The Company has adopted this policy and it has had little impact on the presentation of its financial statements.
Financial instruments and other risks
Our financial instruments consist of cash, receivables, accounts payable and accrued liabilities, accounts payable with related parties, and promissory notes payable. It is management's opinion that we are not exposed to significant interest, currency or credit risks arising from our financial instruments. The fair values of these financial instruments approximate their carrying values unless otherwise noted. The Company has its cash primarily in two commercial banks, one in Vancouver, British Columbia, Canada and in one in Chicago, Illinois.
ITEM 7A. QUANTITATIVE AND QUALITATIVE DISCLOSURES ABOUT MARKET RISK
Not applicable.
ITEM 8. FINANCIAL STATEMENTS AND SUPPLEMENTARY DATA
The Consolidated Financial Statements of the Company and the notes thereto are attached to this report following the signature page and Certifications.
45
ITEM 9. CHANGES IN AND DISAGREEMENTS WITH ACCOUNTANTS ON ACCOUNTING AND FINANCIAL DISCLOSURE
For the fiscal years ended December 31, 2016 and 2015 we did not have any disagreement with our accountants on any matter of accounting principles, practices or financial statement disclosure.
ITEM 9A. CONTROLS AND PROCEDURES
Disclosure controls and procedures
The Company’s management is responsible for establishing and maintaining adequate internal control over financial reporting. The Company’s management, including our principal executive officer and our principal financial officer, evaluated the effectiveness of disclosure controls and procedures (as defined in Exchange Act Rule 13a-15(e)) as of the end of the period covered by this report. Based on that evaluation, the principal executive officer and principal financial officer concluded that as of the end of the period covered by this report, the Company has maintained effective disclosure controls and procedures in all material respects, including those necessary to ensure that information required to be disclosed in reports filed or submitted with the SEC (i) is recorded, processed, and reported within the time periods specified by the SEC, and (ii) is accumulated and communicated to management, including the principal executive officer and principal financial officer, as appropriate to allow for timely decision regarding required disclosure.
Management’s report on internal control over financial reporting
The Company’s management is responsible for establishing and maintaining adequate internal control over financial reporting (as defined in Rule 13a-15(f) or 15d-15(f) of the Exchange Act). Management assessed the effectiveness of our internal control over financial reporting as of December 31, 2015, using criteria established in Internal Control-Integrated Framework issued in 1992 by the Committee of Sponsoring Organizations of the Treadway Commission (COSO). Even an effective internal control system, no matter how well designed, has inherent limitations, including the possibility of human error and circumvention or overriding of controls and therefore can provide only reasonable assurance with respect to reliable financial reporting. Furthermore, the effectiveness of an internal control system in future periods can change with conditions.
A material weakness is a deficiency, or combination of deficiencies, in internal control over financial reporting such that there is a reasonable possibility that a material misstatement of the Company’s annual or interim financial statements will not be prevented or detected on a timely basis.
The Company’s management has determined that the internal controls over financial reporting are effective as of December 31, 2016.
Changes in Internal Control.
There have been no changes in internal control over financial reporting that occurred during the last fiscal quarter that have materially affected, or are reasonably likely to materially affect, internal control over financial reporting.
46
Item 9B. OTHER INFORMATION None.
PART III
Information with respect to Items 10 through 14 is set forth in the definitive Proxy Statement to be filed with the Securities and Exchange Commission on or before April 30, 2017 and is incorporated herein by reference. If the definitive Proxy Statement cannot be filed on or before April 30, 2017, the Company will instead file an amendment to this Form 10-K disclosing the information with respect to Items 10 through 14.
PART IV
ITEM 15. EXHIBITS, FINANCIAL STATEMENTS SCHEDULES
Financial Statements
The following Consolidated Financial Statements are filed as part of this report.
| Description | Page |
| Financial statements for the years ended December 31, 2016 and 2015 and audit reports thereon. | F-1 |
Exhibits
The following table sets out the exhibits filed herewith or incorporated herein by reference.
| Exhibit | Description |
| 3.1 |
Certificate of Incorporation, Certificate of
Name Change dated March 2009, Notice of Articles dated March
2009(1) Certificate of Name Change dated November 19, 2014 and Notice of Articles dated November 19, 2014(2) |
| 3.2 |
Corporate
Articles(1) Amendment to Corporate Articles dated November 10, 2014(2) |
| 10.1(1) | 2008 Stock Option Plan |
| 10.2(3) | 2015 Stock Option Plan |
| 10.3(1) | Management Contract with George Putnam dated May 1, 2010 |
| 10.4(4) | Management Contract with Edward Dickinson dated August 13, 2011 |
| 10.5(5) | Loan Agreement dated June 24, 2014 |
| 21.1(6) | List of Subsidiaries |
| 23.1(6) | Consent of Davidson & Company LLP |
| 23.2(6) | Consent of Stuart Hutchin |
| 23.3(6) | Consent of Dean Basile |
| 23.4(6) | Consent of Geoffrey Duckworth |
| 31.1(6) | Certification Pursuant to Rule 13a-14(a) or 15d-14(a) of the U.S. Securities Exchange Act of 1934 of the Principal Executive Officer |
47
(1) Previously filed as exhibits to the Form 10
filed May 24, 2011 and incorporated herein by reference.
(2)
Previously filed as exhibits to the Form 10-K filed February 27, 2015 and
incorporated herein by reference.
(3)Previously filed as Schedule
“A” to the Form DEF 14A filed October 5, 2015 and incorporated herein by
reference.
(4)Previously filed as an exhibit to the Form 10-K/A
filed May 1, 2014 and incorporated herein by reference.
(5)
Previously filed as an exhibit to the Form 10-Q filed August 12, 2014 and
incorporated herein by reference.
(6) Filed herewith.
48
SIGNATURES
Pursuant to the requirements of Section 13 or 15(d) of the Securities Exchange Act of 1934, the registrant has duly caused this report to be signed on its behalf by the undersigned, thereunto duly authorized.
SCANDIUM INTERNATIONAL MINING CORP.
| By: | /s/ George Putnam | |
| George Putnam | ||
| President and Principal Executive Officer | ||
| Date: | March 16, 2017 |
Pursuant to the requirements of the Securities Exchange Act of 1934, this report has been signed below by the following persons on behalf of the registrant and in the capacities and on the dates indicated.
| Signature | Title | Date | |
| /s/ George Putnam | President, Principal Executive Officer, and Director | March 16, 2017 | |
| George Putnam | |||
| /s/ William Harris | Chairman and Director | March 16, 2017 | |
| William Harris | |||
| /s/ James Rothwell | Director | March 16, 2017 | |
| James Rothwell | |||
| /s/ Willem Duyvesteyn | Director | March 16, 2017 | |
| Willem Duyvesteyn | |||
| /s/ Warren Davis | Director | March 16, 2017 | |
| Warren Davis | |||
| /s/ Barry Davies | Director | March 16, 2017 | |
| Barry Davies | |||
| /s/ Andrew Greig | Director | March 16, 2017 | |
| Andrew Greig | |||
| Principal Accounting Officer and | March 16, 2017 | ||
| /s/ Edward Dickinson | Principal Financial Officer | ||
| Edward Dickinson |
49

CONSOLIDATED FINANCIAL STATEMENTS
YEAR ENDED DECEMBER 31, 2016
F-1

REPORT OF INDEPENDENT REGISTERED PUBLIC ACCOUNTING FIRM
To the Shareholders and Directors of
Scandium International
Mining Corp.
We have audited the accompanying consolidated financial statements of Scandium International Mining Corp. (the "Company"), which comprise the consolidated balance sheets as of December 31, 2016 and 2015, and the related consolidated statements of loss and comprehensive loss, cash flows, and changes in equity for the years ended December 31, 2016 and 2015. These consolidated financial statements are the responsibility of the Company's management. Our responsibility is to express an opinion on these consolidated financial statements based on our audits.
We conducted our audits in accordance with the standards of the Public Company Accounting Oversight Board (United States). Those standards require that we plan and perform the audit to obtain reasonable assurance about whether the consolidated financial statements are free of material misstatement. An audit includes examining, on a test basis, evidence supporting the amounts and disclosures in the consolidated financial statements. An audit also includes assessing the accounting principles used and significant estimates made by management, as well as evaluating the overall consolidated financial statement presentation. We believe that our audits provide a reasonable basis for our opinion.
In our opinion, the consolidated financial statements referred to above present fairly, in all material respects, the financial position of Scandium International Mining Corp. as of December 31, 2016 and 2015, and the results of its operations and its cash flows for the years ended December 31, 2016 and 2015 in conformity with accounting principles generally accepted in the United States of America.
The accompanying consolidated financial statements have been prepared assuming that Scandium International Mining Corp. will continue as a going concern. As discussed in Note 1 to the consolidated financial statements, Scandium International Mining Corp. has suffered recurring losses from operations. This matter, along with other matters set forth in Note 1, indicate the existence of material uncertainties that raise substantial doubt about its ability to continue as a going concern. Management's plans in regard to these matters are also described in Note 1. The consolidated financial statements do not include any adjustments that might result from the outcome of this uncertainty.
| "DAVIDSON & COMPANY LLP" | |
| Vancouver, Canada | Chartered Professional Accountants |
| March 16, 2017 |
F-2
| Scandium International Mining Corp. |
| CONSOLIDATED BALANCE SHEETS |
| (Expressed in US Dollars) |
| As at: | December 31, 2016 | December 31, 2015 | ||||
| ASSETS | ||||||
| Current | ||||||
| Cash | $ | 615,234 | $ | 2,249,676 | ||
| Prepaid expenses and receivables | 51,227 | 107,529 | ||||
| Total Current Assets | 666,461 | 2,357,205 | ||||
| Equipment (Note 3) | 2,918 | 2,611 | ||||
| Mineral property interests (Note 4) | 704,053 | 942,723 | ||||
| Total Assets | $ | 1,373,432 | $ | 3,302,539 | ||
| LIABILITIES AND EQUITY | ||||||
| Current | ||||||
| Accounts payable and accrued liabilities | $ | 27,649 | $ | 196,322 | ||
| Accounts payable with related parties (Note 5) | 13,704 | 11,009 | ||||
| Total Liabilities | 41,353 | 207,331 | ||||
| Stockholders’ Equity | ||||||
| Capital stock
(Note 6) (Authorized: Unlimited number of common shares; Issued and outstanding: 225,047,200 (2015 – 225,047,200)) |
91,142,335 | 91,142,335 | ||||
| Treasury stock (Note 7) (1,033,333 common shares) (2015 – 1,033,333) | (1,264,194 | ) | (1,264,194 | ) | ||
| Additional paid in capital (Note 6) | 6,844,671 | 6,375,237 | ||||
| Accumulated other comprehensive loss | (853,400 | ) | (853,400 | ) | ||
| Deficit | (93,446,610 | ) | (91,338,182 | ) | ||
| Total Stockholders’ Equity | 2,422,802 | 4,061,796 | ||||
| Non-controlling Interest in a Subsidiary (Note 11) | (1,090,723 | ) | (966,588 | ) | ||
| Total Equity | 1,332,079 | 3,095,208 | ||||
| Total Liabilities and Equity | $ | 1,373,432 | $ | 3,302,539 |
Nature and continuance of operations (Note 1)
Subsequent
event (Note 12)
The accompanying notes are an integral part of these consolidated financial statements.
F-3
| Scandium International Mining Corp. |
| CONSOLIDATED STATEMENTS OF LOSS AND |
| COMPREHENSIVE LOSS |
| (Expressed in US Dollars) |
| December 31, | December 31, | |||||
| Years ended | 2016 | 2015 | ||||
|
EXPENSES |
||||||
|
Amortization (Note 3) |
$ | 2,850 | $ | 3,833 | ||
|
Consulting (Note 5) |
102,000 | 102,000 | ||||
|
Exploration |
509,854 | 997,677 | ||||
|
General and administrative |
185,336 | 195,063 | ||||
|
Insurance |
33,224 | 20,816 | ||||
|
Professional fees |
96,007 | 167,786 | ||||
|
Salaries and benefits |
516,361 | 462,034 | ||||
|
Stock-based compensation (Note 6) |
469,434 | 673,224 | ||||
|
Travel and entertainment |
54,988 | 61,048 | ||||
|
|
||||||
|
|
(1,970,054 | ) | (2,683,481 | ) | ||
|
Foreign exchange loss |
(23,839 | ) | (34,282 | ) | ||
|
Write-off of mineral property (Note 4) |
(238,670 | ) | - | |||
|
Interest expense |
- | (226,141 | ) | |||
|
|
||||||
|
|
(262,509 | ) | (260,423 | ) | ||
|
|
||||||
|
Loss and comprehensive loss for the year |
(2,232,563 | ) | (2,943,904 | ) | ||
|
|
||||||
|
Costs allocable to non-controlling interest in a subsidiary |
124,135 | 173,473 | ||||
|
|
||||||
|
Loss and comprehensive loss for the year attributable to Scandium International Mining Corp. |
$ | (2,108,428 | ) | $ | (2,770,431 | ) |
|
|
||||||
|
Basic and diluted loss and comprehensive loss per common share attributable to Scandium International Mining Corp. |
$ | (0.01 | ) | $ | (0.01 | ) |
|
|
||||||
|
Weighted average number of common shares outstanding |
225,047,200 | 211,264,568 |
The accompanying notes are an integral part of these consolidated financial statements.
F-4
| Scandium International Mining Corp. |
| CONSOLIDATED STATEMENTS OF CASH FLOWS |
| (Expressed in US Dollars) |
| Years ended | December 31, | December 31, | ||||
| 2016 | 2015 | |||||
|
CASH FLOWS USED IN OPERATING ACTIVITIES |
||||||
|
Loss for the year |
$ | (2,232,563 | ) | $ | (2,943,904 | ) |
|
Items not affecting cash: |
||||||
|
Amortization |
2,850 | 3,833 | ||||
|
Stock-based compensation |
469,434 | 673,224 | ||||
|
Shares issued in settlement of interest payable |
- | 169,262 | ||||
|
Write-off of mineral property |
238,670 | - | ||||
|
|
||||||
|
Changes in non-cash working capital items: |
||||||
|
Decrease (increase) in prepaids and receivables |
56,302 | (50,096 | ) | |||
|
Increase (decrease) in accounts payable, accrued liabilities and accounts payable with related parties |
(165,978 | ) | 134,086 | |||
|
|
(1,631,285 | ) | (2,013,595 | ) | ||
|
CASH FLOWS (USED IN) FROM INVESTING ACTIVITIES |
||||||
|
Equipment purchase |
(3,157 | ) | - | |||
|
Sale of royalty |
- | 2,070,000 | ||||
|
|
(3,157 | ) | 2,070,000 | |||
|
|
||||||
|
CASH FLOWS FROM FINANCING ACTIVITIES |
||||||
|
Common shares issued |
- | 1,812,047 | ||||
|
Share issuance costs |
- | (60,000 | ) | |||
|
Options exercised for common shares |
- | 23,838 | ||||
|
|
- | 1,775,885 | ||||
|
|
||||||
|
Change in cash during the year |
(1,634,442 | ) | 1,832,290 | |||
|
Cash, beginning of year |
2,249,676 | 417,386 | ||||
|
|
||||||
|
Cash, end of year |
$ | 615,234 | $ | 2,249,676 |
Supplemental disclosure with respect to cash flows (Note 10)
The accompanying notes are an integral part of these consolidated financial statements.
F-5
| Scandium International Mining Corp. |
| CONSOLIDATED STATEMENTS OF CHANGES IN EQUITY |
| (Expressed in US Dollars) |
|
|
Accumulated | Total | Non- | ||||||||||||||||||||||||
|
|
Additional | Treasury | Other | Stockholders’ | controlling | ||||||||||||||||||||||
|
|
Number of | Paid in Capital | Stock | Comprehensive | Deficit | Equity | Interest in a | ||||||||||||||||||||
|
|
Shares | Capital Stock | Loss | Subsidiary | Total Equity | ||||||||||||||||||||||
|
|
|||||||||||||||||||||||||||
|
Balance, December 31, 2014 |
198,604,790 | $ | 89,186,471 | $ | 2,419,615 | $ | (1,264,194 | ) | $ | (853,400 | ) | $ | (88,567,751 | ) | $ | 920,741 | $ | - | $ | 920,741 | |||||||
|
Private placements |
23,654,930 | 1,812,047 | - | - | - | - | 1,812,047 | - | 1,812,047 | ||||||||||||||||||
|
Shares issued in settlement of debt |
2,237,480 | 169,262 | - | - | - | - | 169,262 | - | 169,262 | ||||||||||||||||||
|
Share issue costs |
- | (60,000 | ) | - | - | - | - | (60,000 | ) | - | (60,000 | ) | |||||||||||||||
|
Stock options exercised |
550,000 | 34,555 | (10,717 | ) | - | - | - | 23,838 | - | 23,838 | |||||||||||||||||
|
Stock-based compensation |
- | - | 673,224 | - | - | - | 673,224 | - | 673,224 | ||||||||||||||||||
|
Sale of 20% of Australian subsidiary |
- | - | 3,293,115 | - | - | - | 3,293,115 | (793,115 | ) | 2,500,000 | |||||||||||||||||
|
Loss for the year |
- | - | - | - | - | (2,770,431 | ) | (2,770,431 | ) | (173,473 | ) | (2,943,904 | ) | ||||||||||||||
|
Balance, December 31, 2015 |
225,047,200 | 91,142,335 | 6,375,237 | (1,264,194 | ) | (853,400 | ) | (91,338,182 | ) | 4,061,796 | (966,588 | ) | 3,095,208 | ||||||||||||||
|
Stock-based compensation |
- | - | 469,434 | - | - | - | 469,434 | - | 469,434 | ||||||||||||||||||
|
Loss for the year |
- | - | - | - | - | (2,108,428 | ) | (2,108,428 | ) | (124,135 | ) | (2,232,563 | ) | ||||||||||||||
|
Balance, December 31, 2016 |
225,047,200 | $ | 91,142,335 | $ | 6,844,671 | $ | (1,264,194 | ) | $ | (853,400 | ) | $ | (93,446,610 | ) | $ | 2,422,802 | $ | (1,090,723 | ) | $ | 1,332,079 |
The accompanying notes are an integral part of these consolidated financial statements.
F-6
| Scandium International Mining Corp. |
| NOTES TO THE CONSOLIDATED FINANCIAL STATEMENTS |
| December 31, 2016 |
| (Expressed in US Dollars) |
| 1. |
NATURE AND CONTINUANCE OF OPERATIONS |
|
Scandium International Mining Corp. (the “Company”) is a specialty metals and alloys company focusing on scandium and other specialty metals. | |
|
The Company was incorporated under the laws of the Province of British Columbia, Canada in 2006. The Company currently trades on the Toronto Stock Exchange under the symbol “SCY”. | |
|
The Company’s focus is on the exploration and evaluation of its specialty metals assets, specifically the Nyngan scandium deposit located in New South Wales, Australia. The Company is an exploration stage company and anticipates incurring significant additional expenditures prior to production at any and all of its properties. | |
|
In fiscal 2015, the Company settled a $2,500,000 promissory note payable in exchange for a 20% interest in its Australian subsidiary which holds the Nyngan and Honeybugle properties. Accordingly, the Company holds an 80% interest in its Australian subsidiary as at year end (Note 11). | |
|
These consolidated financial statements have been prepared on a going concern basis that contemplates the realization of assets and discharge of liabilities at their carrying values in the normal course of business for the foreseeable future. These financial statements do not reflect any adjustments that may be necessary if the Company is unable to continue as a going concern. | |
|
The Company currently earns no operating revenues and will require additional capital in order to advance the Nyngan property. The Company’s ability to continue as a going concern is uncertain and is dependent upon the generation of profits from mineral properties, obtaining additional financing and maintaining continued support from its shareholders and creditors. These are material uncertainties that raise substantial doubt about the Company’s ability to continue as a going concern. In the event that additional financial support is not received or operating profits are not generated, the carrying values of the Company’s assets may be adversely affected. |
| 2. |
SIGNIFICANT ACCOUNTING POLICIES |
| a) |
Basis of presentation |
These consolidated financial statements have been prepared in conformity with generally accepted accounting principles of the United States of America (“US GAAP”).
These consolidated financial statements include the accounts of the Company and its wholly-owned subsidiaries, EMC Metals USA Inc., Wolfram Jack Mining Corp., and The Technology Store, Inc. Non-controlling interest represents the minority shareholders’ 20% proportionate share of the net assets and results of the Company’s majority-owned Australian subsidiary, EMC Metals Australia Pty Ltd., from the date the 20% interest was disposed by the Company (Note 4). All significant intercompany accounts and transactions have been eliminated on consolidation.
| b) |
Use of estimates |
The preparation of consolidated financial statements in conformity with US GAAP requires management to make estimates and assumptions that affect the reported amounts of assets and liabilities and the disclosure of contingent assets and liabilities at the date of the financial statements and the reported amounts of expenses during the reporting period. The Company regularly evaluates estimates and assumptions related to the deferred income tax asset valuations, asset impairment, stock-based compensation and loss contingencies. The Company bases its estimates and assumptions on current facts, historical experience and various other factors that it believes to be reasonable under the circumstances, the results of which form the basis for making judgments about the other sources. The actual results experienced by the Company may differ materially and adversely from the Company’s estimates. To the extent there are material differences between estimates and the actual results, future results of operations will be affected.
The Company considers itself to be an exploration stage company and will consider the transition to development stage after it receives a mining lease for its Nyngan Scandium project from the Mines Department of New South Wales, Australia, funding to begin mine construction, and board approval.
| c) |
Equipment |
Equipment is recorded at cost less accumulated amortization, calculated as follows:
| Computer equipment | 30% straight line |
| Office equipment | 20% straight line |
| d) |
Mineral interests and exploration and development costs |
The costs of acquiring mineral rights are capitalized at the date of acquisition. After acquisition, various factors can affect the recoverability of the capitalized costs. If, after review, management concludes that the carrying amount of a mineral interest is impaired, it will be written down to estimated fair value. Exploration costs incurred on mineral interests are expensed as incurred. Development costs incurred on proven and probable reserves will be capitalized. Upon commencement of production, capitalized costs will be amortized using the unit-of-production method over the estimated life of the ore body based on proven and probable reserves (which exclude non-recoverable reserves and anticipated processing losses).
F-7
| Scandium International Mining Corp. |
| NOTES TO THE CONSOLIDATED FINANCIAL STATEMENTS |
| December 31, 2016 |
| (Expressed in US Dollars) |
| 2. |
SIGNIFICANT ACCOUNTING POLICIES (cont’d…) |
| e) |
Asset retirement obligations |
The Company records the fair value of an asset retirement obligation as a liability in the period in which it incurs a legal obligation associated with the retirement of tangible long-lived assets that result from the acquisition, construction, development, and/or normal use of the long-lived assets. The Company also records a corresponding asset which is amortized over the life of the asset. Subsequent to the initial measurement of the asset retirement obligation, the obligation is adjusted at the end of each period to reflect the passage of time (accretion expense) and changes in the estimated future cash flows underlying the obligation (asset retirement cost).
| f) |
Long-lived assets |
Long-lived assets held and used by the Company are reviewed for impairment whenever events or changes in circumstances indicate that the carrying amount of an asset may not be recoverable. For purposes of evaluating the recoverability of long-lived assets, the recoverability test is performed using undiscounted net cash flows related to the long-lived assets. If such assets are considered to be impaired, the impairment recognized is measured by the amount by which the carrying amount of the assets exceeds the fair value of the assets. Assets to be disposed of are reported at the lower of the carrying amount or fair value less costs to sell.
| g) |
Income taxes |
The Company accounts for income taxes under the asset and liability method. Deferred tax assets and liabilities are recognized for the future tax consequences attributable to differences between the financial statement carrying amounts of existing assets and liabilities and their respective tax bases. Deferred tax assets and liabilities are measured using enacted tax rates expected to apply to taxable income in the years in which those temporary differences are expected to be recovered or settled. Under the asset and liability method the effect on deferred tax assets and liabilities of a change in tax rates is recognized in income in the period that includes the enactment date. A valuation allowance is recognized if it is more likely than not that some part or all of the deferred tax asset will not be recognized.
| h) |
Loss per share |
Basic loss per common share is computed using the weighted average number of common shares outstanding during the year. To calculate diluted loss per share, the Company uses the treasury stock method and the if converted method. As at December 31, 2016 and 2015 there were no warrants outstanding and 21,820,000 options (2015 – 17,610,000) outstanding which have not been included in the weighted average number of common shares outstanding as these were anti-dilutive.
| i) |
Foreign exchange |
The Company's and subsidiaries’ functional currency is the USD. Any monetary assets and liabilities that are in a currency other than the USD are translated at the rate prevailing at year end. Revenue and expenses in a foreign currency are translated at rates that approximate those in effect at the time of translation. Gains and losses from translation of foreign currency transactions USD are included in current results of operations. Fixed assets and mineral properties have been translated at historical rates, rate on the date of the transaction.
| j) |
Stock-based compensation |
The Company accounts for stock-based compensation under the provisions of Accounting Standard Codification (“ASC”) 718, “Compensation-Stock Compensation”. Under the fair value recognition provisions, stock-based compensation expense is measured at the grant date for all stock-based awards to employees and directors and is recognized as an expense over the requisite service period, which is generally the vesting period. The Black-Scholes option valuation model is used to calculate fair value.
| k) |
Financial instruments |
The Company’s financial instruments consist of cash, receivables, accounts payable, accounts payable with related parties, and accrued liabilities. It is management's opinion that the Company is not exposed to significant interest, currency or credit risks arising from its financial instruments. The fair values of these financial instruments approximate their carrying values unless otherwise noted. The Company has its cash primarily in two commercial banks, one in Chicago, Illinois, United States of America and the other in Melbourne, Victoria, Australia.
| l) |
Concentration of credit risk |
The financial instrument which potentially subjects the Company to concentration of credit risk is cash. The Company maintains cash in bank accounts that, at times, may exceed federally insured limits. As at December 31, 2016 and 2015, the Company has exceeded the federally insured limit. The Company has not experienced any losses in such amounts and believes it is not exposed to any significant risks on its cash in bank accounts.
F-8
| Scandium International Mining Corp. |
| NOTES TO THE CONSOLIDATED FINANCIAL STATEMENTS |
| December 31, 2016 |
| (Expressed in US Dollars) |
| 2. |
SIGNIFICANT ACCOUNTING POLICIES (cont’d…) |
| m) |
Fair value of financial assets and liabilities |
The Company measures the fair value of financial assets and liabilities based on US GAAP guidance which defines fair value, establishes a framework for measuring fair value, and expands disclosures about fair value measurements.
The Company classifies financial assets and liabilities as held-for-trading, available-for-sale, held-to-maturity, loans and receivables or other financial liabilities depending on their nature. Financial assets and financial liabilities are recognized at fair value on their initial recognition, except for those arising from certain related party transactions which are accounted for at the transferor’s carrying amount or exchange amount.
Financial assets and liabilities classified as held-for-trading are measured at fair value, with gains and losses recognized in net income. Financial assets classified as held-to-maturity, loans and receivables, and financial liabilities other than those classified as held-for-trading are measured at amortized cost, using the effective interest method of amortization. Financial assets classified as available-for-sale are measured at fair value, with unrealized gains and losses being recognized as other comprehensive income until realized, or if an unrealized loss is considered other than temporary, the unrealized loss is recorded in income.
Financial instruments, including receivables, accounts payable and accrued liabilities, and accounts payable with related parties are carried at amortized cost, which management believes approximates fair value due to the short term nature of these instruments.
The following table presents information about the assets that are measured at fair value on a recurring basis as at December 31, 2016, and indicates the fair value hierarchy of the valuation techniques the Company utilized to determine such fair value. In general, fair values determined by Level 1 inputs utilize quoted prices (unadjusted) in active markets for identical assets. Fair values determined by Level 2 inputs utilize data points that are observable such as quoted prices, interest rates and yield curves. Fair values determined by Level 3 inputs are unobservable data points for the asset or liability, and included situations where there is little, if any, market activity for the asset:
| Quoted Prices | Significant Other | Significant | |||||||||||
| December 31, | in Active Markets | Observable Inputs | Unobservable Inputs | ||||||||||
| 2016 | (Level 1) | (Level 2) | (Level 3) | ||||||||||
| Assets: | |||||||||||||
| Cash | $ | 615,234 | $ | 615,234 | $ | — | $ | — | |||||
| Total | $ | 615,234 | $ | 615,234 | $ | — | $ | — |
The carrying value of receivables, accounts payable and accrued liabilities, accounts payable to related parties and promissory notes payable approximate their fair value due to their short-term nature.
The fair values of cash are determined through market, observable and corroborated sources.
| n) |
Recently Adopted and Recently Issued Accounting Standards |
Accounting Standards Update 2016-09 – Compensation—Stock Compensation (Topic 718) Improvements to Employee Share-Based Payment Accounting. This accounting pronouncement, which goes into effect for annual periods beginning after December 16, 2016, addresses the simplification of several aspects of the accounting for share-based payment transactions, including the income tax consequences, classification of awards as either equity or liabilities, and classification on the statement of cash flows. The Company is reviewing this update to determine the impact it will have on its financial statements.
Accounting Standards Update 2016-02 - Leases (Topic 842). This accounting pronouncement allows lessees to make an accounting policy election to not recognize a lease asset and liability for leases with a term of 12 months or less and do not have a purchase option that is expected to be exercised. This standard is effective for interim and annual reporting periods beginning after December 15, 2018, with early adoption permitted. The Company is currently evaluating the impact this guidance will have on its financial statements.
Accounting Standards Update 2016-01 – Financial Instruments – Overall (Subtopic 825-10): Recognition and Measurement of Financial Assets and Financial Liabilities. This accounting pronouncement, which goes into effect for annual periods beginning after December 12, 2017, is far reaching and covers several presentation areas dealing with measurement, impairment, assumptions used in estimating fair value and several other areas. The Company is reviewing this update to determine the impact it may have on its financial statements.
Accounting Standards Update 2015-17 – Income Taxes (Topic 740): Balance Sheet Classification of Deferred Taxes. This accounting pronouncement requires that deferred tax liabilities and assets be classified as noncurrent in a classified balance sheet. Currently deferred tax liabilities and assets must be presented as current and noncurrent. The policy is effective for annual periods beginning after December 16, 2016. The Company has adopted this policy and it has had no impact on the presentation of its financial statements.
F-9
| Scandium International Mining Corp. |
| NOTES TO THE CONSOLIDATED FINANCIAL STATEMENTS |
| December 31, 2016 |
| (Expressed in US Dollars) |
| 2. |
SIGNIFICANT ACCOUNTING POLICIES (cont’d…) |
Accounting Standards Update 2015-02 - Consolidation (Topic 810) - Amendments to the Consolidation Analysis. This update provides guidance with respect to the analysis that a reporting entity must perform to determine whether it should consolidate certain types of legal entities. The amendments in this Update are effective for public business entities for fiscal years, and for interim periods within those fiscal years, beginning after December 15, 2015. The Company has adopted this policy and it has had no impact on the presentation of its financial statements.
Accounting Standards Update 2015-01 - Income Statement—Extraordinary and Unusual Items (Subtopic 225-20). This Update is part of an initiative to reduce complexity in accounting standards (the Simplification Initiative). This Update eliminates from GAAP the concept of extraordinary items. The amendments in this Update are effective for fiscal years, and interim periods within those fiscal years, beginning after December 15, 2015. The Company has adopted this policy and it has had no impact on the presentation of its financial statements.
Accounting Standards Update 2014-15 – Presentation of Financial Statements – Going Concern (Subtopic 205-40). This accounting pronouncement provides guidance in GAAP about management’s responsibility to evaluate whether there is substantial doubt about an entity’s ability to continue as a going concern and to provide related footnote disclosures. In doing so, the amendments should reduce diversity in the timing and content of footnote disclosures. The policy is effective for annual periods ending after December 15, 2016. The Company has adopted this policy which has had no impact on the presentation of its financial statements.
| 3. |
EQUIPMENT |
| 2016 | |||||||||||||
| December 31, | December 31, | ||||||||||||
| 2015 Net Book | Additions | 2016 Net Book | |||||||||||
| Value | (disposals) | Amortization | Value | ||||||||||
| Computer equipment | $ | 1,017 | $ | 3,157 | $ | (1,256 | ) | $ | 2,918 | ||||
| Office equipment | 1,594 | - | (1,594 | ) | - | ||||||||
| $ | 2,611 | $ | 3,157 | $ | (2,850 | ) | $ | 2,918 | |||||
| 2015 | |||||||||||||
| December 31, | December 31, | ||||||||||||
| 2014 Net Book | Additions | 2015 Net Book | |||||||||||
| Value | (disposals) | Amortization | Value | ||||||||||
| Computer equipment | $ | 1,696 | $ | - | $ | (679 | ) | $ | 1,017 | ||||
| Office equipment | 4,748 | - | (3,154 | ) | 1,594 | ||||||||
| $ | 6,444 | $ | - | $ | (3,833 | ) | $ | 2,611 |
| 4. |
MINERAL PROPERTY INTERESTS |
| Scandium and | ||||
| December 31, 2016 | other | |||
| Acquisition costs | ||||
| Balance, December 31, 2015 | $ | 942,723 | ||
| Write-off of Tordal property | (238,670 | ) | ||
| Balance December 31, 2016 | $ | 704,053 | ||
| Scandium and | ||||
| December 31, 2015 | other | |||
| Acquisition costs | ||||
| Balance, December 31, 2014 | $ | 3,012,723 | ||
| Sale of royalty | (2,070,000 | ) | ||
| Balance December 31, 2015 | $ | 942,723 |
F-10
| Scandium International Mining Corp. |
| NOTES TO THE CONSOLIDATED FINANCIAL STATEMENTS |
| December 31, 2016 |
| (Expressed in US Dollars) |
| 4. |
MINERAL PROPERTY INTERESTS (cont’d…) |
Title to mineral property interests involves certain inherent risks due to the difficulties of determining the validity of certain claims as well as the potential for problems arising from the frequently ambiguous conveyancing history characteristic of many mineral property interests. The Company has investigated title to all of its mineral property interests and, to the best of its knowledge, title to all of its properties is in good standing.
SCANDIUM PROPERTIES
Nyngan, New South Wales Property
On February 6, 2013, the Company announced that it had acquired 100% of the Nyngan Scandium Project, in return for AUD$2.6 million cash payments and a percentage royalty payable to its previous partner on sales of product from the project.
During fiscal 2015, the Company settled a $2,500,000 promissory note payable in exchange for a 20% interest in its Australian subsidiary which holds title to both the Nyngan and Honeybugle properties (Note 11).
On October 13, 2015, the Company received US$2.07M from a private investor in return for the granting of a 0.7% royalty on gross mineral sales from both the Nyngan property and the Honeybugle property. The amount received in return for the royalty interest was deducted from the value of the mineral interests of Nyngan and Honeybugle.
Royalties attached to the Nyngan property include a 1.5% Net Profits Interest royalty to private parties involved with the early exploration on the property, and a 1.7% Net Smelter Returns royalty payable to Jervois for 12 years after production commences, subject to terms in the settlement agreement. Another revenue royalty is payable to private interests of 0.2%, subject to a $370,000 cap. A NSW minerals royalty will also be levied on the project, subject to negotiation, currently 4% on revenue.
Honeybugle property, Australia
In April of 2014 the Company also acquired an exploration license referred to as the Honeybugle property, a prospective scandium exploration property located 24 kilometers from the Nyngan Project. As described in the previous Nyngan Property section, during fiscal 2015, the Company settled its $2,500,000 promissory note payable in exchange for a 20% interest in its Australian subsidiary which holds title to both the Nyngan and Honeybugle properties.
Tørdal and Evje-Iveland properties, Norway
During 2012 the Company entered into an option agreement with REE Mining AS (“REE”) to earn up to a 100% interest in the Tørdal and Evje-Iveland properties pursuant to which the Company paid $130,000 and issued 1,000,000 common shares valued at $40,000. The Company subsequently renegotiated the payments required to earn the interest and the Evje-Iveland property was removed from the option agreement. Pursuant to the amendment, the Company earned a 100% interest in the Tørdal property by paying an additional $35,000 and granting a 1% Net Smelter Return (“NSR”) payable to REE. In December 2016 it was decided to write-off the Company’s interest in the Tordal property.
| 5. |
RELATED PARTY TRANSACTIONS |
During the year ended December 31, 2016, the Company expensed $366,923 for stock-based compensation for stock options issued to Company directors. During the year ended December 31, 2015, the Company expensed $517,934 for stock options issued to Company directors.
During each of the years ended December 31, 2016 and December 31, 2015 the Company paid a consulting fee of $102,000 to one of its directors.
| 6. |
CAPITAL STOCK AND ADDITIONAL PAID IN CAPITAL |
On September 1, 2015, the Company issued 1,982,850 common shares at a value of C$0.10 per common share for total proceeds of C$198,285 ($150,000).
On August 31, 2015, the Company issued 2,237,480 common shares at a value of C$0.10 per common share in settlement of interest payable on a promissory note with a fair value of C$223,748 ($169,262).
On August 24, 2015, the Company issued 21,672,080 common shares at a value of C$0.10 per common share for total proceeds of C$2,167,208 ($1,662,047). The Company paid $60,000 in share issuance costs with regard to this common share issue.
F-11
| Scandium International Mining Corp. |
| NOTES TO THE CONSOLIDATED FINANCIAL STATEMENTS |
| December 31, 2016 |
| (Expressed in US Dollars) |
| 6. |
CAPITAL STOCK AND ADDITIONAL PAID IN CAPITAL (cont’d…) |
Stock Options
The Company established a stock option plan (the “Plan”) under which it is authorized to grant options to executive officers and directors, employees and consultants and the number of options granted under the Plan shall not exceed 15% of the shares outstanding. Under the Plan, the exercise period of the options may not exceed ten years from the date of grant and vesting is determined by the Board of Directors.
Stock option transactions are summarized as follows:
| Stock Options | |||||||
| Weighted average | |||||||
| exercise price in | |||||||
| Number | Canadian $ | ||||||
| Outstanding, December 31, 2014 | 15,378,750 | $ | 0.11 | ||||
| Granted | 5,350,000 | 0.14 | |||||
| Cancelled | (2,568,750 | ) | 0.16 | ||||
| Exercised | (550,000 | ) | 0.05 | ||||
| Outstanding, December 31, 2015 | 17,610,000 | 0.12 | |||||
| Granted | 5,260,000 | 0.14 | |||||
| Expired | (1,050,000 | ) | 0.24 | ||||
| Outstanding, December 31, 2016 | 21,820,000 | $ | 0.11 | ||||
| Number currently exercisable | 21,166,500 | $ | 0.11 | ||||
As at December 31, 2016, incentive stock options were outstanding as follows:
| Number of | Number of | Exercise | |||||||||||
| Options | Options | Price in | |||||||||||
| (exercisable) | (outstanding) | Canadian $ | Expiry Date | ||||||||||
| Options | |||||||||||||
| 4,300,000 | 4,300,000 | 0.100 | November 5, 2020* | ||||||||||
| 2,285,000 | 2,285,000 | 0.080 | April 24, 2017 | ||||||||||
| 150,000 | 150,000 | 0.120 | July 25, 2017 | ||||||||||
| 1,400,000 | 1,400,000 | 0.070 | August 8, 2017 | ||||||||||
| 1,000,000 | 1,000,000 | 0.100 | May 9, 2018 | ||||||||||
| 3,375,000 | 3,375,000 | 0.120 | July 25, 2019 | ||||||||||
| 200,000 | 200,000 | 0.100 | December 30, 2019 | ||||||||||
| 3,260,000 | 3,450,000 | 0.140 | April 17, 2020 | ||||||||||
| 400,000 | 400,000 | 0.115 | August 28, 2020 | ||||||||||
| 4,636,500 | 4,860,000 | 0.130 | February 8, 2021 | ||||||||||
| 160,000 | 400,000 | 0.200 | June 14, 2021 | ||||||||||
| 21,166,500 | 21,820,000 |
* These options were extended by the Company shareholders at the Company’s annual meeting in October 2015. The Company recognized an additional expense of $281,962 related to this extension. Black-Scholes option pricing model assumptions used were a risk-free interest rate of 1.49%, expected life of 5 years, with a 0.00% forfeiture and dividend rate as well as a volatility rate of 145.92% .
As at December 31, 2016 the Company’s outstanding and exercisable stock options have an aggregate intrinsic value of $922,412 (2015 - $489,509).
Stock-based compensation
During the year ended December 31, 2016, the Company recognized stock-based compensation of $469,434 (December 31, 2015 - $673,224) in the statement of operations and comprehensive loss as a result of incentive stock options granted, vested and extended in the current period. There was a corresponding entry to additional paid in capital. There were 5,260,000 stock options granted during the year ended December 31, 2016 (December 31, 2015 – 5,350,000).
F-12
| Scandium International Mining Corp. |
| NOTES TO THE CONSOLIDATED FINANCIAL STATEMENTS |
| December 31, 2016 |
| (Expressed in US Dollars) |
| 6. |
CAPITAL STOCK AND ADDITIONAL PAID IN CAPITAL (cont’d…) |
The weighted average fair value of the options granted in the year was C$0.12 (2015 - C$0.14) .
The fair value of all compensatory options granted is estimated on grant date using the Black-Scholes option pricing model. The weighted average assumptions used in calculating the fair values of options granted are as follows:
| 2016 | 2015 | ||||||
| Risk-free interest rate | 1.13% | 1.02% | |||||
| Expected life | 5 years | 5 years | |||||
| Volatility | 141.12% | 145.72% | |||||
| Forfeiture rate | 0.00% | 0.00% | |||||
| Dividend rate | 0.00% | 0.00% |
| 7. |
TREASURY STOCK |
| Number | Amount | ||||||
| Treasury shares, December 31, 2016, 2015 and 2014 | 1,033,333 | $ | 1,264,194 |
Treasury shares comprise shares of the Company which cannot be sold without the prior approval of the TSX.
| 8. |
SEGMENTED INFORMATION |
The Company’s mineral properties are located in Norway and Australia. The Company’s capital assets’ geographic information is as follows:
| December 31, 2016 | Norway | Australia | United States | Total | |||||||||
| Equipment | $ | - | $ | - | $ | 2,918 | $ | 2,918 | |||||
| Mineral property interests | - | 704,053 | - | 704,053 | |||||||||
| $ | - | $ | 704,053 | $ | 2,918 | $ | 706,971 | ||||||
| December 31, 2015 | Norway | Australia | United States | Total | |||||||||
| Equipment | $ | - | $ | - | $ | 2,611 | $ | 2,611 | |||||
| Mineral property interests | 238,670 | 704,053 | - | 942,723 | |||||||||
| $ | 238,670 | $ | 704,053 | $ | 2,611 | $ | 945,334 |
F-13
| Scandium International Mining Corp. |
| NOTES TO THE CONSOLIDATED FINANCIAL STATEMENTS |
| December 31, 2016 |
| (Expressed in US Dollars) |
| 9. |
DEFERRED INCOME TAX |
|
A reconciliation of income taxes at statutory rates with the reported taxes is as follows: | |
| 2016 | 2015 | ||||||
|
|
|||||||
|
Loss before income taxes |
$ | (2,108,428 | ) | $ | (2,770,431 | ) | |
|
|
|||||||
|
Expected income tax (recovery) |
(548,000 | ) | (720,000 | ) | |||
|
Change in statutory, foreign tax, foreign exchange rates and other |
(439,000 | ) | (24,000 | ) | |||
|
Permanent difference |
90,000 | 130,000 | |||||
|
Adjustment to prior years provision versus statutory tax returns |
- | 1,055,000 | |||||
|
Change in unrecognized deductible temporary differences |
897,000 | (441,000 | ) | ||||
|
Total Income tax expense (recovery) |
$ | - | $ | - |
The significant components of the Company’s deferred tax assets that have not been included on the consolidated statement of financial position are as follows;
| 2016 | 2015 | ||||||
|
Deferred Tax Assets (Liabilities) |
|||||||
|
Exploration and evaluation assets |
$ | 1,527,000 | $ | 745,000 | |||
|
Property and equipment |
63,000 | 61,000 | |||||
|
Share issue costs |
13,000 | 27,000 | |||||
|
Marketable securities |
19,000 | 19,000 | |||||
|
Allowable capital losses |
1,786,000 | 1,935,000 | |||||
|
Non-capital losses available for future periods |
3,533,000 | 3,257,000 | |||||
|
|
6,941,000 | 6,044,000 | |||||
|
Unrecognized deferred tax assets |
(6,941,000 | ) | (6,044,000 | ) | |||
|
Net deferred tax assets |
$ | - | $ | - |
The significant components of the Company’s temporary differences, unused tax credits and unused tax losses that have not been included on the consolidated statement of financial position are as follows:
|
|
2016 | Expiry Date | 2015 | Expiry Date | |||||||||
|
|
Range | Range | |||||||||||
|
Temporary Differences |
|||||||||||||
|
Exploration and evaluation assets |
$ | 5,848,000 | No expiry date | $ | 2,866,000 | No expiry date | |||||||
|
Property and equipment |
244,000 | No expiry date | 236,000 | No expiry date | |||||||||
|
Share issue costs |
48,000 | 2036 to 2039 | 104,000 | 2035 to 2038 | |||||||||
|
Marketable securities |
145,000 | No expiry date | 145,000 | No expiry date | |||||||||
|
Allowable capital losses |
6,870,000 | No expiry date | 7,442,000 | No expiry date | |||||||||
|
Non-capital losses available for future periods |
13,509,000 | 2017 to 2036 | 12,166,000 | 2016 to 2035 |
| 10. |
SUPPLEMENTAL DISCLOSURE WITH RESPECT TO CASH FLOWS |
| 2016 | 2015 | ||||||
| Cash paid during the year for interest | $ | $ | 56,250 | ||||
| Cash paid during the year for income taxes | $ | - | $ | - |
There were no significant non-cash transactions for the year ended December 31, 2016.
In the year ending December 31, 2015 the Company exchanged a loan of $2,500,000 for a 20% interest in its Australian subsidiary which hold both the Nyngan and Honeybugle properties resulting in initial non-controlling interests of $793,115.
F-14
| Scandium International Mining Corp. |
| NOTES TO THE CONSOLIDATED FINANCIAL STATEMENTS |
| December 31, 2016 |
| (Expressed in US Dollars) |
| 11. |
EMC METALS AUSTRALIA PTY LTD |
|
On August 24, 2015 the Company’s $2,500,000 promissory note payable converted into a 20% ownership interest in EMC Metals Australia Pty Ltd (“EMC Australia”), with the Company holding an 80% ownership interest. EMC Australia holds our interests in the | |
|
Nyngan Scandium Project and Honeybugle Scandium property. Upon conversion of the promissory note payable, EMC Australia is now operated as a joint venture between Scandium Investments LLC (“SIL”) and the Company. SIL holds a carried interest in the Nyngan Scandium Project and is not required to contribute cash for the operation of EMC Australia until the Company meets two development milestones: (1) filing a feasibility study on SEDAR, and (2) receiving a mining license on either joint venture property. At such time as the two development milestones are met, SIL becomes fully participating on project costs thereafter. | |
|
Completion of the development milestones by the Company, as described above, activates a second one-time, limited period option for SIL to elect to convert the fair market value of its 20% joint venture interest in the Nyngan Scandium Project and Honeybugle Scandium property into an equivalent value of the Company’s common shares, at the then prevailing market prices, rather than continue with ownership at the project level. | |
|
EMC Australia is consolidated in the Company’s Consolidated Financial Statements for the year ended December 31, 2016. |
| December 31, | ||||
| Year ended | 2015 | |||
|
Loss attributable to Scandium International Mining Corp. Shareholders |
$ | (2,770,431 | ) | |
|
Increase in Scandium International Mining Corp additional paid in capital on disposal of 20% of subsidiary |
3,293,115 | |||
|
Change from loss to Scandium International Mining Corp. shareholders and transfers from non- controlling interests |
$ | 522,684 |
| 12. |
Subsequent event |
|
Subsequent to December 31, 2016, the Company granted 5,100,000 stock options exercisable at C$0.37 for a period of 5 years expiring on February 21, 2022. | |
|
Subsequent to December 31, 2016, 2,380,000 stock options were exercised raising C$181,400. |
F-15