Attached files
| file | filename |
|---|---|
| 8-K - 8-K - JPMORGAN CHINA REGION FUND, INC. | form8k-17151_jfc.htm |
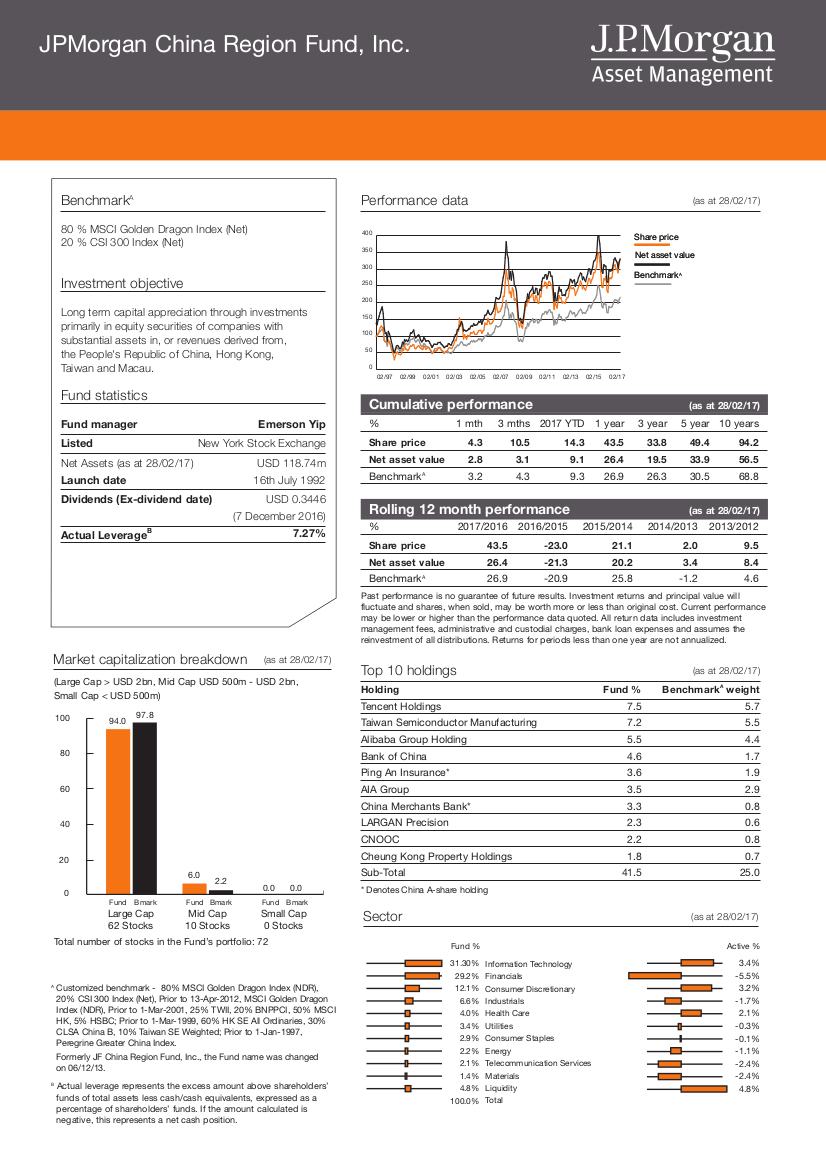
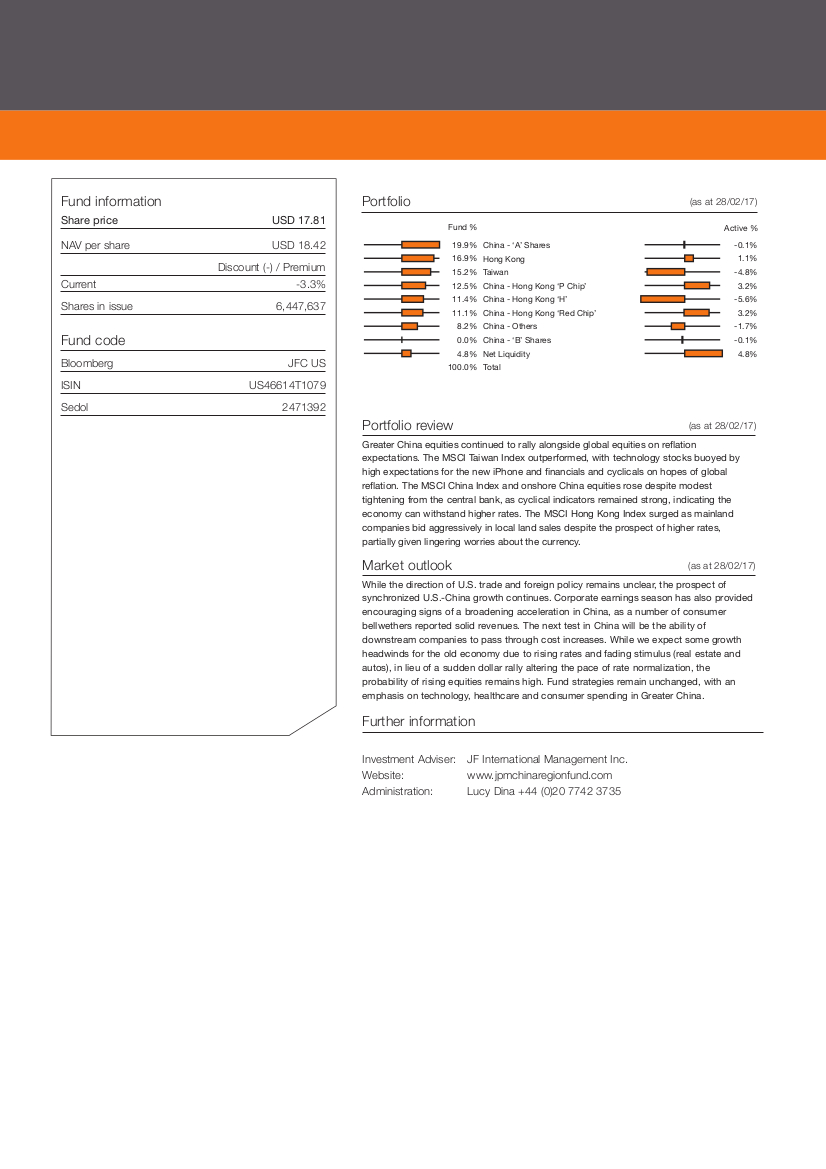
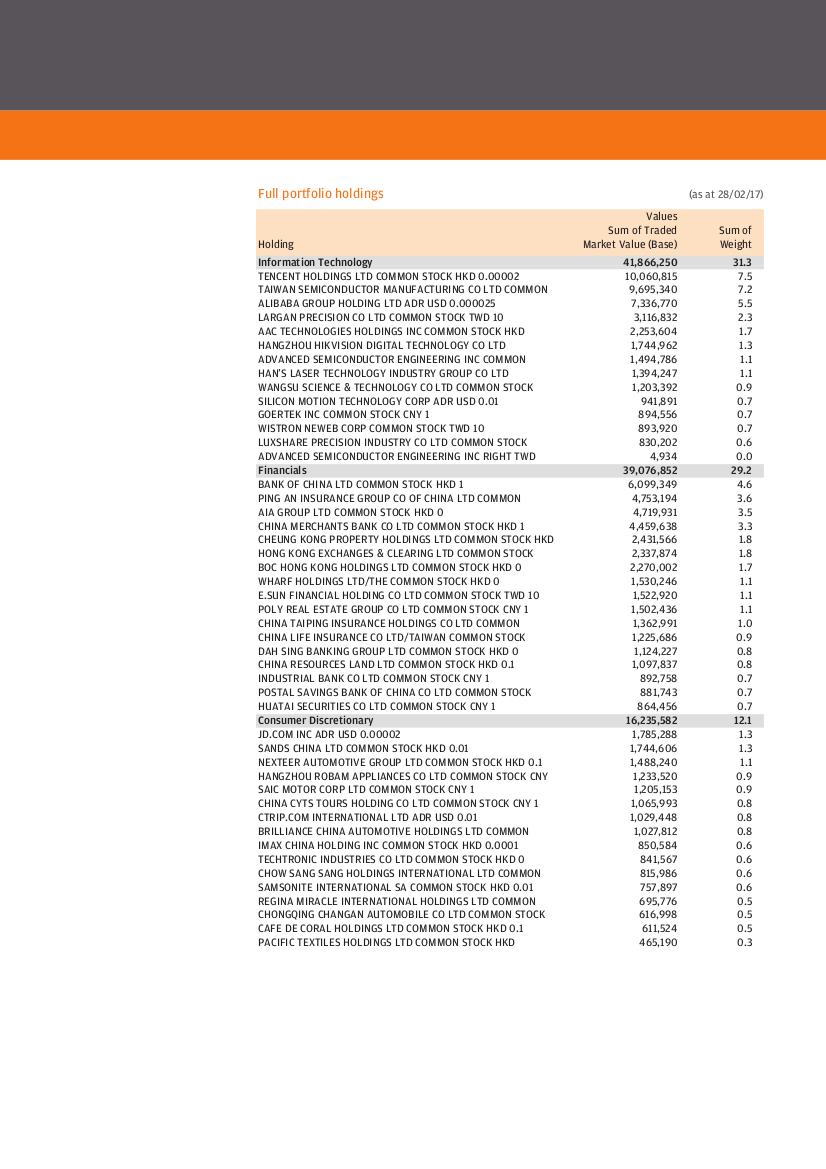
BenchmarkA Performance data (as at 28/02/17) 80 ! MSCI Golden Dragon Index (Net) 400 20 ! CSI 300 Index (Net) 350 300 Investment objective 250 200 Long term capital appreciation through investments 150 primarily in equity securities of companies with 100 substantial assets in, or revenues derived from, the People's Republic of China, Hong Kong, 50 Taiwan and Macau. 0 02/97 02/99 02/01 02/05 02/07 02/09 02/11 02/13 02/15 02/17 Fund statistics S h a r e p r i c e N et asset v alue Ben c h m a r k A Fund mZnZger Emerson Yip % 1 mth 3 mths 2017 YTD 1 year 3 year 5 year 10 years Listed New York Stock Exchange ShZre price 4.3 10.5 14.3 43.5 33.8 49.4 94.2 Net Zsset vZlue 2.8 3.1 9.1 26.4 19.5 33.9 56.5 Net Assets (as at 28/02/17) USD 118.74m BenchmarkA 3.2 4.3 9.3 26.9 26.3 30.5 68.8 LZunch dZte 16th July 1992 Dividends (Ex-dividend dZte) USD 0.3446 (7 December 2016) B % 2017/2016 2016/2015 2015/2014 2014/2013 2013/2012 7.27! ShZre price 43.5 -23.0 21.1 2.0 9.5 ActuZl LeverZge Market capitalization breakdown (as at 28/02/17) (Large Cap > USD 2bn, Mid Cap USD 500m USD 2bn, Small Cap less than USD 500m) 97.8 100 0 Fund Bmark Fund Bmark Fund Bmark Large Cap Mid Cap Small Cap 62 Stocks 10 Stocks 0 Stocks Total number of stocks in the Fund’s portfolio: 72 A Customized benchmark 80% MSCI Golden Dragon Index (NDR), 20% CSI 300 Index (Net), Prior to 13Apr2012, MSCI Golden Dragon Index (NDR), Prior to 1Mar2001, 25% TWII, 20% BNPPCI, 50% MSCI HK, 5% HSBC; Prior to 1Mar1999, 60% HK SE All Ordinaries, 30% CLSA China B, 10% Taiwan SE Weighted; Prior to 1Jan1997, Peregrine Greater China Index. Formerly JF China Region Fund, Inc., the Fund name was changed on 06/12/13. B Actual leverage represents the excess amount above shareholders’ funds of total assets less cash/cash equivalents, expressed as a percentage of shareholders’ funds. If the amount calculated is negative, this represents a net cash position. Net Zsset vZlue 26.4 -21.3 20.2 3.4 8.4 BenchmarkA 26.9 20.9 25.8 1.2 4.6 Past performance is no guarantee of future results. Investment returns and principal value will fluctuate and shares, when sold, may be worth more or less than original cost. Current performance may be lower or higher than the performance data quoted. All return data includes investment management fees, administrative and custodial charges, bank loan expenses and assumes the reinvestment of all distributions. Returns for periods less than one year are not annualized. Top 10 holdings (as at 28/02/17) Holding Fund ! BenchmZrkA weight Tencent Holdings 7.5 5.7 Taiwan Semiconductor Manufacturing 7.2 5.5 Alibaba Group Holding 5.5 4.4 80 Bank of China 4.6 1.7 Ping An Insurance* 3.6 1.9 60 AIA Group 3.5 2.9 China Merchants Bank* 3.3 0.8 LARGAN Precision 2.3 0.6 40 CNOOC 2.2 0.8 Cheung Kong Property Holdings 1.8 0.7 20 SubTotal 41.5 25.0 * Denotes China Ashare holding Sector Fund % 31.30% Information Technology 29.2% Financials 12.1% Consumer Discretionary 6.6% Industrials 4.0% Health Care 3.4% Utilities 2.9% Consumer Staples 2.2% Energy 2.1% Telecommunication Services 1.4% Materials 4.8% Liquidity 100.0% Total (as at 28/02/17) Active % 3.4% -5.5% 3.2% -1.7% 2.1% -0.3% -0.1% -1.1% -2.4% -2.4% 4.8%
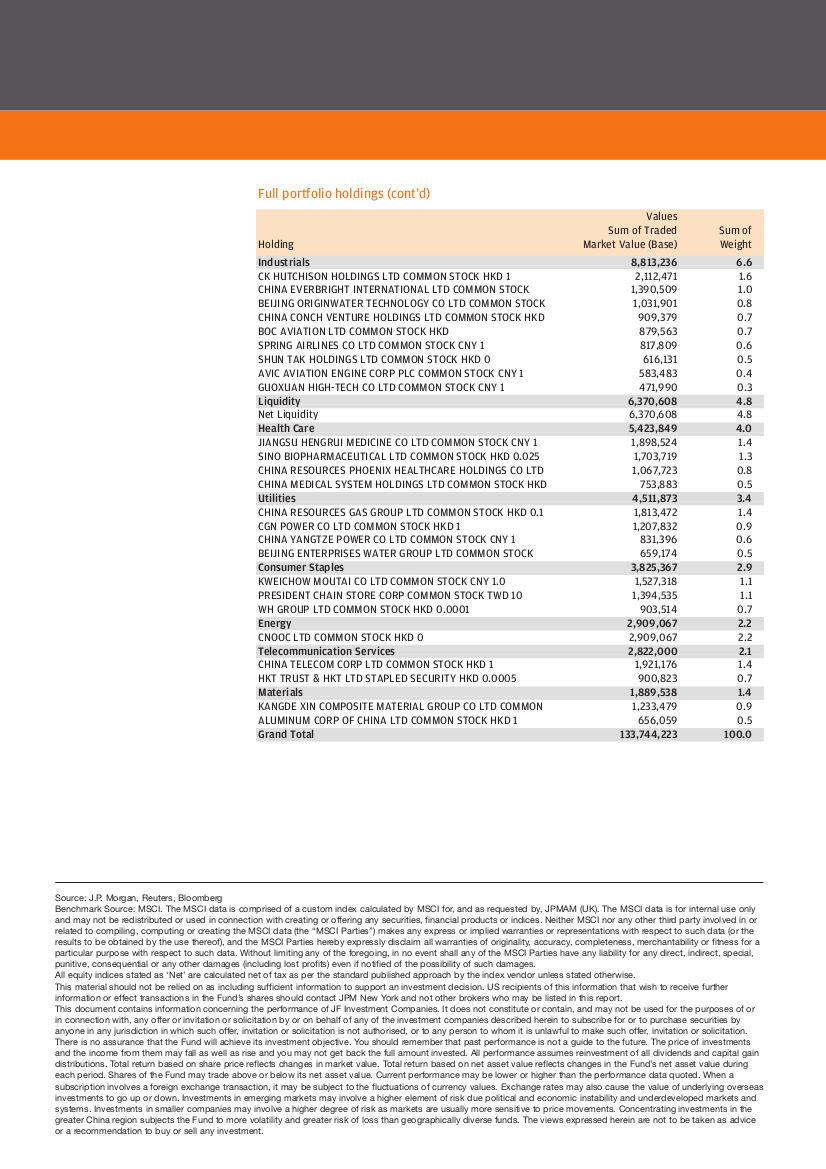
Fund information Portfolio (as at 28/02/17) Share price USD 17.81 NAV per share USD 18.42 Discount (-) / Premium Current -3.3! Shares in issue 6,447,637 Fund code Bloomberg JFC US ISIN US46614T1079 Sedol 2471392 Fund % 19.9% 16.9% 15.2% 12.5% 11.4% 11.1% 8.2% 0.0% 4.8% 100.0% Portfolio review China - ‘A’ Shares Hong Kong Taiwan China - Hong Kong ‘P Chip’ China - Hong Kong ‘H’ China - Hong Kong ‘Red Chip’ China - Others China - ‘B’ Shares Net Liquidity Total Active % -0.1% 1.1% -4.8% 3.2% -5.6% 3.2% -1.7% -0.1% 4.8% (as at 28/02/17) Greater China equities continued to rally alongside global equities on reflation expectations. The MSCI Taiwan Index outperformed, with technology stocks buoyed by high expectations for the new iPhone and financials and cyclicals on hopes of global reflation. The MSCI China Index and onshore China equities rose despite modest tightening from the central bank, as cyclical indicators remained strong, indicating the economy can withstand higher rates. The MSCI Hong Kong Index surged as mainland companies bid aggressively in local land sales despite the prospect of higher rates, partially given lingering worries about the currency. Market outlook (as at 28/02/17) While the direction of U.S. trade and foreign policy remains unclear, the prospect of synchronized U.S.China growth continues. Corporate earnings season has also provided encouraging signs of a broadening acceleration in China, as a number of consumer bellwethers reported solid revenues. The next test in China will be the ability of downstream companies to pass through cost increases. While we expect some growth headwinds for the old economy due to rising rates and fading stimulus (real estate and autos), in lieu of a sudden dollar rally altering the pace of rate normalization, the probability of rising equities remains high. Fund strategies remain unchanged, with an emphasis on technology, healthcare and consumer spending in Greater China. Further information Investment Adviser: JF International Management Inc. Website: www.jpmchinaregionfund.com Administration: Lucy Dina +44 (0)20 7742 3735
Full portfolio holdings (as at 28/02/17) Values Sum of Traded Sum of Holding Market Value (Base) Weight Information Technology 41,866,250 TENCENT HOLDINGS LTD COMMON STOCK HKD 0.00002 TAIWAN SEMICONDUCTOR MANUFACTURING CO LTD COMMON ALIBABA GROUP HOLDING LTD ADR USD 0.000025 LARGAN PRECISION CO LTD COMMON STOCK TWD 10 AAC TECHNOLOGIES HOLDINGS INC COMMON STOCK HKD HANGZHOU HIKVISION DIGITAL TECHNOLOGY CO LTD ADVANCED SEMICONDUCTOR ENGINEERING INC COMMON HAN’S LASER TECHNOLOGY INDUSTRY GROUP CO LTD WANGSU SCIENCE & TECHNOLOGY CO LTD COMMON STOCK SILICON MOTION TECHNOLOGY CORP ADR USD 0.01 GOERTEK INC COMMON STOCK CNY 1 WISTRON NEWEB CORP COMMON STOCK TWD 10 LUXSHARE PRECISION INDUSTRY CO LTD COMMON STOCK ADVANCED SEMICONDUCTOR ENGINEERING INC RIGHT TWD 10,060,815 7.5 9,695,340 7.2 7,336,770 5.5 3,116,832 2.3 2,253,604 1.7 1,744,962 1.3 1,494,786 1.1 1,394,247 1.1 1,203,392 0.9 941,891 0.7 894,556 0.7 893,920 0.7 830,202 0.6 4,934 0.0 Financials 39,076,852 29.2 BANK OF CHINA LTD COMMON STOCK HKD 1 PING AN INSURANCE GROUP CO OF CHINA LTD COMMON AIA GROUP LTD COMMON STOCK HKD 0 CHINA MERCHANTS BANK CO LTD COMMON STOCK HKD 1 CHEUNG KONG PROPERTY HOLDINGS LTD COMMON STOCK HKD HONG KONG EXCHANGES & CLEARING LTD COMMON STOCK BOC HONG KONG HOLDINGS LTD COMMON STOCK HKD 0 WHARF HOLDINGS LTD/THE COMMON STOCK HKD 0 E.SUN FINANCIAL HOLDING CO LTD COMMON STOCK TWD 10 POLY REAL ESTATE GROUP CO LTD COMMON STOCK CNY 1 CHINA TAIPING INSURANCE HOLDINGS CO LTD COMMON CHINA LIFE INSURANCE CO LTD/TAIWAN COMMON STOCK DAH SING BANKING GROUP LTD COMMON STOCK HKD 0 CHINA RESOURCES LAND LTD COMMON STOCK HKD 0.1 INDUSTRIAL BANK CO LTD COMMON STOCK CNY 1 POSTAL SAVINGS BANK OF CHINA CO LTD COMMON STOCK HUATAI SECURITIES CO LTD COMMON STOCK CNY 1 6,099,349 4.6 4,753,194 3.6 4,719,931 3.5 4,459,638 3.3 2,431,566 1.8 2,337,874 1.8 2,270,002 1.7 1,530,246 1.1 1,522,920 1.1 1,502,436 1.1 1,362,991 1.0 1,225,686 0.9 1,124,227 0.8 1,097,837 0.8 892,758 0.7 881,743 0.7 864,456 0.7 Consumer Discretionary 16,235,582 12.1 JD.COM INC ADR USD 0.00002 SANDS CHINA LTD COMMON STOCK HKD 0.01 NEXTEER AUTOMOTIVE GROUP LTD COMMON STOCK HKD 0.1 HANGZHOU ROBAM APPLIANCES CO LTD COMMON STOCK CNY SAIC MOTOR CORP LTD COMMON STOCK CNY 1 CHINA CYTS TOURS HOLDING CO LTD COMMON STOCK CNY 1 CTRIP.COM INTERNATIONAL LTD ADR USD 0.01 BRILLIANCE CHINA AUTOMOTIVE HOLDINGS LTD COMMON IMAX CHINA HOLDING INC COMMON STOCK HKD 0.0001 TECHTRONIC INDUSTRIES CO LTD COMMON STOCK HKD 0 CHOW SANG SANG HOLDINGS INTERNATIONAL LTD COMMON SAMSONITE INTERNATIONAL SA COMMON STOCK HKD 0.01 REGINA MIRACLE INTERNATIONAL HOLDINGS LTD COMMON CHONGQING CHANGAN AUTOMOBILE CO LTD COMMON STOCK CAFE DE CORAL HOLDINGS LTD COMMON STOCK HKD 0.1 PACIFIC TEXTILES HOLDINGS LTD COMMON STOCK HKD 1,785,288 1.3 1,744,606 1.3 1,488,240 1.1 1,233,520 0.9 1,205,153 0.9 1,065,993 0.8 1,029,448 0.8 1,027,812 0.8 850,584 0.6 841,567 0.6 815,986 0.6 757,897 0.6 695,776 0.5 616,998 0.5 611,524 0.5 465,190 0.3
Full portfolio holdings (cont’d) Values Sum of Traded Sum of Holding Market Value (Base) Weight Industrials 8,813,236 6.6 CK HUTCHISON HOLDINGS LTD COMMON STOCK HKD 1 2,112,471 1.6 CHINA EVERBRIGHT INTERNATIONAL LTD COMMON STOCK 1,390,509 1.0 BEIJING ORIGINWATER TECHNOLOGY CO LTD COMMON STOCK 1,031,901 0.8 CHINA CONCH VENTURE HOLDINGS LTD COMMON STOCK HKD 909,379 0.7 BOC AVIATION LTD COMMON STOCK HKD 879,563 0.7 SPRING AIRLINES CO LTD COMMON STOCK CNY 1 817,809 0.6 SHUN TAK HOLDINGS LTD COMMON STOCK HKD 0 616,131 0.5 AVIC AVIATION ENGINE CORP PLC COMMON STOCK CNY 1 583,483 0.4 GUOXUAN HIGHTECH CO LTD COMMON STOCK CNY 1 471,990 0.3 Liquidity 6,370,608 4.8 Net Liquidity 6,370,608 4.8 Health Care 5,423,849 4.0 JIANGSU HENGRUI MEDICINE CO LTD COMMON STOCK CNY 1 1,898,524 1.4 SINO BIOPHARMACEUTICAL LTD COMMON STOCK HKD 0.025 1,703,719 1.3 CHINA RESOURCES PHOENIX HEALTHCARE HOLDINGS CO LTD 1,067,723 0.8 CHINA MEDICAL SYSTEM HOLDINGS LTD COMMON STOCK HKD 753,883 0.5 Utilities 4,511,873 3.4 CHINA RESOURCES GAS GROUP LTD COMMON STOCK HKD 0.1 1,813,472 1.4 CGN POWER CO LTD COMMON STOCK HKD 1 1,207,832 0.9 CHINA YANGTZE POWER CO LTD COMMON STOCK CNY 1 831,396 0.6 BEIJING ENTERPRISES WATER GROUP LTD COMMON STOCK 659,174 0.5 Consumer Staples 3,825,367 2.9 KWEICHOW MOUTAI CO LTD COMMON STOCK CNY 1.0 1,527,318 1.1 PRESIDENT CHAIN STORE CORP COMMON STOCK TWD 10 1,394,535 1.1 WH GROUP LTD COMMON STOCK HKD 0.0001 903,514 0.7 Energy 2,909,067 2.2 CNOOC LTD COMMON STOCK HKD 0 2,909,067 2.2 Telecommunication Services 2,822,000 2.1 CHINA TELECOM CORP LTD COMMON STOCK HKD 1 1,921,176 1.4 HKT TRUST & HKT LTD STAPLED SECURITY HKD 0.0005 900,823 0.7 Materials 1,889,538 1.4 KANGDE XIN COMPOSITE MATERIAL GROUP CO LTD COMMON 1,233,479 0.9 ALUMINUM CORP OF CHINA LTD COMMON STOCK HKD 1 656,059 0.5 Grand Total 133,744,223 100.0 Source: J.P. Morgan, Reuters, Bloomberg Benchmark Source: MSCI. The MSCI data is comprised of a custom index calculated by MSCI for, and as requested by, JPMAM (UK). The MSCI data is for internal use only and may not be redistributed or used in connection with creating or offering any securities, financial products or indices. Neither MSCI nor any other third party involved in or related to compiling, computing or creating the MSCI data (the “MSCI Parties”) makes any express or implied warranties or representations with respect to such data (or the results to be obtained by the use thereof), and the MSCI Parties hereby expressly disclaim all warranties of originality, accuracy, completeness, merchantability or fitness for a particular purpose with respect to such data. Without limiting any of the foregoing, in no event shall any of the MSCI Parties have any liability for any direct, indirect, special, punitive, consequential or any other damages (including lost profits) even if notified of the possibility of such damages. All equity indices stated as ‘Net’ are calculated net of tax as per the standard published approach by the index vendor unless stated otherwise. This material should not be relied on as including sufficient information to support an investment decision. US recipients of this information that wish to receive further information or effect transactions in the Fund’s shares should contact JPM New York and not other brokers who may be listed in this report. This document contains information concerning the performance of JF Investment Companies. It does not constitute or contain, and may not be used for the purposes of or in connection with, any offer or invitation or solicitation by or o n behalf of any of the investment companies described herein to subscribe for or to purchase securities by anyone in any jurisdiction in which such offer, invitation or solicitation is not authorised, or to any person to whom it is unlawful to make such offer, invitation or solicitation. There is no assurance that the Fund will achieve its investment objective. You should remember that past performance is not a guide to the future. The price of investments and the income from them may fall as well as rise and you may not get back the full amount invested. All performance assumes reinvestment of all dividends and capital gain distributions. Total return based on share price reflects changes in market value. Total return based on net asset value reflects changes in the Fund’s net asset value during each period. Shares of the Fund may trade above or below its net asset value. Current performance may be lower or higher than the performance data quoted. When a subscription involves a foreign exchange transaction, it may be subject to the fluctuations of currency values. Exchange rates may also cause the value of underlying overseas investments to go up or down. Investments in emerging markets may involve a higher element of risk due political and economic instability and underdeveloped markets and systems. Investments in smaller companies may involve a higher degree of risk as markets are usually more sensitive to price movements. Concentrating investments in the greater China region subjects the Fund to more volatility and greater risk of loss than geographically diverse funds. The views expressed herein are not to be taken as advice or a recommendation to buy or sell any investment.